UNITED STATES
SECURITIES AND EXCHANGE COMMISSION
Washington, D.C. 20549
FORM N-CSR
CERTIFIED SHAREHOLDER REPORT OF REGISTERED MANAGEMENT
INVESTMENT COMPANIES
Investment Company Act file number 811-21761
Keeley Funds, Inc.
(Exact name of registrant as specified in charter)
141 West Jackson Boulevard
Suite 2150
Chicago, IL 60604
(Address of principal executive offices) (Zip code)
Kevin Keeley
141 West Jackson Boulevard
Suite 2150
Chicago, IL 60604
(Name and address of agent for service)
Registrant’s telephone number, including area code: 312-786-5000
Date of fiscal year end: September 30
Date of reporting period: September 30, 2020
Form N-CSR is to be used by management investment companies to file reports with the Commission not later than 10 days after the transmission to stockholders of any report that is required to be transmitted to stockholders under Rule 30e-1 under the Investment Company Act of 1940 (17 CFR 270.30e-1). The Commission may use the information provided on Form N-CSR in its regulatory, disclosure review, inspection, and policymaking roles.
A registrant is required to disclose the information specified by Form N-CSR, and the Commission will make this information public. A registrant is not required to respond to the collection of information contained in Form N-CSR unless the Form displays a currently valid Office of Management and Budget (“OMB”) control number. Please direct comments concerning the accuracy of the information collection burden estimate and any suggestions for reducing the burden to Secretary, Securities and Exchange Commission, 450 Fifth Street, NW, Washington, DC 20549-0609. The OMB has reviewed this collection of information under the clearance requirements of 44 U.S.C. § 3507.
Item 1. Reports to Stockholders.
The Report to Shareholders is attached herewith.
|
KEELEY Small Cap Dividend Value Fund |
|
KEELEY Small-Mid Cap Value Fund |
|
KEELEY Mid Cap Dividend Value Fund |
Annual Report
September 30, 2020
Beginning on January 1, 2021, as permitted by regulations adopted by the Securities and Exchange Commission, paper copies of the Funds’ annual and semiannual shareholder reports will no longer be sent by mail, unless you specifically request paper copies of the reports. Instead, the reports will be made available on the Funds’ website (www.keeleyfunds.com), and you will be notified by mail each time a report is posted and provided with a website link to access the report. If you already elected to receive shareholder reports electronically, you will not be affected by this change and you need not take any action. To elect to receive all future reports on paper free of charge, please contact your financial intermediary, or, if you invest directly with the Funds, you may call 800-422-3554 or send an email request to info@keeleyteton.com.
KEELEY FUNDS
(Unaudited)
| | | | | | | | | | | | | | | | | | | | | | | | | | | | | | | | | | | | | | |
| | | Class A Shares | | | | | | Class I Shares | | | | |
| | | Average Annual Returns – September 30, 2020 (a)(b) | | | | | | Average Annual Returns –September 30, 2020 (a) | | | | |
| | | 1 Year | | 5 Year | | 10 Year | | Since Inception | | Gross Expense
Ratio | | Expense Ratio after Adviser Reimburse-
ments | | | | | | | | 1 Year | | 5 Year | | 10 Year | | Since Inception | | Gross Expense Ratio | | Expense Ratio after Adviser Reimburse-
ments | | | | | | | | |
KEELEY Small Cap Dividend Value | | (21.08)% | | 1.74% | | 6.16% | | 7.22% | | 1.60% | | 1.44% | | | | | | | | (17.08)% | | 2.96% | | 6.94% | | 7.95% | | 1.38% | | 1.19% | | | | | | | | |
KEELEY Small-Mid Cap Value | | (18.72) | | 2.52 | | 7.42 | | 4.69 | | 1.53 | | 1.40 | | | | | | | | (14.69) | | 3.73 | | 8.19 | | 5.32 | | 1.28 | | 1.15 | | | | | | | | |
KEELEY Mid Cap Dividend Value | | (17.26) | | 4.18 | | — | | 9.50 | | 1.39 | | 1.22 | | | | | | | | (13.15) | | 5.41 | | — | | 10.33 | | 1.14 | | 0.97 | | | | | | | | |
| (a) | Returns represent past performance and do not guarantee future results. Total returns and average annual returns reflect changes in share price and reinvestment of dividends and are net of expenses. Investment returns and the principal value of an investment will fluctuate. When shares are redeemed they may be worth more or less than their original cost. Current performance may be lower or higher than the performance data presented. Visit www.keeleyfunds.com for performance information as of the most recent month end. Investors should carefully consider the investment objectives, risks, charges, and expenses of a Fund before investing. The prospectuses contain information about these and other matters and should be read carefully before investing. To obtain a prospectus, please visit our website at www.keeleyfunds.com. The prospectuses contain expense reimbursement information and should be read carefully before investing. The gross expense ratios and expense ratios after Adviser reimbursements are from the current prospectus dated January 28, 2020. |
| (b) | Includes the effect of the maximum 4.50% sales charge at the beginning of the period. |
| | | | |
| | | Inception Dates |
| | | Class A Shares | | Class I Shares |
KEELEY Small Cap Dividend Value | | 12/01/09 | | 12/01/09 |
KEELEY Small-Mid Cap Value | | 08/15/07 | | 08/15/07 |
KEELEY Mid Cap Dividend Value | | 10/03/11 | | 10/03/11 |
The KEELEY Funds file complete schedules of portfolio holdings with the Securities and Exchange Commission (the SEC) for the first and third quarters of each fiscal year on Form N-PORT. Shareholders may obtain this information at www.keeleyfunds.com by calling the Funds at 800-422-3554. The Funds’ Form N-PORT is available on the SEC’s website at www.sec.gov and may also be reviewed and copied at the SEC’s Public Reference Room in Washington, DC. Information on the operation of the Public Reference Room may be obtained by calling 800-SEC-0330.
Proxy Voting
Each Fund files Form N-PX with its complete proxy voting record for the twelve months ended June 30, no later than August 31 of each year. A description of the Funds’ proxy voting policies, procedures, and how the Funds voted proxies relating to portfolio securities are available without charge, upon request, by (i) calling 800-422-3554; (ii) writing to The KEELEY Funds at One Corporate Center, Rye, NY 10580-1422; and (iii) visiting the SEC’s website at www.sec.gov.
2
Performance Discussion (Unaudited)
Small Cap Dividend Value Fund
To Our Shareholders,
It has been a tough year to be a value investor. It has been tougher to be a small-cap value investor. It has been even tougher to be a small-cap value investor focused on dividend-paying stocks.
For large-cap stocks as measured by the S&P 500 Index, the year ending September 30, 2020 turned out to be a pretty good year. While it had some scary moments, it ended up about 15% for the twelve months. The even larger cap Russell Top 200 gained an even more impressive 20%! As you go down the capitalization spectrum, however, things fall off. The Russell Mid Cap Index gained only 4.6% and the Russell 2000 Index barely broke even.
While the market’s gains were driven by the megacap growth stocks, mid-cap and small-cap growth stocks also dramatically outperformed value stocks. In each of the three capitalization ranges, growth stocks produced strong returns while value stocks generated negative returns. For the Russell Top 200, the spread between growth and value was a stunning 45%, plus 41% for the Russell Top 200 Growth vs. negative 4% for the Russell Top 200 Value Index. In mid-cap and small-cap, the spread was a more modest 31%, but the gains were smaller for growth and the losses were larger for value. For large-cap stocks, the spread between the performance of growth and value stocks has never been this wide. For mid-cap and small-cap stocks, the performance was even wider in the late-90s. At the end of February 2000, the trailing twelve-month performance of the Russell MidCap Growth Index was a positive 87% compared to a negative 6% for the Russell MidCap Value Index! Those were also tough times to be a value manager, but those who survived saw great things in the following years.
We probably do not need to list another reason why the year 2020 is unusual, but we will because it explains much of the reason for why Keeley’s Dividend Value Funds have not performed as well as we expected in a volatile and down market. The strategy of buying stocks of companies that pay dividends has not worked over the last year. The last year has been one where unprofitable companies have been the best performers. The 496 companies in the Russell 3000 Index that were expected to be unprofitable this year on September 30, 2019 are up 40.5% on average, while the 2,326 companies that were expected to be profitable have seen their stocks fall 4.4% on average. (The other ~200 did not have consensus earnings estimates.)
Typically, dividend-paying stocks provide good participation in rising markets and very good protection in falling markets. That has not been the case over the last year. When the markets sold off sharply in the first calendar quarter, dividend-paying stocks fell along with the rest of them as Financials fell on rising credit concerns and REITs fell on concerns about what widespread lockdowns would do to the tenants of the companies. As the market has rebounded, it has been led by sectors that generally have a low propensity to pay dividends (Technology and Health Care) or have a small representation in the small- and mid-cap indices (Consumer Staples).
Over the last year, dividend-paying stocks in the Russell Midcap Value Index have fallen 9.4% compared to a 7.3% decline for the Index overall and a 3.6% gain for the non-dividend-paying stocks. In the Russell 2000 Value Index, the spread was even wider; -22.5% for dividend-payers vs. -14.9% for the Index and +1.2% for non-dividend-payers. These are historically wide spreads. It is interesting that the other years where we saw non-dividend paying stocks outperform dividend paying stocks by this magnitude have generally been years when an economic recovery began. It seems that 2020 qualifies for this definition, but it was also a year when an economic downturn began.
To recap: Large cap stocks trounced small cap stocks, growth stocks outperformed value stocks, and non-dividend-paying stocks beat dividend-paying stocks. That is the worst possible combination for our dividend-focused strategies. So, where do we go from here?
We are actually quite optimistic. First, the long-term records of small-cap stocks, value stocks, and dividend-paying stocks is superior to that of large-cap stocks, growth stocks, and non-dividend-paying stocks. There have certainly been periods in the past where these types of stocks lagged, and there will almost certainly be periods where they underperform in the future. It is very hard to pick the timing on the change in these cycles and we would have expected a turn sooner. We have thought that value stocks were undervalued relative to growth stocks all year, and small-cap stocks have been attractive relative to large cap stocks based on historical patterns. We can now point to an additional reason to be bullish on small and mid-cap dividend-paying stocks. They are attractive from the standpoint of generating income! Small-cap (and mid-cap) dividend-paying stocks yield more than large-cap dividend-paying stocks, which in turn yield more than bonds.
In response to the slowing economy brought on by the lockdown measures to control the spread of the COVID-19 pandemic, the Fed cut short-term rates aggressively. This dragged down long-term rates as well. Even with rates moving a little higher recently, the yield on the ten-year treasury remains well below 1% and near historic lows. The rise in the overall market offset a little by slightly higher dividend payouts has reduced the yield on the market as measured by the larger cap focused indices (Russell Top 200), but not as much as the fall in the ten-year yield. As a result, RT200 yield/10-year Treasury yield has risen to 235% at the end of the third quarter compared to 91% at year-end. While equities have yielded more than Treasuries before, this condition is unusual as it has only happened in about 11% of months since 1978.
Even more unusual is the relationship between the yield on small cap stocks and large cap stocks. The yield on small caps has been higher than that of large caps since June and at the end of September, the yield on the Russell 2000 was 1.64% vs. 1.62% for the Russell Top 200. That has only happened in about 8% of months since 1978. Almost all of these months were between 1998 and 2001. The combination of higher equity yields and higher small cap yields never happened before June.
If we dig deeper and only compare the yields on dividend-paying stocks, the income advantage increases. The average yield on dividend paying stocks in the Russell Top 200 is now 2.63% whereas the average yield on the dividend-paying stocks in the Russell 2000 is an impressive 3.72%. These are up from 2.42% and 2.99% at year-end. While yields have fallen broadly in the capital and money markets, the decline in share prices has more than offset cuts in dividends so that dividend-paying equities are attractive from a yield perspective.
3
So what does this all mean? We think these conditions point to a couple things. First, there is likely more skepticism about whether smaller companies will be able to sustain their dividends than exists for larger companies. This is partly correct, in our opinion, although smaller companies have been quicker to reduce or suspend dividends so far. The reason for the potential vulnerability is that nearly 40% of the dividends in the Russell 2000 come from Financials stocks. So far, they have not cut dividends much, but if the recovery stalls, they may have to boost reserves further which might necessitate dividend cuts. By contrast, almost 50% of dividends in the Russell Top 200 come from Technology, Healthcare, and Consumer Staples, sectors that have seen some positive impacts from the COVID-19 pandemic.
The other takeaway is that there are still a lot of stocks that could be significantly undervalued. While the 2020 and 2021 outlooks are lower, the longer-term prospects for many companies may not have changed significantly (although the outlook for some has). It is our job to find those and we are confident that we will be able to do so.
Portfolio Results
In the fiscal year ended September 30, 2020, the Keeley Small Cap Dividend Fund’s net asset value (NAV) total return declined 17.35% compared with a 14.88% decline in total return for its benchmark, the Russell 2000 Value Index. We believe the Fund trailed its benchmark, and our expectations, primarily for the reasons we have explained above but we will provide more detail on the performance of the Fund in the next few paragraphs.
When we disaggregate relative performance into the impact from Sector Allocation decisions and the impact from Stock Selection efforts, we find that Sector Allocation added a little bit to relative performance while Stock Selection hurt a little. While the Fund is relatively sector neutral, we find that small underweights in the poor performing Financials and Energy sectors helped performance a little, while a small underweight in the good-performing Technology sector hurt relative performance a little. Our Stock Selection decisions had the biggest positive impact in the Financials, Utilities, and Health Care sectors, while the Fund’s holdings in the Materials, Consumer Discretionary, Consumer Staples, and Technology sectors were the biggest laggards.
| | ● | | The Financial sector declined more than the overall Index, but the Fund’s holdings meaningfully outperformed those of the Index. Strong gains in the shares of Brightsphere Investment Group and Virtu Financial accounted for most of the superior performance. Brightsphere’s share price ran up after the company made some strategic transactions to position itself better to grow assets under management. Virtu, on the other hand, is a market-maker of a wide variety of financial instruments around the world and benefitted from a pick-up in volumes and volatility. The Fund’s holdings in bank stocks were a detractor as investors feared a replay of the Global Financial Crisis. |
| | ● | | Historically, Utilities have been a safe haven in market downdrafts and stellar performers when interest rates fell sharply. That has not been the case in 2020 as Utilities shares have actually fallen more than the overall Index. The Fund’s holdings held up relatively better as its position in Atlantica Yield benefitted from that company’s ongoing recovery and a flight toward ESG–oriented investments. The acquisition of El Paso Electric by private equity funds also helped a little. |
| | ● | | The Fund only owned two Healthcare stocks during the year. They were the same two as last year, Ensign Group and Chemed. Both stocks performed very well as both companies weathered the volatility in the healthcare services industry in the time of the COVID epidemic very well. |
| | ● | | The Materials sector was the biggest detractor for the Fund. Most of the weakness was due to declines in Kaiser Aluminum and Mercer International. Both companies felt a disproportionate impact from the COVID pandemic. At Kaiser, the COVID pandemic has battered the airline industry and hurt aircraft suppliers, a key customer base for the company. At Mercer, the pandemic has slowed trade and closed the key China market for the company’s products. |
| | ● | | We did a lot of things right in the Consumer Discretionary sector, but not enough as it was one of the best performing sectors. The main thing that hurt performance was a lack of ownership of the stocks of retailers, particularly those focused on the home. The Fund’s biggest detractor in this sector was Kontoor Brands, a recent spinout from VF Corporation of the Lee and Wranglers jeanswear business. While the COVID related slowdown led the company to suspend its dividend, we are optimistic that it will resume its payout over the next quarter or two. |
| | ● | | The Consumer Staples sector was the second best performing sector in the market (behind Healthcare) as COVID-related lockdowns pushed consumers into grocery stores. This is a small sector in the small cap universe and the Fund held only one stock in the sector this year. That holding, Primo Water, performed well, but not quite as well as the sector. |
| | ● | | Performance of the Fund’s Technology investments was disappointing, particularly compared to the positive overall returns of the sector. While Perspecta and Hackett Group shares fell, the main cause of the Fund’s shortfall was a steep drop in the shares of Plantronics. We had been optimistic that the company’s acquisition of Polycom would drive a large uptick in earnings, but poor execution on the integration and some product transitions drove large earnings shortfalls. We sold the stock after the decline in earnings created concerns about its ability to remain in compliance with its debt covenants. |
In conclusion, we thank you for investing alongside us in the Keeley Small Cap Dividend Value Fund.
4
| | | | | | | | | | | | | | |
Average Annual Returns Through September 30, 2020 (a) (Unaudited) | |
| | | 1 Year | | | 5 Year | | 10 Year | | Since
Inception
(12/01/09) | | | |
Small Cap Dividend Value Fund Class A | | | (21.08) | % | | 1.74% | | 6.16% | | 7.22% | | | | |
Russell 2000 Value Index | | | (14.88) | | | 4.11 | | 7.09 | | 7.86 | | | | |
In the current prospectuses dated January 28, 2020, the proforma expense ratio for Class A Shares is 1.60%, and the net expense ratio is 1.44% after contractual reimbursements by Keeley-Teton Advisors, Inc. (the Adviser). See page 22 for the expense ratios for the year ended September 30, 2020. Class A Shares have a maximum sales charge of 4.50%, which is included in the figures. | |
(a) Returns represent past performance and do not guarantee future results. Total returns and average annual returns reflect changes in share price, reinvestment of distributions, and are net of expenses. Investment returns and the principal value of an investment will fluctuate. When shares are redeemed, they may be worth more or less than their original cost. Current performance may be lower or higher than the performance data presented. Visit www.keeleyfunds.com for performance information as of the most recent month end. The Adviser reimbursed expenses to limit the expense ratio. Had such limitation not been in place, returns would have been lower. Investors should carefully consider the investment objectives, risks, charges, and expenses of the Fund before investing. The prospectuses contain information about these and other matters and should be read carefully before investing. To obtain a prospectus, please visit our website at www.keeleyfunds.com. Another share class is available and has different performance characteristics. See page 2 for performance of the other share class. The Russell 2000 Value Index ® is an unmanaged index that measures the performance of the small-cap value segment of the U.S. equity market universe and includes those Russell 2000® Index companies with lower price-to-book ratios and lower forecasted growth values. The Russell 2000® Index is an unmanaged index that measures the performance of the smallest 2,000 companies by market capitalization of the Russell 3000® Index. Investing in small capitalization securities involves special challenges because these securities may trade less frequently and experience more abrupt price movements than large capitalization securities. Dividends are considered reinvested. You cannot invest directly in an index. | |
COMPARISON OF CHANGE IN VALUE OF A $10,000 INVESTMENT IN THE SMALL CAP DIVIDEND VALUE FUND CLASS A AND THE RUSSELL 2000 VALUE INDEX (Unaudited)
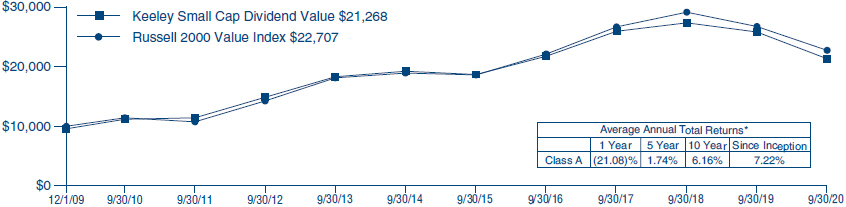
| * | Past performance is not predictive of future results. The performance tables and graph do not reflect the deduction of taxes that a shareholder would pay on Fund distributions or the redemption of Fund shares. |
5
Small-Mid Cap Value Fund (Unaudited)
To Our Shareholders,
The last several years have been difficult times to be a value investor. This has been doubly true for small- and mid-cap value investors. Large cap stocks have dramatically outperformed their small-cap brethren and simple, secular growth stories have worked regardless of their valuation while stocks of companies in change have found it difficult to gain traction. This created a tough environment for the Keeley Small-Mid Cap Value fund and it slightly lagged its benchmark over the last year. Later in this letter, we will outline some of the specific reasons for the underperformance, but we first wanted to talk about the areas of the market that we find interesting and discuss how we are positioning the Fund.
Over the last year, the Russell 2500 Index, an Index of small- and mid-cap stocks (SMID), rose 2%. This compares with a 20% increase in the Russell Top 200, an Index of large-cap stocks. This has been going on for several years so that the spread between the 200 and 2500 is 10% annualized over three years and 7% annualized over five years. If we look at the performance of value stocks and growth stocks, we see a similar trend with the Russell 2500 Growth Index outperforming the Russell 2500 Value Index by 36%, 16%, and 10% annualized over the one, three, and five-year periods.
This is not the first time, large cap stocks have outperformed SMID stocks or growth stocks have outperformed value stocks for a multi-year. Performance of asset sub-classes has tended to unfold in multi-year cycles. The length of the cycles has varied, but tends to run until it stops. Valuation can sometimes give clues to whether or not the cycle has nearly reached its end, but not always. It also may be more effective at identifying when a value cycle will end than a growth cycle. We would note that the five-year annualized return spread in favor of growth has only been this wide during the last forty years in the period from 1998-2000 and has only favored large caps by this much in February 2000.
Some of the areas in which the Keeley Small-Mid Cap Value Fund has historically invested have been challenging over the last several years. For example, the Fund has always looked at investing in companies after they were spun-out of other companies. A significant number of academic studies have documented the effectiveness of this strategy going as far back as 1965. In the last several years, these stocks have not performed as well. The 2016 vintage performed okay, but 2017 underperformed and 2018 was dismal. It is too early to evaluate 2019. We do not think anything has fundamentally changed in why these stocks have historically been attractive and we think this will once again be a fruitful area for investment.
We are also looking at some additional areas to target our efforts. For example, our research suggests that stocks which have underperformed, but where there has been a change in CEO offer potential once the new leader has had the opportunity to implement some changes. We are more systematically evaluating this universe of stocks.
We believe that investing in corporate change will always be an area where research and active management can produce benchmark-beating returns. Because there may be a lack of information or because it may be difficult to analyze, it is likely to remain an area that we can find stocks that are misunderstood. Overall, we are very optimistic about the prospects for the Keeley Small-Mid Cap Value Fund.
Portfolio Results
In the fiscal year ended September 30, 2020, the Keeley Small Mid Cap Value Fund’s net asset value (NAV) total return declined 14.9% compared with a 12.6% decline in total return for its benchmark, the Russell 2500 Value Index.
When we disaggregate relative performance into the impact from Sector Allocation decisions and the impact from Stock Selection efforts, we find that Sector Allocation contributed a very slight amount to relative performance while Stock Selection accounted for the relative underperformance. Despite minimal net impact from Sector Allocation, the Fund’s overweights and underweights impacted returns in specific sectors. Overweights in the Industrials and Technology sectors helped the Fund. Underweights in the Financials and Real Estate Sectors also helped. On the other hand, an underweight position in the Health Care sector hurt performance. From a Stock Selection standpoint, the Fund’s holdings in the Industrials, Financials, and Utilities sectors performed better than those sectors in the Index, while its holdings in Consumer Discretionary, Technology, and Communications Services lagged those of the benchmark.
| | ● | | The Industrials sector posted a positive return of more than 6%, while the benchmark was negative by about 5%. Strong gains from Chart Industries, Fortune Brands Home & Security and auto auction firms Copart and IAA accounted for most of the superior performance. Chart capitalized on COVID-19 through a significant amount of orders from industrial gas customers that provide oxygen to hospitals and through a faster focus on renewable energy projects due to various stimulus packages approved around the world. Fortune Brands Home & Security, whose brands include Moen plumbing and Omega cabinets, saw strength from homebound consumers’ reemphasis on repair and remodel of their homes, as well as from accelerated new housing starts. The auto auction firms benefited from very strong demand for cars – and not enough supply – as well as from improved volumes as more drivers got back on the road and from an ongoing business shift to online auctions only. |
| | ● | | The Financial sector was down more than 20% for the year, but the Fund’s Stock Selection significantly helped performance. Brightsphere Investment Group was the only real bright spot, but several other stocks produced gains in a sector that performed notably badly. Banks such as PacWest Bancorp and Synovus Financial were the leading detractors in the sector. |
| | ● | | The Utilities sector was surprisingly disappointing over the last year in light of the volatility in the stock market and the plunge in interest rates. It performed worse than the benchmark with a loss of a little more than 20%. The Fund’s holding performed much better, largely on the strength of the shares of American Water Works. The stock screens well on ESG criteria and flows into those strategies seem to have boosted the shares of stocks that score well. The Fund’s other three utility stocks performed largely in line with the sector. |
| | ● | | The Consumer Discretionary sector was negative for the year, and the Fund’s performance was dragged down more by lodging-related stocks. Playa Hotels & Resorts and Ryman Hospitality Group both were negatively affected by pandemic-related travel restrictions, which brought revenues to near-zero. Both firms are on a slow road back as they reopen their destination hospitality locations. The pain in lodging overshadowed good performance from homebuilder TRI Pointe Group, which |
6
| | benefited from continued pandemic-fueled housing demand, and from boat- and engine-maker Brunswick Corporation, which saw a quick rebound in the marine market. |
| | ● | | The overall Technology sector eked out small gains in the just-ended fiscal year, but the Fund’s holdings fell. While the Fund had a couple of big winners with TTEC Holdings (outsourced customer experience) and Black Knight (mortgage processing), they were more than offset by declines in WEX Inc. (transaction processing for transportation), Extreme Networks (networking equipment), and GTY Technology (IT Services to state and local governments). WEX’s fuel card services are being used less leading to lower revenues and earnings, while Extreme and GTY have found it more difficult to close new business. |
| | ● | | The Fund’s underperformance in the Materials sector was entirely due to weakness from Kaiser Aluminum, which encountered dramatically slower production from both its aerospace and its automotive end markets. While the company is guiding to a nice rebound in automotive, expectations remain low for any rebound in aerospace, given COVID-19 and lower aviation travel. Kaiser’s underperformance more than overshadowed good performance from the Fund’s three other Materials names, including Valvoline and Huntsman. |
In conclusion, we thank you for investing alongside us in the Keeley Small Mid Cap Value Fund.
7
| | | | | | | | |
| Average Annual Returns through September 30, 2020 (a) (Unaudited) | | 1 Year | | 5 Year | | 10 Year | | Since
Inception
(8/15/2007) |
Small-Mid Cap Value Fund Class A | | (18.72)% | | 2.52% | | 7.42% | | 4.69% |
Russell 2500 Value Index | | (12.62)% | | 4.65% | | 8.01% | | 5.61% |
In the current prospectuses dated January 28, 2020, the gross expense ratio for Class A Shares is 1.53%, and net expense ratio is 1.40% after contractual reimbursements by Keeley-Teton Advisors, Inc. (the Adviser). See page 23 for the expense ratios for the year ended September 30, 2020. Class A Shares have a maximum sales charge of 4.50%, which is included in the figures. |
(a) Returns represent past performance and do not guarantee future results. Total returns and average annual returns reflect changes in share price, reinvestment of distributions, and are net of expenses. Investment returns and the principal value of an investment will fluctuate. When shares are redeemed, they may be worth more or less than their original cost. Current performance may be lower or higher than the performance data presented. Visit www.keeleyfunds.com for performance information as of the most recent month end. The Adviser reimbursed expenses to limit the expense ratio. Had such limitation not been in place, returns would have been lower. Investors should carefully consider the investment objectives, risks, charges, and expenses of the Fund before investing. The prospectuses contain information about these and other matters and should be read carefully before investing. To obtain a prospectus, please visit our website at www.keeleyfunds.com. Another share class is available and has different performance characteristics. See page 2 for performance of other share class. The Russell 2500® Value Index is an unmanaged index that measures the performance of the small to mid-cap value segment of the U.S. equity universe and includes those Russell 2500® Index companies with lower price-to-book ratios and lower forecasted growth values. The Russell 2500® Index is an unmanaged index that measures the performance of the 2,500 smallest companies by market capitalization of the Russell 3000® Index. Dividends are considered reinvested. You cannot invest directly in an index. |
COMPARISON OF CHANGE IN VALUE OF A $10,000 INVESTMENT IN THE SMALL-MID CAP VALUE FUND CLASS A AND THE RUSSELL 2500 VALUE INDEX (Unaudited)
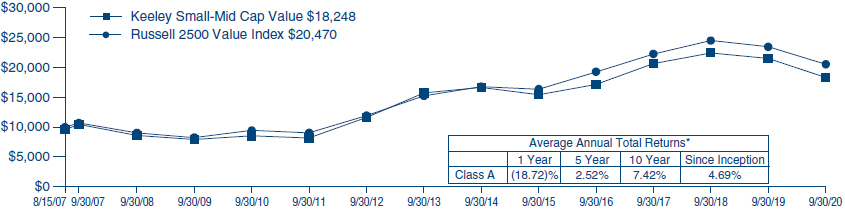
| * | Past performance is not predictive of future results. The performance tables and graph do not reflect the deduction of taxes that a shareholder would pay on Fund distributions or the redemption of Fund shares. |
8
Mid Cap Dividend Value Fund (Unaudited)
To Our Shareholders,
It has been a tough year to be a value investor. It has been tougher to be a mid cap value investor. It has been even tougher to be a mid cap value investor focused on dividend-paying stocks.
For large-cap stocks as measured by the S&P 500 Index, the year ending September 30, 2020 turned out to be a pretty good year. While it had some scary moments, it ended up about 15% for the twelve months. The even larger cap Russell Top 200 gained an even more impressive 20%! As you go down the capitalization spectrum, however, things fall off. The Russell Mid Cap Index gained only 4.6% and the Russell 2000 Index barely broke even.
Returns were concentrated in the top megacap growth companies. The three largest contributors (Apple, Microsoft, and Amazon) to the Russell Top 200’s gains contributed twelve percentage points of the index’s total return despite being only fourteen percent of the Index at the beginning of the period. The top seventeen contributors accounted for all of the Index’s total return. That would not be unusual in a year of very modest returns, but it seems unusual in a year with strong gains. As a point of reference, in 2017 the Russell Top 200 was up 23%, but it took 112 stocks to account for all the Index’s gains. You see a similar trend in 2009 and 2012 where it took 79 and 111 stocks to account for the gains, although 1999’s strong gains were driven by just 25 stocks.
While the market’s gains were driven by the mega cap growth stocks, mid-cap and small-cap growth stocks also dramatically outperformed value stocks. In each of the three capitalization ranges, growth stocks produced strong returns while value stocks generated negative returns. For the Russell Top 200, the spread between growth and value was a stunning 45%, plus 41% for the Russell Top 200 Growth vs. negative 4% for the Russell Top 200 Value Index. In mid-cap and small-cap, the spread was a more modest 31%, but the gains were smaller for growth and the losses were larger for value. For large-cap stocks, the spread between the performance of growth and value stocks has never been this wide. For mid-cap and small-cap stocks, the performance was even wider in the late-90s. At the end of February 2000, the trailing twelve-month performance of the Russell MidCap Growth Index was a positive 87% compared to a negative 6% for the Russell MidCap Value Index! Those were also tough times to be a value manager, but those who survived saw great things in the following years.
We probably do not need to list another reason why the year 2020 is unusual, but we will because it explains much of the reason for why Keeley’s Dividend Value Funds have not performed as well as we expected in a volatile and down market. The strategy of buying stocks of companies that pay dividends has not worked over the last year. The last year has been one where unprofitable companies have been the best performers. The 496 companies in the Russell 3000 Index that were expected to be unprofitable this year on September 30, 2019 are up 40.5% on average, while the 2,326 companies that were expected to be profitable have seen their stocks fall 4.4% on average. The other ~200 did not have consensus earnings estimates.
Typically, dividend-paying stocks provide good participation in rising markets and very good protection in falling markets. That has not been the case over the last year. When the markets sold off sharply in the first calendar quarter, dividend-paying stocks fell along with the rest of them as Financials fell on rising credit concerns and REITs fell on concerns about what widespread lockdowns would do to the tenants of the companies. As the market has rebounded, it has been led by sectors that generally have a low propensity to pay dividends (Technology and Health Care) or have a small representation in the small- and mid-cap indices (Consumer Staples).
Over the last year, dividend-paying stocks in the Russell MidCap Value Index have fallen 9.4% compared to a 7.3% decline for the Index overall and a 3.6% gain for the non-dividend-paying stocks. In the Russell 2000 Value Index, the spread was even wider; -22.5% for dividend-payers vs. -14.9% for the Index and +1.2% for non-dividend-payers. These are historically wide spreads. It is interesting that the other years where we saw non-dividend paying stocks outperform dividend paying stocks by this magnitude have generally been years when an economic recovery began. It seems that 2020 qualifies for this definition, but it was also a year when an economic downturn began.
To recap: Large cap stocks trounced small cap stocks, growth stocks outperformed value stocks, and non-dividend-paying stocks beat dividend-paying stocks. That is the worst possible combination for our dividend-focused strategies. So, where do we go from here?
We are actually quite optimistic. First, the long-term records of small-cap stocks, value stocks, and dividend-paying stocks is superior to that of large-cap stocks, growth stocks, and non-dividend-paying stocks. There have certainly been periods in the past where these types of stocks lagged, and there will almost certainly be periods where they underperform in the future. It is very hard to pick the timing on the change in these cycles and we would have expected a turn sooner. We have thought that value stocks were undervalued relative to growth stocks all year, and small-cap stocks have been attractive relative to large cap stocks based on historical patterns. We can now point to an additional reason to be bullish on small and mid-cap dividend-paying stocks. They are attractive from the standpoint of generating income! Small-cap (and mid-cap) dividend-paying stocks yield more than large-cap dividend-paying stocks, which in turn yield more than bonds.
In response to the slowing economy brought on by the lockdown measures to control the spread of the COVID-19 pandemic, the Fed cut short-term rates aggressively. This dragged down long-term rates as well. Even with rates moving a little higher recently, the yield on the ten-year treasury remains well below 1% and near historic lows. The rise in the overall market offset a little by slightly higher dividend payouts has reduced the yield on the market as measured by the larger cap focused indices (Russell Top 200), but not as much as the fall in the ten-year yield. As a result, RT200 yield/10-year Treasury yield has risen to 235% at the end of the third quarter compared to 91% at year-end. While equities have yielded more than Treasuries before, this condition is unusual as it has only happened in about 11% of months since 1978.
Even more unusual is the relationship between the yield on small cap stocks and large cap stocks. The yield on small caps has been higher than that of large caps since June and at the end of September, the yield on the Russell 2000 was 1.64% vs. 1.62% for the Russell Top 200. That has only happened in about 8% of months since 1978. Almost all of these months were between 1998 and 2001. The combination of higher equity yields and higher small cap yields never happened before June.
If we dig deeper and only compare the yields on dividend-paying stocks, the income advantage increases. The average yield on dividend paying stocks in the Russell Top 200 is now 2.63% whereas the average yield on the dividend-paying stocks in the Russell 2000 is an impressive 3.72%. These are up from 2.42% and 2.99% at year-end. While yields have fallen broadly in the capital and money markets, the decline in share prices has more than offset cuts in dividends so that dividend-paying equities are attractive from a yield perspective.
9
So what does this all mean? We think these conditions point to a couple things. First, there is likely more skepticism about whether smaller companies will be able to sustain their dividends than exists for larger companies. This is partly correct, in our opinion, although smaller companies have been quicker to reduce or suspend dividends so far. The reason for the potential vulnerability is that nearly 40% of the dividends in the Russell 2000 come from Financials stocks. So far, they have not cut dividends much, but if the recovery stalls, they may have to boost reserves further which might necessitate dividend cuts. By contrast, almost 50% of dividends in the Russell Top 200 come from Technology, Healthcare, and Consumer Staples, sectors that have seen some positive impacts from the COVID-19 pandemic.
The other takeaway is that there are still a lot of stocks that could be significantly undervalued. While the 2020 and 2021 outlooks are lower, the longer-term prospects for many companies may not have changed significantly (although the outlook for some has). It is our job to find those and we are confident that we will be able to do so.
Portfolio Results
In the fiscal year ended September 30, 2020, the Keeley Mid Cap Dividend Fund’s net asset value (NAV) total return declined 13.4% compared with a 7.3% decline in total return for its benchmark, the Russell MidCap Value Index. We believe the Fund trailed its benchmark, and our expectations, primarily for the reasons we have explained above but we will provide more detail on the performance of the Fund in the next few paragraphs.
When we disaggregate relative performance into the impact from Sector Allocation decisions and the impact from Stock Selection efforts, we find that Sector Allocation detracted a very slight amount from relative performance while Stock Selection produced the vast majority of relative underperformance. While the Fund is relatively sector neutral, we find that an overweight in the strong performing Materials sector provided a lift, while a small underweight in the strong-performing Technology sector hurt relative performance. Our Stock Selection decisions had the biggest positive impact in the Financial sector, while the Fund’s holdings in the Communication Services, Technology and Industrials sectors were the biggest laggards.
| | ● | | The Financial sector declined more than the overall Index, but the Fund’s holdings meaningfully outperformed those of the index. Strong gains in the shares of Ameriprise and Virtu Financial accounted for most of the superior performance. Ameriprise’s shares ran up after strong net flows. Virtu, on the other hand, is a market-maker of a wide variety of financial instruments around the world and benefitted from a pick-up in volumes and volatility. Some of the Fund’s holdings in bank stocks, such as Comerica and Popular, detracted as investors feared a replay of the Global Financial Crisis, while others, like Umpqua Holdings, held up relatively better. |
| | ● | | The Communication Services sector was the biggest detractor for the Fund. Both Fund holdings in the sector underperformed, although broadcaster Nexstar Holdings only lagged by a modest amount on a relative basis and should perform well as it reports results from 2020 political advertising. The Fund’s other holding, film exhibitor Cinemark Holdings, dramatically declined as COVID-19 shutdowns reduced Cinemark’s revenues to near-zero. We remain confident that Cinemark can rebound with patrons returning to theaters once a vaccine is developed. |
| | ● | | Performance of the Fund’s Technology investments was disappointing, particularly compared to the positive overall returns of the sector. While audio technology firm Dolby Laboratories was up nicely, it wasn’t enough to offset declines at government IT services firm Perspecta and automotive IT provider CDK Global. Perspecta underperformed both the benchmark and its government IT services peers after it lost its largest contract early in 2020. |
| | ● | | Industrials were a mixed bag for the Fund, which was not good enough in a sector that performed better than the overall market. While the Fund benefitted from strong gains in building products manufacturer Fortune Brands Home and Security and infrastructure builder Quanta Services, weakness in GrafTech International, Air Lease, and nVent more than offset these gains. GrafTech supplies electrodes used in steelmaking while Air Lease is a leading lessor of commercial aircraft. These businesses have been more negatively impacted by the deterioration in the economy related to the COVID pandemic than most other companies. |
In conclusion, we thank you for investing alongside us in the Keeley Mid Cap Dividend Value Fund.
10
| | | | | | | | | | | | | | | | | | | | |
| Average Annual Returns Through September 30, 2020 (a) (Unaudited) | |
| | | | | | 1 Year | | | 5 Year | | | Since
Inception
(10/03/11) | | | | |
Mid Cap Dividend Value Fund Class A | | | | | | | (17.26)% | | | | 4.18% | | | | 9.50% | | | | | |
Russell MidCap Value Index | | | | | | | (7.30) | | | | 6.38 | | | | 11.65 | | | | | |
In the current prospectuses dated January 28, 2020, the gross expense ratio for Class A Shares is 1.39%, and the net expense ratio is 1.22%, after contractual reimbursements by Keeley-Teton Advisors, Inc. (the Adviser). See page 24 for the expense ratios for the year ended September 30, 2020. Class A Shares have a maximum sales charge of 4.50% which is included in the figures. (a) Returns represent past performance and do not guarantee future results. Total returns and average annual returns reflect changes in share price, reinvestment of distributions, and are net of expenses. Investment returns and the principal value of an investment will fluctuate. When shares are redeemed, they may be worth more or less than their original cost. Current performance may be lower or higher than the performance data presented. Visit www.keeleyfunds.com for performance information as of the most recent month end. The Adviser reimbursed expenses to limit the expense ratio. Had such limitation not been in place, returns would have been lower. Investors should carefully consider the investment objectives, risks, charges, and expenses of the Fund before investing. The prospectuses contain information about these and other matters and should be read carefully before investing. To obtain a prospectus, please visit our website at www.keeleyfunds.com. Another share class is available and has different performance characteristics. See page 2 for performance of the other share class. The Russell Midcap® Value Index is an unmanaged index that measures the performance of the mid-cap value segment of the U.S. equity universe and includes those Russell Midcap Index companies with lower price-to-book ratios and lower forecasted growth values. The Russell Midcap® Index is an unmanaged index that measures the performance of the 800 smallest companies by market capitalization of the Russell 1000® Index. Dividends are considered reinvested. You cannot invest directly in an index. | |
COMPARISON OF CHANGE IN VALUE OF A $10,000 INVESTMENT IN THE MID CAP DIVIDEND VALUE FUND CLASS A AND THE RUSSELL MIDCAP VALUE INDEX (Unaudited)
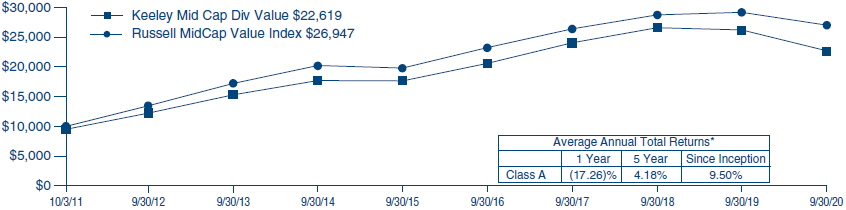
| * | Past performance is not predictive of future results. The performance tables and graph do not reflect the deduction of taxes that a shareholder would pay on Fund distributions or the redemption of Fund shares. |
11
KEELEY Funds
Disclosure of Fund Expenses (Unaudited)
For the Six Month Period from April 1, 2020 through September 30, 2020
We believe it is important for you to understand the impact of fees and expenses regarding your investment. All mutual funds have operating expenses. As a shareholder of a fund, you incur ongoing costs, which include costs for portfolio management, administrative services, and shareholder reports (like this one), among others. Operating expenses, which are deducted from a fund’s gross income, directly reduce the investment return of a fund. When a fund’s expenses are expressed as a percentage of its average net assets, this figure is known as the expense ratio. The following examples are intended to help you understand the ongoing costs (in dollars) of investing in your Fund and to compare these costs with those of other mutual funds. The examples are based on an investment of $1,000 made at the beginning of the period shown and held for the entire period.
The Expense Table below illustrates your Fund’s costs in two ways:
Actual Fund Return: This section provides information about actual account values and actual expenses. You may use this section to help you to estimate the actual expenses that you paid over the period after any fee waivers and expense reimbursements. The “Ending Account Value” shown is derived from the Fund’s actual return during the past six months, and the Expenses Paid During Period” shows the dollar amount that would have been paid by an investor who started with $1,000 in the Fund. You may use this information, together with the amount you invested, to estimate the expenses that you paid over the period. To do so, simply divide your account value by $1,000 (for example, an $8,600 account value
divided by $1,000 = 8.6), then multiply the result by the number given for your Fund under the heading “Expenses Paid During Period” to estimate the expenses you paid during this period.
Hypothetical 5% Return: This section provides information about hypothetical account values and hypothetical expenses based on the Fund’s actual expense ratio. It assumes a hypothetical annualized return of 5% before expenses during the period shown. In this case – because the hypothetical return used is not the Fund’s actual return – the results do not apply to your investment and you cannot use the hypothetical account value and expense to estimate the actual ending account balance or expenses you paid for the period. This example is useful in making comparisons of the ongoing costs of investing in the Fund and other funds. To do so, compare this 5% hypothetical example with the 5% hypothetical examples that appear in shareholder reports of other funds.
Please note that the expenses shown in the table are meant to highlight your ongoing costs only and do not reflect any transactional costs such as sales charges (loads), redemption fees, or exchange fees, if any, which are described in the Prospectus. If these costs were applied to your account, your costs would be higher. Therefore, the 5% hypothetical return is useful in comparing ongoing costs only, and will not help you determine the relative total costs of owning different funds. The ���Annualized Expense Ratio” represents the actual expenses for the last six months and may be different from the expense ratio in the Financial Highlights which is for the fiscal year ended September 30, 2020.
Expense Table
| | | | | | | | | | | | | | | | | | | | | | | | | | | | | | | | |
| | | Actual Fund Return | | Hypothetical 5% Return |
| | | Beginning
Account Value 04/01/20 | | Ending
Account Value
09/30/20 | | Annualized
Expense
Ratio | | | Expenses
Paid During
Period* | | Beginning
Account Value
04/01/20 | | Ending
Account Value
09/30/20 | | | Annualized
Expense
Ratio | | | Expenses
Paid During
Period* | |
KEELEY Small Cap Dividend Value Fund | | | | | | | | | | | | | | | | | | | | | | | | | | | | | | | | |
Class A | | | $1,000.00 | | | | $1,219.10 | | | | 1.29% | | | | $7.16 | | | | $1,000.00 | | | | $1,018.55 | | | | 1.29% | | | | $6.51 | |
Class I | | | $1,000.00 | | | | $1,221.10 | | | | 1.04% | | | | $5.77 | | | | $1,000.00 | | | | $1,019.80 | | | | 1.04% | | | | $5.25 | |
KEELEY Small-Mid Cap Value Fund | | | | | | | | | | | | | | | | | | | | | | | | | | | | | | | | |
Class A | | | $1,000.00 | | | | $1,305.80 | | | | 1.39% | | | | $8.01 | | | | $1,000.00 | | | | $1,018.05 | | | | 1.39% | | | | $7.01 | |
Class I | | | $1,000.00 | | | | $1,307.50 | | | | 1.14% | | | | $6.58 | | | | $1,000.00 | | | | $1,019.30 | | | | 1.14% | | | | $5.76 | |
KEELEY Mid Cap Dividend Value Fund | | | | | | | | | | | | | | | | | | | | | | | | | | | | | | | | |
Class A | | | $1,000.00 | | | | $1,228.10 | | | | 1.20% | | | | $6.68 | | | | $1,000.00 | | | | $1,019.00 | | | | 1.20% | | | | $6.06 | |
Class I | | | $1,000.00 | | | | $1,229.80 | | | | 0.95% | | | | $5.30 | | | | $1,000.00 | | | | $1,020.25 | | | | 0.95% | | | | $4.80 | |
| * | Expenses are equal to the Funds’ annualized expense ratio for the last six months multiplied by the average account value over the period, multiplied by the number of days in the most recent fiscal half year (183 days), then divided by 366. |
12
Summary of Portfolio Holdings (Unaudited)
The following tables present portfolio holdings as a percent of net assets as of September 30, 2020:
| | | | | | | | | | | | | | |
KEELEY Small Cap Dividend Value Fund | |
Financial Services | | | 17.2 | % | | | | | | Paper and Forest Products | | | 2.2 | % |
Energy and Utilities | | | 13.4 | % | | | | | | Hotels and Gaming | | | 1.7 | % |
Banking | | | 13.1 | % | | | | | | Automotive | | | 1.7 | % |
Health Care | | | 8.9 | % | | | | | | Electronics | | | 1.5 | % |
Building and Construction | | | 7.0 | % | | | | | | Equipment and Supplies | | | 1.3 | % |
Business Services | | | 6.2 | % | | | | | | Consumer Services | | | 1.2 | % |
Diversified Industrial | | | 4.8 | % | | | | | | Machinery | | | 0.9 | % |
Computer Software and Services | | | 3.8 | % | | | | | | Entertainment | | | 0.4 | % |
Retail | | | 3.5 | % | | | | | | Other Assets and Liabilities (Net) | | | 0.0 | %* |
| | | | | | | | | | | | | | |
Metals and Mining | | | 3.3 | % | | | | | | | | | 100.0 | % |
| | | | | | | | | | | | | | |
Consumer Products | | | 3.1 | % | | | | | | * Amount represents less than 0.05%. | | | | |
Other Investment Companies | | | 2.4 | % | | | | | | | | |
Broadcasting | | | 2.4 | % | | | | | | | | |
KEELEY Small-Mid Cap Value Fund | | | | | | | |
Financial Services | | | 16.7 | % | | | | | | Banking | | | 3.3 | % |
Diversified Industrial | | | 12.5 | % | | | | | | Broadcasting | | | 2.6 | % |
Energy and Utilities | | | 11.6 | % | | | | | | Other Investment Companies | | | 2.4 | % |
Computer Software and Services | | | 7.8 | % | | | | | | Equipment and Supplies | | | 1.4 | % |
Building and Construction | | | 7.0 | % | | | | | | Food and Beverage | | | 1.3 | % |
Health Care | | | 6.2 | % | | | | | | Automotive: Parts and Accessories | | | 1.0 | % |
Consumer Products | | | 5.8 | % | | | | | | Metals and Mining | | | 0.8 | % |
Business Services | | | 5.3 | % | | | | | | Other Assets and Liabilities (Net) | | | 0.4 | % |
| | | | | | | | | | | | | | |
Retail | | | 5.0 | % | | | | | | | | | 100.0 | % |
| | | | | | | | | | | | | | |
Hotels and Gaming | | | 4.7 | % | | | | | | | | | | |
Specialty Chemicals | | | 4.2 | % | | | | | | | | | | |
KEELEY Mid Cap Dividend Value Fund | |
Financial Services | | | 17.0 | % | | | | | | Other Investment Companies | | | 1.7 | % |
Energy and Utilities | | | 16.4 | % | | | | | | Metals and Mining | | | 1.6 | % |
Health Care | | | 9.6 | % | | | | | | Consumer Services | | | 1.4 | % |
Specialty Chemicals | | | 6.9 | % | | | | | | Real Estate | | | 1.3 | % |
Building and Construction | | | 6.8 | % | | | | | | Automotive: Parts and Accessories | | | 1.2 | % |
Business Services | | | 6.2 | % | | | | | | Broadcasting | | | 1.1 | % |
Hotels and Gaming | | | 4.2 | % | | | | | | Banking | | | 0.7 | % |
Consumer Products | | | 4.0 | % | | | | | | Equipment and Supplies | | | 0.5 | % |
Machinery | | | 3.8 | % | | | | | | Entertainment | | | 0.3 | % |
Diversified Industrial | | | 3.7 | % | | | | | | Other Assets and Liabilities (Net) | | | (0.2 | )% |
| | | | | | | | | | | | | | |
Electronics | | | 3.5 | % | | | | | | | | | 100.0 | % |
| | | | | | | | | | | | | | |
Computer Software and Services | | | 3.2 | % | | | | | | | | | | |
Food and Beverage | | | 3.1 | % | | | | | | | | | | |
Retail | | | 2.0 | % | | | | | | | | | | |
13
KEELEY Small Cap Dividend Value Fund
Schedule of Investments — September 30, 2020
| | | | | | | | | | |
Shares | | | | Cost | | | Market
Value | |
| | | |
| | COMMON STOCKS — 97.6% | | | | | | | | |
| | Automotive — 1.7% | | | | | | | | |
| 89,560 | | Winnebago Industries Inc. | | $ | 3,162,106 | | | $ | 4,627,565 | |
| | | | | | | | | | |
| | | |
| | Banking — 13.1% | | | | | | | | |
| 161,031 | | Atlantic Union Bankshares Corp. | | | 5,177,928 | | | | 3,441,232 | |
| 209,032 | | BancorpSouth Bank | | | 3,158,673 | | | | 4,051,040 | |
| 32,106 | | BOK Financial Corp. | | | 1,509,168 | | | | 1,653,780 | |
| 136,064 | | Columbia Banking System Inc. | | | 4,438,549 | | | | 3,245,126 | |
| 146,501 | | First Bancorp/Southern Pines NC | | | 3,056,959 | | | | 3,066,266 | |
| 114,040 | | Glacier Bancorp Inc. | | | 4,126,076 | | | | 3,654,982 | |
| 111,325 | | Independent Bank Group Inc. | | | 5,623,973 | | | | 4,918,339 | |
| 228,080 | | OceanFirst Financial Corp. | | | 5,728,888 | | | | 3,122,415 | |
| 30,773 | | Prosperity Bancshares Inc. | | | 2,133,492 | | | | 1,594,965 | |
| 184,509 | | The Bank of NT Butterfield & Son Ltd. | | | 6,373,488 | | | | 4,110,860 | |
| 71,210 | | Wintrust Financial Corp. | | | 4,128,862 | | | | 2,851,961 | |
| | | | | | | | | | |
| | | |
| | | | | 45,456,056 | | | | 35,710,966 | |
| | | | | | | | | | |
| | | |
| | Broadcasting — 2.4% | | | | | | | | |
| 72,073 | | Nexstar Media Group Inc., Cl. A | | | 3,337,896 | | | | 6,481,525 | |
| | | | | | | | | | |
| | |
| | Building and Construction — 7.0% | | | | | |
| 141,379 | | KB Home | | | 3,515,916 | | | | 5,427,540 | |
| 298,440 | | KBR Inc. | | | 4,624,224 | | | | 6,673,118 | |
| 382,350 | | Primoris Services Corp. | | | 7,000,737 | | | | 6,897,594 | |
| | | | | | | | | | |
| | | |
| | | | | 15,140,877 | | | | 18,998,252 | |
| | | | | | | | | | |
| | | |
| | Business Services — 6.2% | | | | | | | | |
| 403,649 | | City Office REIT Inc. | | | 4,715,552 | | | | 3,035,440 | |
| 201,200 | | Healthcare Services Group Inc. | | | 4,942,974 | | | | 4,331,836 | |
| 292,192 | | Outfront Media Inc., REIT | | | 7,457,300 | | | | 4,251,394 | |
| 141,486 | | STAG Industrial Inc., REIT | | | 3,816,814 | | | | 4,313,908 | |
| 93,415 | | The Hackett Group Inc. | | | 1,517,651 | | | | 1,044,380 | |
| | | | | | | | | | |
| | | |
| | | | | 22,450,291 | | | | 16,976,958 | |
| | | | | | | | | | |
| | |
| | Computer Software and Services — 3.8% | | | | | |
| 253,102 | | Perspecta Inc. | | | 5,874,853 | | | | 4,922,834 | |
| 102,707 | | TTEC Holdings Inc. | | | 3,897,678 | | | | 5,602,667 | |
| | | | | | | | | | |
| | | |
| | | | | 9,772,531 | | | | 10,525,501 | |
| | | | | | | | | | |
| | | |
| | Consumer Products — 3.1% | | | | | | | | |
| 296,263 | | Culp Inc. | | | 4,825,271 | | | | 3,679,586 | |
| 196,100 | | Kontoor Brands Inc. | | | 5,203,858 | | | | 4,745,620 | |
| | | | | | | | | | |
| | | |
| | | | | 10,029,129 | | | | 8,425,206 | |
| | | | | | | | | | |
| | | |
| | Consumer Services — 1.2% | | | | | | | | |
| 102,846 | | National Storage Affiliates Trust, REIT | | | 3,069,941 | | | | 3,364,093 | |
| | | | | | | | | | |
| | | |
| | Diversified Industrial — 4.8% | | | | | | | | |
| 34,569 | | ESCO Technologies Inc. | | | 1,139,096 | | | | 2,784,879 | |
| 144,813 | | Hillenbrand Inc. | | | 2,935,854 | | | | 4,106,897 | |
| 38,315 | | John Bean Technologies Corp. | | | 1,384,603 | | | | 3,520,765 | |
| 217,134 | | Olin Corp. | | | 3,872,429 | | | | 2,688,119 | |
| | | | | | | | | | |
| | | |
| | | | | 9,331,982 | | | | 13,100,660 | |
| | | | | | | | | | |
| | | |
| | Electronics — 1.5% | | | | | | | | |
| 61,417 | | Dolby Laboratories Inc., Cl. A | | | 3,865,277 | | | | 4,070,719 | |
| | | | | | | | | | |
| | | |
| | Energy and Utilities — 13.4% | | | | | | | | |
| 81,366 | | ALLETE Inc. | | | 3,462,582 | | | | 4,209,877 | |
| 302,139 | | Atlantica Sustainable Infrastructure plc. | | | 5,814,956 | | | | 8,644,197 | |
| 75,181 | | Black Hills Corp. | | | 4,271,362 | | | | 4,021,432 | |
| 298,069 | | Covanta Holding Corp. | | | 5,139,133 | | | | 2,310,035 | |
| 199,048 | | Delek U.S. Holdings Inc. | | | 4,675,366 | | | | 2,215,404 | |
| 18,845 | | Evolution Petroleum Corp. | | | 127,271 | | | | 42,213 | |
| 362,538 | | Parsley Energy Inc., Cl. A | | | 2,924,403 | | | | 3,393,356 | |
| 391,598 | | Primo Water Corp. | | | 5,064,532 | | | | 5,560,692 | |
| 207,675 | | South Jersey Industries Inc. | | | 6,541,456 | | | | 4,001,897 | |
| | | | | | | | | | |
Shares | | | | Cost | | | Market
Value | |
| | | |
| 4,626 | | Texas Pacific Land Trust | | $ | 1,807,428 | | | $ | 2,088,916 | |
| | | | | | | | | | |
| | | |
| | | | | 39,828,489 | | | | 36,488,019 | |
| | | | | | | | | | |
| | | |
| | Entertainment — 0.4% | | | | | | | | |
| 101,029 | | Cinemark Holdings Inc. | | | 3,737,463 | | | | 1,010,290 | |
| | | | | | | | | | |
| | | |
| | Equipment and Supplies — 1.3% | | | | | | | | |
| 39,230 | | Regal Beloit Corp. | | | 3,081,823 | | | | 3,682,520 | |
| | | | | | | | | | |
| | | |
| | Financial Services — 17.2% | | | | | | | | |
| 99,559 | | Air Lease Corp. | | | 2,072,330 | | | | 2,929,026 | |
| 319,155 | | Alpine Income Property Trust Inc., REIT | | | 5,801,520 | | | | 4,962,860 | |
| 571,407 | | Brightsphere Investment Group Inc. | | | 5,316,609 | | | | 7,371,150 | |
| 31,601 | | FBL Financial Group Inc., Cl. A | | | 1,308,116 | | | | 1,523,168 | |
| 385,330 | | FNB Corp. | | | 4,314,916 | | | | 2,612,537 | |
| 57,862 | | James River Group Holdings Ltd. | | | 1,938,161 | | | | 2,576,595 | |
| 690,877 | | Oaktree Specialty Lending Corp. | | | 3,723,399 | | | | 3,343,845 | |
| 180,716 | | Pacific Premier Bancorp Inc. | | | 3,781,933 | | | | 3,639,620 | |
| 258,017 | | Provident Financial Services Inc. | | | 3,497,582 | | | | 3,147,807 | |
| 213,983 | | Silvercrest Asset Management Group Inc., Cl. A | | | 1,986,907 | | | | 2,238,262 | |
| 105,368 | | Solar Capital Ltd. | | | 2,050,782 | | | | 1,670,083 | |
| 78,449 | | South State Corp. | | | 7,138,129 | | | | 3,777,319 | |
| 178,078 | | Synovus Financial Corp. | | | 4,598,571 | | | | 3,769,911 | |
| 151,450 | | Virtu Financial Inc., Cl. A | | | 3,272,779 | | | | 3,484,865 | |
| | | | | | | | | | |
| | | |
| | | | | 50,801,734 | | | | 47,047,048 | |
| | | |
| | Health Care — 8.9% | | | | | | | | |
| 257,154 | | CareTrust REIT Inc. | | | 3,073,038 | | | | 4,576,055 | |
| 13,584 | | Chemed Corp. | | | 4,708,526 | | | | 6,525,074 | |
| 360,825 | | Sabra Health Care REIT Inc. | | | 4,325,582 | | | | 4,973,973 | |
| 145,062 | | The Ensign Group Inc. | | | 2,561,519 | | | | 8,277,238 | |
| | | | | | | | | | |
| | | |
| | | | | 14,668,665 | | | | 24,352,340 | |
| | | | | | | | | | |
| | | |
| | Hotels and Gaming — 1.7% | | | | | | | | |
| 51,590 | | Marriott Vacations Worldwide Corp. | | | 4,899,200 | | | | 4,684,888 | |
| | | | | | | | | | |
| | | |
| | Machinery — 0.9% | | | | | | | | |
| 47,864 | | Astec Industries Inc. | | | 2,236,081 | | | | 2,596,622 | |
| | | | | | | | | | |
| | | |
| | Metals and Mining — 3.3% | | | | | | | | |
| 102,877 | | Compass Minerals International Inc. | | | 5,687,849 | | | | 6,105,750 | |
| 55,302 | | Kaiser Aluminum Corp. | | | 1,855,492 | | | | 2,963,634 | |
| | | | | | | | | | |
| | | |
| | | | | 7,543,341 | | | | 9,069,384 | |
| | | | | | | | | | |
| | |
| | Paper and Forest Products — 2.2% | | | | | |
| 566,648 | | Mercer International Inc. | | | 7,661,104 | | | | 3,739,877 | |
| 52,633 | | PotlatchDeltic Corp., REIT | | | 1,852,610 | | | | 2,215,849 | |
| | | | | | | | | | |
| | | |
| | | | | 9,513,714 | | | | 5,955,726 | |
| | | | | | | | | | |
| | | |
| | Retail — 3.5% | | | | | | | | |
| 53,702 | | Jack in the Box Inc. | | | 4,636,995 | | | | 4,259,106 | |
| 112,223 | | Penske Automotive Group Inc. | | | 2,028,811 | | | | 5,348,548 | |
| | | | | | | | | | |
| | | |
| | | | | 6,665,806 | | | | 9,607,654 | |
| | | | | | | | | | |
| | | |
| | TOTAL COMMON STOCKS | | | 268,592,402 | | | | 266,775,936 | |
| | | | | | | | | | |
| | | |
| | RIGHTS — 0.0% | | | | | | | | |
| | Broadcasting — 0.0% | | | | | | | | |
| 851,756 | | Media General Inc., CVR†(a) | | | 0 | | | | 1 | |
| | | | | | | | | | |
See accompanying notes to financial statements.
14
KEELEY Small Cap Dividend Value Fund
Schedule of Investments (Continued) — September 30, 2020
| | | | | | | | | | |
Shares | | | | Cost | | | Market
Value | |
| | |
| | SHORT TERM INVESTMENT — 2.4% | | | | | |
| | Other Investment Companies — 2.4% | | | | | |
| 6,591,757 | | Fidelity Government Portfolio,
Cl. I, 0.010%* | | $ | 6,591,757 | | | $ | 6,591,757 | |
| | | | | | | | | | |
| | | |
| | TOTAL
INVESTMENTS — 100.0% | | $ | 275,184,159 | | | | 273,367,694 | |
| | | | | | | | | | |
| | |
| | Other Assets and Liabilities (Net) — 0.0% | | | | (107,510 | ) |
| | | | | | | | | | |
| | | |
| | NET ASSETS — 100.0% | | | | | | $ | 273,260,184 | |
| | | | | | | | | | |
| * | 1 day yield as of September 30, 2020. |
| (a) | Security is valued using significant unobservable inputs and is classified as Level 3 in the fair value hierarchy. |
| † | Non-income producing security. |
| CVR | Contingent Value Right |
| REIT | Real Estate Investment Trust |
See accompanying notes to financial statements.
15
KEELEY Small-Mid Cap Value Fund
Schedule of Investments — September 30, 2020
| | | | | | | | | | |
Shares | | | | Cost | | | Market
Value | |
| | COMMON STOCKS — 97.2% | | | | | |
| | Automotive: Parts and Accessories — 1.0% | | | | | |
| 5,594 | | Visteon Corp.† | | $ | 439,617 | | | $ | 387,217 | |
| | | | | | | | | | |
| | | |
| | Banking — 3.3% | | | | | | | | |
| 16,650 | | PacWest Bancorp | | | 558,028 | | | | 284,382 | |
| 16,695 | | The Bank of NT Butterfield & Son Ltd | | | 463,391 | | | | 371,965 | |
| 29,571 | | Umpqua Holdings Corp. | | | 508,189 | | | | 314,044 | |
| 6,700 | | Wintrust Financial Corp. | | | 317,629 | | | | 268,335 | |
| | | | | | | | | | |
| | | |
| | | | | 1,847,237 | | | | 1,238,726 | |
| | | | | | | | | | |
| | | |
| | Broadcasting — 2.6% | | | | | | | | |
| 10,525 | | Nexstar Media Group Inc., Cl. A | | | 763,188 | | | | 946,513 | |
| | | | | | | | | | |
| | |
| | Building and Construction — 7.0% | | | | | |
| 11,589 | | Fortune Brands Home & Security Inc. | | | 180,112 | | | | 1,002,680 | |
| 40,991 | | KBR Inc. | | | 672,528 | | | | 916,559 | |
| 36,589 | | TRI Pointe Group Inc.† | | | 417,526 | | | | 663,724 | |
| | | | | | | | | | |
| | | |
| | | | | 1,270,166 | | | | 2,582,963 | |
| | | | | | | | | | |
| | | |
| | Business Services — 5.3% | | | | | | | | |
| 11,788 | | IAA Inc.† | | | 401,756 | | | | 613,801 | |
| 6,975 | | Lamar Advertising Co., Cl. A, REIT | | | 238,207 | | | | 461,536 | |
| 19,400 | | Outfront Media Inc., REIT | | | 297,896 | | | | 282,270 | |
| 4,279 | | WEX Inc.† | | | 142,614 | | | | 594,653 | |
| | | | | | | | | | |
| | | |
| | | | | 1,080,473 | | | | 1,952,260 | |
| | | | | | | | | | |
| | |
| | Computer Software and Services — 7.8% | | | | | |
| 8,207 | | Black Knight Inc.† | | | 119,475 | | | | 714,419 | |
| 11,306 | | CDK Global Inc. | | | 307,823 | | | | 492,829 | |
| 16,868 | | Perspecta Inc. | | | 369,786 | | | | 328,083 | |
| 12,200 | | Teradata Corp.† | | | 256,442 | | | | 276,940 | |
| 11,638 | | TTEC Holdings Inc. | | | 439,324 | | | | 634,853 | |
| 8,997 | | Verint Systems Inc.† | | | 257,179 | | | | 433,475 | |
| | | | | | | | | | |
| | | |
| | | | | 1,750,029 | | | | 2,880,599 | |
| | | | | | | | | | |
| | | |
| | Consumer Products — 5.8% | | | | | | | | |
| 11,308 | | Brunswick Corp. | | | 588,779 | | | | 666,154 | |
| 22,020 | | Kontoor Brands Inc. | | | 459,793 | | | | 532,884 | |
| 6,936 | | PVH Corp. | | | 529,494 | | | | 413,663 | |
| 9,102 | | Spectrum Brands Holdings Inc. | | | 460,065 | | | | 520,270 | |
| | | | | | | | | | |
| | | |
| | | | | 2,038,131 | | | | 2,132,971 | |
| | | | | | | | | | |
| | | |
| | Diversified Industrial — 12.5% | | | | | | | | |
| 12,014 | | Altra Industrial Motion Corp. | | | 429,964 | | | | 444,158 | |
| 11,043 | | Chart Industries Inc.† | | | 343,126 | | | | 775,992 | |
| 10,534 | | ESCO Technologies Inc. | | | 366,149 | | | | 848,619 | |
| 44,627 | | GrafTech International Ltd. | | | 464,253 | | | | 305,249 | |
| 27,500 | | Harsco Corp.† | | | 379,523 | | | | 382,525 | |
| 10,463 | | ITT Inc. | | | 189,635 | | | | 617,840 | |
| 9,069 | | John Bean Technologies Corp. | | | 92,598 | | | | 833,350 | |
| 24,765 | | nVent Electric plc | | | 607,535 | | | | 438,093 | |
| | | | | | | | | | |
| | | |
| | | | | 2,872,783 | | | | 4,645,826 | |
| | | | | | | | | | |
| | | |
| | Energy and Utilities — 11.6% | | | | | | | | |
| 5,627 | | American Water Works Co. Inc. | | | 233,446 | | | | 815,240 | |
| 18,361 | | Delek U.S. Holdings Inc. | | | 399,256 | | | | 204,358 | |
| 38,800 | | Diamond S Shipping Inc.† | | | 284,634 | | | | 266,556 | |
| 9,482 | | Diamondback Energy Inc. | | | 620,635 | | | | 285,598 | |
| 7,164 | | Evergy Inc. | | | 389,577 | | | | 364,075 | |
| 27,935 | | MDU Resources Group Inc. | | | 549,395 | | | | 628,538 | |
| 22,643 | | NRG Energy Inc. | | | 210,596 | | | | 696,046 | |
| 32,993 | | Parsley Energy Inc., Cl. A | | | 554,959 | | | | 308,814 | |
| 35,731 | | Primo Water Corp. | | | 465,711 | | | | 507,380 | |
| 504 | | Texas Pacific Land Trust | | | 257,881 | | | | 227,586 | |
| | | | | | | | | | |
| | | |
| | | | | 3,966,090 | | | | 4,304,191 | |
| | | | | | | | | | |
| | | |
| | Equipment and Supplies — 1.4% | | | | | | | | |
| 10,074 | | A.O. Smith Corp. | | | 91,019 | | | | 531,907 | |
| | | | | | | | | | |
| | | | | | | | | | |
Shares | | | | Cost | | | Market
Value | |
| | | |
| | Financial Services — 16.7% | | | | | | | | |
| 24,734 | | Air Lease Corp. | | $ | 523,245 | | | $ | 727,674 | |
| 6,417 | | BOK Financial Corp. | | | 291,316 | | | | 330,540 | |
| 46,338 | | Brightsphere Investment Group Inc. | | | 441,751 | | | | 597,760 | |
| 38,935 | | Equitable Holdings Inc. | | | 792,735 | | | | 710,174 | |
| 18,300 | | FG New America Acquisition Corp.† | | | 183,000 | | | | 183,183 | |
| 38,529 | | FNB Corp. | | | 446,725 | | | | 261,227 | |
| 20,800 | | FS KKR Capital Corp. II | | | 272,026 | | | | 305,968 | |
| 2,923 | | Hudson Executive Investment Corp.† | | | 29,493 | | | | 30,428 | |
| 20,100 | | Live Oak Acquisition Corp., Cl. A† | | | 200,290 | | | | 202,608 | |
| 19,300 | | New Providence Acquisition Corp., Cl. A† | | | 193,386 | | | | 194,351 | |
| 12,233 | | Popular Inc. | | | 664,550 | | | | 443,691 | |
| 6,455 | | Prosperity Bancshares Inc. | | | 393,977 | | | | 334,563 | |
| 7,655 | | South State Corp. | | | 433,583 | | | | 368,588 | |
| 25,441 | | Synovus Financial Corp. | | | 783,040 | | | | 538,586 | |
| 12,000 | | Virtu Financial Inc., Cl. A | | | 276,707 | | | | 276,120 | |
| 14,546 | | Voya Financial Inc. | | | 357,861 | | | | 697,190 | |
| | | | | | | | | | |
| | | |
| | | | | 6,283,685 | | | | 6,202,651 | |
| | | | | | | | | | |
| | | |
| | Food and Beverage — 1.3% | | | | | | | | |
| 7,276 | | Lamb Weston Holdings Inc. | | | 271,846 | | | | 482,181 | |
| | | | | | | | | | |
| | | |
| | Health Care — 6.2% | | | | | | | | |
| 31,936 | | CareTrust REIT Inc. | | | 411,940 | | | | 568,301 | |
| 2,872 | | Laboratory Corp. of America Holdings† | | | 324,471 | | | | 540,711 | |
| 44,273 | | Sabra Health Care REIT Inc. | | | 629,870 | | | | 610,303 | |
| 10,151 | | The Ensign Group Inc. | | | 434,785 | | | | 579,216 | |
| | | | | | | | | | |
| | | |
| | | | | 1,801,066 | | | | 2,298,531 | |
| | | | | | | | | | |
| | | |
| | Hotels and Gaming — 4.7% | | | | | | | | |
| 17,071 | | Gaming and Leisure Properties Inc., REIT | | | 435,947 | | | | 630,432 | |
| 50,522 | | Playa Hotels & Resorts NV† | | | 407,828 | | | | 211,687 | |
| 21,819 | | VICI Properties Inc., REIT | | | 431,474 | | | | 509,910 | |
| 7,832 | | Wyndham Hotels & Resorts Inc. | | | 453,856 | | | | 395,516 | |
| | | | | | | | | | |
| | | |
| | | | | 1,729,105 | | | | 1,747,545 | |
| | | | | | | | | | |
| | | |
| | Metals and Mining — 0.8% | | | | | | | | |
| 5,234 | | Kaiser Aluminum Corp. | | | 135,672 | | | | 280,490 | |
| | | | | | | | | | |
| | | |
| | Retail — 5.0% | | | | | | | | |
| 11,708 | | Copart Inc.† | | | 177,758 | | | | 1,231,213 | |
| 13,129 | | Penske Automotive Group Inc. | | | 222,649 | | | | 625,728 | |
| | | | | | | | | | |
| | | |
| | | | | 400,407 | | | | 1,856,941 | |
| | | | | | | | | | |
| | | |
| | Specialty Chemicals — 4.2% | | | | | | | | |
| 6,939 | | Ashland Global Holdings Inc. | | | 31,687 | | | | 492,114 | |
| 26,070 | | Huntsman Corp. | | | 303,609 | | | | 579,015 | |
| 25,157 | | Valvoline Inc. | | | 169,754 | | | | 478,989 | |
| | | | | | | | | | |
| | | |
| | | | | 505,050 | | | | 1,550,118 | |
| | | | | | | | | | |
| | | |
| | TOTAL COMMON STOCKS | | | 27,245,564 | | | | 36,021,630 | |
| | | | | | | | | | |
| | |
| | SHORT TERM INVESTMENT — 2.4% | | | | | |
| | |
| | Other Investment Companies — 2.4% | | | | | |
| 901,214 | | Fidelity Government Portfolio, Cl. I, 0.010%* | | | 901,214 | | | | 901,214 | |
| | | | | | | | | | |
| | | |
| | TOTAL INVESTMENTS — 99.6% | | $ | 28,146,778 | | | | 36,922,844 | |
| | | | | | | | | | |
| | |
| | Other Assets and Liabilities (Net) — 0.4% | | | | 147,346 | |
| | | | | | | | | | |
| | |
| | NET ASSETS — 100.0% | | | $ | 37,070,190 | |
| | | | | | | | | | |
| * | 1 day yield as of September 30, 2020. |
| † | Non-income producing security. |
| REIT | Real Estate Investment Trust |
See accompanying notes to financial statements.
16
KEELEY Mid Cap Dividend Value Fund
Schedule of Investments — September 30, 2020
| | | | | | | | | | |
Shares | | | | Cost | | | Market Value | |
| | | |
| | COMMON STOCKS — 98.5% | | | | | | | | |
| | |
| | Automotive: Parts and Accessories — 1.2% | | | | | |
| 17,943 | | Autoliv Inc. | | $ | 1,272,146 | | | $ | 1,307,686 | |
| | | | | | | | | | |
| | |
| | Banking — 0.7% | | | | | |
| 68,709 | | Umpqua Holdings Corp. | | | 1,070,784 | | | | 729,690 | |
| | | | | | | | | | |
| | |
| | Broadcasting — 1.1% | | | | | |
| 14,208 | | Nexstar Media Group Inc., Cl. A | | | 1,406,874 | | | | 1,277,725 | |
| | | | | | | | | | |
| | |
| | Building and Construction — 6.8% | | | | | |
| 30,396 | | Fortune Brands Home & Security Inc. | | | 1,374,649 | | | | 2,629,862 | |
| 79,307 | | KB Home | | | 2,045,889 | | | | 3,044,596 | |
| 15,515 | | Vulcan Materials Co. | | | 1,495,648 | | | | 2,102,903 | |
| | | | | | | | | | |
| | | |
| | | | | 4,916,186 | | | | 7,777,361 | |
| | | | | | | | | | |
| | |
| | Business Services — 6.2% | | | | | |
| 63,326 | | Hudson Pacific Properties Inc., REIT | | | 2,041,465 | | | | 1,388,739 | |
| 61,426 | | Iron Mountain Inc., REIT | | | 1,779,674 | | | | 1,645,603 | |
| 25,013 | | Lamar Advertising Co., Cl. A, REIT | | | 1,451,089 | | | | 1,655,110 | |
| 44,751 | | Quanta Services Inc. | | | 1,601,131 | | | | 2,365,538 | |
| | | | | | | | | | |
| | | |
| | | | | 6,873,359 | | | | 7,054,990 | |
| | | | | | | | | | |
| | |
| | Computer Software and Services — 3.2% | | | | | |
| 45,530 | | CDK Global Inc. | | | 2,311,816 | | | | 1,984,653 | |
| 87,458 | | Perspecta Inc. | | | 1,795,125 | | | | 1,701,058 | |
| | | | | | | | | | |
| | | |
| | | | | 4,106,941 | | | | 3,685,711 | |
| | | | | | | | | | |
| | |
| | Consumer Products — 4.0% | | | | | |
| 33,985 | | Brunswick Corp. | | | 1,760,534 | | | | 2,002,056 | |
| 20,296 | | Hasbro Inc. | | | 1,132,310 | | | | 1,678,885 | |
| 29,296 | | Reynolds Consumer Products Inc. | | | 884,227 | | | | 897,044 | |
| | | | | | | | | | |
| | | |
| | | | | 3,777,071 | | | | 4,577,985 | |
| | | | | | | | | | |
| | |
| | Consumer Services — 1.4% | | | | | |
| 26,386 | | Equity LifeStyle Properties Inc., REIT | | | 735,230 | | | | 1,617,462 | |
| | | | | | | | | | |
| | |
| | Diversified Industrial — 3.7% | | | | | |
| 162,441 | | GrafTech International Ltd. | | | 2,391,070 | | | | 1,111,096 | |
| 30,186 | | ITT Inc. | | | 1,294,612 | | | | 1,782,483 | |
| 77,258 | | nVent Electric plc | | | 1,849,965 | | | | 1,366,694 | |
| | | | | | | | | | |
| | | |
| | | | | 5,535,647 | | | | 4,260,273 | |
| | | | | | | | | | |
| | |
| | Electronics — 3.5% | | | | | |
| 24,065 | | Agilent Technologies Inc. | | | 1,105,315 | | | | 2,429,121 | |
| 22,903 | | Dolby Laboratories Inc., Cl. A | | | 1,022,114 | | | | 1,518,011 | |
| | | | | | | | | | |
| | | |
| | | | | 2,127,429 | | | | 3,947,132 | |
| | | | | | | | | | |
| | |
| | Energy and Utilities — 16.4% | | | | | |
| 13,193 | | American Water Works Co. Inc. | | | 1,005,965 | | | | 1,911,402 | |
| 33,690 | | Black Hills Corp. | | | 1,974,157 | | | | 1,802,078 | |
| 70,081 | | Cabot Oil & Gas Corp. | | | 1,459,916 | | | | 1,216,606 | |
| 33,862 | | Diamondback Energy Inc. | | | 2,611,270 | | | | 1,019,923 | |
| 28,180 | | Evergy Inc. | | | 1,449,401 | | | | 1,432,108 | |
| 72,192 | | MDU Resources Group Inc. | | | 1,822,831 | | | | 1,624,320 | |
| 18,048 | | National Fuel Gas Co. | | | 822,178 | | | | 732,568 | |
| 61,321 | | NRG Energy Inc. | | | 1,363,015 | | | | 1,885,008 | |
| 62,848 | | OGE Energy Corp. | | | 1,690,267 | | | | 1,884,812 | |
| 12,665 | | Pioneer Natural Resources Co. | | | 771,424 | | | | 1,089,063 | |
| 54,883 | | PPL Corp. | | | 1,702,553 | | | | 1,493,366 | |
| 27,231 | | UGI Corp. | | | 771,789 | | | | 898,078 | |
| 28,428 | | Valero Energy Corp. | | | 1,188,050 | | | | 1,231,501 | |
| 105,328 | | WPX Energy Inc.† | | | 919,036 | | | | 516,107 | |
| | | | | | | | | | |
| | | |
| | | | | 19,551,852 | | | | 18,736,940 | |
| | | | | | | | | | |
| | | | | | | | | | |
Shares | | | | Cost | | | Market Value | |
| | | |
| | Entertainment — 0.3% | | | | | | | | |
| 38,523 | | Cinemark Holdings Inc. | | $ | 1,361,155 | | | $ | 385,230 | |
| | | | | | | | | | |
| | | |
| | Equipment and Supplies — 0.5% | | | | | | | | |
| 11,200 | | The Timken Co. | | | 614,304 | | | | 607,264 | |
| | | | | | | | | | |
| | | |
| | Financial Services — 17.0% | | | | | | | | |
| 59,316 | | Air Lease Corp. | | | 1,515,094 | | | | 1,745,077 | |
| 12,349 | | Ameriprise Financial Inc. | | | 1,309,770 | | | | 1,903,104 | |
| 19,525 | | Arthur J Gallagher & Co. | | | 1,045,426 | | | | 2,061,449 | |
| 10,765 | | BOK Financial Corp. | | | 540,002 | | | | 554,505 | |
| 25,225 | | Comerica Inc. | | | 1,391,843 | | | | 964,856 | |
| 29,974 | | Discover Financial Services | | | 1,517,165 | | | | 1,731,898 | |
| 88,657 | | Equitable Holdings Inc. | | | 1,796,857 | | | | 1,617,104 | |
| 31,241 | | Popular Inc. | | | 1,713,840 | | | | 1,133,111 | |
| 29,126 | | Prosperity Bancshares Inc. | | | 1,914,444 | | | | 1,509,601 | |
| 14,143 | | Reinsurance Group of America Inc. | | | 1,605,998 | | | | 1,346,272 | |
| 24,278 | | South State Corp. | | | 1,330,994 | | | | 1,168,986 | |
| 50,029 | | Synovus Financial Corp. | | | 1,674,528 | | | | 1,059,114 | |
| 51,505 | | Virtu Financial Inc., Cl. A | | | 1,051,256 | | | | 1,185,130 | |
| 30,300 | | Voya Financial Inc. | | | 1,000,700 | | | | 1,452,279 | |
| | | | | | | | | | |
| | | |
| | | | | 19,407,917 | | | | 19,432,486 | |
| | | | | | | | | | |
| | | |
| | Food and Beverage — 3.1% | | | | | | | | |
| 43,379 | | Conagra Brands Inc. | | | 1,250,828 | | | | 1,549,064 | |
| 29,674 | | Lamb Weston Holdings Inc. | | | 1,079,664 | | | | 1,966,496 | |
| | | | | | | | | | |
| | | |
| | | | | 2,330,492 | | | | 3,515,560 | |
| | | | | | | | | | |
| | | |
| | Health Care — 9.6% | | | | | | | | |
| 2,850 | | Chemed Corp. | | | 1,115,240 | | | | 1,368,997 | |
| 6,756 | | Cigna Corp. | | | 928,017 | | | | 1,144,534 | |
| 25,752 | | Encompass Health Corp. | | | 1,591,608 | | | | 1,673,365 | |
| 57,628 | | Healthcare Trust of America Inc., Cl. A, REIT | | | 1,410,457 | | | | 1,498,328 | |
| 101,428 | | Sabra Health Care REIT Inc. | | | 2,024,413 | | | | 1,398,185 | |
| 14,460 | | STERIS plc | | | 1,177,876 | | | | 2,547,707 | |
| 12,243 | | Universal Health Services Inc., Cl. B | | | 1,436,495 | | | | 1,310,246 | |
| | | | | | | | | | |
| | | |
| | | | | 9,684,106 | | | | 10,941,362 | |
| | | | | | | | | | |
| | | |
| | Hotels and Gaming — 4.2% | | | | | | | | |
| 17,943 | | Marriott Vacations Worldwide Corp. | | | 1,474,169 | | | | 1,629,404 | |
| 84,436 | | VICI Properties Inc., REIT | | | 1,680,858 | | | | 1,973,269 | |
| 24,274 | | Wyndham Hotels & Resorts Inc. | | | 1,162,250 | | | | 1,225,837 | |
| | | | | | | | | | |
| | | |
| | | | | 4,317,277 | | | | 4,828,510 | |
| | | | | | | | | | |
| | | |
| | Machinery — 3.8% | | | | | | | | |
| 40,318 | | BWX Technologies Inc. | | | 2,026,552 | | | | 2,270,307 | |
| 27,652 | | Oshkosh Corp. | | | 2,037,984 | | | | 2,032,422 | |
| | | | | | | | | | |
| | | |
| | | | | 4,064,536 | | | | 4,302,729 | |
| | | | | | | | | | |
| | | |
| | Metals and Mining — 1.6% | | | | | | | | |
| 12,877 | | Franco-Nevada Corp. | | | 927,886 | | | | 1,797,372 | |
| | | | | | | | | | |
| | | |
| | Real Estate — 1.3% | | | | | | | | |
| 43,906 | | Highwoods Properties Inc., REIT | | | 1,795,366 | | | | 1,473,924 | |
| | | | | | | | | | |
| | | |
| | Retail — 2.0% | | | | | | | | |
| 117,154 | | Brixmor Property Group Inc., REIT | | | 1,794,351 | | | | 1,369,530 | |
| 14,987 | | PVH Corp. | | | 1,452,123 | | | | 893,825 | |
| | | | | | | | | | |
| | | |
| | | | | 3,246,474 | | | | 2,263,355 | |
| | | | | | | | | | |
| | | |
| | Specialty Chemicals — 6.9% | | | | | | | | |
| 23,114 | | FMC Corp. | | | 1,068,163 | | | | 2,448,004 | |
| 56,150 | | Huntsman Corp. | | | 1,318,384 | | | | 1,247,092 | |
| 64,552 | | Olin Corp. | | | 1,028,195 | | | | 799,154 | |
| 23,537 | | RPM International Inc. | | | 890,542 | | | | 1,949,805 | |
See accompanying notes to financial statements.
17
KEELEY Mid Cap Dividend Value Fund
Schedule of Investments (Continued) — September 30, 2020
| | | | | | | | | | |
Shares | | | | Cost | | | Market
Value | |
| | |
| | COMMON STOCKS (Continued) | | | | | |
| | Specialty Chemicals (Continued) | | | | | |
| 77,016 | | Valvoline Inc. | | $ | 1,009,590 | | | $ | 1,466,385 | |
| | | | | | | | | | |
| | | |
| | | | | 5,314,874 | | | | 7,910,440 | |
| | | | | | | | | | |
| | | |
| | TOTAL COMMON STOCKS | | | 104,437,906 | | | | 112,431,187 | |
| | | | | | | | | | |
| | |
| | SHORT TERM INVESTMENT — 1.7% | | | | | |
| | Other Investment Companies — 1.7% | | | | | |
| 1,888,959 | | Fidelity Government Portfolio, Cl. I, 0.010%* | | | 1,888,959 | | | | 1,888,959 | |
| | | | | | | | | | |
| | | |
| | TOTAL
INVESTMENTS — 100.2% | | $ | 106,326,865 | | | | 114,320,146 | |
| | | | | | | | | | |
| | |
| | Other Assets and Liabilities (Net) — (0.2)% | | | | (227,043 | ) |
| | | | | | | | | | |
| | |
| | NET ASSETS — 100.0% | | | $ | 114,093,103 | |
| | | | | | | | | | |
| * | 1 day yield as of September 30, 2020. |
| † | Non-income producing security. |
| REIT | Real Estate Investment Trust |
See accompanying notes to financial statements.
18
KEELEY Funds
Statements of Assets and Liabilities
September 30, 2020
| | | | | | | | | | | | | | | | | | | | | | | | | | |
| | | Small Cap
Dividend
Value Fund | | | | | | | | | Small-Mid
Cap Value Fund | | | | | | | | Mid Cap
Dividend
Value Fund | |
Assets: | | | | | | | | | | | | | | | | | | | | | | | | | | |
Investments, at value (cost $275,184,159, $28,146,778, and $106,326,865,
respectively) | | | $273,367,694 | | | | | | | | | | | $36,922,844 | | | | | | | | | | | $114,320,146 | |
Receivable for Fund shares sold | | | 104,015 | | | | | | | | | | | 884 | | | | | | | | | | | 36,305 | |
Receivable for investments sold | | | — | | | | | | | | | | | 726,166 | | | | | | | | | | | — | |
Receivable from Adviser | | | 28,914 | | | | | | | | | | | 11,437 | | | | | | | | | | | 22,604 | |
Dividends and interest receivable | | | 500,528 | | | | | | | | | | | 63,684 | | | | | | | | | | | 234,152 | |
Prepaid expenses | | | 36,095 | | | | | | | | | | | 21,903 | | | | | | | | | | | 27,096 | |
| | | | | | | | | | | | | | | | | | | | | | | | | | |
Total Assets | | | 274,037,246 | | | | | | | | | | | 37,746,918 | | | | | | | | | | | 114,640,303 | |
| | | | | | | | | | | | | | | | | | | | | | | | | | |
Liabilities: | | | | | | | | | | | | | | | | | | | | | | | | | | |
Payable for investments purchased | | | — | | | | | | | | | | | 560,249 | | | | | | | | | | | 228,598 | |
Payable for Fund shares redeemed | | | 316,261 | | | | | | | | | | | 15,142 | | | | | | | | | | | 148,498 | |
Payable for investment advisory fees | | | 232,819 | | | | | | | | | | | 31,372 | | | | | | | | | | | 86,469 | |
Payable for distribution fees | | | 33,626 | | | | | | | | | | | 2,442 | | | | | | | | | | | 2,657 | |
Payable for accounting fees | | | 2,525 | | | | | | | | | | | 1,664 | | | | | | | | | | | 215 | |
Payable for chief compliance officer compensation | | | 4,885 | | | | | | | | | | | 646 | | | | | | | | | | | 1,970 | |
Payable for custodian fees | | | 3,374 | | | | | | | | | | | 2,018 | | | | | | | | | | | 2,638 | |
Payable for legal and audit fees | | | 68,105 | | | | | | | | | | | 31,676 | | | | | | | | | | | 37,428 | |
Payable for shareholder communications expenses | | | 49,857 | | | | | | | | | | | 17,690 | | | | | | | | | | | 19,385 | |
Payable for shareholder services fees | | | 49,032 | | | | | | | | | | | 5,299 | | | | | | | | | | | 9,437 | |
Other accrued expenses | | | 16,578 | | | | | | | | | | | 8,530 | | | | | | | | | | | 9,905 | |
| | | | | | | | | | | | | | | | | | | | | | | | | | |
Total Liabilities | | | 777,062 | | | | | | | | | | | 676,728 | | | | | | | | | | | 547,200 | |
| | | | | | | | | | | | | | | | | | | | | | | | | | |
Net Assets | | | $273,260,184 | | | | | | | | | | | $37,070,190 | | | | | | | | | | | $114,093,103 | |
| | | | | | | | | | | | | | | | | | | | | | | | | | |
Net Assets Consist of: | | | | | | | | | | | | | | | | | | | | | | | | | | |
Paid-in capital | | | $279,051,057 | | | | | | | | | | | $27,189,869 | | | | | | | | | | | $124,338,005 | |
Total distributable earnings (accumulated loss) | | | (5,790,873 | ) | | | | | | | | | | 9,880,321 | | | | | | | | | | | (10,244,902 | ) |
| | | | | | | | | | | | | | | | | | | | | | | | | | |
Net Assets | | | $273,260,184 | | | | | | | | | | | $37,070,190 | | | | | | | | | | | $114,093,103 | |
| | | | | | | | | | | | | | | | | | | | | | | | | | |
Shares of Capital Stock, each at $0.0001 par value: | | | | | | | | | | | | | | | | | | | | | | | | | | |
Class A: | | | | | | | | | | | | | | | | | | | | | | | | | | |
Net assets | | | $157,732,128 | | | | | | | | | | | $11,515,466 | | | | | | | | | | | $12,610,874 | |
| | | | | | | | | | | | | | | | | | | | | | | | | | |
Capital Shares outstanding | | | 12,279,990 | | | | | | | | | | | 1,301,920 | | | | | | | | | | | 660,395 | |
| | | | | | | |
Net Asset Value and redemption price per share (500,000,000 shares authorized) | | | $12.84 | | | | | | | | | | | $8.84 | | | | | | | | | | | $19.10 | |
| | | | | | | |
Maximum offering price per share (NAV ÷ 0.9550, based on maximum sales
charge of 4.50% of the offering price) | | | $13.45 | | | | | | | | | | | $9.26 | | | | | | | | | | | $20.00 | |
| | | | | | | |
Class I: | | | | | | | | | | | | | | | | | | | | | | | | | | |
Net assets | | | $115,528,056 | | | | | | | | | | | $25,554,724 | | | | | | | | | | | $101,482,229 | |
| | | | | | | | | | | | | | | | | | | | | | | | | | |
Capital Shares outstanding | | | 8,978,024 | | | | | | | | | | | 2,806,984 | | | | | | | | | | | 5,316,791 | |
| | | | | | | |
Net Asset Value, offering, and redemption price per share (100,000,000 shares
authorized) | | | $12.87 | | | | | | | | | | | $9.10 | | | | | | | | | | | $19.09 | |
| | | | | | | |
| | | | | | | | | | | | | | | | | | | | | | | | | | |
See accompanying notes to financial statements.
19
KEELEY Funds
Statements of Operations
For the Year Ended September 30, 2020
| | | | | | | | | | | | | | | | | | | | | | | | |
| | | Small Cap
Dividend Value
Fund | | | | | | | | | Small-Mid
Cap
Value Fund | | | | | | | Mid Cap
Dividend
Value Fund | |
Investment Income: | | | | | | | | | | | | | | | | | | | | | | | | |
Dividends (net of foreign withholding taxes of $16,287, $3,518, and $8,421,
respectively) | | $ | 9,493,216 | | | | | | | | | | | $ 893,000 | | | | | | | | $ | 3,555,529 | |
Interest | | | 53,552 | | | | | | | | | | | 8,81 | | | | | | | | | 28,707 | |
| | | | | | | | | | | | | | | | | | | | | | | | |
Total Investment Income | | | 9,546,768 | | | | | | | | | | | 901,812 | | | | | | | | | 3,584,236 | |
| | | | | | | | | | | | | | | | | | | | | | | | |
Expenses: | | | | | | | | | | | | | | | | | | | | | | | | |
Investment advisory fees | | | 3,394,229 | | | | | | | | | | | 495,534 | | | | | | | | | 1,311,246 | |
Distribution fees - Class A | | | 496,828 | | | | | | | | | | | 41,895 | | | | | | | | | 38,432 | |
Accounting fees | | | 85,645 | | | | | | | | | | | 12,388 | | | | | | | | | 36,424 | |
Custodian fees | | | 21,472 | | | | | | | | | | | 11,592 | | | | | | | | | 14,566 | |
Legal and audit fees | | | 79,771 | | | | | | | | | | | 31,182 | | | | | | | | | 44,317 | |
Chief compliance officer compensation | | | 57,412 | | | | | | | | | | | 8,158 | | | | | | | | | 24,431 | |
Registration expenses | | | 49,909 | | | | | | | | | | | 38,768 | | | | | | | | | 39,478 | |
Shareholder communications expenses | | | 84,040 | | | | | | | | | | | 28,615 | | | | | | | | | 37,966 | |
Shareholder services fees | | | 403,409 | | | | | | | | | | | 47,695 | | | | | | | | | 101,754 | |
Directors’ fees | | | 98,226 | | | | | | | | | | | 13,990 | | | | | | | | | 41,783 | |
Miscellaneous expenses | | | 62,331 | | | | | | | | | | | 19,262 | | | | | | | | | 29,637 | |
| | | | | | | | | | | | | | | | | | | | | | | | |
| | | | | | | |
Total Expenses | | | 4,833,272 | | | | | | | | | | | 749,079 | | | | | | | | | 1,720,034 | |
| | | | | | | | | | | | | | | | | | | | | | | | |
| | | | | | | |
Less: | | | | | | | | | | | | | | | | | | | | | | | | |
Fees waived or expenses reimbursed by Adviser (See Note 3) | | | (773,620 | ) | | | | | | | | | | (142,211) | | | | | | | | | (297,386 | ) |
| | | | | | | | | | | | | | | | | | | | | | | | |
Net Expenses | | | 4,059,652 | | | | | | | | | | | 606,868 | | | | | | | | | 1,422,648 | |
| | | | | | | | | | | | | | | | | | | | | | | | |
Net Investment Income | | | 5,487,116 | | | | | | | | | | | 294,944 | | | | | | | | | 2,161,588 | |
| | | | | | | | | | | | | | | | | | | | | | | | |
| | | | | | | |
Net Realized and Unrealized Gain/(Loss) on Investments: | | | | | | | | | | | | | | | | | | | | | | | | |
Net realized gain/(loss) on investments | | | 972,844 | | | | | | | | | | | 3,112,287 | | | | | | | | | (17,503,850 | ) |
| | | | | | | | | | | | | | | | | | | | | | | | |
| | | | | | | |
Net change in unrealized appreciation/depreciation:
on investments | | | (74,778,050 | ) | | | | | | | | | | (13,097,255) | | | | | | | | | (9,660,731 | ) |
| | | | | | | | | | | | | | | | | | | | | | | | |
Net Realized and Unrealized Gain/(Loss) on Investments | | | (73,805,206 | ) | | | | | | | | | | (9,984,968) | | | | | | | | | (27,164,581 | ) |
| | | | | | | | | | | | | | | | | | | | | | | | |
Net Decrease in Net Assets Resulting from Operations | | $ | (68,318,090 | ) | | | | | | | | | | $ (9,690,024) | | | | | | | | $ | (25,002,993 | ) |
| | | | | | | | | | | | | | | | | | | | | | | | |
See accompanying notes to financial statements.
20
KEELEY Funds
Statements of Changes in Net Assets
For the Year Ended September 30,
| | | | | | | | | | | | | | | | | | | | |
| | | KEELEY Small Cap Dividend Value | | | KEELEY Small-Mid Cap Value | | KEELEY Mid Cap Dividend Value | |
| | | 2020 | | | 2019 | | | 2020 | | 2019 | | 2020 | | | 2019 | |
Operations: | | | | | | | | | | | | | | | | | | | | |
Net investment income | | $ | 5,487,116 | | | $ | 4,135,089 | | | $ 294,944 | | $ 615,625 | | $ | 2,161,588 | | | $ | 2,464,887 | |
Net realized gain/(loss) on investments | | | 972,844 | | | | (5,287 | ) | | 3,112,287 | | 10,314,055 | | | (17,503,850 | ) | | | 1,337,881 | |
Net change in net unrealized
appreciation/(depreciation) on
investments | | | (74,778,050 | ) | | | (6,662,847 | ) | | (13,097,255) | | (25,520,924) | | | (9,660,731 | ) | | | (4,866,808 | ) |
| | | | | | | | | | | | | | | | | | | | |
| | | | | | |
Net decrease in net assets resulting
from operations | | | (68,318,090 | ) | | | (2,533,045 | ) | | (9,690,024) | | (14,591,244) | | | (25,002,993 | ) | | | (1,064,040 | ) |
| | | | | | | | | | | | | | | | | | | | |
| | | | | | |
Distributions to Shareholders: | | | | | | | | | | | | | | | | | | | | |
Accumulated earnings | | | | | | | | | | | | | | | | | | | | |
Class A | | | (3,609,728 | ) | | | (2,885,470 | ) | | (3,819,010) | | (3,865,339) | | | (354,000 | ) | | | (1,112,192 | ) |
Class I | | | (2,962,530 | ) | | | (7,522,546 | ) | | (7,284,679) | | (11,311,730) | | | (3,354,051 | ) | | | (5,853,691 | ) |
| | | | | | | | | | | | | | | | | | | | |
| | | (6,572,258 | ) | | | (10,408,016 | ) | | (11,103,689) | | (15,177,069) | | | (3,708,051 | ) | | | (6,965,883 | ) |
| | | | | | | | | | | | | | | | | | | | |
Return of capital | | | | | | | | | | | | | | | | | | | | |
Class A | | | — | | | | (229,189 | ) | | — | | — | | | (29,269 | ) | | | — | |
Class I | | | — | | | | (1,198,300 | ) | | — | | — | | | (251,879 | ) | | | — | |
| | | | | | | | | | | | | | | | | | | | |
| | | — | | | | (1,427,489 | ) | | — | | — | | | (281,148 | ) | | | — | |
| | | | | | | | | | | | | | | | | | | | |
Total Distributions to Shareholders | | | (6,572,258 | ) | | | (11,835,505 | ) | | (11,103,689) | | (15,177,069) | | | (3,989,199 | ) | | | (6,965,883 | ) |
| | | | | | | | | | | | | | | | | | | | |
| | | | | | |
Capital Share Transactions: | | | | | | | | | | | | | | | | | | | | |
Proceeds from shares issued | | | | | | | | | | | | | | | | | | | | |
Class A | | | 7,248,428 | | | | 7,807,736 | | | 170,048 | | 676,322 | | | 1,458,255 | | | | 3,838,412 | |
Class I | | | 13,954,538 | | | | 8,100,690 | | | 1,724,088 | | 5,525,120 | | | 16,887,630 | | | | 52,905,109 | |
| | | | | | | | | | | | | | | | | | | | |
| | | 21,202,966 | | | | 15,908,426 | | | 1,894,136 | | 6,201,442 | | | 18,345,885 | | | | 56,743,521 | |
| | | | | | | | | | | | | | | | | | | | |
Proceeds from shares issued in
connection with acquisition | | | | | | | | | | | | | | | | | | | | |
Class A | | | — | | | | 266,632,981 | | | — | | — | | | — | | | | — | |
Class I | | | — | | | | 146,414,615 | | | — | | — | | | — | | | | — | |
| | | | | | | | | | | | | | | | | | | | |
| | | — | | | | 413,047,596 | (a) | | — | | — | | | — | | | | — | |
| | | | | | | | | | | | | | | | | | | | |
Proceeds from reinvestment of distributions | | | | | | | | | | | | | | | | | | | | |
Class A | | | 3,433,976 | | | | 2,948,069 | | | 3,730,318 | | 3,789,513 | | | 351,944 | | | | 1,051,232 | |
Class I | | | 2,904,659 | | | | 8,677,246 | | | 7,246,618 | | 11,283,213 | | | 3,585,634 | | | | 5,843,745 | |
| | | | | | | | | | | | | | | | | | | | |
| | | 6,338,635 | | | | 11,625,315 | | | 10,976,936 | | 15,072,726 | | | 3,937,578 | | | | 6,894,977 | |
| | | | | | | | | | | | | | | | | | | | |
Cost of shares redeemed | | | | | | | | | | | | | | | | | | | | |
Class A | | | (63,912,988 | ) | | | (34,505,245 | ) | | (8,202,435) | | (17,881,113) | | | (4,268,813 | ) | | | (16,161,591 | ) |
Class I | | | (54,751,486 | ) | | | (42,975,867 | ) | | (12,990,087) | | (73,149,121) | | | (50,746,070 | ) | | | (19,731,626 | ) |
| | | | | | | | | | | | | | | | | | | | |
| | | (118,664,474 | ) | | | (77,481,112 | ) | | (21,192,522) | | (91,030,234) | | | (55,014,883 | ) | | | (35,893,217 | ) |
| | | | | | | | | | | | | | | | | | | | |
Net Increase/(Decrease) in Net Assets
from Capital Share Transactions | | | (91,122,873 | ) | | | 363,100,225 | | | (8,321,450) | | (69,756,066) | | | (32,731,420 | ) | | | 27,745,281 | |
| | | | | | | | | | | | | | | | | | | | |
Net Increase/(Decrease) in Net Assets | | | | | | | | | | | | | | | | | | | | |
| | | (166,013,221 | ) | | | 348,731,675 | | | (29,115,163) | | (99,524,379) | | | (61,723,612 | ) | | | 19,715,358 | |
| | | | | | |
Net Assets: | | | | | | | | | | | | | | | | | | | | |
Beginning of year | | | 439,273,405 | | | | 90,541,730 | | | 66,185,353 | | 165,709,732 | | | 175,816,715 | | | | 156,101,357 | |
| | | | | | | | | | | | | | | | | | | | |
End of year | | $ | 273,260,184 | | | $ | 439,273,405 | | | $ 37,070,190 | | $ 66,185,353 | | $ | 114,093,103 | | | $ | 175,816,715 | |
| | | | | | | | | | | | | | | | | | | | |
| (a) | On June 7, 2019, Small Cap Value Fund merged into Small Cap Dividend Value Fund. (See Note 10 of the Notes to Financial Statements.) |
See accompanying notes to financial statements.
21
KEELEY Funds
Financial Highlights
Selected data for a share of capital stock outstanding throughout each year:
| | | | | | | | | | | | | | | | | | | | |
| Small Cap Dividend Value Fund | | Year Ended September 30, | |
| | | 2020 | | | 2019 | | | 2018 | | | 2017 | | | 2016 | |
Class A | | | | | | | | | | | | | | | | | | | | |
Net Asset Value, Beginning of Year | | $ | 15.86 | | | $ | 18.91 | | | $ | 19.27 | | | $ | 16.63 | | | $ | 15.21 | |
| | | | | | | | | | | | | | | | | | | | |
| | | | | |
Income (Loss) from Investment Operations: | | | | | | | | | | | | | | | | | | | | |
Net Investment Income(a) | | | 0.21 | | | | 0.32 | | | | 0.26 | | | | 0.25 | | | | 0.28 | |
Net Realized and Unrealized Gain/(Loss) on Investments | | | (2.97 | ) | | | (1.44 | ) | | | 0.76 | | | | 2.94 | | | | 2.11 | |
| | | | | | | | | | | | | | | | | | | | |
Total from Investment Operations | | | (2.76 | ) | | | (1.12 | ) | | | 1.02 | | | | 3.19 | | | | 2.39 | |
| | | | | | | | | | | | | | | | | | | | |
| | | | | |
Distributions: | | | | | | | | | | | | | | | | | | | | |
Net Investment Income | | | (0.26 | ) | | | (0.30 | ) | | | (0.25 | ) | | | (0.24 | ) | | | (0.33 | ) |
Net Realized Gain on Investments | | | — | | | | (0.60 | ) | | | (1.13 | ) | | | (0.31 | ) | | | (0.64 | ) |
Return of Capital | | | — | | | | (1.03 | ) | | | — | | | | — | | | | — | |
| | | | | | | | | | | | | | | | | | | | |
Total Distributions | | | (0.26 | ) | | | (1.93 | ) | | | (1.38 | ) | | | (0.55 | ) | | | (0.97 | ) |
| | | | | | | | | | | | | | | | | | | | |
Net Asset Value, End of Year | | $ | 12.84 | | | $ | 15.86 | | | $ | 18.91 | | | $ | 19.27 | | | $ | 16.63 | |
| | | | | | | | | | | | | | | | | | | | |
Total Return† | | | (17.3 | )% | | | (5.7 | )% | | | 5.4 | % | | | 19.3 | % | | | 16.4 | % |
Ratios to Average Net Assets/Supplemental Data | | | | | | | | | | | | | | | | | | | | |
Net Assets, End of Year (in 000’s) | | $ | 157,732 | | | $ | 254,329 | | | $ | 13,836 | | | $ | 22,460 | | | $ | 24,620 | |
Net Investment Income | | | 1.49 | % | | | 2.04 | % | | | 1.34 | % | | | 1.39 | % | | | 1.81 | % |
Operating Expenses Net of Waivers/Credits/Reimbursements/Reductions | | | 1.29 | % | | | 1.29 | % | | | 1.29 | % | | | 1.29 | % | | | 1.30 | % |
Operating Expenses Before Waivers/Credits/Reimbursements/Reductions(b) | | | 1.52 | % | | | 1.45 | % | | | 1.50 | % | | | 1.49 | % | | | 1.49 | % |
Portfolio Turnover Rate | | | 21 | % | | | 71 | % | | | 24 | % | | | 22 | % | | | 27 | % |
| | | | | |
Class I | | | | | | | | | | | | | | | | | | | | |
Net Asset Value, Beginning of Year | | $ | 15.89 | | | $ | 18.94 | | | $ | 19.30 | | | $ | 16.65 | | | $ | 15.23 | |
| | | | | | | | | | | | | | | | | | | | |
| | | | | |
Income (Loss) from Investment Operations: | | | | | | | | | | | | | | | | | | | | |
Net Investment Income(a) | | | 0.25 | | | | 0.35 | | | | 0.31 | | | | 0.30 | | | | 0.32 | |
Net Realized and Unrealized Gain/(Loss) on Investments | | | (2.97 | ) | | | (1.43 | ) | | | 0.76 | | | | 2.95 | | | | 2.11 | |
| | | | | | | | | | | | | | | | | | | | |
Total from Investment Operations | | | (2.72 | ) | | | (1.08 | ) | | | 1.07 | | | | 3.25 | | | | 2.43 | |
| | | | | | | | | | | | | | | | | | | | |
| | | | | |
Distributions: | | | | | | | | | | | | | | | | | | | | |
Net Investment Income | | | (0.30 | ) | | | (0.34 | ) | | | (0.30 | ) | | | (0.29 | ) | | | (0.37 | ) |
Net Realized Gain on Investments | | | — | | | | (0.60 | ) | | | (1.13 | ) | | | (0.31 | ) | | | (0.64 | ) |
Return of Capital | | | — | | | | (1.03 | ) | | | — | | | | — | | | | — | |
| | | | | | | | | | | | | | | | | | | | |
Total Distributions | | | (0.30 | ) | | | (1.97 | ) | | | (1.43 | ) | | | (0.60 | ) | | | (1.01 | ) |
| | | | | | | | | | | | | | | | | | | | |
Net Asset Value, End of Year | | $ | 12.87 | | | $ | 15.89 | | | $ | 18.94 | | | $ | 19.30 | | | $ | 16.65 | |
| | | | | | | | | | | | | | | | | | | | |
Total Return† | | | (17.1 | )% | | | (5.4 | )% | | | 5.7 | % | | | 19.6 | % | | | 16.7 | % |
Ratios to Average Net Assets/Supplemental Data | | | | | | | | | | | | | | | | | | | | |
Net Assets, End of Year (in 000’s) | | $ | 115,528 | | | $ | 184,944 | | | $ | 76,705 | | | $ | 75,701 | | | $ | 75,811 | |
Net Investment Income | | | 1.75 | % | | | 2.17 | % | | | 1.59 | % | | | 1.64 | % | | | 2.06 | % |
Operating Expenses Net of Waivers/Credits/Reimbursements/Reductions | | | 1.04 | % | | | 1.04 | % | | | 1.04 | % | | | 1.04 | % | | | 1.05 | % |
Operating Expenses Before Waivers/Credits/Reimbursements/Reductions(b) | | | 1.27 | % | | | 1.23 | % | | | 1.25 | % | | | 1.24 | % | | | 1.24 | % |
Portfolio Turnover Rate | | | 21 | % | | | 71 | % | | | 24 | % | | | 22 | % | | | 27 | % |
| † | Total return represents aggregate total return of a hypothetical $1,000 investment at the beginning of the year and sold at the end of the year including reinvestment of distributions and does not reflect the applicable sales charges. |
| (a) | Per share amounts have been calculated using the average shares outstanding method. |
| (b) | The ratio of expenses to average net assets includes interest expense and deferred compensation expense which was 0.00%, 0.00%, 0.00%, 0.00%, and 0.01% for the fiscal years ended September 30, 2020, 2019, 2018, 2017, and 2016, respectively. (See Note 3 of the Notes to the Financial Statements). |
See accompanying notes to financial statements.
22
KEELEY Funds
Financial Highlights (Continued)
Selected data for a share of capital stock outstanding throughout each year:
| | | | | | | | | | | | | | | | | | | | |
| Small-Mid Cap Value Fund | | Year Ended September 30, | |
| | | 2020 | | | 2019 | | | 2018 | | | 2017 | | | 2016 | |
Class A | | | | | | | | | | | | | | | | | | | | |
Net Asset Value, Beginning of Year | | $ | 12.38 | | | $ | 14.55 | | | $ | 14.92 | | | $ | 13.48 | | | $ | 12.57 | |
| | | | | | | | | | | | | | | | | | | | |
| | | | | |
Income (Loss) from Investment Operations: | | | | | | | | | | | | | | | | | | | | |
Net Investment Income(a) | | | 0.04 | | | | 0.06 | | | | 0.04 | | | | 0.07 | | | | 0.02 | |
Net Realized and Unrealized Gain/(Loss) on Investments | | | (1.40 | ) | | | (0.76 | ) | | | 1.18 | | | | 2.52 | | | | 1.35 | |
| | | | | | | | | | | | | | | | | | | | |
Total from Investment Operations | | | (1.36 | ) | | | (0.70 | ) | | | 1.22 | | | | 2.59 | | | | 1.37 | |
| | | | | | | | | | | | | | | | | | | | |
| | | | | |
Distributions: | | | | | | | | | | | | | | | | | | | | |
Net Investment Income | | | (0.07 | ) | | | (0.03 | ) | | | (0.08 | ) | | | (0.02 | ) | | | (0.02 | ) |
Net Realized Gain on Investments | | | (2.11 | ) | | | (1.44 | ) | | | (1.51 | ) | | | (1.13 | ) | | | (0.44 | ) |
| | | | | | | | | | | | | | | | | | | | |
Total Distributions | | | (2.18 | ) | | | (1.47 | ) | | | (1.59 | ) | | | (1.15 | ) | | | (0.46 | ) |
| | | | | | | | | | | | | | | | | | | | |
Net Asset Value, End of Year | | $ | 8.84 | | | $ | 12.38 | | | $ | 14.55 | | | $ | 14.92 | | | $ | 13.48 | |
| | | | | | | | | | | | | | | | | | | | |
Total Return† | | | (14.9 | )% | | | (4.1 | )% | | | 8.7 | % | | | 20.2 | % | | | 11.3 | % |
Ratios to Average Net Assets/Supplemental Data | | | | | | | | | | | | | | | | | | | | |
Net Assets, End of Year (in 000’s) | | $ | 11,515 | | | $ | 23,125 | | | $ | 43,302 | | | $ | 43,501 | | | $ | 45,570 | |
Net Investment Income | | | 0.43 | % | | | 0.48 | % | | | 0.25 | % | | | 0.47 | % | | | 0.19 | % |
Operating Expenses Net of Waivers/Credits/Reimbursements/Reductions | | | 1.39 | % | | | 1.40 | % | | | 1.39 | % | | | 1.39 | % | | | 1.40 | % |
Operating Expenses Before Waivers/Credits/Reimbursements/Reductions(b) | | | 1.68 | % | | | 1.53 | % | | | 1.47 | % | | | 1.47 | % | | | 1.47 | % |
Portfolio Turnover Rate | | | 21 | % | | | 26 | % | | | 27 | % | | | 20 | % | | | 37 | % |
| | | | | |
Class I | | | | | | | | | | | | | | | | | | | | |
Net Asset Value, Beginning of Year | | $ | 12.69 | | | $ | 14.88 | | | $ | 15.20 | | | $ | 13.72 | | | $ | 12.80 | |
| | | | | | | | | | | | | | | | | | | | |
| | | | | |
Income (Loss) from Investment Operations: | | | | | | | | | | | | | | | | | | | | |
Net Investment Income(a) | | | 0.07 | | | | 0.09 | | | | 0.07 | | | | 0.10 | | | | 0.06 | |
Net Realized and Unrealized Gain/(Loss) on Investments | | | (1.44 | ) | | | (0.77 | ) | | | 1.22 | | | | 2.56 | | | | 1.37 | |
| | | | | | | | | | | | | | | | | | | | |
Total from Investment Operations | | | (1.37 | ) | | | (0.68 | ) | | | 1.29 | | | | 2.66 | | | | 1.43 | |
| | | | | | | | | | | | | | | | | | | | |
| | | | | |
Distributions: | | | | | | | | | | | | | | | | | | | | |
Net Investment Income | | | (0.11 | ) | | | (0.07 | ) | | | (0.10 | ) | | | (0.05 | ) | | | (0.07 | ) |
Net Realized Gain on Investments | | | (2.11 | ) | | | (1.44 | ) | | | (1.51 | ) | | | (1.13 | ) | | | (0.44 | ) |
| | | | | | | | | | | | | | | | | | | | |
Total Distributions | | | (2.22 | ) | | | (1.51 | ) | | | (1.61 | ) | | | (1.18 | ) | | | (0.51 | ) |
| | | | | | | | | | | | | | | | | | | | |
Net Asset Value, End of Year | | $ | 9.10 | | | $ | 12.69 | | | $ | 14.88 | | | $ | 15.20 | | | $ | 13.72 | |
| | | | | | | | | | | | | | | | | | | | |
Total Return† | | | (14.7 | )% | | | (3.9 | )% | | | 9.0 | % | | | 20.4 | % | | | 11.6 | % |
Ratios to Average Net Assets/Supplemental Data | | | | | | | | | | | | | | | | | | | | |
Net Assets, End of Year (in 000’s) | | $ | 25,555 | | | $ | 43,060 | | | $ | 122,408 | | | $ | 91,586 | | | $ | 104,638 | |
Net Investment Income | | | 0.68 | % | | | 0.71 | % | | | 0.50 | % | | | 0.72 | % | | | 0.44 | % |
Operating Expenses Net of Waivers/Credits/Reimbursements/Reductions | | | 1.14 | % | | | 1.15 | % | | | 1.14 | % | | | 1.14 | % | | | 1.15 | % |
Operating Expenses Before Waivers/Credits/Reimbursements/Reductions(b) | | | 1.43 | % | | | 1.28 | % | | | 1.22 | % | | | 1.22 | % | | | 1.22 | % |
Portfolio Turnover Rate | | | 21 | % | | | 26 | % | | | 27 | % | | | 20 | % | | | 37 | % |
| † | Total return represents aggregate total return of a hypothetical $1,000 investment at the beginning of the year and sold at the end of the year including reinvestment of distributions and does not reflect the applicable sales charges. |
| (a) | Per share amounts have been calculated using the average shares outstanding method. |
| (b) | The ratio of expenses to average net assets includes interest expense and deferred compensation expense which was 0.00%, 0.00%, 0.00%, 0.00%, and 0.01% for the fiscal years ended September 30, 2020, 2019, 2018, 2017, and 2016, respectively. (See Note 3 of the Notes to the Financial Statements). |
See accompanying notes to financial statements.
23
KEELEY Funds
Financial Highlights (Continued)
Selected data for a share of capital stock outstanding throughout each year:
| | | | | | | | | | | | | | | | | | | | |
| Mid Cap Dividend Value Fund | | Year Ended September 30, | |
| | | 2020 | | | 2019 | | | 2018 | | | 2017 | | | 2016 | |
Class A | | | | | | | | | | | | | | | | | | | | |
Net Asset Value, Beginning of Year | | $ | 22.60 | | | $ | 23.94 | | | $ | 21.85 | | | $ | 18.88 | | | $ | 17.03 | |
| | | | | | | | | | | | | | | | | | | | |
| | | | | |
Income (Loss) from investment operations: | | | | | | | | | | | | | | | | | | | | |
Net Investment Income(a) | | | 0.26 | | | | 0.29 | | | | 0.19 | | | | 0.15 | | | | 0.19 | |
Net Realized and Unrealized Gain/(Loss) on Investments | | | (3.26 | ) | | | (0.67 | ) | | | 2.09 | | | | 2.97 | | | | 2.57 | |
| | | | | | | | | | | | | | | | | | | | |
Total from Investment Operations | | | (3.00 | ) | | | (0.38 | ) | | | 2.28 | | | | 3.12 | | | | 2.76 | |
| | | | | | | | | | | | | | | | | | | | |
| | | | | |
Distributions: | | | | | | | | | | | | | | | | | | | | |
Net Investment Income | | | (0.31 | ) | | | (0.32 | ) | | | (0.19 | ) | | | (0.15 | ) | | | (0.16 | ) |
Net Realized Gain on Investments | | | (0.18 | ) | | | (0.64 | ) | | | — | | | | — | | | | (0.71 | ) |
Return of Capital | | | (0.01 | ) | | | — | | | | — | | | | — | | | | (0.04 | ) |
| | | | | | | | | | | | | | | | | | | | |
Total Distributions | | | (0.50 | ) | | | (0.96 | ) | | | (0.19 | ) | | | (0.15 | ) | | | (0.91 | ) |
| | | | | | | | | | | | | | | | | | | | |
Net Asset Value, End of Year | | $ | 19.10 | | | $ | 22.60 | | | $ | 23.94 | | | $ | 21.85 | | | $ | 18.88 | |
| | | | | | | | | | | | | | | | | | | | |
Total Return† | | | (13.4 | )% | | | (1.5 | )% | | | 10.5 | % | | | 16.6 | % | | | 16.9 | % |
Ratios to Average Net Assets/Supplemental Data | | | | | | | | | | | | | | | | | | | | |
Net Assets, End of Year (in 000’s) | | $ | 12,611 | | | $ | 18,260 | | | $ | 31,987 | | | $ | 19,273 | | | $ | 20,661 | |
Net Investment Income | | | 1.25 | % | | | 1.31 | % | | | 0.84 | % | | | 0.76 | % | | | 1.10 | % |
Operating Expenses Net of Waivers/Credits/Reimbursements/ Reductions | | | 1.20 | % | | | 1.21 | %(b) | | | 1.29 | % | | | 1.29 | % | | | 1.29 | % |
Operating Expenses Before Waivers/Credits/Reimbursements/ Reductions(c) | | | 1.40 | % | | | 1.38 | % | | | 1.47 | % | | | 1.49 | % | | | 1.52 | % |
Portfolio Turnover Rate | | | 22 | % | | | 22 | % | | | 19 | % | | | 43 | % | | | 49 | % |
| | | | | |
Class I | | | | | | | | | | | | | | | | | | | | |
Net Asset Value, Beginning of Year | | $ | 22.59 | | | $ | 23.94 | | | $ | 21.84 | | | $ | 18.87 | | | $ | 17.03 | |
| | | | | | | | | | | | | | | | | | | | |
| | | | | |
Income (Loss) from Investment Operations: | | | | | | | | | | | | | | | | | | | | |
Net Investment Income(a) | | | 0.31 | | | | 0.35 | | | | 0.25 | | | | 0.21 | | | | 0.24 | |
Net Realized and Unrealized Gain/(Loss) on Investments | | | (3.26 | ) | | | (0.69 | ) | | | 2.09 | | | | 2.96 | | | | 2.56 | |
| | | | | | | | | | | | | | | | | | | | |
Total from Investment Operations | | | (2.95 | ) | | | (0.34 | ) | | | 2.34 | | | | 3.17 | | | | 2.80 | |
| | | | | | | | | | | | | | | | | | | | |
| | | | | |
Distributions: | | | | | | | | | | | | | | | | | | | | |
Net Investment Income | | | (0.36 | ) | | | (0.37 | ) | | | (0.24 | ) | | | (0.20 | ) | | | (0.21 | ) |
Net Realized Gain on Investments | | | (0.18 | ) | | | (0.64 | ) | | | — | | | | — | | | | (0.71 | ) |
Return of Capital | | | (0.01 | ) | | | — | | | | — | | | | — | | | | (0.04 | ) |
| | | | | | | | | | | | | | | | | | | | |
Total Distributions | | | (0.55 | ) | | | (1.01 | ) | | | (0.24 | ) | | | (0.20 | ) | | | (0.96 | ) |
| | | | | | | | | | | | | | | | | | | | |
Net Asset Value, End of Year | | $ | 19.09 | | | $ | 22.59 | | | $ | 23.94 | | | $ | 21.84 | | | $ | 18.87 | |
| | | | | | | | | | | | | | | | | | | | |
Total Return† | | | (13.1 | )% | | | (1.2 | )% | | | 10.8 | % | | | 16.9 | % | | | 17.2 | % |
Ratios to Average Net Assets/Supplemental Data | | | | | | | | | | | | | | | | | | | | |
Net Assets, End of Year (in 000’s) | | $ | 101,482 | | | $ | 157,557 | | | $ | 124,114 | | | $ | 98,361 | | | $ | 69,290 | |
Net Investment Income | | | 1.51 | % | | | 1.57 | % | | | 1.09 | % | | | 1.01 | % | | | 1.35 | % |
Operating Expenses Net of Waivers/Credits/Reimbursements/ Reductions | | | 0.95 | % | | | 0.96 | %(b) | | | 1.04 | % | | | 1.04 | % | | | 1.04 | % |
Operating Expenses Before Waivers/Credits/Reimbursements/ Reductions(c) | | | 1.15 | % | | | 1.13 | % | | | 1.22 | % | | | 1.24 | % | | | 1.27 | % |
Portfolio Turnover Rate | | | 22 | % | | | 22 | % | | | 19 | % | | | 43 | % | | | 49 | % |
| † | Total return represents aggregate total return of a hypothetical $1,000 investment at the beginning of the year and sold at the end of the year including reinvestment of distributions and does not reflect the applicable sales charges. |
| (a) | Per share amounts have been calculated using the average shares outstanding method. |
| (b) | The Fund incurred tax expense during the year ended September 30, 2019. If the tax expense had not been incurred, the ratios of operating expenses to average net assets would have been 1.20% (Class A) and 0.95% (Class I), respectively. |
| (c) | The ratio of expenses to average net assets includes interest expense and deferred compensation expense which was 0.00%, 0.00%, 0.00%, 0.00%, and 0.00% for the fiscal years ended September 30, 2020, 2019, 2018, 2017, and 2016, respectively. (See Note 3 of the Notes to the Financial Statements). |
See accompanying notes to financial statements.
24
KEELEY Funds, Inc.
Notes to Financial Statements
1. Organization. KEELEY Funds, Inc. (the Corporation) was organized on April 7, 2005 as a Maryland corporation and is registered under the Investment Company Act of 1940, as amended (the 1940 Act), as a diversified, open-ended investment company. As of September 30, 2019, the Corporation consists of three series, KEELEY Small Cap Dividend Value Fund (Small Cap Dividend Value Fund), KEELEY Small-Mid Cap Value Fund (Small-Mid Cap Value Fund ), and KEELEY Mid Cap Dividend Value Fund (Mid Cap Dividend Value Fund) (each, a Fund, and collectively, the Funds), each with two classes of shares: Class A and Class I. As noted in the Funds’ prospectus, Class I is an institutional class and does not charge a sales load or a 12b-1 fee to its shareholders. KEELEY Small Cap Value Fund (Small Cap Value Fund) was reorganized into Small Cap Dividend Fund on June 7, 2019 (See Note 10).
The investment objectives of each Fund are as follows:
| ● | | Small Cap Dividend Value Fund seeks to provide long term capital appreciation and current income through investments in equity securities with a small market capitalization and that currently pay, or are reasonably expected to pay, dividends to shareholders. |
| ● | | Small-Mid Cap Value Fund seeks to provide long term capital appreciation through investments in equity securities of companies with a small or mid-sized market capitalization. |
| ● | | Mid Cap Dividend Value Fund seeks to provide long term capital appreciation and current income through investments in equity securities of companies with a mid-sized market capitalization and that currently pay, or are reasonably expected to pay, dividends to shareholders. |
2. Significant Accounting Policies. As an investment company, the Corporation follows the investment company accounting and reporting guidance, which is part of U.S. generally accepted accounting principles (GAAP) that may require the use of management estimates and assumptions in the preparation of its financial statements. Actual results could differ from those estimates. The following is a summary of significant accounting policies followed by the Corporation in the preparation of its financial statements.
The global outbreak of the novel coronavirus disease, known as COVID-19, has caused adverse effects on many companies, sectors, nations, regions and the markets in general, and may continue for an unpredictable duration. The effects of this pandemic may materially impact the value and performance of the Fund, its ability to buy and sell fund investments at appropriate valuations, and its ability to achieve its investment objectives.
New Accounting Pronouncements.To improve the effectiveness of fair value disclosure requirements, the Financial Accounting Standards Board recently issued Accounting Standard Update (ASU) 2018-13, Fair Value Measurement Disclosure Framework
– Changes to the Disclosure Requirements for Fair Value Measurement (ASU 2018-13), which adds, removes, and modifies certain aspects relating to fair value disclosure. ASU 2018-13 is effective for interim and annual reporting periods beginning after December 15, 2019; early adoption of the additions relating to ASU 2018-13 is not required, even if early adoption is elected for the removals under ASU 2018-13. Management has early adopted the removals set forth in ASU 2018-13 in these financial statements and has not early adopted the additions set forth in ASU 2018-13.
In March 2020, the Financial Accounting Standards Board (FASB) issued Accounting Standards Update (ASU) No. 2020-04, Reference Rate Reform (Topic 848) – Facilitation of the Effects of Reference Rate Reform on Financial Reporting. The amendments in the ASU provides optional temporary financial reporting relief from the effect of certain types of contract modifications due to the planned discontinuation of the London Interbank Offered Rate (LIBOR) and other interbank-offered based reference rates as of the end of 2021. The ASU is effective for certain reference rate-related contract modifications that occur during the period March 12, 2020 through December 31, 2022. Management has reviewed the requirements and believes the adoption of this ASU will not have a material impact on the financial statements.
Security Valuation. Portfolio securities listed or traded on a nationally recognized securities exchange or traded in the U.S. over-the-counter market for which market quotations are readily available are valued at the last quoted sale price or a market’s official closing price as of the close of business on the day the securities are being valued. If there were no sales that day, the security is valued at the average of the closing bid and asked prices or, if there were no asked prices quoted on that day, then the security is valued at the closing bid price on that day. If no bid or asked prices are quoted on such day, the security is valued at the most recently available price or, if the Board of Directors (the Board) so determines, by such other method as the Board shall determine in good faith to reflect its fair market value. Portfolio securities traded on more than one national securities exchange or market are valued according to the broadest and most representative market, as determined by Keeley-Teton Advisors, LLC (the Adviser). Investments in open-end investment companies are valued at each underlying Fund’s NAV per share as of the report date.
25
KEELEY Funds, Inc.
Notes to Financial Statements (Continued)
Portfolio securities primarily traded on a foreign market are generally valued at the preceding closing values of such securities on the relevant market, but may be fair valued pursuant to procedures established by the Board if market conditions change significantly after the close of the foreign market, but prior to the close of business on the day the securities are being valued. Debt obligations for which market quotations are readily available are valued at the average of the latest bid and asked prices. If there were no asked prices quoted on such day, the security is valued using the closing bid price, unless the Board determines such amount does not reflect the security’s fair value, in which case the security will be fair value as determined by the Board. Certain securities are valued principally using dealer quotations. Futures contracts are valued at the closing settlement price of the exchange or board of trade on which the applicable contract is traded. OTC futures and options on futures for which market quotations are readily available will be valued by quotations received from a pricing service or, if no quotations are available from a pricing service, by quotations obtained from one or more dealers in the instrument in question by the Adviser.
Securities for which quotations are not readily available are valued by the Funds’ investment adviser, Keeley-Teton Advisors, LLC, at their respective fair values as determined in good faith pursuant to procedures adopted by the Corporation’s Board. For each investment that is fair valued, the Adviser takes into consideration, to the extent applicable, various factors, including, but not limited to, the financial condition of the company, comparable companies in the public market, the nature and duration of the cause for a quotation not being readily available and other relevant factors. Securities fair valued by the Adviser are indicated in the Schedules of Investments and are categorized as Level 2 or Level 3 in the fair value hierarchy depending on the observability of the inputs. Media General, Inc. was fair valued using methods approved by the Corporation’s Board as of September 30, 2020. No other securities were fair valued by the Funds as of September 30, 2020.
The inputs and valuation techniques used to measure fair value of the Fund’s investments are summarized into three levels as described in the hierarchy below:
| | ● | | Level 1 — quoted prices in active markets for identical securities; |
| | ● | | Level 2 — other significant observable inputs (including quoted prices for similar securities, interest rates, prepayment speeds, credit risk, etc.); and |
| | ● | | Level 3 — significant unobservable inputs (including the Board’s determinations as to the fair value of investments). |
A financial instrument’s level within the fair value hierarchy is based on the lowest level of any input both individually and in the aggregate that is significant to the fair value measurement. The inputs or methodology used for valuing securities are not necessarily an indication of the risk associated with investing in those securities. The summary of the Funds’ investments in securities by inputs used to value the Funds’ investments as of September 30, 2020 is as follows:
| | | | | | | | | | | | | | | | |
| | | Valuation Inputs | | | | |
| | | Level 1
Quoted Prices | | | Level 2 Other Significant
Observable Inputs | | | Level 3 Significant
Unobservable Inputs | | | Total Market Value
at 9/30/20 | |
SMALL CAP DIVIDEND VALUE FUND | | | | | | | | | | | | | | | | |
INVESTMENTS IN SECURITIES: | | | | | | | | | | | | | | | | |
ASSETS (Market Value): | | | | | | | | | | | | | | | | |
Common Stocks (a) | | | $266,775,936 | | | | — | | | | — | | | | $266,775,936 | |
Rights (a) | | | — | | | | — | | | | $ 1 | | | | 1 | |
Short Term Investments | | | 6,591,757 | | | | — | | | | — | | | | 6,591,757 | |
TOTAL INVESTMENTS IN SECURITIES – ASSETS | | | $273,367,693 | | | | — | | | | $ 1 | | | | $273,367,694 | |
| | | | |
SMALL-MID CAP VALUE FUND | | | | | | | | | | | | | | | | |
INVESTMENTS IN SECURITIES: | | | | | | | | | | | | | | | | |
ASSETS (Market Value): | | | | | | | | | | | | | | | | |
Common Stocks: | | | | | | | | | | | | | | | | |
Financial Services | | | $ 6,019,468 | | | | $ 183,183 | | | | — | | | | $ 6,202,651 | |
Other Industries (a) | | | 29,818,979 | | | | — | | | | — | | | | 29,818,979 | |
Total Common Stocks | | | 35,838,447 | | | | 183,183 | | | | — | | | | 36,021,630 | |
Short Term Investments | | | 901,214 | | | | — | | | | — | | | | 901,214 | |
TOTAL INVESTMENTS IN SECURITIES – ASSETS | | | $ 36,739,661 | | | | $ 183,183 | | | | — | | | | $ 36,922,844 | |
| | | | |
MID CAP DIVIDEND VALUE FUND | | | | | | | | | | | | | | | | |
INVESTMENTS IN SECURITIES: | | | | | | | | | | | | | | | | |
ASSETS (Market Value): | | | | | | | | | | | | | | | | |
Common Stocks (a) | | | $114,320,146 | | | | — | | | | — | | | | $114,320,146 | |
TOTAL INVESTMENTS IN SECURITIES – ASSETS | | | $114,320,146 | | | | — | | | | — | | | | $114,320,146 | |
| (a) | Please refer to the Schedule of Investments for the industry classifications of these portfolio holdings. |
26
KEELEY Funds, Inc.
Notes to Financial Statements (Continued)
There were no Level 3 investments held at September 30, 2020 or September 30, 2019 by Small-Mid Cap Value Fund or Mid Cap Dividend Value Fund.
Additional Information to Evaluate Qualitative Information.
General. The Funds use recognized industry pricing services – approved by the Board and unaffiliated with the Adviser – to value most of their securities, and use broker quotes provided by market makers of securities not valued by these and other recognized pricing sources. Several different pricing feeds are received to value domestic equity securities, international equity securities, preferred equity securities, and fixed income securities. The data within these feeds are ultimately sourced from major stock exchanges and trading systems where these securities trade. The prices supplied by external sources are checked by obtaining quotations or actual transaction prices from market participants. If a price obtained from the pricing source is deemed unreliable, prices will be sought from another pricing service or from a broker/dealer that trades that security or similar securities.
Fair Valuation. Fair valued securities may be common or preferred equities, warrants, options, rights, or fixed income obligations. Where appropriate, Level 3 securities are those for which market quotations are not available, such as securities not traded for several days or for which current bids are not available, or which are restricted as to transfer. When fair valuing a security, factors to consider include recent prices of comparable securities that are publicly traded, reliable prices of securities not publicly traded, the use of valuation models, current analyst reports, valuing the income or cash flow of the issuer, or cost if the preceding factors do not apply. A significant change in the unobservable inputs could result in a lower or higher value in Level 3 securities. The circumstances of Level 3 securities are frequently monitored to determine if fair valuation measures continue to apply.
The Adviser reports quarterly to the Board the results of the application of fair valuation policies and procedures. These may include back testing the prices realized in subsequent trades of these fair valued securities to fair values previously recognized.
Investments in other Investment Companies. All Funds may invest, from time to time, in shares of other investment companies (or entities that would be considered investment companies but are excluded from the definition pursuant to certain exceptions under the 1940 Act) (the Acquired Funds) in accordance with the 1940 Act and related rules. Shareholders in these funds would bear the pro rata portion of the periodic expenses of the Acquired Funds in addition to the Funds’ expenses. During the fiscal year ended September 30, 2020, Small Cap Dividend Value Fund’s pro rata portion of the periodic expenses charged by the Acquired Funds was less than thirteen basis points, the Small-Mid Cap Value Fund’s was less than two basis points and Mid Cap Dividend Value Fund’s was less than 1 basis point.
Foreign Taxes. The Funds may be subject to foreign taxes on income, gains on investments, or currency repatriation, a portion of which may be recoverable. The Funds will accrue such taxes and recoveries as applicable, based upon their current interpretation of tax rules and regulations that exist in the markets in which they invest.
Securities Transactions and Investment Income. Securities transactions are accounted for on the trade date with realized gain or loss on investments determined by using the identified cost method. Interest income (including amortization of premium and accretion of discount) is recorded on the accrual basis. Premiums and discounts on debt securities are amortized using the effective yield to maturity method or amortized to earliest call date, if applicable. Dividend income is recorded on the ex-dividend date except for certain dividends from foreign securities that are recorded as soon after the ex-dividend date as a Fund becomes aware of such dividends. Upon notification from issuers, distributions received from a real estate investment trust (REIT) may be redesignated as a reduction of cost of investments and/or realized gain. Upon notification from issuers, distributions received from a real estate investment trust (REIT) may be redesignated as a reduction of cost of investments and/or realized gain.
Determination of Net Asset Value and Calculation of Expenses. Certain administrative expenses are common to, and allocated among, various affiliated funds. Such allocations are made on the basis of each fund’s average net assets or other criteria directly affecting the expenses as determined by the Adviser pursuant to procedures established by the Board.
In calculating the NAV per share of each class, investment income, realized and unrealized gains and losses, redemption fees, and expenses other than class specific expenses are allocated daily to each class of shares based upon the proportion of net assets of each class at the beginning of each day. Distribution expenses are borne solely by the class incurring the expense.
Distributions to Shareholders. Distributions to shareholders are recorded on the ex-dividend date. Distributions to shareholders are based on income and capital gains as determined in accordance with federal income tax regulations, which may differ from income and capital gains as determined under GAAP. These differences are primarily due to differing treatments of income and gains on various investment securities held by the Funds, timing differences, and differing characterizations of
27
KEELEY Funds, Inc.
Notes to Financial Statements (Continued)
distributions made by the Funds. These book/tax differences are either temporary or permanent in nature. To the extent these differences are permanent, adjustments are made to the appropriate capital accounts in the period when the differences arise. Permanent differences were primarily due to redesignation of dividends paid, and reversal of prior year Real Estate Investment Trust adjustments. These reclassifications have no impact on the NAVs of the Funds.
For the fiscal year ended September 30, 2020, the following reclassifications were made to increase/decrease such amounts with offsetting adjustments to paid-in capital:
| | | | | | |
| | | Accumulated
Earnings/
(Losses) | | Paid-in
Capital | |
Small Cap Dividend Value Fund | | $1,085,142 | | $ | (1,085,142 | ) |
The tax character of distributions paid during the fiscal years ended September 30, 2020 and 2019 was as follows:
| | | | | | | | | | | | | | | | | | | | | | | | |
| | | Year Ended
September 30, | | | Year Ended
September 30, | | | Year Ended
September 30, | |
| | | 2020 | | | 2019 | | | 2020 | | | 2019 | | | 2020 | | | 2019 | |
| | | |
| | | Small Cap
Dividend Value Fund | | | Small-Mid
Cap Value Fund | | | Mid Cap
Dividend Value Fund | |
Ordinary Income (inclusive of short term capital gains) | | $ | 6,572,258 | | | $ | 4,622,674 | | | $ | 549,855 | | | $ | 616,566 | | | $ | 2,483,255 | | | $ | 3,000,967 | |
Net long term capital gains | | | — | | | | 5,785,342 | | | | 10,553,834 | | | | 14,560,503 | | | | 1,224,796 | | | | 3,964,916 | |
Return of capital | | | — | | | | 1,427,489 | | | | — | | | | — | | | | 281,148 | | | | — | |
| | | | | | | | | | | | | | | | | | | | | | | | |
Total distributions paid | | $ | 6,572,258 | | | $ | 11,835,505 | | | $ | 11,103,689 | | | $ | 15,177,069 | | | $ | 3,989,199 | | | $ | 6,965,883 | |
| | | | | | | | | | | | | | | | | | | | | | | | |
Provision for Income Taxes. The Funds intend to continue to qualify as regulated investment companies under Subchapter M of the Internal Revenue Code of 1986, as amended (the Code). It is the policy of the Funds to comply with the requirements of the Code applicable to regulated investment companies and to distribute substantially all of the Funds’ net investment company taxable income and net capital gains.
At September 30, 2020, the components of accumulated earnings/losses on a tax basis were as follows:
| | | | | | | | | | | | | | | |
| | | Small Cap
Dividend Value Fund | | Small-Mid
Cap Value Fund | | Mid Cap
Dividend Value Fund |
Undistributed ordinary income | | | | — | | | | $ | 170,476 | | | | | — | |
Undistributed long term capital gain | | | | — | | | | | 1,463,205 | | | | | — | |
Accumulated capital loss carryforward | | | $ | (69,455 | ) | | | | — | | | | | — | |
Unrealized appreciation/(depreciation) | | | | (3,620,776 | ) | | | | 8,246,640 | | | | $ | 7,356,960 | |
Qualified late year loss deferral | | | | (2,100,642 | ) | | | | — | | | | | (17,601,862 | ) |
| | | | | | | | | | | | | | | |
Total accumulated earnings | | | $ | (5,790,873 | ) | | | $ | 9,880,321 | | | | $ | (10,244,902 | ) |
| | | | | | | | | | | | | | | |
At September 30, 2020, the Fund had net capital loss carryforwards for federal income tax purposes which are available to reduce future required distributions of net capital gains to shareholders. The Fund is permitted to carry capital losses forward for an unlimited period. Capital losses that are carried forward will retain their character as either short term or long term losses.
| | | | | |
| | | Small Cap
Dividend Value Fund |
Short term with no expiration | | | | $69,455 | |
| | | | | |
Total capital loss carryforwards | | | | $69,455 | |
| | | | | |
At September 30, 2020, the temporary differences between book basis and tax basis unrealized appreciation/depreciation on investments was primarily due to deferral of losses from wash sales for tax purposes.
28
KEELEY Funds, Inc.
Notes to Financial Statements (Continued)
The following summarizes the tax cost of investments and the related net unrealized appreciation/depreciation at September 30, 2020:
| | | | | | |
| | | Small Cap
Dividend Value Fund | | Small-Mid
Cap Value Fund | | Mid Cap
Dividend Value Fund |
Aggregate cost of investments | | $276,988,470 | | $28,676,204 | | $106,963,187 |
| | | |
Gross unrealized appreciation | | $ 42,179,276 | | $11,920,956 | | $ 20,334,419 |
Gross unrealized depreciation | | (45,800,052) | | (3,674,316) | | (12,977,460) |
| | | |
Net unrealized appreciation/depreciation | | $ (3,620,776) | | $ 8,246,640 | | $ 7,356,959 |
The Funds are required to evaluate tax positions taken or expected to be taken in the course of preparing the Funds’ tax returns to determine whether the tax positions are “more-likely-than-not” of being sustained by the applicable tax authority. Income tax and related interest and penalties would be recognized by the Funds as tax expense in the Statement of Operations if the tax positions were deemed not to meet the more-likely-than-not threshold. As of September 30, 2020, the Adviser has reviewed all open tax years and concluded that there was no impact to the Funds’ net assets or results of operations. The Funds’ federal and state tax returns for the prior three fiscal years remain open, subject to examination by the Internal Revenue Service and state taxing authorities. On an ongoing basis, the Adviser will monitor the Funds’ tax positions to determine if adjustments to this conclusion are necessary.
3. Investment Advisory Agreements and Other Transactions. The Corporation, on behalf of each Fund, has entered into an investment advisory agreement (the Agreement) with the Adviser, with whom certain officers and directors of the Corporation are affiliated, to furnish investment advisory services to that Fund. Under the terms of the Agreement, Small Cap Dividend Value Fund and Small-Mid Cap Value Fund each pay the Adviser a monthly fee at the annual rate of 1.00% of the Fund’s first $350 million of average daily net assets, 0.90% for net assets greater than $350 million but less than $700 million, and 0.80% in excess of $700 million of the Fund’s average daily net assets. Mid Cap Dividend Value Fund pays the Adviser a monthly fee at the annual rate of 0.90% of the Fund’s average daily net assets.
The Adviser has contractually agreed to waive a portion of its fees and/or reimburse expenses with respect to each Fund until February 28, 2021 (the Expense Cap Agreement), such that total expenses, exclusive of taxes, interest charges, dividend expenses incurred on securities that the Fund sells short, litigation expenses, other extraordinary expenses, deferred compensation expense, and brokerage commissions and other charges relating to the purchase and sale of the Fund’s securities will not exceed the following amounts of average daily net assets of the respective Fund:
| | | | |
| | | Class A | | Class I |
Small Cap Dividend Value Fund. | | 1.29% | | 1.04% |
Small-Mid Cap Value Fund | | 1.39% | | 1.14% |
Mid Cap Dividend Value Fund | | 1.20% | | 0.95% |
Any reimbursements or fee waivers made by the Adviser to a Fund are subject to repayment by the Fund, to the extent that the Fund is able to make the repayment within its Expense Cap Agreement. However, the repayment of previously waived expenses is limited to amounts that do not cause the aggregate operating expenses of the Fund to exceed the current expense cap or the expense cap in place at the time the waiver was generated. The Adviser did not recoup any fees previously waived or reimbursed under the Expense Cap Agreement for the fiscal year ended September 30, 2020. The table below indicates the amount of fees available for recoupment by the Adviser in future periods:
As of September 30, 2020, the cumulative unreimbursed amounts which may be recovered by the Adviser are as follows:
| | | | | | | | |
| | | For the year ended
September 30, 2018,
expiring
September 30, 2021 | | For the year ended
September 30, 2019,
expiring
September 30, 2022 | | For the year ended
September 30, 2020,
expiring
September 30, 2023 | | Total |
Small Cap Dividend Value Fund. | | $196,530 | | $347,914 | | $773,620 | | $1,318,064 |
Small-Mid Cap Value Fund | | 113,365 | | 127,131 | | 142,211 | | 382,707 |
Mid Cap Dividend Value Fund | | 241,278 | | 274,447 | | 297,386 | | 813,111 |
Any waiver or reimbursement is subject to later adjustment during the term of each Fund’s investment advisory agreement to allow Keeley-Teton to recoup amounts waived or reimbursed to the extent actual fees and expenses for a period are less than the expense limitation caps. Keeley-Teton, however, will only be entitled to recoup such amounts for a period of three years following the fiscal year in which such amount was waived or reimbursed.
The Adviser has an administration agreement for each of the Funds with Gabelli Funds, LLC, which has entered into an agreement with BNY Mellon Investment Servicing (US) Inc. to provide certain administrative services to the Funds.
29
KEELEY Funds, Inc.
Notes to Financial Statements (Continued)
The Board terminated the deferred compensation plan (the DC Plan) effective August 21, 2018. Under the plan, each Independent Director had the ability to defer receipt of all or a portion of his or her compensation. Deferred amounts remained in the Funds until distributed in accordance with the provisions of the DC Plan. The value of a participating Director’s deferral account was based on the theoretical investments of deferred amounts, on the normal payment dates, in all the Funds available from the Corporation as designated by the participating Directors. Changes in the value of participants’ deferral accounts were allocated pro rata among all Funds based on average net assets. As a result of the termination, pre-existing deferral account balances were paid out January 7, 2019.
The Corporation pays each Director who is not considered an affiliated person an annual retainer of $10,000 plus $2,000 for each Board meeting attended, and they are reimbursed by the Corporation for any out of pocket expenses incurred in attending meetings. All Board committee members receive $1,000 per meeting attended, and the Chairman of the Audit Committee receives a $25,000 annual fee. A Director may receive a single meeting fee, allocated among the participating funds, for attending certain meetings held on behalf of multiple funds. Directors who are directors or employees of the Adviser or an affiliated company receive no compensation or expense reimbursement from the Corporation.
4. Distribution Plan. The Corporation’s Board has adopted a Distribution Plan (the Plan) pursuant to Rule 12b-1 under the 1940 Act for the Funds’ Class A shares. The Plan is designed to finance or assist in the financing of any activity primarily intended to result in the sale of Class A shares by G.distributors, LLC (the Distributor), with whom certain officers and directors of the Corporation are affiliated, and to permit the Corporation to compensate the Distributor and other dealers of its shares. Each Fund paid the Distributor and each dealer a monthly fee at the annual rate of 0.25% of the average daily net assets of Fund shares beneficially owned by the Distributor’s and each dealer’s existing brokerage clients. The Plan can be continued in effect from year to year if such continuance is approved annually by the Board of the Corporation, including the vote of a majority of the Independent Directors.
For the fiscal year ended September 30, 2020, Small Cap Dividend Value Fund – Class A expensed $496,828 in distribution fees, of which $14,840 was paid to the Distributor; Small-Mid Cap Value Fund – Class A expensed $41,895 in distribution fees, of which $2,526 was paid to the Distributor; and Mid-Cap Dividend Value Fund – Class A expensed $38,432 in distribution fees, of which $1,087 was paid to the Distributor. The distribution fees paid to the Distributor are unaudited.
The Corporation has adopted a Shareholder Servicing Agreement for all of its Funds and their Classes. The Corporation has retained the Adviser to serve as the shareholder servicing agent for the Funds pursuant to the Shareholder Servicing Agreement. Under the Shareholder Servicing Agreement, the Corporation will pay the Adviser a monthly fee calculated at an annual rate of 0.05% of each Fund’s average daily net assets for providing support services to investors who beneficially own shares of a Fund. The Shareholder Servicing Agreement may be continued in effect from year to year if such continuance is approved annually by the Board of the Corporation, including the vote of a majority of the Independent Directors. For the fiscal year ended September 30, 2020, the Adviser received $403,409, $47,695, and $101,754 from Small Cap Dividend Value Fund, Small-Mid Cap Value Fund, and Mid Cap Dividend Value Fund, respectively.
5. Portfolio Securities. Purchases and sales (including maturities) of securities during the fiscal year ended September 30, 2020, other than short term securities, are as follows:
| | | | |
| | | Purchases
(excluding U.S.
Government
Securities) | | Sales
(excluding U.S.
Government
Securities) |
Small Cap Dividend Value Fund | | $70,818,523 | | $161,348,511 |
Small-Mid Cap Value Fund | | 10,401,429 | | 29,279,054 |
Mid Cap Dividend Value Fund | | 31,105,691 | | 61,408,751 |
6. Transactions with Affiliates and Other Arrangements. During the fiscal year ended September 30, 2020, the Distributor retained a total of $9,532 from investors representing commissions (sales charges and underwriting fees) on sales and redemptions of Fund shares.
The cost of calculating each Fund’s NAV per share is a Fund expense pursuant to the Advisory Agreement. During the fiscal year ended September 30, 2020, Small Cap Dividend Value Fund, Small-Mid Cap Value Fund, and Mid Cap Dividend Value Fund accrued $85,645, $12,388, and $36,424, respectively, in the Statements of Operations, in connection with the cost of computing these Funds’ NAVs.
30
KEELEY Funds, Inc.
Notes to Financial Statements (Continued)
As of September 30, 2020, affiliates of the Funds beneficially owned shares of the Funds as set forth below:
| | | | | | | | | | | | |
| | | Small Cap
Dividend Value Fund | | | Small-Mid
Cap Value Fund | | | Mid Cap
Dividend Value Fund | |
Shares | | | 1,909,082 | | | | 608,403 | | | | 1,747,892 | |
Percent of total outstanding shares | | | 8.98% | | | | 14.81% | | | | 29.23% | |
7. Line of Credit. The Funds participate in an unsecured line of credit, which expires on March 3, 2021 and may be renewed annually, of up to $75,000,000 under which they may each borrow up to 10% of their net assets from the custodian for temporary borrowing purposes. Borrowings under this arrangement bear interest at a floating rate equal to the higher of the overnight Federal Funds rate plus 125 basis points or 30 day ICE LIBOR plus 125 basis points in effect on that day. This amount, if any, would be included in “Interest expense” in the Statement of Operations. The average daily borrowings outstanding under the line of credit during the fiscal year ended September 30, 2020, for the Mid Cap Dividend Value Fund was $1,237,500 over 6 days with a weighted average interest rate of 1.63%. The maximum amount borrowed at any time during the fiscal year ended September 30, 2020, was $1,311,000. The Small Cap Dividend Value Fund and the Small-Mid Cap Dividend Value Fund did not borrow from the line of credit during the fiscal year ended September 30, 2020.
8. Capital Stock. The Funds offer two classes of shares - Class A Shares and Class I Shares. The public offering price for Class A Shares is the net asset value plus a sales charge, which varies in accordance with the amount of the purchase up to a maximum of 4.50%. The public offering price for Class I Shares is the net asset value.
Transactions in shares of capital stock were as follows:
| | | | | | | | | | | | | | | | | | | | | | | | |
| | | Year Ended
September 30,
2020 | | | Year Ended
September 30,
2019 | | | Year Ended
September 30,
2020 | | | Year Ended
September 30,
2019 | | | Year Ended
September 30,
2020 | | | Year Ended
September
2019 | |
| | | Small Cap Dividend Value
Fund | | | Small-Mid Cap Value Fund | | | Mid Cap Dividend
Value Fund | |
Class A | | | | | | | | | | | | | | | | | | | | | | | | |
Shares sold. | | | 522,614 | | | | 489,360 | | | | 17,939 | | | | 60,014 | | | | 66,898 | | | | 176,863 | |
Shares sold in connection with acquisition | | | — | | | | 16,811,878 | (a) | | | — | | | | — | | | | — | | | | — | |
Shares issued upon reinvestment of distributions | | | 269,827 | | | | 185,745 | | | | 328,373 | | | | 325,839 | | | | 17,039 | | | | 47,965 | |
Shares redeemed | | | (4,551,764 | ) | | | (2,179,340 | ) | | | (911,705 | ) | | | (1,493,758) | | | | (231,653 | ) | | | (752,733) | |
| | | | | | | | | | | | | | | | | | | | | | | | |
Net increase/(decrease) in Class A Shares | | | (3,759,323 | ) | | | 15,307,643 | | | | (565,393 | ) | | | (1,107,905) | | | | (147,716 | ) | | | (527,905) | |
| | | | | | | | | | | | | | | | | | | | | | | | |
Class I | | | | | | | | | | | | | | | | | | | | | | | | |
Shares sold. | | | 1,055,658 | | | | 516,966 | | | | 188,659 | | | | 424,966 | | | | 832,628 | | | | 2,432,629 | |
Shares sold in connection with acquisition | | | — | | | | 9,213,890 | (a) | | | — | | | | — | | | | — | | | | — | |
Shares issued upon reinvestment of distributions | | | 227,361 | | | | 545,071 | | | | 620,961 | | | | 948,967 | | | | 175,506 | | | | 266,105 | |
Shares redeemed | | | (3,944,219 | ) | | | (2,687,359 | ) | | | (1,394,638 | ) | | | (6,205,619) | | | | (2,665,019 | ) | | | (908,693) | |
| | | | | | | | | | | | | | | | | | | | | | | | |
Net increase/(decrease) in Class I Shares | | | (2,661,200 | ) | | | 7,588,568 | | | | (585,018 | ) | | | (4,831,686) | | | | (1,656,885 | ) | | | 1,790,041 | |
| | | | | | | | | | | | | | | | | | | | | | | | |
| (a) | On June 7, 2019, Small Cap Value Fund merged into Small Cap Dividend Value Fund. (See Note 10 of the Notes to Financial Statements.) |
9. Indemnifications. The Funds enter into contracts that contain a variety of indemnifications. The Funds’ maximum exposure under these arrangements is unknown. However, the Funds have not had prior claims or losses pursuant to these contracts. Management has reviewed the Funds’ existing contracts and expects the risk of loss to be remote.
10. Reorganization. On June 7, 2019, Small Cap Dividend Value Fund acquired all the net assets of the Small Cap Value Fund, pursuant to a plan of reorganization approved by the Corporation’s Board on April 4, 2019. The purpose of the transaction was to combine two funds managed by the Adviser with comparable investment objectives and strategies. The acquisition was accomplished by a tax free exchange of 16,811,878 and 9,213,890 shares of Class A and Class I, respectively, of Small Cap Dividend Value Fund (valued at $266,632,981 and $146,414,615 for Class A and Class I, respectively) for all (12,157,834 and 6,565,394 shares, respectively) of the Class A and I shares outstanding of the Small Cap Value Fund on June 7, 2019. For financial reporting purposes, assets received and shares issued by Small Cap Dividend Value were recorded at fair value; however, the cost basis of the investments received from Small Cap Value Fund was carried forward to align ongoing reporting of Small Cap Dividend Value Fund’s realized and unrealized gains and losses with amounts distributable to shareholders for tax purposes. Small Cap Value Fund’s net assets at that date ($413,047,596), including $54,725,336 of unrealized appreciation, were combined with those of Small Cap Dividend Value Fund. The aggregate net assets of Small Cap Dividend Value Fund immediately before the acquisition were $79,215,494. All costs associated with the plan of reorganization were paid by the Adviser.
31
KEELEY Funds, Inc.
Notes to Financial Statements (Continued)
11. Subsequent Events. Management has evaluated the impact on the Funds of all subsequent events occurring through the date the financial statements were issued and has determined that there were no subsequent events requiring recognition or disclosure in the financial statements.
32
Report of Independent Registered Public Accounting Firm
To the Board of Directors of KEELEY Funds, Inc. and Shareholders of KEELEY Small Cap Dividend Value Fund, KEELEY Small-Mid Cap Value Fund and KEELEY Mid Cap Dividend Value Fund
Opinions on the Financial Statements
We have audited the accompanying statements of assets and liabilities, including the schedules of investments, of KEELEY Small Cap Dividend Value Fund, KEELEY Small-Mid Cap Value Fund and KEELEY Mid Cap Dividend Value Fund (constituting KEELEY Funds, Inc., hereafter collectively referred to as the “Funds”) as of September 30, 2020, the related statements of operations for the year ended September 30, 2020, the statements of changes in net assets for each of the two years in the period ended September 30, 2020, including the related notes, and the financial highlights for each of the five years in the period ended September 30, 2020 (collectively referred to as the “financial statements”). In our opinion, the financial statements present fairly, in all material respects, the financial position of each of the Funds as of September 30, 2020, the results of each of their operations for the year then ended, the changes in each of their net assets for each of the two years in the period ended September 30, 2020 and each of the financial highlights for each of the five years in the period ended September 30, 2020 in conformity with accounting principles generally accepted in the United States of America.
Basis for Opinions
These financial statements are the responsibility of the Funds’ management. Our responsibility is to express an opinion on the Funds’ financial statements based on our audits. We are a public accounting firm registered with the Public Company Accounting Oversight Board (United States) (“PCAOB”) and are required to be independent with respect to the Funds in accordance with the U.S. federal securities laws and the applicable rules and regulations of the Securities and Exchange Commission and the PCAOB.
We conducted our audits of these financial statements in accordance with the standards of the PCAOB. Those standards require that we plan and perform the audit to obtain reasonable assurance about whether the financial statements are free of material misstatement, whether due to error or fraud.
Our audits included performing procedures to assess the risks of material misstatement of the financial statements, whether due to error or fraud, and performing procedures that respond to those risks. Such procedures included examining, on a test basis, evidence regarding the amounts and disclosures in the financial statements. Our audits also included evaluating the accounting principles used and significant estimates made by management, as well as evaluating the overall presentation of the financial statements. Our procedures included confirmation of securities owned as of September 30, 2020 by correspondence with the custodian and brokers; when replies were not received from brokers, we performed other auditing procedures. We believe that our audits provide a reasonable basis for our opinions.
/s/PricewaterhouseCoopers LLP
New York, New York
November 25, 2020
We have served as the auditor of one or more investment companies in the Gabelli/GAMCO Fund Complex since 1986.
33
2020 Tax Notice to Shareholders (Unaudited)
KEELEY Small Cap Dividend Value Fund – During the fiscal year ended September 30, 2020, the Fund paid to shareholders ordinary income dividends (comprised of net investment income and short term capital gains) totaling $0.29870 and $0.33810 per share for Class A and Class I, respectively. For the fiscal year ended September 30, 2020, 100% of the ordinary income dividend qualifies for the dividend received deduction available to corporations. The Fund designates 100% of the ordinary income distributions as qualified dividend income, pursuant to the Jobs and Growth Tax Relief Reconciliation Act of 2003. The Fund designates 0.50% of the ordinary income distributions as qualified interest income, pursuant to the American Jobs Creation Act of 2004.
KEELEY Small-Mid Cap Value Fund – During the fiscal year ended September 30, 2020, the Fund paid to shareholders ordinary income dividends (comprised of net investment income and short term capital gains) totaling $0.08520 and $0.12170 per share for Class A and Class I, respectively. During the fiscal year ended September 30, 2020, the Fund paid to shareholders long term capital gains totaling $10,553,834. The distributions of long term capital gains have been designated as a capital gain dividend by the Fund’s Board of Directors. For the fiscal year ended September 30, 2020, 100% of the ordinary income dividend qualifies for the dividend received deduction available to corporations. The Fund designates 100% of the ordinary income distributions as qualified dividend income, pursuant to the Jobs and Growth Tax Relief Reconciliation Act of 2003. The Fund designates 1.81% of the ordinary income distributions as qualified interest income, pursuant to the American Jobs Creation Act of 2004.
KEELEY Mid Cap Dividend Value Fund – During the fiscal year ended September 30, 2020, the Fund paid to shareholders ordinary income dividends (comprised of net investment income and short term capital gains) totaling $0.32640 and $0.38430 per share for Class A and Class I, respectively. During the fiscal year ended September 30, 2020, the Fund paid to shareholders long term capital gains totaling $1,224,796. The distributions of long term capital gains have been designated as a capital gain dividend by the Fund’s Board of Directors. For the fiscal year ended September 30, 2020, 100% of the ordinary income dividend qualifies for the dividend received deduction available to corporations. The Fund designates 100% of the ordinary income distributions as qualified dividend income, pursuant to the Jobs and Growth Tax Relief Reconciliation Act of 2003. The Fund designates 0.73% of the ordinary income distributions as qualified interest income, pursuant to the American Jobs Creation Act of 2004.
All designations are based on financial information available as of the date of this annual report and, accordingly, are subject to change. For each item, it is the intention of the Fund to designate the maximum amount permitted under the Internal Revenue Code and the regulations thereunder.
34
Keeley Funds
Board Consideration and Re-Approval of Investment Advisory and Subadvisory Agreements (Unaudited)
In determining whether to approve the continuance of the Investment Advisory Agreement (the Advisory Agreement), the Board, including a majority of the Directors who have no direct or indirect interest in the Agreements and are not interested persons of the Funds, as defined in the 1940 Act (the Independent Board Members), considered the following information at a meeting on August 18, 2020:
1) The nature, extent and quality of services provided by the Adviser.
The Board reviewed in detail the nature and extent of the services provided by the Adviser under the Advisory Agreement and the quality of those services over the past year. The Board noted that these services included managing the investment program of the Funds, including the purchase and sale of portfolio securities, as well as the provision of general corporate services. The Board considered that the Adviser also provided, at its expense, office facilities for use by the Funds and supervisory personnel responsible for supervising the performance of administrative, accounting and related services including, for each Fund, monitoring to assure compliance with stated investment policies and restrictions under the 1940 Act and related securities regulations. The Board noted that, in addition to managing the investment program for the Funds, the Adviser provided certain non-advisory and compliance services, including services under the Funds’ Rule 38a-1 compliance program.
The Board also considered that the Adviser paid for all compensation of officers and Board Members of the Funds who are affiliated with the Adviser and that the Adviser further provided services to shareholders of the Funds who had invested through various programs offered by third party financial intermediaries. The Board evaluated these factors based on its direct experience with the Adviser and in consultation with Fund Counsel.
The Board reviewed the personnel responsible for providing services to the Funds and concluded, based on their experience and interaction with the Adviser, that (i) the Adviser was able to retain quality personnel, (ii) the Adviser, and their agents exhibited a high level of diligence and attention to detail in carrying out their advisory and administrative responsibilities under the Agreements, (iii) the Adviser was responsive to requests of the Board, (iv) the scope and depth of the Adviser’s resources were adequate, and (v) the Adviser had kept the Board apprised of developments relating to each Fund and the industry in general. The Board also focused on the Adviser’s reputation and long-standing relationship with the Funds. The Board also believed that the Adviser had devoted substantial resources and made substantial commitments to address new regulatory compliance requirements applicable to the Funds.
2) The performance of the Funds and the Adviser.
The Board reviewed the investment performance of each Fund, on an absolute basis, as compared with Broadridge peer group of other SEC registered funds, and against each Fund’s broad-based securities market benchmarks as reflected in each Fund’s prospectuses and annual report. The Board also considered rankings and ratings of the Funds issued by Broadridge over the short, intermediate, and long term. The Board considered each Fund’s one, three, five and ten year (where applicable) average annual total return for the periods ended June 30, 2020, but placed greatest emphasis on a Fund’s longer term performance. The peer groups considered by the Board were developed by Broadridge and were comprised of funds within the same Broadridge peer group category (the Performance Peer Group). Each Fund’s performance against the Performance Peer Group was considered by the Board as providing an objective comparative benchmark against which each Fund’s performance could be assessed. In general, the Board considered these comparisons helpful in their assessment as to whether the Adviser was obtaining for the Funds’ shareholders the total return performance that was available in the marketplace, given each Fund’s investment objectives, strategies, limitations, and restrictions. In reviewing the Funds’ performance, the Board noted that KMDVF, on a total return basis, underperformed the Lipper Equity Income Index for the one, three, and five-year periods. KSDVF, on a total return basis, outperformed the Lipper Sm-Cap Value Index for the one, three, five, and ten-year periods. KSMVF, on a total return basis, underperformed the Lipper Sm-Cap Core Index for the one, three, five, and ten-year periods. In connection with its assessment of the performance of the Adviser, the Board considered the Adviser’s financial condition and whether it had the resources necessary to continue to carry out their responsibilities under the Advisory Agreement. The Board concluded that the Adviser had the financial resources necessary to continue to perform its obligations under the Advisory Agreement and to continue to provide the high quality services that it have provided to the Funds to date.
3) The cost of the advisory services and the profits to the Adviser and their affiliates from the relationship with the Funds.
In connection with the Board’s consideration of the cost of the advisory services and the profits to the Adviser, and its affiliates from their relationships with the Funds, the Board considered a number of factors. First, the Board compared the level of the advisory fee for each Fund against comparative Broadridge expense peer groups (Expense Peer Group). The Board also considered comparative non-advisory fee expenses and comparative total fund expenses of the Funds and each Expense Peer Group. The Board considered this information as useful in assessing whether the Adviser was providing services at a cost that was competitive with other similar funds. In assessing this information, the Board considered both the comparative contract rates as well as the level of the advisory fees after waivers and/or reimbursements. The Board noted that for KMDVF the advisory fee and the total expense ratio are above the median, as compared to the Expense Peer Group. With respect to KSMVF, the
35
Board noted that the advisory fee and the total expense ratio are above the median, as compared to the Expense Peer Group. In connection with their review of KSDVF, the Board noted that the advisory fee and the total expense ratio is above the median, as compared to the Expense Peer Group. The Board noted that each of the Funds operated pursuant to an expense limitation agreement with the Adviser, wherein the Adviser had agreed to waive a portion of its fee or reimburse a Fund for a portion of its expenses necessary to limit the Fund’s total operating expenses to the level set forth in the respective Fund’s prospectus.
The Board also considered an analysis prepared by the Adviser of the estimated profitability to the Adviser of its relationship with the Funds and reviewed with the Adviser its cost allocation methodology in connection with its profitability. In this regard, the Board reviewed Pro-forma Income Statements of the Adviser for the year ended December 31, 2019. The Board considered one analysis for the Adviser as a whole, and a second analysis for the Adviser with respect to each of the Funds. The Board concluded that the profitability of the Funds to the Adviser under either analysis was not excessive.
4) The extent to which economies of scale will be realized as the Funds grow and whether fee levels reflect those economies of scale.
With respect to the Board’s consideration of economies of scale, the Board discussed whether economies of scale would be realized by the Funds at higher asset levels. The Board also reviewed data from the Expense Peer Groups to assess whether the Expense Peer Group funds had advisory fee breakpoints and, if so, at what asset levels. The Board also assessed whether certain of the Adviser’s costs would increase if asset levels rise. The Board concluded that under foreseeable conditions, they were unable to assess at this time whether economies of scale would be realized if the Funds were to experience significant asset growth. In the event there was to be significant asset growth in the Funds, the Board determined to reassess whether the advisory fee appropriately took into account any economies of scale that had been realized as a result of that growth.
5) Other Factors.
In addition to the above factors, the Board also discussed other benefits received by the Adviser from its management of the Funds. The Board considered that the Adviser does use soft dollars in connection with its management of the Funds. Based on a consideration of all these factors in their totality, the Board Members, including all of the Independent Board Members, determined that each Fund’s advisory fee was fair and reasonable with respect to the quality of services provided and in light of the other factors described above that the Board deemed relevant. Accordingly, the Board Members determined to approve the continuation of each Fund’s Advisory Agreement. The Board based its decision on evaluations of all these factors as a whole and did not consider any one factor as all-important or controlling.
36
Keeley Funds
Additional Fund Information (Unaudited)
The business and affairs of the Corporation are managed under the direction of its Board of Directors. Information pertaining to the Directors and officers of the Corporation is set forth below. The Funds’ Statement of Additional Information includes additional information about the Keeley Funds’ Directors and is available, without charge, upon request, by calling 800-422-3554 or by writing to the Keeley Funds at 141, West Jackson Blvd., Suite 2150 Chicago, Illinois 60604.
| | | | | | | | |
Name, Position(s), Address1 and Year of Birth | | Term of Office and Length of Time Served2 | | Number of Funds in Fund Complex Overseen by Trustee | | Principal Occupation(s) During Past Five Years | | Other Directorships Held by Director3 |
| | | | |
INTERESTED DIRECTORS4 : | | | | | | | | |
Nicholas F. Galluccio Co-Chairman and Director 1950 | | Since 2017 | | 8 | | President and Chief Executive Officer of Teton
Advisors Inc. (since 2008); Group Managing
Director, U.S. Equities (2004-2008), Managing Director, U.S. Equities (1994-2004), Senior Vice President (1990-1994) and Vice President (1982-1990) of Trust Company of the West (TCW) | | Board of Regents of the University of Hartford; Executive Advisory Board of the Columbia Business School
Program for Financial Studies |
| | | | |
Kevin M. Keeley Co-Chairman, Director, and President 1967 | | Co-Chairman and Director since 2017 President since 2015 | | 3 | | Executive Chairman of Keeley-Teton Advisors, LLC (since 2017); President (2015-2017) and Executive Vice President (2010-2015) of Joley Corp; President (2015-2017) and Executive Vice President (2010-2015) of Keeley Holdings, Inc.; President of Keeley Asset Management Corp. (2015-2017); Senior Vice President of Keeley Asset Management Corp. and Keeley Investment Corp. (2010-2015) | | — |
| | | | |
INDEPENDENT DIRECTORS5 : | | | | | | | | |
Laura D. Alter Director 1960 | | Since 2014 | | 3 | | Retired since 2010; previously Managing Director and Senior Partner of Fixed Income, Harris Investments (1994-2010); Fund Manager for Harris Insight family of funds (1994-2010) | | — |
| | | | |
Anthony S. Colavita6 Director 1961 | | Since 2017 | | 17 | | Attorney, Anthony S. Colavita, P.C. | | — |
| | | | |
James P. Conn Director 1938 | | Since 2017 | | 23 | | Former Managing Director and Chief Investment Officer of Financial Security Assurance Holdings Ltd. (1992-1998) | | — |
| | | | |
Jerome J. Klingenberger Director 1955 | | Since 1999 | | 3 | | Executive Vice President and Chief Financial Officer (since 2006) of Grayhill, Inc. (human interface solutions) | | — |
| | | | |
Sean Lowry Director 1953 | | Since 1999 | | 3 | | Retired since 2015; formerly Executive Vice President, Pacor Mortgage Corp. (1992-2015) | | — |
| | | | |
Michael J. Melarkey Director 1949 | | Since 2017 | | 20 | | Of Counsel in the law firm of McDonald Carano Wilson LLP; Partner in the law firm of Avansino, Melarkey, Knobel, Mulligan & McKenzie (1980-2015) | | Chairman of Southwest Gas Corporation (natural gas utility) |
| | | | |
Kuni Nakamura Director 1968 | | Since 2017 | | 32 | | President of Advanced Polymer, Inc. (chemical manufacturing company); President of KEN Enterprises, Inc. (real estate); Trustee on Long Island University Board of Trustees | | — |
37
| | | | |
Name, Position(s),
Address1 and Year of Birth | | Term of
Office and
Length of
Time Served2 | | Principal Occupation(s)
During Past Five Years |
| | |
OFFICERS: | | | | |
Kevin M. Keeley President 1967 | | Since 2015 | | Executive Chairman of Keeley-Teton Advisors, LLC (since 2017); President (2015-2017) and Executive Vice President (2010-2015) of Joley Corp; President (2015-2017) and Executive Vice President (2010-2015) of Keeley Holdings, Inc.; President of Keeley Asset Management Corp. (2015-2017); Senior Vice President of Keeley Asset Management Corp. and Keeley Investment Corp. (2010-2015) |
| | |
John C. Ball Treasurer 1976 | | Since 2018 | | Treasurer of registered investment companies within the Fund Complex since 2017; Vice President and Assistant Treasurer of AMG Funds, 2014-2017 |
| | |
Thomas E. Browne, Jr. Vice President 1963 | | Since 2018 | | Portfolio Manager of Keeley-Teton Advisors, LLC (since 2017); Senior Vice President, Portfolio Manager of Keeley Asset Management Corp. (2009-2017) |
| | |
Peter Goldstein Secretary 1953 | | Since 2020 | | General Counsel, Gabelli Funds, LLC since July 2020; General Counsel and Chief Compliance Officer, Buckingham Capital Management, Inc. (2012-2020); Chief Legal Officer and Chief Compliance Officer, The Buckingham Research Group, Inc. (2012-2020) |
| | |
Deanna B. Marotz Chief Compliance Officer 1965 | | Since 2015 | | Chief Compliance Officer of Keeley-Teton Advisors, LLC and Teton Advisors, Inc. (since 2017); Chief Compliance Officer of Keeley Asset Management Corp. (2015-2017); Chief Compliance Officer of Invesco PowerShares Capital Management LLC (2008-2015) |
| 1 | Address: 141, West Jackson Blvd., Suite 2150 Chicago, Illinois 60604, unless otherwise noted. |
| 2 | Each Director will hold office for an indefinite term until the earliest of (i) the next meeting of shareholders, if any, called for the purpose of considering the election or re-election of such Director and until the election and qualification of his or her successor, if any, elected at such meeting, or (ii) the date a Director resigns or retires, or a Director is removed by the Board of Directors or shareholders, in accordance with the Corporation’s Amended By-Laws and Amended and Restated Articles of Incorporation. Each officer will hold office for an indefinite term until the date he or she resigns or retires or until his or her successor is elected and qualified. |
| 3 | This column includes only directorships of companies required to report to the SEC under the Securities Exchange Act of 1934, i.e., public companies,orother investment companies registered under the Investment Company Act of 1940. |
| 4 | “Interested Directors” of the Funds as defined in the 1940 Act. Mr. Galluccio is considered an “interested person” of the Company because of his position as President and Chief Executive Officer of Teton. Mr. Keeley is considered an “interested person” because of his position as Executive Chairman of Keeley- Teton. |
| 5 | Directors who are not interested persons are considered “Independent” Directors. |
| 6 | Mr. Colavita’s father, Anthony J. Colavita, serves as a director of funds which are part of the Fund Complex. |
38
Keeley Funds and Your Personal Privacy
Protecting your personal information is an important priority for us. The Funds’ privacy policy is designed to support this objective. We collect nonpublic personal information about you from the following sources:
| ● | | Information we receive from you on applications or on other forms; correspondence or conversations, such as your name, address, social security number, assets, income, and date of birth. |
| ● | | Information about your transactions with us, our affiliates or others, such as your account numbers and balances, transaction history, parties to transactions, cost basis information, and other financial information. |
The Funds restrict access to your nonpublic information by maintaining physical, electronic, and procedural safeguards.
The Funds do not disclose any nonpublic information about their current or former customers to nonaffiliated third parties, except as permitted by law. G.distributors, LLC. is the Distributor and Keeley-Teton Advisors, LLC. is the Investment Adviser for the Keeley Funds and are both affiliates of the Keeley Funds. We may share your nonpublic information with affiliates who require such information to provide products or services to you. You may request that we not share your nonpublic information with our affiliates for use by them in marketing products or services to you by calling us toll-free at 1-800-422-3554. We will honor your choice until you tell us otherwise. If you have a joint account, your instruction will be applied to all account holders on that account.

KEELEY Small Cap Dividend Value Fund
KEELEY Small-Mid Cap Value Fund
KEELEY Mid Cap Dividend Value Fund
141 West Jackson Blvd., Suite 2150
Chicago, Illinois 60604
General and Account Information:
800-422-3554
fax: 312-786-5003
website: keeleyfunds.com
e-mail: info@keeleyteton.com
Board of Directors
| | | | |
LAURA D. ALTER Former Managing Director and Senior Partner of Fixed Income, Harris Investments | | NICHOLAS F. GALLUCCIO* Co-Chairman, President, and Chief Executive Officer Teton Advisors, Inc. | | SEAN LOWRY Former Executive Vice President, Pacor Mortgage Corp. |
| | |
ANTHONY S. COLAVITA Attorney, Anthony S. Colavita, P.C. | | KEVIN M. KEELEY* Co-Chairman, Executive Chairman, and President Keeley -Teton Advisors, LLC President, Keeley Funds, Inc. | | MICHAEL J. MELARKEY Of Counsel, McDonald Carano Wilson LLP |
| | |
JAMES P. CONN Former Managing Director and Chief Investment Officer, Financial Security Assurance Holdings Ltd. | | JEROME J. KLINGENBERGER Executive Vice President and, Chief Financial Officer Grayhill, Inc. | | KUNI NAKAMURA President of Advanced Polymer, Inc. |
| | |
*Interested Directors | | | | |
| | |
| | Officers | | |
| | |
KEVIN M. KEELEY President | | JOHN C. BALL Treasurer | | PETER GOLDSTEIN Secretary |
| | |
DEANNA MAROTZ Chief Compliance Officer | | THOMAS E. BROWNE Jr. Vice President | | |
| | | | |
| | Investment Adviser | | Distributor |
| | Keeley-Teton Advisors, LLC | | G.distributors, LLC |
| | Custodian | | Legal Counsel |
| | State Street Bank and Trust Company | | Paul Hastings LLP |
This report is submitted for the information of the shareholders of the KEELEY Funds. It is not authorized for distribution to prospective investors unless preceded or accompanied by an effective prospectus.
GABKLQ320AR
| | (a) | The registrant, as of the end of the period covered by this report, has adopted a code of ethics that applies to the registrant’s principal executive officer, principal financial officer, principal accounting officer or controller, or persons performing similar functions, regardless of whether these individuals are employed by the registrant or a third party. |
| | (c) | There have been no amendments, during the period covered by this report, to a provision of the code of ethics that applies to the registrant’s principal executive officer, principal financial officer, principal accounting officer or controller, or persons performing similar functions, regardless of whether these individuals are employed by the registrant or a third party, and that relates to any element of the code of ethics description. |
| | (d) | The registrant has not granted any waivers, including an implicit waiver, from a provision of the code of ethics that applies to the registrant’s principal executive officer, principal financial officer, principal accounting officer or controller, or persons performing similar functions, regardless of whether these individuals are employed by the registrant or a third party, that relates to one or more of the items set forth in paragraph (b) of this item’s instructions. |
| Item 3. | Audit Committee Financial Expert. |
As of the end of the period covered by the report, the registrant’s board of directors has determined that Jerome Klingenberger and Kuni Nakamura are qualified to serve as audit committee financial experts serving on its audit committee and that they are “independent.”
| Item 4. | Principal Accountant Fees and Services. |
Audit Fees
| | (a) | The aggregate fees billed for each of the last two fiscal years for professional services rendered by the principal accountant for the audit of the registrant’s annual financial statements or services that are normally provided by the accountant in connection with statutory and regulatory filings or engagements for those fiscal years are $63,300 in 2019 and $64,666 in 2020. |
Audit-Related Fees
| | (b) | The aggregate fees billed in each of the last two fiscal years for assurance and related services by the principal accountant that are reasonably related to the performance of the audit of the registrant’s financial statements and are not reported under paragraph (a) of this Item are $5,000 in 2019 and $0 in 2020. These fees relate to the review of a fund merger. |
Tax Fees
| | (c) | The aggregate fees billed in each of the last two fiscal years for professional services rendered by the principal accountant for tax compliance, tax advice, and tax planning are $19,840 in 2019 and $15,180 in 2020. |
All Other Fees
| | (d) | The aggregate fees billed in each of the last two fiscal years for products and services provided by the principal accountant, other than the services reported in paragraphs (a) through (c) of this Item are $0 in 2019 and $0 in 2020. |
| | (e)(1) | Disclose the audit committee’s pre-approval policies and procedures described in paragraph (c)(7) of Rule 2-01 of Regulation S-X. |
Pre-Approval Policies and Procedures. The Audit Committee (“Committee”) of the registrant is responsible for pre-approving (i) all audit and permissible non-audit services to be provided by the independent registered public accounting firm to the registrant and (ii) all permissible non-audit services to be provided by the independent registered public accounting firm to the Adviser, Gabelli Funds, LLC, and any affiliate of Gabelli Funds, LLC (“Gabelli”) that provides services to the registrant (a “Covered Services Provider”) if the independent registered public accounting firm’s engagement related directly to the operations and financial reporting of the registrant. The Committee may delegate its responsibility to pre-approve any such audit and permissible non-audit services to the Chairperson of the Committee, and the Chairperson must report to the Committee, at its next regularly scheduled meeting after the Chairperson’s pre-approval of such services, his or her decision(s). The Committee may also establish detailed pre-approval policies and procedures for pre-approval of such services in accordance with applicable laws, including the delegation of some or all of the Committee’s pre-approval responsibilities to the other persons (other than Gabelli or the registrant’s officers). Pre-approval by the Committee of any permissible non-audit services is not required so long as: (i) the permissible non-audit services were not recognized by the registrant at the time of the engagement to be non-audit services; and (ii) such services are promptly brought to the attention of the Committee and approved by the Committee or Chairperson prior to the completion of the audit.
| | (e)(2) | The percentage of services described in each of paragraphs (b) through (d) of this Item that were approved by the audit committee pursuant to paragraph (c)(7)(i)(C) of Rule 2-01 of Regulation S-X are as follows: |
(b) N/A
(c) N/A
(d) N/A
| | (f) | The percentage of hours expended on the principal accountant’s engagement to audit the registrant’s financial statements for the most recent fiscal year that were attributed to work performed by persons other than the principal accountant’s full-time, permanent employees was less than fifty percent. |
| | (g) | The aggregate non-audit fees billed by the registrant’s accountant for services rendered to the registrant, and rendered to the registrant’s investment adviser (not including any sub-adviser whose role is primarily portfolio management and is subcontracted with or overseen by another investment adviser), and any entity controlling, controlled by, or under common control with the adviser that provides ongoing services to the registrant for each of the last two fiscal years of the registrant was $24,840 in 2019 and $15,180 in 2020. |
| | (h) | The registrant’s audit committee of the board of directors has considered whether the provision of non-audit services that were rendered to the registrant’s investment adviser (not including any sub-adviser whose role is primarily portfolio management and is subcontracted with or overseen by another investment adviser), and any entity controlling, controlled by, or under common control with the investment adviser that provides ongoing services to the registrant that were not pre- |
| | approved pursuant to paragraph (c)(7)(ii) of Rule 2-01 of Regulation S-X is compatible with maintaining the principal accountant’s independence. |
| Item 5. | Audit Committee of Listed Registrants. |
Not applicable.
| (a) | Schedule of Investments in securities of unaffiliated issuers as of the close of the reporting period is included as part of the report to shareholders filed under Item 1 of this form. |
| (b) | Not applicable due to no such divestments during the semi-annual period covered since the previous Form N-CSR filing. |
| Item 7. | Disclosure of Proxy Voting Policies and Procedures for Closed-End Management Investment Companies. |
Not applicable.
| Item 8. | Portfolio Managers of Closed-End Management Investment Companies. |
Not applicable.
| Item 9. | Purchases of Equity Securities by Closed-End Management Investment Company and Affiliated Purchasers. |
Not applicable.
| Item 10. | Submission of Matters to a Vote of Security Holders. |
There have been no material changes to the procedures by which the shareholders may recommend nominees to the registrant’s board of directors, where those changes were implemented after the registrant last provided disclosure in response to the requirements of Item 407(c)(2)(iv) of Regulation S-K (17 CFR 229.407) (as required by Item 22(b)(15) of Schedule 14A (17 CFR 240.14a-101)), or this Item.
| Item 11. | Controls and Procedures. |
| | (a) | The registrant’s principal executive and principal financial officers, or persons performing similar functions, have concluded that the registrant’s disclosure controls and procedures (as defined in Rule 30a-3(c) under the Investment Company Act of 1940, as amended (the “1940 Act”) (17 CFR 270.30a-3(c))) are effective, as of a date within 90 days of the filing date of the report that includes the disclosure required by this paragraph, based on their evaluation of these controls and procedures required by Rule 30a-3(b) under the 1940 Act (17 CFR 270.30a-3(b)) and Rules 13a-15(b) or 15d-15(b) under the Securities Exchange Act of 1934, as amended (17 CFR 240.13a-15(b) or 240.15d-15(b)). |
| | (b) | There were no changes in the registrant’s internal control over financial reporting (as defined in Rule 30a-3(d) under the 1940 Act (17 CFR 270.30a-3(d)) that occurred during the period covered |
| | by this report that has materially affected, or is reasonably likely to materially affect, the registrant’s internal control over financial reporting. |
| Item 12. | Disclosure of Securities Lending Activities for Closed-End Management Investment Companies. |
Not applicable.
SIGNATURES
Pursuant to the requirements of the Securities Exchange Act of 1934 and the Investment Company Act of 1940, the registrant has duly caused this report to be signed on its behalf by the undersigned, thereunto duly authorized.
|
| (Registrant) Keeley Funds, Inc. |
|
| By (Signature and Title)* /s/ Kevin Keeley |
| Kevin Keeley, Principal Executive Officer |
|
| Date December 4, 2020 |
Pursuant to the requirements of the Securities Exchange Act of 1934 and the Investment Company Act of 1940, this report has been signed below by the following persons on behalf of the registrant and in the capacities and on the dates indicated.
|
| By (Signature and Title)* /s/ Kevin Keeley |
| Kevin Keeley, Principal Executive Officer |
|
| Date December 4, 2020 |
|
| By (Signature and Title)* /s/ John C. Ball |
| John C. Ball, Principal Financial Officer and Treasurer |
|
| Date December 4, 2020 |
* Print the name and title of each signing officer under his or her signature.