UNITED STATES
SECURITIES AND EXCHANGE COMMISSION
Washington, DC 20549
FORM 10-K
| x | ANNUAL REPORT PURSUANT TO SECTION 13 OR 15(d) OF THE SECURITIES EXCHANGE ACT OF 1934 |
For the fiscal year ended June 30, 2009
OR
| ¨ | TRANSITION REPORT PURSUANT TO SECTION 13 OR 15(d) OF THE SECURITIES EXCHANGE ACT OF 1934 |
for the transition period from to .
COMMISSION FILE NUMBER: 001-33461
Solera Holdings, Inc.
(Exact name of registrant as specified in its charter)
| | |
| Delaware | | 26-1103816 |
(State or other jurisdiction of incorporation organization) | | (I.R.S. Employer Identification No.) |
15030 Avenue of Science, San Diego, CA 92128
(Address of principal executive offices) (Zip Code)
(858) 724-1600
(Registrant’s telephone number, including area code)
Securities registered pursuant to Section 12(b) of the Act:
| | |
Title of each class | | Name of exchange on which registered |
| Common Stock, par value $0.01 per share | | The New York Stock Exchange |
Securities registered pursuant to Section 12(g) of the Act:
None
Indicate by check mark if the registrant is a well-known seasoned issuer, as defined in Rule 405 of the Securities Act. Yes x No ¨
Indicate by check mark if the registrant is not required to file reports pursuant to Section 13 or Section 15(d) of the Act. Yes ¨ No x
Indicate by check mark whether the Registrant (1) has filed all reports required to be filed by Section 13 or 15(d) of the Securities Exchange Act of 1934 during the preceding 12 months (or for such shorter period that it was required to file such reports), and (2) has been subject to such filing requirements for the past 90 days. Yes x No ¨
Indicate by check mark if disclosure of delinquent filers pursuant to Item 405 of Regulation S-K is not contained herein, and will not be contained, to the best of the Registrant’s knowledge, in definitive proxy or information statements incorporated by reference in Part III of this Form 10-K or any amendment to this Form 10-K. ¨
Indicate by check mark whether the registrant has submitted electronically and posted on its corporate Web site, if any, every Interactive Data File required to be submitted and posted pursuant to Rule 405 of Regulation S-T (§232.405 of this chapter) during the preceding 12 months (or for such shorter period that the registrant was required to submit and post such files). Yes ¨ No ¨
Indicate by check mark whether the registrant is a large accelerated filer, an accelerated filer, a non-accelerated filer, or a smaller reporting company. See the definitions of “large accelerated filer,” “accelerated filer” and “smaller reporting company” in Rule 12b-2 of the Exchange Act. (Check one):
Large accelerated filer x Accelerated filer ¨ Non-accelerated filer ¨ Smaller reporting company ¨
Indicate by check mark whether the registrant is a shell company (as defined in Rule 12b-2 of the Exchange Act). Yes ¨ No x
The aggregate market value of voting stock held by non-affiliates of the Registrant was approximately $1,366,000,000 as of December 31, 2008 (based upon the closing sale price on The New York Stock Exchange for such date). For this purpose, all shares held by directors, executive officers and stockholders beneficially owning five percent or more of the registrant’s common stock have been treated as held by affiliates.
The number of shares of the registrant’s common stock outstanding as of August 24, 2009 was 69,580,393.
DOCUMENTS INCORPORATED BY REFERENCE
Portions of the registrant’s Proxy Statement to be delivered to stockholders in connection with our 2009 Annual Meeting of Stockholders are incorporated by reference into Part III of this Annual Report on Form 10-K to the extent stated herein.
TABLE OF CONTENTS
CAUTIONARY STATEMENT FOR PURPOSES OF THE SAFE HARBOR PROVISIONS OF
THE PRIVATE SECURITIES LITIGATION REFORM ACT OF 1995
This report contains forward-looking statements within the meaning of the federal securities laws. These forward-looking statements are identified by the use of terms and phrases such as “anticipate”, “believe”, “could”, “estimate”, “expect”, “intend” “may”, “plan”, “predict”, “project” and similar terms and phrases, including references to assumptions. However, these words are not the exclusive means of identifying such statements. These statements relate to analyses and other information that are based on forecasts of future results and estimates of amounts not yet determinable. These statements also relate to our future prospects, developments and business strategies and include, but are not limited to, statements about: increase in customer demand for our software and services; growth rates for the automobile insurance claims industry; customer adoption rates for automated claims processing software and services; increases in customer spending on automated claims processing software and services; our relationship with insurance company customers as they continue global expansion; revenue growth resulting from the launch of new software and services; improvements in operating margins resulting from operational efficiency initiatives; increased utilization of our software and services resulting from increased severity; our expectations regarding the growth rates for vehicle insurance; changes in the amount of our existing unrecognized tax benefits; our revenue mix; our income taxes; restructuring plans, potential restructuring charges and their impact on our revenues; our operating expense growth and operating expenses as a percentage of our revenues; stability of our development and programming costs; growth of our selling, general and administrative expenses; decrease of total depreciation and amortization expense; decrease in interest expense and possible impact of future foreign currency fluctuations; our use of cash and liquidity position going forward; and cash needs to service our debt.
Actual results could differ materially from those projected, implied or anticipated by our forward-looking statements. Some of the factors that could cause actual results to differ include: those set forth in “Risk Factors,” “Management’s Discussion and Analysis of Financial Condition and Results of Operations,” “Business” and elsewhere in this Annual Report on Form 10-K.
Although we believe that expectations reflected in the forward-looking statements are reasonable, we cannot guarantee future results, levels of activity, performance or achievements. All forward-looking statements included in this Annual Report on Form 10-K are based on information available to us as of the date of this report. All forward-looking statements are qualified in their entirety by this cautionary statement, and we undertake no obligation to revise or update this Annual Report on Form 10-K to reflect events or circumstances after the date hereof. You are advised, however, to consult any further disclosures that we make on related subjects in our Quarterly Reports on Form 10-Q and Periodic Reports on Form 8-K filed with the Securities and Exchange Commission (the “SEC”). You also should read the section titled “Use of Estimates” included in Note 2 of Notes to Consolidated Financial Statements included pursuant to Item 8 of this Annual Report on Form 10-K.
PART I
General
Our operations began in 1966, when Swiss Re Corporation founded our predecessor, the Claims Services Group (“CSG”). Solera Holdings, LLC was founded in March 2005 by Tony Aquila, our Chairman of the Board, Chief Executive Officer and President, and affiliates of GTCR Golder Rauner II, L.L.C. (“GTCR”), a private equity firm. In April 2006, subsidiaries of Solera Holdings, LLC acquired CSG from Automatic Data Processing, Inc. (“ADP”) for approximately $1.0 billion (the “CSG Acquisition”). We accounted for the CSG Acquisition using the purchase method of accounting. Accordingly, we allocated the aggregate acquisition consideration to the tangible and intangible assets acquired and liabilities assumed based on their respective fair values as of the date of the CSG Acquisition, which resulted in an increase in the accounting bases of some of our assets. Prior to the CSG Acquisition, Solera Holdings, LLC’s operations consisted primarily of developing our business plan, recruiting personnel, providing consulting services, raising capital and identifying and evaluating operating assets for acquisition.
In connection with our initial public offering in May 2007, we converted from Solera Holdings, LLC, a Delaware limited liability company, into Solera Holdings, Inc., a Delaware corporation, and all of the Class A Common Units and Class B Preferred Units of Solera Holdings, LLC were converted into shares of our common stock.
In November 2008, we completed a secondary public offering of 4.5 million shares of our common stock, raising $86.0 million in net proceeds which was used in the purchase of the outstanding share capital of HPI, Ltd. (“HPI”) in December 2008.
On December 19, 2008, we acquired 100% of the outstanding share capital of HPI from a subsidiary of Aviva Plc., the leading provider of used vehicle validation services in the United Kingdom. The total purchase price for the acquisition of HPI was approximately $123.1 million (£79.9 million), which consisted of cash paid at closing of $103.3 million (£67.1 million), acquisition-related expenses of $2.5 million (£1.6 million), and a subordinated note payable with a principal amount of $17.3 million (£11.3 million). We are required to make additional cash payments up to a maximum aggregate amount of approximately $7.4 million (£4.8 million) if HPI achieves certain financial performance targets through December 31, 2011.
The terms “we,” “us,” “our,” “our company” and “our business” collectively refer to: (1) the combined operations of CSG for periods prior to the CSG Acquisition, (2) the consolidated operations of Solera Holdings, LLC for the periods following the CSG Acquisition and prior to the completion of our corporate reorganization in May 2007 and (3) the consolidated operations of Solera Holdings, Inc. as of and following the corporate reorganization in May 2007. Our fiscal year ends on June 30 of each year. Fiscal years are identified in this Annual Report on Form 10-K according to the calendar year in which they end. For example, the fiscal year ended June 30, 2009 is referred to as “fiscal year 2009.”
Our Company
We are the leading global provider of software and services to the automobile insurance claims processing industry. We also provide products and services that complement our insurance claims processing software and services, including used vehicle validation and fraud detection software and services. Our insurance claims processing customers include insurance companies, collision repair facilities, independent assessors and automotive recyclers. We help our customers:
| | • | | estimate the costs to repair damaged vehicles and determine pre-collision fair market values for vehicles damaged beyond repair; |
| | • | | automate and outsource steps of the claims process that insurance companies have historically performed internally; and |
| | • | | improve their ability to monitor and manage their businesses through data reporting and analysis. |
1
As of June 30, 2009, we served over 72,000 customers and were active in more than 50 countries with approximately 2,200 employees. Our customers include more than 1,500 automobile insurance companies, 36,000 collision repair facilities, 7,000 independent assessors and 29,000 automotive recyclers and auto dealers. We derive revenues from many of the world’s largest automobile insurance companies, including each of the ten largest automobile insurance companies in Europe and nine of the ten largest automobile insurance companies in North America.
The Automobile Insurance Claims Process
An overview of the automobile insurance claims process and its complexities provides a framework for understanding how our customers can derive value from our software and services. The automobile insurance claims process generally begins following an automobile collision and consists of the following steps:
| | |
| First Notice of Loss | | • The policyholder initiates the claim process with the insurance company. • The insurance company assigns the claim to an assessor and/or a collision repair facility. |
| |
| Investigation | | • The assessor conducts interviews, examines photos and reviews police reports. |
| |
| | • The insurance company, assessor or collision repair facility estimates the cost to repair the vehicle. |
| |
| | • In the case of a heavily damaged vehicle, the assessor or collision repair facility may request a pre-accident vehicle valuation. |
| |
| Evaluation | | • The insurance company reviews the estimate and/or pre-accident valuation and confirms the results of the investigation. |
| |
| | • The insurance company may request additional information and/or require follow-up investigation. |
| |
| Decision | | • The insurance company determines whether the vehicle should be repaired or declared a total loss. |
| |
| | • Based on its evaluation, the insurance company determines who is liable for the claim and the repair or total loss amount it intends to pay. |
| |
| Settlement | | • The insurance company notifies the policyholder or the collision repair facility of the amount it intends to pay. |
| |
| | • The policyholder or collision repair facility may negotiate the final payment amount with the insurance company. |
| |
| Vehicle Repair | | • The collision repair facility repairs the vehicle if it is not a total loss. |
| |
| | • The collision repair facility purchases replacement parts from original equipment manufacturers, or OEMs, aftermarket parts makers or automotive recyclers. |
| |
| | • Further revisions to the claim payment amount may occur if additional damage or cost savings are identified. |
| |
| Payment | | • The insurance company pays the policyholder or the collision repair facility. |
Each of these steps consists of multiple actions requiring significant and complex interaction among several parties. For example, the investigation step generally involves insurance companies, assessors, collision repair facilities and automotive recyclers and includes conducting interviews, taking and examining photographs, obtaining and reviewing police reports and estimating repair costs. When performed manually, many of these tasks, such as the mailing of vehicle photographs or the estimating of vehicle repair costs, can be time-consuming. In addition, without an efficient means of communication that facilitates real-time access to data, claim-related negotiations can result in substantial delays and unnecessary costs.
2
The Automobile Insurance Claims Processing Industry
The primary participants in the automobile insurance claims processing industry with whom we do business are automobile insurance companies, collision repair facilities, independent assessors and automotive recyclers. We believe that our business is affected by trends associated with each of the following:
Automobile Insurance Industry
We estimate that the global automobile insurance industry processes more than 100 million claims each year, representing approximately $150 billion in repair costs. We believe the industry is relatively concentrated with a number of large automobile insurance companies accounting for the majority of global automobile insurance premiums. In the U.S., of the approximately 320 companies offering automobile insurance, the twenty-five largest providers accounted for over 80% of all automobile insurance premiums in 2007. The top 15 European non-life insurance companies accounted for 84% of total non-life insurance premiums in 2007.
Collision Repair Industry
The collision repair industry is highly fragmented. We estimate there are approximately 100,000 collision repair facilities in our markets. The operating costs of these facilities have increased substantially over the past decade due to continued increases in vehicle diagnostic and repair technologies and changes in environmental regulations. In addition, collision repair facilities have increasingly established preferred relationships with insurance companies. These arrangements, known in the U.S. as direct repair programs, allow collision repair facilities to generate increased repair volumes through insurance company referrals. Insurance companies benefit by establishing a trusted network of collision repair facilities across which they can negotiate labor rates and implement standard procedures and best practices. Insurance companies often require collision repair facilities to use specified automated claims processing software and related services to participate in their programs. We believe the combination of these factors will increase demand for software and services that help collision repair facilities manage their workflow and increase their efficiency.
Independent Assessors
Independent assessors are often used to estimate vehicle repair costs, particularly where automobile insurance companies have chosen not to employ their own assessors or do not have a sufficient number of employee assessors and where governments mandate the use of independent assessors.
In some markets, we believe changing government regulations and improved claims technology will result in a decrease in the number of independent assessors. However, in other markets, insurance companies are reducing their employee assessor staff to contain costs, which we believe will lead to a growth in the number of independent assessors. We believe the combination of these offsetting factors will result in a modest overall increase in the number of independent assessors and, therefore, the demand for automobile insurance claims processing software and services.
Automotive Recycling Industry
The automotive recycling industry is highly fragmented with over $25 billion in estimated worldwide annual sales by over 15,000 independent salvage and recycling facilities. Participants in the automotive recycling industry are a valuable source of economical and often hard-to-find used vehicle replacement parts. In addition, this industry has become more sophisticated and technology-driven in order to keep pace with innovations in vehicle technology. Additionally, insurance companies are increasingly mandating the use of aftermarket and recycled parts to lower the costs to repair damaged vehicles. We believe these factors will result in increased demand for automobile insurance claims processing software and services, as automotive recyclers seek to manage their workflows, maximize the value of their inventories and increase efficiency.
3
Key Drivers of Automobile Insurance Claims Processing Demand
We believe that the principal drivers of demand for our software and services are:
Inefficiencies in the Automobile Insurance Claims Process
Claims Process Fragmentation. The automobile insurance claims process involves many parties and consists of many steps, which are often managed through paper, fax and other labor intensive processes. By simplifying and streamlining the claims process, insurance companies can process claims faster and reduce costs.
Unequal Access to Information. Collision repair facilities typically have more information about vehicles in their shops than do insurance companies who often must make their damage estimates remotely or with limited information. Through access to detailed information about vehicle damage and replacement costs, insurance companies can more accurately estimate fair settlement values and reduce overpayment on claims.
Disparate Claims Data. Claims-related data generated by automobile insurance companies often is not stored, shared with other parties or captured in a format that is easily transferable to other applications. This, combined with the inability to transfer and manipulate data easily across multiple applications, hinders comparisons of repairs and claims. Increased access to data from industry participants generates more accurate repair estimates and allows automobile insurance companies to identify top-performing collision repair facilities.
Conflicting Interests of Industry Participants. Collision repair facilities benefit from high repair costs, which increase their revenues. Conversely, insurance companies benefit from low repair costs, which reduce their expenses. This conflict can result in high settlement costs and delays. Repair cost estimates that rely on common data sources can reduce these costs and delays.
Inefficient Collision Repair Facility Workflow. Many collision repair facilities manage their complex workflows manually or without specialized software. Manual workflow management leads to increased processing time, higher costs and more errors, problems that generally intensify as a facility grows. With claims processing software and services, collision repair facilities can more effectively manage their workflows and obtain detailed part availability and pricing information.
Growth in the Automobile Insurance Claims Industry
Growth in the Number of Worldwide Vehicles.According to industry sources, vehicle sales declined in calendar year 2008 and are expected to (i) decline in calendar year 2009, (ii) increase modestly in 2010 and (iii) continue to increase in 2011 and 2012. As the number of insured vehicles on the road continues to expand, we believe the need for automobile insurance claims processing products and services will continue to grow to handle increased claims activity.
In some insurance markets, such as North America and Western Europe, automobile insurance is generally government-mandated and automated claims processing is widespread. Automobile insurance companies achieve growth in these highly competitive markets by gaining additional market share, and generally compete on price and quality of policyholder service. To remain competitive, insurance companies increasingly seek additional automated claims processing products and services to minimize costs and improve policyholder service.
In other markets, such as Eastern Europe, Latin America, China and India, automobile insurance companies are growing primarily due to an increase in the number of vehicles and emerging government regulations or vehicle financing conditions that require vehicles to be insured. Many automobile insurance companies in these markets process claims manually, presenting significant opportunities for them to increase their operational efficiencies, by automating claims processing.
4
Adoption of Automated Claims Processing Software and Services. Many markets have only recently begun to adopt automated claims processing software and services to reduce inefficiencies. We anticipate that increased adoption of automated claims processing software and services in these markets will be a key driver of our growth.
The cost of automated claims processing software and services generally represents a relatively small portion of automobile insurance companies’ claims costs. We believe automobile insurance companies will increase their spending on automated claims processing software and services because incremental investments can result in significant cost reductions.
Our Software and Services
Our software and services can be organized into five general categories: estimating and workflow software, salvage and recycling software, business intelligence and consulting services, shared services and other. The majority of our customers access our software and services through a standard Web browser utilizing a “software on demand” model. By subscribing to our services, our customers can reduce upfront investments in software, hardware, implementation services and IT staff that they would typically make with traditional software solutions. Key benefits of our platform include a secure, scalable and reliable delivery platform, and total lower cost of ownership.
Estimating and Workflow Software
Our core offering is our estimating and workflow software. Our estimating and workflow software helps our customers manage the overall claims process, estimate the cost to repair a damaged vehicle, and calculate the pre-collision fair market value of a vehicle. Key functions of our estimating and workflow software include:
| | • | | capturing first notice of loss information |
| | • | | assigning, managing and monitoring claims and claim-related events |
| | • | | accessing and exchanging claims-related information |
| | • | | calculating, submitting, tracking and storing repair and total loss estimates |
| | • | | reviewing, assessing and reporting estimate variations based upon pre-set rules |
| | • | | routing shop estimates for manual review |
Salvage and Recycling Software
Our salvage and recycling software helps automotive recyclers manage their inventories in order to facilitate the location, sale and exchange of vehicle parts for use in the repair of a damaged vehicle. Key functions of our salvage and recycling software include:
| | • | | connecting to collision repair facilities to facilitate the use of recycled parts in the repair of a damaged vehicle |
| | • | | locating vehicle parts by price, year, model and/or geographic area |
| | • | | determining the interchangeability of automobile parts across vehicle models |
| | • | | exchanging vehicle parts with other recyclers |
5
| | • | | preparing invoices and managing accounts receivable |
| | • | | generating management reports |
Business Intelligence and Consulting Services
Our business intelligence and consulting services help our insurance company customers monitor and assess their performance through customized data, reports and analyses. Key elements of our business intelligence and consulting services include:
| | • | | analyzing claims amounts and payments |
| | • | | creating customized statistical reports on claims data and activity |
| | • | | measuring our customers’ performance against industry standards |
| | • | | monitoring key performance indicators, such as alternative parts utilization in the repair process and repair cycle time |
Other
We provide additional services and products to our customers, which include selling hardware for use with our software, training, and call center technical support services. We also offer services that allow our customers to access operational and technical support in times of high demand following natural disasters and software that helps detect fraudulent activity. In addition to some of the software and services described above, we provide software and services that are not directly related to the automobile insurance claims process. For example, HPI provides private car buyers, car dealers, finance houses and the insurance industry with access to information on all UK registered vehicles. Through its databases, HPI can inform a customer if a vehicle has outstanding car finance, is recorded as stolen or has previously been written-off. Through its access to the National Mileage Register, the UK’s largest database of mileages, HPI can alert car buyers and dealers to potential mileage discrepancies.
Our Databases
At the core of our software and services are our proprietary databases. Each of our databases has been adapted for use in our local markets. We have invested over $200 million in the last ten years to maintain and expand our proprietary databases. Our primary databases include our repair estimating database, our total loss database, our claims database and our parts salvage databases.
Repair Estimating Database. We have created our repair estimating database over 35 years through the development, collection, organization and management of automobile-related information. The data in this database enables our customers to estimate the cost to repair a damaged vehicle. This database:
| | • | | contains detailed cost data for each part and the required labor operations needed to complete repairs on over 4,500 vehicle types |
| | • | | covers over 98% of the vehicle models in our core markets |
| | • | | includes vehicles data dating back to 1970 |
| | • | | includes over 8.5 million parts for vehicles with multiple model years, editions, option packages and country-specific variations |
| | • | | includes over 22 million aftermarket parts |
| | • | | includes over 2.2 million graphics |
6
We update this database with data provided to us by third parties, including original equipment manufacturers, or OEMs, and aftermarket part suppliers, and automotive recyclers, along with data we develop through our proprietary analyses of local labor repair times and damage repair techniques. The quality and accuracy of the database, which are very important to each of our customers, are continuously monitored and maintained using rigorous quality control processes, which include updating over 2.5 million data points every month.
Total Loss Database. Our total loss database helps our customers determine the pre-collision fair market values of vehicles that have been damaged beyond the point where repair is economically feasible, as well as the amounts they pay policyholders for total losses. Additionally, our employees use this database to provide total loss valuation services to our customers. This database has been designed to accurately reflect the local fair market value of a vehicle rather than simply delivering a market value based on national or regional averages. Each year, we collect more than 180 million “for sale” and “sold” vehicle records from over 10,000 automobile dealer sources, which we have combined with local market purchase and sale data collected from over 3,500 different sources, including websites, local newspapers, magazines and private listings. We update this database by incorporating nearly three million data points per week which include the latest vehicle purchase and sale information including specific models, option packages, vehicle condition and mileage.
Claims Database. Our claims database enables our customers to evaluate their internal claims process performance, as well as measure the performance of their business partners. Our employees also use this database to provide consulting services to our customers and develop new software and services. Customers use this database to benchmark their performance against their local peer group through detailed analyses of comprehensive industry data. Compiled over the past 15 years, this database contains approximately two billion data points representing over 100 million automobile repair claims and over $200 billion in claims payments. We update this database by incorporating approximately 200,000 additional repair estimates every week.
Parts Salvage Databases. Our parts salvage databases contain data on approximately 140 million automobile parts through a network of approximately 3,100 automotive recyclers. These databases are used by our customers to quickly find locally available automobile parts and identify interchangeable parts across different vehicles.
Vehicle Validation Database. Our vehicle validation database supports the previously owned car market in the United Kingdom by providing private car buyers, car dealers, finance companies and the insurance industry with access to information on all vehicles registered in the United Kingdom. By using our vehicle validation database, customers can verify who the owner is, whether there is a finance-related lien, whether the vehicle has been recorded as stolen or if it has been declared a total loss by an insurance company. Data is acquired from a number of public and private data sources including the GB Driver and Vehicle Licensing Agency, motor dealers and manufacturers and finance and insurance companies. The database contains information on approximately 94 million vehicles (including 44 million vehicles currently licensed for use in the United Kingdom) and approximately 125 million mileage readings. The database is updated daily, weekly or periodically depending on the specific data element and its source.
Our Global Operations
We are active in more than 50 countries on six continents. We have organized our operations into two regional reportable segments, EMEA and Americas.
EMEA
Our EMEA operating segment accounted for approximately 63% of our revenues during fiscal year 2009. EMEA comprises our activities in over 35 countries in Europe, the Middle East, Africa, Asia and Australia.
7
Americas
Our Americas operating segment accounted for approximately 37% of our revenues during fiscal year 2009. Americas comprises our activities in over 15 countries in North, Central, and South America, as well as the Caribbean.
Geographic Financial Information
The table below sets forth the revenues we derived from the following geographic areas during each of the previous three fiscal years.
| | | | | | | | | |
| | | Fiscal Years Ended June 30, |
| | | 2009 | | 2008 | | 2007 |
| | | (in thousands) |
United States | | $ | 145,898 | | $ | 147,875 | | $ | 146,392 |
United Kingdom | | | 70,368 | | | 57,819 | | | 50,814 |
The Netherlands | | | 61,282 | | | 62,554 | | | 56,898 |
Germany | | | 55,384 | | | 52,450 | | | 46,220 |
Other | | | 224,759 | | | 219,155 | | | 171,636 |
The table below sets forth the property and equipment we held in the following geographic areas at the end of each of the previous three fiscal years.
| | | | | | | | | |
| | | Fiscal Years Ended June 30, |
| | | 2009 | | 2008 | | 2007 |
| | | (in thousands) |
United States | | $ | 20,160 | | $ | 22,554 | | $ | 26,214 |
United Kingdom | | | 13,865 | | | 8,681 | | | 8,149 |
The Netherlands | | | 160 | | | 290 | | | 311 |
Germany | | | 7,963 | | | 8,473 | | | 8,269 |
Other | | | 8,636 | | | 9,245 | | | 8,542 |
Key Competitive Strengths
Leading Global Provider
We are the leading global provider of software and services to the automobile insurance claims processing industry. We are active in more than 50 countries across six continents. In most of our markets, we believe we are either the largest or second-largest provider of automobile insurance claims processing software and services based on total revenues. The large number of geographic regions in which we operate provides us with a strategic advantage when expanding into new markets by enabling us to utilize our database and vehicle coverage already present in adjacent or nearby markets. As insurance companies continue to expand their businesses globally, our international leadership position should further position us as a single provider of automobile insurance claims processing software and services to our international insurance company customers.
Long-Standing Relationships with Customers
We have long-standing relationships with many of the world’s largest automobile insurance companies. For example, our relationships with our ten largest customers in Europe and North America date back, on average, 17 and 18 years, respectively. Our software and services are typically integrated into our customers’ systems, operations and processes, often making it costly and time-consuming for our customers to switch to another provider. These long-standing relationships have also allowed us to better understand our customers’ needs and further expand these relationships over time, both with additional software and by increasing our customer
8
support and training services. Additionally, several of our customers own minority interests in five of our local operating subsidiaries. We have found these partnerships to be effective when entering new markets as they have allowed us to collaborate more closely with our insurance company customers and rely on their local expertise to introduce, customize and market our software and services quickly and efficiently.
History of Developing New Software and Services
Since our inception, we have consistently developed and marketed new software and services in order to meet the needs of our customers. We work closely with our customers in order to determine the features and functions that they may require in the future. We have developed and introduced new software and services to the market through both internal development as well as through the acquisition and licensing of products and technology owned by third parties. For example, we recently introduced an auditing tool that allows insurance companies to identify repair estimates that should be further reviewed. We believe our focus on software development and customization creates incremental revenue opportunities as we expand the number and sophistication of the software and services that we offer.
Attractive Operating Model
We believe we have an attractive operating model due to the recurring nature of our revenues, the scalability of our databases and software and the significant operating cash flow we generate.
Contract-Based Revenues. A substantial portion of our revenues is derived from customers who have been under contract with us for several years. For fiscal year 2009, we generated over 95% of our revenues from subscription-based contracts (where we charge a monthly fee), transaction-based contracts (where we charge a fee per transaction) and subscription-based contracts with additional transaction-based fees (where we charge both a monthly fee and a fee per transaction), all of which generate recurring revenues from our customers.
Scalable Databases and Software.Our databases and software have been designed to accommodate significant additional transaction- and subscription-based volumes with limited incremental costs. The ability to generate additional revenues from increased subscription and transaction volumes without incurring substantial incremental costs provides us with opportunities to improve our operating margins.
Significant Operating Cash Flow Generation. We believe we are able to generate significant operating cash flows due to our operating margins and the relatively moderate working capital required to grow our business. The operating cash flow we generate may be used to repay debt, finance acquisitions, expand geographically or further invest in database and software innovation.
Significant Barriers to Entry
We believe that our proprietary databases pose barriers to entry due to the significant capital investment and time that would be required to develop a similar set of integrated databases and customize them for use in local markets. Our proprietary databases have been built over 35 years of developing, collecting, organizing and managing automobile related information and data. We invest over $100 million annually in developing, maintaining and enhancing our proprietary databases and product suite, and customizing them for use in local markets.
Business Strategy
Broaden the Scope of our Software and Services
We intend to further broaden the capabilities, features and functionality of our claims processing software, as well as the breadth of our service offerings. We believe that expanding the breadth of our offerings will allow us to retain and strengthen our relationships with our existing customers by helping them improve the efficiency of their claims process. We also intend to develop new software and services for our insurance company customers that can help them process claims in areas other than automobile insurance.
9
Expand Customer Base in Existing Markets
We seek to expand our customer base in existing markets by competing on the quality of our software and services, our industry expertise, and our strong industry relationships. In some markets, such as North America and Western Europe, we intend to seek new customers by competing favorably on both price and service, as well as by providing a complete suite of claims processing software and services that optimize each step of the claims process. In other markets, such as Eastern Europe, Latin America, China and India, we intend to use the combination of our local expertise with our global presence and comprehensive databases to serve new automobile insurance companies and other customers who can use our software and services to reduce claims-related costs and increase their operational efficiencies.
Expand into New Markets
As a result of recent growth in vehicle usage, regulatory and market developments, increasing penetration of automobile insurance, and rising adoption of automated claims processing by insurance companies, we believe that new markets represent significant opportunities for future growth. We have a history of successfully entering markets that previously had not used automated claims processing software and services. We intend to use this expertise to further expand in markets where we have recently established operations, such as China and India, and enter markets where we are not currently active.
Improve Operational Efficiencies
We continually seek to operate more efficiently, reduce costs and improve our operating margins primarily through productivity and technological enhancements and reduction of overhead. We have identified and targeted several operational initiatives that we plan to implement, including the elimination of database and infrastructure redundancies, technology enhancements and reduction of overhead. If implemented, we expect that these initiatives will improve our operating margins.
Pursue Strategic Acquisitions
We plan to supplement our growth by acquiring additional businesses or technologies that allow us to expand our range of services, increase our customer base or enter new markets. When evaluating these opportunities, we will consider characteristics such as recurring revenues, strong operating and financial performance, enhanced products and services, long-standing customer relationships and strong management personnel. In fiscal year 2009, we acquired three companies: US Universal Consulting Software GmbH (“UCS”), a leading provider of software and services to collision repair facilities in Germany; Inpart Services Ltda. (“Inpart”), a leading electronic exchange for the purchase and sale of vehicle replacement parts in Brazil; and HPI, the leading provider of used vehicle validation services in the United Kingdom.
Sales and Marketing
As of June 30, 2009, our sales and marketing staff included 253 full-time professionals. Our sales and marketing personnel identify and target specific sales opportunities and manage customer relationships. They also design and plan launch strategies for new software and services, and plan and facilitate customer conferences and tradeshows. Our country managers are also involved in the sales and marketing process, though they are not counted as full-time sales professionals.
Customer Support and Training
We believe that providing high quality customer support and training services is critical to our success. As of June 30, 2009, we had 384 full-time customer support and training personnel, who provide telephone support, as well as on- and off-site implementation and training. Our customer support and training staff generally consists of individuals with expertise in both our software and services and in the automobile insurance and/or collision repair industries.
10
Software and Database Development
We devote significant resources to the continued development of our software and databases. We have created sophisticated processes and tools to achieve high-quality software development and data accuracy. Our ability to maintain and grow our leading position in the automobile insurance claims processing industry is dependent upon our ability to enhance and broaden the scope of our software and services, as well as continuing to expand and improve our repair estimating, total loss, claims and parts salvage databases. We often collaborate with our customers in the development process to focus on addressing their specific needs. We then incorporate what we have learned from our customers’ workflow experiences and needs to deliver quality, workflow-oriented software and services to the marketplace quickly. We believe these efforts provide a significant competitive advantage in the development of new software and services.
As of June 30, 2009, our software development staff consisted of 450 full-time professionals across six international software development centers. As of the same date, our database staff consisted of 382 full-time professionals across five international database development centers.
Competition
We compete primarily on the value and functionality of our software and services, the integrity and breadth of our data, customer service and price. The competitive dynamics of the global automobile insurance claims processing industry vary by region, and our competitors are present in a subset of markets in which we operate. In Europe, our largest competitors include DAT, GmbH, EurotaxGlass’ Group and GT Motive Einsa Group, with whom we compete in multiple countries. In North America, our largest competitors include CCC Information Services Group Inc. in the U.S. and Mitchell International Inc. in the U.S. and Canada.
Intellectual Property and Licenses
We enter into license agreements with our customers, granting each customer a license to use our software and services while ensuring the protection of our ownership and the confidentiality of the embedded information and technology contained in our software. As a general practice, employees, contractors and other parties with access to our confidential information sign agreements that prohibit the unauthorized use or disclosure of our proprietary rights, information and technology.
We own registered trademarks and service marks that we use in connection with our software and services, including their advertising and marketing. For example, our trademark Audatex is registered in over 50 countries. In the U.S. and Canada, we market our collision damage estimating and total loss valuation software under the registered trademarks Penpro, Shoplink and Autosource.
We license much of the data used in our software and services through short-term contracts with third parties, including OEMs, aftermarket parts suppliers, data aggregators, automobile dealerships and vehicle repair facilities, to whom we pay royalties.
Employees
As of June 30, 2009, we had 2,176 associates, including 1,277 employees in our EMEA operating segment, 875 employees in our Americas operating segment, and 24 employees in corporate roles. None of our employees are subject to a collective bargaining agreement. We consider our relationships with our employees to be good.
Available Information
Our internet website address is www.solerainc.com. Our Annual Reports on Form 10-K, Quarterly Reports on Form 10-Q, Current Reports on Form 8-K and amendments to those reports filed or furnished pursuant to Section 13 or 15(d) of the Exchange Act are available free of charge through our website as soon as reasonably practicable after they are electronically filed with, or furnished to, the SEC. Our website and the information contained or incorporated therein are not intended to be incorporated into this Annual Report on Form 10-K.
11
In addition to the cautionary statement regarding forward-looking statements included above in this Annual Report on Form 10-K, we also provide the following cautionary discussion of risks and uncertainties relevant to our business. These risks and uncertainties, as well as other factors that we may not be aware of, could cause our actual results to differ materially from expected and historical results and could cause assumptions that underlie our business plans, expectations and statements in this Annual Report on Form 10-K to be inaccurate.
We depend on a limited number of customers for a substantial portion of our revenues, and the loss of, or a significant reduction in volume from, any of these customers would harm our financial results.
We derive a substantial portion of our revenues from sales to large insurance companies. During fiscal year 2009, we derived 15.6% of our revenues from our ten largest insurance company customers. The largest three of these customers accounted for 2.9%, 2.3%, and 1.9%, respectively, of our revenues during this period. A loss of one or more of these customers would result in a significant decrease in our revenues, including the business generated by collision repair facilities associated with those customers. In fiscal year 2008, we were notified by a U.S. insurance company customer that it will not renew its contract with us. During fiscal year 2009, this customer transitioned our services to another provider. The transition was completed in the fourth quarter of fiscal year 2009. This contract accounted for approximately 1.2% of revenues during fiscal year 2009. Furthermore, many of our arrangements with European customers are terminable by them on short notice or at any time. In addition, disputes with customers may lead to delays in payments to us, terminations of agreements or litigation. Additional terminations or non-renewals of customer contracts or reductions in business from our large customers would harm our business, financial condition and results of operations.
Our industry is highly competitive, and our failure to compete effectively could result in a loss of customers and market share, which could harm our revenues and operating results.
The markets for our automobile insurance claims processing software and services are highly competitive. In the U.S., our principal competitors are CCC Information Services Group Inc. and Mitchell International Inc. In Europe, our principal competitors are EurotaxGlass’s Group, DAT, GmbH and GT Motive Einsa Group. We also encounter regional or country-specific competition in the markets for automobile insurance claims processing software and services and our complementary products and services. For example Experian® is our principal competitor in the United Kingdom in the vehicle validation market. If one or more of our competitors develop software or services that are superior to ours or are more effective in marketing their software or services, our market share could decrease, thereby reducing our revenues. In addition, if one or more of our competitors retain existing or attract new customers for which we have developed new software or services, we may not realize expected revenues from these new offerings, thereby reducing our profitability.
Some of our current or future competitors may have or develop closer customer relationships, develop stronger brands, have greater access to capital, lower cost structures and/or more attractive system design and operational capabilities than we have. Consolidation within our industry could result in the formation of competitors with substantially greater financial, management or marketing resources than we have, and such competitors could utilize their substantially greater resources and economies of scale in a manner that affects our ability to compete in the relevant market or markets. As a result of consolidation, our competitors may be able to adapt more quickly to new technologies and customer needs, devote greater resources to promoting or selling their products and services, initiate and withstand substantial price competition, expand into new markets, hire away our key employees, change or limit access to key information and systems, take advantage of acquisition or other strategic opportunities more readily and develop and expand their product and service offerings more quickly than we can. In addition, our competitors may form strategic or exclusive relationships with each other and with other companies in attempts to compete more successfully against us. These relationships may increase our competitors’ ability, relative to ours, to address customer needs with their software and service offerings, which may enable them to rapidly increase their market share.
12
Moreover, many insurance companies have historically entered into agreements with automobile insurance claims processing service providers like us and our competitors whereby the insurance company agrees to use that provider on an exclusive or preferred basis for particular products and services and agrees to require collision repair facilities, independent assessors and other vendors to use that provider. If our competitors are more successful than we are at negotiating these exclusive or preferential arrangements, we may lose market share even in markets where we retain other competitive advantages.
In addition, our insurance company customers have varying degrees of in-house development capabilities, and one or more of them have expanded and may seek to further expand their capabilities in the areas in which we operate. Many of our customers are larger and have greater financial and other resources than we do and could commit significant resources to product development. Our software and services have been, and may in the future be, replicated by our insurance company customers in-house, which could result in our loss of those customers and their associated repair facilities, independent assessors and other vendors, resulting in decreased revenues and net income.
The time and expense associated with switching from our competitors’ software and services to ours may limit our growth.
The costs for an insurance company to switch providers of claims processing software and services can be significant and the process can sometimes take 12 to 18 months to complete. As a result, potential customers may decide that it is not worth the time and expense to begin using our software and services, even if we offer competitive and economic advantages. If we are unable to convince these customers to switch to our software and services, our ability to increase market share will be limited, which could harm our revenues and operating results.
Our operating results may be subject to volatility as a result of exposure to foreign currency exchange risks.
We derive most of our revenues, and incur most of our costs, including a portion of our debt service costs, in currencies other than the U.S. dollar, mainly the Euro. We currently do not hedge our exposure to foreign currency risks. In our historical financial statements, we re-measure our local currency financial results into U.S. dollars based on average exchange rates prevailing during a reporting period or the exchange rate at the end of that period. These re-measurements resulted in a net foreign currency translation adjustment of $(46.5) million for fiscal year 2009. Recent global economic conditions have impacted currency exchange rates. During fiscal year 2009, the U.S. dollar has strengthened significantly versus most major foreign currencies we use to transact our business. For example, one Euro was equal to approximately $1.58 on June 30, 2008, $1.44 on September 30, 2008, $1.41 on December 31, 2008, $1.32 on March 31, 2009 and $1.40 on June 30, 2009. The change from June 30, 2008 to June 30, 2009 represents a strengthening of the U.S. dollar versus the Euro of approximately 11.1%. Further fluctuations in exchange rates against the U.S. dollar could decrease our revenues and associated profits and, therefore, harm our future operating results.
Current uncertainty in global economic conditions makes it particularly difficult to predict product demand, utilization and other related matters and makes it more likely that our actual results could differ materially from expectations.
Our operations and performance depend on worldwide economic conditions, which have deteriorated significantly in many countries where our products and services are sold, and may remain depressed for the foreseeable future. These conditions make it difficult for our customers and potential customers to accurately forecast and plan future business activities, and could cause our customers and potential customers to slow or reduce spending on our products. In addition, external factors that affect our business have been and may continue to be impacted by the global economic slowdown. Examples include:
| | • | | Automobile Usage—Number of Miles Driven: In fiscal year 2009, the number of miles driven in the United States and several of our large western European markets declined due to higher gasoline prices and difficult economic conditions. Fewer miles driven can result in fewer automobile accidents, which can reduce the transaction-based fees that we generate. |
13
| | • | | Number of Insurance Claims Made: In fiscal year 2009, the number of insurance claims for vehicle damage submitted by owners to their insurance carriers has declined slightly in several of our markets, including some of our large western European markets. While we do not know whether the decline in the number of claims made is a result of fewer accidents, other factors, such as vehicle owners’ reluctance to pay the insurance policy deductible for vehicle repair, or a combination of factors, fewer claims made can reduce the transaction-based fees that we generate. |
| | • | | Sales of New and Used Vehicles: In fiscal year 2009, the number of new vehicles sold in the United States and most of our large western European markets declined due to higher gasoline prices and difficult economic conditions. Fewer new light vehicle sales can result in fewer insured vehicles on the road and fewer automobile accidents, which can reduce the transaction-based fees that we generate. |
| | • | | Used Vehicle Retail and Wholesale Values: Declines in retail and wholesale used vehicle values can impact vehicle owner and insurance carrier decisions about which damaged vehicles should be repaired and which should be declared a total loss. The lower the retail and wholesale used vehicle values, the more likely it is that a greater percentage of automobiles are declared a total loss versus a partial loss. The fewer number of vehicles that owners and insurance carriers decide to repair can reduce the transaction-based fees that we generate for partial-loss estimates, but may have a beneficial impact on the transaction-based fees that we generate for total-loss estimates. |
We cannot predict the timing, strength or duration of any economic slowdown or subsequent economic recovery, worldwide or in particular economic markets. These and other economic factors could have a material adverse effect on demand for or utilization of our products and on our financial condition and operating results.
We may engage in acquisitions, joint ventures, dispositions or similar transactions that could disrupt our operations, cause us to incur substantial expenses, result in dilution to our stockholders and harm our business or results of operations.
Our growth is dependent upon market growth and our ability to enhance our existing products and introduce new products on a timely basis. We have addressed and are likely to continue to address the need to introduce new products both through internal development and through acquisitions of other companies and technologies that would complement our business or enhance our technological capability. In fiscal year 2009, we acquired UCS, Inpart and HPI. Acquisitions involve numerous risks, including the following:
| | • | | adverse effects on existing customer or supplier relationships, such as cancellation of orders or the loss of key customers or suppliers; |
| | • | | difficulties in integrating or retaining key employees of the acquired company; |
| | • | | difficulties in integrating the operations of the acquired company, such as information technology resources, and financial and operational data; |
| | • | | entering geographic or product markets in which we have no or limited prior experience; |
| | • | | difficulties in assimilating product lines or integrating technologies of the acquired company into our products; |
| | • | | disruptions to our operations; |
| | • | | diversion of our management’s attention; |
| | • | | potential incompatibility of business cultures; |
| | • | | potential dilution to existing stockholders if we issue shares of common stock or other securities as consideration in an acquisition or if we issue any such securities to finance acquisitions; |
| | • | | limitations on the use of net operating losses; |
| | • | | negative market perception, which could negatively affect our stock price; |
14
| | • | | the assumption of debt and other liabilities, both known and unknown; and |
| | • | | additional expenses associated with the amortization of intangible assets or impairment charges related to purchased intangibles and goodwill, or write-offs, if any, recorded as a result of the acquisition. |
We participate in joint ventures in some countries, and we may participate in future joint ventures. Our partners in these ventures may have interests and goals that are inconsistent with or different from ours, which could result in the joint venture taking actions that negatively impact our growth in the local market and consequently harm our business or financial condition. If we are unable to find suitable partners or if suitable partners are unwilling to enter into joint ventures with us, our growth into new geographic markets may slow, which would harm our results of operations.
Additionally, we may finance future acquisitions and/or joint ventures with cash from operations, additional indebtedness and/or the issuance of additional securities, any of which may impair the operation of our business or present additional risks, such as reduced liquidity or increased interest expense. We may also seek to restructure our business in the future by disposing of certain of our assets, which may harm our future operating results, divert significant managerial attention from our operations and/or require us to accept non-cash consideration, the market value of which may fluctuate.
Our operating results may vary widely from period to period due to the sales cycle, seasonal fluctuations and other factors.
Our contracts with insurance companies generally require time-consuming authorization procedures by the customer, which can result in additional delays between when we incur development costs and when we begin generating revenues from those software or service offerings. In addition, we incur significant operating expenses while we are researching and designing new software and related services, and we typically do not receive corresponding payments in those same periods. As a result, the number of new software and service offerings that we are able to implement, successfully or otherwise, can cause significant variations in our cash flow from operations, and we may experience a decrease in our net income as we incur the expenses necessary to develop and design new software and services. Accordingly, our quarterly and annual revenues and operating results may fluctuate significantly period to period.
Our business is subject to seasonal and other fluctuations. In particular, we have historically experienced higher revenues during the second quarter and third quarter versus the first quarter and fourth quarter during each fiscal year. This seasonality is caused primarily by more days of inclement weather during the second quarter and third quarter in most of our markets, which contributes to a greater number of vehicle accidents and damage during these periods. In addition, our business is subject to fluctuations caused by other factors, including the occurrence of extraordinary weather events and the timing of certain public holidays. For example, the Easter holiday occurs during the third quarter in certain fiscal years and occurs during the fourth quarter in other fiscal years, resulting in a change in the number of business days during the quarter in which the holiday occurs.
Weather and other factors result in significant quarterly fluctuations in our financial results. We anticipate that our revenues will continue to be subject to seasonality and therefore our financial results will vary from period to period. However, actual results from operations may or may not follow these normal seasonal patterns in a given year leading to performance that is not in alignment with expectations.
We also may experience variations in our earnings due to other factors beyond our control, such as the introduction of new software or services by our competitors, customer acceptance of new software or services, the volume of usage of our offerings by existing customers, variations of vehicle accident rates due to factors such as changes in fuel prices, number of miles driven or new vehicle purchases and their impact on vehicle usage, and competitive conditions, or changes in competitive conditions, in our industry generally. We may also incur significant or unanticipated expenses when contracts expire, are terminated or are not renewed. Any of these events could harm our financial condition and results of operations and cause our stock price to decline.
15
Our industry is subject to rapid technological changes, and if we fail to keep pace with these changes, our market share and revenues will decline.
Our industry is characterized by rapidly changing technology, evolving industry standards and frequent introductions of, and enhancements to, existing software and services, all with an underlying pressure to reduce cost. Industry changes could render our offerings less attractive or obsolete, and we may be unable to make the necessary adjustments to our offerings at a competitive cost, or at all. We also incur substantial expenses in researching, developing, designing and marketing new software and services. The development or adaptation of these new technologies may result in unanticipated expenditures and capital costs that would not be recovered in the event that our new software or services are unsuccessful. The research, development, production and marketing of new software and services are also subject to changing market requirements, as well as the satisfaction of applicable regulatory requirements and customers’ approval procedures and other factors, each of which could prevent us from successfully marketing any new software and services or responding to competing technologies. The success of new software in our industry also often depends on the ability to be first to market, and our failure to be first to market with any particular software project could limit our ability to recover the development expenses associated with that project. If we cannot develop or acquire new technologies, software and services or any of our existing software or services are rendered obsolete, our revenues and income could decline and we may lose market share to our competitors, which would impact our future operations and financial results.
Changes in or violations by us or our customers of applicable government regulations could reduce demand for or limit our ability to provide our software and services in those jurisdictions.
Our insurance company customers are subject to extensive government regulations, mainly at the state level in the U.S. and at the country level in our non-U.S. markets. Some of these regulations relate directly to our software and services, including regulations governing the use of total loss and estimating software. If our insurance company customers fail to comply with new or existing insurance regulations, including those applicable to our software and services, they could lose their certifications to provide insurance and/or reduce their usage of our software and services, either of which would reduce our revenues. Also, we are subject to direct regulation in some markets, and our failure to comply with these regulations could significantly reduce our revenues or subject us to government sanctions. In addition, future regulations could force us to implement costly changes to our software and/or databases or have the effect of prohibiting or rendering less valuable one or more of our offerings. Moreover, some states in the U.S. have changed their regulations to permit insurance companies to use book valuations for total loss calculations, making our total loss software potentially less valuable to insurance companies in those states. Some states have adopted total loss regulations, that, among other things, require insurers use a methodology deemed acceptable to the respective government agency.
We submit our methodology to such agencies, and if they do not approve our methodology, we will not be able to perform total loss valuations in their respective states. Other states are considering legislation that would limit the data that our software can provide to our insurance company customers. In the event that demand for or our ability to provide our software and services decreases in particular jurisdictions due to regulatory changes, our revenues and margins may decrease.
In recent months, there has been increased momentum to create a U.S. federal government oversight mechanism for the insurance industry. There is also legislation under consideration by the U.S. legislature relating to the vehicle repair industry. Federal regulatory oversight of or legislation relating to the insurance industry in the U.S. could result in a broader impact on our business versus similar oversight or legislation at the U.S. state level.
16
We have a large amount of goodwill and other intangible assets as a result of the CSG Acquisition, the HPI acquisition and other acquisitions. Our earnings will be harmed if we suffer an impairment of our goodwill or other intangible assets.
We have a large amount of goodwill and other intangible assets and are required to perform an annual, or in certain situations a more frequent, assessment for possible impairment for accounting purposes. At June 30, 2009, we had goodwill and other intangible assets of $973.9 million. If we do not achieve our planned operating results or other factors impair these assets, we may be required to incur a non-cash impairment charge. Any impairment charges in the future will adversely affect our results of operations.
We may incur significant restructuring and severance charges in future periods, which would harm our operating results and cash position or increase debt.
We incurred restructuring charges of $5.0 million, $13.3 million and $6.0 million in fiscal years 2009, 2008 and 2007, respectively. These charges consist primarily of termination benefits paid or to be paid to employees. As of June 30, 2009, our remaining obligation associated with these restructuring charges and others from prior periods is $11.0 million. In addition, we anticipate that we incur further restructuring charges in fiscal year 2010 resulting from our continued implementation of the restructuring plan we initiated in our Americas segment in April 2009.
We regularly evaluate our existing operations and capacity, and we expect to incur additional restructuring charges as a result of future personnel reductions, related restructuring, and productivity and technology enhancements, which could exceed the levels of our historical charges. In addition, we may incur certain unforeseen costs as existing or future restructuring activities are implemented. Any of these potential charges could harm our operating results and significantly reduce our cash position.
We require a significant amount of cash to service our indebtedness, which reduces the cash available to finance our organic growth, make strategic acquisitions and enter into alliances and joint ventures; our amended and restated senior credit facility contains restrictive covenants that limit our ability to engage in certain activities.
We have a significant amount of indebtedness. As of June 30, 2009, our indebtedness, including current maturities, was $598.1 million, and we have the ability to borrow an additional $50.0 million under our amended and restated senior credit facility. During the fiscal year 2009, our aggregate interest expense was $38.6 million and cash paid for interest was $38.0 million.
Our indebtedness could:
| | • | | make us more vulnerable to unfavorable economic conditions and reduce our revenues; |
| | • | | make it more difficult to obtain additional financing in the future for working capital, capital expenditures or other general corporate purposes; |
| | • | | require us to dedicate or reserve a large portion of our cash flow from operations for making payments on our indebtedness which would prevent us from using it for other purposes including software development; |
| | • | | make us susceptible to fluctuations in market interest rates that affect the cost of our borrowings to the extent that our variable rate debt is not covered by interest rate derivative agreements; and |
| | • | | make it more difficult to pursue strategic acquisitions, joint ventures, alliances and collaborations. |
Our ability to service our indebtedness will depend on our future performance, which will be affected by prevailing economic conditions and financial, business, regulatory and other factors. Some of these factors are beyond our control. If we cannot generate sufficient cash flow from operations to service our indebtedness and to
17
meet our other obligations and commitments, we may be required to refinance our debt or to dispose of assets to obtain funds for such purpose. We cannot assure you that debt refinancings or asset dispositions could be completed on a timely basis or on satisfactory terms, if at all, or would be permitted by the terms of our debt instruments.
Our amended and restated senior credit facility contains covenants that restrict our and our subsidiaries’ ability to make certain distributions with respect to our capital stock, prepay other debt, encumber our assets, incur additional indebtedness, make capital expenditures above specified levels, engage in business combinations or undertake various other corporate activities. These covenants may also require us also to maintain certain specified financial ratios, including those relating to total leverage and interest coverage.
Our failure to comply with any of these covenants could result in the acceleration of our outstanding indebtedness under the amended and restated senior credit facility. If acceleration occurs, we would not be able to repay our debt and it is unlikely that we would be able to borrow sufficient additional funds to refinance our debt. Even if new financing is made available to us, it may not be available on acceptable or reasonable terms. An acceleration of our indebtedness would impair our ability to operate as a going concern.
Our software and services rely on information generated by third parties and any interruption of our access to such information could materially harm our operating results.
We believe that our success depends significantly on our ability to provide our customers access to data from many different sources. For example, a substantial portion of the data used in our repair estimating software is derived from parts and repair data provided by, among others, original equipment manufacturers, or OEMs, aftermarket parts suppliers, data aggregators, automobile dealerships, government organizations and vehicle repair facilities. We obtain much of our data about vehicle parts and components and collision repair labor and costs through license agreements with OEMs, automobile dealers, and other providers. EurotaxGlass’s Group, one of our primary competitors in Europe, provides us with valuation and paint data for use in our European markets pursuant to a similar arrangement, and Mitchell International, one of our primary competitors in the U.S., provides us with vehicle glass data for use in our U.S. markets pursuant to a similar arrangement. In some cases, the data included in our products and services is licensed from sole-source suppliers. Many of the license agreements through which we obtain data are for terms of one year and may be terminated without cost to the provider on short notice.
If one or more of our licenses are terminated or if we are unable to renew one or more of these licenses on favorable terms or at all, we may be unable to access the information (in the case of information licensed from sole-service suppliers) or unable to access alternative data sources that would provide comparable information without incurring substantial additional costs. Some OEM sources have indicated to us that they intend to materially increase the licensing costs for their data. While we do not believe that our access to most individual sources of data is material to our operations, prolonged industry-wide price increases or reductions in data availability could make receiving certain data more difficult and could result in significant cost increases, which would materially harm our operating results.
System failures, delays and other problems could harm our reputation and business, cause us to lose customers and expose us to customer liability.
Our success depends on our ability to provide accurate, consistent and reliable services and information to our customers on a timely basis. Our operations could be interrupted by any damage to or failure of:
| | • | | our computer software or hardware or our customers’ or third-party service providers’ computer software or hardware; |
| | • | | our networks, our customers’ networks or our third-party service providers’ networks; and |
18
| | • | | our connections to and outsourced service arrangements with third parties, such as Acxiom, which hosts data and applications for us and our customers. |
Our systems and operations are also vulnerable to damage or interruption from:
| | • | | power loss or other telecommunications failures; |
| | • | | earthquakes, fires, floods, hurricanes and other natural disasters; |
| | • | | computer viruses or software defects; |
| | • | | physical or electronic break-ins, sabotage, intentional acts of vandalism and similar events; and |
| | • | | errors by our employees or third-party service providers. |
As part of our ongoing process improvements efforts, we have and will continue to migrate product and system platforms to next generation platforms, and the risks noted above will be exacerbated by our migration efforts. Because many of our services play a mission-critical role for our customers, any damage to or failure of the infrastructure we rely on, including those of our customers and vendors, could disrupt our ability to deliver information to and provide services for our customers in a timely manner, which could result in the loss of current and/or potential customers. In addition, we generally indemnify our customers to a limited extent for damages they sustain related to the unavailability of, or errors in, the software and services we provide; therefore, a significant interruption of, or errors in, our software and services could expose us to significant customer liability.
Security breaches could result in lost revenues, litigation claims and/or harm to our reputation.
Our databases contain confidential data relating to our customers, policyholders and other industry participants. Security breaches, particularly those involving connectivity to the Internet, and the trend toward broad consumer and general public notification of such incidents, could significantly harm our business, financial condition or results of operations. Our databases could be vulnerable to physical system or network break-ins or other inappropriate access, which could result in claims against us and/or harm our reputation. In addition, potential competitors may obtain our data illegally and use it to provide services that are competitive to ours.
We are active in over 50 countries, where we are subject to country-specific risks that could adversely impact our business and results of operations.
During fiscal year 2009, we generated approximately 74% of our revenues outside the U.S. and we expect revenues from non-U.S. markets to continue to represent a majority of our total revenues. Business and operations in individual countries are subject to changes in local government regulations and policies, including those related to tariffs and trade barriers, investments, taxation, currency exchange controls and repatriation of earnings. Our results are also subject to the difficulties of coordinating our activities across more than 50 different countries. Furthermore, our business strategy includes expansion of our operations into new and developing markets, which will require even greater international coordination, expose us to additional local government regulations and involve markets in which we do not have experience or established operations. In addition, our operations in each country are vulnerable to changes in socio-economic conditions and monetary and fiscal policies, intellectual property protection disputes, the settlement of legal disputes through foreign legal systems, the collection of receivables through foreign legal systems, exposure to possible expropriation or other governmental actions, unsettled political conditions, possible terrorist attacks and pandemic disease. These and other factors may harm our operations in those countries and therefore our business and results of operations.
19
We are subject to periodic changes in the amount of our income tax provision (benefit) and these changes could adversely affect our operating results.
Our effective tax rate could be adversely affected by our mix of earnings in countries with high versus low tax rates; by changes in the valuation of our deferred tax assets and liabilities; upon the distribution of earnings from our foreign subsidiaries in the form of dividends or otherwise; by the outcomes of examinations, audits or disputes by or with relevant tax authorities, or by changes in tax laws and regulations. There are recently proposed significant changes to U.S. international tax laws which, if enacted, could have a significant adverse impact on our effective tax rate. It is unclear whether, or in what form these proposals may be enacted. Significant judgment is required to determine the recognition and measurement attribute prescribed in Financial Interpretation No. 48,Accounting for Uncertainty in Income Taxes, an interpretation of FASB Statement No. 109 (“FIN No. 48”). In addition, FIN No. 48 applies to all income tax positions, including the potential recovery of previously paid taxes, which if settled unfavorably could adversely impact our provision for income taxes or additional paid-in capital.
We have a history of net losses and may not maintain profitability in the future.
For fiscal years 2009, 2008 and 2007, we had net income (loss) of $57.8 million, $0.6 million and ($80.9) million, respectively. As of June 30, 2009, we had an accumulated deficit of approximately $52.3 million. Fiscal year 2008 was our first year since the CSG Acquisition for which we did not report a significant loss. We will need to maintain or increase revenues and maintain or reduce expenses, which include the amortization of the remaining $305.2 million of amortizable intangible assets that we had as of June 30, 2009 and interest expense associated with our indebtedness, to sustain or improve our profitability. We cannot assure you that we will achieve a significant level of profitability. Future decreases in profitability could reduce our stock price, and future net losses would reduce our stock price.
We may require additional capital in the future, which may not be available on favorable terms, or at all.
Our future capital requirements depend on many factors, including our ability to develop and market new software and services and to generate revenues at levels sufficient to cover ongoing expenses. If we need to raise additional capital, equity or debt financing may not be available at all or may be available only on terms that are not favorable to us. In the case of equity financings, dilution to our stockholders could result, and in any case such securities may have rights, preferences and privileges that are senior to our outstanding common stock. In the case of debt financings, we may have to grant additional security interests in our assets to lenders and agree to restrictive business and operating covenants. If we cannot obtain adequate capital on favorable terms or at all, we may be unable to support future growth or operating requirements and, accordingly, our business, financial condition and results of operations could be harmed.
Privacy concerns could require us to exclude data from our software and services, which may reduce the value of our offerings to our customers, damage our reputation and deter current and potential users from using our software and services.
In the European Union and other jurisdictions, there are significant restrictions on the use of personal data. Violations of these laws would harm our business. In addition, concerns about our collection, use or sharing of automobile insurance claims information or other privacy-related matters, even if unfounded, could damage our reputation and operating results.
Our business depends on our brands, and if we are not able to maintain and enhance our brands, our business and operating results could be harmed.
We believe that the brand identity that we have developed has significantly contributed to the success of our business. We also believe that maintaining and enhancing our brands, such as Audatex, ABZ, Hollander, Informex, Sidexa, HPI and IMS, are critical to the expansion of our software and services to new customers in
20
both existing and new markets. Maintaining and enhancing our brands may require us to make substantial investments and these investments may not be successful. If we fail to promote and maintain our brands or if we incur excessive expenses in this effort, our business, operating results and financial condition will be harmed. We anticipate that, as our markets become increasingly competitive, maintaining and enhancing our brands may become increasingly difficult and expensive. Maintaining and enhancing our brands will depend largely on our ability to be a technology innovator and to continue to provide high quality software and services, which we may not do successfully. To date, we have not engaged in extensive direct brand promotion activities, and we may not successfully implement brand enhancement efforts in the future.
Third parties may claim that we are infringing upon their intellectual property rights, and we could be prevented from selling our software or suffer significant litigation expense even if these claims have no merit.
Our competitive position is driven in part by our intellectual property and other proprietary rights. Third parties, however, may claim that software, products or technology, including claims data or other data, which we obtain from other parties are infringing upon the intellectual property rights of others, and we may be unaware of intellectual property rights of others that may cover some of our assets, technology, software or services. Any litigation initiated against us regarding patents, trademarks, copyrights or other intellectual property rights, even litigation relating to claims without merit, could be costly and time-consuming and could divert our management and key personnel from operating our business. In addition, if any third party has a meritorious or successful claim that we are infringing upon its intellectual property rights, we may be forced to change our software or enter into licensing arrangements with third parties, which may be costly or impractical. These claims may also require us to stop selling our software and/or services as currently designed, which could harm our competitive position. We also may be subject to significant damages or injunctions that prevent the further development and sale of certain of our software or services and may result in a material loss in revenue.
We may be unable to protect our intellectual property and property rights, either without incurring significant costs or at all, which would harm our business.
We rely on a combination of trade secrets, copyrights, know-how, trademarks, patents, license agreements and contractual provisions, as well as internal procedures, to establish and protect our intellectual property rights. The steps we have taken and will take to protect our intellectual property rights may not deter infringement, duplication, misappropriation or violation of our intellectual property by third parties. In addition, any of the intellectual property we own or license from third parties may be challenged, invalidated, circumvented or rendered unenforceable. Furthermore, the laws of some of the countries in which products similar to ours may be developed may not protect our software and intellectual property to the same extent as U.S. laws or at all. We may be unable to protect our rights in trade secrets and unpatented proprietary technology in these countries. We may also be unable to prevent the unauthorized disclosure or use of our technical knowledge or trade secrets by consultants, vendors, former employees or current employees, despite the existence of nondisclosure and confidentiality agreements and other contractual restrictions. If our trade secrets become known or we fail to otherwise protect our intellectual property, we may not receive any return on the resources expended to create the intellectual property or generate any competitive advantage based on it.
Pursuing infringers of our intellectual property could result in significant litigation costs and diversion of management resources, and any failure to pursue or successfully litigate claims against infringers could result in competitors using our technology and offering similar products and services, potentially resulting in loss of competitive advantage and decreased revenues.
Currently, we believe that one or more of our customers in our EMEA segment may be infringing our intellectual property by making and distributing unauthorized copies of our software. Enforcement of these intellectual property rights may be difficult and may require considerable resources.
21
We depend on a limited number of key personnel who would be difficult to replace. If we lose the services of these individuals, or are unable to attract new talent, our business will be adversely affected.
We depend upon the ability and experience of our key personnel, who have substantial experience with our operations, the rapidly changing automobile insurance claims processing industry and the markets in which we offer our software and services. The loss of the services of one or more of our senior executives or key employees, particularly our Chairman of the Board, Chief Executive Officer and President, Tony Aquila, could harm our business and operations. On March 30, 2009, Dudley Mendenhall replaced Jack Pearlstein as our Chief Financial Officer.
Our success depends on our ability to continue to attract, manage and retain other qualified management, sales and technical personnel as we grow. We may not be able to continue to attract or retain such personnel in the future.
Current or future litigation could have a material adverse impact on us.
We have been and continue to be involved in legal proceedings, claims and other litigation that arise in the ordinary course of business. For example, we have been involved in disputes with collision repair facilities, acting individually and as a group in some situations that claim that we have colluded with our insurance company customers to depress the repair time estimates generated by our repair estimating software. In addition, we are currently one of the defendants in a putative class action lawsuit alleging that we have colluded with our insurance company customers to cause the estimates of vehicle fair market value generated by our total loss estimation software to be unfairly low. Furthermore, we are also subject to assertions by our customers and strategic partners that we have not complied with the terms of our agreements with them or that the agreements are not enforceable against them, some of which are the subject of pending litigation and any of which could in the future lead to arbitration or litigation. While we do not expect the outcome of any such pending or threatened litigation to have a material adverse effect on our financial position, litigation is unpredictable and excessive verdicts, both in the form of monetary damages and injunction, could occur. In the future, we could incur judgments or enter into settlements of claims that could harm our financial position and results of operations.
Requirements associated with being a public company increase our costs significantly, as well as divert significant company resources and management attention.
Prior to our initial public offering in May 2007, we were not subject to the reporting requirements of the Securities Exchange Act of 1934, as amended, or the Exchange Act, or the other rules and regulations of the SEC or any securities exchange relating to public companies. We continue to work with our legal, independent accounting and financial advisors to identify those areas in which changes should be made to our financial and management control systems to manage our growth and our obligations as a public company. These areas include corporate governance, corporate control, internal audit, disclosure controls and procedures and financial reporting and accounting systems. We have made, and will continue to make, changes in these and other areas. In addition, we are monitoring proposed U.S. federal and state legislation relating to corporate governance and other regulatory matters and how the legislation could affect our obligations as a public company.
The expenses that are required as a result of being a public company are and will likely continue to be material. Compliance with the various reporting and other requirements applicable to public companies also require considerable time and attention of management. In addition, any changes we make may not be sufficient to allow us to satisfy our obligations as a public company on a timely basis.
In addition, being a public company could make it more difficult or more costly for us to obtain certain types of insurance, including directors’ and officers’ liability insurance, and we may be forced to accept reduced policy limits and coverage or incur substantially higher costs to obtain the same or similar coverage. The impact of these events could also make it more difficult for us to attract and retain qualified persons to serve on our board of directors, our board committees or as executive officers.
22
Our certificate of incorporation and by-laws contain provisions that could discourage another company from acquiring us and may prevent attempts by our stockholders to replace or remove our current management.
Some provisions of our certificate of incorporation and by-laws may have the effect of delaying, discouraging or preventing a merger or acquisition that our stockholders may consider favorable, including transactions in which stockholders may receive a premium for their shares. In addition, these provisions may frustrate or prevent any attempts by our stockholders to replace or remove our current management by making it more difficult for stockholders to replace or remove our board of directors. These provisions include:
| | • | | authorization of the issuance of “blank check” preferred stock without the need for action by stockholders; |
| | • | | the removal of directors only by the affirmative vote of the holders of two-thirds of the shares of our capital stock entitled to vote; |
| | • | | any vacancy on the board of directors, however occurring, including a vacancy resulting from an enlargement of the board, may only be filled by vote of the directors then in office; |
| | • | | inability of stockholders to call special meetings of stockholders and limited ability of stockholders to take action by written consent; and |
| | • | | advance notice requirements for board nominations and proposing matters to be acted on by stockholders at stockholder meetings. |
We are monitoring proposed U.S. federal and state legislation relating to stockholder rights and related regulatory matters and how the legislation could affect, among other things, the nomination and election of directors and our charter documents.
We recently declared our first quarterly dividend and we may not be able to pay dividends on our common stock and restricted stock units in the future; as a result, your only opportunity to achieve a return on your investment may be if the price of our common stock appreciates.
On August 27, 2009, we announced that our board of directors approved the payment of a quarterly cash dividend of $0.0625 per share outstanding of common stock and per outstanding restricted stock unit payable on September 28, 2009 to stockholders and restricted stock unit holders of record at the close of business on September 18, 2009. Any determination to pay dividends in future periods will be at the discretion of our board of directors. Our ability to pay dividends to holders of our common stock and restricted stock units in future periods may be limited by restrictive covenants under our amended and restated senior credit facility. As a result, your only opportunity to achieve a return on your investment in us could be if the market price of our common stock appreciates and you sell your shares at a profit. We cannot assure you that the market price for our common stock will ever exceed the price that you pay.
| ITEM 1B. | UNRESOLVED STAFF COMMENTS |
None.
Our corporate and Americas headquarters are located in San Diego, California, where we lease approximately 31,000 square feet of space.
Our principal leased EMEA facilities are located in Zurich, Switzerland and Zeist, the Netherlands. In addition to our corporate headquarters in San Diego, California, our principal leased Americas facilities are located in San Ramon, California; Ann Arbor, Michigan; Plymouth, Minnesota and Milwaukie, Oregon. We also lease a number of other facilities in countries where we operate. We own real estate in Minden, Germany, Brussels, Belgium, Reading, United Kingdom, Salisbury, United Kingdom and Harrogate, United Kingdom.
23
We believe that our existing space is adequate for our current operations. We believe that suitable replacement and additional space, if necessary, will be available in the future on commercially reasonable terms.
In the normal course of business, various claims, charges and litigation are asserted or commenced against us, including:
| | • | | We have from time to time been the subject of allegations that our repair estimating and total loss software and services produced results that favored our insurance company customers. |
| | • | | We are subject to assertions by our customers and strategic partners that we have not complied with the terms of our agreements with them or our agreements with them are not enforceable, some of which are the subject of pending litigation. |
We have and will continue to vigorously defend ourselves against these claims. We believe that final judgments, if any, which may be rendered against us in current litigation, are adequately reserved for, covered by insurance or would not have a material adverse effect on our financial position.
| ITEM 4. | SUBMISSION OF MATTERS TO A VOTE OF SECURITY HOLDERS |
No matters were submitted to a vote of our security holders during the fourth quarter of fiscal year 2009.
24
PART II
| ITEM 5. | MARKET FOR REGISTRANT’S COMMON EQUITY, RELATED STOCKHOLDER MATTERS AND ISSUER PURCHASES OF EQUITY SECURITIES |
Market Information
Our common stock has been traded on The New York Stock Exchange since May 16, 2007 under the symbol “SLH”. Prior to that time, there was no public market for our common stock. The following table sets forth the high and low sales prices for our common stock as reported on the New York Stock Exchange for the periods indicated.
| | | | | | |
Fiscal Year 2009 | | High | | Low |
First Quarter | | $ | 31.57 | | $ | 26.46 |
Second Quarter | | $ | 29.01 | | $ | 15.02 |
Third Quarter | | $ | 25.28 | | $ | 19.50 |
Fourth Quarter | | $ | 26.00 | | $ | 21.92 |
| | |
Fiscal Year 2008 | | High | | Low |
First Quarter | | $ | 21.23 | | $ | 17.19 |
Second Quarter | | $ | 25.45 | | $ | 18.41 |
Third Quarter | | $ | 25.69 | | $ | 21.33 |
Fourth Quarter | | $ | 28.28 | | $ | 24.16 |
Holders of Record and Dividends
As of August 24, 2009, there were approximately 31 holders of record of our common stock. We have not paid any cash dividends to date, and we recently announced that our board of directors declared our first quarterly cash dividend. Any future determination to pay dividends will be at the discretion of our board of directors. Our ability to pay dividends to holders of our common stock may be limited by restrictive covenants under our amended and restated senior credit facility.
Unregistered Sales of Equity Securities
None.
25
Equity Compensation Plan Information
The following table sets forth certain information regarding our equity compensation plans as of June 30, 2009 (shares in thousands):
| | | | | | | |
Plan Category | | Number of securities to
be issued upon exercise of
outstanding options
purchase rights and
vesting of restricted stock
units | | Weighted-average
exercise price of
outstanding options | | Number of securities
remaining available for
future issuance under
equity compensation
plans |
Equity compensation plans approved by stockholders: | | | | | | | |
2006 Securities Purchase Plan (1) | | 311 | | $ | 0.30 | | — |
2007 Long-Term Equity Incentive Plan (2) | | 1,502 | | | 23.38 | | — |
2007 Employee Stock Purchase Plan | | — | | | — | | 1,471 |
2008 Omnibus Equity Incentive Plan (2) | | 307 | | | 13.91 | | 11,965 |
Equity compensation plans not approved by stockholders | | — | | | — | | — |
| | | | | | | |
Total | | 2,120 | | | | | 13,436 |
| | | | | | | |
| (1) | In November 2006, our board of managers adopted the 2006 Securities Purchase Plan. In January and February 2007, pursuant to securities purchase agreements, 24 employees purchased common equity interests that were converted into approximately 740,000 shares of common stock. Pursuant to these agreements, the shares of stock held by these employees remains subject to vesting over a five-year period, and unvested shares remain subject to repurchase by us or, to the extent we do not repurchase, by affiliates of GTCR Golder Rauner II, L.L.C. (“GTCR”), one of our founding private equity investors, under certain circumstances. No additional equity securities will be issued under this plan. The outstanding shares under the 2006 Securities Purchase Plan as of June 30, 2009 represent unvested restricted common shares that remain subject to repurchase. |
| (2) | Following our stockholders’ approval of the 2008 Omnibus Equity Incentive Plan (the “2008 Plan”) on November 12, 2008, we ceased granting equity awards under our 2007 Long-Term Equity Incentive Plan (the “2007 Plan”). All equity awards granted after November 12, 2008 have been granted pursuant to the 2008 Plan. Subject to certain exceptions, all outstanding equity awards under the 2007 Plan that are forfeited, expired or settled in cash will be returned to and available for issuance under the 2008 Plan. Under the 2008 Plan, each restricted stock unit or award granted reduces the number of securities available for issuance under the 2008 Plan by 2.05 shares. |
26
Performance Graph
The following graph compares our cumulative total stockholder return on our common stock with the cumulative total returns of the Russell 2000 Index and an aggregate of peer issuers in the information services industry. The peer issuers used for this graph are The Thomson Corporation, Equifax Inc., The Dun & Bradstreet Corporation, FactSet Research Systems Inc., Fair Isaac Corporation, DealerTrack Holdings, Inc. and CoStar Group, Inc. Each peer issuer was weighted according to its respective capitalization on May 16, 2007, the date our common stock began trading on the New York Stock Exchange.
The graph assumes that the value of the investment in our common stock and each index was $100 on May 16, 2007.
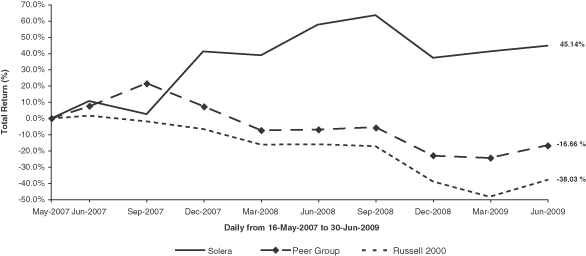
| | | | | | | | | |
| | | Cumulative Total Return |
| | | Solera
Holdings, Inc. | | Russell 2000
Index | | Information Service
Peers |
May 16, 2007 | | $ | 100.00 | | $ | 100.00 | | $ | 100.00 |
June 29, 2007 | | $ | 110.74 | | $ | 101.65 | | $ | 107.46 |
June 30, 2008 | | $ | 158.06 | | $ | 84.08 | | $ | 93.10 |
June 30, 2009 | | $ | 145.14 | | $ | 61.97 | | $ | 83.34 |
The information in the graph and table above is not “soliciting material,” is not deemed “filed” with the Securities and Exchange Commission and is not to be incorporated by reference in any of our filings under the Securities Act of 1933, as amended, or the Securities Exchange Act of 1934, as amended, whether made before or after the date of this annual report, except to the extent that we specifically incorporate such information by reference.
Issuer Purchases of Equity Securities
None.
27
| ITEM 6. | SELECTED FINANCIAL DATA |
The following table sets forth selected historical financial information regarding our business and should be read in conjunction with Item 7. “Management’s Discussion and Analysis of Financial Condition and Results of Operations” and our consolidated financial statements and the related notes included elsewhere in this Annual Report on Form 10-K.
The selected historical consolidated financial data as of June 30, 2009 and 2008 and for the fiscal years ended June 30, 2009, 2008 and 2007 are derived from our audited consolidated financial statements that are included elsewhere in this Annual Report on Form 10-K. The selected historical consolidated financial data as of June 30, 2007 and as of and for the period from April 14, 2006 to June 30, 2006 are derived from the consolidated financial statements of Solera Holdings, LLC that are not included elsewhere in this Annual Report on Form 10-K. The historical combined balance sheet data as of June 30, 2005 and the combined statements of operations and cash flows data for fiscal year 2005 and the period from July 1, 2005 through April 13, 2006 are derived from the audited combined financial statements of CSG, which are not included in this Annual Report on Form 10-K. Financial information presented reflects adjustment of assets and liabilities to the fair value at the date of the CSG Acquisition, which is used as the basis for amounts included in our results of operations from April 14, 2006 until June 30, 2006.
| | | | | | | | | | | | | | | | | | | | | | | | |
| | | Solera Holdings, Inc. | | | Claims Services Group (1) | |
| | | Fiscal Years Ended
June 30, | | | April 14 to
June 30,
2006 (2) | | | July 1, 2005
to April 13,
2006 | | | Fiscal Year Ended
June 30,
2005 | |
| | | 2009 (4) | | | 2008 | | | 2007 | | | | |
| | | (in thousands, except per share data) | |
Statement of Operations Data: | | | | | | | | | | | | | | | | | | | | | | | | |
Revenues | | $ | 557,691 | | | $ | 539,853 | | | $ | 471,960 | | | $ | 95,084 | | | $ | 335,146 | | | $ | 412,355 | |
| | | | | | | | | | | | | | | | | | | | | | | | |
Cost of revenues: | | | | | | | | | | | | | | | | | | | | | | | | |
Operating expenses | | | 128,424 | | | | 131,715 | | | | 138,345 | | | | 29,013 | | | | 101,995 | | | | 117,361 | |
Systems development and programming costs | | | 60,212 | | | | 66,666 | | | | 65,041 | | | | 15,080 | | | | 52,306 | | | | 62,690 | |
| | | | | | | | | | | | | | | | | | | | | | | | |
Total cost of revenues (excluding depreciation and amortization) | | | 188,636 | | | | 198,381 | | | | 203,386 | | | | 44,093 | | | | 154,301 | | | | 180,051 | |
Selling, general and administrative expenses | | | 162,223 | | | | 154,532 | | | | 134,545 | | | | 27,105 | | | | 87,033 | | | | 112,480 | |
Depreciation and amortization | | | 86,146 | | | | 95,266 | | | | 104,419 | | | | 23,571 | | | | 28,894 | | | | 34,335 | |
Restructuring charges (benefit) | | | 4,976 | | | | 13,286 | | | | 6,049 | | | | 2,871 | | | | (468 | ) | | | 5,512 | |
Interest expense | | | 38,565 | | | | 45,730 | | | | 69,681 | | | | 14,842 | | | | 318 | | | | 334 | |
Other (income) expense, net | | | (15,656 | ) | | | (9,518 | ) | | | 31,509 | | | | 1,836 | | | | (3,069 | ) | | | (4,065 | ) |
| | | | | | | | | | | | | | | | | | | | | | | | |
Income (loss) from continuing operations before income tax provision (benefit) and minority interests | | | 92,801 | | | | 42,176 | | | | (77,629 | ) | | | (19,234 | ) | | | 68,137 | | | | 83,708 | |
Income tax provision (benefit) | | | 26,650 | | | | 34,335 | | | | (773 | ) | | | (1,268 | ) | | | 23,688 | | | | 24,030 | |
Minority interests in net income of consolidated subsidiaries | | | 8,326 | | | | 7,243 | | | | 4,050 | | | | 921 | | | | 3,468 | | | | 1,909 | |
| | | | | | | | | | | | | | | | | | | | | | | | |
Income (loss) from continuing operations | | | 57,825 | | �� | | 598 | | | | (80,906 | ) | | | (18,887 | ) | | | 40,981 | | | | 57,769 | |
Loss from discontinued operations | | | — | | | | — | | | | — | | | | — | | | | — | | | | 128 | |
| | | | | | | | | | | | | | | | | | | | | | | | |
Net income (loss) | | | 57,825 | | | | 598 | | | | (80,906 | ) | | | (18,887 | ) | | | 40,981 | | | | 57,641 | |
Dividends and redeemable preferred unit accretion | | | — | | | | — | | | | 14,614 | | | | 88,789 | | | | — | | | | — | |
| | | | | | | | | | | | | | | | | | | | | | | | |
Net income (loss) applicable to common shares/units | | $ | 57,825 | | | $ | 598 | | | $ | (95,520 | ) | | $ | (107,676 | ) | | $ | 40,981 | | | $ | 57,641 | |
| | | | | | | | | | | | | | | | | | | | | | | | |
28
| | | | | | | | | | | | | | | | | | | | | | | | |
| | | Solera Holdings, Inc. | | | CSG (1) | |
| | | Fiscal Years Ended
June 30, | | | April 14 to
June 30,
2006 (2) | | | July 1, 2005
to April 13,
2006 | | | Fiscal Year Ended
June 30,
2005 | |
| | | 2009 | | | 2008 | | | 2007 | | | | |
| | | (in thousands, except per share data) | |
Basic net income (loss) per common share/unit | | $ | 0.86 | | | $ | 0.01 | | | $ | (2.82 | ) | | $ | (6.34 | ) | | | | | | | | |
Diluted net income (loss) per common share/unit (3) | | $ | 0.85 | | | $ | 0.01 | | | $ | (2.82 | ) | | $ | (6.34 | ) | | | | | | | | |
Weighted average common shares/units outstanding (3): | | | | | | | | | | | | | | | | | | | | | | | | |
Basic | | | 67,252 | | | | 63,500 | | | | 33,865 | | | | 16,978 | | | | | | | | | |
Diluted | | | 67,732 | | | | 64,737 | | | | 33,865 | | | | 16,978 | | | | | | | | | |
| | | | | | |
Other Financial Data: | | | | | | | | | | | | | | | | | | | | | | | | |
Capital expenditures | | $ | 19,622 | | | $ | 18,821 | | | $ | 27,230 | | | $ | 4,112 | | | $ | 9,671 | | | $ | 7,659 | |
Cash flows provided by
(used in): | | | | | | | | | | | | | | | | | | | | | | | | |
Operating activities | | | 128,874 | | | | 117,402 | | | | 46,078 | | | | 45,356 | | | | 51,325 | | | | 106,840 | |
Investing activities | | | (121,876 | ) | | | (19,135 | ) | | | (41,507 | ) | | | (936,471 | ) | | | (18,464 | ) | | | (62,975 | ) |
Financing activities | | | 76,739 | | | | (51,346 | ) | | | (6,356 | ) | | | 977,954 | | | | (82,787 | ) | | | (33,369 | ) |
| | | | | | |
Balance Sheet Data (as of end of period): | | | | | | | | | | | | | | | | | | | | | | | | |
Cash and cash equivalents | | $ | 223,420 | | | $ | 149,311 | | | $ | 89,868 | | | $ | 88,826 | | | | | | | $ | 121,313 | |
Total assets | | | 1,418,609 | | | | 1,331,755 | | | | 1,223,953 | | | | 1,253,005 | | | | | | | | 608,065 | |
Long-term debt, net of current portion | | | 592,200 | | | | 624,570 | | | | 599,128 | | | | 831,628 | | | | | | | | — | |
Total group/unitholders’/stockholders’ equity (deficit) | | | 558,939 | | | | 466,308 | | | | 401,274 | | | | (12,403 | ) | | | | | | | 399,282 | |
| (1) | CSG was owned by ADP until subsidiaries of Solera Holdings, LLC acquired it on April 13, 2006. The combined financial information of CSG for the periods prior to the CSG Acquisition are presented on a carve-out basis and reflect the assets, liabilities, revenues and expenses that were attributed or allocated to its as a business unit of ADP. The historical financial results in the combined financial statements may not be indicative of the results that would have been achieved had we operated as a stand-along entity. The combined financial statements of CSG include costs for facilities, functions and services used by CSG at ADP sites that is shared with other ADP business units and costs for certain functions and services performed by centralized ADP organizations and directly charged to CSG based on usage as well as allocations of certain expenses of ADP, including general corporate overhead, insurance, stock compensation and pension plans, royalty fees, facilities and other expenses. These allocations were based on a variety of factors. |
| (2) | The statement of operations data for fiscal year 2006 include the results of operations for our predecessor from July 1, 2005 to April 13, 2006 and the results of operations for Solera Holdings, LLC from April 14, 2006 to June 30, 2006. Financial information presented reflects adjustment of assets and liabilities to the fair value at the date of the CSG Acquisition, which is used as the basis for amounts included in our results of operations from April 14, 2006 until June 30, 2006. Prior to the acquisition, Solera Holdings, LLC’s operations consisted primarily of developing our business plan, recruiting personnel, providing consulting services, raising capital and identifying and evaluating operating assets for acquisition. |
| (3) | All unit and per unit amounts give effect to a one-for-three reverse split of our common units, which was completed on April 30, 2007. |
| (4) | The results of operations of HPI, UCS and Inpart, acquired in fiscal year 2009, are included from the respective dates of the acquisitions. |
29
| ITEM 7. | MANAGEMENT’S DISCUSSION AND ANALYSIS OF FINANCIAL CONDITION AND RESULTS OF OPERATIONS |
You should read the following discussion and analysis of our financial condition and results of operations in conjunction with our consolidated financial statements and the notes to those statements included elsewhere in this Annual Report on Form 10-K.
All percentage amounts and ratios were calculated using the underlying data in thousands. Operating results for fiscal years 2009, 2008 and 2007 are not necessarily indicative of the results that may be expected for any future period. We describe the effects on our results that are attributed to the change in foreign currency exchange rates by measuring the incremental difference between translating the current and prior period results at the monthly average rates for the same period from the prior year.
Overview of the Business
We are the leading global provider of software and services to the automobile insurance claims processing industry. We also provide products and services that complement our insurance claims processing software and services, including used vehicle validation and fraud detection software and services. Our automobile insurance claims processing customers include insurance companies, collision repair facilities, independent assessors and automotive recyclers. We help our customers:
| | • | | estimate the costs to repair damaged vehicles and determine pre-collision fair market values for vehicles damaged beyond repair; |
| | • | | automate and outsource steps of the claims process that insurance companies have historically performed internally; and |
| | • | | improve their ability to monitor and manage their businesses through data reporting and analysis. |
As of June 30, 2009, we served over 72,000 customers and were active in more than 50 countries with approximately 2,200 employees. Our customers include more than 1,500 automobile insurance companies, 36,000 collision repair facilities, 7,000 independent assessors and 29,000 automotive recyclers and auto dealers. We derive revenues from many of the world’s largest automobile insurance companies, including each of the ten largest automobile insurance companies in Europe and at least nine of the ten largest automobile insurance companies in North America.
Segments
We operate our business using two reportable segments: EMEA and Americas. Our EMEA segment consists of our operations in Europe, the Middle East, Africa, Asia and Australia. Our Americas segment consists of our operations in North, Central and South America. We do not allocate certain costs to reportable segments. These costs are managed at the corporate level and include costs related to our financing activities.
The table below sets forth our revenues by operating segment and as a percentage of our total revenues for the periods indicated (dollars in millions):
| | | | | | | | | | | | | | | | | | |
| | | Fiscal Years Ended June 30, | |
| | | 2009 | | | 2008 | | | 2007 | |
EMEA | | $ | 351.7 | | 63.1 | % | | $ | 334.2 | | 61.9 | % | | $ | 280.1 | | 59.3 | % |
Americas | | | 206.0 | | 36.9 | | | | 205.7 | | 38.1 | | | | 191.9 | | 40.7 | |
| | | | | | | | | | | | | | | | | | |
Total | | $ | 557.7 | | 100.0 | % | | $ | 539.9 | | 100.0 | % | | $ | 472.0 | | 100.0 | % |
| | | | | | | | | | | | | | | | | | |
30
Set forth below is our revenues from each of our principal customer categories and as a percentage of revenues for the periods indicated (dollars in millions):
| | | | | | | | | | | | | | | | | | |
| | | Fiscal Years Ended June 30, | |
| | | 2009 | | | 2008 | | | 2007 | |
Insurance companies | | $ | 231.9 | | 41.6 | % | | $ | 220.0 | | 40.8 | % | | $ | 207.6 | | 44.0 | % |
Collision repair facilities | | | 203.6 | | 36.5 | | | | 204.2 | | 37.8 | | | | 162.2 | | 34.4 | |
Independent assessors | | | 54.2 | | 9.7 | | | | 57.3 | | 10.6 | | | | 44.9 | | 9.5 | |
Automotive recyclers and others | | | 68.0 | | 12.2 | | | | 58.4 | | 10.8 | | | | 57.3 | | 12.1 | |
| | | | | | | | | | | | | | | | | | |
Total | | $ | 557.7 | | 100.0 | % | | $ | 539.9 | | 100.0 | % | | $ | 472.0 | | 100.0 | % |
| | | | | | | | | | | | | | | | | | |
For fiscal year 2009, the United States, the Netherlands and the United Kingdom were the only countries that individually represented more than 10% of total revenues.
The accounting policies for each of our segments are the same. We evaluate the operating performance of our segments based primarily upon their respective revenues and earnings before interest, taxes, depreciation and amortization (“EBITDA”). We generally do not evaluate our costs and expenses on a segment basis.
Components of Revenues and Expenses
Revenues
We generate revenues from the sale of software and services to our customers pursuant to negotiated contracts or pricing agreements. Pricing for our software and services is set forth in these agreements and negotiated with each customer. We generally bill our customers monthly under one or more of the following bases:
| | • | | fixed monthly amount for a prescribed number of transactions |
| | • | | fixed monthly subscription rate |
| | • | | price per set of services rendered |
| | • | | price per system delivered |
Our software and services are often sold as packages, without individual pricing for each component. Our revenues are reflected net of customer sales allowances, which we estimate based on both our examination of a subset of customer accounts and historical experience.
Our core offering is our estimating and workflow software, which is used by our insurance company, collision repair facility and independent assessor customers and which represents the majority of our revenues. Our salvage and recycling software, business intelligence and consulting services, and other offerings represent in the aggregate a smaller portion of our revenues. We believe that our estimating and workflow software will continue to represent a majority of our revenue for the foreseeable future.
Cost of Revenues (excluding depreciation and amortization)
Our costs and expenses applicable to revenues represent the total of operating expenses and systems development and programming costs, which are discussed below.
Operating Expenses
Our operating expenses include: compensation and benefit costs for our operations, database development and customer service personnel; other costs related to operations, database development and customer support functions; third-party data and royalty costs; and costs related to computer software and hardware used in the delivery of our software and services.
31
Systems Development and Programming Costs
Systems development and programming costs include compensation and benefit costs for our product development and product management personnel, other costs related to our product development and product management functions and costs related to external software consultants involved in systems development and programming activities.
Selling, General and Administrative Expenses
Our selling, general and administrative expenses include: compensation and benefit costs for our sales, marketing, administration and corporate personnel; costs related to our facilities; and professional and legal fees.
Depreciation and Amortization
Depreciation includes depreciation attributable to buildings, leasehold improvements, data processing and computer equipment, furniture and fixtures. Amortization includes amortization attributable to software purchases and software developed or obtained for internal use and our intangible assets, the majority of which were acquired in the CSG Acquisition.
Interest Expense
Interest expense consists primarily of payments of interest on our credit facilities and amortization of related debt issuance costs.
Other (Income) Expense, Net
Other (income) expense, net consists of foreign exchange gains and losses on notes receivable and notes payable to affiliates, interest income and other miscellaneous income and expense.
Minority Interests in Net Income of Consolidated Subsidiaries
Several of our customers own minority interests in five of our local operating subsidiaries. Minority interests in net income of consolidated subsidiaries reflect such customers’ proportionate interest in the earnings of such operating subsidiaries.
Income Tax Provision (Benefit)
Prior to our corporate reorganization in May 2007, we were a limited liability company and, therefore, we were not subject to entity-level federal income taxation. However, even as a limited liability company, we incurred income taxes on our operations as they were held by taxable entities in the U.S. and in foreign jurisdictions. Historical financial statements for our predecessor, which was a Subchapter C corporation for federal income tax purposes, are based on corporate tax rates for the periods presented. Prior to our corporate reorganization, our income taxes were payable by our equity holders at rates applicable to them. Following our conversion to a Subchapter C corporation, transactions recorded by us are subject to federal income taxation. Income taxes have been provided for all items included in the statements of income (loss) included herein, regardless of when such items were reported for tax purposes or when the taxes were actually paid or refunded.
32
Factors Affecting Our Operating Results
Below is a summary description of several external factors that have or may have an effect on our operating results.
Foreign currency. During fiscal years 2009, 2008 and 2007, we generated approximately 74%, 73% and 69% of our revenues, respectively, and incurred a majority of our costs, in currencies other than the U.S. dollar, primarily the Euro. We currently do not hedge our exposure to foreign currency risks. In our historical financial statements, we re-measure our local currency financial results in U.S. dollars based on average exchange rates prevailing during a reporting period or the exchange rate at the end of that period. These re-measurements resulted in foreign currency translation adjustments of $(46.5) million, $58.7 million and $4.8 million in fiscal years 2009, 2008 and 2007, respectively, which are recorded as a component of accumulated other comprehensive income in stockholders’ equity. Foreign currency transaction gains (losses) recognized in our consolidated statements of operations in fiscal years 2009, 2008 and 2007 were $1.2 million, $4.8 million and $(0.1) million, respectively.
During fiscal year 2009, the U.S. dollar strengthened significantly versus most major foreign currencies we use to transact our business. For example, one Euro was equal to approximately $1.58 on June 30, 2008, $1.44 on September 30, 2008, $1.41 on December 31, 2008, $1.32 on March 31, 2009 and $1.40 on June 30, 2009. The change from June 30, 2008 to June 30, 2009 represents a strengthening of the U.S. dollar versus the Euro of approximately 11.1%. The strengthening of the U.S. dollar had a negative comparable impact on our revenues, but a positive comparable impact on our expenses for fiscal year 2009 as compared to fiscal year 2008.
Factors that affect business volume. The following external factors have or may have an effect on the number of claims that are submitted and/or our volume of transactions, any of which can affect our revenues:
| | • | | Automobile usage—number of miles driven. Fewer miles driven can result in fewer automobile accidents, which can reduce the transaction-based fees that we generate. In fiscal year 2009, the number of miles driven in the United States and several of our large western European markets declined due to higher gasoline prices and difficult economic conditions. |
| | • | | Number of insurance claims made. In fiscal year 2009, the number of insurance claims for vehicle damage submitted by owners to their insurance carriers has declined slightly in several of our markets, including some of our large western European markets. While we do not know whether the decline in the number of claims made is a result of fewer accidents, other factors, such as vehicle owners’ reluctance to pay the insurance policy deductible for vehicle repair, or a combination of factors, fewer claims made can reduce the transaction-based fees that we generate. |
| | • | | Sales of new and used vehicles. Fewer new vehicle sales can result in fewer insured vehicles on the road and fewer automobile accidents, which can reduce the transaction-based fees that we generate. In fiscal year 2009, the number of new vehicles sold in the United States and most of our large western European markets declined due to higher gasoline prices and difficult economic conditions. |
| | • | | Used vehicle retail and wholesale values. Declines in retail and wholesale used vehicle values can impact vehicle owner and insurance carrier decisions about which damaged vehicles should be repaired and which should be declared a total loss. The lower the retail and wholesale used vehicle values, the more likely it is that a greater percentage of automobiles are declared a total loss versus a partial loss. The fewer number of vehicles that owners and insurance carriers decide to repair can reduce the transaction-based fees that we generate for partial-loss estimates, but may have a beneficial impact on the transaction-based fees that we generate for total-loss estimates. |
| | • | | Damaged vehicle repair costs. The cost to repair damaged vehicles, also known as severity, includes labor, parts and other related costs. Severity has steadily risen for a number of years. According to the Insurance Resource Council, the average severity per damaged vehicle in the United States rose by 18% from 2002 to 2006. More recently, the U.S. Department of Labor reported that the cost of motor vehicle body work for January 2009 rose by 4.1% compared to January 2008. Insurance companies |
33
| | purchase our products and services to help standardize the cost of repair. Should the cost of labor, parts and other related items continue to increase over time, insurance companies may seek to purchase and utilize an increasing number of our products and services to help improve the standardization of the cost of repair. |
| | • | | Penetration Rate of Vehicle Insurance. An increasing rate of procuring vehicle insurance will result in an increase in the number of insurance claims made for damaged vehicles. An increasing number of insurance claims submitted can increase the transaction-based fees that we generate for partial-loss and total-loss estimates. The rate of vehicle insurance is increasing in many of our less mature international markets. This is due in part to both increased regulation and increased use of financing in the purchase of new and used vehicles. We expect that the rate of vehicle insurance in our less mature international markets will continue to increase during the next eighteen months. |
| | • | | Seasonality.Our business is subject to seasonal and other fluctuations. In particular, we have historically experienced higher revenues during the second quarter and third quarter versus the first quarter and fourth quarter during each fiscal year. This seasonality is caused primarily by more days of inclement weather during the second quarter and third quarter in most of our markets, which contributes to a greater number of vehicle accidents and damage during these periods. In addition, our business is subject to fluctuations caused by other factors, including the occurrence of extraordinary weather events and the timing of certain public holidays. For example, the Easter holiday occurs during the third quarter in certain fiscal years and occurs during the fourth quarter in other fiscal years, resulting in a change in the number of business days during the quarter in which the holiday occurs. |
Non-cash charges.We incurred pre-tax, non-cash share-based compensation charges of $6.7 million, $4.8 million and $2.3 million, respectively, during fiscal years 2009, 2008 and 2007. We expect to recognize additional pre-tax, non-cash share-based compensation charges related to share-based awards outstanding at June 30, 2009 aggregating approximately $15.9 million ratably over the remaining weighted-average vesting period of 2.9 years.
In fiscal year 2007, we incurred an additional pre-tax, non-cash charge of approximately $35.7 million on the early extinguishment of debt associated with the completion of our initial public offering and the refinancing of debt. This relates primarily to the write-off of unamortized debt issuance costs and a prepayment premium on our second lien credit facility and our subordinated unsecured credit facility.
Restructuring charges.We have incurred restructuring charges in each period presented and also expect to incur additional restructuring charges, primarily relating to severance costs, over the next several quarters as we work to improve efficiencies in our business. These charges, consisting primarily of termination benefits, will reduce our cash balances. We do not expect reduced revenues or an increase in other expenses as a result of continued implementation of our restructuring initiatives.
Other factors. Other factors that have or may have an effect on our operating results include:
| | • | | gain and loss of customers; |
| | • | | acquisitions, joint ventures or similar transactions; |
| | • | | expenses to develop new software or services; |
| | • | | expenses and restrictions related to indebtedness. |
We do not believe inflation has had a material effect on our financial condition or results of operations in recent years.
34
Results of Operations
Our results of operations include the results of operations of acquired companies from the date of the respective acquisitions.
The table below sets forth our results of operations data expressed as a percentage of revenues for the periods indicated:
| | | | | | | | | |
| | | Fiscal Years Ended June 30, | |
| | | 2009 | | | 2008 | | | 2007 | |
Revenues | | 100.0 | % | | 100.0 | % | | 100.0 | % |
Cost of revenues: | | | | | | | | | |
Operating expenses | | 23.0 | | | 24.4 | | | 29.3 | |
Systems development and programming costs | | 10.8 | | | 12.3 | | | 13.8 | |
| | | | | | | | | |
Total cost of revenues (excluding depreciation and amortization) | | 33.8 | | | 36.7 | | | 43.1 | |
Selling, general & administrative expenses | | 29.1 | | | 28.6 | | | 28.5 | |
Depreciation and amortization | | 15.5 | | | 17.6 | | | 22.1 | |
Restructuring charges | | 0.9 | | | 2.5 | | | 1.3 | |
Interest expense | | 6.9 | | | 8.5 | | | 14.8 | |
Other (income) expense, net | | (2.8 | ) | | (1.7 | ) | | 6.7 | |
| | | | | | | | | |
Income (loss) before provision for income taxes and minority interests | | 16.6 | | | 7.8 | | | (16.5 | ) |
Income tax provision (benefit) | | 4.8 | | | 6.4 | | | (0.2 | ) |
Minority interest in net income of consolidated subsidiaries | | 1.5 | | | 1.3 | | | 0.9 | |
| | | | | | | | | |
Net income (loss) | | 10.4 | % | | 0.1 | % | | (17.2 | %) |
| | | | | | | | | |
The table below sets forth statement of operations data, including the amount and percentage changes for the periods indicated:
| | | | | | | | | | | | | | | | | | | | | | | | | | |
| | | Fiscal Years Ended June 30, | | | Fiscal Year 2009 to Fiscal
Year 2008 Change | | | Fiscal Year 2008 to Fiscal
Year 2007 Change | |
| | | 2009 | | | 2008 | | | 2007 | | | $ | | | % | | | $ | | | % | |
| | | (dollars in thousands) | |
Revenues | | $ | 557,691 | | | $ | 539,853 | | | $ | 471,960 | | | $ | 17,838 | | | 3.3 | % | | $ | 67,893 | | | 14.4 | % |
Cost of revenues: | | | | | | | | | | | | | | | | | | | | | | | | | | |
Operating expenses | | | 128,424 | | | | 131,715 | | | | 138,345 | | | | (3,291 | ) | | (2.5 | ) | | | (6,630 | ) | | (4.8 | ) |
Systems development and programming costs | | | 60,212 | | | | 66,666 | | | | 65,041 | | | | (6,454 | ) | | (9.7 | ) | | | 1,625 | | | 2.5 | |
| | | | | | | | | | | | | | | | | | | | | | | | | | |
Total cost of revenues (excluding depreciation and amortization) | | | 188,636 | | | | 198,381 | | | | 203,386 | | | | (9,745 | ) | | (4.9 | ) | | | (5,005 | ) | | (2.5 | ) |
Selling, general and administrative expenses | | | 162,223 | | | | 154,532 | | | | 134,545 | | | | 7,691 | | | 5.0 | | | | 19,987 | | | 14.9 | |
Depreciation and amortization | | | 86,146 | | | | 95,266 | | | | 104,419 | | | | (9,120 | ) | | (9.6 | ) | | | (9,153 | ) | | (8.8 | ) |
Restructuring charges | | | 4,976 | | | | 13,286 | | | | 6,049 | | | | (8,310 | ) | | (62.6 | ) | | | 7,237 | | | 119.6 | |
Interest expense | | | 38,565 | | | | 45,730 | | | | 69,681 | | | | (7,165 | ) | | (15.7 | ) | | | (23,951 | ) | | (34.4 | ) |
Other (income) expense, net | | | (15,656 | ) | | | (9,518 | ) | | | 31,509 | | | | (6,138 | ) | | 64.5 | | | | (41,027 | ) | | (130.2 | ) |
| | | | | | | | | | | | | | | | | | | | | | | | | | |
Income (loss) before provision for income taxes and minority interest | | | 92,801 | | | | 42,176 | | | | (77,629 | ) | | | 50,625 | | | 120.0 | | | | 119,805 | | | 154.3 | |
Income tax provision (benefit) | | | 26,650 | | | | 34,335 | | | | (773 | ) | | | (7,685 | ) | | (22.4 | ) | | | 35,108 | | | (4,541.7 | ) |
Minority interest in net income of consolidated subsidiaries | | | 8,326 | | | | 7,243 | | | | 4,050 | | | | 1,083 | | | 15.0 | | | | 3,193 | | | 78.9 | |
| | | | | | | | | | | | | | | | | | | | | | | | | | |
Net income (loss) | | $ | 57,825 | | | $ | 598 | | | $ | (80,906 | ) | | $ | 57,227 | | | 9,569.7 | % | | $ | 81,504 | | | 100.7 | % |
| | | | | | | | | | | | | | | | | | | | | | | | | | |
35
Amounts and percentages in the above table and throughout our discussion and analysis of financial conditions and results of operations may reflect rounding adjustments.
Revenues
Fiscal Year 2009 vs. Fiscal Year 2008. In fiscal year 2009, revenues increased $17.8 million, or 3.3%, and include the revenues from HPI, acquired in December 2008, of $21.1 million. After adjusting for changes in foreign currency exchange rates and excluding revenues from HPI, revenues increased $41.6 million, or 7.7%, in fiscal year 2009 resulting from growth in transaction and subscription revenues in several countries from sales to new customers and increased transaction volume from and sales of new software and services to existing customers.
Our EMEA revenues increased $17.6 million, or 5.3%, to $351.7 million and include the revenues from HPI, acquired in December 2008, of $21.1 million. After adjusting for changes in foreign currency exchange rates and excluding revenues from HPI, EMEA revenues increased $31.8 million, or 9.5%, in fiscal year 2009 resulting from growth in transaction and subscription revenues in several countries from sales to new customers and increased transaction volume from and sales of new software and services to existing customers.
Our Americas revenues increased $0.3 million, or 0.1%, to $206.0 million. After adjusting for changes in foreign currency exchange rates, Americas revenues increased $9.8 million, or 4.8%, in fiscal year 2009 resulting from growth in transaction and subscription revenues in several countries from sales to new customers and increased transaction volume from and sales of new software and services to existing customers. During fiscal year 2009, a U.S. customer that accounted for approximately 1.2% of our revenues for fiscal year 2009 completed its transition to another provider.
Fiscal Year 2008 vs. Fiscal Year 2007. In fiscal year 2008, revenues increased $67.9 million, or 14.4% (6.0% after adjusting for changes in foreign currency exchange rates), due to higher revenues in both our EMEA and Americas segments.
Our EMEA revenues increased $54.1 million, or 19.3% (7.4% after adjusting for changes in foreign currency exchange rates), to $334.2 million due to a $33.5 million increase in the value of the Euro and other currencies in which we transact business versus the U.S. dollar and a $20.6 million growth in transaction and subscription revenues in several countries from both existing and new customers.
Our Americas revenues increased $13.8 million, or 7.2% (4.0% after adjusting for changes in foreign currency exchange rates), to $205.7 million due to a $6.2 million increase in value of the non U.S. Americas currencies in which we transact business versus the U.S. dollar and a $7.6 million growth in transaction and subscription revenues in the U.S., Canada, Brazil and Mexico, partially offset by the loss of several U.S. insurance customer contracts and a reduction in contract pricing terms given to a large U.S. insurance customer. The Americas revenues in fiscal year 2007 included $5.9 million from a shared services contract that terminated in April 2007. Excluding the $5.9 million of shared services revenues for fiscal year 2007, Americas revenues increased $19.7 million, or 10.6% (7.3% after adjusting for changes in foreign currency exchange rates).
36
Revenue growth (decline) for each of our customer categories was as follows (dollars in millions):
| | | | | | | | | | | | | |
| | | Fiscal Year 2009 vs
Fiscal Year 2008 | | | Fiscal Year 2008 vs
Fiscal Year 2007 | |
Customer category | | Revenue
Growth | | | Percentage
Change | | | Revenue
Growth | | Percentage
Change | |
Insurance companies | | $ | 11.9 | | | 5.4 | % | | $ | 12.4 | | 6.0 | % |
Collision repair facilities | | | (0.6 | ) | | (0.3 | ) | | | 42.0 | | 25.9 | |
Independent assessors | | | (3.1 | ) | | (5.5 | ) | | | 12.4 | | 27.6 | |
Automotive recyclers and other | | | 9.6 | | | 16.6 | | | | 1.1 | | 1.9 | |
| | | | | | | | | | | | | |
Total | | $ | 17.8 | | | 3.3 | % | | $ | 67.9 | | 14.4 | % |
| | | | | | | | | | | | | |
Revenue growth (decline) for each of our customer categories after adjusting for changes in foreign currency exchange rates was as follows (dollars in millions):
| | | | | | | | | | | | | |
| | | Fiscal Year 2009 vs
Fiscal Year 2008 | | | Fiscal Year 2008 vs
Fiscal Year 2007 | |
Customer category | | Revenue
Growth | | Percentage
Change | | | Revenue
Growth | | | Percentage
Change | |
Insurance companies | | $ | 30.1 | | 13.7 | % | | $ | (3.3 | ) | | (1.6 | )% |
Collision repair facilities | | | 20.9 | | 10.2 | | | | 28.1 | | | 17.3 | |
Independent assessors | | | 1.3 | | 2.3 | | | | 5.9 | | | 13.0 | |
Automotive recyclers and other | | | 17.2 | | 29.5 | | | | (2.1 | ) | | (3.6 | ) |
| | | | | | | | | | | | | |
Total | | $ | 69.5 | | 12.9 | % | | $ | 28.6 | | | 6.1 | % |
| | | | | | | | | | | | | |
Operating expenses
Fiscal Year 2009 vs. Fiscal Year 2008.In fiscal year 2009, operating expenses decreased $3.3 million, or 2.5%, and include the operating expenses from HPI of $5.0 million. After adjusting for changes in foreign currency exchange rates and excluding the operating expenses of HPI, operating expenses decreased $0.9 million, or 0.7%, in fiscal year 2009 due primarily to reductions in operating expenses in our Americas segment, offset by increased operating expenses in our EMEA segment.
Our Americas operating expenses decreased $6.7 million, or 11.5%. After adjusting for changes in foreign currency exchange rates, Americas operating expenses decreased $5.4 million, or 9.4%, in fiscal year 2009 due principally to a $3.4 million decrease in personnel costs, a $1.0 million decrease in distribution costs, and a $1.2 million decrease in professional fees and outside services costs.
Our EMEA operating expenses increased $3.4 million, or 4.6%, and include the operating expenses from HPI of $5.0 million. After adjusting for changes in foreign currency exchange rates and excluding the operating expenses of HPI, EMEA operating expenses increased $4.5 million, or 6.1%, in fiscal year 2009 reflecting a $1.3 million increase in consulting fees and a $3.3 million increase in third-party license fees and other expenses.
Fiscal Year 2008 vs. Fiscal Year 2007.In fiscal year 2008, operating expenses decreased $6.6 million, or 4.8% (10.9% after adjusting for changes in foreign currency exchange rates), due to lower operating expenses in the Americas segment, partially offset by higher operating expenses in the EMEA segment.
Our Americas operating expenses decreased $8.8 million, or 13.0% (14.3% after adjusting for changes in foreign currency exchange rates), due principally to a $6.6 million decrease in personnel costs, a $1.8 million dollar decrease in distribution costs, and a $0.9 million decrease in third party license and royalty fees, partially offset by a $0.9 million increase in the value of the non U.S. Americas currencies in which we transact business versus the U.S. dollar.
37
Our EMEA operating expenses increased $2.2 million, or 3.1% (a 7.6% decrease after adjusting for changes in foreign currency exchange rates), due principally to a $7.5 million increase in the value of the Euro and other currencies in which we transact business versus the U.S. dollar and a $3.0 million increase in third party license and royalty costs, partially offset by a $5.9 million decrease in data center and external support and maintenance costs and a $1.4 million decrease in personnel costs.
We continually evaluate our operating costs in order to identify inefficiencies and eliminate unnecessary costs. We anticipate that, although our operating expenses will continue to increase, they will decline as a percentage of revenues in future years.
Systems development and programming costs
Fiscal Year 2009 vs. Fiscal Year 2008. In fiscal year 2009, systems development and programming costs (“SD&P”) decreased $6.5 million, or 9.7%, and includes the SD&P from HPI of $1.1 million. After adjusting for changes in foreign currency exchange rates and excluding the SD&P of HPI, SD&P decreased $4.7 million, or 7.1%, in fiscal year 2009 primarily due to reductions in SD&P expenses in our Americas and EMEA segments.
Our Americas SD&P decreased $4.2 million, or 16.2%. After adjusting for changes in foreign currency exchange rates, Americas SD&P decreased $3.9 million, or 14.9%, in fiscal year 2009 resulting from a decrease in personnel and consulting costs associated with the development of software updates and new software releases.
Our EMEA SD&P decreased $2.3 million, or 5.5%, and includes the SD&P of HPI of $1.1 million. After adjusting for changes in foreign currency exchange rates and excluding the SD&P from HPI, EMEA SD&P decreased $0.9 million, or 2.1%, in fiscal year 2009 due to a $0.9 million decrease in consulting costs associated with the development of software updates and new software releases.
Fiscal Year 2008 vs. Fiscal Year 2007. In fiscal year 2008, SD&P increased $1.6 million, or 2.4% (a 4.3% decrease after adjusting for changes in foreign currency exchange rates), due to higher SD&P in both our EMEA and Americas segments.
Our Americas SD&P increased $0.2 million, or 0.7% (a 0.5% decrease after adjusting for changes in foreign currency exchange rates), due to a $0.3 million increase in the value of the non U.S. Americas currencies versus the U.S. dollar and a $0.6 million increase in consulting associated with the development of software updates and new software releases, partially offset by a $0.7 million decrease in personnel costs.
Our EMEA SD&P increased $1.4 million, or 3.5% (a 6.9% decrease after adjusting for changes in foreign currency exchange rates), due principally to a $4.1 million increase in the value of the Euro and other currencies versus the U.S. dollar and a $0.7 million increase in consulting associated with the development of software updates and new software releases, partially offset by a $3.4 million decrease in personnel costs.
Our SD&P costs fluctuate based upon the levels of activity related to and timing of product releases. We expect our SD&P costs to remain relatively stable in future years.
Selling, general and administrative expenses.
Fiscal Year 2009 vs. Fiscal Year 2008. In fiscal year 2009, selling, general and administrative expenses (“SG&A”) increased $7.7 million, or 5.0%, and include the SG&A from HPI of $4.7 million. After adjusting for changes in foreign currency exchange rates and excluding the SG&A of HPI, SG&A increased $11.1 million, or 7.2%, primarily due to a $7.8 million increase in personnel and facilities costs, which primarily relates to our EMEA segment, and includes a $1.9 million increase in stock-based compensation expense, a $1.5 million increase in legal fees primarily related to acquisitions not yet completed at June 30, 2009 and therefore charged
38
to results of operations in contemplation of our adoption of Statement of Accounting Standards (“SFAS”) No. 141 (revised),Business Combinations, in the first quarter of fiscal year 2010, and a $1.4 million increase in non-income based taxes in foreign jurisdictions.
Fiscal Year 2008 vs. Fiscal Year 2007. In fiscal year 2008, SG&A increased $20.0 million, or 14.9% (8.7% after adjusting for changes in foreign currency exchange rates), due to a $8.3 million increase in the value of foreign currencies in which we transact business versus the U.S. dollar, a $5.3 million increase in consulting fees for our first year efforts to comply with Section 404 of the Sarbanes-Oxley Act, a $2.5 million increase in stock-based compensation expense, and an increase of $3.9 million in personnel costs and professional fees, including tax services.
We expect SG&A to continue to increase in the future as we continue to expand our business into new markets, incur costs related to acquisitions, similar transactions and related activities and continue to incur costs associated with being a public company.
Depreciation and amortization
Fiscal Year 2009 vs. Fiscal Year 2008 and Fiscal Year 2008 vs. Fiscal Year 2007. In fiscal year 2009, depreciation and amortization decreased by $9.1 million primarily due to lower intangibles amortization expense resulting from the CSG Acquisition, offset by the intangibles amortization expense resulting from the businesses we acquired in fiscal year 2009, including HPI, and a strengthening of the U.S. dollar versus certain foreign currencies in which we transact business which reduced depreciation and amortization which caused $4.8 million of the decrease.
In fiscal year 2008, depreciation and amortization decreased by $9.2 million primarily due to lower intangibles amortization expense resulting from the CSG Acquisition.
We generally amortize intangible assets on an accelerated basis to reflect the pattern in which the economic benefits of the intangible assets are realized. Although we expect to experience significant depreciation and amortization in the future as we amortize intangible assets resulting from the CSG Acquisition and our fiscal year 2009 acquisitions, we anticipate that the amount of total depreciation and amortization expense will continue to decline over the next several years, subject to the effect of any future acquisitions.
Restructuring charges
Fiscal Year 2009 vs. Fiscal Year 2008 and Fiscal Year 2008 vs. Fiscal Year 2007.In fiscal years 2009 and 2008, we incurred restructuring charges of $5.0 million and $13.3 million, respectively, that followed operational reviews conducted after the CSG Acquisition. These charges relate almost entirely to employee termination benefits.
We expect to incur additional restructuring charges, relating primarily to employee termination benefits and lease-related liabilities, in fiscal year 2010 and future years as we continue to implement the restructuring plan in our Americas segment initiated in April 2009 and strive to improve efficiencies in our business.
Interest expense
Fiscal Year 2009 vs. Fiscal Year 2008 and Fiscal Year 2008 vs. Fiscal Year 2007.In fiscal year 2009, interest expense decreased $7.2 million due to lower borrowings under our credit facilities.
In fiscal year 2008, interest expense decreased $24.0 million due to lower borrowings under our credit facilities, which were in part due to the refinancing transactions completed on May 16, 2007 in conjunction with our initial public offering.
39
We expect that our annual interest expense will continue to decrease as we repay outstanding indebtedness, assuming no additional borrowings, including borrowings to finance any future acquisitions.
Other (income) expense, net
Fiscal Year 2009 vs. Fiscal Year 2008 and Fiscal Year 2008 vs. Fiscal Year 2007.In fiscal year 2009, other (income) expense, net increased $6.1 million due primarily to a $9.8 million increase in the value of our foreign currency option during fiscal year 2009, including the gain recognized upon the sale of the option in November 2008, offset by a decrease in foreign currency transaction gains of $3.6 million.
In fiscal year 2008, other (income) expense, net decreased $41.0 million which was primarily due to the $28.7 million loss on debt extinguishment we incurred as a result of the May 2007 refinancing transactions.
Income tax provision
Fiscal Year 2009 vs. Fiscal Year 2008 and Fiscal Year 2008 vs. Fiscal Year 2007.In fiscal year 2009, we recorded an income tax provision of $26.7 million, which resulted in an effective tax rate of 28.7%. The decrease in the effective tax rate in fiscal year 2009 was attributable to the establishment of a full valuation allowance against our U.S. net deferred tax assets in fiscal year 2008 which caused an increase in our fiscal year 2008 income tax provision. The effective tax rate is reduced by the benefit attributable to foreign income taxed at lower rates and tax credits generated during the year.
In fiscal year 2008, we recorded an income tax provision of $34.3 million, which resulted in an effective tax rate of 81.4%. The increase in effective tax rate in fiscal year 2008 was attributable to our establishment of a full valuation allowance against our U.S. net deferred tax assets based on analysis of all available evidence, both positive and negative, including historical levels of income, expectations and risks associated with estimates of future taxable income and ongoing prudent and feasible tax planning strategies in assessing the need for the valuation allowance. The effective tax rate is reduced by the benefit attributable to foreign income taxed at lower rates and tax credits generated during the year.
Factors that impact our income tax provision include (but are not limited to) the mix of jurisdictional earnings, establishment of valuation allowances in certain jurisdictions, and varying jurisdictional income tax rates that are applied. Changes in tax laws or tax rulings may have a significantly adverse impact on our effective tax rate. There have been recent public reports regarding proposed significant changes to the U.S. international tax laws, including changes that would limit U.S. tax deductions for expenses related to un-repatriated foreign-source income and modify the U.S. foreign tax credit, that, if enacted, could have a significant adverse impact on our effective tax rate.
Liquidity and Capital Resources
Our principal sources of cash have included cash generated from operations, proceeds from our May 2007 initial public offering and our November 2008 secondary public stock offering, and borrowings under our senior secured credit facilities. Our principal uses of cash have included business combinations, debt service, capital expenditures and working capital. We expect that these will remain our principal uses of cash in the future.
In May 2007, we entered into an amended and restated senior secured credit facility, which provides us with the following borrowing commitments: a $50.0 million revolving credit facility, a $230.0 million U.S. term loan and a €280.0 million European term loan. As of June 30, 2009, we had $216.5 million and $363.0 million (€258.4 million) in outstanding loans under the U.S. term loan and European term loan, respectively, with interest rates of 2.4% and 3.1%, respectively. No borrowings were outstanding under the revolving credit facility at June 30, 2009.
40
The amended and restated senior secured credit facility contains a leverage ratio, which is applicable only to the revolving loans and applies only if at least $10.0 million of revolving loans, net of outstanding letters of credit, are outstanding for at least 10 days during the prior fiscal quarter. In addition, the amended and restated senior secured credit facility contains covenants restricting us from undertaking specified corporate actions, including asset dispositions, acquisitions, payment of dividends and other specified payments, changes of control, incurrence of indebtedness, creation of liens, making loans and investments and transactions with affiliates.
As of June 30, 2009 and 2008, we had unrestricted cash and cash equivalents and short-term investments of $235.4 million and $149.3 million, respectively.
We believe that our existing unrestricted cash, cash equivalents and short-term investments, cash flow from operating activities and borrowings under our amended and restated senior credit facilities will be sufficient to fund currently anticipated working capital, planned capital spending and debt service requirements for at least the next twelve months. We regularly review acquisition and other strategic opportunities, which may require additional debt or equity financing. We currently do not have any material pending agreements with respect to any other acquisition or strategic opportunity. If we raise additional funds by issuing equity securities, further dilution to our then-existing stockholders may result. Additional debt financing may include covenants limiting or restricting our ability to take specific actions, such as incurring additional debt, making capital expenditures or declaring dividends. Any equity or debt financing may contain terms, such as liquidation and other preferences that are not favorable to us or our stockholders.
On August 27, 2009, we announced that our board of directors approved the payment of a quarterly cash dividend of $0.0625 per share outstanding of common stock and per outstanding restricted stock unit payable on September 28, 2009 to stockholders and restricted stock unit holders of record at the close of business on September 18, 2009. Any determination to pay dividends in future periods will be at the discretion of our board of directors.
The following summarizes our primary sources and uses of cash in the periods presented:
| | | | | | | | | | | | | | | | | | | | |
| | | Amount Changed from | | | Fiscal Years Ended June 30, | |
| | | 2008 to 2009 | | | 2007 to 2008 | | | 2009 | | | 2008 | | | 2007 | |
| | | (in thousands) | |
Operating activities | | $ | 11,472 | | | $ | 71,324 | | | $ | 128,874 | | | $ | 117,402 | | | $ | 46,078 | |
Investing activities | | $ | (102,741 | ) | | $ | 22,372 | | | $ | (121,876 | ) | | $ | (19,135 | ) | | $ | (41,507 | ) |
Financing activities | | $ | 128,085 | | | $ | (44,990 | ) | | $ | 76,739 | | | $ | (51,346 | ) | | $ | (6,356 | ) |
Operating activities. The $11.5 million increase in cash provided by operating activities during fiscal year 2009 was primarily the result of an increase in net income partially offset by a decrease in the non-cash adjustments, such as depreciation and amortization, deferred income taxes and the change in the fair value of derivative financial instruments, to reconcile net income to cash, and by the changes in operating assets and liabilities.
Investing activities. The $102.7 million increase in cash used for investing activities in fiscal year 2009 included an increase in capital expenditures of $0.8 million, purchases of $11.9 million of short-term investments in fiscal year 2009, and $99.7 million of cash used in our fiscal year 2009 acquisitions, including our acquisition of HPI.
Financing activities. The $128.1 million increase in cash provided by financing activities during fiscal year 2009 was primarily due to the net proceeds from our November 2008 secondary public stock offering of $86.0 million and a $31.9 million decrease in repayments of long-term debt as a result of voluntary debt principal payments in fiscal year 2008.
41
Contractual Obligations
The following table reflects our cash contractual obligations as of June 30, 2009:
| | | | | | | | | | | | | | | |
| | | Payments Due by Period |
| | | Total | | Less than
1 Year | | 1-3 Years | | 3-5 Years | | More than
5 Years |
| | | (in thousands) |
Long-term debt obligations (1) | | $ | 707,593 | | $ | 38,464 | | $ | 77,442 | | $ | 591,687 | | $ | — |
Purchase obligations | | | 18,555 | | | 16,501 | | | 1,973 | | | 81 | | | — |
Lease obligations (2) | | | 47,634 | | | 13,000 | | | 18,406 | | | 11,873 | | | 4,355 |
| | | | | | | | | | | | | | | |
Total | | $ | 773,782 | | $ | 67,965 | | $ | 97,821 | | $ | 603,641 | | $ | 4,355 |
| | | | | | | | | | | | | | | |
| (1) | Represents principal and interest payments for our senior secured credit facilities and the note payable issued in connection with our acquisition of HPI, as well as payments on our interest rate swaps. For purposes of the table above, we calculated the interest payments on our senior secured credit facilities assuming that the interest rate in effect on the senior secured credit facilities at June 30, 2009 would remain fixed through maturity. |
| (2) | Lease obligations include operating and capital leases and are net of sublease income. |
In addition to the contractual obligations identified in the preceding table, the minority shareholders of certain of our majority-owned subsidiaries have the right to put their minority shares to us at a purchase price equal to the then-fair value of the shares. As of June 30, 2009, we estimated that the aggregate fair value of these redeemable minority interests was approximately $92 million. We also have a liability for unrecognized tax benefits of $7.8 million as of June 30, 2009. The timing of the future cash flows related to this liability are highly uncertain.
Off-Balance Sheet Arrangements and Related Party Transactions
As of June 30, 2009, we did not have any relationships with unconsolidated entities or financial partnerships, such as entities often referred to as structured finance or special purpose entities, which would have been established for the purpose of facilitating off-balance sheet arrangements or other contractually narrow or limited purposes. As such, we are not materially exposed to any financing, liquidity, market or credit risk that could arise if we had engaged in such relationships. Certain minority stockholders of our international subsidiaries are also commercial purchasers and users of our software and services. Revenue transactions with all of the individual minority stockholders in the aggregate represent approximately 6% of our consolidated revenue for fiscal year 2009 and aggregate accounts receivable from the minority stockholders represent approximately 8% of consolidated accounts receivable at June 30, 2009. The corresponding amounts for fiscal years 2008 and 2007 were less than 5%.
Critical Accounting Policies and Estimates
Our consolidated financial statements included elsewhere in this Annual Report on Form 10-K have been prepared in accordance with U.S. generally accepted accounting principles. The preparation of these financial statements requires us to make estimates and judgments that affect the amounts reported in those financial statements. On an ongoing basis, we evaluate our estimates and judgments. We base our estimates on historical experiences and assumptions which we believe to be reasonable under the circumstances. Those estimates form the basis for our judgments that affect the amounts reported in the financial statements. Actual results could differ materially from our estimates under different assumptions or conditions. Our accounting policies, many of which may be affected by our estimates and assumptions, are more fully described in Note 2 to the consolidated financial statements included elsewhere in this Annual Report on Form 10-K. We believe that the following significant accounting policies and assumptions may involve a higher degree of judgment and complexity than others.
42
Goodwill and indefinite-lived intangible assets.In accordance with Statement of Financial Accounting Standards (“SFAS”) No. 142,Goodwill and Other Intangible Assets, goodwill and intangible assets with indefinite useful lives are not amortized, but instead are tested for impairment at least annually, or more frequently if impairment indicators arise.
The Company tests goodwill for impairment annually at a reporting unit level using a two-step process. The first step of the impairment test involves comparing the fair values of the applicable reporting units with their aggregate carrying values, including goodwill. If the carrying amount of a reporting unit exceeds the reporting unit’s fair value, we then perform the second step of the goodwill impairment test to determine the amount of the impairment loss. The second step of the goodwill impairment test involves comparing the implied fair value of the affected reporting unit’s goodwill with the carrying value of that goodwill. If the carrying amount of goodwill exceeds the implied fair value of that goodwill, an impairment loss is recognized in an amount equal to that excess.
We determine the fair value of our reporting units through an income approach, utilizing a discounted cash flow model, and a market approach, which considers comparable companies and transactions. Under the income approach, the discounted cash flow model determines fair value based on the present value of projected cash flows over a specific projection period and a residual value related to future cash flows beyond the projection period. Both values are discounted to reflect the degree of risk inherent in an investment in the reporting unit and achieving the projected cash flows. A weighted average cost of capital of a market participant is used as the discount rate. The residual value is generally determined by applying a constant terminal growth rate to the estimated net cash flows at the end of the projection period. Alternatively, the present value of the residual value may be determined by applying a market multiple at the end of the projection period.
Under the market approach, fair value is determined based on multiples of revenues and earnings before interest, taxes, depreciation and amortization for each reporting unit. The multiples were determined based on a selection of comparable companies and acquisition transactions, discounted for each reporting unit to reflect the relative size, diversification and risk of the reporting unit in comparison to the indexed companies and transactions.
We test indefinite-lived intangible assets at the unit of accounting level by making a determination of the fair value of the intangible asset. If the fair value of the intangible asset is less than its carrying value, an impairment loss is recognized in an amount equal to the difference. We also evaluate the remaining useful life of our intangible assets that are not subject to amortization on an annual basis to determine whether events and circumstances continue to support an indefinite useful life. If an intangible asset that is not being amortized is subsequently determined to have a finite useful life, that asset is tested for impairment. After recognition of the impairment, if any, the asset is amortized prospectively over its estimated remaining useful life and accounted for in the same manner as other intangible assets that are subject to amortization.
We primarily determine fair value of our indefinite-lived intangible assets under an income approach that utilizes a discounted cash flow model.
As of June 30, 2009 and 2008, we had goodwill of $651.1 million and $646.1 million, respectively, and indefinite-lived intangible assets of $17.7 million and $0, respectively.
Long-lived assets. In accordance with SFAS No. 144,Accounting for the Impairment or Disposal of Long-Lived Assets, long-lived assets, including intangible assets with finite lives and property and equipment, are reviewed for impairment whenever events or changes in circumstances indicate that the carrying amount of an asset may not be recoverable. Conditions that would necessitate an impairment assessment include a significant decline in the market price of an asset or asset group, a significant adverse change in the extent or manner in which an asset or asset group is being used, the loss of legal ownership or title to the asset, significant negative industry or economic trends or the presence of other factors that would indicate that the carrying amount of an
43
asset or asset group is not recoverable. A long-lived asset is considered to be impaired if the estimated undiscounted future cash flows resulting from the use of the asset and its eventual disposition are not sufficient to recover the carrying value of the asset.
Revenue recognition.We recognize and present revenue in accordance with SEC Staff Accounting Bulletin (“SAB”) Topic 13,Revenue Recognition, American Institute of Certified Public Accountants (“AICPA”) Statement of Position (“SOP”) No. 97-2,Software Revenue Recognition, as amended, SFAS No. 13,Accounting for Leases, Emerging Issues Task Force (“EITF”) Issue No. 01-8,Determining Whether an Arrangement Contains a Lease, EITF Issue No. 00-03,Application of AICPA Statement of Position No. 97-2 to Arrangements That Include the Right to Use Software Stored on Another Entity’s Hardware, EITF Issue No. 00-21,Revenue Arrangements with Multiple Deliverables, and EITF No. 99-19,Reporting Revenue Gross as a Principal versus Net as an Agent. Accordingly, revenues are recognized only after services are provided, when persuasive evidence of an arrangement exists, the fee is fixed and determinable, and when collectability is probable. Our multiple element arrangements primarily include a combination of software licenses, hosted database and other services, installation and set-up services, hardware, maintenance services and transaction-based deliverables.
We generate a significant majority of our revenue from subscription-based contracts (where a monthly fee is charged), transaction-based contracts (where a fee per transaction is charged) and subscription-based contracts with additional transaction-based fees (where a monthly fee and a fee per transaction are charged).
Subscription-based and transaction-based contracts generally include the delivery of software, access to software through a hosted service (“Hosted Database”), upfront fees for the implementation and set-up activities necessary for the client to use/access the software (“Implementation Services”) and maintenance. Under a subscription arrangement, delivery of software, access to the Hosted Database and maintenance are considered a single element or a combined unit of accounting and related revenues are recognized at the end of each month upon the completion of the monthly service. Revenues under transaction-based contracts are recognized based on the guidance in AICPA Technical Practice Aid No. 5100.76,Fair value in multiple-element arrangements that include contingent usage based fees and software revenue recognition. The transaction-based fee represents payment for the right to use the software, access to the Hosted Database and maintenance. The fee is considered fixed and determinable only at the time actual usage occurs. Revenue is recognized based on actual usage. Implementation Services are considered a separate element or unit of accounting and the related revenue recognition is described below.
Subscription-based contracts with additional fees for certain types of transactions generally include all deliverables discussed in the above paragraph and also include an additional element, which is the option to access specialized queries on the Hosted Database. Revenue under subscription-based contracts with additional fees for certain types of transactions is accounted for based on the guidance in AICPA Technical Practice Aid No. 5100.76. Under these arrangements, the delivery of software, access to software through the Hosted Database and maintenance are considered a combined unit of accounting, and the related fee is recognized at the end of each month upon the completion of the monthly service. The transaction-based fee is recognized at the time of actual usage. Implementation Services are considered a separate element or unit of accounting and the related revenue recognition is described below.
When we are required to perform setup and implementation activities necessary for the client to receive services/software, up-front fees billed during the setup/implementation phase are deferred and amortized on a straight-line basis over the estimated customer life. The upfront fees represent fair value of the implementation services based on vendor specific objective evidence. The amortization of this deferred revenue will commence upon the start of the monthly service. Setup costs that are direct and incremental to the contract are capitalized and amortized on a straight-line basis over the estimated customer life.
In a limited number of our revenue arrangements, we also provide generic computer equipment as part of the sales arrangement. Based on guidance in EITF Issue No. 03-5,Applicability of SOP No. 97-2, “Software
44
Revenue Recognition”, to Non-Software Deliverables in an Arrangement Containing More-than-IncidentalSoftware, the generic computer equipment is considered a non-software deliverable since our software is not essential to the functionality of the generic computer equipment. We account for the sale of generic equipment as a direct finance lease. The related revenue is recognized over the term of the contract using the effective interest rate method. We allocate revenue to the elements of these arrangements on a relative fair value basis using our best estimate of the fair value of the elements. Revenue from leased computer equipment represents approximately 1% of our consolidated revenue.
Revenues are reflected net of customer sales allowances, which are based on both specific identification of certain accounts and a predetermined percentage of revenue based on historical experience.
Stock-Based Compensation. Effective July 1, 2006, we adopted SFAS No. 123 (revised 2004),Share-Based Payments, (“SFAS No. 123(R)”), which requires the measurement and recognition of compensation expense for all stock-based payment awards made to employees and directors, including employee stock options, restricted stock units and restricted share awards, based on estimated fair values recognized over the requisite service period. Prior to adoption of SFAS No. 123(R), pursuant to SFAS No. 123,Accounting for Stock-BasedCompensation, we accounted for employee share awards under Accounting Principles Board (“APB”) No. 25,Accounting for Stock Issued to Employees, and followed the disclosure-only provisions of SFAS No. 123.
We estimate the fair value on the date of grant using the Black-Scholes option-pricing model. The Black-Scholes option-pricing model requires the use of certain input variables, as follows:
Expected Volatility. Volatility is a measure of the amount the stock price will fluctuate during the expected life of an award. We determine the expected volatility based on a combination of implied market volatilities, historical volatility of our stock price and other factors.
Risk-Free Interest Rate. Our assumption of the risk-free interest rate is based on the implied yield available on U.S. constant rate treasury securities in effect at the time of the grant with remaining terms equivalent to the respective expected terms of the share-based award.
Expected Dividend Yield. Because we have not paid any cash dividends since our inception, we have historically assumed a dividend yield of zero.
Expected Award Life.Because we have a limited history of stock option exercises, we determine the expected award life using the “simplified method” described in SEC Staff Accounting Bulletin No. 110,Share-Based Payments.
Under SFAS No. 123(R), we are also required to estimate at the grant date the likelihood that the award will ultimately vest (the “pre-vesting forfeiture rate”), and revise the estimate, if necessary, in future periods if the actual forfeiture rate differs. We determine the pre-vesting forfeiture rate of an award based on industry and employee turnover data as well as an historical pre-vesting forfeitures occurring over the previous year. Under the true-up provisions of SFAS No. 123(R), we recognize additional share-based compensation expense if the actual forfeiture rate is lower than estimated and a recovery of previously recognized share-based compensation expense if the actual forfeiture rate is higher than estimated.
Income taxes. We use the asset and liability method of accounting for income taxes in accordance with SFAS No. 109,Accounting for Income Taxes.Under this method, income tax expenses or benefits are recognized for the amount of taxes payable or refundable for the current year and for deferred tax liabilities and assets for the future tax consequences of events that have been recognized in our consolidated financial statements or tax returns. We also account for any uncertain income tax positions in accordance with Financial Accounting Standards Board (“FASB”) Interpretation (“FIN”) No. 48,Accounting for Uncertainty in Income Taxes, an interpretation of FASB statement. The measurement of current and deferred tax assets and liabilities are based on
45
provisions of currently enacted tax laws. The effects of future enactments of changes in tax laws or rates are not contemplated.
In addition, the calculation of our tax liabilities involves dealing with uncertainties in the application of complex tax regulations. We recognize liabilities for anticipated tax audit issues in the United States and other tax jurisdictions based on our estimate of whether, and the extent to which, additional tax payments are probable. If we ultimately determine that payment of these amounts is unnecessary, we reverse the liability and recognize a tax benefit during the period in which we determine that the liability is no longer necessary. This may occur for a variety of reasons, such as the expiration of the statute of limitations with respect to a particular tax return or the signing of a final settlement agreement with the respective tax authority. We record an additional charge in our provision for taxes in the period in which we determine that the recorded tax liability is less than we expect the ultimate assessment to be.
As part of the process of preparing consolidated financial statements, we are required to estimate our income taxes and tax contingencies in each of the jurisdictions in which we operate prior to the completion and filing for tax returns for such periods. This process involves estimating actual current tax expense together with assessing temporary differences, or reversing book-tax differences, resulting from differing treatment of items, such as deferred revenue, for tax and accounting purposes. These differences result in net deferred tax assets and liabilities. We must then assess the likelihood that the deferred tax assets will be realizable and to the extent we believe that realizability does not meet the more likely than not standard, we must establish a valuation allowance. To the extent we establish a valuation allowance in a period, we must include a tax expense or benefit within the tax provision in the statement of operations unless a current year valuation allowance is allocated to an item of equity. In the event that actual results differ from these estimates or we adjust these estimates in future periods, we may need to adjust our valuation allowances, which could impact our results of operations in the quarter in which such determination is made.
At June 30, 2009, we had our gross deferred tax assets of approximately $39.6 million, including $10.6 million of net operating losses generated in the U.S. and result primarily from interest expense under our debt agreements.
We consider all available evidence, both positive and negative, including historical levels of income, expectations and risks associated with estimates of future taxable income and ongoing prudent and feasible tax planning strategies in assessing the need for the valuation allowance. As a result of our analysis of all available evidence as of June 30, 2009, it was concluded that it was not more likely than not that our deferred tax assets, primarily in the U.S., would be realized and, accordingly, we have maintained a valuation allowance against our deferred tax assets in the amount of $38.0 million.
Derivative financial instruments. Derivative financial instruments are used principally in the management of foreign currency and interest rate exposures and are recorded in the consolidated balance sheets at fair value. If the derivative is designated as a fair value hedge, the changes in the fair value of the derivative and of the hedged item attributable to the hedged risk are recognized as a charge or credit to earnings. If the derivative is designated as a cash flow hedge, the effective portions of the changes in the fair value of the derivative are initially recorded in accumulated other comprehensive income (loss) and are subsequently reclassified into earnings when the hedged transactions occur and affect earnings. Ineffective portions of changes in the fair value of cash flow hedges are recognized as a charge or credit to earnings. Derivative instruments not designated as hedges are marked-to-market at the end of each accounting period with the results included in results of operations.
Our derivative financial instruments at June 30, 2009 consisted entirely of interest rate swaps. These interest rate swaps were designated and documented at their inception as cash flow hedges and are evaluated for effectiveness quarterly. The effective portion of the gain or loss on these hedges is reported as a component of accumulated other comprehensive (loss) income in stockholders’ equity and reclassified into earnings when the
46
hedged transaction affects earnings. The ineffective portion of these cash flow hedges is recognized in interest expense.
We estimate the fair value of our interest rate swaps using industry standard valuation techniques to extrapolate future reset rates from period-end yield curves and standard valuation models based on the Black-Scholes option valuation model. Market-based observable inputs including spot and forward rates, volatilities and interest rate curves at observable intervals are used as inputs to the models.
Recent Accounting Pronouncements
In June 2009, the FASB issued SFAS No. 168,The FASB Accounting Standards Codification and the Hierarchy of Generally Accepted Accounting Principles—a replacement of FASB Statement No. 162. The FASB Accounting Standards Codification (“Codification”) will become the source of authoritative U.S. generally accepted accounting principles (“GAAP”) recognized by the FASB to be applied by nongovernmental entities. Rules and interpretive releases of the SEC under authority of federal securities laws are also sources of authoritative GAAP for SEC registrants. On the effective date of SFAS No. 168, the Codification will supersede all then-existing non-SEC accounting and reporting standards. All other non-grandfathered non-SEC accounting literature not included in the Codification will become nonauthoritative. We do not expect our adoption of SFAS No. 168 in the first quarter of fiscal year 2010 to have a material effect on our consolidated results of operations or financial condition.
In May 2009, the FASB issued SFAS No. 165,Subsequent Events. SFAS No. 165 is intended to establish general standards of accounting for and disclosure of events that occur after the balance sheet date but before financial statements are issued or are available to be issued. It requires the disclosure of the date through which an entity has evaluated subsequent events and the basis for selecting that date, that is, whether that date represents the date the financial statements were issued or were available to be issued. We adopted SFAS No. 165 in the fourth quarter of fiscal year 2009. The disclosures required by SFAS No. 165 are provided in Note 1 to our consolidated financial statements included elsewhere in this Annual Report on Form 10-K.
In December 2008, the FASB issued Staff Position (“FSP”) No. FAS 132R-1,Employers’ Disclosures about Postretirement Benefit Plan Assets. FSP No. FAS 132R-1 amends SFAS No. 132R,Employers’ Disclosures about Postretirement Benefit Plan Assets, to provide for additional disclosure and documentation surrounding benefit plan assets and activities in annual disclosures. We expect that our adoption of FSP No. FAS 132R-1 in our consolidated financial statements for fiscal year 2010 will result in additional disclosures regarding our defined benefit pension plans.
In June 2008, the FASB issued FSP No. EITF 03-6-1,Determining Whether Instruments Granted in Share-Based Payment Transactions Are Participating Securities, which requires participating securities such as unvested restricted stock units containing nonforfeitable rights to receive dividends, whether paid or unpaid, to be included in the computation of earnings pursuant to the two-class method prescribed under SFAS No. 128,Earnings per Share. We are required to adjust all prior period earnings per share data on a retrospective basis to conform with the provisions of FSP No. EITF 03-6-1. This standard is effective for our first quarter of fiscal year 2010. We are currently assessing the impact of adopting FSP No. EITF 03-6-1.
In April 2008, the FASB issued FSP No. FAS 142-3,Determination of the Useful Life of Intangible Assets, which amends the factors that should be considered in developing renewal or extension assumptions used to determine the useful life of a recognized intangible asset under SFAS No. 142. The intent of the statement is to improve the consistency between the useful life of a recognized intangible asset and the period of expected cash flows used to measure the fair value of the asset. We will adopt FSP No. FAS 142-3 in the first quarter of fiscal year 2010. We are currently evaluating the potential impact, if any, that the adoption of FSP No. FAS 142-3 will have on our consolidated financial position, results of operations and cash flows.
47
In March 2008, the FASB issued SFAS No. 161, Disclosures about Derivative Instruments and Hedging Activities, an amendment of FASB Statement No. 133. SFAS No. 161 is intended to improve transparency in financial reporting by requiring enhanced disclosures of an entity’s derivative instruments and hedging activities and their effects on the entity’s financial position, financial performance, and cash flows. SFAS No. 161 applies to all derivative instruments within the scope of SFAS No. 133,Accounting for Derivative Instruments and Hedging Activities, as well as related hedged items, bifurcated derivatives, and nonderivative instruments that are designated and qualify as hedging instruments. Entities with instruments subject to SFAS No. 161 must provide more robust qualitative disclosures and expanded quantitative disclosures. We adopted SFAS No. 161 in fiscal year 2009. The disclosures required by SFAS No. 161 are provided in Note 8 to our consolidated financial statements included elsewhere in this Annual Report on Form 10-K.
In December 2007, the FASB issued SFAS No. 160,Noncontrolling Interests in Consolidated Financial Statements, an amendment of ARB 51. SFAS No. 160 establishes accounting and reporting standards for ownership interests in subsidiaries held by parties other than the parent, the amount of consolidated net income attributable to the parent and to the noncontrolling interest, changes in a parent’s ownership interest, and the valuation of retained noncontrolling equity investments when a subsidiary is deconsolidated. SFAS No. 160 also establishes disclosure requirements that clearly identify and distinguish between the interests of the parent and the interests of the noncontrolling owners. SFAS No. 160 is effective for us beginning in the first quarter of fiscal year 2010 and will apply prospectively, except for the presentation and disclosure requirements, which will apply retrospectively. We are currently assessing the potential impact that adoption of SFAS No. 160 will have on our consolidated financial statements.
At the March 12, 2008 EITF meeting, the SEC Observer announced revisions to Topic No. D-98,Classification and Measurement of Redeemable Securities, which provides SEC registrants with guidance on the financial statement classification and measurement of equity securities that are subject to mandatory redemption requirements or whose redemption is outside the control of the issuer. The revised Topic No. D-98 requires minority interests that are redeemable at the option of the holder to be recorded outside of permanent equity at fair value, and the redeemable minority interests to be adjusted to their fair value at each balance sheet date. Adjustments to the carrying amount of a noncontrolling interest from the application of Topic No. D-98 are recorded to retained earnings (or additional paid-in-capital in the absence of retained earnings). We will adopt the revised provisions of Topic No. D-98 in the first quarter of fiscal year 2010 related to our redeemable minority interest. Upon adoption of the revised provisions of Topic No. D-98, we will adjust the carrying value of our redeemable minority interests to fair value with a corresponding adjustment to stockholders’ equity in the consolidated balance sheet.
Had we adopted the revised provisions of Topic No. D-98 as of June 30, 2009, we would have recorded an approximately $82 million increase to redeemable minority interest with a corresponding decrease to stockholders’ equity in the consolidated balance sheet. We estimate our redeemable minority interests have an aggregate fair value of approximately $92 million at June 30, 2009. We determined the fair value of our redeemable minority interests using a discounted cash flow model utilizing significant unobservable inputs, which are Level 3 inputs under SFAS No. 157.
In December 2007, the FASB issued SFAS No. 141 (revised) (“SFAS No. 141(R)”),Business Combinations. SFAS No. 141(R) requires an acquirer to recognize the assets acquired, the liabilities assumed, and any noncontrolling interest in the acquiree at the acquisition date to be measured at their fair value as of that date. An acquirer is required to recognize assets or liabilities arising from all other contingencies as of the acquisition date, measured at their acquisition-date fair values, only if it is more likely than not that they meet the definition of an asset or a liability. Any acquisition-related costs are to be expensed instead of capitalized. Additionally, restructuring expenses generally must be expensed in periods subsequent to the acquisition date and changes in accounting for deferred tax asset valuation allowances and acquired income tax uncertainties after the measurement period impact income tax expense. SFAS No. 141(R) applies prospectively to business combinations, if any, for which the acquisition date is on or after July 1, 2009. The impact on our consolidated
48
financial statements from the adoption of SFAS No. 141(R) in fiscal year 2010 will depend on our acquisition activity during the reporting period. Had we adopted SFAS No. 141(R) effective at the beginning of fiscal year 2009, $3.3 million of capitalized acquisition-related expenses related to our fiscal year 2009 acquisitions would have been recognized as a charge against our fiscal year 2009 earnings and we would have recognized a liability at the acquisition date for the estimated fair value of contingent purchase consideration expected to be paid in the future. Additionally, any acquisition-related expenses incurred in fiscal year 2009 in relation to potential acquisitions which were not consummated by June 30, 2009 were charged against our fiscal year 2009 earnings.
In September 2006, the FASB issued SFAS No. 157,Fair Value Measurements. SFAS No. 157 clarifies the principle that fair value should be based on the assumptions market participants would use when pricing an asset or liability and establishes a fair value hierarchy that prioritizes the information used to develop those assumptions. Under SFAS No. 157, fair value measurements would be disclosed separately by level within the fair value hierarchy. Our adoption of SFAS No. 157 in the first quarter of fiscal year 2009 did not have a significant impact on our consolidated financial statements, although we are now required to provide additional financial statement disclosures. In February 2008, the FASB issued FSP No. FAS 157-2 which delays the effective date of SFAS No. 157 for all nonfinancial assets and nonfinancial liabilities, except those that are recognized or disclosed at fair value in the financial statements on a recurring basis (at least annually), to fiscal years beginning after November 15, 2008. The disclosures required by SFAS No. 157 are provided in Note 7 to our consolidated financial statements provided elsewhere in this Annual Report on Form 10-K.
| ITEM 7A. | QUANTITATIVE AND QUALITATIVE DISCLOSURES ABOUT MARKET RISK |
Foreign Currency Risk
We conduct operations in many countries around the world. Our results of operations are subject to both currency transaction risk and currency translation risk. We incur currency transaction risk when we enter into either a purchase or sale transaction using a currency other than our functional currency, which is the U.S. dollar. With respect to currency translation risk, our financial condition and results of operations are measured and recorded in the relevant domestic currency and then translated into U.S. dollars for inclusion in our consolidated financial statements. Exchange rates between these currencies and U.S. dollars have fluctuated significantly over the last few years and we expect that they will continue to fluctuate in the future. A substantial portion of our revenues and costs are denominated in or effectively indexed to U.S. dollars, but the majority of our revenues and costs are denominated in Euros, Pound Sterling, Swiss francs, Canadian dollars and other international currencies.
During fiscal year 2009, the U.S. dollar has strengthened significantly versus most major foreign currencies we use to transact our business. For example, one Euro was equal to approximately $1.58 on June 30, 2008, $1.44 on September 30, 2008, $1.41 on December 31, 2008, $1.32 on March 31, 2009 and $1.40 on June 30, 2009. The change from June 30, 2008 to June 30, 2009 represents a strengthening of the U.S. dollar versus the Euro of approximately 11.1%. The strengthening of the U.S. dollar had a negative comparable impact on our revenues, but a positive comparable impact on our expenses for fiscal year 2009 as compared to fiscal year 2008. A hypothetical 5% increase or decrease in the U.S. dollar versus other currencies in which we transact our business would have resulted in a $20.6 million change to our revenues during fiscal year 2009.
In February 2006, we entered into a foreign exchange option that gave us the right to call $200.0 million in U.S. dollars at a strike price of €1.1646 per U.S. dollar at any time up to February 8, 2011. We paid approximately $7.9 million for this option. In November 2008, we sold the foreign exchange option for $12.4 million. Historically, other than the foreign currency option described above, we have not undertaken hedging strategies to minimize the effect of currency fluctuations on our results of operations and financial condition; however, we may decide to do so in the future.
49
Interest Rate Risk
We are exposed to interest rate risks primarily through borrowings under our revolving loan arrangement and term loans. Interest on these borrowings is based upon variable interest rates. Our weighted-average borrowings outstanding and the weighted-average interest rate under the revolving loan arrangement and term loans during fiscal year 2009 were $602.0 million and 4.8%. Based on the foregoing, a hypothetical 1% increase or decrease in interest rates would have resulted in a $5.9 million change to our interest expense for fiscal year 2009.
In June 2007, we entered into three U.S. dollar-based interest rate swaps with notional amounts of $50.0 million, $81.0 million ($63.4 million as of June 30, 2009 per the planned reduction in notional amounts over the life of the swap contract), and $75.0 million, each with maturities on June 30, 2011, which require us to pay fixed rates of 5.445%, 5.418%, and 5.445%, respectively. We also entered into three Euro-based interest rate swaps with notional amounts of €69.8 million (€28.8 million as of June 30, 2009 per the planned reduction in notional amounts over the life of the swap contract), €50.0 million, and €60.0 million, each with maturities as late as June 30, 2011, which require us to pay fixed rates of 4.603%, 4.679%, and 4.685%, respectively. These interest rate swaps are designated and documented at their inception as cash flow hedges and are evaluated for effectiveness quarterly. The effective portion of the gain or loss on these hedges is reported as a component of accumulated other comprehensive income in stockholders’ equity and reclassified into earnings when the hedged transaction affects earnings. The ineffective portion of these cash flow hedges is recognized in interest expense in the consolidated statement of operations.
The estimated fair values of the U.S. dollar-based swaps were liabilities of $13.3 million and $8.7 million at June 30, 2009 and 2008, respectively, which were included in other noncurrent liabilities in the consolidated balance sheets. The estimated fair values of the Euro-based swaps were a liability of €6.9 million ($9.6 million) and an asset of €1.7 million ($2.7 million) at June 30, 2009 and 2008, respectively, which were included in other noncurrent liabilities and other noncurrent assets in the consolidated balance sheets. The change of $16.9 million in the fair value of swaps, net of tax, reflects the effective portion of loss on these hedges and is reported as a component of accumulated other comprehensive income in stockholders’ equity.
| ITEM 8. | FINANCIAL STATEMENTS AND SUPPLEMENTARY DATA |
We incorporate the information required for this item by reference to the financial statements listed in Item 15(a) of Part IV of this Annual Report on Form 10-K.
| ITEM 9. | CHANGES IN AND DISAGREEMENTS WITH ACCOUNTANTS ON ACCOUNTING AND FINANCIAL DISCLOSURE |
None.
| ITEM 9A. | CONTROLS AND PROCEDURES |
Conclusion Regarding the Effectiveness of Disclosure Controls and Procedures
We maintain disclosure controls and procedures, as such term is defined in Rules 13a-15(e) and 15d-15(e) under the Securities Exchange Act of 1934, as amended (the “Exchange Act”), that are designed to provide reasonable assurance that information required to be disclosed by us in the reports that we file or submit under the Exchange Act is recorded, processed, summarized and reported within the time periods specified in the SEC rules and forms, and that such information is accumulated and communicated to our management, including our principal executive officer and principal financial officer, as appropriate, to allow timely decisions regarding required financial disclosures. Under the supervision and with the participation of our management, including our principal executive officer and principal financial officer, we conducted an evaluation of our disclosure controls and procedures and, based on this evaluation, our principal executive officer and principal financial officer concluded that our disclosure controls and procedures were effective as of June 30, 2009.
50
Our management, including our principal executive officer and principal financial officer, does not expect that our disclosure controls and procedures will prevent all error or all fraud. A control system can provide only reasonable, not absolute, assurance that the objectives of the control system are met. Further, the design of a control system must reflect the fact that there are resource constraints, and the benefits of controls must be considered relative to their costs. Because of the inherent limitations in all control systems, no evaluation of controls can provide absolute assurance that all control issues and instances of fraud, if any, within Solera have been detected. These inherent limitations include the realities that judgments in decision-making can be faulty, and that breakdowns can occur because of simple error or mistake. Additionally, controls can be circumvented by the individual acts of some persons, by collusion of two or more people or by management override of the control. Because of the inherent limitations in a cost-effective control system, misstatements due to error or fraud may occur and not be detected.
Management’s Report on Internal Control over Financial Reporting
Our management is responsible for establishing and maintaining adequate internal control over financial reporting, as such term is defined in Exchange Act Rules 13a-15(f) and 15d-15(f). Our internal control over financial reporting is a process designed to provide reasonable assurance regarding the reliability of financial reporting and the preparation of the financial statements for external purposes in accordance with generally accepted accounting principles. Because of its inherent limitations, internal control over financial reporting may not prevent or detect misstatements. Also, projections of any evaluation of effectiveness to future periods are subject to the risk that internal controls may become inadequate because of changes in conditions, or that the degree of compliance with policies and procedures may deteriorate.
Under the supervision and with the participation of our management, including our principal executive officer and principal financial officer, we conducted an evaluation of the effectiveness of our internal control over financial reporting based on the framework set forth inInternal Control—Integrated Frameworkissued by the Committee of Sponsoring Organizations of the Treadway Commission. Based on our evaluation under the framework inInternal Control—Integrated Framework, our management concluded that our internal control over financial reporting was effective as of June 30, 2009.
Management’s assessment of and conclusion on the effectiveness of internal control over financial reporting did not include the internal controls of HPI, Ltd., acquired in December 2008, which are included in the consolidated financial statements of Solera Holdings, Inc. as of and for the year ended June 30, 2009 and constituted 12% of total assets as of June 30, 2009 and 4% and 2% of total revenues and net income, respectively, for the fiscal year then ended. Due to the timing of the acquisition, management did not assess the effectiveness of internal control over financial reporting at HPI, Ltd.
Deloitte & Touche LLP, the independent registered public accounting firm that audited the consolidated financial statements included in this Annual Report on Form 10-K, has also audited the effectiveness of our internal control over financial reporting as of June 30, 2009, as stated in their report which is included herein.
Changes in Internal Controls
There were no changes in our internal control over financial reporting identified in connection with the evaluation of such internal control that occurred during the fourth quarter of fiscal year 2009, that have materially affected, or are reasonably likely to materially affect, our internal control over financial reporting.
51
REPORT OF INDEPENDENT REGISTERED PUBLIC ACCOUNTING FIRM
To the Board of Directors and Stockholders of
Solera Holdings, Inc.
San Diego, California
We have audited the internal control over financial reporting of Solera Holdings, Inc. and subsidiaries (the “Company”) as of June 30, 2009 based on criteria established inInternal Control—Integrated Frameworkissued by the Committee of Sponsoring Organizations of the Treadway Commission. As described in Management’s Report on Internal Control over Financial Reporting, management excluded from its assessment the internal control over financial reporting at HPI, Ltd., which was acquired on December 19, 2008 and whose financial statements constitute 12% of total assets, 4% and 2% of total revenue and net income, respectively, of the consolidated financial statements for the Company as of and for the year ended June 30, 2009. Accordingly, our audit did not include the internal control over financial reporting at HPI, Ltd. The Company’s management is responsible for maintaining effective internal control over financial reporting and for its assessment of the effectiveness of internal control over financial reporting. Our responsibility is to express an opinion on the Company’s internal control over financial reporting based on our audit.
We conducted our audit in accordance with the standards of the Public Company Accounting Oversight Board (United States). Those standards require that we plan and perform the audit to obtain reasonable assurance about whether effective internal control over financial reporting was maintained in all material respects. Our audit included obtaining an understanding of internal control over financial reporting, assessing the risk that a material weakness exists, testing and evaluating the design and operating effectiveness of internal control based on the assessed risk, and performing such other procedures as we considered necessary in the circumstances. We believe that our audit provides a reasonable basis for our opinion.
A company’s internal control over financial reporting is a process designed by, or under the supervision of, the company’s principal executive and principal financial officers, or persons performing similar functions, and effected by the company's board of directors, management, and other personnel to provide reasonable assurance regarding the reliability of financial reporting and the preparation of financial statements for external purposes in accordance with generally accepted accounting principles. A company’s internal control over financial reporting includes those policies and procedures that (1) pertain to the maintenance of records that, in reasonable detail, accurately and fairly reflect the transactions and dispositions of the assets of the company; (2) provide reasonable assurance that transactions are recorded as necessary to permit preparation of financial statements in accordance with generally accepted accounting principles, and that receipts and expenditures of the company are being made only in accordance with authorizations of management and directors of the company; and (3) provide reasonable assurance regarding prevention or timely detection of unauthorized acquisition, use, or disposition of the company’s assets that could have a material effect on the financial statements.
Because of the inherent limitations of internal control over financial reporting, including the possibility of collusion or improper management override of controls, material misstatements due to error or fraud may not be prevented or detected on a timely basis. Also, projections of any evaluation of the effectiveness of the internal control over financial reporting to future periods are subject to the risk that the controls may become inadequate because of changes in conditions, or that the degree of compliance with the policies or procedures may deteriorate.
In our opinion, the Company maintained, in all material respects, effective internal control over financial reporting as of June 30, 2009, based on the criteria established inInternal Control—Integrated Frameworkissued by the Committee of Sponsoring Organizations of the Treadway Commission.
52
We have also audited, in accordance with the standards of the Public Company Accounting Oversight Board (United States), the consolidated financial statements and financial statement schedule as of and for the year ended June 30, 2009 of the Company and our report dated August 31, 2009 expressed an unqualified opinion on those consolidated financial statements and financial statement schedule and includes an explanatory paragraph regarding the adoption of Financial Accounting Standards Board (FASB) Interpretation No. 48,Accounting for Uncertainty in Income Taxes - an interpretation of FASB Statement No. 109.
/s/ DELOITTE & TOUCHE LLP
San Jose, California
August 31, 2009
| ITEM 9B. | OTHER INFORMATION |
Not applicable.
53
PART III
| ITEM 10. | DIRECTORS, EXECUTIVE OFFICERS AND CORPORATE GOVERNANCE |
Information required by this Item 10 will be set forth in our proxy statement to be filed with the SEC in connection with our 2009 annual meeting of stockholders (the “Proxy Statement”) or in a future amendment to this Annual Report on Form 10-K and is incorporated herein by reference.
We have adopted a Conflict of Interest and Code of Conduct Policy that applies to all officers, directors and employees. The Conflict of Interest and Code of Conduct Policy is available for free on our website at www.solerainc.com under “Investor Relations.” If we make any substantive amendments to the Conflict of Interest and Code of Conduct Policy or grant any waivers from a provision of the Conflict of Interest and Code of Conduct Policy to our principal executive officer, principal financial officer, principal accounting officer or controller, or persons performing similar functions, we will promptly disclose the nature of the amendment or waiver on our website or in a Current Report on Form 8-K.
| ITEM 11. | EXECUTIVE COMPENSATION |
Information required by this Item 11 will be set forth in our Proxy Statement or in a future amendment to this Annual Report on Form 10-K and is incorporated herein by reference.
| ITEM 12. | SECURITY OWNERSHIP OF CERTAIN BENEFICIAL OWNERS AND MANAGEMENT AND RELATED STOCKHOLDER MATTERS |
Information required by this Item 12 will be set forth in our Proxy Statement or in a future amendment to this Annual Report on Form 10-K and is incorporated herein by reference.
| ITEM 13. | CERTAIN RELATIONSHIPS AND RELATED TRANSACTIONS, AND DIRECTOR INDEPENDENCE |
Information required by this Item 13 will be set forth in our Proxy Statement or in a future amendment to this Annual Report on Form 10-K and is incorporated herein by reference.
| ITEM 14. | PRINCIPAL ACCOUNTANT FEES AND SERVICES |
Information required by this Item 14 will be set forth in our Proxy Statement or in a future amendment to this Annual Report on Form 10-K and is incorporated herein by reference.
54
PART IV
| ITEM 15. | EXHIBITS AND FINANCIAL STATEMENT SCHEDULES |
(a) (1) Financial Statements.
(a) (2) Financial Statement Schedules. Financial statements schedules other than those appearing on page F-37 are omitted because they are not required or applicable or the information is included in the consolidated financial statements or notes thereto.
(a) (3) Exhibits. The list of exhibits in the Exhibit Index to this Annual Report on Form 10-K is incorporated herein by reference.
55
SIGNATURES
Pursuant to the requirements of Section 13 or 15(d) of the Securities Exchange Act of 1934, the registrant has duly caused this report to be signed on its behalf by the undersigned, thereunto duly authorized on August 31, 2009.
|
| SOLERA HOLDINGS, INC. |
|
| /s/ Tony Aquila |
| By: Tony Aquila |
| Its: Chief Executive Officer |
POWER OF ATTORNEY
KNOW ALL PERSONS BY THESE PRESENTS, that each person whose signature appears below constitutes and appoints Tony Aquila and Dudley Mendenhall, and each of them, his true and lawful attorneys-in-fact, each with full power of substitution, for him in any and all capacities, to sign any amendments to this report on Form 10-K and to file the same, with exhibits thereto and other documents in connection therewith, with the Securities and Exchange Commission, hereby ratifying and confirming all that each of said attorneys-in-fact or their substitute or substitutes may do or cause to be done by virtue hereof.
Pursuant to the requirements of the Securities Exchange Act of 1934, this report has been signed by the following persons on behalf of the registrant and in the capacities and on the dates indicated below.
| | | | |
Signatures | | | | Date |
| | |
/s/ Tony Aquila Tony Aquila | | Chairman of the Board, Chief Executive Officer and President (principal executive officer) | | August 31, 2009 |
| | |
/s/ Dudley Mendenhall Dudley Mendenhall | | Chief Financial Officer (principal financial and accounting officer) | | August 31, 2009 |
| | |
/s/ Philip A. Canfield Philip A. Canfield | | Director | | August 31, 2009 |
| | |
/s/ Kenneth A. Viellieu Kenneth A. Viellieu | | Director | | August 31, 2009 |
| | |
/s/ Stuart J. Yarbrough Stuart J. Yarbrough | | Director | | August 31, 2009 |
| | |
/s/ Jerrell W. Shelton Jerrell W. Shelton | | Director | | August 31, 2009 |
| | |
/s/ Arthur F. Kingsbury Arthur F. Kingsbury | | Director | | August 31, 2009 |
56
SOLERA HOLDINGS, INC.
INDEX TO THE CONSOLIDATED FINANCIAL STATEMENTS
F-1
REPORT OF INDEPENDENT REGISTERED PUBLIC ACCOUNTING FIRM
To the Board of Directors and Stockholders of
Solera Holdings, Inc.
San Diego, California
We have audited the accompanying consolidated balance sheets of Solera Holdings, Inc. and subsidiaries (the “Company”) as of June 30, 2009 and 2008, and the related consolidated statements of operations, stockholders’/unitholders’ equity (deficit) and accumulated other comprehensive income, and cash flows for each of the three years in the period ended June 30, 2009. Our audits also included the financial statement schedule listed in the Index at Item 15(a). These consolidated financial statements and financial statement schedule are the responsibility of the Company’s management. Our responsibility is to express an opinion on the consolidated financial statements and financial statement schedule based on our audits.
We conducted our audits in accordance with the standards of the Public Company Accounting Oversight Board (United States). Those standards require that we plan and perform the audit to obtain reasonable assurance about whether the financial statements are free of material misstatement. An audit includes examining, on a test basis, evidence supporting the amounts and disclosures in the financial statements. An audit also includes assessing the accounting principles used and significant estimates made by management, as well as evaluating the overall financial statement presentation. We believe that our audits provide a reasonable basis for our opinion.
In our opinion, such consolidated financial statements present fairly, in all material respects, the financial position of Solera Holdings, Inc. and subsidiaries as of June 30, 2009 and 2008, and the results of their operations and their cash flows for each of the three years in the period ended June 30, 2009, in conformity with accounting principles generally accepted in the United States of America. Also, in our opinion, such financial statement schedule, when considered in relation to the basic consolidated financial statements taken as a whole, presents fairly, in all material respects, the information set forth therein.
As discussed in Note 13 to the consolidated financial statements, effective July 1, 2007, the Company adopted the recognition and measurement provisions of Financial Accounting Standards Board (FASB) Interpretation No. 48,Accounting for Uncertainty in Income Taxes - an interpretation of FASB Statement No. 109.
We have also audited, in accordance with the standards of the Public Company Accounting Oversight Board (United States), the Company’s internal control over financial reporting as of June 30, 2009, based on the criteria established inInternal Control—Integrated Framework issued by the Committee of Sponsoring Organizations of the Treadway Commission and our report dated August 31, 2009, expressed an unqualified opinion on the Company’s internal control over financial reporting.
/s/ DELOITTE & TOUCHE LLP
San Jose, California
August 31, 2009
F-2
SOLERA HOLDINGS, INC.
CONSOLIDATED BALANCE SHEETS
(In thousands, except per share data)
| | | | | | | | |
| | | June 30, | |
| | | 2009 | | | 2008 | |
| ASSETS | | | | | | | | |
Current assets: | | | | | | | | |
Cash and cash equivalents | | $ | 223,420 | | | $ | 149,311 | |
Short-term investments | | | 11,941 | | | | — | |
Accounts receivable, net of allowance for doubtful accounts of $2,344 and $1,289 at June 30, 2009 and 2008, respectively | | | 98,565 | | | | 95,843 | |
Other receivables | | | 12,177 | | | | 9,784 | |
Other current assets | | | 19,550 | | | | 18,314 | |
Deferred income tax assets | | | 4,392 | | | | 4,802 | |
| | | | | | | | |
Total current assets | | | 370,045 | | | | 278,054 | |
Property and equipment, net | | | 50,784 | | | | 49,243 | |
Goodwill | | | 651,099 | | | | 646,098 | |
Intangible assets, net | | | 322,843 | | | | 330,218 | |
Other noncurrent assets | | | 13,660 | | | | 22,980 | |
Noncurrent deferred income tax assets | | | 10,178 | | | | 5,162 | |
| | | | | | | | |
Total assets | | $ | 1,418,609 | | | $ | 1,331,755 | |
| | | | | | | | |
| LIABILITIES AND STOCKHOLDERS’ EQUITY | | | | | | | | |
Current liabilities: | | | | | | | | |
Accounts payable | | $ | 30,447 | | | $ | 32,191 | |
Accrued expenses and other current liabilities | | | 104,414 | | | | 103,597 | |
Income taxes payable | | | 17,462 | | | | 12,449 | |
Deferred income tax liabilities | | | 1,037 | | | | 842 | |
Current portion of long-term debt | | | 5,880 | | | | 6,336 | |
| | | | | | | | |
Total current liabilities | | | 159,240 | | | | 155,415 | |
Long-term debt | | | 592,200 | | | | 624,570 | |
Other noncurrent liabilities | | | 36,935 | | | | 33,475 | |
Noncurrent deferred income tax liabilities | | | 53,965 | | | | 36,558 | |
| | | | | | | | |
Total liabilities | | | 842,340 | | | | 850,018 | |
Commitments and contingencies (Note 14) | | | | | | | | |
Minority interests in consolidated subsidiaries, including minority interests redeemable at fair value of $92,000 at June 30, 2009 (Note 2) | | | 17,330 | | | | 15,429 | |
| | |
Stockholders’ equity: | | | | | | | | |
Common shares, $0.01 par value: 150,000 shares authorized; 69,531 and 64,816 issued and outstanding as of June 30, 2009 and 2008, respectively | | | 604,952 | | | | 510,900 | |
Accumulated deficit | | | (52,332 | ) | | | (110,157 | ) |
Accumulated other comprehensive income | | | 6,319 | | | | 65,565 | |
| | | | | | | | |
Total stockholders’ equity | | | 558,939 | | | | 466,308 | |
| | | | | | | | |
Total liabilities and stockholders’ equity | | $ | 1,418,609 | | | $ | 1,331,755 | |
| | | | | | | | |
See accompanying notes to consolidated financial statements.
F-3
SOLERA HOLDINGS, INC.
CONSOLIDATED STATEMENTS OF OPERATIONS
(In thousands, except per share/unit data)
| | | | | | | | | | | | |
| | | Fiscal Years Ended June 30, | |
| | | 2009 | | | 2008 | | | 2007 | |
Revenues | | $ | 557,691 | | | $ | 539,853 | | | $ | 471,960 | |
| | | | | | | | | | | | |
Cost of revenues: | | | | | | | | | | | | |
Operating expenses | | | 128,424 | | | | 131,715 | | | | 138,345 | |
Systems development and programming costs | | | 60,212 | | | | 66,666 | | | | 65,041 | |
| | | | | | | | | | | | |
Total cost of revenues (excluding depreciation and amortization) | | | 188,636 | | | | 198,381 | | | | 203,386 | |
Selling, general and administrative expenses | | | 162,223 | | | | 154,532 | | | | 134,545 | |
Depreciation and amortization | | | 86,146 | | | | 95,266 | | | | 104,419 | |
Restructuring charges | | | 4,976 | | | | 13,286 | | | | 6,049 | |
Interest expense | | | 38,565 | | | | 45,730 | | | | 69,681 | |
Other (income) expense, net | | | (15,656 | ) | | | (9,518 | ) | | | 31,509 | |
| | | | | | | | | | | | |
| | | 464,890 | | | | 497,677 | | | | 549,589 | |
| | | | | | | | | | | | |
Income (loss) before income tax provision (benefit) and minority interests | | | 92,801 | | | | 42,176 | | | | (77,629 | ) |
Income tax provision (benefit) | | | 26,650 | | | | 34,335 | | | | (773 | ) |
Minority interest in net income of consolidated subsidiaries | | | 8,326 | | | | 7,243 | | | | 4,050 | |
| | | | | | | | | | | | |
Net income (loss) | | | 57,825 | | | | 598 | | | | (80,906 | ) |
Dividends and redeemable preferred unit accretion | | | — | | | | — | | | | 14,614 | |
| | | | | | | | | | | | |
Net income (loss) applicable to common shares/units | | $ | 57,825 | | | $ | 598 | | | $ | (95,520 | ) |
| | | | | | | | | | | | |
Net income (loss) per share/unit applicable to common shares/units: | | | | | | | | | | | | |
Basic | | $ | 0.86 | | | $ | 0.01 | | | $ | (2.82 | ) |
Diluted | | $ | 0.85 | | | $ | 0.01 | | | $ | (2.82 | ) |
| | | | | | | | | | | | |
Weighted average shares/units used in the calculation of net income (loss) per share/units: | | | | | | | | | | | | |
Basic | | | 67,252 | | | | 63,500 | | | | 33,865 | |
Diluted | | | 67,732 | | | | 64,737 | | | | 33,865 | |
Pro forma net loss data (unaudited)—Note 1: | | | | | | | | | | | | |
Net loss applicable to common shares/units as reported | | | | | | | | | | $ | (95,520 | ) |
Pro forma adjustment for income tax benefit | | | | | | | | | | | (956 | ) |
| | | | | | | | | | | | |
Pro forma net loss applicable to common shares/units | | | | | | | | | | $ | (94,564 | ) |
| | | | | | | | | | | | |
Pro forma basic and diluted net loss per share/unit applicable to common shares/units | | | | | | | | | | $ | (2.79 | ) |
Weighted average shares/units used in the calculation of pro forma basic and diluted net loss per share/unit | | | | | | | | | | | 33,865 | |
See accompanying notes to consolidated financial statements.
F-4
SOLERA HOLDINGS, INC.
CONSOLIDATED STATEMENTS OF STOCKHOLDERS’/UNITHOLDERS’ EQUITY (DEFICIT) AND
ACCUMULATED OTHER COMPREHENSIVE INCOME
(In thousands)
| | | | | | | | | | | | | | | | | | | | | | | | | | | | | | |
| | | Common Shares | | | Class A
Common Units | | | Deferred
Compensation | | | Accumulated
Other
Comprehensive
Income | | | Accumulated
Deficit | | | Total
Stockholders’/
Unitholders’
Equity
(Deficit) | |
| | | Shares | | | Amount | | | Units | | | Amount | | | | | |
Balance at June 30, 2006 | | — | | | $ | — | | | 31,047 | | | $ | 4,907 | | | $ | (1,446 | ) | | $ | 3,763 | | | $ | (19,627 | ) | | $ | (12,403 | ) |
Cumulative effect of adopting SFAS No.123(R) | | — | | | | — | | | — | | | | (1,446 | ) | | | 1,446 | | | | — | | | | — | | | | — | |
Adoption of SFAS No.158, net of tax | | | | | | | | | | | | | | | | | | | | | (492 | ) | | | | | | | (492 | ) |
Unit-based compensation | | — | | | | — | | | — | | | | 673 | | | | — | | | | — | | | | — | | | | 673 | |
Stock-based compensation | | — | | | | 1,669 | | | — | | | | — | | | | — | | | | — | | | | — | | | | 1,669 | |
Dividend | | — | | | | — | | | — | | | | (4,071 | ) | | | — | | | | — | | | | (10,543 | ) | | | (14,614 | ) |
Issuance of Class A Common Units | | — | | | | — | | | 675 | | | | 203 | | | | — | | | | — | | | | — | | | | 203 | |
Repurchase and retirement of LLC units | | — | | | | — | | | (89 | ) | | | (266 | ) | | | — | | | | — | | | | (611 | ) | | | (877 | ) |
Conversion of Class A Common Units into common shares | | 31,633 | | | | — | | | (31,633 | ) | | | — | | | | — | | | | — | | | | — | | | | — | |
Conversion of Class B Redeemable Preferred Units into common shares | | 13,890 | | | | 222,479 | | | — | | | | — | | | | — | | | | — | | | | — | | | | 222,479 | |
Issuance of common shares from initial public offering, net of issuance costs of $25,410 | | 19,200 | | | | 281,790 | | | — | | | | — | | | | — | | | | — | | | | — | | | | 281,790 | |
Issuance of common shares under employee stock plans | | 90 | | | | 1 | | | — | | | | — | | | | — | | | | — | | | | — | | | | 1 | |
Components of comprehensive loss: | | | | | | | | | | | | | | | | | | | | | | | | | | | | | | |
Net loss | | — | | | | — | | | — | | | | — | | | | — | | | | — | | | | (80,906 | ) | | | (80,906 | ) |
Foreign currency translation adjustments | | — | | | | — | | | — | | | | — | | | | — | | | | 4,816 | | | | — | | | | 4,816 | |
Unrealized losses on derivative instruments, net of tax | | | | | | | | | | | | | | | | | — | | | | (1,065 | ) | | | | | | | (1,065 | ) |
| | | | | | | | | | | | | | | | | | | | | | | | | | | | | | |
Total comprehensive loss | | — | | | | | | | | | | | — | | | | — | | | | — | | | | — | | | | (77,155 | ) |
| | | | | | | | | | | | | | | | | | | | | | | | | | | | | | |
Balance at June 30, 2007 | | 64,814 | | | | 505,939 | | | — | | | | — | | | | — | | | | 7,022 | | | | (111,687 | ) | | | 401,274 | |
Cumulative effect of adopting FIN No.48 | | — | | | | — | | | — | | | | — | | | | — | | | | — | | | | 1,027 | | | | 1,027 | |
Repurchase of commons shares | | (84 | ) | | | (17 | ) | | — | | | | — | | | | — | | | | — | | | | (95 | ) | | | (112 | ) |
Stock-based compensation | | — | | | | 4,848 | | | — | | | | — | | | | — | | | | — | | | | — | | | | 4,848 | |
Reversal of previously accrued equity issuance costs | | — | | | | 24 | | | — | | | | — | | | | — | | | | — | | | | — | | | | 24 | |
Issuance of common shares under employee stock purchase plan | | 6 | | | | 105 | | | — | | | | — | | | | — | | | | — | | | | — | | | | 105 | |
Issuance of common shares under stock award plans | | 80 | | | | 1 | | | — | | | | — | | | | — | | | | — | | | | — | | | | 1 | |
Components of comprehensive income: | | | | | | | | | | | | | | | | | | | | | | | | | | | | | | |
Net income | | — | | | | — | | | — | | | | — | | | | — | | | | — | | | | 598 | | | | 598 | |
Foreign currency translation adjustments | | — | | | | — | | | — | | | | — | | | | — | | | | 58,746 | | | | — | | | | 58,746 | |
Unrealized losses on derivative instruments, net of tax | | — | | | | — | | | — | | | | — | | | | — | | | | (5,474 | ) | | | — | | | | (5,474 | ) |
Change in funded status of defined benefit pension plan, net of tax | | — | | | | — | | | — | | | | — | | | | — | | | | 5,271 | | | | — | | | | 5,271 | |
| | | | | | | | | | | | | | | | | | | | | | | | | | | | | | |
Total comprehensive income | | — | | | | — | | | — | | | | — | | | | — | | | | — | | | | — | | | | 59,141 | |
| | | | | | | | | | | | | | | | | | | | | | | | | | | | | | |
Balance at June 30, 2008 | | 64,816 | | | | 510,900 | | | — | | | | — | | | | — | | | | 65,565 | | | | (110,157 | ) | | | 466,308 | |
Repurchase of common shares | | — | | | | (3 | ) | | — | | | | — | | | | — | | | | — | | | | — | | | | (3 | ) |
Stock-based compensation | | — | | | | 6,711 | | | — | | | | — | | | | — | | | | — | | | | — | | | | 6,711 | |
Issuance of common shares in secondary public offering, net of issuance costs of $3,981 | | 4,500 | | | | 86,019 | | | — | | | | — | | | | — | | | | — | | | | — | | | | 86,019 | |
Issuance of common shares under employee stock plans, net of tax benefit | | 215 | | | | 1,325 | | | — | | | | — | | | | — | | | | — | | | | — | | | | 1,325 | |
Components of comprehensive income (loss): | | | | | | | | | | | | | | | | | | | | | | | | | | | | | | |
Net income | | — | | | | — | | | — | | | | — | | | | — | | | | — | | | | 57,825 | | | | 57,825 | |
Foreign currency translation adjustments | | — | | | | — | | | — | | | | — | | | | — | | | | (46,473 | ) | | | — | | | | (46,473 | ) |
Unrealized losses on derivative instruments, net of tax | | — | | | | — | | | — | | | | — | | | | — | | | | (15,965 | ) | | | — | | | | (15,965 | ) |
Change in funded status of defined benefit pension plan, net of tax | | — | | | | — | | | — | | | | — | | | | — | | | | 3,192 | | | | — | | | | 3,192 | |
| | | | | | | | | | | | | | | | | | | | | | | | | | | | | | |
Total comprehensive loss | | — | | | | — | | | — | | | | — | | | | — | | | | — | | | | — | | | | (1,421 | ) |
| | | | | | | | | | | | | | | | | | | | | | | | | | | | | | |
Balance at June 30, 2009 | | 69,531 | | | $ | 604,952 | | | — | | | $ | — | | | $ | — | | | $ | 6,319 | | | $ | (52,332 | ) | | $ | 558,939 | |
| | | | | | | | | | | | | | | | | | | | | | | | | | | | | | |
See accompanying notes to consolidated financial statements.
F-5
SOLERA HOLDINGS, INC.
CONSOLIDATED STATEMENTS OF CASH FLOWS
(In thousands)
| | | | | | | | | | | | |
| | | Fiscal Years Ended June 30, | |
| | | 2009 | | | 2008 | | | 2007 | |
Operating activities: | | | | | | | | | | | | |
Net income (loss) | | $ | 57,825 | | | $ | 598 | | | $ | (80,906 | ) |
Adjustments to reconcile net income (loss) to net cash provided by operating activities: | | | | | | | | | | | | |
Depreciation and amortization | | | 86,146 | | | | 95,266 | | | | 104,419 | |
Minority interests in net income of consolidated subsidiaries | | | 8,326 | | | | 7,243 | | | | 4,050 | |
Provision (recovery) for doubtful accounts | | | 1,549 | | | | 890 | | | | (193 | ) |
Stock-/unit-based compensation | | | 6,711 | | | | 4,848 | | | | 2,343 | |
Deferred income taxes | | | (8,627 | ) | | | 4,615 | | | | (21,844 | ) |
Change in fair value of financial instrument | | | (10,599 | ) | | | (832 | ) | | | (1,544 | ) |
Loss on debt extinguishment | | | — | | | | — | | | | 28,691 | |
Other | | | (454 | ) | | | 280 | | | | 558 | |
Changes in operating assets and liabilities, net of effects from acquisitions of businesses: | | | | | | | | | | | | |
Increase in accounts receivable | | | (4,949 | ) | | | (1,961 | ) | | | (18,962 | ) |
(Increase) decrease in other assets | | | 1,711 | | | | (10,152 | ) | | | 8,343 | |
(Decrease) increase in accounts payable | | | (244 | ) | | | 3,409 | | | | 10,695 | |
(Decrease) increase in accrued expenses and other liabilities | | | (8,316 | ) | | | 13,269 | | | | 20,324 | |
Decrease in accrued interest | | | (205 | ) | | | (71 | ) | | | (9,896 | ) |
| | | | | | | | | | | | |
Net cash provided by operating activities | | | 128,874 | | | | 117,402 | | | | 46,078 | |
| | | | | | | | | | | | |
Investing activities: | | | | | | | | | | | | |
Capital expenditures | | | (19,622 | ) | | | (18,821 | ) | | | (27,230 | ) |
Final working capital payment adjustment for acquisition of business | | | — | | | | — | | | | (13,167 | ) |
Proceeds from sale of foreign currency exchange option | | | 12,400 | | | | — | | | | — | |
Purchases of short-term investments | | | (11,941 | ) | | | — | | | | — | |
Increase in restricted cash | | | (3,021 | ) | | | — | | | | — | |
Acquisitions of businesses and investment in joint venture, net of cash acquired | | | (99,692 | ) | | | (314 | ) | | | (1,110 | ) |
| | | | | | | | | | | | |
Net cash used in investing activities | | | (121,876 | ) | | | (19,135 | ) | | | (41,507 | ) |
| | | | | | | | | | | | |
Financing activities: | | | | | | | | | | | | |
Proceeds from issuance of debt | | | — | | | | — | | | | 610,688 | |
Debt issuance costs | | | — | | | | — | | | | (4,393 | ) |
Principal payments on financed capital assets | | | (4,730 | ) | | | (4,907 | ) | | | (3,740 | ) |
Borrowings under revolving credit facility | | | — | | | | — | | | | 12,814 | |
Repayments under revolving credit facility | | | | | | | (8,548 | ) | | | (16,000 | ) |
Repayments of long-term debt | | | (5,872 | ) | | | (37,779 | ) | | | (887,607 | ) |
Premium on prepayment of long term debt | | | — | | | | — | | | | (6,975 | ) |
Proceeds from termination of interest rate swaps | | | — | | | | — | | | | 7,741 | |
Proceeds from issuance of Class A common units, net of offering costs | | | — | | | | — | | | | 203 | |
Repurchase of Class A common and Class B redeemable preferred units | | | — | | | | — | | | | (877 | ) |
Proceeds from issuance of common shares in public stock offerings, net of offering costs | | | 86,019 | | | | — | | | | 281,790 | |
Proceeds from stock purchase plan and exercise of stock options | | | 1,325 | | | | | | | | | |
Repurchase of common shares | | | (3 | ) | | | (112 | ) | | | — | |
| | | | | | | | | | | | |
Net cash provided by (used in) financing activities | | | 76,739 | | | | (51,346 | ) | | | (6,356 | ) |
| | | | | | | | | | | | |
Effect of foreign currency exchange rate changes on cash and cash equivalents | | | (9,628 | ) | | | 12,522 | | | | 2,827 | |
| | | | | | | | | | | | |
Net change in cash and cash equivalents | | | 74,109 | | | | 59,443 | | | | 1,042 | |
Cash and cash equivalents, beginning of period | | | 149,311 | | | | 89,868 | | | | 88,826 | |
| | | | | | | | | | | | |
Cash and cash equivalents, end of period | | $ | 223,420 | | | $ | 149,311 | | | $ | 89,868 | |
| | | | | | | | | | | | |
Supplemental cash flow information: | | | | | | | | | | | | |
Dividends and redeemable preferred share accretion | | $ | — | | | $ | — | | | $ | 14,614 | |
Cash paid for interest | | $ | 37,961 | | | $ | 44,913 | | | $ | 66,806 | |
Cash paid for income taxes | | $ | 30,828 | | | $ | 23,341 | | | $ | 24,736 | |
Supplemental disclosure of non-cash investing and finance activities: | | | | | | | | | | | | |
Capital assets financed | | $ | 1,554 | | | $ | 3,735 | | | $ | 9,618 | |
Note payable issued in acquisition of business | | $ | 17,330 | | | $ | — | | | $ | — | |
Conversion of Class B redeemable preferred units into common shares | | $ | — | | | $ | — | | | $ | 222,479 | |
See accompanying notes to consolidated financial statements.
F-6
SOLERA HOLDINGS, INC.
NOTES TO CONSOLIDATED FINANCIAL STATEMENTS
| 1. | ORGANIZATION AND BASIS OF PRESENTATION |
Description of Business—Solera Holdings, Inc. and subsidiaries (the “Company” or “Solera”) is a leading global provider of software and services to the automobile insurance claims processing industry. Its software and services help its customers: estimate the costs to repair damaged vehicles; determine pre-collision fair market values for vehicles damaged beyond repair; automate steps of the claims process; outsource steps of the claims process that insurance companies have historically performed internally; and monitor and manage their businesses through data reporting and analysis. The Company is active in over 50 countries and derives most of its revenues from its estimating and workflow software. Through its acquisition of HPI, Ltd. in December 2008, the Company also provides used vehicle validation services in the United Kingdom.
Solera was formed in March 2005. In April 2006, Solera acquired Claims Services Group (“CSG”), a business unit of Automatic Data Processing, Inc. (“ADP”), for approximately $1.0 billion. Prior to the acquisition of CSG, Solera’s operations consisted primarily of developing its business plan, recruiting personnel, providing consulting services, raising capital and identifying and evaluating operating assets for acquisition.
Solera accounted for the acquisition of CSG using the purchase method of accounting. The Company allocated the aggregate acquisition consideration to the tangible and intangible assets acquired and liabilities assumed based on their respective fair values as of the date of the acquisition.
In May 2007, the Company completed an initial public offering of 19,200,000 shares of its common stock. Additionally, the selling stockholders sold 10,987,500 shares of common stock. In connection with the initial public offering, the Company amended its corporate status and converted from a Delaware limited liability company into a Delaware corporation with 150,000,000 authorized shares of common stock, par value $0.01 per share, and 15,000,000 authorized shares of preferred stock, par value $0.01 per share. Upon the effectiveness of the conversion, all of the Company’s outstanding preferred and common units were automatically converted into shares of common stock based on their relative rights as set forth in the Company’s limited liability company agreement. As a result, 31,633,211 common units were converted into 31,633,211 shares of common stock, and 204,016 preferred units were converted into 13,889,974 shares of common stock.
In November 2008, the Company completed a secondary public offering of 4,500,000 shares of its common stock for net proceeds of $86,019,000 which was used to purchase the outstanding share capital of HPI, Ltd. in December 2008 (Note 3).
Unaudited Pro Forma Information—The unaudited pro forma net loss data present the pro forma effects of applying a provision for income taxes to historical net income. Such provision reflects the income taxes that would have been applicable had the Company been taxed as a Subchapter C corporation prior to May 2007.
Pro forma net loss per share/unit is based on the weighted average common shares/units outstanding. Pro forma net loss per share is computed as if the conversion into a Delaware corporation described above occurred on July 1, 2005.
Principles of Consolidation and Basis of Presentation—The accompanying consolidated financial statements have been prepared in accordance with United States generally accepted accounting principles and applicable regulations of the Securities and Exchange Commission (“SEC”). The Company’s operating results for the twelve months ended June 30, 2009 are not necessarily indicative of the results that may be expected for any future periods.
F-7
The consolidated financial statements include the accounts of the Company and its wholly-owned and majority-owned subsidiaries. Minority interest represents minority shareholders’ proportionate share of the net equity in our consolidated, majority-owned subsidiaries in Belgium, France, Portugal, Spain and Mexico. All intercompany accounts and transactions have been eliminated in consolidation.
The Company evaluated subsequent events through August 31, 2009, the date of the filing of the Company’s Annual Report on Form 10-K (Note 16).
| 2. | SUMMARY OF SIGNIFICANT ACCOUNTING POLICIES |
Use of Estimates—The preparation of the accompanying consolidated financial statements and related disclosures in conformity with accounting principles generally accepted in the United States requires management to make judgments, assumptions and estimates that affect the amounts reported in the Company’s consolidated financial statements and accompanying notes. The Company bases its estimates and judgments on historical experience and on various other assumptions that it believes are reasonable under the circumstances. However, future events are subject to change and estimates and judgments routinely require adjustment. The reported amounts of assets, liabilities, revenues and expenses are affected by estimates and assumptions which are used for, but not limited to, the accounting for sales allowances, allowance for doubtful accounts, fair value of derivatives, valuation of goodwill and intangible assets, amortization of intangibles, restructurings, liabilities under defined benefit plans, stock-based compensation, redeemable minority interest and income taxes. Actual results could differ from these estimates.
Cash and Cash Equivalents and Short-Term Investments—The Company considers all highly liquid investments with original maturities of 90 days or less at the time of purchase to be cash equivalents. Cash equivalents at June 30, 2009 and 2008 consisted primarily of money market funds. The carrying amounts approximate fair value due to the short maturities of these instruments.
At June 30, 2009, the Company held bank certificates of deposits with original maturities of greater than 90 days at the time of purchase which have been categorized as short-term investments and are reported at fair value. The carrying amounts approximate fair value given the nature of the investments. All of the Company’s short-term investments have contractual maturities within one year from June 30, 2009.
Accounts Receivable and Allowance for Doubtful Accounts—Accounts receivable are recorded according to contractual agreements. Credit terms for payment of products and services are extended to customers in the normal course of business and no collateral is required. The allowance for doubtful accounts is estimated based on the Company’s historical losses, the existing economic conditions, and the financial stability of the Company’s customers. Receivables are written-off in the period that they are deemed uncollectible.
Property and Equipment—Property and equipment is stated at cost and depreciated over the estimated useful lives of the assets using the straight-line method. The estimated useful lives of assets are as follows:
| | |
| Buildings | | 20 to 40 years |
| Building improvements | | 5 to 15 years |
| Leasehold improvements | | Lesser of 10 years or remaining lease term |
| Data processing equipment | | 3 years |
| Furniture and fixtures | | 4 to 7 years |
| Machinery and equipment | | 3 to 6 years |
| Software licenses | | 3 years |
Internal Use Software—Expenditures for software purchases and software developed or obtained for internal use are capitalized and amortized over a three- to five-year period on a straight-line basis. For software developed or obtained for internal use, the Company capitalizes costs in accordance with the provisions of
F-8
American Institute of Certified Public Accountants (“AICPA”) Statement of Position (“SOP”) No. 98-1,Accounting for the Costs of Computer Software Developed or Obtained for Internal Use. The Company’s policy provides for the capitalization of external direct costs of materials and services associated with developing or obtaining internal use computer software. In addition, the Company also capitalizes certain payroll and payroll-related costs for employees who are directly associated with internal use computer software projects. The amount of capitalizable payroll costs with respect to these employees is limited to the time directly spent on such projects. Costs associated with preliminary project stage activities, training, maintenance and all other post-implementation stage activities are expensed as incurred. The Company also expenses internal costs related to minor upgrades and enhancements, as it is impractical to separate these costs from normal maintenance activities.
Goodwill and Intangible Assets—In accordance with Statement of Financial Accounting Standards (“SFAS”) No. 142,Goodwill and Other Intangible Assets, goodwill and intangible assets with indefinite useful lives are not amortized, but instead are tested for impairment at least annually, or more frequently if impairment indicators arise.
Intangible assets with finite lives are amortized over their estimated useful lives on an accelerated basis to reflect the pattern in which the economic benefits of the intangible assets are consumed and are reviewed for impairment in accordance with SFAS No. 144,Accounting for the Impairment or Disposal of Long-Lived Assets.
The Company tests goodwill for impairment annually at a reporting unit level using a two-step process. The first step of the impairment test involves comparing the fair values of the applicable reporting units with their aggregate carrying values, including goodwill. If the carrying amount of a reporting unit exceeds the reporting unit’s fair value, the Company then performs the second step of the goodwill impairment test to determine the amount of the impairment loss. The second step of the goodwill impairment test involves comparing the implied fair value of the affected reporting unit’s goodwill with the carrying value of that goodwill. If the carrying amount of goodwill exceeds the implied fair value of that goodwill, an impairment loss is recognized in an amount equal to that excess.
In its annual goodwill impairment assessment for fiscal year 2009, the Company concluded that the fair value of the reporting units to which goodwill was assigned exceeded their respective carrying values and, accordingly, goodwill was not impaired.
The Company tests indefinite-lived intangible assets at the unit of accounting level by making a determination of the fair value of the intangible asset. If the fair value of the intangible asset is less than its carrying value, an impairment loss is recognized in an amount equal to the difference. The Company also evaluates the remaining useful life of its intangible assets that are not subject to amortization on an annual basis to determine whether events and circumstances continue to support an indefinite useful life. If an intangible asset that is not being amortized is subsequently determined to have a finite useful life, that asset is tested for impairment. After recognition of the impairment, if any, the asset is amortized prospectively over its estimated remaining useful life and accounted for in the same manner as other intangible assets that are subject to amortization.
In its annual indefinite-lived intangible asset impairment assessment for fiscal year 2009, the Company concluded that the fair value of its indefinite-lived intangible asset exceeded its carrying value and, accordingly, the indefinite-lived intangible asset was not impaired.
Impairment of Long-Lived Assets—In accordance with SFAS No. 144, long-lived assets, including intangible assets with finite lives and property and equipment, are reviewed for impairment whenever events or changes in circumstances indicate that the carrying amount of an asset or asset group may not be recoverable. Conditions that would necessitate an impairment assessment include a significant decline in the price of an asset or asset group, a significant adverse change in the extent or manner in which an asset or asset group is being used, the loss of legal ownership or title to the asset, significant negative industry or economic trends or the
F-9
presence of other indicators that would indicate that the carrying amount of an asset or asset group is not recoverable. A long-lived asset is considered to be impaired if the estimated undiscounted future cash flows resulting from the use of the asset and its eventual disposition are not sufficient to recover the carrying value of the asset.
Net Income (Loss) Per Share/Unit—Basic net income (loss) per share/unit and diluted net loss per share/unit is calculated by dividing net income (loss) by the weighted-average number of common shares/units outstanding during the period, excluding shares/units subject to repurchase. Diluted net income (loss) per share/unit considers the dilutive effect of in-the-money stock options and nonvested restricted stock and restricted stock units, which is calculated using the treasury stock method. Under the treasury stock method, the amount of assumed proceeds from nonvested stock awards and unexercised stock options includes the amount of compensation cost attributable to future services not yet recognized, proceeds from the exercise of the options, and the incremental income tax benefit or liability as if the awards were exercised/issued during the period.
The computation of basic and diluted net income (loss) per share/unit is as follows (in thousands except for per share/unit data):
| | | | | | | | | | | | |
| | | Fiscal Years Ended June 30, | |
| | | 2009 | | | 2008 | | | 2007 | |
Net income (loss) applicable to common shares/units | | $ | 57,825 | | | $ | 598 | | | $ | (95,520 | ) |
| | | | | | | | | | | | |
Weighted-average number of common shares/units outstanding during the period | | | 67,603 | | | | 64,035 | | | | 36,041 | |
Weighted-average common shares/units subject to repurchase | | | (351 | ) | | | (535 | ) | | | (2,176 | ) |
| | | | | | | | | | | | |
Weighted-average number of common shares/units used to compute basic net income (loss) per share/unit | | | 67,252 | | | | 63,500 | | | | 33,865 | |
Effect of dilutive common stock equivalents: | | | | | | | | | | | | |
Options to purchase common stock | | | 43 | | | | 15 | | | | — | |
Restricted common stock awards | | | 437 | | | | 1,222 | | | | — | |
| | | | | | | | | | | | |
Weighted-average number of common shares/units used to compute diluted net income (loss) per share/unit | | | 67,732 | | | | 64,737 | | | | 33,865 | |
| | | | | | | | | | | | |
Basic net income (loss) per share/unit | | $ | 0.86 | | | $ | 0.01 | | | $ | (2.82 | ) |
| | | | | | | | | | | | |
Diluted net income (loss) per share/unit | | $ | 0.85 | | | $ | 0.01 | | | $ | (2.82 | ) |
| | | | | | | | | | | | |
The following securities that could potentially dilute earnings per share in the future are not included in the determination of diluted net income (loss) per share as their effect would have been antidilutive (in thousands):
| | | | | | |
| | | Fiscal Years Ended June 30, |
| | | 2009 | | 2008 | | 2007 |
Options to purchase common stock | | 255 | | 137 | | — |
Nonvested restricted common stock awards and units | | 33 | | 32 | | 2,332 |
Nonvested common units | | — | | — | | 2,010 |
Revenue Recognition—The Company recognizes and presents revenue in accordance with SEC Staff Accounting Bulletin (“SAB”) Topic 13,Revenue Recognition, AICPA SOP No. 97-2,Software Revenue Recognition, as amended, SFAS No. 13,Accounting for Leases,Emerging Issues Task Force (“EITF”) Issue No. 01-8,Determining Whether an Arrangement Contains a Lease, EITF Issue No. 00-03,Application of AICPA Statement of Position No. 97-2 to Arrangements That Include the Right to Use Software Stored on Another Entity’s Hardware, EITF Issue No. 00-21,Revenue Arrangements with Multiple Deliverables, and EITF No. 99-19,Reporting Revenue Gross as a Principal versus Net as an Agent. Accordingly, revenues are recognized only after services are provided, when persuasive evidence of an arrangement exists, the fee is fixed
F-10
and determinable, and when collectability is probable. The Company’s multiple element arrangements primarily include a combination of software licenses, hosted database and other services, installation and set-up services, hardware, maintenance services and transaction-based deliverables.
The Company generates a significant majority of its revenue from subscription-based contracts (where a monthly fee is charged), transaction-based contracts (where a fee per transaction is charged) and subscription-based contracts with additional transaction-based fees (where a monthly fee and a fee per transaction are charged).
Subscription-based and transaction-based contracts generally include the delivery of software, access to software through a hosted service (“Hosted Database”), upfront fees for the implementation and set-up activities necessary for the client to use/access the software (“Implementation Services”) and maintenance. Under a subscription arrangement, delivery of software, access to the Hosted Database and maintenance are considered a single element or a combined unit of accounting and related revenues are recognized at the end of each month upon the completion of the monthly service. Revenues under transaction-based contracts are recognized based on the guidance in AICPA Technical Practice Aid No. 5100.76,Fair value in multiple-element arrangements that include contingent usage based fees and software revenue recognition. The transaction-based fee represents payment for the right to use the software, access to the Hosted Database and maintenance. The fee is considered fixed and determinable only at the time actual usage occurs. Revenue is recognized based on actual usage. Implementation Services are considered a separate element or unit of accounting and the related revenue recognition is described below.
Subscription-based contracts with additional fees for certain types of transactions generally include all deliverables discussed in the above paragraph and also include an additional element, which is the option to access specialized queries on the Hosted Database. Revenue under subscription-based contracts with additional fees for certain types of transactions is accounted for based on the guidance in AICPA Technical Practice Aid No. 5100.76. Under these arrangements, the delivery of software, access to software through the Hosted Database and maintenance are considered a combined unit of accounting, and the related fee is recognized at the end of each month upon the completion of the monthly service. The transaction-based fee is recognized at the time of actual usage. Implementation Services are considered a separate element or unit of accounting and the related revenue recognition is described below.
When the Company is required to perform setup and implementation activities necessary for the client to receive services/software, up-front fees billed during the setup/implementation phase are deferred and amortized on a straight-line basis over the estimated customer life. The amortization of this deferred revenue will commence upon the start of the monthly service. Setup costs that are direct and incremental to the contract are capitalized and amortized on a straight-line basis over the estimated customer life.
In a limited number of its revenue arrangements, the Company also provides generic computer equipment as part of the sales arrangement. Based on guidance in EITF Issue No. 03-5,Applicability of SOP No. 97-2, “Software Revenue Recognition”, to Non-Software Deliverables in an Arrangement Containing More-than-Incidental Software, the generic computer equipment is considered a non-software deliverable since the Company’s software is not essential to the functionality of the generic computer equipment. The Company accounts for the sale of generic equipment as a direct finance lease. The related revenue is recognized over the term of the contract using the effective interest rate method. The Company allocates revenue to the elements of these arrangements on a relative fair value basis using the Company’s best estimate of the fair value of the elements. Revenue from leased computer equipment represents approximately 1% of the Company’s consolidated revenue.
Revenues are reflected net of customer sales allowances, which are based on both specific identification of certain accounts and a predetermined percentage of revenue based on historical experience.
F-11
Sales and Related Taxes Collected—Sales and related taxes collected from customers and remitted to various governmental agencies are excluded from reported revenues in the Company’s consolidated statement of operations.
Cost of revenues (excluding Depreciation and Amortization)—The Company’s costs and expenses applicable to revenues (“cost of revenues excluding depreciation and amortization”) represent the total of operating expenses and systems development and programming costs as presented on the consolidated statement of operations. Operating expenses include the compensation and benefits costs for operations, database development and customer service personnel, other costs related to operations, database development and customer support functions, as well as third-party data and royalty costs, and the cost of computer software and hardware used directly in the delivery of the Company’s products and services. Systems development and programming costs include compensation and benefit costs for the Company’s product development and product management personnel, other costs related to its product development and product management functions and costs related to external software consultants involved in systems development and programming activities.
Software Development Costs—Costs for the development of new software products and substantial enhancements to existing software products are expensed as incurred until technological feasibility has been established, at which time any additional costs would be capitalized in accordance with SFAS No. 86,Computer Software To Be Sold, Leased or Otherwise Marketed. The costs to develop such software have not been capitalized, as the Company believes its current software development process is essentially completed concurrent with the establishment of technological feasibility.
Foreign Currency Translation—The net assets of the Company’s foreign subsidiaries are translated into U.S. dollars based on foreign currency exchange rates in effect at the end of each period, and revenues and expenses are translated at average exchange rates during the periods. Functional currencies of significant foreign subsidiaries include Euros, British pounds, Swiss francs, and Canadian dollars. Gains or losses resulting from these foreign currency translations are recorded in accumulated other comprehensive income in the consolidated balance sheets.
Foreign currency transaction gains (losses), which are included in the results of operations, totaled $1,179,000, $4,793,000, and $(65,000) for the fiscal years ended June 30, 2009, 2008 and 2007, respectively.
Income Taxes—The provision for income taxes, income taxes payable and deferred income taxes are determined using the liability method. Deferred tax assets and liabilities are determined based on differences between the financial reporting and tax basis of assets and liabilities and are measured by applying enacted tax rates and laws to taxable years in which such differences are expected to reverse. A valuation allowance is provided when the Company determines that it is more likely than not that a portion of the deferred tax asset balance will not be realized.
Derivative Financial Instruments—Derivative financial instruments are used principally in the management of foreign currency and interest rate exposures and are recorded in the consolidated balance sheets at fair value. If the derivative is designated as a fair value hedge, the changes in the fair value of the derivative and of the hedged item attributable to the hedged risk are recognized as a charge or credit to earnings. If the derivative is designated as a cash flow hedge, the effective portions of the changes in the fair value of the derivative are initially recorded in accumulated other comprehensive income (loss) and are subsequently reclassified into earnings when the hedged transactions occur and affect earnings. Ineffective portions of changes in the fair value of cash flow hedges are recognized as a charge or credit to earnings. Derivative instruments not designated as hedges are marked-to-market at the end of each accounting period with the results included in results of operations.
Advertising Costs—Advertising costs are expensed when incurred and are included in selling, general and administrative expenses. Total advertising costs were $4,881,000, $4,297,000, and $4,775,000 for the fiscal years ended June 30, 2009, 2008 and 2007, respectively.
F-12
Share-Based Compensation—The Company accounts for share-based payments in accordance with SFAS No. 123 (revised 2004),Share-Based Payments (“SFAS No. 123(R)”). The Company adopted SFAS No. 123(R) effective January 1, 2006 using the modified prospective transition method. SFAS No. 123(R) requires the measurement of the grant date fair value for all share-based payment awards made to employees and directors, including stock options, restricted stock awards and restricted stock units. The estimated grant date fair value is then recognized as compensation expense on a straight-line basis over the requisite service period of the award, which generally equals the vesting period or, in the case of restricted stock awards, over the period during which the transfer restrictions exist. Compensation expense related to the Company’s employee stock purchase plan is recognized over the applicable offering period on a straight-line basis. The amount of share-based compensation expense recognized for share-based awards is net of estimated forfeitures of unvested awards. Under the true-up provisions of SFAS No. 123(R), we will record additional expense if the actual forfeiture rate is lower than estimated, and will record a recovery of prior expense if the actual forfeiture rate is higher than estimated. No compensation cost is recorded for awards that do not vest.
Accumulated Other Comprehensive Income—Accumulated other comprehensive income includes foreign currency translation adjustments, unrealized losses on derivatives related to the effective portion of cash flow hedges and changes in the funded status of defined benefit pension plans that are excluded from the consolidated statements of operations and are reported as a separate component in stockholders’/unitholders’ equity.
Accumulated other comprehensive income (loss) consists of the following (in thousands):
| | | | | | | | |
| | | June 30, | |
| | | 2009 | | | 2008 | |
Cumulative foreign currency translation adjustments | | $ | 20,852 | | | $ | 67,325 | |
Unrealized losses on derivative financial instruments, net of tax | | | (22,504 | ) | | | (6,539 | ) |
Change in funded status of defined benefit pension plan, net of tax | | | 7,971 | | | | 4,779 | |
| | | | | | | | |
Accumulated other comprehensive income | | $ | 6,319 | | | $ | 65,565 | |
| | | | | | | | |
Guarantees—The Company accounts for guarantees in accordance with Financial Accounting Standards Board (“FASB”) Interpretation (“FIN”) No. 45,Guarantor’s Accounting and Disclosure Requirements for Guarantees, Including Indirect Guarantees of Indebtedness of Others. FIN No. 45 requires that a guarantor recognize, at the inception of a guarantee, a liability for the fair value of certain guarantees and requires certain disclosures to be made by a guarantor about its obligations under certain guarantees that it has issued.
Recent Accounting Pronouncements—In June 2009, the FASB issued SFAS No. 168,The FASB Accounting Standards Codification and the Hierarchy of Generally Accepted Accounting Principles—a replacement of FASB Statement No. 162. The FASB Accounting Standards Codification (“Codification”) will become the source of authoritative U.S. generally accepted accounting principles (“GAAP”) recognized by the FASB to be applied by nongovernmental entities. Rules and interpretive releases of the SEC under authority of federal securities laws are also sources of authoritative GAAP for SEC registrants. Upon adoption of SFAS No. 168 in the first quarter of fiscal year 2010, the Codification will supersede all then-existing non-SEC accounting and reporting standards. All other non-grandfathered non-SEC accounting literature not included in the Codification will become nonauthoritative. The Company does not expect its adoption of SFAS No. 168 will have a material effect on its consolidated results of operations or financial condition.
In May 2009, the FASB issued SFAS No. 165,Subsequent Events. SFAS No. 165 is intended to establish general standards of accounting for and disclosure of events that occur after the balance sheet date but before financial statements are issued or are available to be issued. It requires the disclosure of the date through which an entity has evaluated subsequent events and the basis for selecting that date, that is, whether that date represents the date the financial statements were issued or were available to be issued. The Company adopted SFAS No. 165 in the fourth quarter of fiscal year 2009. The disclosures required by SFAS No. 165 are provided in Note 1.
F-13
In December 2008, the FASB issued Staff Position (“FSP”) No. FAS 132R-1,Employers’ Disclosures about Postretirement Benefit Plan Assets. FSP No. FAS 132R-1 amends SFAS No. 132R,Employers’ Disclosures about Postretirement Benefit Plan Assets, to provide for additional disclosure and documentation surrounding benefit plan assets and activities in annual disclosures. The Company’s adoption of FSP No. FAS 132R-1 in its consolidated financial statements for fiscal year 2010 will result in significantly expanded disclosures regarding its defined benefit pension plans.
In June 2008, the FASB issued FSP No. EITF 03-6-1,Determining Whether Instruments Granted in Share-Based Payment Transactions Are Participating Securities, which requires participating securities such as unvested restricted stock units containing nonforfeitable rights to receive dividends, whether paid or unpaid, to be included in the computation of earnings pursuant to the two-class method prescribed under SFAS No. 128,Earnings per Share. The Company is required to adjust all prior period earnings per share data on a retrospective basis to conform with the provisions of FSP No. EITF 03-6-1. This standard is effective for the Company’s first quarter of fiscal year 2010. The Company is currently assessing the impact of adopting FSP No. EITF 03-6-1.
In April 2008, the FASB issued FSP No. FAS 142-3,Determination of the Useful Life of Intangible Assets, which amends the factors that should be considered in developing renewal or extension assumptions used to determine the useful life of a recognized intangible asset under SFAS No. 142. The intent of the statement is to improve the consistency between the useful life of a recognized intangible asset and the period of expected cash flows used to measure the fair value of the asset. The Company will adopt FSP No. FAS 142-3 in the first quarter of fiscal year 2010. The Company is currently evaluating the potential impact, if any, of the adoption of FSP No. FAS 142-3 will have on its consolidated financial position, results of operations and cash flows.
In March 2008, the FASB issued SFAS No. 161, Disclosures about Derivative Instruments and Hedging Activities, an amendment of FASB Statement No. 133. SFAS No. 161 is intended to improve transparency in financial reporting by requiring enhanced disclosures of an entity’s derivative instruments and hedging activities and their effects on the entity’s financial position, financial performance, and cash flows. SFAS No. 161 applies to all derivative instruments within the scope of SFAS No. 133,Accounting for Derivative Instruments and Hedging Activities, as well as related hedged items, bifurcated derivatives, and nonderivative instruments that are designated and qualify as hedging instruments. Entities with instruments subject to SFAS No. 161 must provide more robust qualitative disclosures and expanded quantitative disclosures. The Company adopted SFAS No. 161 in fiscal year 2009. The disclosures required by SFAS No. 161 are provided in Note 8.
In December 2007, the FASB issued SFAS No. 160,Noncontrolling Interests in Consolidated Financial Statements, an amendment of ARB 51. SFAS No. 160 establishes accounting and reporting standards for ownership interests in subsidiaries held by parties other than the parent, the amount of consolidated net income attributable to the parent and to the noncontrolling interest, changes in a parent’s ownership interest, and the valuation of retained noncontrolling equity investments when a subsidiary is deconsolidated. SFAS No. 160 also establishes disclosure requirements that clearly identify and distinguish between the interests of the parent and the interests of the noncontrolling owners. SFAS No. 160 is effective for the Company beginning in the first quarter of fiscal year 2010 and will apply prospectively, except for the presentation and disclosure requirements, which will apply retrospectively. The Company is currently assessing the potential impact that adoption of SFAS No. 160 will have on its consolidated financial statements.
At the March 12, 2008 EITF meeting, the SEC Observer announced revisions to Topic No. D-98,Classification and Measurement of Redeemable Securities, which provides SEC registrants with guidance on the financial statement classification and measurement of equity securities that are subject to mandatory redemption requirements or whose redemption is outside the control of the issuer. The revised Topic No. D-98 requires minority interests that are redeemable at the option of the holder to be recorded outside of permanent equity at fair value, and the redeemable minority interests to be adjusted to their fair value at each balance sheet date. Adjustments to the carrying amount of a noncontrolling interest from the application of Topic No. D-98 are recorded to retained earnings (or additional paid-in-capital in the absence of retained earnings). The Company will adopt the revised provisions of Topic No. D-98 in the first quarter of fiscal year 2010 related to the
F-14
Company’s redeemable minority interest. Upon adoption of the revised provisions of Topic No. D-98, the Company will adjust the carrying value of its redeemable minority interests to fair value with a corresponding adjustment to stockholders’ equity in the consolidated balance sheet.
Had the Company adopted the revised provisions of Topic No. D-98 as of June 30, 2009, the Company would have recorded an approximately $82,000,000 increase to redeemable minority interest with a corresponding decrease to stockholders’ equity in the consolidated balance sheet. The Company estimates that its redeemable minority interests have an aggregate fair value of approximately $92,000,000 at June 30, 2009. The Company determined the fair value of its redeemable minority interests using a discounted cash flow model utilizing significant unobservable inputs, which are Level 3 inputs under SFAS No. 157.
In December 2007, the FASB issued SFAS No. 141 (revised) (“SFAS No. 141(R)”),Business Combinations. SFAS No. 141(R) requires an acquirer to recognize the assets acquired, the liabilities assumed, and any noncontrolling interest in the acquiree at the acquisition date to be measured at their fair value as of that date. An acquirer is required to recognize assets or liabilities arising from all other contingencies as of the acquisition date, measured at their acquisition-date fair values, only if it is more likely than not that they meet the definition of an asset or a liability. Any acquisition-related costs are to be expensed instead of capitalized. Additionally, restructuring expenses generally must be expensed in periods subsequent to the acquisition date and changes in accounting for deferred tax asset valuation allowances and acquired income tax uncertainties after the measurement period impact income tax expense. SFAS No. 141(R) applies prospectively to business combinations, if any, for which the acquisition date is on or after July 1, 2009. The impact on the Company’s consolidated financial statements from the adoption of SFAS No. 141(R) in fiscal year 2010 will depend on acquisitions at the time. Had the Company adopted SFAS No. 141(R) effective at the beginning of fiscal year 2009, approximately $3,300,000 of capitalized acquisition-related expenses related to the Company’s fiscal year 2009 acquisitions would have been recognized as a charge against fiscal year 2009 earnings and the Company would have recognized a liability at the acquisition date for the estimated fair value of contingent purchase consideration expected to be paid in the future. Additionally, any acquisition-related expenses incurred in fiscal year 2009 in relation to potential acquisitions which were not consummated by June 30, 2009 were charged against fiscal year 2009 earnings.
In September 2006, the FASB issued SFAS No. 157,Fair Value Measurements. SFAS No. 157 clarifies the principle that fair value should be based on the assumptions market participants would use when pricing an asset or liability and establishes a fair value hierarchy that prioritizes the information used to develop those assumptions. Under SFAS No. 157, fair value measurements would be separately disclosed by level within the fair value hierarchy. The Company’s adoption of SFAS 157 in the first quarter of fiscal year 2009 did not have a significant impact on its consolidated financial statements, although the Company is now required to provide additional financial statement disclosures. In February 2008, the FASB issued FSP No. FAS 157-2 which delays the effective date of SFAS No. 157 for all nonfinancial assets and nonfinancial liabilities, except those that are recognized or disclosed at fair value in the financial statements on a recurring basis (at least annually), to fiscal years beginning after November 15, 2008. The disclosures required by SFAS No. 157 are provided in Note 7.
Acquisition of HPI Ltd.—On December 19, 2008, the Company acquired 100% of the outstanding share capital of HPI Ltd. (“HPI”), a leading provider of used vehicle validation services in the United Kingdom. The Company’s acquisition of HPI is expected to enhance its delivery of decision support data and software applications to its customers. HPI will be included in the Company’s EMEA segment.
The total purchase price for the acquisition of HPI was approximately $123,080,000 (£79,902,000), which consisted of cash paid at closing of $103,293,000 (£67,056,000), acquisition-related expenses of $2,457,000 (£1,596,000), and a subordinated note payable with a principal amount of $17,330,000 (£11,250,000). The note accrues interest at 8.0% per annum, payable annually, and becomes due and payable in full on December 31,
F-15
2011, subject to certain acceleration events. The Company is required to make contingent future cash payments up to a maximum aggregate amount of approximately $7,394,000 (£4,800,000) if HPI achieves certain financial performance targets through December 31, 2011. If earned, these contingent future cash payments will be recognized as additional goodwill once the contingency is resolved and the amounts are due and payable. All amounts are payable in Pound Sterling.
Under the purchase method of accounting, the total purchase price is allocated to the tangible and identifiable intangible assets acquired and liabilities assumed based on their estimated fair values on the acquisition date. The results of operations of HPI are included in the consolidated results of operation of the Company from the acquisition date.
The Company allocated the purchase price to the tangible assets, liabilities, and identifiable intangible assets acquired, based on their estimated fair values as of the date of acquisition. The excess of the purchase price over the aggregate fair values was recorded as goodwill. None of the goodwill value recorded as part of the acquisition of HPI will be deductible for foreign income tax purposes.
The following table summarizes the purchase price allocation for the acquisition of HPI (in thousands):
| | | | |
Goodwill | | $ | 63,166 | |
Intangible assets | | | 69,626 | |
Cash acquired | | | 11,739 | |
Accounts receivable | | | 4,867 | |
Property and equipment | | | 5,478 | |
Other current and noncurrent assets | | | 712 | |
Liabilities assumed | | | (12,957 | ) |
Deferred income tax liability | | | (19,551 | ) |
| | | | |
Total | | $ | 123,080 | |
| | | | |
The purchase price allocated to purchased intangible assets and their respective amortizable lives are as follows (dollars in thousands):
| | | | | |
| | | Amortizable
Life
(in Years) | | Amount |
Trademark | | Indefinite | | $ | 16,482 |
Purchased customer list | | 15.0 | | | 17,561 |
Purchased technology | | 12.0 | | | 35,583 |
| | | | | |
| | | | $ | 69,626 |
| | | | | |
The weighted average amortizable life of the intangible assets purchased in the acquisition of HPI was 13.0 years.
The fair value assigned to purchased technology was determined by applying the income approach using the excess earnings methodology which involves estimating the future discounted cash flows to be derived from the currently existing technologies. The purchased trademark was valued using the income approach using the relief from royalty method, which assumes value to the extent that the acquired company is relieved of the obligation to pay royalties for the benefits received from them. The fair value assigned to the purchased customer list existing on the acquisition date was determined by applying the income approach using the excess earnings methodology based upon estimated future discounted cash flows attributable to revenues projected to be generated from those customers.
F-16
The following unaudited pro forma financial information assumes that the acquisition of HPI occurred at the beginning of each of the periods presented. The unaudited pro forma financial information is presented for informational purposes only and is not indicative of the results of operations that would have been achieved if the acquisition had taken place at the beginning of each of the periods presented. Amounts are in thousands, except per share data.
| | | | | | |
| | | Fiscal Years Ended June 30, |
| | | 2009 | | 2008 |
| | | (unaudited) |
Revenues | | $ | 577,828 | | $ | 590,693 |
Net income | | | 62,057 | | | 7,534 |
Net income per share—basic | | | 0.92 | | | 0.12 |
Net income per share—diluted | | | 0.92 | | | 0.12 |
Immaterial Acquisitions—During fiscal year 2009, the Company also acquired UC Universal Consulting Software Gmbh (“UCS”), a German provider of software and services to collision repair facilities, and Inpart Services Ltda. (“Inpart”), a Brazilian company that provides an internet-based auto part supplier application to auto insurance companies, for aggregate initial cash consideration of approximately $7,000,000 and contingent future cash payments of up to approximately $6,500,000. If earned, these contingent future cash payments will be recognized as additional goodwill once the contingency is resolved and the amounts are due and payable. Of the initial purchase price of the acquisitions, approximately $4,500,000 was allocated to goodwill and approximately $4,300,000 was allocated to purchased intangible assets, including purchased technology, purchased customer lists, trademarks and non-compete agreements. The weighted average amortizable life of intangible assets purchased in the acquisitions of UCS and Inpart was 9.0 years. Additionally, in fiscal year 2009, a contingent future cash payment of approximately $400,000 was earned and, accordingly, was recognized as additional goodwill.
Both entities have been consolidated into the results of operations subsequent to the respective acquisition dates. Pro forma results have not been presented because the effects of these acquisitions, individually and in the aggregate, were not material to the consolidated results of operations.
The objectives of the Company’s restructuring initiatives have been to eliminate waste and improve operational efficiencies. The restructuring reserves are included in accrued expenses and other current liabilities and other liabilities in the accompanying consolidated balance sheets. All amounts incurred in connection with the Company’s restructuring activities are recorded in restructuring charges in the accompanying consolidated statements of operations.
The following table summarizes the activity in the restructuring reserves for fiscal year 2009 (in thousands):
| | | | | | | | | | | | |
| | | Employee
Termination
Benefits | | | Lease-Related
Charges | | | Total | |
Balance at June 30, 2008 | | $ | 11,953 | | | $ | 2,609 | | | $ | 14,562 | |
Restructuring charges (1) | | | 4,516 | | | | — | | | | 4,516 | |
Cash payments | | | (7,440 | ) | | | (531 | ) | | | (7,971 | ) |
Other (2) | | | 849 | | | | — | | | | 849 | |
Effect of foreign exchange | | | (990 | ) | | | — | | | | (990 | ) |
| | | | | | | | | | | | |
Balance at June 30, 2009 | | $ | 8,888 | | | $ | 2,078 | | | $ | 10,966 | |
| | | | | | | | | | | | |
F-17
| (1) | Depreciation expense associated with property and equipment to be abandoned in connection with restructuring activities of $460,000 is also included in restructuring charges in the accompanying consolidated statement of operations for fiscal year 2009. |
| (2) | Consists of the restructuring liability established in connection with the acquisition of UCS. |
In April 2009, the Company initiated a restructuring plan in its Americas segment (the “Americas 2009 Plan”). The primary objective of the Americas 2009 Plan is the relocation of certain business delivery and general and administrative functions to the Company’s corporate headquarters in San Diego, California, as well as to Mexico, and the closure of the Company’s facility in San Ramon, California. Under the Americas 2009 Plan, the Company anticipates terminating approximately 120 employees and incurring termination benefits of approximately $3,000,000 which are anticipated to be paid through fiscal year 2010. Additionally, the Company expects to vacate the remaining floor it occupies at its leased facility in San Ramon during fiscal year 2010. Upon vacating the facility, the remaining lease obligation related to the floor will be approximately $6,100,000 which will be paid over the remaining lease term of approximately four years. The Company is in the process of attempting to locate a sublease tenant for the facility. However, no assurance can be given that a sublease tenant will be located and a sublease agreement will be executed on favorable terms to the Company. As a result of vacating the San Ramon facility, the Company expects to incur a charge in fiscal year 2010 of up to the remaining lease obligation depending upon the timing and amount of any sublease.
In June 2008, the Company initiated a restructuring plan in its EMEA segment (the “EMEA 2008 Plan”), which was designed to create a more efficient and flexible employee work force for parts of its EMEA segment. Under the EMEA 2008 Plan, the Company terminated approximately 64 employees and incurred termination benefits of approximately $10,364,000, of which $6,019,000 remains unpaid at June 30, 2009. The remaining unpaid termination benefits under the EMEA 2008 Plan are anticipated to be paid through fiscal year 2011. Of the termination benefits incurred under the EMEA 2008 Plan, approximately $849,000 resulted from the termination of 14 employees in connection with the acquisition of UCS and, accordingly, was recorded as a component of goodwill as of the purchase date.
In February 2008, the Company initiated a restructuring plan in its Americas segment (the “Americas 2008 Plan”), which was designed to create a more efficient and flexible employee workforce across the Americas segment. Under the Americas 2008 Plan, the Company terminated approximately 168 employees and incurred employee termination benefits of approximately $3,598,000, of which $175,000 remains unpaid at June 30, 2009. The remaining unpaid termination benefits under the Americas 2008 Plan are anticipated to be paid during fiscal year 2010.
In 2007, the Company initiated a restructuring plan in its Americas segment (the “Americas 2007 Plan”), which was designed to create appropriate resource levels and efficiencies for various functional groups across the Americas segment. Under the Americas 2007 Plan, the Company terminated approximately 112 employees and incurred employee termination benefits of approximately $2,323,000 million which were fully paid in fiscal year 2008. Additionally, in connection with the Americas 2007 Plan, the Company incurred a lease-related liability of $3,589,000 representing the remaining lease obligations related to the vacate portion of a leased facility, net of estimated future sublease income. At June 30, 2009, the remaining lease-related liability under Americas 2007 Plan was $2,067,000 which will be paid over the remaining lease term of 4.1 years.
In 2007, the Company initiated a restructuring plan in its EMEA segment (the “EMEA 2007 Plan”), which was designed to create a more efficient and flexible employee workforce for parts of its European operations in the EMEA segment. Under the EMEA 2007 Plan, the Company terminated approximately 45 employees and incurred employee termination benefits of approximately $5,015,000, of which $446,000 remains unpaid at June 30, 2009. The remaining unpaid termination benefits under the EMEA 2007 Plan are anticipated to be paid through fiscal year 2011.
F-18
The following table summarizes the restructuring charges incurred for each restructuring plan for the periods presented (in thousands):
| | | | | | | | | | | | | | | | | | | | | | | | |
| | | Solera Restructuring Plans | | |
| | | CSG (1) | | EMEA 2007 | | EMEA 2008 | | Americas 2007 | | Americas 2008 | | Americas 2009 | | Other | | Total |
Fiscal Year Ended June 30, 2009: | | | | | | | | | | | | | | | | | | | | | | | | |
Employee termination benefits | | $ | — | | $ | 142 | | $ | — | | $ | — | | $ | 1,847 | | $ | 1,504 | | $ | 1,023 | | $ | 4,516 |
Lease-related liabilities | | | — | | | — | | | — | | | — | | | — | | | — | | | — | | | — |
Other | | | — | | | — | | | — | | | — | | | — | | | 460 | | | — | | | 460 |
| | | | | | | | | | | | | | | | | | | | | | | | |
Total restructuring charges | | $ | — | | $ | 142 | | $ | — | | $ | — | | $ | 1,847 | | $ | 1,964 | | $ | 1,023 | | $ | 4,976 |
| | | | | | | | | | | | | | | | | | | | | | | | |
Fiscal Year Ended June 30, 2008: | | | | | | | | | | | | | | | | | | | | | | | | |
Employee termination benefits | | $ | — | | $ | 805 | | $ | 9,515 | | $ | 867 | | $ | 1,751 | | $ | — | | $ | — | | $ | 12,938 |
Lease-related liabilities | | | — | | | — | | | — | | | 348 | | | — | | | — | | | — | | | 348 |
| | | | | | | | | | | | | | | | | | | | | | | | |
Total restructuring charges | | $ | — | | $ | 805 | | $ | 9,515 | | $ | 1,215 | | $ | 1,751 | | $ | — | | $ | — | | $ | 13,286 |
| | | | | | | | | | | | | | | | | | | | | | | | |
Fiscal Year Ended June 30, 2007: | | | | | | | | | | | | | | | | | | | | | | | | |
Employee termination benefits | | $ | 525 | | $ | 4,068 | | $ | — | | $ | 1,456 | | $ | — | | $ | — | | $ | — | | $ | 6,049 |
Lease-related liabilities | | | — | | | — | | | — | | | — | | | — | | | — | | | — | | | — |
| | | | | | | | | | | | | | | | | | | | | | | | |
Total restructuring charges | | $ | 525 | | $ | 4,068 | | $ | — | | $ | 1,456 | | $ | — | | $ | — | | $ | — | | $ | 6,049 |
| | | | | | | | | | | | | | | | | | | | | | | | |
| (1) | Restructuring plan from acquisition of CSG |
Of the restructuring charges incurred in fiscal year 2009, $1,165,000 related to our EMEA segment and $3,811,000 related to our Americas segment.
| 5. | GOODWILL AND INTANGIBLE ASSETS |
Goodwill and intangible assets consist of the following (dollars in thousands):
| | | | | | | | | | | | | | | | |
| | | June 30, 2009 | | June 30, 2008 |
| | | Weighted
Average
Life (in
years) | | Gross
Carrying
Amount | | Accumulated
Amortization | | Weighted
Average
Life (in
years) | | Gross
Carrying
Amount | | Accumulated
Amortization |
Amortized intangible assets: | | | | | | | | | | | | | | | | |
Internally developed software | | 2.0 | | $ | 32,678 | | $ | 16,794 | | 2.3 | | $ | 27,862 | | $ | 14,138 |
Purchased customer relationships | | 16.4 | | | 206,375 | | | 85,755 | | 18.0 | | | 202,970 | | | 67,323 |
Purchased tradenames and trademarks | | 0.2 | | | 16,144 | | | 12,650 | | 2.0 | | | 17,264 | | | 9,598 |
Purchased software and database technology | | 7.2 | | | 312,884 | | | 147,715 | | 7.0 | | | 285,015 | | | 111,834 |
| | | | | | | | | | | | | | | | |
| | 9.9 | | $ | 568,081 | | $ | 262,914 | | 11.2 | | $ | 533,111 | | $ | 202,893 |
| | | | | | | | | | | | | | | | |
Intangible assets not subject to amortization: | | | | | | | | | | | | | | | | |
Goodwill | | | | $ | 651,099 | | | | | | | $ | 646,098 | | | |
Purchased tradenames and trademarks with indefinite life | | | | | 17,676 | | | | | | | | — | | | |
| | | | | | | | | | | | | | | | |
| | | | $ | 668,775 | | | | | | | $ | 646,098 | | | |
| | | | | | | | | | | | | | | | |
F-19
Changes in our goodwill are as follows (in thousands):
| | | | | | | | | | | | | | | | |
| | | Balance at
Beginning
of Year | | Current
Year
Acquisitions | | Adjustments | | Foreign
Currency
Translation
Effect | | | Balance at
End of
Year |
Year Ended June 30, 2009: | | | | | | | | | | | | | | | | |
EMEA | | $ | 557,084 | | $ | 66,285 | | $ | — | | $ | (62,879 | ) | | $ | 560,490 |
Americas | | | 89,014 | | | 1,850 | | | 67 | | | (322 | ) | | | 90,609 |
| | | | | | | | | | | | | | | | |
Total | | $ | 646,098 | | $ | 68,135 | | $ | 67 | | $ | (63,201 | ) | | $ | 651,099 |
| | | | | | | | | | | | | | | | |
Year Ended June 30, 2008: | | | | | | | | | | | | | | | | |
EMEA | | $ | 478,355 | | $ | — | | $ | 78 | | $ | 78,651 | | | $ | 557,084 |
Americas | | | 90,810 | | | — | | | — | | | (1,796 | ) | | | 89,014 |
| | | | | | | | | | | | | | | | |
Total | | $ | 569,165 | | $ | — | | $ | 78 | | $ | 76,855 | | | $ | 646,098 |
| | | | | | | | | | | | | | | | |
Amortization of intangible assets totaled $68,848,000, $77,702,000 and $87,313,000 for the fiscal years ended June 30, 2009, 2008 and 2007, respectively. Estimated amortization expense of amortized intangible assets for the next five fiscal years are as follows (in thousands):
| | | |
2010 | | $ | 68,197 |
2011 | | | 55,241 |
2012 | | | 45,191 |
2013 | | | 33,262 |
2014 | | | 26,189 |
Thereafter | | | 77,087 |
| | | |
Total | | $ | 305,167 |
| | | |
| 6. | OTHER FINANCIAL STATEMENT CAPTIONS |
Property and equipment—Property and equipment, net consists of the following (in thousands):
| | | | | | | | |
| | | June 30, | |
| | | 2009 | | | 2008 | |
Land and buildings | | $ | 19,708 | | | $ | 14,855 | |
Machinery and equipment | | | 3,672 | | | | 5,925 | |
Furniture and fixtures | | | 5,005 | | | | 5,641 | |
Data processing equipment | | | 19,153 | | | | 28,992 | |
Leasehold improvements | | | 15,251 | | | | 13,795 | |
Software licenses | | | 17,562 | | | | 15,044 | |
Capital leases | | | 2,516 | | | | 1,459 | |
| | | | | | | | |
Property and equipment at cost | | | 82,867 | | | | 85,711 | |
Less accumulated depreciation | | | (32,083 | ) | | | (36,468 | ) |
| | | | | | | | |
Property and equipment—net | | $ | 50,784 | | | $ | 49,243 | |
| | | | | | | | |
Depreciation expense was $17,298,000, $17,564,000 and $17,106,000 for fiscal years 2009, 2008 and 2007, respectively.
F-20
Other (income) expense, net—Other (income) expense, net consists of the following (in thousands):
| | | | | | | | | | | | |
| | | Fiscal Years Ended June 30, | |
| | | 2009 | | | 2008 | | | 2007 | |
Interest income | | $ | (3,606 | ) | | $ | (3,656 | ) | | $ | (2,633 | ) |
Net realized and unrealized gains on derivative instruments | | | (10,599 | ) | | | (832 | ) | | | (1,589 | ) |
Foreign exchange (gains) losses | | | (1,179 | ) | | | (4,793 | ) | | | 65 | |
Loss on debt extinguishment (Note 9) | | | — | | | | — | | | | 35,666 | |
Other | | | (272 | ) | | | (237 | ) | | | — | |
| | | | | | | | | | | | |
Other (income) expense—net | | $ | (15,656 | ) | | $ | (9,518 | ) | | $ | 31,509 | |
| | | | | | | | | | | | |
| 7. | FAIR VALUE MEASUREMENTS |
The Company adopted SFAS No. 157 in the first quarter of fiscal year 2009. SFAS No. 157 establishes a three-tier fair value hierarchy, which prioritizes the inputs used in measuring fair value. These tiers include: Level 1, defined as observable inputs such as quoted market prices in active markets; Level 2, defined as inputs other than quoted prices in active markets that are either directly or indirectly observable; and Level 3, defined as unobservable inputs in which little or no market data exists, therefore requiring an entity to develop its own assumptions.
Assets and Liabilities Measured at Fair Value on a Recurring Basis—The following table summarizes the Company’s assets and liabilities that require fair value measurements on a recurring basis and their respective input levels based on the SFAS No. 157 fair value hierarchy (in thousands):
| | | | | | | | | | | | |
| | | | | Fair Value Measurements at June 30, 2009 Using: |
| | | Fair Value at
June 30, 2009 | | Quoted Market
Prices for
Identical Assets
(Level 1) | | Significant Other
Observable
Inputs
(Level 2) | | Significant
Unobservable
Inputs
(Level 3) |
Cash and cash equivalents | | $ | 223,420 | | $ | 223,420 | | $ | — | | $ | — |
Short-term investments | | | 11,941 | | | 11,941 | | | — | | | — |
Restricted cash (1) | | | 3,448 | | | 3,448 | | | — | | | — |
Derivative financial instruments (2) | | | 22,894 | | | — | | | 22,894 | | | — |
| (1) | Included in other current assets and other noncurrent assets in the accompanying consolidated balance sheet. |
| (2) | Included in other noncurrent liabilities in the accompanying consolidated balance sheet. |
Cash and cash equivalents, short-term investments and restricted cash. The Company’s cash and cash equivalents, short-term investments and restricted cash, primarily consist of bank deposits, money market funds and bank certificates of deposit. The fair value of the Company’s cash and cash equivalents, short-term investments and restricted cash are determined using quoted market prices for identical assets (Level 1 inputs).
Derivative financial instruments. The Company’s derivative financial instruments at June 30, 2009 consisted entirely of interest rate swaps. The Company estimates the fair value of its interest rate swaps using industry standard valuation techniques to extrapolate future reset rates from period-end yield curves and standard valuation models based on a discounted cash flow model. Market-based observable inputs including spot and forward rates, volatilities and interest rate curves at observable intervals are used as inputs to the models (Level 2 inputs).
Assets and Liabilities Measured at Fair Value on a Nonrecurring Basis—In February 2008, the FASB issued FSP No. FAS 157-2 which delays the effective date of SFAS No. 157 for all nonfinancial assets and nonfinancial liabilities, except those that are recognized or disclosed at fair value in the financial statements on a
F-21
recurring basis (at least annually), to fiscal years beginning after November 15, 2008. Accordingly, the Company only partially adopted SFAS No. 157 during fiscal year 2009 and did not apply the provisions of SFAS No. 157 to its goodwill, intangible assets and other long-lived assets.
Fair Value of Other Financial Instruments—The carrying amounts of certain of the Company’s financial instruments, including accounts receivable, accounts payable and accrued expenses, approximate fair value due to their short-term nature. The carrying amounts of the Company’s senior secured credit facility approximate its fair value at June 30, 2009 and 2008, respectively, due to its variable interest rate. The estimated fair value of the note payable issued in connection with the acquisition of HPI was approximately $20,081,000 at June 30, 2009. The Company determined the fair value of the note payable using a discounted cash flow model with a discount rate of 5.0% which represents the weighted average interest rate on the senior secured credit facility.
| 8. | DERIVATIVE FINANCIAL INSTRUMENTS |
In the normal course of business, the Company is exposed to interest rate changes and foreign currency fluctuations. The Company strives to limit these risks through the use of derivatives such as interest rate swaps and foreign exchange options. Derivatives are not used for speculative purposes.
In February 2006, the Company entered into a foreign currency exchange option (the “Fx Option”) that gave the Company the option to call $200,000,000 at a strike price of 1.1646 EUR/USD at any time up to February 8, 2011. The Fx Option was not designated as a hedging instrument. The Company paid $7,912,000 for the Fx Option. In November 2008, the Company sold the Fx Option for $12,400,000. During fiscal year 2009, the Company recorded a gain of $10,599,000 due to increased volatility in foreign currency rates and changes in interest rates. The gain was recognized in other income, net in the accompanying consolidated statement of operations.
In June 2007, the Company entered into three U.S. dollar-based interest rate swaps (“US Term loan interest rate swaps”) and three Euro-based interest rate swaps (“EUR Term loan interest rate swaps”). The following table summarizes the fair value of the Company’s derivative financial instruments which are included in other noncurrent liabilities in the accompanying consolidated balance sheet as of June 30, 2009 (in thousands):
| | | | |
| | | Fair Value | |
Derivatives designated as hedging instruments: | | | | |
US Term loan interest rate swaps | | $ | (13,271 | ) |
EUR Term loan interest rate swaps | | | (9,623 | ) |
| | | | |
Total | | $ | (22,894 | ) |
| | | | |
These interest rate swaps were designated and documented at their inception as cash flow hedges for floating rate debt and are evaluated for effectiveness quarterly. The effective portion of the gain or loss on these hedges is reported as a component of accumulated other comprehensive (loss) income in stockholders’ equity and reclassified into earnings when the hedged transaction affects earnings. The ineffective portion of these cash flow hedges is recognized in interest expense. The estimated fair values of the Company’s derivatives were determined based on quoted market prices and may not be representative of actual values that could have been realized or that will be realized in the future.
F-22
The following table summarizes the outstanding derivatives designated as cash flow hedges as of June 30, 2009 (in thousands):
| | | | | | | | | | |
Type | | Fixed
Rate | | | Start Date of
Swap | | End Date of
Swap | | Notional Amount
Outstanding |
Interest rate contracts | | | | | | | | | | |
US Term loan interest rate swap | | 5.4450 | % | | 06/29/2007 | | 6/30/2011 | | $ | 50,000 |
US Term loan interest rate swap | | 5.4180 | % | | 06/29/2007 | | 6/30/2011 | | $ | 63,415 |
US Term loan interest rate swap | | 5.4450 | % | | 06/29/2007 | | 6/30/2011 | | $ | 75,000 |
EUR Term loan interest rate swap | | 4.6030 | % | | 06/29/2007 | | 6/30/2011 | | € | 28,836 |
EUR Term loan interest rate swap | | 4.6790 | % | | 06/29/2007 | | 6/30/2011 | | € | 50,000 |
EUR Term loan interest rate swap | | 4.6850 | % | | 06/29/2007 | | 9/30/2010 | | € | 60,000 |
The following table summarizes the effect of the interest rate swaps on the consolidated statement of operations and accumulated other comprehensive income (“AOCI”) for fiscal year 2009 (in thousands):
| | | | | | | | | | | | | | | | |
Derivatives in SFAS No. 133 Cash Flow
Hedging Relationship | | Gain/(loss)
Recognized in
AOCI on
Derivatives (1) | | | Location of gain/
(loss) Reclassified
from AOCI
into Income (1) | | Gain/(loss)
Reclassified
from AOCI
into Income (1) | | | Location of Gain/
(loss) Recognized
in Income on
Derivative (2) | | Gain/(loss)
recognized in
Income on
Derivative (2) | |
US Term loan interest rate swaps | | $ | (10,426 | ) | | Interest Expense | | $ | (5,958 | ) | | Interest Expense | | $ | (354 | ) |
EUR Term loan interest rate swaps | | | (14,356 | ) | | Interest Expense | | | (2,175 | ) | | Interest Expense | | | 29 | |
| | | | | | | | | | | | | | | | |
Total | | $ | (24,782 | ) | | | | $ | (8,133 | ) | | | | $ | (325 | ) |
| | | | | | | | | | | | | | | | |
| (2) | Ineffective portion and amount excluded from effectiveness testing. |
Long-term debt consists of the following (in thousands):
| | | | | | |
| | | June 30, |
| | | 2009 | | 2008 |
Senior secured domestic term loan due May 2014 | | $ | 216,475 | | $ | 218,697 |
Senior secured european term loan due May 2014 | | | 363,020 | | | 412,209 |
Subordinated note payable due December 2011 | | | 18,585 | | | — |
| | | | | | |
Total long-term debt | | | 598,080 | | | 630,906 |
Less current portion | | | 5,880 | | | 6,336 |
| | | | | | |
Long-term portion | | $ | 592,200 | | $ | 624,570 |
| | | | | | |
Future minimum principal payments as of June 30, 2009 are as follows (in thousands):
| | | |
2010 | | $ | 5,928 |
2011 | | | 5,928 |
2012 | | | 24,513 |
2013 | | | 5,928 |
2014 | | | 555,783 |
| | | |
Total | | $ | 598,080 |
| | | |
F-23
Senior Secured Credit Facilities—In May 2007, the Company entered into the Amended and Restated First Lien Credit and Guaranty Agreement with a syndicate of commercial lenders, which provides the Company with the following borrowing commitments: a $50,000,000 senior secured revolving credit facility (the “Revolving Credit Facility”), a $230,000,000 senior secured domestic term loan (the “Domestic Term Loan”) and a €280,000,000 senior secured European term loan (the “European Term Loan”).
The Domestic Term Loan and European Term Loan require quarterly minimum principal payments with the remaining unpaid balance due in full in May 2014. Voluntary prepayments are allowed under specified conditions and mandatory prepayments and commitment reductions are required upon the occurrence of certain events, including, among others, sales of assets, receipts of insurance or condemnation proceeds, excess cash flow and issuances of debt and equity securities. Future quarterly minimum principal payments will be reduced upon a voluntary prepayment. During fiscal year 2008, the Company made a voluntary principal prepayment of $8,500,000 on the Domestic Term Loan and €15,500,000 on the European Term Loan. As a result, the quarterly minimum principal payments on the Domestic Term Loan and European Term Loan decreased to $554,000 and €661,000, respectively.
Borrowings under the Amended and Restated First Lien Credit and Guaranty Agreement bear interest, to be reset at the Company’s option, at a rate determined by the sole lead arranger of the syndicate of commercial lenders equal to the offer rate on dollars based on the British Bankers’ Association Settlement Rate for deposits or the offer rate on the Euro from the Banking Federation of the European Union. In the event such rates are not available, borrowings bear interest at the offered quotation rate to first class banks in the London inter-bank market or European inter-bank market by Citibank USA Inc. for deposits, respectively, in each case, plus an applicable margin that varies based upon the Company’s consolidated leverage ratio, as defined in the agreement. At June 30, 2009, the interest rates on the Domestic Term Loan and European Term Loan were 2.4% and 3.1%, respectively. Interest is payable quarterly.
The costs incurred in relation to the Amended and Restated First Lien Credit and Guaranty Agreement, which totaled $4,393,000, were deferred and are included in other noncurrent assets in the consolidated balance sheet. The Company is amortizing the deferred loan costs to interest expense over the expected term of the Amended and Restated First Lien Credit and Guaranty Agreement using the straight line method.
The obligations under the Amended and Restated First Lien Credit and Guaranty Agreement are secured by substantially all of the assets of the Company. The Amended and Restated First Lien Credit and Guaranty Agreement contains certain covenants including, among others, requirements related to financial reporting, maintenance of operations, compliance with applicable laws and regulations, maintenance of interest rate protection and compliance with specified financial covenants, as well as restrictions related to liens, investments, business combinations, additional indebtedness, dispositions of assets or subsidiary interests, dividends, distributions, issuances of equity securities, transactions with affiliates, capital expenditures and certain other changes in the business. The Amended and Restated First Lien Credit and Guaranty Agreement also contains a leverage ratio, which is applicable only to the revolving loans and applies only if at least $10 million of revolving loans, including outstanding letters of credit, are outstanding for at least 10 days during the prior fiscal quarter. The Company is in compliance with its specified financial covenants at June 30, 2009.
The Company also has a Second Lien Credit and Guaranty Agreement with a syndicate of commercial lenders, which provides the Company with a commitment for an additional €165,000,000 European term loan (the “European Second Lien Term Loan”).
Subordinated Note Payable—In connection with the acquisition of HPI in December 2008 (Note 3), the Company issued a subordinated note payable with a principal amount of $17,330,000 (£11,250,000). The note accrues interest at 8.0% per annum, payable annually, and becomes due and payable in full on December 31, 2011, subject to certain acceleration events.
F-24
Subordinated Unsecured Credit Facility—In April 2006, the Company entered into the Subordinated Unsecured Credit Agreement with a syndicate of commercial lenders. The Subordinated Unsecured Credit Agreement consists of a European term loan (the “European Mezzanine Loan”) of €80,000,000. On May 16, 2007, the Company repaid the remaining outstanding balance under the Subordinated Unsecured Credit Agreement of $124,396,000 along with a prepayment premium of $2,486,000. As a result, the Company recognized a loss on extinguishment of debt of $35,666,000 in other (income) expense, net in the consolidated statement of operations, of which $28,691,000 represents the write-off of the remaining deferred loan costs associated with the Subordinated Unsecured Credit Agreement and $6,975,000 represents the prepayment premium.
| 10. | SHARE-BASED COMPENSATION |
During fiscal year 2009, the Company granted stock options and restricted stock units to its employees and members of its board of directors under its 2008 Omnibus Equity Incentive Plan (the “2008 Plan”), which was approved by the Company’s stockholders in November 2008, and its 2007 Long-Term Equity Incentive Plan (the “2007 Plan”). Stock options are granted at exercise prices equal to the fair market value of the Company’s common stock on the date of grant, generally vest ratably over four years and have a term of 7 to 10 years. Restricted stock unit grants generally vest ratably over four years. Upon stockholder approval of the 2008 Plan, the Company ceased granting awards under the 2007 Plan and the remaining shares available for grant under the 2007 Plan were added to the shares authorized for grant under the 2008 Plan. Additionally, any awards previously granted under the 2007 Plan that expire unexercised or are forfeited are added to the shares authorized for grant under the 2008 Plan. At June 30, 2009, 11,965,000 shares remain available for future grant of awards under the 2008 Plan.
The Company also has an employee stock purchase plan (“the ESPP”) that allows eligible employees to purchase shares of common stock at a price equal to 95% of the lower of the fair market value of the common stock at the beginning or end of each six-month offering period. The Company has reserved for issuance 1,500,000 shares of its common stock under the ESPP. During fiscal years 2009 and 2008, the Company issued approximately 23,000 shares and 6,000 shares, respectively, of its common stock under the ESPP. At June 30, 2009, 1,471,000 shares remain available for future grant of awards under the ESPP.
In November 2006, the board of managers adopted the 2006 Securities Purchase Plan. In January and February 2007, pursuant to securities purchase agreements, 24 employees purchased common equity interests in the Company that were converted into approximately 740,000 shares of common stock. Pursuant to such agreements, the shares of stock held by these employees remains subject to vesting over a five-year period, and unvested shares remain, under certain circumstances, subject to repurchase by the Company or, to the extent the Company does not repurchase, by affiliates of GTCR Golder Rauner II, L.L.C. (“GTCR”), a private equity investor in the Company. No additional equity will be issued under this plan.
Share-Based Award Activity—The following table summarizes restricted stock award and restricted stock unit activity during fiscal year 2009 (shares in thousands):
| | | | | | |
| | | Number of
Shares | | | Weighted Average
Grant Date
Fair Value per Share |
Nonvested at June 30, 2008 | | 805 | | | $ | 9.33 |
Granted | | 244 | | | $ | 23.60 |
Vested | | (322 | ) | | $ | 9.19 |
Forfeited | | (70 | ) | | $ | 18.64 |
| | | | | | |
Nonvested at June 30, 2009 | | 657 | | | $ | 13.60 |
| | | | | | |
F-25
The following table summarizes stock option activity during fiscal year 2009 (shares in thousands):
| | | | | | | | | | | |
| | | Number
of Shares | | | Weighted Average
Exercise Price
per Share | | Weighted Average
Remaining
Contractual Term
(in years) | | Aggregate
Intrinsic Value
(in thousands) |
Outstanding at June 30, 2008 | | 1,068 | | | $ | 22.49 | | | | | |
Granted | | 716 | | | $ | 24.07 | | | | | |
Exercised | | (74 | ) | | $ | 16.24 | | | | | |
Canceled | | (247 | ) | | $ | 23.51 | | | | | |
| | | | | | | | | | | |
Outstanding at June 30, 2009 | | 1,463 | | | $ | 23.06 | | 8.5 | | $ | 4,025 |
| | | | | | | | | | | |
Exercisable at June 30, 2009 | | 351 | | | $ | 22.41 | | 8.5 | | $ | 1,199 |
| | | | | | | | | | | |
Of the stock options outstanding at June 30, 2009, approximately 1,400,000 are expected to vest.
Cash received from the exercise of stock options was $1,225,000 during fiscal year 2009. The intrinsic value of stock options exercised during fiscal years 2009 and 2008 totaled $809,000 and $28,000, respectively. No stock options were exercised in fiscal year 2007.
Valuation of Share-Based Awards—We utilized the Black-Scholes option pricing model for estimating the grant date fair value of stock options granted during fiscal years 2009, 2008 and 2007 with the following assumptions:
| | | | | | | | | | | | | | |
| | | Risk-Free
Interest Rate | | | Expected Term
(in years) | | Weighted Average
Expected Stock
Price Volatility | | | Expected
Dividend Yield | | | Weighted Average
Per Share Grant
Date Fair Value |
Year Ended June 30, 2009 | | | | | | | | | | | | | | |
Stock options | | 3.2 | % | | 6.1 | | 27 | % | | 0 | % | | $ | 7.92 |
Year Ended June 30, 2008 | | | | | | | | | | | | | | |
Stock options | | 3.2 | % | | 6.1 | | 27 | % | | 0 | % | | $ | 9.03 |
Year Ended June 30, 2007 | | | | | | | | | | | | | | |
Stock options | | 4.5 | % | | 6.1 | | 33 | % | | 0 | % | | $ | 6.63 |
The risk-free interest rates are based on the implied yield available on U.S. Treasury constant maturities in effect at the time of the grant with remaining terms equivalent to the respective expected terms of the options. Because the Company has a limited history of stock option exercises, the expected award life was determined using the “simplified method” described in SAB No. 110,Share-Based Payments. The expected volatility was determined based on a combination of implied market volatilities, historical volatility of the Company’s stock price and other factors. The dividend yield of zero is based on the fact that the Company has never paid cash dividends.
The fair value of restricted stock awards and restricted stock units is based on the market price of the Company’s common stock on the date of grant. Due to the significant difference between the purchase price and fair value per share of restricted stock awards and restricted stock units, the fair value of these awards approximates their intrinsic value.
Share-Based Compensation Expense—Share-based compensation expense, which is included in selling, general and administrative expenses in the accompanying consolidated statements of operations, was $6,711,000, $4,848,000 and $2,343,000 for fiscal years 2009, 2008 and 2007, respectively. At June 30, 2009, the estimated total remaining unamortized compensation expense, net of forfeitures, associated with share-based awards was $15,900,000 which is expected to be recognized over a weighted-average period of 2.9 years.
F-26
| 11. | EMPLOYEE BENEFIT PLANS |
Defined Benefit Pension Plans—The Company’s foreign subsidiaries sponsor various defined benefit pension plans and individual defined benefit arrangements covering certain eligible employees. The benefits under these pension plans are based on years of service and compensation levels. Funding is limited to statutory requirements. The measurement date for all plans is June 30 of each fiscal year.
In September 2006, the FASB issued SFAS No. 158,Employers’ Accounting for Defined Benefit Pension and Other Postretirement Plans—an amendment of FASB Statements No. 87, 88, 106 and 132(R). SFAS No. 158 requires a company to (a) recognize in its statement of financial position an asset for a plan’s overfunded status or a liability for a plan’s underfunded status, (b) measure a plan’s assets and its obligations that determine its funded status as of the end of the employer’s fiscal year, and (c) recognize changes in the funded status of a defined benefit plan in the year in which the changes occur which are reported in other comprehensive income (loss). The requirement to recognize the funded status of a benefit plan and the related disclosure requirements were effective for the Company as of the end of fiscal year 2007 and the Company adopted SFAS No. 158 at that time. The impact of the adoption of SFAS No. 158 in fiscal year 2007, comprising actuarial gains and losses, resulted in a reduction to stockholders’ equity of $492,000 and consists of an increase (decrease) to the following accounts in the consolidated balance sheet (in thousands):
| | | | |
Other liabilities (non-current) | | $ | 559 | |
Long term deferred income tax liabilities | | | (67 | ) |
| | | | |
Impact to stockholders’ equity | | $ | (492 | ) |
| | | | |
The change in benefit obligations and plan assets as well as the funded status of the Company’s foreign pension plans were as follows (in thousands):
| | | | | | | | |
| | | June 30, | |
| | | 2009 | | | 2008 | |
Change in plan assets: | | | | | | | | |
Fair value of plan assets—beginning of year | | $ | 71,768 | | | $ | 53,000 | |
Net transfer, including effect of business combination | | | — | | | | 7,500 | |
Actual return on plan assets | | | 1,944 | | | | 2,200 | |
Employer contributions | | | 3,681 | | | | 4,100 | |
Participant contributions | | | 762 | | | | 800 | |
Benefits and expenses paid | | | (708 | ) | | | (3,500 | ) |
Settlement | | | — | | | | (3,500 | ) |
Foreign currency exchange rate changes | | | (6,471 | ) | | | 11,200 | |
| | | | | | | | |
Fair value of plan assets—end of year | | | 70,976 | | | | 71,800 | |
| | | | | | | | |
Change in benefit obligation: | | | | | | | | |
Benefit obligation—beginning of year | | $ | 76,920 | | | $ | 63,300 | |
Net transfer, including effect of business combination | | | — | | | | 7,700 | |
Service cost | | | 2,748 | | | | 3,400 | |
Interest cost | | | 3,399 | | | | 3,300 | |
Participant contributions | | | 762 | | | | 800 | |
Actuarial gain | | | (5,104 | ) | | | (7,300 | ) |
Benefits and expenses paid | | | (708 | ) | | | (7,000 | ) |
Foreign currency exchange rate changes | | | (6,960 | ) | | | 12,600 | |
| | | | | | | | |
Projected benefit obligation—end of year | | $ | 71,057 | | | $ | 76,800 | |
| | | | | | | | |
Funded status—plan assets less benefit obligation | | $ | (81 | ) | | $ | (5,000 | ) |
Unrecognized net actuarial (gain) loss due to experience different than assumed | | | — | | | | — | |
| | | | | | | | |
Accrued pension liability | | $ | (81 | ) | | $ | (5,000 | ) |
| | | | | | | | |
F-27
Net transfers of plan assets and benefit obligations are the result of the Company’s acquisition of CSG in April 2006. During the fiscal year ended June 30, 2007, retirement plans that were included in the Company’s purchase of CSG, and were previously accounted for as defined contribution plans, were determined to be defined benefit plans under SFAS No. 87,Employers’ Accounting for Pensions. During the fiscal year ended June 30, 2007, the funded status of these acquired plans was recorded as an adjustment to the purchase price allocation.
The amounts recognized in the consolidated balance sheets are as follows (in thousands):
| | | | | | | | |
| | | June 30, | |
| | | 2009 | | | 2008 | |
Noncurrent assets | | $ | 2,271 | | | $ | 700 | |
Noncurrent liabilities | | | (2,352 | ) | | | (5,700 | ) |
| | | | | | | | |
Net asset (obligation) recognized on balance sheet | | $ | (81 | ) | | $ | (5,000 | ) |
| | | | | | | | |
The accumulated benefit obligation for all defined benefit pension plans was $66,380,000 and $70,500,000 at June 30, 2009 and 2008, respectively.
The projected benefit obligation, accumulated benefit obligation and fair value of plan assets for the Company’s pension plans with accumulated benefit obligations in excess of plan assets were $71,057,000, $66,380,000 and $70,976,000, respectively, as of June 30, 2009.
The components of net pension expense were as follows (in thousands):
| | | | | | | | | | | | |
| | | Fiscal Years Ended June 30, | |
| | | 2009 | | | 2008 | | | 2007 | |
Service cost—benefits earned during the period | | $ | 2,748 | | | $ | 3,400 | | | $ | 3,400 | |
Interest cost on projected benefits | | | 3,399 | | | | 3,300 | | | | 2,700 | |
Expected return on plan assets | | | (2,982 | ) | | | (3,000 | ) | | | (2,400 | ) |
Recognized actuarial (gain) loss | | | (109 | ) | | | — | | | | — | |
| | | | | | | | | | | | |
| | $ | 3,056 | | | $ | 3,700 | | | $ | 3,700 | |
| | | | | | | | | | | | |
General assumptions used to determine the actuarial present value of benefit obligations were:
| | | | | | | | | |
| | | Fiscal Years Ended June 30, | |
| | | 2009 | | | 2008 | | | 2007 | |
Discount rate | | 5.36 | % | | 5.07 | % | | 4.21 | % |
Increase in compensation levels | | 2.13 | | | 2.19 | | | 1.89 | |
General assumptions used to determine the net pension expense were:
| | | | | | | | | |
| | | Fiscal Year Ended June 30, | |
| | | 2009 | | | 2008 | | | 2007 | |
Discount rate | | 5.07 | % | | 4.22 | % | | 4.09 | % |
Expected long-term rate of return on assets | | 4.62 | | | 4.43 | | | 4.24 | |
Increase in compensation levels | | 2.16 | | | 2.02 | | | 1.99 | |
The discount rate is based upon published rates for high-quality fixed-income investments that produce cash flows that approximate the timing and amount of expected future benefit payments.
F-28
The weighted-average long-term expected rate of return on assets has been determined based on historical and expected future rates of return on plan assets considering the target asset mix and the long-term investment strategy.
The plan assets of the pension plans are the liability of insurance companies and benefit payments are fully insured. The insurance companies invest the plan assets in accordance with the terms of the insurance companies’ guidelines and the Company has no control over the investment decisions made by the insurance companies. The insurance companies invest virtually the entire pension plan portfolio in fixed income securities.
The contributions for the fiscal years ended June 30, 2009 and 2008 were $3,681,000 and $4,100,000, respectively. The minimum required contribution and expected contribution to the Company’s pension plans are $3,693,000 for the fiscal year ending June 30, 2010.
Expected future benefit payments as of June 30, 2009 are as follows (in thousands):
| | | |
2010 | | $ | 1,427 |
2011 | | | 3,636 |
2012 | | | 1,926 |
2013 | | | 2,298 |
2014 | | | 2,423 |
2015 – 2019 | | | 17,166 |
The expected benefits to be paid are based on the same assumptions used to measure the Company’s pension plans’ benefit obligation at June 30, 2009 and include estimated future employee service.
Defined Contribution Retirement and Savings Plans—The Company has a qualifying 401(k) defined contribution plan that covers most of its domestic employees and provides company matching contributions under various formulas. For the fiscal years ended June 30, 2009, 2008 and 2007, we incurred $1,165,000, $1,409,000, and $1,096,000, respectively, in costs related to the 401(k) plan relating to Company matching contributions.
The Company’s foreign subsidiaries have defined contribution plans that cover certain international employees and provide company matching contributions under various formulas. For the fiscal years ended June 30, 2009, 2008 and 2007, we incurred $3,555,000, $3,300,000 and $3,000,000, respectively, in costs related to our foreign defined contribution plans relating to Company matching contributions.
| 12. | RELATED-PARTY TRANSACTIONS |
In connection with the Unit Purchase Agreement between the Company and GTCR, the Company entered into a professional services agreement (the “Professional Services Agreement”) with GTCR, under which the Company incurred management fees of $208,000 for the fiscal year ended June 30, 2007. A member of the Company’s board of directors is a managing partner of GTCR.
Certain minority stockholders of the Company’s international subsidiaries are also commercial purchasers and users of the Company’s software and services. Revenue transactions with all of the individual minority stockholders in the aggregate represent approximately 6% of consolidated revenue for fiscal year 2009 and aggregate accounts receivable from the minority stockholders represent approximately 8% of consolidated accounts receivable at June 30, 2009. The corresponding amounts for fiscal years 2008 and 2007 were less than 5%.
F-29
The components of income (loss) before income taxes attributable to domestic and foreign operations are as follows (in thousands):
| | | | | | | | | | | |
| | | Fiscal Years Ended June 30, | |
| | | 2009 | | 2008 | | | 2007 | |
Domestic | | $ | 6,568 | | $ | (19,821 | ) | | $ | (48,759 | ) |
Foreign | | | 86,233 | | | 61,997 | | | | (28,870 | ) |
| | | | | | | | | | | |
| | $ | 92,801 | | $ | 42,176 | | | $ | (77,629 | ) |
| | | | | | | | | | | |
The income tax provision (benefit) by jurisdiction are as follows (in thousands):
| | | | | | | | | | | | |
| | | Fiscal Years Ended June 30, | |
| | | 2009 | | | 2008 | | | 2007 | |
Current: | | | | | | | | | | | | |
Federal | | $ | 60 | | | $ | 1,829 | | | $ | (464 | ) |
Foreign | | | 34,117 | | | | 25,698 | | | | 21,907 | |
State | | | 1,100 | | | | 2,193 | | | | (372 | ) |
| | | | | | | | | | | | |
Total current | | | 35,277 | | | | 29,720 | | | | 21,071 | |
| | | | | | | | | | | | |
Deferred: | | | | | | | | | | | | |
Federal | | | — | | | | 17,501 | | | | (13,417 | ) |
Foreign | | | (8,627 | ) | | | (12,538 | ) | | | (8,295 | ) |
State | | | — | | | | (348 | ) | | | (132 | ) |
| | | | | | | | | | | | |
Total deferred | | | (8,627 | ) | | | 4,615 | | | | (21,844 | ) |
| | | | | | | | | | | | |
Total income tax provision (benefit) | | $ | 26,650 | | | $ | 34,335 | | | $ | (773 | ) |
| | | | | | | | | | | | |
A reconciliation between the Company’s effective tax rate on income from operations and the U.S. federal statutory rate is as follows (amounts in thousands):
| | | | | | | | | | | | | | | | | | | | | |
| | | Fiscal Years ended June 30, | |
| | | 2009 | | | 2008 | | | 2007 | |
| | | Amount | | | Percent | | | Amount | | | Percent | | | Amount | | | Percent | |
Income tax provision (benefit) at U.S. statutory rate | | $ | 32,481 | | | 35.0 | % | | $ | 14,762 | | | 35.0 | % | | $ | (27,170 | ) | | (35.0 | )% |
(Increase) decrease in benefit from: | | | | | | | | | | | | | | | | | | | | | |
State taxes—net of federal tax benefit | | | 506 | | | 0.5 | % | | | (64 | ) | | (0.2 | )% | | | (373 | ) | | (0.5 | )% |
Foreign tax rate differential | | | (7,457 | ) | | (8.0 | %) | | | (2,312 | ) | | (5.5 | )% | | | 1,257 | | | 1.6 | % |
Impact on deferred taxes due to increase (reduction) in foreign income tax rate | | | (147 | ) | | (0.2 | )% | | | (8,351 | ) | | (19.8 | )% | | | (2,743 | ) | | (3.5 | )% |
Change in valuation allowance | | | 268 | | | 0.3 | % | | | 28,174 | | | 66.8 | % | | | 18,486 | | | 23.8 | % |
LLC income not subject to entity level income tax | | | — | | | — | | | | — | | | — | | | | 922 | | | 1.2 | % |
Non-deductible interest | | | — | | | — | | | | — | | | — | | | | 5,728 | | | 7.4 | % |
Withholding taxes | | | 512 | | | 0.6 | % | | | 1,872 | | | 4.4 | % | | | 1,864 | | | 2.4 | % |
Stock based compensation | | | 45 | | | 0.0 | % | | | 561 | | | 1.3 | % | | | — | | | — | |
Other | | | 442 | | | 0.5 | % | | | (307 | ) | | (0.6 | )% | | | 1,256 | | | 1.6 | % |
| | | | | | | | | | | | | | | | | | | | | |
Total income tax provision (benefit) | | $ | 26,650 | | | 28.7 | % | | $ | 34,335 | | | 81.4 | % | | $ | (773 | ) | | (1.0 | )% |
| | | | | | | | | | | | | | | | | | | | | |
F-30
The significant components of deferred income tax assets and liabilities and their balance sheet classifications are as follows (in thousands):
| | | | | | | | |
| | | June 30, | |
| | | 2009 | | | 2008 | |
Deferred tax assets: | | | | | | | | |
Accrued expenses not currently deductible | | $ | 10,717 | | | $ | 5,226 | |
Depreciation and amortization | | | 199 | | | | 1,434 | |
Net operating losses and tax credit carryovers | | | 10,579 | | | | 33,054 | |
Intangibles | | | 12,802 | | | | 10,629 | |
Other | | | 5,279 | | | | 14,284 | |
| | | | | | | | |
| | | 39,576 | | | | 64,627 | |
Less valuation allowances | | | (37,972 | ) | | | (54,663 | ) |
| | | | | | | | |
Deferred tax assets—net | | | 1,604 | | | | 9,964 | |
| | | | | | | | |
Deferred tax liabilities: | | | | | | | | |
Amortization | | | 322 | | | | 351 | |
Intangibles | | | 37,411 | | | | 29,046 | |
Other | | | 4,303 | | | | 8,003 | |
| | | | | | | | |
Deferred tax liabilities | | | 42,036 | | | | 37,400 | |
| | | | | | | | |
Net deferred tax liabilities | | $ | (40,432 | ) | | $ | (27,436 | ) |
| | | | | | | | |
The Company has U.S. federal, state and foreign net operating loss carry-forwards of approximately $21,100,000, $35,500,000 and $126,400,000 at June 30, 2009. The Company also has U.S. federal and state research and development tax credit carry-forwards of approximately $1,500,000 and $3,050,000, respectively, and foreign tax credit carry-forwards of $2,150,000. The U.S. federal, state and foreign net operating loss carryforwards begin to expire primarily in years 2026, 2012 and 2016, respectively. The U.S. federal and state research and development tax credit carryforwards begin to expire in years 2026. The foreign tax credit carryforwards begin to expire in year 2016.
Utilization of the Company’s U.S. federal and certain state net operating loss and tax credit carryovers may be subject to substantial annual limitation due to the ownership change limitations provided by the Internal Revenue Code and similar state provisions. Such an annual limitation could result in the expiration of the net operating loss carry-forwards before utilization.
At June 30, 2008, the Company considered it more likely than not that the Dutch net operating losses would not be realized and a full valuation allowance was provided. During fiscal year 2009, in conjunction with filing the tax returns for the Dutch Fiscal Unity Group, management concluded that its Dutch net operating losses would not be utilized before they expired. Consequently, approximately $24,300,000 of the deferred tax asset associated with net operating loss carryforwards were eliminated in fiscal year 2009 with a corresponding reduction in the valuation allowance. The increase in the non-Dutch valuation allowance during fiscal year 2009 is primarily attributed to operating results. Valuation allowances are established and maintained for deferred tax assets on a “more likely than not” threshold. The Company has considered the following possible sources of taxable income when assessing the realization of the deferred tax assets: (1) future reversals of existing taxable temporary differences; (2) taxable income in prior carryback years; (3) tax planning strategies; and (4) future taxable income exclusive of reversing temporary differences and carryforwards. Reliance on future taxable income as an indicator that a valuation allowance is not required is difficult when there is negative evidence such as in the Company’s situation where the Company has cumulative losses in recent years. In considering the evidence as to whether a valuation allowance is needed, the existence of cumulative losses in recent years is a factor that is accorded significant weight in the Company’s assessment. Income forecasts were considered in conjunction with other positive and negative evidence, including the Company’s current financial performance
F-31
and the ongoing debt service costs related to the Company’s external borrowing arising from the acquisition of CSG. As a result, a determination was made that there was not sufficient positive evidence to enable the Company to conclude that it was “more likely than not” that these deferred tax assets would be realized. Therefore, the Company has provided a full valuation allowance against the Company’s U.S. net deferred tax assets. This assessment will continue to be undertaken in the future. The Company’s results of operations may be impacted in the future by the Company’s inability to realize a tax benefit for future tax losses or for items that will generate additional deferred tax assets. The Company’s results of operations might be favorably impacted in the future by reversals of valuation allowances if the Company is able to demonstrate sufficient positive evidence that the Company’s deferred tax assets will be realized.
The Company has recorded valuation allowances for deferred tax assets of $37,972,000 and $54,663,000 at June 30, 2009 and 2008, respectively. The $37,972,000 valuation allowance for deferred tax assets as of June 30, 2009 is comprised of approximately $28,928,000 charged against income tax expense while $1,082,000 is charged against goodwill and 7,962,000 is charged against accumulated other comprehensive income. Depending upon future circumstances, if the valuation allowance is fully realized, $7,962,000 could increase accumulated other comprehensive income and the balance of $30,010,000 will reduce income tax expense.
The undistributed earnings of the Company’s foreign subsidiaries as of June 30, 2009 are considered to be indefinitely reinvested and, accordingly, no U.S. income taxes have been provided thereon. The Company’s undistributed earnings in significant jurisdictions is approximately $220,000,000. Upon distribution of those earnings in the form of dividends or otherwise, the Company would be subject to both U.S. income taxes (subject to an adjustment for foreign tax credits) and withholding taxes payable to various foreign countries. It is currently not practicable to compute the residual taxes due on such earnings.
The Company adopted FIN No. 48,Accounting for Uncertainty in Income taxes, an interpretation of FASB Statement No. 109, on July 1, 2007. A reconciliation of the beginning and ending amount of total unrecognized tax benefits is as follows for fiscal years 2009 and 2008 (in thousands):
| | | | | | | |
| | | Fiscal Year 2009 | | | Fiscal Year 2008 |
Gross unrecognized tax benefits balance at beginning of period | | $ | 17,298 | | | $ | 8,387 |
Increase related to prior year tax positions | | | 231 | | | | 4,126 |
Decrease related to prior year tax positions | | | (7,058 | ) | | | — |
Increase related to current year tax position | | | 3,122 | | | | 4,785 |
Decrease related to lapse of statute of limitations | | | (5,772 | ) | | | — |
| | | | | | | |
Gross unrecognized tax benefits balance at end of period | | $ | 7,821 | | | $ | 17,298 |
| | | | | | | |
As of June 30, 2009, unrecognized tax benefits were $7,821,000, of which approximately $2,608,000, if recognized, would favorably impact the effective tax rate, and the remaining balance would be substantially offset by valuation allowances.
The Company files U.S. federal income tax returns as well as income tax returns in various states and foreign jurisdictions. Pursuant to the terms of the CSG acquisition, ADP has indemnified all pre-acquisition period related income tax assessments arising from such tax examinations of CSG. As such, the Company is responsible for all income tax assessments arising from tax examinations pertaining to the post-acquisition period. Generally, the post-acquisition years remain open under the statute of limitations.
As of June 30, 2009, the Company had approximately $457,000 of accrued interest expense related to the unrecognized tax benefits. The Company recognizes interest accrued and penalties, if incurred, related to unrecognized tax benefits as a component of income tax expense. This policy did not change as a result of the adoption of FIN No. 48.
F-32
| 14. | CONTRACTUAL COMMITMENTS AND CONTINGENCIES |
Leases and Other Contractual Commitments—The Company leases office space and equipment under various operating and capital leases, and subleases certain excess office space. Additionally, the Company has contractual obligations under software license agreements and other purchase commitments. Total expense incurred under these agreements was approximately $14,136,000, $14,544,000 and $17,031,000 for the fiscal years ended June 30, 2009, 2008 and 2007, respectively. Sublease income recognized for the fiscal years ended June 30, 2009, 2008 and 2007 was $1,309,000, $1,024,000 and $27,000, respectively. Obligations under capital leases totaled $2,609,000 and $3,288,000 at June 30, 2009 and 2008, respectively.
Future minimum contractual commitments and future committed sublease income at June 30, 2009 are as follows (in thousands):
| | | | | | |
| | | Commitments | | Subleases |
2010 | | $ | 30,817 | | $ | 1,315 |
2011 | | | 12,951 | | | 1,170 |
2012 | | | 9,718 | | | 1,120 |
2013 | | | 7,718 | | | 653 |
2014 | | | 4,890 | | | — |
Thereafter | | | 4,355 | | | — |
| | | | | | |
Total | | $ | 70,449 | | $ | 4,258 |
| | | | | | |
In addition to fixed rentals, certain leases require payment of maintenance and real estate taxes and contain escalation provisions based on future adjustments in price indices.
The Company may also be required to make future cash payments of up to approximately $15,600,000 in connection with the business acquisitions completed in fiscal year 2009, based on foreign currency exchange rates at June 30, 2009 (Note 3).
Guarantees—Solera Holdings, Inc. has irrevocably and unconditionally guaranteed the subordinated note payable issued in the acquisition of HPI (Note 3). Additionally, in the normal course of business, the Company enters into contracts in which it makes representations and warranties that guarantee the performance of the Company’s products and services. Losses related to such guarantees were not significant during any of the periods presented.
F-33
| 15. | SEGMENT AND GEOGRAPHIC INFORMATION |
Segment Information—The Company manages its business operations through two strategic business units. Based upon the information reported to the chief operating decision maker, who is the Chief Executive Officer, the Company has the following two reportable segments: EMEA and Americas. The EMEA business unit encompasses the Company’s operations in Europe, the Middle East, Africa and Asia. The Americas business unit encompasses the Company’s operations in North America, and Central and South America.
Based on management fee studies, the Company’s Corporate segment allocates certain costs related to providing services to its reportable segments. These costs are managed at the Corporate level and include costs related to financing activities, business development and oversight, and tax, audit and other professional fees of the Company. The Company evaluates the performance of its reportable segments based on operating results before income taxes and minority interests:
| | | | | | | | | | | | | | | | |
| (in thousands) | | EMEA | | | Americas | | | Corporate | | | Total | |
Fiscal Year Ended June 30, 2009 | | | | | | | | | | | | | | | | |
Revenues | | $ | 351,741 | | | $ | 205,950 | | | $ | — | | | $ | 557,691 | |
Income (loss) before income tax provision and minority interest | | | 102,831 | | | | 48,288 | | | | (58,318 | ) | | | 92,801 | |
Significant items included in income (loss) before income taxes and minority interest: | | | | | | | | | | | | | | | | |
Depreciation and amortization | | | 54,240 | | | | 31,897 | | | | 9 | | | | 86,146 | |
Interest expense | | | 767 | | | | 285 | | | | 37,513 | | | | 38,565 | |
Other (income) expense—net | | | (1,415 | ) | | | (617 | ) | | | (13,624 | ) | | | (15,656 | ) |
Total assets at end of period | | | 1,130,655 | | | | 279,571 | | | | 8,383 | | | | 1,418,609 | |
Capital expenditures | | | 9,472 | | | | 10,150 | | | | — | | | | 19,622 | |
| | | | |
Fiscal Year Ended June 30, 2008 | | | | | | | | | | | | | | | | |
Revenues | | $ | 334,176 | | | $ | 205,677 | | | $ | — | | | $ | 539,853 | |
Income (loss) before income taxes and minority interest | | | 82,593 | | | | 31,124 | | | | (71,541 | ) | | | 42,176 | |
Significant items included in income (loss) before income taxes and minority interest: | | | | | | | | | | | | | | | | |
Depreciation and amortization | | | 57,524 | | | | 37,742 | | | | — | | | | 95,266 | |
Interest expense | | | 60 | | | | 302 | | | | 45,368 | | | | 45,730 | |
Other (income) expense—net | | | (8,120 | ) | | | (983 | ) | | | (415 | ) | | | (9,518 | ) |
Total assets at end of period | | | 1,026,879 | | | | 300,310 | | | | 4,566 | | | | 1,331,755 | |
Capital expenditures | | | 8,630 | | | | 10,191 | | | | — | | | | 18,821 | |
| | | | |
Fiscal Year Ended June 30, 2007 | | | | | | | | | | | | | | | | |
Revenues | | $ | 280,112 | | | $ | 191,848 | | | $ | — | | | $ | 471,960 | |
Income (loss) before income taxes and minority interest | | | 39,270 | | | | 499 | | | | (117,398 | ) | | | (77,629 | ) |
Significant items included in income (loss) before income taxes and minority interest: | | | | | | | | | | | | | | | | |
Depreciation and amortization | | | 58,606 | | | | 45,813 | | | | — | | | | 104,419 | |
Interest expense | | | 47 | | | | 218 | | | | 69,416 | | | | 69,681 | |
Other (income) expense—net | | | (3,568 | ) | | | (306 | ) | | | 35,383 | | | | 31,509 | |
Total assets at end of period | | | 883,911 | | | | 327,865 | | | | 12,177 | | | | 1,223,953 | |
Capital expenditures | | | 7,220 | | | | 20,010 | | | | — | | | | 27,230 | |
F-34
Geographic Information—Geographic revenue information is based on the location of the customer. No single country other than the United States, the United Kingdom, the Netherlands and Germany accounted for 10% or more of total external revenue or of property and equipment.
| | | | | | | | | | | | | | | | | | | | | |
| (in thousands) | | | | | | | | | | | | | | |
| | | Europe* | | United
States | | The
Netherlands | | United
Kingdom | | Germany | | All
Other | | Total |
Fiscal Year Ended June 30, 2009 | | | | | | | | | | | | | | | | | | | | | |
Revenues | | $ | 145,675 | | $ | 145,898 | | $ | 61,282 | | $ | 70,368 | | $ | 55,384 | | $ | 79,084 | | $ | 557,691 |
Property and equipment, net | | | 3,085 | | | 20,160 | | | 160 | | | 13,865 | | | 7,963 | | | 5,551 | | | 50,784 |
| | | | | | | |
Fiscal Year Ended June 30, 2008 | | | | | | | | | | | | | | | | | | | | | |
Revenues | | $ | 141,219 | | $ | 147,875 | | $ | 62,554 | | $ | 57,819 | | $ | 52,450 | | $ | 77,936 | | $ | 539,853 |
Property and equipment, net | | | 4,392 | | | 22,554 | | | 290 | | | 8,681 | | | 8,473 | | | 4,853 | | | 49,243 |
| | | | | | | |
Fiscal Year Ended June 30, 2007 | | | | | | | | | | | | | | | | | | | | | |
Revenues | | $ | 118,955 | | $ | 146,392 | | $ | 56,898 | | $ | 50,814 | | $ | 46,220 | | $ | 52,681 | | $ | 471,960 |
Property and equipment, net | | | 6,003 | | | 26,214 | | | 311 | | | 8,149 | | | 8,269 | | | 2,539 | | | 51,485 |
| * | Excludes the Netherlands, the United Kingdom and Germany, which are shown separately. |
Concentration of Risks—The Company offers a broad range of services to a diverse group of customers throughout North, Central and South America, Europe, the Middle East, Africa and Asia. The Company performs periodic credit evaluations of its customers and monitors their financial condition and developing business news. No customers accounted for more than 10% of consolidated revenues or accounts receivable for any of the periods presented.
On August 27, 2009, the Company announced that its board of directors approved the payment of a quarterly cash dividend of $0.0625 per share outstanding of common stock and per outstanding restricted stock unit payable on September 28, 2009 to stockholders and restricted stock unit holders of record at the close of business on September 18, 2009.
F-35
QUARTERLY FINANCIAL RESULTS (UNAUDITED)
Summarized unaudited quarterly results of the Company’s continuing operations for each of the two fiscal years ended June 30, 2009 and 2008 are as follows (amounts in thousands, except per share data):
| | | | | | | | | | | | | |
Year Ended June 30, 2009 (1)(2) | | First
Quarter | | Second
Quarter | | Third
Quarter | | Fourth
Quarter | |
Revenues | | $ | 142,992 | | $ | 131,301 | | $ | 139,263 | | $ | 144,135 | |
Cost of revenues (excluding depreciation and amortization) | | | 49,537 | | | 44,043 | | | 46,872 | | | 48,185 | |
Net income | | $ | 14,347 | | $ | 19,645 | | $ | 11,987 | | $ | 11,841 | |
Net income per share: | | | | | | | | | | | | | |
Basic | | $ | 0.22 | | $ | 0.30 | | $ | 0.17 | | $ | 0.17 | |
Diluted | | $ | 0.22 | | $ | 0.29 | | $ | 0.17 | | $ | 0.17 | |
| | | | |
Year Ended June 30, 2008 (2) | | First
Quarter | | Second
Quarter | | Third
Quarter | | Fourth
Quarter | |
Revenues | | $ | 124,181 | | $ | 132,089 | | $ | 138,049 | | $ | 145,534 | |
Cost of revenues (excluding depreciation and amortization) | | | 48,313 | | | 49,565 | | | 49,192 | | | 51,313 | |
Net income (loss) (3) | | | 3,854 | | | 11,009 | | | 7,308 | | | (21,573 | ) |
Net income (loss) per share (3): | | | | | | | | | | | | | |
Basic | | $ | 0.06 | | $ | 0.17 | | $ | 0.11 | | $ | (0.34 | ) |
Diluted | | $ | 0.06 | | $ | 0.17 | | $ | 0.11 | | $ | (0.34 | ) |
| (1) | The results of operations of HPI, UCS and Inpart, acquired in fiscal year 2009, are included from the respective dates of the acquisitions, which affects the comparability of the Quarterly Financial Data. |
| (2) | The Company’s business is subject to seasonal and other fluctuations. In particular, the Company has historically experienced higher revenues during the second quarter and third quarter versus the first quarter and fourth quarter during each fiscal year. This seasonality is caused primarily by more days of inclement weather during the second quarter and third quarter in most of the Company’s markets, which contributes to a greater number of vehicle accidents and damage during these periods. In addition, the Company’s business is subject to fluctuations caused by other factors, including the occurrence of extraordinary weather events and the timing of certain public holidays. For example, the Easter holiday occurs during the third quarter in certain fiscal years and occurs during the fourth quarter in other fiscal years, resulting in a change in the number of business days during the quarter in which the holiday occurs. |
| (3) | Net loss and net loss per share in the fourth quarter of fiscal year 2008 includes the effect of the establishment of a full valuation allowance against the Company’s U.S. net deferred tax assets based on analysis of all available evidence, both positive and negative, including historical levels of income, expectations and risks associated with estimates of future taxable income and ongoing prudent and feasible tax planning strategies in assessing the need for the valuation allowance. |
F-36
SOLERA HOLDINGS, INC.
Schedule II—Valuation and Qualifying Accounts
| | | | | | | | | | | | | | |
| (in thousands) | | Balance at
Beginning
of Period | | Net
Additions
Charged
(Credited)
to Expense | | | Deductions (1) | | | Balance at
End of
Period |
Year Ended June 30, 2009: | | | | | | | | | | | | | | |
Allowance for doubtful accounts | | $ | 1,289 | | $ | 2,173 | | | $ | (1,118 | ) | | $ | 2,344 |
| | | | |
Year Ended June 30, 2008: | | | | | | | | | | | | | | |
Allowance for doubtful accounts | | $ | 1,170 | | $ | 891 | | | $ | (772 | ) | | $ | 1,289 |
| | | | |
Year Ended June 30, 2007: | | | | | | | | | | | | | | |
Allowance for doubtful accounts | | $ | 1,665 | | $ | (273 | ) | | $ | (222 | ) | | $ | 1,170 |
| (1) | Deductions for allowance for doubtful accounts primarily consists of accounts receivable written-off, net of recoveries. |
F-37
EXHIBIT INDEX
| | |
Exhibit
Number | | Description |
3.1* | | Amended and Restated Certificate of Incorporation of the Registrant (filed as Exhibit 3.1 to Solera Holdings, Inc.’s Form S-1/A filed with the SEC on May 9, 2007). |
| |
3.2* | | Amended and Restated By-laws of the Registrant (filed as Exhibit 3.1 to Solera Holdings, Inc.’s Form 8-K filed with the SEC on November 18, 2008). |
| |
4.1* | | Specimen Common Stock Certificate (filed as Exhibit 4.1 to Solera Holdings, Inc.’s Form S-1/A filed with the SEC on May 9, 2007). |
| |
4.2* | | Registration Rights Agreement, dated as of April 1, 2005, by and among Solera Holdings, LLC, GTCR Fund VIII, L.P., GTCR Fund VIII/B, L.P., GTCR Co-Invest II, L.P. and each of the other Stockholders party thereto (filed as Exhibit 4.2 to Solera Holdings, Inc.’s Form S-1 filed with the SEC on February 12, 2007). |
| |
10.1* | | Transaction Agreement, dated as of February 8, 2006, by and among Solera, Inc., Automatic Data Processing, Inc., ADP Atlantic Inc., ADP Nederland B.V., ADP International B.V., ADP Canada Co. and ADP Private Limited (filed as Exhibit 10.1 to Solera Holdings, Inc.’s Form S-1 filed with the SEC on February 12, 2007). |
| |
10.2* | | Amendment No. 1 to Transaction Agreement, dated as of March 28, 2006, by and among Solera, Inc., Automatic Data Processing, Inc., ADP Atlantic Inc., ADP Nederland B.V., ADP International B.V., ADP Canada Co. and ADP Private Limited (filed as Exhibit 10.2 to Solera Holdings, Inc.’s Form S-1 filed with the SEC on February 12, 2007). |
| |
10.3* | | Amendment No. 2 to Transaction Agreement, dated as of April 13, 2006, by and among Solera, Inc., Automatic Data Processing, Inc., ADP Atlantic Inc., ADP Nederland B.V., ADP International B.V., ADP Canada Co. and ADP Private Limited (filed as Exhibit 10.3 to Solera Holdings, Inc.’s Form S-1 filed with the SEC on February 12, 2007). |
| |
10.4* | | Professional Services Agreement, dated as of April 1, 2005, by and among Solera Holding Corp. and GTCR Golder Rauner, L.L.C. (filed as Exhibit 10.4 to Solera Holdings, Inc.’s Form S-1 filed with the SEC on February 12, 2007). |
| |
10.5*# | | Solera Holdings, Inc. 2007 Long-Term Equity Incentive Plan (filed as Exhibit 10.5 to Solera Holdings, Inc.’s Form S-1/A filed with the SEC on May 9, 2007). |
| |
10.6*# | | Form of Option Agreement issued under 2007 Long-Term Equity Incentive Plan (filed as Exhibit 10.6 to Solera Holdings, Inc.’s Form S-1/A filed with the SEC on April 30, 2007). |
| |
10.7*# | | Solera Holdings, LLC 2006 Employee Securities Purchase Plan (filed as Exhibit 10.7 to Solera Holdings, Inc.’s Form S-1 filed with the SEC on February 12, 2007). |
| |
10.8*# | | Solera Holdings, Inc. 2007 Employee Stock Purchase Plan (filed as Exhibit 10.8 to Solera Holdings, Inc.’s Form S-1/A filed with the SEC on May 9, 2007). |
| |
10.9*# | | Form of Indemnification Agreement (filed as Exhibit 10.9 to Solera Holdings, Inc.’s Form S-1/A filed with the SEC on May 9, 2007). |
| |
10.10*# | | Second Amended and Restated Senior Management Agreement, dated as of January 28, 2008, by and among Solera Holdings, Inc., Solera, Inc., Tony Aquila, Anthony Aquila 2007 Annuity Trust dated May 10, 2007, Shelly Renee Aquila and Shelly Renee Aquila 2007 Annuity Trust dated May 10, 2007 (filed as Exhibit 10.1 to Solera Holdings, Inc.’s Form 10-Q filed with the SEC on February 13, 2008). |
| |
10.11* | | First Amended and Restated First Lien Credit and Guaranty Agreement, dated as of May 16, 2007, among Audatex North America, Inc., Solera Nederland Holding B.V., Audatex Holdings IV B.V., Audatex Holdings, LLC, the other Guarantors party thereto, Goldman Sachs Credit Partners L.P., Citigroup Global Markets, Inc., Citicorp USA, Inc. and the other Lenders party thereto (filed as Exhibit 10.1 to Solera Holdings, Inc.’s Form 10-Q filed with the SEC on June 25, 2007) |
| | |
Exhibit
Number | | Description |
10.12*# | | Management Agreement, dated as of December 31, 2007, by and among Solera Holdings, Inc., Solera, Inc. and Jason Brady (filed as Exhibit 10.17 to Solera Holdings, Inc.’s Form 10-K filed with the SEC on August 29, 2008). |
| |
10.13*# | | Solera Holdings, Inc. 2008 Omnibus Incentive Plan (filed as Appendix A to Solera Holdings, Inc.’s Definitive Proxy Statement filed with the SEC on August 29, 2008). |
| |
10.14* | | Share Purchase Agreement among RAC plc, HPI Holding Limited and Solera Holdings, Inc. dated December 19, 2008 (filed as Exhibit 10.1 to Solera Holdings, Inc.’s Form 10-Q filed with the SEC on February 9, 2009). |
| |
10.15*# | | Employment Offer Letter between Solera Holdings, Inc. and Dudley Mendenhall dated March 9, 2009 (filed as Exhibit 10.1 to Solera Holdings, Inc.’s Form 10-Q filed with the SEC on May 11, 2009). |
| |
21.1 | | List of subsidiaries of the Registrant. |
| |
23.1 | | Consent of Deloitte & Touche LLP, independent registered public accounting firm. |
| |
31.1 | | Certification of Chief Executive Officer pursuant to Rule 13a-14(a) and 15d-14(a) of the Exchange Act. |
| |
31.2 | | Certification of Chief Financial Officer pursuant to Rule 13a-14(a) and 15d-14(a) of the Exchange Act. |
| |
32.1 | | Certification Pursuant to 18 U.S.C. Section 1350, as adopted pursuant to Section 906 of the Sarbanes-Oxley Act of 2002. |
| * | Incorporated by reference. |
| # | Management contract or compensatory plan or arrangement. |