UNITED STATES
SECURITIES AND EXCHANGE COMMISSION
Washington, D.C. 20549
FORM N-CSR
CERTIFIED SHAREHOLDER REPORT OF REGISTERED MANAGEMENT INVESTMENT
COMPANIES
Investment Company Act file number: 811-21759
Name of Fund: BlackRock Long-Horizon Equity Fund
Fund Address: 100 Bellevue Parkway, Wilmington, DE 19809
Name and address of agent for service: John M. Perlowski, Chief Executive Officer, BlackRock Long-Horizon
Equity Fund, 55 East 52nd Street, New York, NY 10055
Registrant’s telephone number, including area code: (800) 441-7762
Date of fiscal year end: 10/31/2016
Date of reporting period: 04/30/2016
Item 1 – Report to Stockholders
APRIL 30, 2016
| | | | |
SEMI-ANNUAL REPORT (UNAUDITED) | | | |  |
BlackRock Long-Horizon Equity Fund
|
| Not FDIC Insured • May Lose Value • No Bank Guarantee |

| | | | | | |
| | | | | | | |
| 2 | | BLACKROCK LONG-HORIZON EQUITY FUND | | APRIL 30, 2016 | | |
Dear Shareholder,
Diverging monetary policies and shifting economic outlooks across regions have been the overarching themes driving financial markets over the past couple of years. Investors spent most of 2015 anticipating the end of the Federal Reserve’s (the “Fed”) near-zero interest rate policy as U.S. growth outpaced other developed markets. The Fed ultimately hiked rates in December, whereas the European Central Bank and the Bank of Japan took additional steps to stimulate growth, even introducing negative interest rates. The U.S. dollar had strengthened considerably ahead of these developments, causing profit challenges for U.S. companies that generate revenues overseas, and pressuring emerging market currencies and commodities prices.
Global market volatility increased in the latter part of 2015 and spilled over into early 2016. Oil prices were a key factor behind the instability after collapsing in mid-2015 due to excess global supply. China, one of the world’s largest consumers of oil, was another notable source of stress for financial markets. Signs of slowing economic growth, a depreciating yuan and declining confidence in the country’s policymakers stoked investors’ worries about the potential impact of China’s weakness on the global economy. Risk assets (such as equities and high yield bonds) suffered in this environment.
After a painful start to the new year, fears of a global recession began to fade as the first quarter wore on, allowing markets to calm and risk assets to rebound. Central bank stimulus in Europe and Japan, combined with a more tempered outlook for rate hikes in the United States, helped bolster financial markets. A softening in U.S. dollar strength offered some relief to U.S. exporters and emerging market economies. Oil prices found firmer footing as global supply showed signs of leveling off.
The selloff in risk assets at the turn of the year brought valuations to more reasonable levels, creating some appealing entry points for investors in 2016. Nonetheless, slow but relatively stable growth in the United States is countered by a less optimistic global economic outlook and uncertainties around the efficacy of China’s policy response, the potential consequences of negative interest rates in Europe and Japan, and a host of geopolitical risks.
For the 12 months ended April 30, 2016, higher-quality assets such as municipal bonds, U.S. Treasuries and investment grade corporate bonds generated positive returns, while riskier assets such as non-U.S. and small cap equities broadly declined.
At BlackRock, we believe investors need to think globally, extend their scope across a broad array of asset classes and be prepared to adjust accordingly as market conditions change over time. We encourage you to talk with your financial advisor and visit blackrock.com for further insight about investing in today’s markets.
Sincerely,

Rob Kapito
President, BlackRock Advisors, LLC

Rob Kapito
President, BlackRock Advisors, LLC
| | | | | | | | |
| Total Returns as of April 30, 2016 | |
| | | 6-month | | | 12-month | |
U.S. large cap equities
(S&P 500® Index) | | | 0.43 | % | | | 1.21 | % |
U.S. small cap equities
(Russell 2000® Index) | | | (1.90 | ) | | | (5.94 | ) |
International equities
(MSCI Europe, Australasia,
Far East Index) | | | (3.07 | ) | | | (9.32 | ) |
Emerging market equities
(MSCI Emerging
Markets Index) | | | (0.13 | ) | | | (17.87 | ) |
3-month Treasury bills
(BofA Merrill Lynch 3-Month
U.S. Treasury Bill Index) | | | 0.14 | | | | 0.15 | |
U.S. Treasury securities
(BofA Merrill Lynch 10-Year
U.S. Treasury Index) | | | 3.76 | | | | 3.74 | |
U.S. investment grade
bonds (Barclays
U.S. Aggregate Bond Index) | | | 2.82 | | | | 2.72 | |
Tax-exempt municipal
bonds (S&P Municipal
Bond Index) | | | 3.52 | | | | 5.16 | |
U.S. high yield bonds
(Barclays U.S.
Corporate High Yield 2%
Issuer Capped Index) | | | 2.38 | | | | (1.08 | ) |
| Past performance is no guarantee of future results. Index performance is shown for illustrative purposes only. You cannot invest directly in an index. | |
| | | | | | |
| | | | | | | |
| | THIS PAGE NOT PART OF YOUR FUND REPORT | | | | 3 |
| | |
| Fund Summary as of April 30, 2016 | | |
BlackRock Long-Horizon Equity Fund’s (the “Fund”) investment objective is to provide high total investment return.
| | |
| Portfolio Management Commentary | | |
How did the Fund perform?
| • | | For the six-month period ended April 30, 2016, the Fund underperformed its benchmark, the MSCI All Country World Index (“ACWI”). |
What factors influenced performance?
| • | | Unfavorable stock selection within the consumer discretionary sector was the most significant cause of the Fund’s underperformance, although stock selection in financials and industrials also weighed on results. The largest individual detractors were the tax advisory service company H&R Block, Inc., the computer data storage company Western Digital Corp. and the medical waste disposal firm Stericycle, Inc. (all U.S. based). H&R Block shares have been weak following two quarters of disappointing results. |
| • | | Positive stock selection in information technology (“IT”) and health care, along with the Fund’s cash allocation, were the most significant contributors to semi-annual performance. The largest individual contributors were the Chinese Internet services company Baidu, Inc. — ADR, HDFC Bank Ltd. (India) as well as a lack of exposure to Apple Inc. |
| | | Baidu released better-than-expected financial results at the start of the period, which boosted investor sentiment. |
Describe recent portfolio activity.
| • | | The most notable changes during the period were significant increases in the Fund’s industrials and health care exposures. In contrast, financials and IT holdings within the Fund were meaningfully reduced. Stericycle, the U.S. financial services company MasterCard, Inc. and the U.S.-managed health care company UnitedHealth Group, Inc. were the largest purchases. Baidu, Allergan PLC and Citigroup, Inc. were the largest sales from the portfolio. |
Describe portfolio positioning at period end.
| • | | The Fund’s most significant weightings were within health care, industrials and IT. The Fund had no exposure to utilities or telecommunication services, and modest positions within materials and energy. Regionally, more than half of portfolio companies were listed in North America, with European holdings accounting for more than one-third of assets. The Fund held no stocks listed in developed Asia. |
The views expressed reflect the opinions of BlackRock as of the date of this report and are subject to change based on changes in market, economic or other conditions. These views are not intended to be a forecast of future events and are no guarantee of future results.
| | |
| Ten Largest Holdings | | Percent of
Net Assets |
| | | | |
Comcast Corp., Class A | | | 5 | % |
Imperial Brands PLC | | | 5 | |
AutoZone, Inc. | | | 5 | |
MasterCard, Inc. | | | 5 | |
UnitedHealth Group, Inc. | | | 5 | |
Danaher Corp. | | | 5 | |
Union Pacific Corp. | | | 4 | |
Medtronic PLC | | | 4 | |
AstraZeneca PLC | | | 4 | |
Novo Nordisk A/S, Class B | | | 4 | |
| | |
| Geographic Allocation | | Percent of
Net Assets |
| | | | |
United States | | | 57 | % |
United Kingdom | | | 12 | |
Ireland | | | 8 | |
Netherlands | | | 7 | |
Sweden | | | 6 | |
Denmark | | | 4 | |
India | | | 3 | |
Israel | | | 3 | |
| | | | | | |
| | | | | | | |
| 4 | | BLACKROCK LONG-HORIZON EQUITY FUND | | APRIL 30, 2016 | | |
| | |
| Total Return Based on a $10,000 Investment | | |
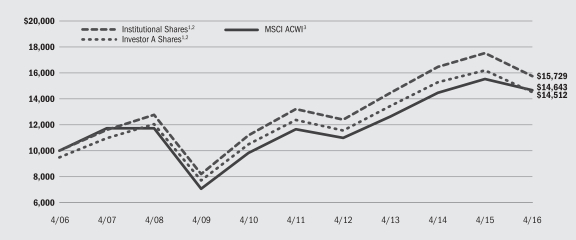
| | 1 | | Assuming maximum sales charges, if any, transaction costs and other operating expenses, including advisory fees. Institutional Shares do not have a sales charge. |
| | 2 | | The Fund will, under normal circumstances, invest at least 80% of its net assets (plus any borrowings for investment purposes) in equity securities. The Fund’s total returns prior to October 15, 2012 are the returns of the Fund when it followed a different investment objective and different investment strategies under the name BlackRock Global Dynamic Equity Fund. |
| | 3 | | This unmanaged index is a free float-adjusted, market capitalization weighted index that is designed to measure the equity market performance of developed and emerging markets. The MSCI ACWI consists of 46 country indexes comprising 23 developed and 23 emerging market country indexes. |
| | |
| Performance Summary for the Period Ended April 30, 2016 | | |
| | | | | | | | | | | | | | | | | | | | | | | | | | | | |
| | | | | | Average Annual Total Returns2,4 | |
| | | | | | 1 Year | | | 5 Years | | | 10 Years | |
| | | 6-Month
Total Returns | | | w/o sales
charge | | | w/sales
charge | | | w/o sales
charge | | | w/sales
charge | | | w/o sales
charge | | | w/sales
charge | |
Institutional | | | (6.18 | )% | | | (10.18 | )% | | | N/A | | | | 3.58 | % | | | N/A | | | | 4.63 | % | | | N/A | |
Investor A | | | (6.27 | ) | | | (10.35 | ) | | | (15.05 | )% | | | 3.29 | | | | 2.18 | % | | | 4.36 | | | | 3.79 | % |
Investor B | | | (6.82 | ) | | | (11.32 | ) | | | (15.05 | ) | | | 2.36 | | | | 2.05 | | | | 3.67 | | | | 3.67 | |
Investor C | | | (6.66 | ) | | | (11.07 | ) | | | (11.90 | ) | | | 2.50 | | | | 2.50 | | | | 3.56 | | | | 3.56 | |
Class R | | | (6.56 | ) | | | (10.83 | ) | | | N/A | | | | 2.83 | | | | N/A | | | | 3.93 | | | | N/A | |
MSCI ACWI | | | (0.94 | ) | | | (5.66 | ) | | | N/A | | | | 4.69 | | | | N/A | | | | 3.89 | | | | N/A | |
| | 4 | | Assuming maximum sales charges, if any. Average annual total returns with and without sales charges reflect reductions for distribution and service fees. See “About Fund Performance” on page 6 for a detailed description of share classes, including any related sales charges and fees. |
| | | | N/A — Not applicable as share class and index do not have a sales charge. |
| | | | Past performance is not indicative of future results. |
| | | | | | |
| | | | | | | |
| | BLACKROCK LONG-HORIZON EQUITY FUND | | APRIL 30, 2016 | | 5 |
Institutional Shares are not subject to any sales charge. These shares bear no ongoing distribution or service fees and are available only to certain eligible investors.
Investor A Shares are subject to a maximum initial sales charge (front-end load) of 5.25% and a service fee of 0.25% per year (but no distribution fee). Certain redemptions of these shares may be subject to a contingent deferred sales charge (“CDSC”) where no initial sales charge was paid at the time of purchase. These shares are generally available through financial intermediaries.
Investor B Shares are subject to a maximum CDSC of 4.50%, declining to 0% after six years. In addition, these shares are subject to a distribution fee of 0.75% per year and a service fee of 0.25% per year. These shares automatically convert to Investor A Shares after approximately eight years. (There is no initial sales charge for automatic share conversions.) All returns for periods greater than eight years reflect this conversion. These shares are only available through exchanges and distribution reinvestments by current holders and for purchase by certain employer-sponsored retirement plans.
Investor C Shares are subject to a 1.00% CDSC if redeemed within one year of purchase. In addition, these shares are subject to a distribution fee of 0.75% per year and a service fee of 0.25% per year. These shares are generally available through financial intermediaries.
Class R Shares are not subject to any sales charge. These shares are subject to a distribution fee of 0.25% per year and a service fee of 0.25% per year. These shares are available only to certain employer-
sponsored retirement plans. Prior to March 1, 2007, Class R Shares performance results are those of the Institutional Shares (which have no distribution or service fees) restated to reflect Class R Shares fees.
Performance information reflects past performance and does not guarantee future results. Current performance may be lower or higher than the performance data quoted. Refer to www.blackrock.com/funds to obtain performance data current to the most recent month end. Performance results do not reflect the deduction of taxes that a shareholder would pay on fund distributions or the redemption of fund shares. Figures shown in the performance tables on the previous page assume reinvestment of all distributions, if any, at net asset value (“NAV”) on the ex-dividend date. Investment return and principal value of shares will fluctuate so that shares, when redeemed, may be worth more or less than their original cost. Distributions paid to each class of shares will vary because of the different levels of service, distribution and transfer agency fees applicable to each class, which are deducted from the income available to be paid to shareholders.
BlackRock Advisors, LLC (the “Manager”), the Fund’s investment advisor, has contractually agreed to waive and/or reimburse a portion of the Fund’s expenses. Without such waiver and/or reimbursement, the Fund’s performance would have been lower. The Manager is under no obligation to continue waiving and/or reimbursing its fees after the applicable termination date of such agreement. See Note 5 of the Notes to Financial Statements for additional information on waivers and/or reimbursements.
| | | | | | |
| | | | | | | |
| 6 | | BLACKROCK LONG-HORIZON EQUITY FUND | | APRIL 30, 2016 | | |
Shareholders of the Fund may incur the following charges: (a) transactional expenses, such as sales charges; and (b) operating expenses, including investment advisory fees, service and distribution fees, including 12b-1 fees, acquired fund fees and expenses, and other Fund expenses. The expense example shown below (which is based on a hypothetical investment of $1,000 invested on November 1, 2015 and held through April 30, 2016) is intended to assist shareholders both in calculating expenses based on an investment in the Fund and in comparing these expenses with similar costs of investing in other mutual funds.
The expense example provides information about actual account values and actual expenses. In order to estimate the expenses a shareholder paid during the period covered by this report, shareholders can divide their account value by $1,000 and then multiply the result by the number corresponding to their share class under the heading entitled “Expenses Paid During the Period.”
The expense example also provides information about hypothetical account values and hypothetical expenses based on the Fund’s actual expense ratio and an assumed rate of return of 5% per year before expenses. In order to assist shareholders in comparing the ongoing expenses of investing in the Fund and other funds, compare the 5% hypothetical example with the 5% hypothetical examples that appear in shareholder reports of other funds.
The expenses shown in the expense example are intended to highlight shareholders’ ongoing costs only and do not reflect any transactional expenses, such as sales charges, if any. Therefore, the hypothetical example is useful in comparing ongoing expenses only, and will not help shareholders determine the relative total expenses of owning different funds. If these transactional expenses were included, shareholder expenses would have been higher.
| | | | | | | | | | | | | | | | | | | | | | | | | | | | |
| | | Actual | | | Hypothetical2 | | | | |
| | | Beginning Account Value November 1, 2015 | | | Ending Account Value April 30, 2016 | | | Expenses Paid
During the Period1 | | | Beginning Account Value November 1, 2015 | | | Ending Account Value April 30, 2016 | | | Expenses Paid
During the Period1 | | | Annualized
Expense
Ratio | |
Institutional | | $ | 1,000.00 | | | $ | 938.20 | | | $ | 4.92 | | | $ | 1,000.00 | | | $ | 1,019.79 | | | $ | 5.12 | | | | 1.02 | % |
Investor A | | $ | 1,000.00 | | | $ | 937.30 | | | $ | 6.21 | | | $ | 1,000.00 | | | $ | 1,018.45 | | | $ | 6.47 | | | | 1.29 | % |
Investor B | | $ | 1,000.00 | | | $ | 931.80 | | | $ | 10.86 | | | $ | 1,000.00 | | | $ | 1,013.63 | | | $ | 11.31 | | | | 2.26 | % |
Investor C | | $ | 1,000.00 | | | $ | 933.40 | | | $ | 9.90 | | | $ | 1,000.00 | | | $ | 1,014.62 | | | $ | 10.32 | | | | 2.06 | % |
Class R | | $ | 1,000.00 | | | $ | 934.40 | | | $ | 8.18 | | | $ | 1,000.00 | | | $ | 1,016.41 | | | $ | 8.52 | | | | 1.70 | % |
| | 1 | | Expenses for the Fund are equal to the annualized expense ratio for the class, multiplied by the average account value over the period, multiplied by 182/366 (to reflect the one-half year period shown). |
| | 2 | | Hypothetical 5% return before expenses is calculated by prorating the number of days in the most recent fiscal half year divided by 366. |
| | | | | | |
| | | | | | | |
| | BLACKROCK LONG-HORIZON EQUITY FUND | | APRIL 30, 2016 | | 7 |
| | |
Schedule of Investments April 30, 2016 (Unaudited) | | |
| | | | | | | | |
| | |
| Common Stocks | | Shares | | | Value | |
Denmark — 3.8% | | | | | | | | |
Novo Nordisk A/S, Class B | | | 251,143 | | | $ | 14,022,406 | |
India — 3.5% | | | | | | | | |
HDFC Bank Ltd. | | | 639,838 | | | | 13,031,780 | |
Ireland — 7.6% | | | | | | | | |
Medtronic PLC | | | 187,271 | | | | 14,822,500 | |
Shire PLC | | | 215,261 | | | | 13,432,723 | |
| | | | | | | | |
| | | | | | | | 28,255,223 | |
Israel — 2.9% | | | | | | | | |
Teva Pharmaceutical Industries Ltd. — SP- ADR | | | 201,882 | | | | 10,992,475 | |
Netherlands — 6.8% | | | | | | | | |
ASML Holding NV (a) | | | 128,411 | | | | 12,411,666 | |
Royal Dutch Shell PLC, Class A | | | 492,562 | | | | 12,901,775 | |
| | | | | | | | |
| | | | | | | | 25,313,441 | |
Sweden — 6.0% | | | | | | | | |
Assa Abloy AB, Class B | | | 510,890 | | | | 10,734,947 | |
Hexagon AB, Class B | | | 293,531 | | | | 11,725,027 | |
| | | | | | | | |
| | | | | | | | 22,459,974 | |
United Kingdom — 11.6% | | | | | | | | |
AstraZeneca PLC | | | 258,029 | | | | 14,803,794 | |
Delta Topco Ltd., (Acquired 5/02/12, cost $962,533) (b) | | | 1,559,597 | | | | 623,839 | |
Imperial Brands PLC | | | 356,323 | | | | 19,374,426 | |
Lloyds Banking Group PLC | | | 8,557,666 | | | | 8,399,440 | |
| | | | | | | | |
| | | | | | | | 43,201,499 | |
United States — 54.7% | | | | | | | | |
Alphabet, Inc., Class C (a) | | | 13,402 | | | | 9,287,720 | |
AutoZone, Inc. (a) | | | 24,891 | | | | 19,047,340 | |
Cerner Corp. (a)(c) | | | 200,919 | | | | 11,279,593 | |
Citizens Financial Group, Inc. | | | 411,785 | | | | 9,409,287 | |
Colgate-Palmolive Co. | | | 190,818 | | | | 13,532,813 | |
Comcast Corp., Class A | | | 319,116 | | | | 19,389,488 | |
Crane Co. | | | 199,050 | | | | 11,061,208 | |
Danaher Corp. | | | 175,200 | | | | 16,950,600 | |
H&R Block, Inc. | | | 532,630 | | | | 10,780,431 | |
International Paper Co. | | | 209,017 | | | | 9,044,166 | |
MasterCard, Inc., Class A | | | 182,697 | | | | 17,719,782 | |
Stericycle, Inc. (a) | | | 146,139 | | | | 13,965,043 | |
Union Pacific Corp. | | | 176,523 | | | | 15,398,101 | |
United Technologies Corp. | | | 89,336 | | | | 9,323,998 | |
UnitedHealth Group, Inc. | | | 133,559 | | | | 17,587,049 | |
| | | | | | | | |
| | | | | | | | 203,776,619 | |
| Total Common Stocks — 96.9% | | | | | | | 361,053,417 | |
| | | | | | | | |
| | | | | | | | | |
| | |
| Corporate Bonds | | Par (000) | | | | |
China — 0.0% | | | | | | | | |
China Milk Products Group Ltd., 0.00%, 1/15/2012 (a)(d)(e) | | $ | 1,000 | | | | 10,000 | |
| | | | | | | | |
| Corporate Bonds | | Par (000) | | | Value | |
United Kingdom — 0.4% | | | | | | | | |
Delta Topco Ltd., (Acquired 5/02/12-1/01/16, cost $1,605,262), 10.00% (10.00% Cash), 11/24/60 (b)(f) | | $ | 1,583 | | | $ | 1,582,557 | |
| Total Corporate Bonds — 0.4% | | | | | | | 1,592,557 | |
| | | | | | | | |
| | | | | | | | | |
| | |
| Preferred Stock — 2.3% | | Shares | | | | |
United States — 2.3% | | | | | | | | |
Proteus Digital Health, (Acquired 7/22/14, cost $7,000,007), 0.00% (a)(b) | | | 532,725 | | | | 8,417,055 | |
Total Long-Term Investments
(Cost — $351,949,849) — 99.6% | | | | 371,063,029 | |
| | | | | | | | |
| | | | | | | | | |
| | |
| Short-Term Securities | | | | | | |
BlackRock Liquidity Funds, TempFund, Institutional Class, 0.40% (g)(h) | | | 2,448,991 | | | | 2,448,991 | |
| | |
| | | Beneficial
Interest (000) | | | | |
BlackRock Liquidity Series LLC, Money Market Series, 0.55% (g)(h)(i) | | $ | 3,251 | | | | 3,250,900 | |
Total Short-Term Securities
(Cost — $5,699,891) — 1.5% | | | | 5,699,891 | |
| Total Investments (Cost — $357,649,740) — 101.1% | | | | 376,762,920 | |
| Liabilities in Excess of Other Assets — (1.1)% | | | | (3,916,517 | ) |
| | | | | | | | |
| Net Assets — 100.0% | | | | | | $ | 372,846,403 | |
| | | | | | | | |
| | |
| ADR | | American Depositary Receipts |
See Notes to Financial Statements.
| | | | | | |
| | | | | | | |
| 8 | | BLACKROCK LONG-HORIZON EQUITY FUND | | APRIL 30, 2016 | | |
| | |
Schedule of Investments (continued) | | |
|
| Notes to Schedule of Investments |
| (a) | | Non-income producing security. |
| (b) | | Restricted security as to resale, excluding 144A securities. As of period end, the Fund held restricted securities with a current value of $10,623,451 and an original cost of $9,567,802 which was 2.8% of its net assets. |
| (c) | | Security, or a portion of security, is on loan. |
| (d) | | Issuer filed for bankruptcy and/or is in default of interest payments. |
| (f) | | Payment-in-kind security which may pay interest/dividends in additional par/shares and/or in cash. Rates shown are the current rate and possible payment rates. |
| (g) | | During the six months ended April 30, 2016, investments in issuers considered to be affiliates of the Fund for purposes of Section 2(a)(3) of the Investment Company Act of 1940, as amended, were as follows: |
| | | | | | | | | | | | | | | | |
| Affiliate | | Shares/Beneficial
Interest Held at
October 31,
2015 | | | Net
Activity | | | Shares/Beneficial
Interest Held at
April 30,
2016 | | | Income | |
BlackRock Liquidity Funds, TempFund, Institutional Class | | | 8,575,834 | | | | (6,126,843 | ) | | | 2,448,991 | | | $ | 15,319 | |
BlackRock Liquidity Series LLC, Money Market Series | | | — | | | $ | 3,250,900 | | | $ | 3,250,900 | | | | 238 | 1 |
Total | | | | | | | | | | | 5,699,891 | | | $ | 15,557 | |
| | | | | | | | | | | | | | | | |
1 Represents securities lending income earned from the reinvestment of cash collateral from loaned securities, net of fees, and other payments to and from borrowers of securities. | |
| (h) | | Current yield as of period end. |
| (i) | | Security was purchased with the cash collateral from loaned securities. The Fund may withdraw up to 25% of its investment daily, although the manager of the BlackRock Liquidity Series LLC, Money Market Series, in its sole discretion, may permit an investor to withdraw more than 25% on any one day. |
|
| Fair Value Hierarchy as of Period End |
Various inputs are used in determining the fair value of investments. For information about the Fund’s policy regarding valuation of investments, refer to the Notes to Financial Statements.
The following table summarizes the Fund’s investments categorized in the disclosure hierarchy:
| | | | | | | | | | | | | | | | |
| | | Level 1 | | | Level 2 | | | Level 3 | | | Total | |
Assets: | | | | | | | | | | | | | | | | |
| Investments: | | | | | | | | | | | | | | | | |
Common Stocks: | | | | | | | | | | | | | | | | |
Denmark | | | — | | | $ | 14,022,406 | | | | — | | | $ | 14,022,406 | |
India | | | — | | | | 13,031,780 | | | | — | | | | 13,031,780 | |
Ireland | | $ | 14,822,500 | | | | 13,432,723 | | | | — | | | | 28,255,223 | |
Israel | | | 10,992,475 | | | | — | | | | — | | | | 10,992,475 | |
Netherlands | | | — | | | | 25,313,441 | | | | — | | | | 25,313,441 | |
Sweden | | | — | | | | 22,459,974 | | | | — | | | | 22,459,974 | |
United Kingdom | | | — | | | | 42,577,660 | | | $ | 623,839 | | | | 43,201,499 | |
United States | | | 203,776,619 | | | | — | | | | — | | | | 203,776,619 | |
Corporate Bonds | | | — | | | | — | | | | 1,592,557 | | | | 1,592,557 | |
Preferred Stocks | | | — | | | | — | | | | 8,417,055 | | | | 8,417,055 | |
Short-Term Securities | | | 2,448,991 | | | | 3,250,900 | | | | — | | | | 5,699,891 | |
| | | | |
Total | | $ | 232,040,585 | | | $ | 134,088,884 | | | $ | 10,633,451 | | | $ | 376,762,920 | |
| | | | |
The Fund may hold assets and/or liabilities in which the fair value approximates the carrying amount for financial statement purposes. As of period end, such assets and/or liabilities are categorized within the disclosure hierarchy as follows:
| | | | | | | | | | | | | | |
| | | Level 1 | | | Level 2 | | | Level 3 | | Total | |
Assets: | | | | | | | | | | | | | | |
Foreign currency at value | | $ | 374 | | | | — | | | — | | $ | 374 | |
Liabilities: | | | | | | | | | | | | | | |
Collateral on securities loaned at value | | | — | | | $ | (3,250,900 | ) | | — | | | (3,250,900 | ) |
| | | | |
Total | | $ | 374 | | | $ | (3,250,900 | ) | | — | | $ | (3,250,526 | ) |
| | | | |
See Notes to Financial Statements.
| | | | | | |
| | | | | | | |
| | BLACKROCK LONG-HORIZON EQUITY FUND | | APRIL 30, 2016 | | 9 |
| | |
Schedule of Investments (concluded) | | |
During the six months ended April 30, 2016 there were no transfers between Level 1 and Level 2.
A reconciliation of Level 3 investments is presented when the Fund had a significant amount of Level 3 investments at the beginning and/or end of the year in relation to net assets. The following table is a reconciliation of Level 3 investments for which significant unobservable inputs were used in determining fair value:
| | | | | | | | | | | | | | | | |
| | | Common
Stock | | | Corporate
Bonds | | | Preferred
Stocks | | | Total | |
Assets: | | | | | | | | | | | | | | | | |
Opening Balance, as of October 31, 2015 | | $ | 740,809 | | | $ | 1,451,853 | | | $ | 7,000,007 | | | $ | 9,192,669 | |
Transfers into Level 3 | | | — | | | | — | | | | — | | | | — | |
Transfers out of Level 3 | | | — | | | | — | | | | — | | | | — | |
Accrued discounts/premiums | | | — | | | | — | | | | — | | | | — | |
Net realized gain (loss) | | | — | | | | — | | | | — | | | | — | |
Net change in unrealized appreciation (depreciation)1,2 | | | (116,970 | ) | | | (3,165 | ) | | | 1,417,048 | | | | 1,296,913 | |
Purchases | | | — | | | | 143,869 | | | | — | | | | 143,869 | |
Sales | | | — | | | | — | | | | — | | | | — | |
Closing Balance as of April 30, 2016 | | $ | 623,839 | | | $ | 1,592,557 | | | $ | 8,417,055 | | | $ | 10,633,451 | |
| | | | |
Net change in unrealized appreciation (depreciation) on investments held as of April 30, 2016 | | $ | (116,970 | ) | | $ | (3,165 | ) | | $ | 1,417,048 | | | $ | 1,296,913 | |
| | | | |
1 Included in the related net change in unrealized appreciation (depreciation) in the Statement of Operations. | |
2 Any difference between net change in unrealized appreciation (depreciation) and net change in unrealized appreciation (depreciation) on investments still held at April 30, 2016, is generally due to investments no longer held or categorized as Level 3 at period end. | |
The following table summarizes the valuation techniques used and unobservable inputs utilized by the BlackRock Global Valuation Methodologies Committee (the “Global Valuation Committee”) to determine the value of certain of the Fund’s Level 3 investments as of period end. The table does not include Level 3 investments with values based upon unadjusted third party pricing information in the amount of $10,000.
| | | | | | | | | | | | |
| | | Value | | | Valuation Techniques | | Unobservable Inputs | | Range of
Unobservable Inputs
Utilized | |
Assets: | | | | | | | | | | | | |
Common Stocks | | $ | 623,839 | | | Market Comparables | | Run Rate EBITDA Multiple1 | | | 21.0x | |
Corporate Bonds | | | 1,582,557 | | | Market Comparables | | Run Rate EBITDA Multiple1 | | | 21.0x | |
Preferred Stocks2 | | | 8,417,055 | | | Market Comparables | | Priced to Last Financing Round1 | | $ | 15.80 | |
| | | | |
Total | | $ | 10,623,451 | | | | | | | | | |
| | | | | | | | | | | | |
1 Increase in unobservable input may result in a significant increase to value, while a decrease in the unobservable input may result in a significant decrease to value. | |
2 For the period ended April 30, 2016, the valuation technique for certain investments classified as preferred stocks changed to a market approach. The investment was previously valued utilizing acquisition cost. A market approach was considered to be a more relevant measure of fair value for this investment. | |
See Notes to Financial Statements.
| | | | | | |
| | | | | | | |
| 10 | | BLACKROCK LONG-HORIZON EQUITY FUND | | APRIL 30, 2016 | | |
| | |
| Statement of Assets and Liabilities | | |
| | | | |
| April 30, 2016 (Unaudited) | | | |
| | | | |
| Assets | | | | |
Investments at value — unaffiliated (including securities loaned of $3,093,314) (cost — $351,949,849) | | $ | 371,063,029 | |
Investments at value — affiliated (cost — $5,699,891) | | | 5,699,891 | |
Foreign currency at value (cost — $365) | | | 374 | |
| Receivables: | | | | |
Investments sold | | | 12,160,178 | |
Dividends — unaffiliated | | | 1,280,997 | |
Capital shares sold | | | 80,797 | |
Interest | | | 51,887 | |
Dividends — affiliated | | | 2,544 | |
Securities lending income — affiliated | | | 129 | |
Prepaid expenses | | | 41,029 | |
| | | | |
Total assets | | | 390,380,855 | |
| | | | |
| | | | |
| Liabilities | |
Collateral on securities loaned at value | | | 3,250,900 | |
| Payables: | | | | |
Investments purchased | | | 12,322,322 | |
Capital shares redeemed | | | 1,237,141 | |
Investment advisory fees | | | 249,498 | |
Service and distribution fees | | | 119,180 | |
Deferred foreign capital gain tax | | | 27,707 | |
Officer’s and Trustees’ fees | | | 5,201 | |
Other affiliates | | | 1,422 | |
Other accrued expenses | | | 321,081 | |
| | | | |
Total liabilities | | | 17,534,452 | |
| | | | |
Net Assets | | $ | 372,846,403 | |
| | | | |
| | | | |
| Net Assets Consist of | |
Paid-in capital | | $ | 361,330,515 | |
Undistributed net investment income | | | 1,436,531 | |
Accumulated net realized loss | | | (8,973,833 | ) |
Net unrealized appreciation (depreciation) | | | 19,053,190 | |
| | | | |
Net Assets | | $ | 372,846,403 | |
| | | | |
| | | | |
| Net Asset Value | | | | |
Institutional — Based on net assets of $55,333,612 and 4,990,503 shares outstanding, unlimited shares authorized, $0.10 par value | | $ | 11.09 | |
| | | | |
Investor A — Based on net assets of $231,400,219 and 20,892,926 shares outstanding, unlimited shares authorized, $0.10 par value | | $ | 11.08 | |
| | | | |
Investor B — Based on net assets of $455,666 and 40,285 shares outstanding, unlimited shares authorized, $0.10 par value | | $ | 11.31 | |
| | | | |
Investor C — Based on net assets of $81,916,691 and 7,422,631 shares outstanding, unlimited shares authorized, $0.10 par value | | $ | 11.04 | |
| | | | |
Class R — Based on net assets of $3,740,215 and 337,132 shares outstanding, unlimited shares authorized, $0.10 par value | | $ | 11.09 | |
| | | | |
| | | | | | |
| See Notes to Financial Statements. | | | | |
| | | | | | | |
| | BLACKROCK LONG-HORIZON EQUITY FUND | | APRIL 30, 2016 | | 11 |
| | | | |
| Six Months Ended April 30, 2016 (Unaudited) | | | |
| | | | |
| Investment Income | | | | |
Dividends — unaffiliated | | $ | 4,364,311 | |
Interest | | | 76,313 | |
Dividends — affiliated | | | 15,319 | |
Securities lending — affiliated — net | | | 238 | |
Foreign taxes withheld | | | (185,986 | ) |
| | | | |
Total income | | | 4,270,195 | |
| | | | |
| | | | |
| Expenses | |
Investment advisory | | | 1,593,014 | |
Service and distribution — class specific | | | 759,522 | |
Transfer agent — class specific | | | 217,204 | |
Professional | | | 66,516 | |
Accounting services | | | 65,097 | |
Custodian | | | 54,988 | |
Registration | | | 35,754 | |
Printing | | | 16,701 | |
Officer and Trustees | | | 13,248 | |
Miscellaneous | | | 15,980 | |
| | | | |
Total expenses | | | 2,838,024 | |
| Less: | | | | |
Fees waived by the Manager | | | (3,646 | ) |
Transfer agent fees reimbursed — class specific | | | (674 | ) |
| | | | |
Total expenses after fees waived and/or reimbursed | | | 2,833,704 | |
| | | | |
Net investment income | | | 1,436,491 | |
| | | | |
| | | | |
| Realized and Unrealized Gain (Loss) | | | | |
| Net realized loss from: | | | | |
Investments | | | (8,707,434 | ) |
Foreign currency transactions | | | (50,116 | ) |
| | | | |
| | | (8,757,550 | ) |
| | | | |
| Net change in unrealized appreciation (depreciation) on: | | | | |
Investments (including $27,707 foreign capital gain tax) | | | (21,431,675 | ) |
Foreign currency translations | | | 29,316 | |
| | | | |
| | | (21,402,359 | ) |
| | | | |
Net realized and unrealized loss | | | (30,159,909 | ) |
| | | | |
Net Decrease in Net Assets Resulting from Operations | | $ | (28,723,418 | ) |
| | | | |
| | | | | | |
| See Notes to Financial Statements. | | | | |
| | | | | | | |
| 12 | | BLACKROCK LONG-HORIZON EQUITY FUND | | APRIL 30, 2016 | | |
| | |
| Statements of Changes in Net Assets | | |
| | | | | | | | |
| Increase (Decrease) in Net Assets: | | Six Months Ended
April 30,
2016
(Unaudited) | | | Year Ended
October 31,
2015 | |
| | | | | | | | |
| Operations | | | | | | | | |
Net investment income | | $ | 1,436,491 | | | $ | 2,723,561 | |
Net realized gain (loss) | | | (8,757,550 | ) | | | 28,166,256 | |
Net change in unrealized appreciation (depreciation) | | | (21,402,359 | ) | | | (33,483,492 | ) |
| | | | |
Net decrease in net assets resulting from operations | | | (28,723,418 | ) | | | (2,593,675 | ) |
| | | | |
| | | | | | | | |
| Distributions to Shareholders1 | | | | | | | | |
| From net investment income: | | | | | | | | |
Institutional | | | (694,578 | ) | | | (1,007,870 | ) |
Investor A | | | (1,763,202 | ) | | | (3,219,989 | ) |
Investor C | | | — | | | | (381,537 | ) |
Class R | | | (11,003 | ) | | | (17,144 | ) |
| From net realized gain: | | | | | | | | |
Institutional | | | (4,628,985 | ) | | | (11,862,920 | ) |
Investor A | | | (17,251,277 | ) | | | (46,410,117 | ) |
Investor B | | | (47,152 | ) | | | (291,196 | ) |
Investor C | | | (6,349,186 | ) | | | (17,262,600 | ) |
Class R | | | (241,152 | ) | | | (499,860 | ) |
| | | | |
Decrease in net assets resulting from distributions to shareholders | | | (30,986,535 | ) | | | (80,953,233 | ) |
| | | | |
| | | | | | | | |
| Capital Share Transactions | | | | | | | | |
Net decrease in net assets derived from capital share transactions | | | (17,988,292 | ) | | | (8,343,102 | ) |
| | | | |
| | | | | | | | |
| Net Assets | |
Total decrease in net assets | | | (77,698,245 | ) | | | (91,890,010 | ) |
Beginning of period | | | 450,544,648 | | | | 542,434,658 | |
| | | | |
End of period | | $ | 372,846,403 | | | $ | 450,544,648 | |
| | | | |
Undistributed net investment income, end of period | | $ | 1,436,531 | | | $ | 2,468,823 | |
| | | | |
| | 1 | | Distributions for annual periods determined in accordance with federal income tax regulations. |
| | | | | | |
| See Notes to Financial Statements. | | | | |
| | | | | | | |
| | BLACKROCK LONG-HORIZON EQUITY FUND | | APRIL 30, 2016 | | 13 |
| | | | | | | | | | | | | | | | | | | | | | | | |
| | | Institutional | |
| | | Six Months Ended
April 30, 2016
(Unaudited) | | | Year Ended October 31, | |
| | | | 2015 | | | 2014 | | | 20131 | | | 20121 | | | 20111 | |
| | | | | | | | | | | | | | | | | | | | | | | | |
| Per Share Operating Performance | | | | | | | | | | | | | | | | | | | | | | | | |
Net asset value, beginning of period | | $ | 12.80 | | | $ | 15.27 | | | $ | 14.48 | | | $ | 12.43 | | | $ | 11.98 | | | $ | 11.93 | |
| | | | |
Net investment income2 | | | 0.06 | | | | 0.13 | | | | 0.19 | | | | 0.15 | | | | 0.14 | | | | 0.15 | |
Net realized and unrealized gain (loss) | | | (0.83 | ) | | | (0.22 | ) | | | 1.11 | | | | 2.56 | | | | 0.64 | | | | 0.02 | 3 |
| | | | |
Net increase (decrease) from investment operations | | | (0.77 | ) | | | (0.09 | ) | | | 1.30 | | | | 2.71 | | | | 0.78 | | | | 0.17 | |
| | | | |
| Distributions:4 | | | | | | | | | | | | | | | | | | | | | | | | |
From net investment income | | | (0.12 | ) | | | (0.19 | ) | | | (0.18 | ) | | | (0.37 | ) | | | (0.33 | ) | | | (0.12 | ) |
From net realized gain | | | (0.82 | ) | | | (2.19 | ) | | | (0.33 | ) | | | (0.29 | ) | | | — | | | | — | |
| | | | |
Total distributions | | | (0.94 | ) | | | (2.38 | ) | | | (0.51 | ) | | | (0.66 | ) | | | (0.33 | ) | | | (0.12 | ) |
| | | | |
Net asset value, end of period | | $ | 11.09 | | | $ | 12.80 | | | $ | 15.27 | | | $ | 14.48 | | | $ | 12.43 | | | $ | 11.98 | |
| | | | |
| | | | | | | | | | | | | | | | | | | | | | | | |
| Total Return5 | | | | | | | | | | | | | | | | | | | | | | | | |
Based on net asset value | | | (6.18)% | 6 | | | (0.28)% | | | | 9.36% | | | | 22.71% | | | | 6.93% | | | | 1.41% | |
| | | | |
| | | | | | | | | | | | | | | | | | | | | | | | |
| Ratios to Average Net Assets | | | | | | | | | | | | | | | | | | | | | | | | |
Total expenses | | | 1.02% | 7 | | | 0.98% | | | | 0.95% | | | | 0.98% | | | | 1.01% | | | | 1.00% | |
| | | | |
Total expenses after fees waived and/or reimbursed | | | 1.02% | 7 | | | 0.98% | | | | 0.95% | | | | 0.98% | | | | 1.00% | | | | 1.00% | |
| | | | |
Total expenses after fees waived and/or reimbursed, excluding dividend expense | | | 1.02% | 7 | | | 0.98% | | | | 0.95% | | | | 0.98% | | | | 1.00% | | | | 1.00% | 8 |
| | | | |
Net investment income | | | 1.11% | 7 | | | 0.95% | | | | 1.31% | | | | 1.12% | | | | 1.17% | | | | 1.19% | |
| | | | |
| | | | | | | | | | | | | | | | | | | | | | | | |
| Supplemental Data | | | | | | | | | | | | | | | | | | | | | | | | |
Net assets, end of period (000) | | $ | 55,334 | | | $ | 72,806 | | | $ | 83,466 | | | $ | 130,942 | | | $ | 138,976 | | | $ | 319,863 | |
| | | | |
Portfolio turnover rate | | | 61% | | | | 71% | | | | 45% | | | | 11% | | | | 112% | | | | 37% | |
| | | | |
| | 1 | | Consolidated Financial Highlights. |
| | 2 | | Based on average shares outstanding |
| | 3 | | Includes redemption fees, which are less than $0.005 per share. |
| | 4 | | Distributions for annual periods determined in accordance with federal income tax regulations. |
| | 5 | | Where applicable, assumes the reinvestment of distributions. |
| | 6 | | Aggregate total return. |
| | 8 | | Excludes stock loan fees, which had no impact to the ratio. |
| | | | | | |
| See Notes to Financial Statements. | | | | |
| | | | | | | |
| 14 | | BLACKROCK LONG-HORIZON EQUITY FUND | | APRIL 30, 2016 | | |
| | |
| Financial Highlights (continued) | | |
| | | | | | | | | | | | | | | | | | | | | | | | |
| | | Investor A | |
| | | Six Months Ended
April 30, 2016
(Unaudited) | | | Year Ended October 31, | |
| | | | 2015 | | | 2014 | | | 20131 | | | 20121 | | | 20111 | |
| | | | | | | | | | | | | | | | | | | | | | | | |
| Per Share Operating Performance | | | | | | | | | | | | | | | | | | | | | | | | |
Net asset value, beginning of period | | $ | 12.76 | | | $ | 15.23 | | | $ | 14.43 | | | $ | 12.40 | | | $ | 11.95 | | | $ | 11.90 | |
| | | | |
Net investment income2 | | | 0.05 | | | | 0.09 | | | | 0.14 | | | | 0.11 | | | | 0.12 | | | | 0.11 | |
Net realized and unrealized gain (loss) | | | (0.83 | ) | | | (0.22 | ) | | | 1.13 | | | | 2.55 | | | | 0.63 | | | | 0.03 | 3 |
| | | | |
Net increase (decrease) from investment operations | | | (0.78 | ) | | | (0.13 | ) | | | 1.27 | | | | 2.66 | | | | 0.75 | | | | 0.14 | |
| | | | |
| Distributions:4 | | | | | | | | | | | | | | | | | | | | | | | | |
From net investment income | | | (0.08 | ) | | | (0.15 | ) | | | (0.14 | ) | | | (0.34 | ) | | | (0.30 | ) | | | (0.09 | ) |
From net realized gain | | | (0.82 | ) | | | (2.19 | ) | | | (0.33 | ) | | | (0.29 | ) | | | — | | | | — | |
| | | | |
Total distributions | | | (0.90 | ) | | | (2.34 | ) | | | (0.47 | ) | | | (0.63 | ) | | | (0.30 | ) | | | (0.09 | ) |
| | | | |
Net asset value, end of period | | $ | 11.08 | | | $ | 12.76 | | | $ | 15.23 | | | $ | 14.43 | | | $ | 12.40 | | | $ | 11.95 | |
| | | | |
| | | | | | | | | | | | | | | | | | | | | | | | |
| Total Return5 | | | | | | | | | | | | | | | | | | | | | | | | |
Based on net asset value | �� | | (6.27)% | 6 | | | (0.55)% | | | | 9.09% | | | | 22.32% | | | | 6.62% | | | | 1.14% | |
| | | | |
| | | | | | | | | | | | | | | | | | | | | | | | |
| Ratios to Average Net Assets | | | | | | | | | | | | | | | | | | | | | | | | |
Total expenses | | | 1.29% | 7 | | | 1.25% | | | | 1.22% | | | | 1.27% | | | | 1.28% | | | | 1.26% | |
| | | | |
Total expenses after fees waived and/or reimbursed | | | 1.29% | 7 | | | 1.25% | | | | 1.22% | | | | 1.27% | | | | 1.28% | | | | 1.26% | |
| | | | |
Total expenses after fees waived and/or reimbursed, excluding dividend expense | | | 1.29% | 7 | | | 1.25% | | | | 1.22% | | | | 1.27% | | | | 1.28% | | | | 1.26% | 8 |
| | | | |
Net investment income | | | 0.86% | 7 | | | 0.69% | | | | 0.96% | | | | 0.82% | | | | 1.04% | | | | 0.91% | |
| | | | |
| | | | | | | | | | | | | | | | | | | | | | | | |
| Supplemental Data | | | | | | | | | | | | | | | | | | | | | | | | |
Net assets, end of period (000) | | $ | 231,400 | | | $ | 273,185 | | | $ | 330,524 | | | $ | 354,562 | | | $ | 353,237 | | | $ | 381,311 | |
| | | | |
Portfolio turnover rate | | | 61% | | | | 71% | | | | 45% | | | | 11% | | | | 112% | | | | 37% | |
| | | | |
| | 1 | | Consolidated Financial Highlights. |
| | 2 | | Based on average shares outstanding. |
| | 3 | | Includes redemption fees, which are less than $0.005 per share. |
| | 4 | | Distributions for annual periods determined in accordance with federal income tax regulations. |
| | 5 | | Where applicable, excludes the effects of any sales charges and assumes the reinvestment of distributions. |
| | 6 | | Aggregate total return. |
| | 8 | | Excludes stock loan fees, which had no impact to the ratio. |
| | | | | | |
| See Notes to Financial Statements. | | | | |
| | | | | | | |
| | BLACKROCK LONG-HORIZON EQUITY FUND | | APRIL 30, 2016 | | 15 |
| | |
| Financial Highlights (continued) | | |
| | | | | | | | | | | | | | | | | | | | | | | | |
| | | Investor B | |
| | | Six Months Ended
April 30, 2016
(Unaudited) | | | Year Ended October 31, | |
| | | | 2015 | | | 2014 | | | 20131 | | | 20121 | | | 20111 | |
| | | | | | | | | | | | | | | | | | | | | | | | |
| Per Share Operating Performance | | | | | | | | | | | | | | | | | | | | | | | | |
Net asset value, beginning of period | | $ | 12.99 | | | $ | 15.37 | | | $ | 14.43 | | | $ | 12.39 | | | $ | 11.90 | | | $ | 11.86 | |
| | | | |
Net investment income (loss)2 | | | (0.01 | ) | | | (0.04 | ) | | | 0.02 | | | | 0.00 | 3 | | | 0.02 | | | | (0.06 | ) |
Net realized and unrealized gain (loss) | | | (0.85 | ) | | | (0.22 | ) | | | 1.14 | | | | 2.55 | | | | 0.64 | | | | 0.10 | 4 |
| | | | |
Net increase (decrease) from investment operations | | | (0.86 | ) | | | (0.26 | ) | | | 1.16 | | | | 2.55 | | | | 0.66 | | | | 0.04 | |
| | | | |
| Distributions:5 | | | | | | | | | | | | | | | | | | | | | | | | |
From net investment income | | | — | | | | — | | | | — | | | | (0.22 | ) | | | (0.17 | ) | | | — | |
From net realized gain | | | (0.82 | ) | | | (2.12 | ) | | | (0.22 | ) | | | (0.29 | ) | | | — | | | | — | |
| | | | |
Total distributions | | | (0.82 | ) | | | (2.12 | ) | | | (0.22 | ) | | | (0.51 | ) | | | (0.17 | ) | | | — | |
| | | | |
Net asset value, end of period | | $ | 11.31 | | | $ | 12.99 | | | $ | 15.37 | | | $ | 14.43 | | | $ | 12.39 | | | $ | 11.90 | |
| | | | |
| | | | | | | | | | | | | | | | | | | | | | | | |
| Total Return6 | | | | | | | | | | | | | | | | | | | | | | | | |
Based on net asset value | | | (6.82)% | 7 | | | (1.51)% | | | | 8.13 | % | | | 21.26 | % | | | 5.76 | % | | | 0.34 | % |
| | | | |
| | | | | | | | | | | | | | | | | | | | | | | | |
| Ratios to Average Net Assets | | | | | | | | | | | | | | | | | | | | | | | | |
Total expenses | | | 2.30 | %8 | | | 2.20 | % | | | 2.14 | % | | | 2.11 | % | | | 2.12 | % | | | 2.08 | % |
| | | | |
Total expenses after fees waived and/or reimbursed | | | 2.26 | %8 | | | 2.19 | % | | | 2.13 | % | | | 2.11 | % | | | 2.12 | % | | | 2.08 | % |
| | | | |
Total expenses after fees waived and/or reimbursed, excluding dividend expense | | | 2.26 | %8 | | | 2.19 | % | | | 2.13 | % | | | 2.11 | % | | | 2.12 | % | | | 2.08 | %9 |
| | | | |
Net investment income (loss) | | | (0.14 | )%8 | | | (0.31 | )% | | | 0.13 | % | | | 0.01 | % | | | 0.18 | % | | | (0.50 | )% |
| | | | |
| | | | | | | | | | | | | | | | | | | | | | | | |
| Supplemental Data | | | | | | | | | | | | | | | | | | | | | | | | |
Net assets, end of period (000) | | $ | 456 | | | $ | 893 | | | $ | 2,388 | | | $ | 6,200 | | | $ | 8,868 | | | $ | 13,819 | |
| | | | |
Portfolio turnover rate | | | 61 | % | | | 71 | % | | | 45 | % | | | 11 | % | | | 112 | % | | | 37 | % |
| | | | |
| | 1 | | Consolidated Financial Highlights. |
| | 2 | | Based on average shares outstanding. |
| | 3 | | Amount is less than $0.005 per share. |
| | 4 | | Includes redemption fees, which are less than $0.005 per share. |
| | 5 | | Distributions for annual periods determined in accordance with federal income tax regulations. |
| | 6 | | Where applicable, excludes the effects of any sales charges and assumes the reinvestment of distributions. |
| | 7 | | Aggregate total return. |
| | 9 | | Excludes stock loan fees, which had no impact to the ratio. |
| | | | | | |
| See Notes to Financial Statements. | | | | |
| | | | | | | |
| 16 | | BLACKROCK LONG-HORIZON EQUITY FUND | | APRIL 30, 2016 | | |
| | |
| Financial Highlights (continued) | | |
| | | | | | | | | | | | | | | | | | | | | | | | |
| | | Investor C | |
| | | Six Months Ended
April 30, 2016
(Unaudited) | | | Year Ended October 31, | |
| | | | 2015 | | | 2014 | | | 20131 | | | 20121 | | | 20111 | |
| | | | | | | | | | | | | | | | | | | | | | | | |
| Per Share Operating Performance | | | | | | | | | | | | | | | | | | | | | | | | |
Net asset value, beginning of period | | $ | 12.68 | | | $ | 15.14 | | | $ | 14.33 | | | $ | 12.32 | | | $ | 11.85 | | | $ | 11.81 | |
| | | | |
Net investment income (loss)2 | | | 0.00 | 3 | | | (0.01 | ) | | | 0.03 | | | | 0.01 | | | | 0.03 | | | | 0.02 | |
Net realized and unrealized gain (loss) | | | (0.82 | ) | | | (0.21 | ) | | | 1.12 | | | | 2.53 | | | | 0.64 | | | | 0.02 | 4 |
| | | | |
Net increase (decrease) from investment operations | | | (0.82 | ) | | | (0.22 | ) | | | 1.15 | | | | 2.54 | | | | 0.67 | | | | 0.04 | |
| | | | |
| Distributions:5 | | | | | | | | | | | | | | | | | | | | | | | | |
From net investment income | | | — | | | | (0.05 | ) | | | (0.01 | ) | | | (0.24 | ) | | | (0.20 | ) | | | — | |
From net realized gain | | | (0.82 | ) | | | (2.19 | ) | | | (0.33 | ) | | | (0.29 | ) | | | — | | | | — | |
| | | | |
Total distributions | | | (0.82 | ) | | | (2.24 | ) | | | (0.34 | ) | | | (0.53 | ) | | | (0.20 | ) | | | — | |
| | | | |
Net asset value, end of period | | $ | 11.04 | | | $ | 12.68 | | | $ | 15.14 | | | $ | 14.33 | | | $ | 12.32 | | | $ | 11.85 | |
| | | | |
| | | | | | | | | | | | | | | | | | | | | | | | |
| Total Return6 | | | | | | | | | | | | | | | | | | | | | | | | |
Based on net asset value | | | (6.66)% | 7 | | | (1.28)% | | | | 8.23% | | | | 21.36% | | | | 5.85% | | | | 0.34% | |
| | | | |
| | | | | | | | | | | | | | | | | | | | | | | | |
| Ratios to Average Net Assets | | | | | | | | | | | | | | | | | | | | | | | | |
Total expenses | | | 2.06% | 8 | | | 2.01% | | | | 1.99% | | | | 2.04% | | | | 2.05% | | | | 2.02% | |
| | | | |
Total expenses after fees waived and/or reimbursed | | | 2.06% | 8 | | | 2.01% | | | | 1.99% | | | | 2.03% | | | | 2.05% | | | | 2.02% | |
| | | | |
Total expenses after fees waived and/or reimbursed, excluding dividend expense | | | 2.06% | 8 | | | 2.01% | | | | 1.99% | | | | 2.03% | | | | 2.05% | | | | 2.02% | 9 |
| | | | |
Net investment income (loss) | | | 0.09% | 8 | | | (0.08)% | | | | 0.19% | | | | 0.05% | | | | 0.26% | | | | 0.13% | |
| | | | |
| | | | | | | | | | | | | | | | | | | | | | | | |
| Supplemental Data | | | | | | | | | | | | | | | | | | | | | | | | |
Net assets, end of period (000) | | $ | 81,917 | | | $ | 99,939 | | | $ | 122,305 | | | $ | 134,124 | | | $ | 133,374 | | | $ | 165,823 | |
| | | | |
Portfolio turnover rate | | | 61% | | | | 71% | | | | 45% | | | | 11% | | | | 112% | | | | 37% | |
| | | | |
| | 1 | | Consolidated Financial Highlights. |
| | 2 | | Based on average shares outstanding. |
| | 3 | | Amount is less than $0.005 per share. |
| | 4 | | Includes redemption fees, which are less than $0.005 per share. |
| | 5 | | Distributions for annual periods determined in accordance with federal income tax regulations. |
| | 6 | | Where applicable, excludes the effects of any sales charges and assumes the reinvestment of distributions. |
| | 7 | | Aggregate total return. |
| | 9 | | Excludes stock loan fees, which had no impact to the ratio. |
| | | | | | |
| See Notes to Financial Statements. | | | | |
| | | | | | | |
| | BLACKROCK LONG-HORIZON EQUITY FUND | | APRIL 30, 2016 | | 17 |
| | |
| Financial Highlights (concluded) | | |
| | | | | | | | | | | | | | | | | | | | | | | | |
| | | Class R | |
| | | Six Months Ended
April 30, 2016
(Unaudited) | | | Year Ended October 31, | |
| | | | 2015 | | | 2014 | | | 20131 | | | 20121 | | | 20111 | |
| | | | | | | | | | | | | | | | | | | | | | | | |
| Per Share Operating Performance | | | | | | | | | | | | | | | | | | | | | | | | |
Net asset value, beginning of period | | $ | 12.76 | | | $ | 15.21 | | | $ | 14.38 | | | $ | 12.36 | | | $ | 11.89 | | | $ | 11.85 | |
| | | | |
Net investment income2 | | | 0.03 | | | | 0.03 | | | | 0.07 | | | | 0.06 | | | | 0.07 | | | | 0.06 | |
Net realized and unrealized gain (loss) | | | (0.84 | ) | | | (0.22 | ) | | | 1.13 | | | | 2.54 | | | | 0.63 | | | | 0.02 | 3 |
| | | | |
Net increase (decrease) from investment operations | | | (0.81 | ) | | | (0.19 | ) | | | 1.20 | | | | 2.60 | | | | 0.70 | | | | 0.08 | |
| | | | |
| Distributions:4 | | | | | | | | | | | | | | | | | | | | | | | | |
From net investment income | | | (0.04 | ) | | | (0.07 | ) | | | (0.04 | ) | | | (0.29 | ) | | | (0.23 | ) | | | (0.04 | ) |
From net realized gain | | | (0.82 | ) | | | (2.19 | ) | | | (0.33 | ) | | | (0.29 | ) | | | — | | | | — | |
| | | | |
Total distributions | | | (0.86 | ) | | | (2.26 | ) | | | (0.37 | ) | | | (0.58 | ) | | | (0.23 | ) | | | (0.04 | ) |
| | | | |
Net asset value, end of period | | $ | 11.09 | | | $ | 12.76 | | | $ | 15.21 | | | $ | 14.38 | | | $ | 12.36 | | | $ | 11.89 | |
| | | | |
| | | | | | | | | | | | | | | | | | | | | | | | |
| Total Return5 | | | | | | | | | | | | | | | | | | | | | | | | |
Based on net asset value | | | (6.56)% | 6 | | | (0.99)% | | | | 8.56% | | | | 21.87% | | | | 6.17% | | | | 0.68% | |
| | | | |
| | | | | | | | | | | | | | | | | | | | | | | | |
| Ratios to Average Net Assets | | | | | | | | | | | | | | | | | | | | | | | | |
Total expenses | | | 1.73% | 7 | | | 1.78% | | | | 1.79% | | | | 1.86% | | | | 1.82% | | | | 1.77% | |
| | | | |
Total expenses after fees waived and/or reimbursed | | | 1.70% | 7 | | | 1.70% | | | | 1.70% | | | | 1.69% | | | | 1.69% | | | | 1.70% | |
| | | | |
Total expenses after fees waived and/or reimbursed, excluding dividend expense | | | 1.70% | 7 | | | 1.70% | | | | 1.70% | | | | 1.69% | | | | 1.69% | | | | 1.70% | 8 |
| | | | |
Net investment income | | | 0.47% | 7 | | | 0.21% | | | | 0.51% | | | | 0.45% | | | | 0.62% | | | | 0.48% | |
| | | | |
| | | | | | | | | | | | | | | | | | | | | | | | |
| Supplemental Data | | | | | | | | | | | | | | | | | | | | | | | | |
Net assets, end of period (000) | | $ | 3,740 | | | $ | 3,721 | | | $ | 3,751 | | | $ | 4,848 | | | $ | 6,853 | | | $ | 6,895 | |
| | | | |
Portfolio turnover rate | | | 61% | | | | 71% | | | | 45% | | | | 11% | | | | 112% | | | | 37% | |
| | | | |
| | 1 | | Consolidated Financial Highlights. |
| | 2 | | Based on average shares outstanding. |
| | 3 | | Includes redemption fees, which are less than $0.005 per share. |
| | 4 | | Distributions for annual periods determined in accordance with federal income tax regulations. |
| | 5 | | Where applicable, assumes the reinvestment of distributions. |
| | 6 | | Aggregate total return. |
| | 8 | | Excludes stock loan fees, which had no impact to the ratio. |
| | | | | | |
| See Notes to Financial Statements. | | | | |
| | | | | | | |
| 18 | | BLACKROCK LONG-HORIZON EQUITY FUND | | APRIL 30, 2016 | | |
| | | | |
| Notes to Financial Statements (Unaudited) | | |
1. Organization:
BlackRock Long-Horizon Equity Fund (the “Fund”) is registered under the Investment Company Act of 1940, as amended (the “1940 Act”). The Fund is registered as a diversified, open-end management investment company. The Fund is organized as a Delaware statutory trust.
The Fund offers multiple classes of shares. Institutional Shares are sold without a sales charge and only to certain eligible investors. Investor A Shares are generally sold with an initial sales charge, and may be subject to a CDSC for certain redemptions where no initial sales charge was paid at the time of purchase. Investor B and Investor C Shares may be subject to a CDSC. Class R Shares are sold without a sales charge and only to certain employer-sponsored retirement plans. All classes of shares have identical voting, dividend, liquidation and other rights and are subject to the same terms and conditions. Investor A, Investor B, Investor C, and Class R Shares bear certain expenses related to shareholder servicing of such shares, and Investor B, Investor C, and Class R Shares also bear certain expenses related to the distribution of such shares. Investor B Shares automatically convert to Investor A Shares after approximately eight years. Institutional Shares are sold only to certain eligible investors. Investor B Shares are only available through exchanges and distribution reinvestments by current holders and for purchase by certain employer-sponsored retirement plans. Investor A and Investor C Shares are generally available through financial intermediaries. Each class has exclusive voting rights with respect to matters relating to its shareholder servicing and distribution expenditures (except that Investor B shareholders may vote on material changes to the Investor A distribution and service plan).
The Fund, together with certain other registered investment companies advised by BlackRock Advisors, LLC (the “Manager”) or its affiliates, is included in a complex of open-end funds referred to as the Equity-Bond Complex.
Basis of Consolidation: The accompanying consolidated financial highlights of the Fund include the accounts of BlackRock Cayman Global Dynamic Equity Fund I, Ltd. (the “Subsidiary”), which was a wholly owned subsidiary of the Fund and primarily invested in commodity-related instruments. During the year ended October 31, 2013, the Subsidiary was dissolved. The Subsidiary enabled the Fund to hold these commodity-related instruments and satisfy regulated investment company tax requirements. Intercompany accounts and transactions, if any, have been eliminated.
2. Significant Accounting Policies:
The financial statements are prepared in conformity with accounting principles generally accepted in the United States of America (“U.S. GAAP”), which may require management to make estimates and assumptions that affect the reported amounts of assets and liabilities in the financial statements, disclosure of contingent assets and liabilities at the date of the financial statements and the reported amounts of increases and decreases in net assets from operations during the reporting period. Actual results could differ from those estimates. The Fund is considered an investment company under U.S. GAAP and follows the accounting and reporting guidance applicable to investment companies. Below is a summary of significant accounting policies:
Foreign Currency: The Fund’s books and records are maintained in U.S. dollars. Purchases and sales of investments are recorded at the rates of exchange prevailing on the respective dates of such transactions. Generally, when the U.S. dollar rises in value against a foreign currency, the investments denominated in that currency will lose value; the opposite effect occurs if the U.S. dollar falls in relative value.
The Fund does not isolate changes in the exchange rates from the changes in the market prices of investments held or sold for financial reporting purposes. Accordingly, the effects of changes in exchange rates on investments are not segregated in the Statement of Operations from the effects of changes in market prices of those investments, but are included as a component of net realized and unrealized gain (loss) from investments. The Fund reports realized currency gains (losses) on foreign currency related transactions as components of net realized gain (loss) for financial reporting purposes, whereas such components are generally treated as ordinary income for federal income tax purposes.
Investment Transactions and Investment Income: For financial reporting purposes, investment transactions are recorded on the dates the transactions are entered into (the trade dates). Realized gains and losses on investment transactions are determined on the identified cost basis. Dividend income is recorded on the ex-dividend date. Dividends from foreign securities where the ex-dividend date may have passed are subsequently recorded when the Fund is informed of the ex-dividend date. Under the applicable foreign tax laws, a withholding tax at various rates may be imposed on capital gains, dividends and interest. Interest income, including amortization and accretion of premiums and discounts on debt securities, is recognized on the accrual basis. Income, expenses and realized and unrealized gains and losses are allocated daily to each class based on its relative net assets.
Distributions: Distributions paid by the Fund are recorded on the ex-dividend date. The character and timing of distributions are determined in accordance with federal income tax regulations, which may differ from U.S. GAAP.
| | | | | | |
| | | | | | | |
| | BLACKROCK LONG-HORIZON EQUITY FUND | | APRIL 30, 2016 | | 19 |
| | |
| Notes to Financial Statements (continued) | | |
Indemnifications: In the normal course of business, the Fund enters into contracts that contain a variety of representations that provide general indemnification. The Fund’s maximum exposure under these arrangements is unknown because it involves future potential claims against the Fund, which cannot be predicted with any certainty.
Other: Expenses directly related to the Fund or its classes are charged to the Fund or the applicable class. Other operating expenses shared by several funds, including other funds managed by the Manager, are prorated among those funds on the basis of relative net assets or other appropriate methods. Expenses directly related to the Fund and other shared expenses prorated to the Fund are allocated daily to each class based on its relative net assets or other appropriate methods.
The Fund has an arrangement with its custodian whereby fees may be reduced by credits earned on uninvested cash balances, which, if applicable, are shown as fees paid indirectly in the Statement of Operations. The custodian imposes fees on overdrawn cash balances, which can be offset by accumulated credits earned or may result in additional custody charges.
3. Investment Valuation and Fair Value Measurements:
Investment Valuation Policies: The Fund’s investments are valued at fair value (also referred to as “market value” within the financial statements) as of the close of trading on the New York Stock Exchange (“NYSE”) (generally 4:00 p.m., Eastern time) (or if the reporting date falls on a day the NYSE is closed, investments are valued at fair value as of the report date). U.S. GAAP defines fair value as the price the Fund would receive to sell an asset or pay to transfer a liability in an orderly transaction between market participants at the measurement date. The Fund determines the fair values of its financial instruments using various independent dealers or pricing services under policies approved by the Board of Trustees of the Fund (the “Board”). The BlackRock Global Valuation Methodologies Committee (the “Global Valuation Committee”) is the committee formed by management to develop global pricing policies and procedures and to oversee the pricing function for all financial instruments.
Fair Value Inputs and Methodologies: The following methods (or “techniques”) and inputs are used to establish the fair value of the Fund’s assets and liabilities:
| • | | Equity investments traded on a recognized securities exchange are valued at the official closing price each day, if available. For equity investments traded on more than one exchange, the official close price on the exchange where the stock is primarily traded is used. Equity investments traded on a recognized exchange for which there were no sales on that day may be valued at the last available bid (long positions) or ask (short positions) price. |
| • | | Bond investments are valued on the basis of last available bid prices or current market quotations provided by dealers or pricing services. Floating rate loan interests are valued at the mean of the bid prices from one or more brokers or dealers as obtained from a pricing service. In determining the value of a particular investment, pricing services may use certain information with respect to transactions in such investments, quotations from dealers, pricing matrixes, market transactions in comparable investments, various relationships observed in the market between investments and calculated yield measures. Asset-backed and mortgage-backed securities are valued by independent pricing services using models that consider estimated cash flows of each tranche of the security, establish a benchmark yield and develop an estimated tranche-specific spread to the benchmark yield based on the unique attributes of the tranche. |
| • | | Generally, trading in foreign instruments is substantially completed each day at various times prior to the close of business on the NYSE. Occasionally, events affecting the values of such instruments may occur between the foreign market close and the close of business on the NYSE that may not be reflected in the computation of the Fund’s net assets. Each business day, the Fund uses a pricing service to assist with the valuation of certain foreign exchange-traded equity securities and foreign exchange-traded and over-the-counter (“OTC”) options (the “Systematic Fair Value Price”). Using current market factors, the Systematic Fair Value Price is designed to value such foreign securities and foreign options at fair value as of the close of business on the NYSE, which follows the close of the local markets. |
| • | | Investments in open-end U.S. mutual funds are valued at net asset value (“NAV”) each business day. |
| • | | The Fund values its investment in BlackRock Liquidity Series, LLC, Money Market Series (the “Money Market Series”) at fair value, which is ordinarily based upon its pro rata ownership in the underlying fund’s net assets. The Money Market Series seeks current income consistent with maintaining liquidity and preserving capital. Although the Money Market Series is not registered under the 1940 Act, its investments may follow the parameters of investments by a money market fund that is subject to Rule 2a-7 under the 1940 Act. The Fund may withdraw up to 25% of its investment daily, although the manager of the Money Market Series, in its sole discretion, may permit an investor to withdraw more than 25% on any one day. |
| | | | | | |
| | | | | | | |
| 20 | | BLACKROCK LONG-HORIZON EQUITY FUND | | APRIL 30, 2016 | | |
| | | | |
| Notes to Financial Statements (continued) | | |
| • | | Securities and other assets and liabilities denominated in foreign currencies are translated into U.S. dollars using exchange rates determined as of the close of business on the NYSE. Forward foreign currency exchange contracts are valued at the mean between the bid and ask prices and are determined as of the close of business on the NYSE. Interpolated values are derived when the settlement date of the contract is an interim date for which quotations are not available. |
If events (e.g., a company announcement, market volatility or a natural disaster) occur that are expected to materially affect the value of such instruments, or in the event that the application of these methods of valuation results in a price for an investment that is deemed not to be representative of the market value of such investment, or if a price is not available, the investment will be valued by the Global Valuation Committee, or its delegate, in accordance with a policy approved by the Board as reflecting fair value (“Fair Valued Investments”). When determining the price for Fair Valued Investments, the Global Valuation Committee, or its delegate, seeks to determine the price that the Fund might reasonably expect to receive or pay from the current sale or purchase of that asset or liability in an arm’s-length transaction. Fair value determinations shall be based upon all available factors that the Global Valuation Committee, or its delegate, deems relevant consistent with the principles of fair value measurement, which include the market approach, income approach and/or in the case of recent investments, the cost approach, as appropriate. The market approach generally consists of using comparable market transactions. The income approach generally is used to discount future cash flows to present value and is adjusted for liquidity as appropriate. These factors include but are not limited to: (i) attributes specific to the investment or asset; (ii) the principal market for the investment or asset; (iii) the customary participants in the principal market for the investment or asset; (iv) data assumptions by market participants for the investment or asset, if reasonably available; (v) quoted prices for similar investments or assets in active markets; and (vi) other factors, such as future cash flows, interest rates, yield curves, volatilities, prepayment speeds, loss severities, credit risks, recovery rates, liquidation amounts and/or default rates. Due to the inherent uncertainty of valuations of such investments, the fair values may differ from the values that would have been used had an active market existed.
The Global Valuation Committee, or its delegate, employs various methods for calibrating valuation approaches for investments where an active market does not exist, including regular due diligence of the Fund’s pricing vendors, regular reviews of key inputs and assumptions, transactional back-testing or disposition analysis to compare unrealized gains and losses to realized gains and losses, reviews of missing or stale prices and large movements in market values and reviews of any market related activity. The pricing of all Fair Valued Investments is subsequently reported to the Board or a committee thereof on a quarterly basis.
Fair Value Hierarchy: Various inputs are used in determining the fair value of investments. These inputs to valuation techniques are categorized into a fair value hierarchy consisting of three broad levels for financial statement purposes as follows:
| • | | Level 1 — unadjusted price quotations in active markets/exchanges for identical assets or liabilities that the Fund has the ability to access |
| • | | Level 2 — other observable inputs (including, but not limited to, quoted prices for similar assets or liabilities in markets that are active, quoted prices for identical or similar assets or liabilities in markets that are not active, inputs other than quoted prices that are observable for the assets or liabilities (such as interest rates, yield curves, volatilities, prepayment speeds, loss severities, credit risks and default rates) or other market–corroborated inputs) |
| • | | Level 3 — unobservable inputs based on the best information available in the circumstances, to the extent observable inputs are not available (including the Fund’s own assumptions used in determining the fair value of investments) |
The hierarchy gives the highest priority to unadjusted quoted prices in active markets for identical assets or liabilities (Level 1 measurements) and the lowest priority to unobservable inputs (Level 3 measurements). Accordingly, the degree of judgment exercised in determining fair value is greatest for instruments categorized in Level 3. The inputs used to measure fair value may fall into different levels of the fair value hierarchy. In such cases, for disclosure purposes, the fair value hierarchy classification is determined based on the lowest level input that is significant to the fair value measurement in its entirety. The significant unobservable inputs used by the Global Valuation Committee in determining the price for Fair Valued Investments are typically categorized as Level 3. The fair value hierarchy for the Fund’s investments has been included in the Schedule of Investments.
Changes in valuation techniques may result in transfers into or out of an assigned level within the hierarchy. In accordance with the Fund’s policy, transfers between different levels of the fair value hierarchy are deemed to have occurred as of the beginning of the reporting period. The categorization of a value determined for investments is based on the pricing transparency of the investments and is not necessarily an indication of the risks associated with investing in those securities.
| | | | | | |
| | | | | | | |
| | BLACKROCK LONG-HORIZON EQUITY FUND | | APRIL 30, 2016 | | 21 |
| | |
| Notes to Financial Statements (continued) | | |
4. Securities and Other Investments:
Zero-Coupon Bonds: Zero-coupon bonds are normally issued at a significant discount from face value and do not provide for periodic interest payments. These bonds may experience greater volatility in market value than other debt obligations of similar maturity which provide for regular interest payments.
Preferred Stock: Preferred stock has a preference over common stock in liquidation (and generally in receiving dividends as well) but is subordinated to the liabilities of the issuer in all respects. As a general rule, the market value of preferred stock with a fixed dividend rate and no conversion element varies inversely with interest rates and perceived credit risk, while the market price of convertible preferred stock generally also reflects some element of conversion value. Because preferred stock is junior to debt securities and other obligations of the issuer, deterioration in the credit quality of the issuer will cause greater changes in the value of a preferred stock than in a more senior debt security with similar stated yield characteristics. Unlike interest payments on debt securities, preferred stock dividends are payable only if declared by the issuer’s board of directors. Preferred stock also may be subject to optional or mandatory redemption provisions.
Securities Lending: The Fund may lend its securities to approved borrowers, such as brokers, dealers and other financial institutions. The borrower pledges and maintains with the Fund collateral consisting of cash, an irrevocable letter of credit issued by a bank, or securities issued or guaranteed by the U.S. Government. The initial collateral received by the Fund is required to have a value of at least 102% of the current value of the loaned securities for securities traded on U.S. exchanges and a value of at least 105% for all other securities. The collateral is maintained thereafter at a value equal to at least 100% of the current market value of the securities on loan. The market value of the loaned securities is determined at the close of each business day of the Fund and any additional required collateral is delivered to the Fund, or excess collateral returned by the Fund, on the next business day. During the term of the loan, the Fund is entitled to all distributions made on or in respect of the loaned securities. Loans of securities are terminable at any time and the borrower, after notice, is required to return borrowed securities within the standard time period for settlement of securities transactions.
The market value of any securities on loan, all of which were classified as common stocks in the Fund’s Schedule of Investments, and the value of any related collateral are shown separately in the Statement of Assets and Liabilities as a component of investments at value-unaffiliated, and collateral on securities loaned at value, respectively. As of period end, any securities on loan were collateralized by cash. The cash collateral invested by the securities lending agent, BlackRock Investment Management, LLC (“BIM”), if any, is disclosed in the Schedule of Investments.
Securities lending transactions are entered into by the Fund under Master Securities Lending Agreements (each, an “MSLA”), which provide the right, in the event of default (including bankruptcy or insolvency), for the non-defaulting party to liquidate the collateral and calculate a net exposure to the defaulting party or request additional collateral. In the event that a borrower defaults, the Fund, as lender, would offset the market value of the collateral received against the market value of the securities loaned. When the value of the collateral is greater than that of the market value of the securities loaned, the lender is left with a net amount payable to the defaulting party. However, bankruptcy or insolvency laws of a particular jurisdiction may impose restrictions on or prohibitions against such a right of offset in the event of an MSLA counterparty’s bankruptcy or insolvency. Under the MSLA, absent an event of default the borrower can resell or re-pledge the loaned securities, and the Fund can reinvest cash collateral received in connection with loaned securities. Upon an event of default, the parties’ obligations to return the securities or collateral to the other party are extinguished, and the parties can resell or re-pledge the loaned securities or the collateral received in connection with the loaned securities in order to satisfy the defaulting party’s net payment obligation for all transactions under the MSLA. The defaulting party remains liable for any deficiency.
As of period end, the following table is a summary of the Fund’s securities lending agreements by counterparty which are subject to offset under an MSLA:
| | | | | | | | | | | | |
| Counterparty | | Securities
Loaned
at Value | | | Cash
Collateral
Received1 | | | Net Amount | |
Morgan Stanley & Co. LLC | | $ | 3,093,314 | | | $ | (3,093,314 | ) | | | — | |
| | 1 | | Collateral with a value of $3,250,900 has been received in connection with securities lending agreements. Collateral received in excess of the value of securities loaned from the individual counterparty is not shown for financial reporting purposes in the table above. |
The risks of securities lending include the risk that the borrower may not provide additional collateral when required or may not return the securities when due. To mitigate these risks, the Fund benefits from a borrower default indemnity provided by BIM. BIM’s indemnity allows for full replacement of the securities loaned if the collateral received does not cover the value on the securities loaned in the event of borrower default. The Fund could suffer a loss if the value of an investment purchased with cash collateral falls below the market value of loaned securities or if the value of an investment purchased with cash collateral falls below the value of the original cash collateral received.
| | | | | | |
| | | | | | | |
| 22 | | BLACKROCK LONG-HORIZON EQUITY FUND | | APRIL 30, 2016 | | |
| | | | |
| Notes to Financial Statements (continued) | | |
5. Investment Advisory Agreement and Other Transactions with Affiliates:
The PNC Financial Services Group, Inc. is the largest stockholder and an affiliate of BlackRock, Inc. (“BlackRock”) for 1940 Act purposes.
Investment Advisory
The Fund entered into an Investment Advisory Agreement with the Manager, the Fund’s investment advisor, an indirect, wholly owned subsidiary of BlackRock, to provide investment advisory and administration services. The Manager is responsible for the management of the Fund’s portfolio and provides the personnel, facilities, equipment and certain other services necessary to the operations of the Fund. For such services, the Fund pays the Manager a monthly fee, which is determined by calculating a percentage of the Fund’s average daily net assets, based on the following annual rates:
| | | | |
| Average Daily Net Assets | | Investment Advisory Fee | |
First $1 Billion | | | 0.80% | |
$1 Billion — $3 Billion | | | 0.75% | |
$3 Billion — $5 Billion | | | 0.72% | |
$5 Billion — $10 Billion | | | 0.70% | |
Greater than $10 Billion | | | 0.68% | |
The Manager, with respect to the Fund, entered into a sub-advisory agreement with BlackRock International Limited (“BIL”), an affiliate of the Manager. The Manager pays BIL, for services it provides, a monthly fee that is a percentage of the investment advisory fees paid by the Fund to the Manager.
Service and Distribution Fees
The Fund entered into a Distribution Agreement and a Distribution and Service Plan with BlackRock Investments, LLC (“BRIL”), an affiliate of the Manager. Pursuant to the Distribution and Service Plan and in accordance with Rule 12b-1 under the 1940 Act, the Fund pays BRIL ongoing service and distribution fees. The fees are accrued daily and paid monthly at annual rates based upon the average daily net assets of the relevant share class of the Fund as follows:
| | | | | | | | |
| | | Service
Fee | | | Distribution
Fee | |
Investor A | | | 0.25% | | | | — | |
Investor B | | | 0.25% | | | | 0.75% | |
Investor C | | | 0.25% | | | | 0.75% | |
Class R | | | 0.25% | | | | 0.25% | |
BRIL and broker-dealers, pursuant to sub-agreements with BRIL, provide shareholder servicing and distribution services to the Fund. The ongoing service and distribution fee compensates BRIL and each broker-dealer for providing shareholder servicing and distribution related services to the shareholders.
For the six months ended April 30, 2016, the following table shows the class specific service and distribution fees borne directly by each share class of the Fund:
| | | | |
| Service and Distribution Fees | | | |
Investor A | | $ | 305,699 | |
Investor B | | $ | 3,230 | |
Investor C | | $ | 441,550 | |
Class R | | $ | 9,043 | |
Transfer Agent
Pursuant to written agreements, certain financial intermediaries, some of which may be affiliates, provide the Fund with sub-accounting, recordkeeping, sub-transfer agency and other administrative services with respect to sub-accounts they service. For these services, these entities receive an asset-based fee or an annual fee per shareholder account, which will vary depending on share class and/or net assets.
The Manager maintains a call center that is responsible for providing certain shareholder services to the Fund. Shareholder services include responding to inquiries and processing subscriptions and redemptions transactions based upon instructions from shareholders. For the six months
| | | | | | |
| | | | | | | |
| | BLACKROCK LONG-HORIZON EQUITY FUND | | APRIL 30, 2016 | | 23 |
| | |
| Notes to Financial Statements (continued) | | |
ended April 30, 2016, the Fund reimbursed the Manager the following amounts for costs incurred in running the call center, which are included in transfer agent — class specific in the Statement of Operations:
| | | | |
| Call Center Reimbursements | | | |
Institutional | | $ | 330 | |
Investor A | | $ | 2,541 | |
Investor B | | $ | 19 | |
Investor C | | $ | 736 | |
Class R | | $ | 7 | |
For the six months ended April 30, 2016, the following table shows the class specific transfer agent fees borne directly by each class of the Fund:
| | | | |
| Transfer Agent Fees | | | |
Institutional | | $ | 27,842 | |
Investor A | | $ | 128,246 | |
Investor B | | $ | 1,191 | |
Investor C | | $ | 54,622 | |
Class R | | $ | 5,303 | |
Other Fees
For the six months ended April 30, 2016, affiliates earned underwriting discounts, direct commissions and dealer concessions on sales of the Fund’s Investor A Shares, which total $36.
For the six months ended April 30, 2016, affiliates received CDSCs as follows:
| | | | |
Investor A | | $ | 2,280 | |
Investor C | | $ | 691 | |
For the six months ended April 30, 2016, the Fund reimbursed the Manager for certain accounting services, which is included in accounting services in the Statement of Operations. The reimbursements were as follows:
| | | | |
| Accounting Services Reimbursements | | | |
Institutional | | $ | 366 | |
Investor A | | $ | 1,451 | |
Investor B | | $ | 4 | |
Investor C | | $ | 524 | |
Class R | | $ | 21 | |
Expense Limitations, Waivers and Reimbursements
The Manager, with respect to the Fund, contractually agreed to waive and/or reimburse fees or expenses in order to limit expenses, excluding interest expense, dividend expense, tax expense, acquired fund fees and expenses, and certain other fund expenses, which constitute extraordinary expenses not incurred in the ordinary course of the Fund’s business. The current expense limitation as a percentage of average daily net assets is as follows: 1.15% for Institutional; 1.43% for Investor A; 2.29% for Investor B and Investor C and 1.70% for Class R. For the six months ended April 30, 2016, the Manager waived and/or reimbursed the following amounts:
| | | | |
| Waivers and/or Reimbursements | | | |
Investor B | | $ | 129 | |
Class R | | $ | 545 | |
The Manager has agreed not to reduce or discontinue these contractual expense limitations prior to March 1, 2017, unless approved by the Board, including a majority of the Independent Trustees, or by a majority of the outstanding voting securities of the Fund.
The Manager voluntarily agreed to waive its investment advisory fees by the amount of investment advisory fees the Fund pays to the Manager indirectly through its investment in affiliated money market funds. This amount is shown as fees waived by the Manager in the Statement of Operations. However, the Manager does not waive its investment advisory fees by the amount of investment advisory fees paid in connection with the Fund’s investments in other affiliated investment companies, if any.
| | | | | | |
| | | | | | | |
| 24 | | BLACKROCK LONG-HORIZON EQUITY FUND | | APRIL 30, 2016 | | |
| | | | |
| Notes to Financial Statements (continued) | | |
Securities Lending
The U.S. Securities and Exchange Commission has issued an exemptive order which permits BIM, an affiliate of the Manager, to serve as securities lending agent for the Fund, subject to applicable conditions. As securities lending agent, BIM bears all operational costs directly related to securities lending. The Fund is responsible for expenses in connection with the investment of cash collateral received for securities on loan (the “collateral investment expenses”). The cash collateral is invested in a private investment company managed by the Manager or its affiliates. However, BIM has agreed to cap the collateral investment expenses of the private investment company to an annual rate of 0.04%. The investment advisor to the private investment company will not charge any advisory fees with respect to shares purchased by the Fund.
Securities lending income is equal to the total of income earned from the reinvestment of cash collateral, net of fees and other payments to and from borrowers of securities, and less the collateral investment expenses. The Fund retains a portion of securities lending income and remits a remaining portion to BIM as compensation for its services as securities lending agent.
Pursuant to a securities lending agreement, the Fund retains 80% of securities lending income, and this amount retained can never be less than 70% of the total of securities lending income plus the collateral investment expenses.
In addition, commencing the business day following the date that the aggregate securities lending income earned across the Equity-Bond Complex in a calendar year exceeds a specified threshold, the Fund, pursuant to the securities lending agreement, will retain for the remainder of that calendar year securities lending income as follows: 85% of securities lending income, and this amount can never be less than 70% of the total of securities lending income plus the collateral investment expenses.
The share of securities lending income earned by the Fund is shown as securities lending — affiliated — net in the Statement of Operations. For the six months ended April 30, 2016, the Fund paid BIM $53 for securities lending agent services.
Officers and Trustees
Certain officers and/or trustees of the Fund are officers and/or directors of BlackRock or its affiliates. The Fund reimburses the Manager for a portion of the compensation paid to the Fund’s Chief Compliance Officer, which is included in Officer and Trustees in the Statement of Operations.
6. Purchases and Sales:
For the six months ended April 30, 2016, purchases and sales of investments, excluding short-term securities, were $241,957,663 and $282,832,639, respectively.
7. Income Tax Information:
It is the Fund’s policy to comply with the requirements of the Internal Revenue Code of 1986, as amended, applicable to regulated investment companies, and to distribute substantially all of its taxable income to its shareholders. Therefore, no federal income tax provision is required.
The Fund files U.S. federal and various state and local tax returns. No income tax returns are currently under examination. The statute of limitations on the Fund’s U.S. federal tax returns remains open for each of the four years ended October 31, 2015. The statutes of limitations on the Fund’s state and local tax returns may remain open for an additional year depending upon the jurisdiction.
Management has analyzed tax laws and regulations and their application to the Fund as of April 30, 2016, inclusive of the open tax return years, and does not believe there are any uncertain tax positions that require recognition of a tax liability in the Fund’s financial statements.
As of April 30, 2016, gross unrealized appreciation and depreciation based on cost for federal income tax purposes were as follows:
| | | | |
Tax cost | | $ | 357,865,998 | |
| | | | |
Gross unrealized appreciation | | $ | 43,091,104 | |
Gross unrealized depreciation | | | (24,194,182 | ) |
| | | | |
Net unrealized appreciation | | $ | 18,896,922 | |
| | | | |
8. Bank Borrowings:
The Fund, along with certain other funds managed by the Manager and its affiliates (“Participating Funds”), is a party to a 364-day, $2.1 billion credit agreement with a group of lenders. Under this agreement, the Fund may borrow to fund shareholder redemptions. Excluding commitments designated
| | | | | | |
| | | | | | | |
| | BLACKROCK LONG-HORIZON EQUITY FUND | | APRIL 30, 2016 | | 25 |
| | |
| Notes to Financial Statements (continued) | | |
for certain individual funds, the Participating Funds, including the Fund, can borrow up to an aggregate commitment amount of $1.6 billion at any time outstanding, subject to asset coverage and other limitations as specified in the agreement. The credit agreement has the following terms: a fee of 0.12% per annum on unused commitment amounts and interest at a rate equal to the higher of (a) one-month LIBOR (but, in any event, not less than 0.00%) on the date the loan is made plus 0.80% per annum or (b) the Fed Funds rate (but, in any event, not less than 0.00%) in effect from time to time plus 0.80% per annum on amounts borrowed. The agreement expires in April 2017 unless extended or renewed. Prior to April 21, 2016, a fee per annum was 0.06% on unused commitment amounts and interest at a rate equal to the higher of (a) one-month LIBOR (but, in any event, not less than 0.00%) on the date the loan is made plus 0.80% per annum or (b) the Fed Funds rate (but, in any event, not less than 0.00%) in effect from time to time plus 0.80% per annum on amounts borrowed. Participating Funds paid administration, legal and arrangement fees, which, if applicable, are included in miscellaneous expenses in the Statement of Operations. These fees were allocated among such funds based upon portions of the aggregate commitment available to them and relative net assets of Participating Funds. During the six months ended April 30, 2016, the Fund did not borrow under the credit agreement.
9. Principal Risks:
In the normal course of business, the Fund invests in securities and enters into transactions where risks exist due to fluctuations in the market (market risk) or failure of the issuer to meet all its obligations, including the ability to pay principal and interest when due (issuer credit risk). The value of securities held by the Fund may decline in response to certain events, including those directly involving the issuers of securities owned by the Fund. Changes arising from the general economy, the overall market and local, regional or global political and/or social instability, as well as currency, interest rate and price fluctuations, may also affect the securities’ value.
Counterparty Credit Risk: Similar to issuer credit risk, the Fund may be exposed to counterparty credit risk, or the risk that an entity may fail to or be unable to perform on its commitments related to unsettled or open transactions. The Fund manages counterparty credit risk by entering into transactions only with counterparties that the Manager believes have the financial resources to honor their obligations and by monitoring the financial stability of those counterparties. Financial assets, which potentially expose the Fund to market, issuer and counterparty credit risks, consist principally of financial instruments and receivables due from counterparties. The extent of the Fund’s exposure to market, issuer and counterparty credit risks with respect to these financial assets is approximately their value recorded in the Statement of Assets and Liabilities, less any collateral held by the Fund.
Concentration Risk: The Fund invests a substantial amount of its assets in issuers located in a single country or a limited number of countries. When the Fund concentrates its investments in this manner, it assumes the risk that economic, political and social conditions in those countries may have a significant impact on their investment performance. Foreign issuers may not be subject to the same uniform accounting, auditing and financial reporting standards and practices as used in the United States. Foreign securities markets may also be less liquid, more volatile and less subject to governmental supervision not typically associated with investing in U.S. securities. Investment percentages in specific countries are presented in the Schedule of Investments.
The Fund invests a significant portion of its assets in securities of issuers located in Europe or with significant exposure to European issuers or countries. The European financial markets have recently experienced volatility and adverse trends due to concerns about economic downturns in, or rising government debt levels of, several European countries. These events may spread to other countries in Europe and may affect the value and liquidity of certain of the Fund’s investments.
10. Capital Share Transactions:
Transactions in capital shares for each class were as follows:
| | | | | | | | | | | | | | | | | | |
| | | Six Months Ended
April 30, 2016 | | | | | Year Ended
October 31, 2015 | |
| | | Shares | | | Amount | | | | | Shares | | | Amount | |
| Institutional | | | | | | | | | | | | | | | | | | |
Shares sold | | | 348,596 | | | $ | 3,985,215 | | | | | | 966,583 | | | $ | 12,774,861 | |
Shares issued in reinvestment of distributions | | | 347,662 | | | | 3,977,270 | | | | | | 777,434 | | | | 9,725,634 | |
Shares redeemed | | | (1,393,690 | ) | | | (15,506,767 | ) | | | | | (1,521,819 | ) | | | (20,079,384 | ) |
| | | | | | | | | | |
Net increase (decrease) | | | (697,432 | ) | | $ | (7,544,282 | ) | | | | | 222,198 | | | $ | 2,421,111 | |
| | | | | | | | | | |
| | | | | | |
| | | | | | | |
| 26 | | BLACKROCK LONG-HORIZON EQUITY FUND | | APRIL 30, 2016 | | |
| | | | |
| Notes to Financial Statements (concluded) | | |
| | | | | | | | | | | | | | | | | | |
| | | Six Months Ended
April 30, 2016 | | | | | Year Ended
October 31, 2015 | |
| | | Shares | | | Amount | | | | | Shares | | | Amount | |
| Investor A | | | | | | | | | | | | | | | | | | |
Shares sold | | | 377,469 | | | $ | 4,353,237 | | | | | | 369,311 | | | $ | 4,946,700 | |
Shares issued in reinvestment of distributions | | | 1,444,390 | | | | 16,524,021 | | | | | | 3,416,548 | | | | 42,705,577 | |
Shares redeemed | | | (2,335,124 | ) | | | (26,459,685 | ) | | | | | (4,076,460 | ) | | | (54,409,932 | ) |
| | | | | | | | | | |
Net decrease | | | (513,265 | ) | | $ | (5,582,427 | ) | | | | | (290,601 | ) | | $ | (6,757,655 | ) |
| | | | | | | | | | |
| | | | | | | | | | | | | | | | | | |
| Investor B | | | | | | | | | | | | | | | | | | |
Shares sold | | | — | | | | — | | | | | | 506 | | | $ | 6,374 | |
Shares issued in reinvestment of distributions | | | 3,673 | | | $ | 43,085 | | | | | | 20,511 | | | | 263,160 | |
Shares redeemed | | | (32,144 | ) | | | (374,084 | ) | | | | | (107,664 | ) | | | (1,476,253 | ) |
| | | | | | | | | | |
Net decrease | | | (28,471 | ) | | $ | (330,999 | ) | | | | | (86,647 | ) | | $ | (1,206,719 | ) |
| | | | | | | | | | |
| | | | | | | | | | | | | | | | | | |
| Investor C | | | | | | | | | | | | | | | | | | |
Shares sold | | | 156,785 | | | $ | 1,794,113 | | | | | | 157,913 | | | $ | 2,107,563 | |
Shares issued in reinvestment of distributions | | | 485,924 | | | | 5,554,164 | | | | | | 1,235,110 | | | | 15,438,628 | |
Shares redeemed | | | (1,102,390 | ) | | | (12,397,141 | ) | | | | | (1,586,503 | ) | | | (20,870,761 | ) |
| | | | | | | | | | |
Net decrease | | | (459,681 | ) | | $ | (5,048,864 | ) | | | | | (193,480 | ) | | $ | (3,324,570 | ) |
| | | | | | | | | | |
| | | | | | | | | | | | | | | | | | |
| Class R | | | | | | | | | | | | | | | | | | |
Shares sold | | | 72,492 | | | $ | 828,304 | | | | | | 75,820 | | | $ | 1,014,930 | |
Shares issued in reinvestment of distributions | | | 21,929 | | | | 251,744 | | | | | | 40,140 | | | | 503,761 | |
Shares redeemed | | | (48,988 | ) | | | (561,768 | ) | | | | | (70,897 | ) | | | (993,960 | ) |
| | | | | | | | | | |
Net increase | | | 45,433 | | | $ | 518,280 | | | | | | 45,063 | | | $ | 524,731 | |
| | | | | | | | | | |
Total Net Decrease | | | (1,653,416 | ) | | $ | (17,988,292 | ) | | | | | (303,467 | ) | | $ | (8,343,102 | ) |
| | | | | | | | | | |
11. Subsequent Events:
Management has evaluated the impact of all subsequent events on the Fund through the date the financial statements were issued and has determined that there were no subsequent events requiring adjustment or additional disclosure in the financial statements.
| | | | | | |
| | | | | | | |
| | BLACKROCK LONG-HORIZON EQUITY FUND | | APRIL 30, 2016 | | 27 |
Robert M. Hernandez, Chair of the Board and Trustee
Fred G. Weiss, Vice Chair of the Board and Trustee
James H. Bodurtha, Trustee
Bruce R. Bond, Trustee
Valerie G. Brown, Trustee
Donald W. Burton, Trustee
Honorable Stuart E. Eizenstat, Trustee
Robert Fairbairn, Trustee
Kenneth A. Froot, Trustee
Henry Gabbay, Trustee
John F. O’Brien, Trustee
Donald C. Opatrny, Trustee
Roberta Cooper Ramo, Trustee
David H. Walsh, Trustee
John M. Perlowski, Trustee, President and Chief Executive Officer
Jennifer McGovern, Vice President
Neal J. Andrews, Chief Financial Officer
Jay M. Fife, Treasurer
Charles Park, Chief Compliance Officer
Fernanda Piedra, Anti-Money Laundering Compliance Officer
Benjamin Archibald, Secretary
Effective May 6, 2016, Valerie G. Brown resigned as a Trustee of the Fund.
Effective May 10, 2016, Kenneth A. Froot resigned as a Trustee of the Fund.
On June 2, 2016, the Board appointed Henry R. Keizer as a Trustee of the Fund, effective July 28, 2016.
| | | | | | | | |
| | | | | |
Investment Advisor BlackRock Advisors, LLC Wilmington, DE 19809 | | Custodian Brown Brothers Harriman & Co. Boston, MA 02109 | | Accounting Agent State Street Bank and Trust Company Boston, MA 02110 | | Independent Registered Public Accounting Firm Deloitte & Touche LLP Boston, MA 02116 | | Address of the Fund 100 Bellevue Parkway Wilmington, DE 19809 |
| | | | |
Sub-Advisor BlackRock International Limited Edinburgh, EH3 8BL United Kingdom | | Transfer Agent BNY Mellon Investment Servicing (US) Inc. Wilmington, DE 19809 | | Distributor BlackRock Investments, LLC New York, NY 10022 | | Legal Counsel Willkie Farr & Gallagher LLP New York, NY 10019 | | |
| | | | | | |
| | | | | | | |
| 28 | | BLACKROCK LONG-HORIZON EQUITY FUND | | APRIL 30, 2016 | | |
Householding
The Fund will mail only one copy of shareholder documents, including prospectuses, annual and semi-annual reports and proxy statements, to shareholders with multiple accounts at the same address. This practice is commonly called “householding” and is intended to reduce expenses and eliminate duplicate mailings of shareholder documents. Mailings of your shareholder documents may be householded indefinitely unless you instruct us otherwise. If you do not want the mailing of these documents to be combined with those for other members of your household, please call the Fund at (800) 441-7762.
Availability of Quarterly Schedule of Investments
The Fund files its complete schedule of portfolio holdings with the SEC for the first and third quarters of each fiscal year on Form N-Q. The Fund’s Forms N-Q are available on the SEC’s website at http://www.sec.gov and may also be reviewed and copied at the SEC’s Public Reference Room in Washington, D.C. Information on how to access documents on the SEC’s website without charge may be obtained by calling (800) SEC-0330. The Fund’s Forms N-Q may also be obtained upon request and without charge by calling (800) 441-7762.
Availability of Proxy Voting Policies and Procedures
A description of the policies and procedures that the Fund uses to determine how to vote proxies relating to portfolio securities is available upon request and without charge (1) by calling (800) 441-7762; (2) at http://www.blackrock.com; and (3) on the SEC’s website at http://www.sec.gov.
Availability of Proxy Voting Record
Information about how the Fund voted proxies relating to securities held in the Fund’s portfolio during the most recent 12-month period ended June 30 is available upon request and without charge (1) at http://www.blackrock.com; or by calling (800) 441-7762; and (2) on the SEC’s website at http://www.sec.gov.
BlackRock’s Mutual Fund Family
BlackRock offers a diverse lineup of open-end mutual funds crossing all investment styles and managed by experts in equity, fixed income and tax-exempt investing. Visit http://www.blackrock.com for more information.
Account Information
Call us at (800) 441-7762 from 8:00 AM to 6:00 PM EST on any business day to get information about your account balances, recent transactions and share prices. You can also reach us on the Web at http://www.blackrock.com/funds.
Automatic Investment Plans
Investor Class shareholders who want to invest regularly can arrange to have $50 or more automatically deducted from their checking or savings account and invested in any of the BlackRock funds.
Systematic Withdrawal Plans
Investor Class shareholders can establish a systematic withdrawal plan and receive periodic payments of $50 or more from their BlackRock funds, as long as their account balance is at least $10,000.
Retirement Plans
Shareholders may make investments in conjunction with Traditional, Rollover, Roth, Coverdell, Simple IRAs, SEP IRAs and 403(b) Plans.
| | | | | | |
| | | | | | | |
| | BLACKROCK LONG-HORIZON EQUITY FUND | | APRIL 30, 2016 | | 29 |
| | | | |
| Additional Information (concluded) | | |
| | |
| BlackRock Privacy Principles | | |
BlackRock is committed to maintaining the privacy of its current and former fund investors and individual clients (collectively, “Clients”) and to safeguarding their non-public personal information. The following information is provided to help you understand what personal information BlackRock collects, how we protect that information and why in certain cases we share such information with select parties.
If you are located in a jurisdiction where specific laws, rules or regulations require BlackRock to provide you with additional or different privacy-related rights beyond what is set forth below, then BlackRock will comply with those specific laws, rules or regulations.
BlackRock obtains or verifies personal non-public information from and about you from different sources, including the following: (i) information we receive from you or, if applicable, your financial intermediary, on applications, forms or other documents; (ii) information about your transactions with us, our affiliates, or others; (iii) information we receive from a consumer reporting agency; and (iv) from visits to our websites.
BlackRock does not sell or disclose to non-affiliated third parties any non-public personal information about its Clients, except as permitted by law or as is necessary to respond to regulatory requests or to service Client accounts. These non-affiliated third parties are required to protect the confidentiality and security of this information and to use it only for its intended purpose.
We may share information with our affiliates to service your account or to provide you with information about other BlackRock products or services that may be of interest to you. In addition, BlackRock restricts access to non-public personal information about its Clients to those BlackRock employees with a legitimate business need for the information. BlackRock maintains physical, electronic and procedural safeguards that are designed to protect the non-public personal information of its Clients, including procedures relating to the proper storage and disposal of such information.
| | | | | | |
| | | | | | | |
| 30 | | BLACKROCK LONG-HORIZON EQUITY FUND | | APRIL 30, 2016 | | |
This report is intended for current holders. It is not authorized for use as an offer of sale or a solicitation of an offer to buy shares of the Fund unless preceded or accompanied by the Fund’s current prospectus. Past performance results shown in this report should not be considered a representation of future performance. Investment returns and principal value of shares will fluctuate so that shares, when redeemed, may be worth more or less than their original cost. Statements and other information herein are as dated and are subject to change.

| | |
| LHE-4/16-SAR | | |
| |
| |  |
| Item 2 – | Code of Ethics – Not Applicable to this semi-annual report |
| Item 3 – | Audit Committee Financial Expert – Not Applicable to this semi-annual report |
| Item 4 – | Principal Accountant Fees and Services – Not Applicable to this semi-annual report |
| Item 5 – | Audit Committee of Listed Registrants – Not Applicable |
(a) The registrant’s Schedule of Investments is included as part of the Report to Stockholders filed under Item 1 of this Form.
(b) Not Applicable due to no such divestments during the semi-annual period covered since the previous
Form N-CSR filing.
| Item 7 – | Disclosure of Proxy Voting Policies and Procedures for Closed-End Management Investment Companies – Not Applicable |
| Item 8 – | Portfolio Managers of Closed-End Management Investment Companies – Not Applicable |
| Item 9 – | Purchases of Equity Securities by Closed-End Management Investment Company and Affiliated Purchasers – Not Applicable |
| Item 10 – | Submission of Matters to a Vote of Security Holders –There have been no material changes to these procedures. |
| Item 11 – | Controls and Procedures |
(a) – The registrant’s principal executive and principal financial officers, or persons performing similar functions, have concluded that the registrant’s disclosure controls and procedures (as defined in Rule 30a-3(c) under the Investment Company Act of 1940, as amended (the “1940 Act”)) are effective as of a date within 90 days of the filing of this report based on the evaluation of these controls and procedures required by
Rule 30a-3(b) under the 1940 Act and Rule 15d-15(b) under the Securities Exchange Act of 1934, as amended.
(b) – There were no changes in the registrant’s internal control over financial reporting (as defined in
Rule 30a-3(d) under the 1940 Act) that occurred during the second fiscal quarter of the period covered by this report that have materially affected, or are reasonably likely to materially affect, the registrant’s internal control over financial reporting.
| Item 12 – | Exhibits attached hereto |
(a)(1) – Code of Ethics – Not Applicable to this semi-annual report
(a)(2) – Certifications – Attached hereto
(a)(3) – Not Applicable
(b) – Certifications – Attached hereto
2
Pursuant to the requirements of the Securities Exchange Act of 1934 and the Investment Company Act of 1940, the registrant has duly caused this report to be signed on its behalf by the undersigned, thereunto duly authorized.
BlackRock Long-Horizon Equity Fund
| | | | | | |
| By: | | /s/ John M. Perlowski | | | | |
| | John M. Perlowski | | | | |
| | Chief Executive Officer (principal executive officer) of | | |
| | BlackRock Long-Horizon Equity Fund | | |
Date: July 1, 2016
Pursuant to the requirements of the Securities Exchange Act of 1934 and the Investment Company Act of 1940, this report has been signed below by the following persons on behalf of the registrant and in the capacities and on the dates indicated.
| | | | | | |
| By: | | /s/ John M. Perlowski | | | | |
| | John M. Perlowski | | | | |
| | Chief Executive Officer (principal executive officer) of BlackRock Long-Horizon Equity Fund | | |
Date: July 1, 2016
| | | | | | |
| By: | | /s/ Neal J. Andrews | | | | |
| | Neal J. Andrews | | | | |
| | Chief Financial Officer (principal financial officer) of | | |
| | BlackRock Long-Horizon Equity Fund | | |
Date: July 1, 2016
3