UNITED STATES
SECURITIES AND EXCHANGE COMMISSION
Washington, D.C. 20549
FORM N-CSR
CERTIFIED SHAREHOLDER REPORT OF REGISTERED MANAGEMENT
INVESTMENT COMPANIES
Investment Company Act file number: 811-21759
| Name of Fund: | | BlackRock Unconstrained Equity Fund (Formerly BlackRock Long-Horizon Equity Fund) |
| Fund Address: | | 100 Bellevue Parkway, Wilmington, DE 19809 |
Name and address of agent for service: John M. Perlowski, Chief Executive Officer, BlackRock Unconstrained Equity Fund, 55 East 52nd Street, New York, NY 10055
Registrant’s telephone number, including area code: (800) 441-7762
Date of fiscal year end: 04/30/2022
Date of reporting period: 04/30/2022
Item 1 – Report to Stockholders
(a) The Report to Shareholders is attached herewith.
| | |

| | APRIL 30, 2022 |
BlackRock Emerging Markets Fund, Inc.
BlackRock Latin America Fund, Inc.
BlackRock Unconstrained Equity Fund
BlackRock Funds VII, Inc.
| · | | BlackRock Sustainable Emerging Markets Equity Fund |
|
| Not FDIC Insured • May Lose Value • No Bank Guarantee |
The Markets in Review
Dear Shareholder,
The 12-month reporting period as of April 30, 2022 saw the emergence of significant challenges that disrupted the economic recovery and strong financial markets which characterized 2021. The U.S. economy shrank in the first quarter of 2022, ending the run of robust growth which followed reopening and the development of the COVID-19 vaccines. Rapid changes in consumer spending led to supply constraints and elevated inflation, which reached a 40-year high. Moreover, while the foremost effect of Russia’s invasion of Ukraine has been a severe humanitarian crisis, the invasion has presented challenges for both investors and policymakers.
Equity prices were mixed but mostly down, as persistently high inflation drove investors’ expectations for higher interest rates, particularly weighing on relatively high valuation growth stocks and economically sensitive small-capitalization stocks. Overall, small-capitalization U.S. stocks declined, while large-capitalization U.S. stocks were nearly flat. Both emerging market stocks and international equities from developed markets fell significantly, pressured by rising interest rates and a strengthening U.S. dollar.
The 10-year U.S. Treasury yield (which is inversely related to bond prices) rose during the reporting period as increasing inflation drove investors’ expectations for higher interest rates. The corporate bond market also faced inflationary headwinds, and increasing uncertainty led to higher corporate bond spreads (the difference in yield between U.S. Treasuries and similarly-dated corporate bonds).
The U.S. Federal Reserve (the “Fed”), acknowledging that inflation is growing faster than expected, raised interest rates in March 2022, the first increase of this business cycle. Furthermore, the Fed wound down its bond-buying programs and raised the prospect of reversing the flow and reducing its balance sheet. Continued high inflation and the Fed’s new tone led many analysts to anticipate that the Fed will continue to raise interest rates multiple times throughout the year.
Looking ahead, however, the horrific war in Ukraine has significantly clouded the outlook for the global economy, leading to major volatility in energy and metal markets. Sanctions on Russia, Europe’s top energy supplier, and general wartime disruption are likely to drive already-high commodity prices even higher. We believe sharp increases in energy prices will exacerbate inflationary pressure while also constraining economic growth. Combating inflation without stifling a recovery, while buffering against ongoing supply and price shocks amid the ebb and flow of the pandemic, will be an especially challenging environment for setting effective monetary policy. Despite the likelihood of more rate increases on the horizon, we believe the Fed will err on the side of protecting employment, even at the expense of higher inflation.
In this environment, we favor an overweight to equities, as valuations have become more attractive and inflation-adjusted interest rates remain low. Sectors that are better poised to manage the transition to a lower-carbon world, such as technology and healthcare, are particularly attractive in the long term. We favor U.S. equities due to strong earnings momentum, while Japanese equities should benefit from supportive monetary and fiscal policy. We are underweight credit overall, but inflation-protected U.S. Treasuries, Asian fixed income, and emerging market local-currency bonds offer potential opportunities for additional yield. We believe that international diversification and a focus on sustainability and quality can help provide portfolio resilience.
Overall, our view is that investors need to think globally, extend their scope across a broad array of asset classes, and be nimble as market conditions change. We encourage you to talk with your financial advisor and visit blackrock.com for further insight about investing in today’s markets.
Sincerely,

Rob Kapito
President, BlackRock Advisors, LLC

Rob Kapito
President, BlackRock Advisors, LLC
| | | | |
Total Returns as of April 30, 2022 |
| | | 6-Month | | 12-Month |
| | |
U.S. large cap equities
(S&P 500® Index) | | (9.65)% | | 0.21% |
| | |
U.S. small cap equities
(Russell 2000® Index) | | (18.38) | | (16.87) |
| | |
International equities
(MSCI Europe, Australasia, Far East Index) | | (11.80) | | (8.15) |
| | |
Emerging market equities
(MSCI Emerging Markets Index) | | (14.15) | | (18.33) |
| | |
3-month Treasury bills
(ICE BofA 3-Month U.S. Treasury Bill Index) | | 0.07 | | 0.08 |
| | |
U.S. Treasury securities
(ICE BofA 10-Year U.S. Treasury Index) | | (10.29) | | (8.86) |
| | |
U.S. investment grade bonds
(Bloomberg U.S. Aggregate Bond Index) | | (9.47) | | (8.51) |
| | |
Tax-exempt municipal bonds
(Bloomberg Municipal Bond Index) | | (7.90) | | (7.88) |
| | |
U.S. high yield bonds
(Bloomberg U.S. Corporate
High Yield 2% Issuer Capped Index) | | (7.40) | | (5.22) |
|
| Past performance is not an indication of future results. Index performance is shown for illustrative purposes only. You cannot invest directly in an index. |
| | |
| 2 | | THIS PAGE IS NOT PART OF YOUR FUND REPORT |
Table of Contents

| | |
| Fund Summary as of April 30, 2022 | | BlackRock Emerging Markets Fund, Inc. |
Investment Objective
BlackRock Emerging Markets Fund, Inc.’s (the “Fund”) investment objective is to seek long-term capital appreciation by investing in securities, principally equity securities, of issuers in countries having smaller capital markets.
Portfolio Management Commentary
How did the Fund perform?
For the 12-month period ended April 30, 2022, the Fund underperformed the benchmark, the MSCI Emerging Markets Index.
What factors influenced performance?
Stock selection in Russia and India weighed most heavily on the Fund’s performance relative to the benchmark. Holdings in Russia included Lukoil Oil Company, online financial services provider TCS Group Holding PLC, oil and gas company Surgutneftegaz, state-controlled bank Sberbank and discount variety retail chain Fix Price Group PLC, all of which were leading detractors over the period as stock prices dropped drastically in late February 2022 on the back of the Russian invasion of Ukraine. These positions were marked down to nominal valuations in early March 2022, resulting in further losses.
Positive contributions to performance were primarily driven by the overweight allocation to Indonesia, while the overweight allocation to Peru added to relative return as well. On an individual stock level, an underweight position in Chinese e-commerce firm Alibaba highlighted contributions as the company came under regulatory pressure. An out-of-benchmark position in Chinese chemical manufacturing company Albemarle Corp. also benefited performance given continued exuberance surrounding electronic vehicles and the company’s clear alignment with China’s policy objective of aggressively reducing carbon emissions over the long-term.
The Fund holds MSCI Emerging Markets futures to manage flows for the purposes of efficient portfolio management. The strategy can invest in Contract for Differences (“CFD”), which is a commonly used instrument for market access purposes or operational efficiency. The team has historically also purchased participatory notes (“P-Notes”) to gain exposure to certain domestic equities. The derivative performance mirrors the underlying equity performance and does not materially impact Fund performance. There have been no changes to the types of derivatives used in the past.
Describe recent portfolio activity.
The Fund increased its overall allocation to China over the period. At the same time, the Fund reduced China internet exposure, most notably trimming its position in real estate platform Beke on weaker-than-expected property activity, ecommerce company JD.com on deteriorating core business profitability, and on-demand food delivery provider Meituan. At the same time, the Fund continued to reduce its underweight to Alibaba given the company’s inexpensive valuation and resilient core business. In addition, exposure to both energy and materials was shifted from overweight to neutral. The reduction in energy exposure was largely driven by the decline in value of holdings in Russia. The Fund’s position in Chinese energy company ENN was reduced on concerns around higher natural gas prices. Finally, the Fund trimmed its position in miner China Molybdenum Co, Ltd. due to an ongoing dispute with the Democratic Republic of the Congo government over royalties.
The Fund’s cash position averaged approximately 6.5% over the 12-month period. The cash position did not have a material impact on performance.
Describe portfolio positioning at period end.
Relative to the MSCI Emerging Markets Index, the Fund ended the period overweight in Mexico and Indonesia, while being underweight in Korea and Taiwan. In sector terms, the Fund was overweight in industrials and consumer staples, and underweight in consumer discretionary and information technology.
The views expressed reflect the opinions of BlackRock as of the date of this report and are subject to change based on changes in market, economic or other conditions. These views are not intended to be a forecast of future events and are no guarantee of future results.
| | |
| 4 | | 2 0 2 2 BLACK ROCK ANNUAL REPORT TO SHAREHOLDERS |
| | |
| Fund Summary as of April 30, 2022 (continued) | | BlackRock Emerging Markets Fund, Inc. |
TOTAL RETURN BASED ON A $10,000 INVESTMENT
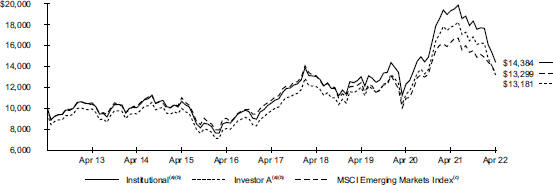
| | (a) | Assuming maximum sales charges, if any, transaction costs and other operating expenses, including investment advisory fees. Institutional Shares do not have a sales charge. |
| | (b) | Under normal conditions, the Fund invests at least 80% of its net assets plus any borrowings for investment purposes in equity securities of issuers located in countries with developing capital markets. |
| | (c) | An index that captures large- and mid-cap representation across Emerging Markets countries. The index covers approximately 85% of the free float-adjusted market capitalization in each country. |
Performance
| | | | | | | | | | | | | | | | | | | | | | | | |
| | | Average Annual Total Returns(a) | |
| | | 1 Year | | | 5 Years | | | 10 Years | |
| | | Without
Sales
Charge | | | With
Sales
Charge | | | Without
Sales
Charge | | | With
Sales
Charge | | | Without
Sales
Charge | | | With
Sales
Charge | |
Institutional | | | (25.52 | )% | | | N/A | | | | 6.49 | % | | | N/A | | | | 3.70 | % | | | N/A | |
Investor A | | | (25.74 | ) | | | (29.63 | )% | | | 6.20 | | | | 5.06 | % | | | 3.36 | | | | 2.80 | % |
Investor C | | | (26.29 | ) | | | (26.99 | ) | | | 5.40 | | | | 5.40 | | | | 2.68 | | | | 2.68 | |
Class K | | | (25.50 | ) | | | N/A | | | | 6.53 | | | | N/A | | | | 3.73 | | | | N/A | |
MSCI Emerging Markets Index | | | (18.33 | ) | | | N/A | | | | 4.32 | | | | N/A | | | | 2.89 | | | | N/A | |
| | (a) | Assuming maximum sales charges, if any. Average annual total returns with and without sales charges reflect reductions for distribution and service fees. See “About Fund Performance” for a detailed description of share classes, including any related sales charges and fees, and how performance was calculated for certain share classes. |
N/A — Not applicable as the share class and index do not have a sales charge.
Past performance is not an indication of future results.
Performance results may include adjustments made for financial reporting purposes in accordance with U.S. generally accepted accounting principles.
Expense Example
| | | | | | | | | | | | | | | | | | | | | | | | | | | | |
| | | Actual | | | Hypothetical 5% Return | | | | |
| | |
| Beginning
Account Value
(11/01/21) |
| |
| Ending
Account Value
(04/30/22) |
| |
| Expenses
Paid During
the Period |
(a) | |
| Beginning
Account Value
(11/01/21) |
| |
| Ending
Account Value
(04/30/22) |
| |
| Expenses
Paid During
the Period |
(a) | |
| Annualized
Expense
Ratio |
|
Institutional | | $ | 1,000.00 | | | $ | 785.00 | | | $ | 3.81 | | | $ | 1,000.00 | | | $ | 1,020.53 | | | $ | 4.31 | | | | 0.86 | % |
Investor A | | | 1,000.00 | | | | 783.90 | | | | 4.91 | | | | 1,000.00 | | | | 1,019.29 | | | | 5.56 | | | | 1.11 | |
Investor C | | | 1,000.00 | | | | 781.00 | | | | 8.21 | | | | 1,000.00 | | | | 1,015.57 | | | | 9.30 | | | | 1.86 | |
Class K | | | 1,000.00 | | | | 785.30 | | | | 3.59 | | | | 1,000.00 | | | | 1,020.78 | | | | 4.06 | | | | 0.81 | |
| | (a) | For each class of the Fund, expenses are equal to the annualized expense ratio for the class, multiplied by the average account value over the period, multiplied by 181/365 (to reflect the one-half year period shown). |
See “Disclosure of Expenses” for further information on how expenses were calculated.
| | |
Fund Summary as of April 30, 2022 (continued) | | BlackRock Emerging Markets Fund, Inc. |
Portfolio Information
TEN LARGEST HOLDINGS
| | | | |
Security(a) | | Percent of
Net Assets | |
Taiwan Semiconductor Manufacturing Co. Ltd. | | | 7 | % |
Samsung Electronics Co. Ltd. | | | 4 | |
Kweichow Moutai Co. Ltd., Class A | | | 2 | |
Alibaba Group Holding Ltd. | | | 2 | |
Saudi National Bank | | | 2 | |
China Mengniu Dairy Co. Ltd. | | | 2 | |
HDFC Bank Ltd. | | | 2 | |
Longfor Group Holdings Ltd. | | | 2 | |
Sendas Distribuidora SA | | | 2 | |
Hapvida Participacoes e Investimentos SA | | | 1 | |
GEOGRAPHIC ALLOCATION
| | | | |
Country/Geographic Region | | Percent of
Net Assets | |
China | | | 28 | % |
Taiwan | | | 11 | |
India | | | 9 | |
United States | | | 8 | |
South Korea | | | 7 | |
Brazil | | | 6 | |
Mexico | | | 5 | |
Saudi Arabia | | | 5 | |
Indonesia | | | 4 | |
Thailand | | | 3 | |
South Africa | | | 2 | |
United Arab Emirates | | | 2 | |
United Kingdom | | | 1 | |
Malaysia | | | 1 | |
Poland | | | 1 | |
Kazakhstan | | | 1 | |
Panama | | | 1 | |
Hong Kong | | | 1 | |
Hungary | | | 1 | |
Peru | | | 1 | |
Italy | | | 1 | |
Other# | | | — | (b) |
Other Assets Less Liabilities | | | 1 | |
| (a) | | Excludes short-term securities. |
| (b) | | Rounds to less than 1% of net assets. |
| # | | Includes holdings within countries/geographic regions that are less than 1% of net assets. Please refer to the Schedule of Investments for such countries/geographic regions. |
| | |
| 6 | | 2 0 2 2 BLACK ROCK ANNUAL REPORT TO SHAREHOLDERS |
| | |
| Fund Summary as of April 30, 2022 | | BlackRock Latin America Fund, Inc. |
Investment Objective
BlackRock Latin America Fund, Inc.’s (the “Fund”) investment objective is to seek long-term capital appreciation by investing primarily in Latin American equity and debt securities.
On February 8, 2022, the Board of Directors of the Fund approved a proposal to close the Fund to purchases and thereafter to liquidate the Fund. Accordingly, effective on June 23, 2022, the Fund will no longer accept purchase orders. On or about June 30, 2022 (the “Liquidation Date”), all of the assets of the Fund will be liquidated completely, the shares of any shareholders on the Liquidation Date will be redeemed at the net asset value per share and the Fund will then be terminated.
Portfolio Management Commentary
How did the Fund perform?
For the 12-month period ended April 30, 2022, the Fund underperformed its benchmark, the MSCI Emerging Markets Latin America Index.
What factors influenced performance?
At the country level, stock selection in Brazil detracted the most from relative performance. At the individual stock level, an underweight position in Brazilian retailer Magazine Luiza based on concerns around competition and consumption in Brazil weighed most heavily on relative performance. An overweight in Mexican cement company Cemex also detracted as rising energy costs pressured profitability in the near term.
Stock selection in Peru and the out-of-benchmark allocation to Panama were the largest contributors to relative performance. At the individual stock level, an overweight to Mexican airport operator Grupo Aeroportuario led positive contributions as sentiment with respect to the stock benefited from a recovery in air traffic. An overweight in Bradespar, a Mexican telecommunications company, also benefited performance as the company has been experiencing strong profitability which is allowing for faster deleveraging of its balance sheet.
Describe recent portfolio activity.
Over the period, the Fund increased its position in Brazilian long steel producer Gerdau, on the outlook for robust demand given a long backlog of infrastructure projects in the company’s main markets. The Fund initiated a position in Brazilian meat processing company Marfrig, based on a strong global pricing environment for beef. The Fund reduced exposure to Peruvian financial services holding company Credicorp, taking profits following a period of stock price outperformance. The Fund exited Colombian bank Bancolombia in an effort to reduce Colombian exposure ahead of the presidential election.
Describe portfolio positioning at period end.
The Fund ended the period overweight in Brazil, Argentina and Panama while being underweight in Colombia, Chile, Mexico and Peru. At the sector level, the Fund was overweight in financials and real estate and underweight in consumer staples and communication services.
The views expressed reflect the opinions of BlackRock as of the date of this report and are subject to change based on changes in market, economic or other conditions. These views are not intended to be a forecast of future events and are no guarantee of future results.
TOTAL RETURN BASED ON A $10,000 INVESTMENT
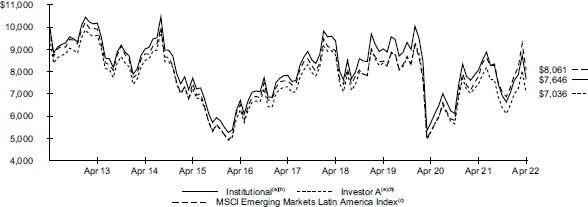
| | (a) | Assuming maximum sales charges, if any, transaction costs and other operating expenses, including investment advisory fees. Institutional Shares do not have a sales charge. | |
| | (b) | Under normal market conditions, the Fund will invest at least 80% of its net assets plus any borrowings for investment purposes in Latin American securities. | |
| | (c) | An index that captures large- and mid-cap representation across Emerging Markets countries in Latin America. The index covers approximately 85% of the free float-adjusted market capitalization in each country. | |
| | |
| Fund Summary as of April 30, 2022 (continued) | | BlackRock Latin America Fund, Inc. |
Performance
| | | | | | | | | | | | | | | | | | | | | | | | | | | | |
| | | | | | Average Annual Total Returns(a) | |
| | | | | | 1 Year | | | 5 Years | | | 10 Years | |
| | | | | | Without
Sales
Charge | | | With
Sales
Charge | | | Without
Sales
Charge | | | With
Sales
Charge | | | Without
Sales
Charge | | | With
Sales
Charge | |
Institutional | | | | | | | (5.28 | )% | | | N/A | | | | (0.45 | )% | | | N/A | | | | (2.65 | )% | | | N/A | |
Investor A | | | | | | | (5.53 | ) | | | (10.48 | )% | | | (0.75 | ) | | | (1.82 | )% | | | (2.93 | ) | | | (3.46 | )% |
Investor C | | | | | | | (6.41 | ) | | | (7.31 | ) | | | (1.62 | ) | | | (1.62 | ) | | | (3.58 | ) | | | (3.58 | ) |
Class K | | | | | | | (5.16 | ) | | | N/A | | | | (0.41 | ) | | | N/A | | | | (2.63 | ) | | | N/A | |
MSCI Emerging Markets Latin America Index | | | | | | | 3.67 | | | | N/A | | | | 1.23 | | | | N/A | | | | (2.13 | ) | | | N/A | |
| | (a) | Assuming maximum sales charges, if any. Average annual total returns with and without sales charges reflect reductions for distribution and service fees. See “About Fund Performance” for a detailed description of share classes, including any related sales charges and fees, and how performance was calculated for certain share classes. |
N/A — Not applicable as the share class and index do not have a sales charge.
Past performance is not an indication of future results.
Performance results may include adjustments made for financial reporting purposes in accordance with U.S. generally accepted accounting principles.
Expense Example
| | | | | | | | | | | | | | | | | | | | | | | | | | | | |
| | | Actual | | | Hypothetical 5% Return | | | | |
| | | Beginning
Account Value | | | Ending
Account Value | | | Expenses
Paid During | | | Beginning
Account Value | | | Ending
Account Value | | | Expenses
Paid During | | | Annualized
Expense | |
| | | | (11/01/21) | | | | (04/30/22) | | | | the Period | (a) | | | (11/01/21) | | | | (04/30/22) | | | | the Period | (a) | | | Ratio | |
Institutional | | $ | 1,000.00 | | | $ | 1,107.70 | | | $ | 8.20 | | | $ | 1,000.00 | | | $ | 1,017.01 | | | $ | 7.85 | | | | 1.57 | % |
Investor A | | | 1,000.00 | | | | 1,106.30 | | | | 9.50 | | | | 1,000.00 | | | | 1,015.77 | | | | 9.10 | | | | 1.82 | |
Investor C | | | 1,000.00 | | | | 1,101.70 | | | | 14.12 | | | | 1,000.00 | | | | 1,011.36 | | | | 13.51 | | | | 2.71 | |
Class K | | | 1,000.00 | | | | 1,108.50 | | | | 7.53 | | | | 1,000.00 | | | | 1,017.65 | | | | 7.20 | | | | 1.44 | |
| | (a) | For each class of the Fund, expenses are equal to the annualized expense ratio for the class, multiplied by the average account value over the period, multiplied by 181/365 (to reflect the one-half year period shown). |
See “Disclosure of Expenses” for further information on how expenses were calculated.
Portfolio Information
TEN LARGEST HOLDINGS
| | | | |
Security(a) | | Percent of
Net Assets | |
Vale SA | | | 9 | % |
Petroleo Brasileiro SA | | | 8 | |
Banco Bradesco SA | | | 6 | |
Itau Unibanco Holding SA | | | 5 | |
Fomento Economico Mexicano SAB de CV | | | 5 | |
B3 SA - Brasil Bolsa Balcao | | | 4 | |
Grupo Financiero Banorte SAB de CV, Class O | | | 3 | |
Gerdau SA, Preference Shares | | | 3 | |
America Movil SAB de CV, Class L | | | 3 | |
Cemex SAB de CV | | | 3 | |
GEOGRAPHIC ALLOCATION
| | | | |
Country/Geographic Region | | Percent of
Net Assets | |
Brazil | | | 65 | % |
Mexico | | | 25 | |
Chile | | | 4 | |
Peru | | | 2 | |
United States | | | 2 | |
Argentina | | | 1 | |
Panama | | | 1 | |
Liabilities in Excess of Other Assets | | | (— | )(b) |
| (a) | Excludes short-term securities. | |
| (b) | Rounds to more than (1)% of net assets. | |
| | |
| 8 | | 2 0 2 2 BLACK ROCK ANNUAL REPORT TO SHAREHOLDERS |
| | |
| Fund Summary as of April 30, 2022 | | BlackRock Unconstrained Equity Fund |
Investment Objective
BlackRock Unconstrained Equity Fund’s (the “Fund”) (formerly known as BlackRock Long-Horizon Equity Fund) investment objective is to seek to achieve long term capital growth.
On February 10, 2021, the Board approved a change in the Fund’s name from BlackRock Long-Horizon Equity Fund to BlackRock Unconstrained Equity Fund and certain changes to the Fund’s investment objective, investment strategy and investment process. Additionally, the Board approved a change of the Fund’s classification from diversified to non-diversified and such change was subsequently approved by shareholders. In addition, the investment adviser has changed the benchmark index against which the Fund compares its performance. These changes were effective on March 1, 2022.
Portfolio Management Commentary
How did the Fund perform?
For the 12-month period ended April 30, 2022, the Fund underperformed its benchmark, the MSCI World Index, as well as its former benchmark, the MSCI All Country World Index.
What factors influenced performance?
The Fund’s lack of exposure to the energy sector weighed on performance relative to the benchmark. Stock selection within the health care and consumer staples sectors also detracted. In terms of individual positions, overweights in insurer Prudential Financial, Inc. and Brazilian information technology services provider Locaweb were the largest detractors from relative performance, along with the failure to hold Apple Inc.
Stock selection within the industrials and consumer discretionary sectors contributed positively to relative performance, as did an overweight allocation to financials. At the individual stock level, overweight positions in software company Cadence Design Systems Inc., payment services card provider American Express Company and insurer UnitedHealth Group Inc. were the largest contributors to relative performance.
Describe recent portfolio activity.
Effective March 1, 2022, the BlackRock Long-Horizon Equity Fund transitioned to the BlackRock Unconstrained Equity Fund. Portfolio changes were made as a result, reflecting the revised investment mandate.
Describe portfolio positioning at period end.
Positioning is based on bottom-up fundamental insights to try to identify those rare businesses with high returns that will not revert to mean. Around 60% of the Fund is invested in businesses with resilient earnings and cash flows, including a payments company, a highly established enterprise software business and select health care names with strong track records of execution. Within the consumer space, the Fund has positions in luxury goods names with powerful brands that allow for pricing power, while also owning select industrial cyclical businesses with proven, market-leading solutions. The Fund owns no stocks in the energy, utilities, materials or real estate sectors as these do not meet the investment adviser’s current criteria for investment.
The views expressed reflect the opinions of BlackRock as of the date of this report and are subject to change based on changes in market, economic or other conditions. These views are not intended to be a forecast of future events and are no guarantee of future results.
TOTAL RETURN BASED ON A $10,000 INVESTMENT
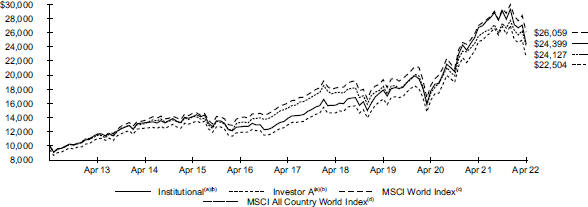
| | (a) | Assuming maximum sales charges, if any, transaction costs and other operating expenses, including advisory fees. Institutional Shares do not have a sales charge. | |
| | (b) | The Fund will, under normal circumstances, invest at least 80% of its net assets (plus any borrowings for investment purposes) in equity securities. The Fund’s returns prior to October 15, 2012 are the returns of the Fund when it followed different investment strategies under the name BlackRock Global Dynamic Equity Fund. The Fund’s total returns for the period between October 15, 2012 and February 28, 2022 are the returns of the Fund when it followed a different investment objective and different investment strategies and investment process under the name BlackRock Long-Horizon Equity Fund. | |
| | (c) | A broad global equity index that captures large- and mid-cap representation across certain developed markets countries. | |
| | (d) | An index that captures large- and mid-cap representation across certain developed and emerging markets. | |
| | |
| Fund Summary as of April 30, 2022 (continued) | | BlackRock Unconstrained Equity Fund |
Performance
| | | | | | | | | | | | | | | | | | | | | | | | | | | | |
| | | | | | Average Annual Total Returns(a)(b) | |
| | | | | | 1 Year | | | 5 Years | | | 10 Years | |
| | | | | | Without
Sales
Charge | | | With
Sales
Charge | | | Without
Sales
Charge | | | With
Sales
Charge | | | Without
Sales
Charge | | | With
Sales
Charge | |
| | | | | | | |
Institutional | | | | | | | (8.74 | )% | | | N/A | | | | 11.91 | % | | | N/A | | | | 9.33 | % | | | N/A | |
Investor A | | | | | | | (9.04 | ) | | | (13.81 | )% | | | 11.62 | | | | 10.42 | % | | | 9.04 | | | | 8.45 | % |
Investor C | | | | | | | (9.75 | ) | | | (10.49 | ) | | | 10.71 | | | | 10.71 | | | | 8.37 | | | | 8.37 | |
Class R | | | | | | | (9.42 | ) | | | N/A | | | | 11.18 | | | | N/A | | | | 8.59 | | | | N/A | |
| | | | | | | |
MSCI World Index | | | | | | | (3.52 | ) | | | N/A | | | | 10.17 | | | | N/A | | | | 10.05 | | | | N/A | |
MSCI All Country World Index | | | | | | | (5.44 | ) | | | N/A | | | | 9.46 | | | | N/A | | | | 9.21 | | | | N/A | |
| | (a) | Assuming maximum sales charges, if any. Average annual total returns with and without sales charges reflect reductions for distribution and service fees. See “About Fund Performance” for a detailed description of share classes, including any related sales charges and fees. |
| | (b) | The Fund will, under normal circumstances, invest at least 80% of its net assets (plus any borrowings for investment purposes) in equity securities. The Fund’s returns prior to October 15, 2012 are the returns of the Fund when it followed different investment strategies under the name BlackRock Global Dynamic Equity Fund. The Fund’s total returns for the period between October 15, 2012 and February 28, 2022 are the returns of the Fund when it followed a different investment objective and different investment strategies and investment process under the name BlackRock Long-Horizon Equity Fund. |
N/A — Not applicable as the share class and index do not have a sales charge.
Past performance is not an indication of future results.
Performance results may include adjustments made for financial reporting purposes in accordance with U.S. generally accepted accounting principles.
Expense Example
| | | | | | | | | | | | | | | | | | | | | | | | | | | | |
| | | Actual | | | Hypothetical 5% Return | | | | |
| | | Beginning
Account Value | | | Ending
Account Value | | | Expenses
Paid During | | | Beginning
Account Value | | | Ending
Account Value | | | Expenses
Paid During | | | Annualized
Expense | |
| | | | (11/01/21) | | | | (04/30/22) | | | | the Period | (a) | | | (11/01/21) | | | | (04/30/22) | | | | the Period | (a) | | | Ratio | |
Institutional | | $ | 1,000.00 | | | $ | 839.50 | | | $ | 4.29 | | | $ | 1,000.00 | | | $ | 1,020.13 | | | $ | 4.71 | | | | 0.94 | % |
Investor A | | | 1,000.00 | | | | 837.90 | | | | 5.38 | | | | 1,000.00 | | | | 1,018.94 | | | | 5.91 | | | | 1.18 | |
Investor C | | | 1,000.00 | | | | 835.20 | | | | 9.19 | | | | 1,000.00 | | | | 1,014.78 | | | | 10.09 | | | | 2.02 | |
Class R | | | 1,000.00 | | | | 836.20 | | | | 7.38 | | | | 1,000.00 | | | | 1,016.76 | | | | 8.10 | | | | 1.62 | |
| | (a) | For each class of the Fund, expenses are equal to the annualized expense ratio for the class, multiplied by the average account value over the period, multiplied by 181/365 (to reflect the one-half year period shown). |
See “Disclosure of Expenses” for further information on how expenses were calculated.
Portfolio Information
TEN LARGEST HOLDINGS
| | | | |
Security(a) | | Percent of
Net Assets | |
Mastercard, Inc., Class A | | | 10 | % |
LVMH Moet Hennessy Louis Vuitton SE | | | 8 | |
ASML Holding NV | | | 8 | |
Microsoft Corp. | | | 7 | |
Alphabet, Inc., Class C | | | 6 | |
Cadence Design Systems, Inc. | | | 5 | |
S&P Global, Inc. | | | 5 | |
Costco Wholesale Corp. | | | 5 | |
Verisk Analytics, Inc. | | | 4 | |
Lonza Group AG, Registered Shares | | | 4 | |
GEOGRAPHIC ALLOCATION
| | | | |
Country/Geographic Region | | Percent of
Net Assets | |
United States | | | 68 | % |
France | | | 8 | |
Netherlands | | | 8 | |
United Kingdom | | | 5 | |
Switzerland | | | 4 | |
Denmark | | | 4 | |
Italy | | | 3 | |
Other# | | | — | (b) |
Liabilities in Excess of Other Assets | | | (— | )(c) |
| (a) | | Excludes short-term securities. |
| (b) | | Rounds to less than 1% of net assets. |
| (c) | | Rounds to more than (1)% of net assets. |
| # | | Includes holdings within countries/geographic regions that are less than 1% of net assets. Please refer to the Schedule of Investments for such countries/geographic regions. |
| | |
| 10 | | 2 0 2 2 BLACK ROCK ANNUAL REPORT TO SHAREHOLDERS |
| | |
| Fund Summary as of April 30, 2022 | | BlackRock Sustainable Emerging Markets Equity Fund |
Investment Objective
BlackRock Sustainable Emerging Markets Equity Fund’s (formerly known as BlackRock Asian Dragon Fund, Inc.) (the “Fund”) investment objective is to seek to maximize total return.
On July 27, 2021, the Board of Directors (the “Board”) of BlackRock Asian Dragon Fund, Inc. (the “Corporation”) approved certain changes relating to the Corporation. In particular, the Board approved (i) the redesignation of the share classes of the Corporation to a new series of the Corporation named BlackRock Asian Dragon Fund and (ii) a change in the name of the Corporation to “BlackRock Funds VII, Inc.” These changes were effective on July 30, 2021.
Additionally, the Board approved a change in the name of the Fund from BlackRock Asian Dragon Fund to BlackRock Sustainable Emerging Markets Equity Fund and certain changes to the Fund’s investment objective, investment strategy and investment process. In addition, the investment adviser has changed the benchmark index against which the Fund compares its performance. These changes were effective on November 2, 2021.
Portfolio Management Commentary
How did the Fund perform?
For the 12-month period ended April 30, 2022, the Fund underperformed its benchmark the MSCI Emerging Markets Index, as well as its former benchmark, the MSCI AC Asia ex Japan Index.
What factors influenced performance?
Stock selections in Taiwan and Brazil were the largest detractors from return relative to the benchmark. At the individual stock level, holdings in Russia detracted the most from performance. Russian holdings included online financial services provider TCS Group Holding PLC and state-controlled bank Sberbank, both of which were leading detractors as the stock prices dropped drastically in late February 2022 on the back of the Russian invasion of Ukraine. These holdings proceeded to be marked down to nominal valuations in early March 2022, resulting in further losses. Wuxi Biologics, a Chinese pharmaceutical contract development and manufacturing company, also detracted from performance over the period, after it was announced the stock had been added to the United States Unverified List.
Positive contributions to performance were led by the overweight allocation to Indonesia, while security selection in Korea added to relative return as well. On an individual stock level, out-of-benchmark exposure to Indian property developer Godrej Properties contributed the most to performance as the Indian property cycle turned upward after an eight-year slump. Mortgage rates are at an all-time low in India and inventory is slowly diminishing, while the bigger property players are beneficiaries of consolidation in the property market in an upturn. A lack of exposure to Gazprom, the Russian gas giant, was also a positive contributor after the stock fell as sanctions led to the removal of Russian equities from the benchmark.
Describe recent portfolio activity.
Over the period the Fund increased exposure to China. At the same time, the Fund reduced China internet exposure, most notably trimming its position in ecommerce company JD.com based on deteriorating core business profitability, as well as its holdings of on-demand food delivery service Meituan. That said, the Fund continued to reduce its underweight to Alibaba given the company’s inexpensive valuation and resilient core business. In addition, exposure to both energy and materials was shifted from overweight to neutral. The reduction in energy exposure was largely driven by the decline in value of holdings in Russia. The Fund’s position in Chinese energy company ENN was reduced on concerns around higher natural gas prices. Finally, the Fund trimmed its position in the mining company China Molybdenum Co, Ltd. due to an ongoing dispute with the Democratic Republic of the Congo government over royalties.
The Fund’s cash position was approximately 5.5% at the end of the period. The Fund’s cash position did not have a material impact on performance over the 12 months.
Describe portfolio positioning at period end.
Relative to the MSCI Emerging Market Index benchmark, the Fund ended the period overweight in Mexico and the United Arab Emirates, while being underweight in China and India. In sector terms, the Fund was overweight in financials and information technology, and underweight in materials and communication services.
The views expressed reflect the opinions of BlackRock as of the date of this report and are subject to change based on changes in market, economic or other conditions. These views are not intended to be a forecast of future events and are no guarantee of future results.
| | |
| Fund Summary as of April 30, 2022 (continued) | | BlackRock Sustainable Emerging Markets Equity Fund |
TOTAL RETURN BASED ON A $10,000 INVESTMENT
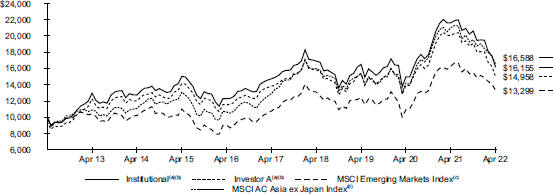
| | (a) | Assuming maximum sales charges, if any, transaction costs and other operating expenses, including investment advisory fees. Institutional Shares do not have a sales charge. |
| | (b) | Under normal circumstances, the Fund invests at least 80% of its net assets, plus the amount of any borrowings for investment purposes, in equity securities of companies located, or exercising the predominant part of their economic activity, in Asia, excluding Japan. The Fund’s total returns prior to October 31, 2017 are the returns of the Fund when it followed a different investment objective and different investment strategies under the name BlackRock Pacific Fund, Inc. The Fund’s total returns for the period between October 31, 2017 and November 1, 2021 are the returns of the Fund when it followed a different investment objective and different investment strategies and investment process under the name BlackRock Asian Dragon Fund, Inc. |
| | (c) | An index that captures large- and mid-cap representation across Emerging Markets countries. The index covers approximately 85% of the free float-adjusted market capitalization in each country. |
| | (d) | A free float-adjusted market capitalization index designed to capture large- and mid-cap representation across two of three developed market countries (excluding Japan) and across emerging markets countries in Asia. The index covers approximately 85% of the free float-adjusted market capitalization in each country. |
Performance
| | | | | | | | | | | | | | | | | | | | | | | | |
| | | Average Annual Total Returns(a)(b) | |
| | | 1 Year | | | 5 Years | | | 10 Years | |
| | | Without
Sales
Charge | | | With
Sales
Charge | | | Without
Sales
Charge | | | With
Sales
Charge | | | Without
Sales
Charge | | | With
Sales
Charge | |
Institutional | | | (25.22 | )% | | | N/A | | | | 1.88 | % | | | N/A | | | | 4.91 | % | | | N/A | |
Investor A | | | (25.40 | ) | | | (29.32 | )% | | | 1.63 | | | | 0.54 | % | | | 4.67 | | | | 4.11 | % |
Class K | | | (25.14 | ) | | | N/A | | | | 1.91 | | | | N/A | | | | 4.93 | | | | N/A | |
Class R | | | (25.72 | ) | | | N/A | | | | 1.19 | | | | N/A | | | | 4.20 | | | | N/A | |
MSCI Emerging Markets Index | | | (18.33 | ) | | | N/A | | | | 4.32 | | | | N/A | | | | 2.89 | | | | N/A | |
MSCI AC Asia ex Japan Index | | | (21.01 | ) | | | N/A | | | | 5.17 | | | | N/A | | | | 5.19 | | | | N/A | |
| | (a) | Assuming maximum sales charges, if any. Average annual total returns with and without sales charges reflect reductions for distribution and service fees. See “About Fund Performance” for a detailed description of share classes, including any related sales charges and fees, and how performance was calculated for certain share classes. |
| | (b) | Under normal circumstances, the Fund invests at least 80% of its net assets, plus the amount of any borrowings for investment purposes, in equity securities of companies located, or exercising the predominant part of their economic activity, in Asia, excluding Japan. The Fund’s total returns prior to October 31, 2017 are the returns of the Fund when it followed a different investment objective and different investment strategies under the name BlackRock Pacific Fund, Inc. The Fund’s total returns for the period between October 31, 2017 and November 1, 2021 are the returns of the Fund when it followed a different investment objective and different investment strategies and investment process under the name BlackRock Asian Dragon Fund Inc. |
N/A — Not applicable as the share class and index do not have a sales charge.
Past performance is not an indication of future results.
Performance results may include adjustments made for financial reporting purposes in accordance with U.S. generally accepted accounting principles.
Expense Example
| | | | | | | | | | | | | | | | | | | | | | | | | | | | |
| | | Actual | | | Hypothetical 5% Return | | | | |
| | |
| Beginning
Account Value
(11/01/21) |
| |
| Ending
Account Value
(04/30/22) |
| |
| Expenses
Paid During
the Period |
(a) | |
| Beginning
Account Value
(11/01/21) |
| |
| Ending
Account Value
(04/30/22) |
| |
| Expenses
Paid During
the Period |
(a) | |
| Annualized
Expense
Ratio |
|
Institutional | | $ | 1,000.00 | | | $ | 784.80 | | | $ | 3.81 | | | $ | 1,000.00 | | | $ | 1,020.53 | | | $ | 4.31 | | | | 0.86 | % |
Investor A | | | 1,000.00 | | | | 784.20 | | | | 4.91 | | | | 1,000.00 | | | | 1,019.29 | | | | 5.56 | | | | 1.11 | |
Class K | | | 1,000.00 | | | | 785.50 | | | | 3.59 | | | | 1,000.00 | | | | 1,020.78 | | | | 4.06 | | | | 0.81 | |
| | |
| 12 | | 2 0 2 2 BLACK ROCK ANNUAL REPORT TO SHAREHOLDERS |
| | |
Fund Summary as of April 30, 2022 (continued) | | BlackRock Sustainable Emerging Markets Equity Fund |
Expense Example (continued)
| | | | | | | | | | | | | | | | | | | | | | | | | | | | |
| | | Actual | | | Hypothetical 5% Return | | | | |
| | | Beginning | | | Ending | | | Expenses | | | Beginning | | | Ending | | | Expenses | | | Annualized | |
| | | Account Value | | | Account Value | | | Paid During | | | Account Value | | | Account Value | | | Paid During | | | Expense | |
| | | | (11/01/21) | | | | (04/30/22) | | | | the Period | (a) | | | (11/01/21) | | | | (04/30/22) | | | | the Period | (a) | | | Ratio | |
Class R | | $ | 1,000.00 | | | $ | 782.90 | | | $ | 6.01 | | | $ | 1,000.00 | | | $ | 1,018.05 | | | $ | 6.81 | | | | 1.36 | % |
| | (a) | For each class of the Fund, expenses are equal to the annualized expense ratio for the class, multiplied by the average account value over the period, multiplied by 181/365 (to reflect the one-half year period shown). |
See “Disclosure of Expenses” for further information on how expenses were calculated.
Portfolio Information
TEN LARGEST HOLDINGS
| | | | |
Security(a) | | Percent of
Net Assets | |
Taiwan Semiconductor Manufacturing Co. Ltd. | | | 9 | % |
Samsung Electronics Co. Ltd. | | | 5 | |
Tencent Holdings Ltd. | | | 3 | |
Wal-Mart de Mexico SAB de CV | | | 3 | |
Bandhan Bank Ltd. | | | 3 | |
Axis Bank Ltd. | | | 3 | |
LONGi Green Energy Technology Co. Ltd., Class A | | | 3 | |
Alibaba Group Holding Ltd. | | | 2 | |
Longfor Group Holdings Ltd. | | | 2 | |
Bangkok Dusit Medical Services PCL | | | 2 | |
GEOGRAPHIC ALLOCATION
| | | | |
Country/Geographic Region | | Percent of
Net Assets | |
China | | | 22 | % |
Taiwan | | | 13 | |
South Korea | | | 10 | |
India | | | 10 | |
United States | | | 8 | |
Mexico | | | 6 | |
Brazil | | | 5 | |
United Arab Emirates | | | 4 | |
Hong Kong | | | 3 | |
Thailand | | | 3 | |
United Kingdom | | | 3 | |
South Africa | | | 3 | |
Indonesia | | | 2 | |
Greece | | | 2 | |
Malaysia | | | 2 | |
Panama | | | 1 | |
Kazakhstan | | | 1 | |
Poland | | | 1 | |
Egypt | | | 1 | |
Hungary | | | 1 | |
Other# | | | — | (b) |
Liabilities in Excess of Other Assets | | | (1 | ) |
| (a) | Excludes short-term securities. |
| (b) | Rounds to less than 1% of net assets. |
| # | Includes holdings within countries/geographic regions that are less than 1% of net assets. Please refer to the Schedule of Investments for such countries/geographic regions. |
About Fund Performance
Institutional and Class K Shares (Class K Shares are available only in BlackRock Emerging Markets Fund, Inc., BlackRock Latin America Fund, Inc. and BlackRock Sustainable Emerging Markets Equity Fund) are not subject to any sales charge. These shares bear no ongoing distribution or service fees and are available only to certain eligible investors. Class K Shares performance of BlackRock Emerging Markets Fund, Inc., BlackRock Latin America Fund, Inc. and BlackRock Sustainable Emerging Markets Equity Fund shown prior to the Class K Shares inception date of January 25, 2018 is that of Institutional Shares. The performance of BlackRock Emerging Markets Fund, Inc., BlackRock Latin America Fund, Inc. and BlackRock Sustainable Emerging Markets Equity Fund Class K Shares would be substantially similar to the performances of the applicable Fund’s Institutional Shares because Class K Shares and Institutional Shares of each Fund invest in the same portfolio of securities and performance would only differ to the extent that Class K Shares and Institutional Shares have different expenses. The actual returns of Class K Shares would have been higher than those of the Institutional Shares because Class K Shares have lower expenses than Institutional Shares.
Investor A Shares are subject to a maximum initial sales charge (front-end load) of 5.25% and a service fee of 0.25% per year (but no distribution fee). Certain redemptions of these shares may be subject to a contingent deferred sales charge (“CDSC”) where no initial sales charge was paid at the time of purchase. These shares are generally available through financial intermediaries. On October 28, 2021, BlackRock Sustainable Emerging Markets Equity Fund’s issued and outstanding Investor C Shares converted into Investor A Shares with the same relative aggregate net asset value (“NAV”).
Investor C Shares (available only in BlackRock Emerging Markets Fund, Inc., BlackRock Latin America Fund, Inc. and BlackRock Unconstrained Equity Fund) are subject to a 1.00% CDSC if redeemed within one year of purchase. In addition, these shares are subject to a distribution fee of 0.75% per year and a service fee of 0.25% per year. These shares are generally available through financial intermediaries. These shares automatically convert to Investor A Shares after approximately eight years.
Class R Shares (available only in BlackRock Unconstrained Equity Fund and BlackRock Sustainable Emerging Markets Equity Fund) are not subject to any sales charge. These shares are subject to a distribution fee of 0.25% per year and a service fee of 0.25% per year. These shares are available only to certain employer-sponsored retirement plans.
Past performance is not an indication of future results. Financial markets have experienced extreme volatility and trading in many instruments has been disrupted. These circumstances may continue for an extended period of time and may continue to affect adversely the value and liquidity of each Fund’s investments. As a result, current performance may be lower or higher than the performance data quoted. Refer to blackrock.com to obtain performance data current to the most recent month-end. Performance results do not reflect the deduction of taxes that a shareholder would pay on Fund distributions or the redemption of Fund shares. Figures shown in the performance table(s) assume reinvestment of all distributions, if any, at net asset value (“NAV”) on the ex-dividend date or payable date, as applicable. Investment return and principal value of shares will fluctuate so that shares, when redeemed, may be worth more or less than their original cost. Distributions paid to each class of shares will vary because of the different levels of service, distribution and transfer agency fees applicable to each class, which are deducted from the income available to be paid to shareholders.
BlackRock Advisors, LLC (the “Manager”), each Fund’s investment adviser, has contractually and/or voluntarily agreed to waive and/or reimburse a portion of each Fund’s expenses. Without such waiver(s) and/or reimbursement(s), each Fund’s performance would have been lower. With respect to each Fund’s voluntary waiver(s), if any, the Manager is under no obligation to waive and/or reimburse or to continue waiving and/or reimbursing its fees and such voluntary waiver(s) may be reduced or discontinued at any time. With respect to each Fund’s contractual waiver(s), if any, the Manager is under no obligation to continue waiving and/or reimbursing its fees after the applicable termination date of such agreement. See the Notes to Financial Statements for additional information on waivers and/or reimbursements.
Disclosure of Expenses
Shareholders of each Fund may incur the following charges: (a) transactional expenses, such as sales charges; and (b) operating expenses, including investment advisory fees, service and distribution fees, including 12b-1 fees, acquired fund fees and expenses, and other fund expenses. The expense examples shown (which are based on a hypothetical investment of $1,000 invested at the beginning of the period (or from the commencement of operations if less than 6 months) and held through the end of the period) are intended to assist shareholders both in calculating expenses based on an investment in each Fund and in comparing these expenses with similar costs of investing in other mutual funds.
The expense examples provide information about actual account values and actual expenses. Annualized expense ratios reflect contractual and voluntary fee waivers, if any. In order to estimate the expenses a shareholder paid during the period covered by this report, shareholders can divide their account value by $1,000 and then multiply the result by the number corresponding to their Fund and share class under the heading entitled “Expenses Paid During the Period.”
The expense examples also provide information about hypothetical account values and hypothetical expenses based on a Fund’s actual expense ratio and an assumed rate of return of 5% per year before expenses. In order to assist shareholders in comparing the ongoing expenses of investing in these Funds and other funds, compare the 5% hypothetical examples with the 5% hypothetical examples that appear in shareholder reports of other funds.
The expenses shown in the expense examples are intended to highlight shareholders’ ongoing costs only and do not reflect transactional expenses, such as sales charges, if any. Therefore, the hypothetical examples are useful in comparing ongoing expenses only and will not help shareholders determine the relative total expenses of owning different funds. If these transactional expenses were included, shareholder expenses would have been higher.
| | |
| 14 | | 2 0 2 2 BLACK ROCK ANNUAL REPORT TO SHAREHOLDERS |
Derivative Financial Instruments
The Funds may invest in various derivative financial instruments. These instruments are used to obtain exposure to a security, commodity, index, market, and/or other assets without owning or taking physical custody of securities, commodities and/or other referenced assets or to manage market, equity, credit, interest rate, foreign currency exchange rate, commodity and/or other risks. Derivative financial instruments may give rise to a form of economic leverage and involve risks, including the imperfect correlation between the value of a derivative financial instrument and the underlying asset, possible default of the counterparty to the transaction or illiquidity of the instrument. The Funds’ successful use of a derivative financial instrument depends on the investment adviser’s ability to predict pertinent market movements accurately, which cannot be assured. The use of these instruments may result in losses greater than if they had not been used, may limit the amount of appreciation a Fund can realize on an investment and/or may result in lower distributions paid to shareholders. The Funds’ investments in these instruments, if any, are discussed in detail in the Notes to Financial Statements.
| | |
DERIVATIVE FINANCIAL INSTRUMENTS | | 15 |
| | |
Schedule of Investments April 30, 2022 | | BlackRock Emerging Markets Fund, Inc. (Percentages shown are based on Net Assets) |
| | | | | | | | |
Security | | Shares | | | Value | |
|
Common Stocks | |
|
| Austria — 0.1% | |
Raiffeisen Bank International AG | | | 287,085 | | | $ | 3,267,977 | |
| | | | | | | | |
|
| Brazil — 5.8% | |
B3 SA - Brasil Bolsa Balcao | | | 22,101,767 | | | | 59,457,216 | |
Hapvida Participacoes e Investimentos SA(a) | | | 35,719,935 | | | | 63,363,066 | |
Petroleo Brasileiro SA, ADR | | | 4,436,690 | | | | 60,205,883 | |
Sendas Distribuidora SA | | | 22,304,489 | | | | 68,935,283 | |
| | | | | | | | |
| | |
| | | | | | | 251,961,448 | |
|
| China — 27.9% | |
Alibaba Group Holding Ltd.(b) | | | 3,333,000 | | | | 40,654,859 | |
Alibaba Group Holding Ltd., ADR(b)(c) | | | 956,001 | | | | 92,818,137 | |
Aluminum Corp. of China Ltd., Class H(b) | | | 31,536,000 | | | | 14,461,762 | |
Anhui Conch Cement Co. Ltd., Class H | | | 7,366,000 | | | | 40,027,072 | |
Anhui Honglu Steel Construction Group Co. Ltd. | | | 5,353,819 | | | | 29,021,872 | |
Bank of China Ltd., Class H | | | 95,580,000 | | | | 37,503,914 | |
BOC Hong Kong Holdings Ltd. | | | 13,936,500 | | | | 50,448,180 | |
China Mengniu Dairy Co. Ltd. | | | 13,802,000 | | | | 74,489,653 | |
China Molybdenum Co. Ltd., Class A | | | 25,403,182 | | | | 17,665,163 | |
China Molybdenum Co. Ltd., Class H | | | 5,694,000 | | | | 2,831,616 | |
China Yangtze Power Co. Ltd., Class A | | | 7,976,978 | | | | 27,183,836 | |
Enn Energy Holdings Ltd. | | | 2,741,000 | | | | 36,715,899 | |
Eve Energy Co. Ltd., Class A | | | 1,894,241 | | | | 18,383,266 | |
Haier Smart Home Co. Ltd., Class A | | | 8,509,707 | | | | 32,823,839 | |
Han’s Laser Technology Industry Group Co. Ltd., Class A | | | 7,723,054 | | | | 31,877,904 | |
I-Mab, ADR(b)(c) | | | 496,632 | | | | 6,227,765 | |
JD.com, Inc., Class A(b) | | | 67,190 | | | | 2,094,886 | |
Kanzhun Ltd., ADR(b) | | | 554,485 | | | | 13,047,032 | |
KE Holdings, Inc., ADR(b)(c) | | | 2,204,136 | | | | 31,254,648 | |
Kweichow Moutai Co. Ltd., Class A | | | 343,600 | | | | 94,316,825 | |
Linklogis, Inc., Class B(a)(b) | | | 3,058,000 | | | | 2,917,805 | |
Longfor Group Holdings Ltd.(a) | | | 14,112,000 | | | | 69,890,844 | |
LONGi Green Energy Technology Co. Ltd., Class A | | | 1,876,670 | | | | 18,871,278 | |
Meituan, Class B(a)(b) | | | 2,710,800 | | | | 58,082,672 | |
NARI Technology Co. Ltd., Class A | | | 4,463,510 | | | | 21,275,387 | |
NetEase, Inc. | | | 1,492,700 | | | | 28,593,069 | |
NetEase, Inc., ADR | | | 303,887 | | | | 28,969,548 | |
Shanghai International Airport Co. Ltd., Class A(b) | | | 3,242,145 | | | | 23,930,246 | |
Shenzhen Inovance Technology Co. Ltd., Class A | | | 2,515,092 | | | | 21,610,871 | |
Sungrow Power Supply Co. Ltd., Class A | | | 2,091,037 | | | | 19,609,977 | |
Tencent Holdings Ltd. | | | 1,076,400 | | | | 50,725,226 | |
Tencent Holdings Ltd., ADR | | | 385,757 | | | | 18,157,582 | |
WuXi AppTec Co. Ltd., Class A | | | 3,056,938 | | | | 47,110,621 | |
Wuxi Biologics Cayman, Inc.(a)(b) | | | 5,421,000 | | | | 40,011,374 | |
Yum China Holdings, Inc. | | | 1,168,248 | | | | 48,832,766 | |
Zijin Mining Group Co. Ltd., Class A | | | 10,703,433 | | | | 17,611,222 | |
| | | | | | | | |
| | |
| | | | | | | 1,210,048,616 | |
|
| Egypt — 0.2% | |
Commercial International Bank Egypt SAE | | | 3,785,274 | | | | 9,139,304 | |
| | | | | | | | |
|
| Hong Kong — 0.6% | |
China Resources Beer Holdings Co. Ltd. | | | 4,456,000 | | | | 26,173,823 | |
| | | | | | | | |
|
| Hungary — 0.6% | |
MOL Hungarian Oil & Gas PLC | | | 2,811,773 | | | | 23,841,345 | |
| | | | | | | | |
|
| India — 9.4% | |
Axis Bank Ltd.(b) | | | 3,278,879 | | | | 30,908,485 | |
Bandhan Bank Ltd.(a) | | | 9,675,278 | | | | 41,955,424 | |
Godrej Properties Ltd.(b) | | | 1,457,097 | | | | 29,635,920 | |
HDFC Bank Ltd. | | | 4,072,694 | | | | 73,014,558 | |
| | | | | | | | |
Security | | Shares | | | Value | |
| | |
| India (continued) | | | | | | |
ICICI Bank Ltd. | | | 2,298,654 | | | $ | 22,097,102 | |
ICICI Prudential Life Insurance Co. Ltd.(a) | | | 7,472,972 | | | | 51,032,542 | |
Infosys Ltd. | | | 1,051,162 | | | | 21,304,090 | |
Infosys Ltd., ADR | | | 3,034,005 | | | | 60,285,680 | |
InterGlobe Aviation Ltd.(a)(b) | | | 1,024,033 | | | | 24,661,611 | |
Reliance Industries Ltd. | | | 775,671 | | | | 28,104,440 | |
UltraTech Cement Ltd. | | | 254,523 | | | | 21,920,360 | |
| | | | | | | | |
| | |
| | | | | | | 404,920,212 | |
|
| Indonesia — 4.2% | |
Astra International Tbk PT | | | 107,190,200 | | | | 55,968,452 | |
Bank Central Asia Tbk PT | | | 91,228,000 | | | | 51,167,195 | |
Bank Rakyat Indonesia Persero Tbk PT | | | 84,939,800 | | | | 28,300,838 | |
Telkom Indonesia Persero Tbk PT | | | 142,362,200 | | | | 45,368,929 | |
| | | | | | | | |
| | |
| | | | | | | 180,805,414 | |
|
| Italy — 0.5% | |
PRADA SpA | | | 3,585,600 | | | | 22,310,099 | |
| | | | | | | | |
|
| Kazakhstan — 1.0% | |
Kaspi.KZ JSC, GDR, Registered Shares | | | 662,138 | | | | 43,038,970 | |
| | | | | | | | |
|
| Macau — 0.2% | |
Sands China Ltd.(b) | | | 4,814,800 | | | | 10,612,662 | |
| | | | | | | | |
|
| Malaysia — 1.4% | |
Malayan Banking BHD | | | 6,333,900 | | | | 13,173,363 | |
Public Bank BHD | | | 34,981,100 | | | | 37,599,311 | |
RHB Bank BHD | | | 6,829,400 | | | | 9,784,358 | |
| | | | | | | | |
| | |
| | | | | | | 60,557,032 | |
|
| Mexico — 5.2% | |
Cemex SAB de CV(b)(c) | | | 14,893,549 | | | | 6,553,994 | |
Cemex SAB de CV, ADR(b)(c) | | | 4,362,601 | | | | 19,195,444 | |
Fomento Economico Mexicano SAB de CV | | | 6,529,412 | | | | 49,095,777 | |
Grupo Aeroportuario del Pacifico SAB de CV, ADR | | | 143,586 | | | | 22,082,091 | |
Grupo Aeroportuario del Pacifico SAB de CV, Class B | | | 1,380,380 | | | | 21,242,287 | |
Grupo Aeroportuario del Sureste SAB de CV, ADR | | | 5,861 | | | | 1,278,987 | |
Grupo Aeroportuario del Sureste SAB de CV, Class B | | | 986,909 | | | | 21,539,199 | |
Grupo Financiero Banorte SAB de CV, Class O | | | 7,657,231 | | | | 50,547,894 | |
Wal-Mart de Mexico SAB de CV | | | 9,184,545 | | | | 32,477,729 | |
| | | | | | | | |
| | |
| | | | | | | 224,013,402 | |
|
| Panama — 0.7% | |
Copa Holdings SA, Class A(b)(c) | | | 399,491 | | | | 30,109,637 | |
| | | | | | | | |
|
| Peru — 0.5% | |
Credicorp Ltd. | | | 171,299 | | | | 23,791,718 | |
| | | | | | | | |
|
| Poland — 1.1% | |
Bank Polska Kasa Opieki SA | | | 1,233,535 | | | | 27,107,254 | |
Powszechna Kasa Oszczednosci Bank Polski SA(b) | | | 2,590,909 | | | | 19,122,307 | |
| | | | | | | | |
| | |
| | | | | | | 46,229,561 | |
|
| Russia(d) — 0.0% | |
Fix Price Group Ltd., GDR, Registered Shares | | | 3,992,341 | | | | 39,923 | |
Gazprom PJSC | | | 8,520,027 | | | | 1,194 | |
LUKOIL PJSC | | | 198,150 | | | | 28 | |
LUKOIL PJSC, ADR | | | 1,171,876 | | | | 11,719 | |
Magnit PJSC | | | 686,994 | | | | 96 | |
Novatek PJSC | | | 72,342 | | | | 10 | |
Novatek PJSC, GDR, Registered Shares | | | 22,358 | | | | 224 | |
| | |
| 16 | | 2 0 2 2 BLACK ROCK ANNUAL REPORT TO SHAREHOLDERS |
| | |
Schedule of Investments (continued) April 30, 2022 | | BlackRock Emerging Markets Fund, Inc. (Percentages shown are based on Net Assets) |
| | | | | | | | |
Security | | Shares | | | Value | |
| | |
| Russia (continued) | | | | | | |
Sberbank of Russia PJSC, ADR | | | 1,697,015 | | | $ | 16,970 | |
TCS Group Holding PLC, GDR, Registered Shares | | | 426,925 | | | | 4,022 | |
| | | | | | | | |
| | | | | | | 74,186 | |
| | |
| Saudi Arabia — 4.6% | | | | | | |
Al Rajhi Bank | | | 954,489 | | | | 44,714,116 | |
SABIC Agri-Nutrients Co. | | | 522,831 | | | | 22,522,825 | |
Saudi National Bank | | | 3,779,084 | | | | 79,208,887 | |
Saudi Telecom Co. | | | 1,303,221 | | | | 40,074,758 | |
Yanbu National Petrochemical Co. | | | 774,290 | | | | 12,514,869 | |
| | | | | | | | |
| | |
| | | | | | | 199,035,455 | |
| | |
| Singapore — 0.3% | | | | | | |
Singapore Telecommunications Ltd. | | | 7,304,900 | | | | 14,579,074 | |
| | | | | | | | |
| | |
| South Africa — 2.2% | | | | | | |
Absa Group Ltd. | | | 1,946,562 | | | | 21,029,808 | |
AngloGold Ashanti Ltd. | | | 708,386 | | | | 14,506,360 | |
AngloGold Ashanti Ltd., ADR(c) | | | 706,073 | | | | 14,418,011 | |
Sanlam Ltd. | | | 11,235,991 | | | | 46,545,543 | |
| | | | | | | | |
| | |
| | | | | | | 96,499,722 | |
| | |
| South Korea — 7.2% | | | | | | |
Hana Financial Group, Inc. | | | 567,092 | | | | 21,054,259 | |
Kakaopay Corp., (Acquired 10/22/21, Cost: $11,915,194)(e) | | | 154,288 | | | | 13,804,231 | |
KB Financial Group, Inc. | | | 1,081,881 | | | | 50,333,519 | |
Korea Zinc Co. Ltd. | | | 56,915 | | | | 25,983,848 | |
Samsung Electronics Co. Ltd. | | | 3,242,028 | | | | 172,779,165 | |
SK Innovation Co. Ltd.(b) | | | 3,161 | | | | 503,092 | |
Wonik IPS Co. Ltd. | | | 872,879 | | | | 27,331,756 | |
| | | | | | | | |
| | |
| | | | | | | 311,789,870 | |
| | |
| Taiwan — 10.5% | | | | | | |
Accton Technology Corp. | | | 7,821,000 | | | | 61,002,781 | |
Chunghwa Telecom Co. Ltd. | | | 7,720,000 | | | | 34,222,488 | |
Taiwan Semiconductor Manufacturing Co. Ltd. | | | 18,059,000 | | | | 326,554,476 | |
Taiwan Semiconductor Manufacturing Co. Ltd., ADR | | | 40,870 | | | | 3,798,049 | |
Unimicron Technology Corp. | | | 4,145,000 | | | | 29,073,547 | |
| | | | | | | | |
| | |
| | | | | | | 454,651,341 | |
| | |
| Thailand — 3.4% | | | | | | |
Advanced Info Service PCL, NVDR | | | 5,617,400 | | | | 35,120,579 | |
Airports of Thailand PCL, NVDR(b) | | | 16,935,600 | | | | 32,727,506 | |
PTT PCL, NVDR | | | 42,774,300 | | | | 46,488,248 | |
Thai Beverage PCL | | | 64,912,400 | | | | 31,976,404 | |
| | | | | | | | |
| | |
| | | | | | | 146,312,737 | |
| | |
| United Arab Emirates — 1.5% | | | | | | |
Emaar Properties PJSC | | | 24,118,307 | | | | 41,600,506 | |
Emirates NBD Bank PJSC | | | 5,722,373 | | | | 23,639,952 | |
| | | | | | | | |
| | |
| | | | | | | 65,240,458 | |
| | |
| United Kingdom — 1.5% | | | | | | |
CK Hutchison Holdings Ltd. | | | 5,854,000 | | | | 41,082,944 | |
Prudential PLC | | | 1,907,581 | | | | 23,746,433 | |
| | | | | | | | |
| | |
| | | | | | | 64,829,377 | |
| | | | | | | | |
Security | | Shares | | | Value | |
| | |
| United States — 0.9% | | | | | | |
Albemarle Corp. | | | 203,498 | | | $ | 39,240,519 | |
| | | | | | | | |
| | |
Total Common Stocks — 91.5%
(Cost: $4,372,379,499) | | | | | | | 3,963,073,959 | |
| | | | | | | | |
|
| Preferred Securities | |
|
| Preferred Stocks — 0.5% | |
|
| Brazil — 0.5% | |
Banco Nacional SA, Preference Shares(d) | | | 42,567,626 | | | | 86 | |
Petroleo Brasileiro SA, Preference Shares | | | 3,088,000 | | | | 18,912,942 | |
| | | | | | | | |
| | | | | | | 18,913,028 | |
| | | | | | | | |
| | |
Total Preferred Securities — 0.5%
(Cost: $19,237,791) | | | | | | | 18,913,028 | |
| | | | | | | | |
| | |
Total Long-Term Investments — 92.0%
(Cost: $4,391,617,290) | | | | | | | 3,981,986,987 | |
| | | | | | | | |
|
| Short-Term Securities | |
|
| Money Market Funds — 7.2% | |
BlackRock Liquidity Funds, T-Fund, Institutional Class, 0.29%(f)(g) | | | 288,654,519 | | | | 288,654,519 | |
SL Liquidity Series, LLC, Money Market Series, 0.47%(f)(g)(h) | | | 22,845,283 | | | | 22,842,998 | |
| | | | | | | | |
| | |
Total Short-Term Securities — 7.2%
(Cost: $311,491,585) | | | | | | | 311,497,517 | |
| | | | | | | | |
| | |
Total Investments — 99.2%
(Cost: $4,703,108,875) | | | | | | | 4,293,484,504 | |
| |
Other Assets Less Liabilities — 0.8% | | | | 36,695,932 | |
| | | | | | | | |
| | |
Net Assets — 100.0% | | | | | | $ | 4,330,180,436 | |
| | | | | | | | |
| (a) | Security exempt from registration pursuant to Rule 144A under the Securities Act of 1933, as amended. These securities may be resold in transactions exempt from registration to qualified institutional investors. |
| (b) | Non-income producing security. |
| (c) | All or a portion of this security is on loan. |
| (d) | Security is valued using significant unobservable inputs and is classified as Level 3 in the fair value hierarchy. |
| (e) | Restricted security as to resale, excluding 144A securities. The Fund held restricted securities with a current value of $13,804,231, representing 0.3% of its net assets as of period end, and an original cost of $11,915,194. |
| (f) | Affiliate of the Fund. |
| (g) | Annualized 7-day yield as of period end. |
| (h) | All or a portion of this security was purchased with the cash collateral from loaned securities. |
| | |
SCHEDULE OF INVESTMENTS | | 17 |
| | |
Schedule of Investments (continued) April 30, 2022 | | BlackRock Emerging Markets Fund, Inc. |
Affiliates
Investments in issuers considered to be affiliate(s) of the Fund during the year ended April 30, 2022 for purposes of Section 2(a)(3) of the Investment Company Act of 1940, as amended, were as follows:
| | | | | | | | | | | | | | | | | | | | | | | | | | | | | | | | | | | | | | |
| | | | | | | | | | |
| | Affiliated Issuer | | Value at
04/30/21 | | | Purchases
at Cost | | | Proceeds
from Sales | | | Net
Realized
Gain (Loss) | | | Change in
Unrealized
Appreciation
(Depreciation) | | | Value at
04/30/22 | | | Shares Held at
04/30/22 | | | Income | | | Capital Gain
Distributions
from
Underlying
Funds | |
| | | | | | | | | | |
| | BlackRock Liquidity Funds, T-Fund, Institutional Class | | $ | 321,271,043 | | | $ | — | | | $ | (32,616,524) | (a) | | $ | — | | | $ | — | | | $ | 288,654,519 | | | | 288,654,519 | | | $ | 103,800 | | | $ | — | |
| | | | | | | | | | |
| | SL Liquidity Series, LLC, Money Market Series | | | 10,450,481 | | | | 12,399,207 | (a) | | | — | | | | (12,623 | ) | | | 5,933 | | | | 22,842,998 | | | | 22,845,283 | | | | 81,466 | (b) | | | — | |
| | | | | | | | | | | | | | | | | | | | | | | | | | | | | | | | | | | | | | |
| | | | | | | | | | |
| | | | | | | | | | | | | | | | $ | (12,623 | ) | | $ | 5,933 | | | $ | 311,497,517 | | | | | | | $ | 185,266 | | | $ | — | |
| | | | | | | | | | | | | | | | | | | | | | | | | | | | | | | | | | | | | | |
| | (a) | Represents net amount purchased (sold). | |
| | (b) | All or a portion represents securities lending income earned from the reinvestment of cash collateral from loaned securities, net of fees and collateral investment expenses, and other payments to and from borrowers of securities. | |
Derivative Financial Instruments Outstanding as of Period End
Futures Contracts
| | | | | | | | | | | | | | | | |
Description | | Number of
Contracts | | | Expiration
Date | | | Notional
Amount (000) | | | Value/
Unrealized
Appreciation
(Depreciation) | |
Long Contracts | | | | | | | | | | | | | |
MSCI Emerging Markets Index | | | 585 | | | | 06/17/22 | | | $ | 30,929 | | | $ | (1,153,404 | ) |
| | | | | | | | | | | | | | | | |
OTC Total Return Swaps
| | | | | | | | | | | | | | | | | | | | | | | | | | | | | | |
| | | | | | | | |
| | Reference Entity | | Payment
Frequency | | | Counterparty(a) | | | Termination Date | | | Net Notional | | | Accrued
Unrealized
Appreciation
(Depreciation) | | | Net Value of
Reference
Entity | | | Gross
Notional
Amount
Net Asset
Percentage | |
| | | | | | | | |
| | Equity Securities Long | | | Monthly | | | | HSBC Bank PLC(b) | | | | 02/10/23 – 02/13/23 | | | $ | 69,249,266 | | | $ | 1,901,522 | (c) | | $ | 70,435,887 | | | | 1.6 | % |
| | | | | | | | |
| | | | | Monthly | | | | JPMorgan Chase Bank N.A.(d) | | | | 02/08/23 | | | | 4,949,632 | | | | 42,910 | (e) | | | 4,854,340 | | | | 0.1 | |
| | | | | | | | | | | | | | | | | | | | | | | | | | | | | | |
| | | | | | | | |
| | | | | | | | | | | | | | | | | | | | $ | 1,944,432 | | | $ | 75,290,227 | | | | | |
| | | | | | | | | | | | | | | | | | | | | | | | | | | | | | |
| | (a) | The Fund receives the total return on a portfolio of long positions underlying the total return swap. The Fund pays the total return on a portfolio of short positions underlying the total return swap. In addition, the Fund pays or receives a variable rate of interest, based on a specified benchmark. The benchmark and spread are determined based upon the country and/or currency of the individual underlying positions. | |
| | (c) | Amount includes $714,901 of net dividends and financing fees. | |
| | (e) | Amount includes $138,202 of net dividends and financing fees. | |
The following are the specified benchmarks (plus or minus a range) used in determining the variable rate of interest:
| | | | |
| | (b) | | (d) |
Range: | | 60-80 basis points | | 95 basis points |
Benchmarks: | | USD - 1D Overnight Bank Funding Rate (OBFR01) | | USD - 1D Overnight Bank Funding Rate (OBFR01) |
| | |
| 18 | | 2 0 2 2 BLACK ROCK ANNUAL REPORT TO SHAREHOLDERS |
| | |
Schedule of Investments (continued) April 30, 2022 | | BlackRock Emerging Markets Fund, Inc. |
The following table represents the individual long positions and related values of the equity securities underlying the total return swap with HSBC Bank PLC as of period end, termination dates February 10, 2023 and February 13, 2023:
| | | | | | | | | | | | |
Security | | Shares | | | Value | | | % of
Basket
Value | |
| |
| Reference Entity — Long | | | | |
| | | |
Common Stocks | | | | | | | | | | | | |
| | | |
Saudi Arabia | | | | | | | | | | | | |
Nahdi Medical Co. | | | 535,902 | | | $ | 23,860,412 | | | | 33.9 | % |
| | | | | | | | | | | | |
| | | |
Total Saudi Arabia | | | | | | | 23,860,412 | | | | | |
| | | |
United Kingdom | | | | | | | | | | | | |
Standard Chartered PLC | | | 6,812,944 | | | | 46,575,475 | | | | 66.1 | |
| | | | | | | | | | | | |
Total United Kingdom | | | | | | | 46,575,475 | | | | | |
| | | | | | | | | | | | |
| | |
Net Value of Reference Entity — HSBC Bank PLC | | | $ | 70,435,887 | | | | | |
| | | | | | | | | | | | |
The following table represents the individual long positions and related values of the equity securities underlying the total return swap with JPMorgan Chase Bank N.A. as of period end, termination date Feburary 8, 2023:
| | | | | | | | | | | | |
Security | | Shares | | | Value | | | % of
Basket
Value | |
| |
| Reference Entity — Long | | | | |
| | | |
Common Stocks | | | | | | | | | | | | |
| | | |
Egypt | | | | | | | | | | | | |
Commercial International Bank Egypt SAE | | | 2,010,548 | | | $ | 4,854,340 | | | | 100.0 | % |
| | | | | | | | | | | | |
| | |
Net Value of Reference Entity — JPMorgan Chase Bank N.A. | | | $ | 4,854,340 | | | | | |
| | | | | | | | | | | | |
Balances Reported in the Statements of Assets and Liabilities for OTC Swaps
| | | | | | | | | | | | | | | | |
Description | | Swap
Premiums
Paid | | | Swap
Premiums
Received | | | Unrealized
Appreciation | | | Unrealized
Depreciation | |
OTC Swaps | | $ | — | | | $ | — | | | $ | 1,944,432 | | | $ | — | |
Derivative Financial Instruments Categorized by Risk Exposure
As of period end, the fair values of derivative financial instruments located in the Statements of Assets and Liabilities were as follows:
| | | | | | | | | | | | | | | | | | | | | | | | | | | | |
| | | Commodity
Contracts | | | Credit
Contracts | | | Equity
Contracts | | | Foreign
Currency
Exchange
Contracts | | | Interest
Rate
Contracts | | | Other
Contracts | | | Total | |
| | | | | | | |
| Assets — Derivative Financial Instruments | | | | | | | | | | | | | | | | | | | | | |
Swaps — OTC | | | | | | | | | | | | | | | | | | | | | | | | | | | | |
Unrealized appreciation on OTC swaps; Swap premiums paid | | $ | — | | | $ | — | | | $ | 1,944,432 | | | $ | — | | | $ | — | | | $ | — | | | $ | 1,944,432 | |
| | | | | | | | | | | | | | | | | | | | | | | | | | | | |
| | | | | | | |
| Liabilities — Derivative Financial Instruments | | | | | | | | | | | | | | | | | | | | | |
Futures contracts | | | | | | | | | | | | | | | | | | | | | | | | | | | | |
Unrealized depreciation on futures contracts(a) | | $ | — | | | $ | — | | | $ | 1,153,404 | | | $ | — | | | $ | — | | | $ | — | | | $ | 1,153,404 | |
| | | | | | | | | | | | | | | | | | | | | | | | | | | | |
| | (a) | Net cumulative unrealized appreciation (depreciation) on futures contracts and centrally cleared swaps, if any, are reported in the Schedule of Investments. In the Statements of Assets and Liabilities, only current day’s variation margin is reported in receivables or payables and the net cumulative unrealized appreciation (depreciation) is included in accumulated earnings (loss). | |
For the period ended April 30, 2022, the effect of derivative financial instruments in the Statements of Operations was as follows:
| | | | | | | | | | | | | | | | | | | | | | | | | | | | |
| | | Commodity
Contracts | | | Credit
Contracts | | | Equity
Contracts | | | Foreign
Currency Exchange
Contracts | | | Interest Rate
Contracts | | | Other
Contracts | | | Total | |
| | | | | | | |
| Net Realized Gain (Loss) from: | | | | | | | | | | | | | | | | | | | | | |
Futures contracts | | $ | — | | | $ | — | | | $ | (25,632,537 | ) | | $ | — | | | $ | — | | | $ | — | | | $ | (25,632,537 | ) |
Forward foreign currency exchange contracts | | | — | | | | — | | | | — | | | | (551,259 | ) | | | — | | | | — | | | | (551,259 | ) |
Swaps | | | — | | | | — | | | | 5,061,391 | | | | — | | | | — | | | | — | | | | 5,061,391 | |
| | | | | | | | | | | | | | | | | | | | | | | | | | | | |
| | $ | — | | | $ | — | | | $ | (20,571,146 | ) | | $ | (551,259 | ) | | $ | — | | | $ | — | | | $ | (21,122,405 | ) |
| | | | | | | | | | | | | | | | | | | | | | | | | | | | |
| | | | | |
| Net Change in Unrealized Appreciation (Depreciation) on: | | | | | | | | | | | | | | | | |
Futures contracts | | $ | — | | | $ | — | | | $ | (2,515,001 | ) | | $ | — | | | $ | — | | | $ | — | | | $ | (2,515,001 | ) |
Swaps | | | — | | | | — | | | | (1,134,351 | ) | | | — | | | | — | | | | — | | | | (1,134,351 | ) |
| | | | | | | | | | | | | | | | | | | | | | | | | | | | |
| | $ | — | | | $ | — | | | $ | (3,649,352 | ) | | $ | — | | | $ | — | | | $ | — | | | $ | (3,649,352 | ) |
| | | | | | | | | | | | | | | | | | | | | | | | | | | | |
| | |
SCHEDULE OF INVESTMENTS | | 19 |
| | |
Schedule of Investments (continued) April 30, 2022 | | BlackRock Emerging Markets Fund, Inc. |
Average Quarterly Balances of Outstanding Derivative Financial Instruments
| | | | |
| | |
Futures contracts: | | | | |
Average notional value of contracts — long | | $ | 84,027,611 | |
Forward foreign currency exchange contracts: | | | | |
Average amounts purchased — in USD | | $ | — | (a) |
Total return swaps: | | | | |
Average notional value | | $ | 70,803,063 | |
| |
| | (a) | Derivative not held at any quarter-end. The risk exposure table serves as an indicator of activity during the period. | |
For more information about the Fund’s investment risks regarding derivative financial instruments, refer to the Notes to Financial Statements.
Derivative Financial Instruments — Offsetting as of Period End
The Fund’s derivative assets and liabilities (by type) were as follows:
| | | | | | | | |
| | | Assets | | | Liabilities | |
| | |
Derivative Financial Instruments | | | | | | | | |
Futures contracts | | $ | 125,827 | | | $ | — | |
Swaps — OTC(a) | | | 1,944,432 | | | | — | |
| | | | | | | | |
Total derivative assets and liabilities in the Statements of Assets and Liabilities | | | 2,070,259 | | | | — | |
| | | | | | | | |
Derivatives not subject to a Master Netting Agreement or similar agreement (“MNA”) | | | (125,827 | ) | | | — | |
| | | | | | | | |
Total derivative assets and liabilities subject to an MNA | | $ | 1,944,432 | | | $ | — | |
| | | | | | | | |
| | (a) | Includes unrealized appreciation (depreciation) on OTC swaps and swap premiums (paid/received) in the Statements of Assets and Liabilities. | |
The following table presents the Fund’s derivative assets by counterparty net of amounts available for offset under an MNA and net of the related collateral received by the Fund:
| | | | | | | | | | | | | | | | | | | | |
Counterparty | |
| Derivative
Assets
Subject to
an MNA by
Counterparty |
| |
| Derivatives
Available
for Offset |
| |
| Non-Cash
Collateral
Received |
| |
| Cash
Collateral
Received |
| |
| Net Amount
of Derivative
Assets |
(a) |
HSBC Bank PLC | | $ | 1,901,522 | | | $ | — | | | $ | — | | | $ | (1,700,000 | ) | | $ | 201,522 | |
JPMorgan Chase Bank N.A. | | | 42,910 | | | | — | | | | — | | | | — | | | | 42,910 | |
| | | | | | | | | | | | | | | | | | | | |
| | $ | 1,944,432 | | | $ | — | | | $ | — | | | $ | (1,700,000 | ) | | $ | 244,432 | |
| | | | | | | | | | | | | | | | | | | | |
| | (a) | Net amount represents the net amount receivable from the counterparty in the event of default. | |
Fair Value Hierarchy as of Period End
Various inputs are used in determining the fair value of financial instruments. For a description of the input levels and information about the Fund’s policy regarding valuation of financial instruments, refer to the Notes to Financial Statements.
The following table summarizes the Fund’s financial instruments categorized in the fair value hierarchy. The breakdown of the Fund’s financial instruments into major categories is disclosed in the Schedule of Investments above.
| | | | | | | | | | | | | | | | |
| | | Level 1 | | | Level 2 | | | Level 3 | | | Total | |
Assets | | | | | | | | | | | | | | | | |
Investments | | | | | | | | | | | | | | | | |
Long-Term Investments | | | | | | | | | | | | | | | | |
Common Stocks | | | | | | | | | | | | | | | | |
Austria | | $ | — | | | $ | 3,267,977 | | | $ | — | | | $ | 3,267,977 | |
Brazil | | | 251,961,448 | | | | — | | | | — | | | | 251,961,448 | |
China | | | 239,307,478 | | | | 970,741,138 | | | | — | | | | 1,210,048,616 | |
Egypt | | | — | | | | 9,139,304 | | | | — | | | | 9,139,304 | |
Hong Kong | | | — | | | | 26,173,823 | | | | — | | | | 26,173,823 | |
Hungary | | | — | | | | 23,841,345 | | | | — | | | | 23,841,345 | |
India | | | 60,285,680 | | | | 344,634,532 | | | | — | | | | 404,920,212 | |
Indonesia | | | 45,368,929 | | | | 135,436,485 | | | | — | | | | 180,805,414 | |
Italy | | | — | | | | 22,310,099 | | | | — | | | | 22,310,099 | |
Kazakhstan | | | 43,038,970 | | | | — | | | | — | | | | 43,038,970 | |
| | |
| 20 | | 2 0 2 2 BLACK ROCK ANNUAL REPORT TO SHAREHOLDERS |
| | |
Schedule of Investments (continued) April 30, 2022 | | BlackRock Emerging Markets Fund, Inc. |
Fair Value Hierarchy as of Period End (continued)
| | | | | | | | | | | | | | | | |
| | | Level 1 | | | Level 2 | | | Level 3 | | | Total | |
| | | | |
Common Stocks (continued) | | | | | | | | | | | | | | | | |
| | | | |
Macau | | $ | — | | | $ | 10,612,662 | | | $ | — | | | $ | 10,612,662 | |
Malaysia | | | — | | | | 60,557,032 | | | | — | | | | 60,557,032 | |
Mexico | | | 224,013,402 | | | | — | | | | — | | | | 224,013,402 | |
Panama | | | 30,109,637 | | | | — | | | | — | | | | 30,109,637 | |
Peru | | | 23,791,718 | | | | — | | | | — | | | | 23,791,718 | |
Poland | | | — | | | | 46,229,561 | | | | — | | | | 46,229,561 | |
Russia | | | — | | | | — | | | | 74,186 | | | | 74,186 | |
Saudi Arabia | | | — | | | | 199,035,455 | | | | — | | | | 199,035,455 | |
Singapore | | | — | | | | 14,579,074 | | | | — | | | | 14,579,074 | |
South Africa | | | 14,418,011 | | | | 82,081,711 | | | | — | | | | 96,499,722 | |
South Korea | | | — | | | | 311,789,870 | | | | — | | | | 311,789,870 | |
Taiwan | | | 3,798,049 | | | | 450,853,292 | | | | — | | | | 454,651,341 | |
Thailand | | | — | | | | 146,312,737 | | | | — | | | | 146,312,737 | |
United Arab Emirates | | | — | | | | 65,240,458 | | | | — | | | | 65,240,458 | |
United Kingdom | | | — | | | | 64,829,377 | | | | — | | | | 64,829,377 | |
United States | | | 39,240,519 | | | | — | | | | — | | | | 39,240,519 | |
Preferred Securities | | | | | | | | | | | | | | | | |
Preferred Stocks | | | 18,912,942 | | | | — | | | | 86 | | | | 18,913,028 | |
Short-Term Securities | | | | | | | | | | | | | | | | |
Money Market Funds | | | 288,654,519 | | | | — | | | | — | | | | 288,654,519 | |
| | | | | | | | | | | | | | | | |
| | $ | 1,282,901,302 | | | $ | 2,987,665,932 | | | $ | 74,272 | | | | 4,270,641,506 | |
| | | | | | | | | | | | | | | | |
Investments Valued at NAV(a) | | | | | | | | | | | | | | | 22,842,998 | |
| | | | | | | | | | | | | | | | |
| | | | | | | | | | | | | | $ | 4,293,484,504 | |
| | | | | | | | | | | | | | | | |
Derivative Financial Instruments(b) | | | | | | | | | | | | | | | | |
Assets | | | | | | | | | | | | | | | | |
Equity Contracts | | $ | — | | | $ | 1,944,432 | | | $ | — | | | $ | 1,944,432 | |
Liabilities | | | | | | | | | | | | | | | | |
Equity Contracts | | | (1,153,404 | ) | | | — | | | | — | | | | (1,153,404 | ) |
| | | | | | | | | | | | | | | | |
| | $ | (1,153,404 | ) | | $ | 1,944,432 | | | $ | — | | | $ | 791,028 | |
| | | | | | | | | | | | | | | | |
| | (a) | Certain investments of the Fund were fair valued using NAV per share as no quoted market value is available and therefore have been excluded from the fair value hierarchy. | |
| | (b) | Derivative financial instruments are swaps and futures contracts. Swaps and futures contracts are valued at the unrealized appreciation (depreciation) on the instrument. | |
See notes to financial statements.
| | |
SCHEDULE OF INVESTMENTS | | 21 |
| | |
Schedule of Investments April 30, 2022 | | BlackRock Latin America Fund, Inc. (Percentages shown are based on Net Assets) |
| | | | | | | | |
| Security | | Shares | | | Value | |
| | |
Common Stocks | | | | | | | | |
| | |
| Argentina — 1.5% | | | | | | |
Globant SA(a) | | | 4,401 | | | $ | 950,572 | |
| | | | | | | | |
| | |
| Brazil — 61.5% | | | | | | |
Afya Ltd., Class A(a)(b) | | | 40,532 | | | | 612,438 | |
Arezzo Industria e Comercio SA | | | 17,599 | | | | 318,487 | |
B3 SA - Brasil Bolsa Balcao | | | 1,004,522 | | | | 2,702,321 | |
Banco Bradesco SA, ADR | | | 1,019,786 | | | | 3,671,229 | |
Banco BTG Pactual SA | | | 361,053 | | | | 1,686,246 | |
BB Seguridade Participacoes SA | | | 255,183 | | | | 1,312,575 | |
Bradespar SA, Preference Shares | | | 177,760 | | | | 1,053,124 | |
CCR SA | | | 494,759 | | | | 1,241,914 | |
Cia de Locacao das Americas | | | 202,513 | | | | 965,060 | |
Hapvida Participacoes e Investimentos SA(c) | | | 923,987 | | | | 1,639,047 | |
Itau Unibanco Holding SA, ADR | | | 662,852 | | | | 3,175,061 | |
Marfrig Global Foods SA | | | 238,910 | | | | 906,069 | |
Movida Participacoes SA | | | 208,657 | | | | 766,012 | |
Neoenergia SA | | | 293,888 | | | | 1,116,358 | |
Petro Rio SA(a) | | | 232,632 | | | | 1,256,338 | |
Petroleo Brasileiro SA, ADR | | | 50,504 | | | | 685,339 | |
Petroleo Brasileiro SA, ADR, Preference Shares | | | 402,930 | | | | 4,943,951 | |
Rede D’Or Sao Luiz SA(c) | | | 108,304 | | | | 804,621 | |
Sendas Distribuidora SA | | | 224,523 | | | | 693,921 | |
Sequoia Logistica e Transportes SA(a) | | | 212,860 | | | | 461,115 | |
Suzano SA | | | 154,114 | | | | 1,546,455 | |
TIM SA | | | 346,058 | | | | 943,550 | |
Vale SA, ADR | | | 345,761 | | | | 5,839,903 | |
XP, Inc., Class A(a) | | | 13,817 | | | | 340,036 | |
| | | | | | | | |
| | |
| | | | | | | 38,681,170 | |
| | |
| Chile — 3.9% | | | | | | |
Banco Santander Chile, ADR | | | 50,284 | | | | 977,521 | |
Empresas CMPC SA | | | 543,957 | | | | 810,743 | |
Falabella SA | | | 240,229 | | | | 674,690 | |
| | | | | | | | |
| | |
| | | | | | | 2,462,954 | |
| | |
| Mexico — 25.0% | | | | | | |
America Movil SAB de CV, Class L, ADR | | | 100,521 | | | | 1,953,123 | |
Cemex SAB de CV, ADR(a) | | | 390,659 | | | | 1,718,900 | |
Corp. Inmobiliaria Vesta SAB de CV | | | 501,475 | | | | 929,154 | |
Fibra Uno Administracion SA de CV | | | 1,183,798 | | | | 1,298,282 | |
Fomento Economico Mexicano SAB de CV, ADR | | | 39,343 | | | | 2,940,496 | |
Grupo Aeroportuario del Pacifico SAB de CV, ADR | | | 3,520 | | | | 541,341 | |
Grupo Aeroportuario del Pacifico SAB de CV, Class B | | | 48,013 | | | | 738,859 | |
Grupo Cementos de Chihuahua SAB de CV | | | 107,594 | | | | 711,634 | |
Grupo Financiero Banorte SAB de CV, Class O | | | 311,897 | | | | 2,058,934 | |
Grupo Mexico SAB de CV, Series B | | | 312,093 | | | | 1,460,864 | |
Wal-Mart de Mexico SAB de CV | | | 388,212 | | | | 1,372,767 | |
| | | | | | | | |
| | |
| | | | | | | 15,724,354 | |
| | |
| Panama — 1.3% | | | | | | |
Copa Holdings SA, Class A(a) | | | 10,470 | | | | 789,124 | |
| | | | | | | | |
| | |
| Peru — 1.9% | | | | | | |
Credicorp Ltd. | | | 8,753 | | | | 1,215,704 | |
| | | | | | | | |
| | |
Total Common Stocks — 95.1%
(Cost: $48,524,379) | | | | | 59,823,878 | |
| | | | | | | | |
| | | | | | | | | | | | |
| Security | | | | | Par (000) | | | Value | |
| | | |
Corporate Bonds | | | | | | | | | | | | |
| | | |
| Brazil — 0.0% | | | | | | | | | |
Klabin SA, 1.00%, 06/15/22(a)(d) | | | BRL | | | | 2 | | | $ | 4,999 | |
| | | | | | | | | | | | |
| | | |
Total Corporate Bonds — 0.0%
(Cost: $11,159) | | | | | | | | | | | 4,999 | |
| | | | | | | | | | | | |
| | | |
| | | | | | Shares | | | | |
| | | |
Preferred Securities | | | | | | | | | | | | |
| | | |
| Preferred Stocks — 3.2% | | | | | | | | | |
| | | |
| Brazil — 3.2% | | | | | | | | | |
Gerdau SA, Preference Shares | | | | | | | 351,314 | | | | 1,987,531 | |
| | | | | | | | | | | | |
| | | |
Total Preferred Securities — 3.2%
(Cost: $1,756,260) | | | | | | | | 1,987,531 | |
| | | | | | | | | | | | |
| | | |
Total Long-Term Investments — 98.3%
(Cost: $50,291,798) | | | | | | | | 61,816,408 | |
| | | | | | | | | | | | |
| | | |
Short-Term Securities | | | | | | | | | | | | |
| | | |
| Money Market Funds — 1.8% | | | | | | | | | |
BlackRock Liquidity Funds, T-Fund, Institutional Class, 0.29%(e)(f) | | | | | | | 583,720 | | | | 583,720 | |
SL Liquidity Series, LLC, Money Market Series, 0.47%(e)(f)(g) | | | | | | | 563,173 | | | | 563,117 | |
| | | | | | | | | | | | |
| | | |
| | | | | | | | | | | 1,146,837 | |
| | | | | | | | | | | | |
| | | |
| | | | | | Par
(000) | | | | |
| | | |
| Time Deposits — 0.0% | | | | | | | | | |
| | | |
| United States — 0.0% | | | | | | | | | |
JP Morgan Chase, New York, (0.33%), 05/02/22 | | | USD | | | | 2 | | | | 2,318 | |
| | | | | | | | | | | | |
| | | |
Total Short-Term Securities — 1.8%
(Cost: $1,149,076) | | | | | | | | 1,149,155 | |
| | | | | | | | | | | | |
| | | |
Total Investments — 100.1%
(Cost: $51,440,874) | | | | | | | | 62,965,563 | |
| |
Liabilities in Excess of Other Assets — (0.1)% | | | | (77,950 | ) |
| | | | | | | | | | | | |
| | | |
Net Assets — 100.0% | | | | | | | | | | $ | 62,887,613 | |
| | | | | | | | | | | | |
| (a) | Non-income producing security. |
| (b) | All or a portion of this security is on loan. |
| (c) | Security exempt from registration pursuant to Rule 144A under the Securities Act of 1933, as amended. These securities may be resold in transactions exempt from registration to qualified institutional investors. |
| (d) | Security is valued using significant unobservable inputs and is classified as Level 3 in the fair value hierarchy. |
| (e) | Affiliate of the Fund. |
| (f) | Annualized 7-day yield as of period end. |
| (g) | All or a portion of this security was purchased with the cash collateral from loaned securities. |
| | |
| 22 | | 2 0 2 2 BLACK ROCK ANNUAL REPORT TO SHAREHOLDERS |
| | |
Schedule of Investments (continued) April 30, 2022 | | BlackRock Latin America Fund, Inc. |
Affiliates
Investments in issuers considered to be affiliate(s) of the Fund during the year ended April 30, 2022 for purposes of Section 2(a)(3) of the Investment Company Act of 1940, as amended, were as follows:
| | | | | | | | | | | | | | | | | | | | | | | | | | | | | | | | | | | | |
| Affiliated Issuer | | Value at
04/30/21 | | | Purchases
at Cost | | | Proceeds
from Sales
| | | Net
Realized
Gain (Loss) | | | Change in
Unrealized
Appreciation
(Depreciation) | | | Value at
04/30/22 | | | Shares
Held at
04/30/22
| | | Income | | | Capital Gain
Distributions
from
Underlying
Funds | |
BlackRock Liquidity Funds, T-Fund, Institutional Class | | $ | 208,850 | | | $ | 374,870 | (a) | | $ | — | | | $ | — | | | $ | — | | | $ | 583,720 | | | | 583,720 | | | $ | 210 | | | $ | — | |
SL Liquidity Series, LLC, Money Market Series | | | 2,443,987 | | | | — | | | | (1,881,163 | )(a) | | | 246 | | | | 47 | | | | 563,117 | | | | 563,173 | | | | 1,280 | | | | — | |
| | | | | | | | | | | | | | | | | | | | | | | | | | | | | | | | | | | | |
| | | | | | | | | | | | | | $ | 246 | | | $ | 47 | | | $ | 1,146,837 | | | | | | | $ | 1,490 | | | $ | — | |
| | | | | | | | | | | | | | | | | | | | | | | | | | | | | | | | | | | | |
| | (a) | Represents net amount purchased (sold). | |
Fair Value Hierarchy as of Period End
Various inputs are used in determining the fair value of financial instruments. For a description of the input levels and information about the Fund’s policy regarding valuation of financial instruments, refer to the Notes to Financial Statements.
The following table summarizes the Fund’s financial instruments categorized in the fair value hierarchy. The breakdown of the Fund’s financial instruments into major categories is disclosed in the Schedule of Investments above.
| | | | | | | | | | | | | | | | |
| | | Level 1 | | | Level 2 | | | Level 3 | | | Total | |
| | | | |
Assets | | | | | | | | | | | | | | | | |
Investments | | | | | | | | | | | | | | | | |
Long-Term Investments | | | | | | | | | | | | | | | | |
Common Stocks | | $ | 59,823,878 | | | $ | — | | | $ | — | | | $ | 59,823,878 | |
Corporate Bonds | | | — | | | | — | | | | 4,999 | | | | 4,999 | |
Preferred Securities | | | | | | | | | | | | | | | | |
Preferred Stocks | | | 1,987,531 | | | | — | | | | — | | | | 1,987,531 | |
Short-Term Securities | | | | | | | | | | | | | | | | |
Money Market Funds | | | 583,720 | | | | — | | | | — | | | | 583,720 | |
Time Deposits | | | — | | | | 2,318 | | | | — | | | | 2,318 | |
| | | | | | | | | | | | | | | | |
| | $ | 62,395,129 | | | $ | 2,318 | | | $ | 4,999 | | | | 62,402,446 | |
| | | | | | | | | | | | | | | | |
Investments Valued at NAV(a) | | | | | | | | | | | | | | | 563,117 | |
| | | | | | | | | | | | | | | | |
| | | | | | | | | | | | | | $ | 62,965,563 | |
| | | | | | | | | | | | | | | | |
| | (a) | Certain investments of the Fund were fair valued using NAV per share as no quoted market value is available and therefore have been excluded from the fair value hierarchy. | |
See notes to financial statements.
| | |
SCHEDULE OF INVESTMENTS | | 23 |
| | |
Schedule of Investments April 30, 2022 | | BlackRock Unconstrained Equity Fund (Percentages shown are based on Net Assets) |
| | | | | | | | | | |
| Security | | | | Shares | | | Value | |
| | | |
Common Stocks | | | | | | | | | | |
| | | |
| Denmark — 4.2% | | | | | | | | |
Novo Nordisk A/S, Class B | | | | | 96,597 | | | $ | 11,033,911 | |
| | | | | | | | | | |
| | | |
| France — 8.2% | | | | | | | | |
LVMH Moet Hennessy Louis Vuitton SE | | | | | 33,029 | | | | 21,374,222 | |
| | | | | | | | | | |
| | | |
| Italy — 3.1% | | | | | | | | |
Ferrari NV | | | | | 38,785 | | | | 8,166,366 | |
| | | | | | | | | | |
| | | |
| Netherlands — 7.5% | | | | | | | | |
ASML Holding NV | | | | | 34,281 | | | | 19,455,787 | |
| | | | | | | | | | |
| | | |
| Switzerland — 4.3% | | | | | | | | |
Lonza Group AG, Registered Shares | | | | | 19,067 | | | | 11,242,548 | |
| | | | | | | | | | |
| | | |
| United Kingdom — 4.5% | | | | | | | | |
Auto Trader Group PLC(a) | | | | | 675,424 | | | | 5,330,553 | |
Spirax-Sarco Engineering PLC | | | | | 41,544 | | | | 6,268,804 | |
| | | | | | | | | | |
| | | |
| | | | | | | | | 11,599,357 | |
| | | |
| United States — 65.2% | | | | | | | | |
Alphabet, Inc., Class C(b) | | | | | 6,670 | | | | 15,336,531 | |
ANSYS, Inc.(b) | | | | | 33,581 | | | | 9,257,946 | |
Cadence Design Systems, Inc.(b) | | | | | 87,168 | | | | 13,149,293 | |
Costco Wholesale Corp. | | | | | 22,341 | | | | 11,879,156 | |
Edwards Lifesciences Corp.(b) | | | | | 85,454 | | | | 9,039,324 | |
Floor & Decor Holdings, Inc., Class A(b) | | | | | 60,898 | | | | 4,854,789 | |
Intuit, Inc. | | | | | 22,780 | | | | 9,539,125 | |
Intuitive Surgical, Inc.(b) | | | | | 32,132 | | | | 7,689,188 | |
Masimo Corp.(b) | | | | | 25,326 | | | | 2,861,078 | |
Mastercard, Inc., Class A | | | | | 71,224 | | | | 25,881,377 | |
Microsoft Corp. | | | | | 66,607 | | | | 18,484,775 | |
NIKE, Inc., Class B | | | | | 57,985 | | | | 7,230,729 | |
S&P Global, Inc. | | | | | 33,608 | | | | 12,653,412 | |
VeriSign, Inc.(b) | | | | | 59,485 | | | | 10,629,375 | |
Verisk Analytics, Inc. | | | | | 55,388 | | | | 11,301,921 | |
| | | | | | | | | | |
| | | |
| | | | | | | | | 169,788,019 | |
| | | | | | | | | | |
| | | |
Total Common Stocks — 97.0%
(Cost: $249,047,187) | | | | | | | |
| 252,660,210
|
|
| | | | | | | | | | |
| | | |
| | | | | Par (000) | | | | |
| | | |
Corporate Bonds | | | | | | | | | | |
| | | |
| China — 0.0% | | | | | | | | |
China Milk Products Group Ltd., 0.00%, 01/15/49(b)(c)(d)(e) | | USD | | | 1,000 | | | | 1 | |
| | | | | | | | | | |
| | | |
Total Corporate Bonds — 0.0%
(Cost: $1,000,000) | | | | | | | | | 1 | |
| | | | | | | | | | |
| | | |
Total Long-Term Investments — 97.0%
(Cost: $250,047,187) | | | | | | | | | 252,660,211 | |
| | | | | | | | | | |
| | | | | | | | | | |
| Security | | | | Shares | | | Value | |
| | | |
Short-Term Securities | | | | | | | | | | |
| | | |
| Money Market Funds — 3.0% | | | | | | | | |
BlackRock Liquidity Funds, T-Fund, Institutional Class, 0.29%(f)(g) | | | | | 7,783,672 | | | $ | 7,783,672 | |
| | | | | | | | | | |
| | | |
| | | | | Par (000) | | | | |
| | | |
| Time Deposits — 0.1% | | | | | | | | |
| | | |
| Europe — 0.1% | | | | | | | | |
BNP Paribas N.A., (0.78%), 05/03/22 | | EUR | | | 197 | | | | 207,321 | |
| | | | | | | | | | |
| | | |
Total Short-Term Securities — 3.1%
(Cost: $7,990,993) | | | | | | | 7,990,993 | |
| | | | | | | | | | |
| | | |
Total Investments — 100.1%
(Cost: $258,038,180) | | | | | | | | | 260,651,204 | |
| |
Liabilities in Excess of Other Assets — (0.1)% | | | | (333,759 | ) |
| | | | | | | | | | |
| | | |
Net Assets — 100.0% | | | | | | | | $ | 260,317,445 | |
| | | | | | | | | | |
| (a) | Security exempt from registration pursuant to Rule 144A under the Securities Act of 1933, as amended. These securities may be resold in transactions exempt from registration to qualified institutional investors. |
| (b) | Non-income producing security. |
| (d) | Issuer filed for bankruptcy and/or is in default. |
| (e) | Security is valued using significant unobservable inputs and is classified as Level 3 in the fair value hierarchy. |
| (f) | Affiliate of the Fund. |
| (g) | Annualized 7-day yield as of period end. |
| | |
| 24 | | 2 0 2 2 BLACK ROCK ANNUAL REPORT TO SHAREHOLDERS |
| | |
Schedule of Investments (continued) April 30, 2022 | | BlackRock Unconstrained Equity Fund |
Affiliates
Investments in issuers considered to be affiliate(s) of the Fund during the year ended April 30, 2022 for purposes of Section 2(a)(3) of the Investment Company Act of 1940, as amended, were as follows:
| | | | | | | | | | | | | | | | | | | | | | | | | | | | | | | | | | | | |
| Affiliated Issuer | | Value at
04/30/21 | | | Purchases
at Cost | | | Proceeds
from Sales | | | Net
Realized
Gain (Loss) | | | Change in
Unrealized
Appreciation
(Depreciation) | | | Value at
04/30/22 | | | Shares Held at
04/30/22 | | | Income
| | | Capital Gain
Distributions
from
Underlying
Funds | |
| | | | | | | | | |
BlackRock Liquidity Funds, T-Fund, Institutional Class | | $ | 759,284 | | | $ | 7,024,388 | (a) | | $ | — | | | $ | — | | | $ | — | | | $ | 7,783,672 | | | | 7,783,672 | | | $ | 2,688 | | | $ | — | |
SL Liquidity Series, LLC, Money Market Series | | | — | | | | 108 | (a) | | | — | | | | (108 | ) | | | — | | | | — | | | | — | | | | 825 | (b) | | | — | |
| | | | | | | | | | | | | | | | | | | | | | | | | | | | | | | | | | | | |
| | | | | | | | | | | | | | $ | (108 | ) | | $ | — | | | $ | 7,783,672 | | | | | | | $ | 3,513 | | | $ | — | |
| | | | | | | | | | | | | | | | | | | | | | | | | | | | | | | | | | | | |
| | (a) | Represents net amount purchased (sold). | |
| | (b) | All or a portion represents securities lending income earned from the reinvestment of cash collateral from loaned securities, net of fees and collateral investment expenses, and other payments to and from borrowers of securities. | |
Derivative Financial Instruments Outstanding as of Period End
Futures Contracts
| | | | | | | | | | | | | | | | |
| Description | | Number of
Contracts | | | Expiration
Date | | | Notional
Amount (000) | | | Value/
Unrealized
Appreciation
(Depreciation) | |
| | | | |
Long Contracts | | | | | | | | | | | | | | | | |
S&P 500 E-Mini Index | | | 37 | | | | 06/17/22 | | | $ | 7,636 | | | $ | (120,722 | ) |
| | | | | | | | | | | | | | | | |
Derivative Financial Instruments Categorized by Risk Exposure
As of period end, the fair values of derivative financial instruments located in the Statements of Assets and Liabilities were as follows:
| | | | | | | | | | | | | | | | | | | | | | | | | | | | |
| | | Commodity
Contracts | | | Credit
Contracts | | | Equity
Contracts | | | Foreign
Currency
Exchange
Contracts | | | Interest
Rate
Contracts | | | Other
Contracts | | | Total | |
| | | | | | | |
| Liabilities — Derivative Financial Instruments | | | | | | | | | | | | | | | | | | | | | |
Futures contracts | | | | | | | | | | | | | | | | | | | | | | | | | | | | |
Unrealized depreciation on futures contracts(a) | | $ | — | | | $ | — | | | $ | 120,722 | | | $ | — | | | $ | — | | | $ | — | | | $ | 120,722 | |
| | | | | | | | | | | | | | | | | | | | | | | | | | | | |
| | (a) | Net cumulative unrealized appreciation (depreciation) on futures contracts and centrally cleared swaps, if any, are reported in the Schedule of Investments. In the Statements of Assets and Liabilities, only current day’s variation margin is reported in receivables or payables and the net cumulative unrealized appreciation (depreciation) is included in accumulated earnings (loss). | |
For the period ended April 30, 2022, the effect of derivative financial instruments in the Statements of Operations was as follows:
| | | | | | | | | | | | | | | | | | | | | | | | | | | | |
| | | Commodity
Contracts | | | Credit
Contracts | | | Equity
Contracts | | | Foreign
Currency
Exchange
Contracts | | | Interest
Rate
Contracts | | | Other
Contracts | | | Total | |
| | | | | | | |
| Net Realized Gain (Loss) from: | | | | | | | | | | | | | | | | | | | | | |
Futures contracts | | $ | — | | | $ | — | | | $ | (223,397) | | | $ | — | | | $ | — | | | $ | — | | | $ | (223,397 | ) |
| | | | | | | | | | | | | | | | | | | | | | | | | | | | |
| | | | | | | |
| Net Change in Unrealized Appreciation (Depreciation) on: | | | | | | | | | | | | | | | | | | | | | |
Futures contracts | | $ | — | | | $ | — | | | $ | (120,722) | | | $ | — | | | $ | — | | | $ | — | | | $ | (120,722 | ) |
| | | | | | | | | | | | | | | | | | | | | | | | | | | | |
Average Quarterly Balances of Outstanding Derivative Financial Instruments
| | | | |
| | |
Futures contracts: | | | | |
Average notional value of contracts — long | | $ | 1,908,969 | |
For more information about the Fund’s investment risks regarding derivative financial instruments, refer to the Notes to Financial Statements.
| | |
SCHEDULE OF INVESTMENTS | | 25 |
| | |
Schedule of Investments (continued) April 30, 2022 | | BlackRock Unconstrained Equity Fund |
Fair Value Hierarchy as of Period End
Various inputs are used in determining the fair value of financial instruments. For a description of the input levels and information about the Fund’s policy regarding valuation of financial instruments, refer to the Notes to Financial Statements.
The following table summarizes the Fund’s financial instruments categorized in the fair value hierarchy. The breakdown of the Fund’s financial instruments into major categories is disclosed in the Schedule of Investments above.
| | | | | | | | | | | | | | | | |
| | | Level 1 | | | Level 2 | | | Level 3 | | | Total | |
| | | | |
Assets | | | | | | | | | | | | | | | | |
Investments | | | | | | | | | | | | | | | | |
Long-Term Investments | | | | | | | | | | | | | | | | |
Common Stocks | | | | | | | | | | | | | | | | |
Denmark | | $ | — | | | $ | 11,033,911 | | | $ | — | | | $ | 11,033,911 | |
France | | | — | | | | 21,374,222 | | | | — | | | | 21,374,222 | |
Italy | | | — | | | | 8,166,366 | | | | — | | | | 8,166,366 | |
Netherlands | | | — | | | | 19,455,787 | | | | — | | | | 19,455,787 | |
Switzerland | | | — | | | | 11,242,548 | | | | — | | | | 11,242,548 | |
United Kingdom | | | — | | | | 11,599,357 | | | | — | | | | 11,599,357 | |
United States | | | 169,788,019 | | | | — | | | | — | | | | 169,788,019 | |
Corporate Bonds | | | — | | | | — | | | | 1 | | | | 1 | |
Short-Term Securities | | | | | | | | | | | | | | | | |
Money Market Funds | | | 7,783,672 | | | | — | | | | — | | | | 7,783,672 | |
Time Deposits | | | — | | | | 207,321 | | | | — | | | | 207,321 | |
| | | | | | | | | | | | | | | | |
| | $ | 177,571,691 | | | $ | 83,079,512 | | | $ | 1 | | | $ | 260,651,204 | |
| | | | | | | | | | | | | | | | |
Derivative Financial Instruments(a) | | | | | | | | | | | | | | | | |
Liabilities | | | | | | | | | | | | | | | | |
Equity Contracts | | $ | (120,722 | ) | | $ | — | | | $ | — | | | $ | (120,722 | ) |
| | | | | | | | | | | | | | | | |
| | (a) | Derivative financial instruments are futures contracts. Futures contracts are valued at the unrealized appreciation (depreciation) on the instrument. | |
See notes to financial statements.
| | |
| 26 | | 2 0 2 2 BLACK ROCK ANNUAL REPORT TO SHAREHOLDERS |
| | |
Schedule of Investments April 30, 2022 | | BlackRock Sustainable Emerging Markets Equity Fund (Percentages shown are based on Net Assets) |
| | | | | | | | |
| Security | | Shares | | | Value | |
| | |
Common Stocks | | | | | | | | |
| | |
| Austria — 0.2% | | | | | | |
Raiffeisen Bank International AG | | | 20,549 | | | $ | 233,916 | |
| | | | | | | | |
| | |
| Brazil — 4.8% | | | | | | |
Arezzo Industria e Comercio SA | | | 80,041 | | | | 1,448,491 | |
B3 SA - Brasil Bolsa Balcao | | | 701,459 | | | | 1,887,035 | |
Hapvida Participacoes e Investimentos SA(a) | | | 921,249 | | | | 1,634,190 | |
| | | | | | | | |
| | |
| | | | | | | 4,969,716 | |
| | |
| China — 22.6% | | | | | | |
Alibaba Group Holding Ltd.(b) | | | 173,692 | | | | 2,118,639 | |
Alibaba Group Holding Ltd., ADR(b) | | | 15,050 | | | | 1,461,204 | |
China Mengniu Dairy Co. Ltd. | | | 311,000 | | | | 1,678,473 | |
China Merchants Bank Co. Ltd., Class H | | | 237,000 | | | | 1,428,457 | |
Haier Smart Home Co. Ltd., Class A | | | 253,200 | | | | 976,649 | |
Haier Smart Home Co. Ltd., Class H | | | 309,200 | | | | 1,092,340 | |
Hangzhou Silan Microelectronics Co. Ltd. | | | 188,300 | | | | 1,166,779 | |
Longfor Group Holdings Ltd.(a) | | | 425,000 | | | | 2,104,848 | |
LONGi Green Energy Technology Co. Ltd., Class A | | | 269,293 | | | | 2,707,936 | |
Sungrow Power Supply Co. Ltd., Class A | | | 105,200 | | | | 986,577 | |
Tencent Holdings Ltd. | | | 68,300 | | | | 3,218,630 | |
Tencent Holdings Ltd., ADR | | | 3,142 | | | | 147,894 | |
Topsports International Holdings Ltd.(a) | | | 1,096,000 | | | | 838,276 | |
Xinyi Solar Holdings Ltd. | | | 1,128,000 | | | | 1,676,687 | |
Yum China Holdings, Inc. | | | 37,178 | | | | 1,554,040 | |
| | | | | | | | |
| | |
| | | | | | | 23,157,429 | |
| | |
| Egypt — 1.0% | | | | | | |
Commercial International Bank Egypt SAE | | | 415,408 | | | | 1,002,976 | |
| | | | | | | | |
| | |
| Greece — 1.6% | | | | | | |
National Bank of Greece SA(b) | | | 421,689 | | | | 1,672,620 | |
| | | | | | | | |
| | |
| Hong Kong — 3.5% | | | | | | |
AIA Group Ltd. | | | 188,200 | | | | 1,848,831 | |
Hang Lung Properties Ltd. | | | 935,000 | | | | 1,788,253 | |
| | | | | | | | |
| | |
| | | | | | | 3,637,084 | |
| | |
| Hungary — 0.8% | | | | | | |
OTP Bank Nyrt(b) | | | 28,232 | | | | 842,144 | |
| | | | | | | | |
| | |
| India — 9.8% | | | | | | |
Axis Bank Ltd. | | | 301,445 | | | | 2,841,583 | |
Bandhan Bank Ltd.(a) | | | 657,168 | | | | 2,849,713 | |
ICICI Bank Ltd. | | | 91,312 | | | | 877,788 | |
ICICI Bank Ltd., ADR | | | 46,145 | | | | 878,601 | |
Infosys Ltd. | | | 64,637 | | | | 1,310,010 | |
Infosys Ltd., ADR | | | 64,097 | | | | 1,273,607 | |
| | | | | | | | |
| | |
| | | | | | | 10,031,302 | |
| | |
| Indonesia — 1.8% | | | | | | |
Bank Rakyat Indonesia Persero Tbk PT | | | 5,484,000 | | | | 1,827,198 | |
| | | | | | | | |
| | |
| Kazakhstan — 1.1% | | | | | | |
Kaspi.KZ JSC, GDR, Registered Shares | | | 18,052 | | | | 1,173,380 | |
| | | | | | | | |
| | |
| Malaysia — 1.6% | | | | | | |
Public Bank BHD | | | 1,501,500 | | | | 1,613,882 | |
| | | | | | | | |
| | |
| Mexico — 5.8% | | | | | | |
Arca Continental SAB de CV | | | 191,710 | | | | 1,216,501 | |
| | | | | | | | |
| Security | | Shares | | | Value | |
| | |
| Mexico (continued) | | | | | | |
Grupo Financiero Banorte SAB de CV, Class O | | | 267,588 | | | $ | 1,766,436 | |
Wal-Mart de Mexico SAB de CV(c) | | | 838,868 | | | | 2,966,345 | |
| | | | | | | | |
| | |
| | | | | | | 5,949,282 | |
| | |
| Panama — 1.4% | | | | | | |
Copa Holdings SA, Class A(b) | | | 19,285 | | | | 1,453,510 | |
| | | | | | | | |
| | |
| Poland — 1.1% | | | | | | |
Bank Polska Kasa Opieki SA | | | 35,726 | | | | 785,088 | |
LPP SA | | | 146 | | | | 308,524 | |
| | | | | | | | |
| | |
| | | | | | | 1,093,612 | |
| | |
| Russia — 0.0% | | | | | | |
TCS Group Holding PLC, GDR, Registered Shares(d) | | | 30,476 | | | | 305 | |
| | | | | | | | |
| | |
| South Africa — 2.9% | | | | | | |
Gold Fields Ltd. | | | 53,178 | | | | 720,539 | |
Gold Fields Ltd., ADR | | | 52,206 | | | | 701,126 | |
Life Healthcare Group Holdings Ltd. | | | 1,125,594 | | | | 1,533,816 | |
| | | | | | | | |
| | |
| | | | | | | 2,955,481 | |
| | |
| South Korea — 10.2% | | | | | | |
Hana Financial Group, Inc. | | | 43,785 | | | | 1,625,593 | |
Samsung Electronics Co. Ltd. | | | 103,561 | | | | 5,519,133 | |
Samsung SDI Co. Ltd. | | | 3,589 | | | | 1,709,635 | |
SK Innovation Co. Ltd.(b) | | | 10,186 | | | | 1,621,164 | |
| | | | | | | | |
| | |
| | | | | | | 10,475,525 | |
| | |
| Taiwan — 12.6% | | | | | | |
Accton Technology Corp. | | | 243,000 | | | | 1,895,368 | |
Far EasTone Telecommunications Co. Ltd.(b) | | | 469,000 | | | | 1,317,772 | |
Taiwan Semiconductor Manufacturing Co. Ltd. | | | 540,000 | | | | 9,764,628 | |
| | | | | | | | |
| | |
| | | | | | | 12,977,768 | |
| | |
| Thailand — 3.5% | | | | | | |
Advanced Info Service PCL, NVDR | | | 251,200 | | | | 1,570,529 | |
Bangkok Dusit Medical Services PCL, NVDR | | | 2,709,600 | | | | 2,028,238 | |
| | | | | | | | |
| | |
| | | | | | | 3,598,767 | |
| | |
| United Arab Emirates — 3.6% | | | | | | |
Abu Dhabi Commercial Bank PJSC | | | 688,836 | | | | 1,904,170 | |
Aldar Properties PJSC | | | 1,168,439 | | | | 1,790,280 | |
| | | | | | | | |
| | |
| | | | | | | 3,694,450 | |
| | |
| United Kingdom — 3.0% | | | | | | |
Prudential PLC | | | 88,795 | | | | 1,105,360 | |
Standard Chartered PLC | | | 284,933 | | | | 1,947,894 | |
| | | | | | | | |
| | |
| | | | | | | 3,053,254 | |
| | |
| United States — 1.5% | | | | | | |
Albemarle Corp. | | | 8,216 | | | | 1,584,291 | |
| | | | | | | | |
| | |
Total Common Stocks — 94.4%
(Cost: $95,006,376) | | | | | | | 96,997,892 | |
| | | | | | | | |
| | |
SCHEDULE OF INVESTMENTS | | 27 |
| | |
Schedule of Investments (continued) April 30, 2022 | | BlackRock Sustainable Emerging Markets Equity Fund (Percentages shown are based on Net Assets) |
| | | | | | | | |
| Security | | Shares | | | Value | |
| | |
| Preferred Securities | | | | | | |
| | |
| Preferred Stocks — 0.3% | | | | | | |
| | |
| South Korea — 0.3% | | | | | | |
Samsung Electronics Co. Ltd., Preference Shares | | | 5,964 | | | $ | 279,614 | |
| | | | | | | | |
| | |
Total Preferred Securities — 0.3%
(Cost: $190,127) | | | | | | | 279,614 | |
| | | | | | | | |
| | |
Total Long-Term Investments — 94.7%
(Cost: $95,196,503) | | | | | | | 97,277,506 | |
| | | | | | | | |
| | |
| Short-Term Securities | | | | | | |
| | |
| Money Market Funds — 6.8% | | | | | | |
BlackRock Liquidity Funds, T-Fund, Institutional Class, 0.29%(e)(f) | | | 5,275,604 | | | | 5,275,604 | |
SL Liquidity Series, LLC, Money Market Series, 0.47%(e)(g) | | | 1,689,958 | | | | 1,689,789 | |
| | | | | | | | |
| | |
Total Short-Term Securities — 6.8%
(Cost: $6,965,351) | | | | | | | 6,965,393 | |
| | | | | | | | |
| | |
Total Investments — 101.5%
(Cost: $102,161,854) | | | | | | | 104,242,899 | |
| |
Liabilities in Excess of Other Assets — (1.5)% | | | | (1,534,550 | ) |
| | | | | | | | |
| | |
Net Assets — 100.0% | | | | | | $ | 102,708,349 | |
| | | | | | | | |
| (a) | Security exempt from registration pursuant to Rule 144A under the Securities Act of 1933, as amended. These securities may be resold in transactions exempt from registration to qualified institutional investors. |
| (b) | Non-income producing security. |
| (c) | All or a portion of this security is on loan. |
| (d) | Security is valued using significant unobservable inputs and is classified as Level 3 in the fair value hierarchy. |
| (e) | Affiliate of the Fund. |
| (f) | Annualized 7-day yield as of period end. |
| (g) | All or a portion of this security was purchased with the cash collateral from loaned securities. |
Affiliates
Investments in issuers considered to be affiliate(s) of the Fund during the year ended April 30, 2022 for purposes of Section 2(a)(3) of the Investment Company Act of 1940, as amended, were as follows:
| | | | | | | | | | | | | | | | | | | | | | | | | | | | | | | | | | | | |
| Affiliated Issuer | | Value at
04/30/21 | | | Purchases at Cost | | | Proceeds
from Sales | | | Net
Realized
Gain (Loss) | | | Change in
Unrealized
Appreciation
(Depreciation) | | | Value at
04/30/22 | | | Shares
Held at
04/30/22 | | | Income | | | Capital Gain
Distributions
from
Underlying
Funds | |
BlackRock Liquidity Funds, T-Fund, Institutional Class | | $ | 3,673,714 | | | $ | 1,601,890 | (a) | | $ | — | | | $ | — | | | $ | — | | | $ | 5,275,604 | | | | 5,275,604 | | | $ | 2,117 | | | $ | — | |
SL Liquidity Series, LLC, Money Market Series | | | 1,407,844 | | | | 281,872 | (a) | | | — | | | | 31 | | | | 42 | | | | 1,689,789 | | | | 1,689,958 | | | | 3,139 | (b) | | | — | |
| | | | | | | | | | | | | | | | | | | | | | | | | | | | | | | | | | | | |
| | | | | | | | | | | | | | $ | 31 | | | $ | 42 | | | $ | 6,965,393 | | | | | | | $ | 5,256 | | | $ | — | |
| | | | | | | | | | | | | | | | | | | | | | | | | | | | | | | | | | | | |
| | (a) | Represents net amount purchased (sold). | |
| | (b) | All or a portion represents securities lending income earned from the reinvestment of cash collateral from loaned securities, net of fees and collateral investment expenses, and other payments to and from borrowers of securities. | |
Derivative Financial Instruments Outstanding as of Period End
OTC Total Return Swaps
| | | | | | | | | | | | | | | | | | | | | | | | | | | | |
| | | | | | | | |
| Reference Entity | | Payment
Frequency | | | Counterparty(a) | | | Termination
Date | | | Net Notional | | | Accrued
Unrealized
Appreciation
(Depreciation) | | | Net Value of
Reference
Entity | | | Gross
Notional
Amount
Net Asset
Percentage | |
| | | | | | | |
Equity Securities Long | | | Monthly | | | | HSBC Bank PLC(b) | | | | 02/13/23 | | | $ | 2,658,540 | | | $ | (253,511 | )(c) | | $ | 2,406,740 | | | | 2.6 | % |
| | | | | | | |
| | | Monthly | | | | JPMorgan Chase Bank N.A.(d) | | | | 02/08/23 | | | | 611,615 | | | | (47,017 | )(e) | | | 549,922 | | | | 0.6 | |
| | | | | | | | | | | | | | | | | | | | | | | | | | | | |
| | | | | | | |
| | | | | | | | | | | | | | | | | | $ | (300,528 | ) | | $ | 2,956,662 | | | | | |
| | | | | | | | | | | | | | | | | | | | | | | | | | | | |
| | (a) | The Fund receives the total return on a portfolio of long positions underlying the total return swap. The Fund pays the total return on a portfolio of short positions underlying the total return swap. In addition, the Fund pays or receives a variable rate of interest, based on a specified benchmark. The benchmark and spread are determined based upon the country and/or currency of the individual underlying positions. | |
| | (c) | Amount includes $(1,711) of net dividends and financing fees. | |
| | (e) | Amount includes $14,676 of net dividends and financing fees. | |
| | |
| 28 | | 2 0 2 2 BLACK ROCK ANNUAL REPORT TO SHAREHOLDERS |
| | |
Schedule of Investments (continued) April 30, 2022 | | BlackRock Sustainable Emerging Markets Equity Fund |
OTC Total Return Swaps (continued)
The following are the specified benchmarks (plus or minus a range) used in determining the variable rate of interest:
| | | | |
| | (b) | | (d) |
| Range: | | 80 basis points | | 60 basis points |
| Benchmarks: | | USD - 1D Overnight Bank Funding Rate (OBFR01) | | USD - 1D Overnight Bank Funding Rate (OBFR01) |
The following table represents the individual long positions and related values of the equity securities underlying the total return swap with HSBC Bank PLC as of period end, termination date Feburary 13, 2023:
| | | | | | | | | | | | |
Security | | Shares | | | Value | | | % of
Basket
Value | |
| |
| Reference Entity — Long | | | | |
| | | |
Common Stocks | | | | | | | | | | | | |
| | | |
Saudi Arabia | | | | | | | | | | | | |
Nahdi Medical Co | | | 22,599 | | | $ | 1,006,194 | | | | 41.8 | % |
| | | | | | | | | | | | |
| | | |
Total Saudi Arabia | | | | | | | 1,006,194 | | | | | |
United Kingdom | | | | | | | | | | | | |
Leejam Sports Co Jsc | | | 47,497 | | | | 1,400,546 | | | | 58.2 | |
| | | | | | | | | | | | |
Total United Kingdom | | | | | | | 1,400,546 | | | | | |
| | | | | | | | | | | | |
| | |
Net Value of Reference Entity — HSBC Bank PLC | | | $ | 2,406,740 | | | | | |
| | | | | | | | | | | | |
The following table represents the individual long positions and related values of the equity securities underlying the total return swap with JPMorgan Chase Bank N.A as of period end, termination date Feburary 8, 2023:
| | | | | | | | | | | | |
Security | | Shares | | | Value | | | % of
Basket
Value | |
| |
| Reference Entity — Long | | | | |
| | | |
Common Stocks | | | | | | | | | | | | |
| | | |
United Kingdom | | | | | | | | | | | | |
Prudential PLC | | | 34,549 | | | $ | 430,081 | | | | 78.2 | % |
Standard Chartered PLC | | | 17,530 | | | | 119,841 | | | | 21.8 | |
| | | | | | | | | | | | |
| | |
Net Value of Reference Entity — JPMorgan Chase Bank N.A. | | | $ | 549,922 | | | | | |
| | | | | | | | | | | | |
Balances Reported in the Statements of Assets and Liabilities for OTC Swaps
| | | | | | | | | | | | | | | | |
Description | | Swap
Premiums
Paid | | | Swap
Premiums
Received | | | Unrealized
Appreciation | | | Unrealized
Depreciation | |
OTC Swaps | | $ | — | | | $ | — | | | $ | — | | | $ | (300,528 | ) |
Derivative Financial Instruments Categorized by Risk Exposure
As of period end, the fair values of derivative financial instruments located in the Statements of Assets and Liabilities were as follows:
| | | | | | | | | | | | | | | | | | | | | | | | | | | | |
| | | Commodity
Contracts | | | Credit
Contracts | | | Equity
Contracts | | | Foreign
Currency
Exchange
Contracts | | | Interest
Rate
Contracts | | | Other
Contracts | | | Total | |
| | | | | | | |
| Liabilities — Derivative Financial Instruments | | | | | | | | | | | | | | | | | | | | | |
Swaps — OTC | | | | | | | | | | | | | | | | | | | | | | | | | | | | |
Unrealized depreciation on OTC swaps; Swap premiums received | | $ | — | | | $ | — | | | $ | 300,528 | | | $ | — | | | $ | — | | | $ | — | | | $ | 300,528 | |
| | | | | | | | | | | | | | | | | | | | | | | | | | | | |
For the period ended April 30, 2022, the effect of derivative financial instruments in the Statements of Operations was as follows:
| | | | | | | | | | | | | | | | | | | | | | | | | | | | |
| | | Commodity
Contracts | | | Credit
Contracts | | | Equity
Contracts | | | Foreign
Currency
Exchange
Contracts | | | Interest
Rate
Contracts | | | Other
Contracts | | | Total | |
| | | | | | | |
| Net Realized Gain (Loss) from: | | | | | | | | | | | | | | | | | | | | | |
Futures contracts | | $ | — | | | $ | — | | | $ | (470,051 | ) | | $ | — | | | $ | — | | | $ | — | | | $ | (470,051 | ) |
Swaps | | | — | | | | — | | | | 426,268 | | | | — | | | | — | | | | — | | | | 426,268 | |
| | | | | | | | | | | | | | | | | | | | | | | | | | | | |
| | $ | — | | | $ | — | | | $ | (43,783 | ) | | $ | — | | | $ | — | | | $ | — | | | $ | (43,783 | ) |
| | | | | | | | | | | | | | | | | | | | | | | | | | | | |
| | | | | |
| Net Change in Unrealized Appreciation (Depreciation) on: | | | | | | | | | | | | | | | | |
Swaps | | $ | — | | | $ | — | | | $ | (345,238 | ) | | $ | — | | | $ | — | | | $ | — | | | $ | (345,238 | ) |
| | | | | | | | | | | | | | | | | | | | | | | | | | | | |
| | |
SCHEDULE OF INVESTMENTS | | 29 |
| | |
Schedule of Investments (continued) April 30, 2022 | | BlackRock Sustainable Emerging Markets Equity Fund |
Average Quarterly Balances of Outstanding Derivative Financial Instruments
| | | | |
| | |
Futures contracts: | | | | |
Average notional value of contracts — long | | $ | — | (a) |
Total return swaps: | | | | |
Average notional value | | $ | 2,042,119 | |
| | (a) | Derivative not held at any quarter-end. The risk exposure table serves as an indicator of activity during the period. | |
For more information about the Fund’s investment risks regarding derivative financial instruments, refer to the Notes to Financial Statements.
Derivative Financial Instruments — Offsetting as of Period End
The Fund’s derivative assets and liabilities (by type) were as follows:
| | | | | | | | |
| | | Assets | | | Liabilities | |
| | |
Derivative Financial Instruments
Swaps — OTC(a) | | $ | — | | | $ | 300,528 | |
| | | | | | | | |
Total derivative assets and liabilities in the Statements of Assets and Liabilities | | | — | | | | 300,528 | |
| | | | | | | | |
Derivatives not subject to a Master Netting Agreement or similar agreement (“MNA”) | | | — | | | | — | |
| | | | | | | | |
Total derivative assets and liabilities subject to an MNA | | $ | — | | | $ | 300,528 | |
| | | | | | | | |
| | (a) | Includes unrealized appreciation (depreciation) on OTC swaps and swap premiums (paid/received) in the Statements of Assets and Liabilities. | |
The following table presents the Fund’s derivative liabilities by counterparty net of amounts available for offset under an MNA and net of the related collateral pledged by the Fund:
| | | | | | | | | | | | | | | | | | | | |
Counterparty | |
| Derivative
Liabilities
Subject to
an MNA by
Counterparty |
| |
| Derivatives
Available
for Offset |
| |
| Non-Cash
Collateral
Pledged |
| |
| Cash
Collateral
Pledged |
| |
| Net Amount
of Derivative
Liabilities |
(a) |
HSBC Bank PLC | | $ | 253,511 | | | $ | — | | | $ | — | | | $ | — | | | $ | 253,511 | |
JPMorgan Chase Bank N.A. | | | 47,017 | | | | — | | | | — | | | | — | | | | 47,017 | |
| | | | | | | | | | | | | | | | | | | | |
| | $ | 300,528 | | | $ | — | | | $ | — | | | $ | — | | | $ | 300,528 | |
| | | | | | | | | | | | | | | | | | | | |
| | (a) | Net amount represents the net amount receivable from the counterparty in the event of default. | |
Fair Value Hierarchy as of Period End
Various inputs are used in determining the fair value of financial instruments. For a description of the input levels and information about the Fund’s policy regarding valuation of financial instruments, refer to the Notes to Financial Statements.
The following table summarizes the Fund’s financial instruments categorized in the fair value hierarchy. The breakdown of the Fund’s financial instruments into major categories is disclosed in the Schedule of Investments above.
| | | | | | | | | | | | | | | | |
| | | Level 1 | | | Level 2 | | | Level 3 | | | Total | |
Assets | | | | | | | | | | | | | | | | |
Investments | | | | | | | | | | | | | | | | |
Long-Term Investments | | | | | | | | | | | | | | | | |
Common Stocks | | | | | | | | | | | | | | | | |
Austria | | $ | — | | | $ | 233,916 | | | $ | — | | | $ | 233,916 | |
Brazil | | | 4,969,716 | | | | — | | | | — | | | | 4,969,716 | |
China | | | 3,163,138 | | | | 19,994,291 | | | | — | | | | 23,157,429 | |
Egypt | | | — | | | | 1,002,976 | | | | — | | | | 1,002,976 | |
Greece | | | — | | | | 1,672,620 | | | | — | | | | 1,672,620 | |
Hong Kong | | | — | | | | 3,637,084 | | | | — | | | | 3,637,084 | |
Hungary | | | — | | | | 842,144 | | | | — | | | | 842,144 | |
India | | | 2,152,208 | | | | 7,879,094 | | | | — | | | | 10,031,302 | |
Indonesia | | | — | | | | 1,827,198 | | | | — | | | | 1,827,198 | |
Kazakhstan | | | 1,173,380 | | | | — | | | | — | | | | 1,173,380 | |
Malaysia | | | — | | | | 1,613,882 | | | | — | | | | 1,613,882 | |
Mexico | | | 5,949,282 | | | | — | | | | — | | | | 5,949,282 | |
Panama | | | 1,453,510 | | | | — | | | | — | | | | 1,453,510 | |
| | |
| 30 | | 2 0 2 2 BLACK ROCK ANNUAL REPORT TO SHAREHOLDERS |
| | |
Schedule of Investments (continued) April 30, 2022 | | BlackRock Sustainable Emerging Markets Equity Fund |
Fair Value Hierarchy as of Period End (continued)
| | | | | | | | | | | | | | | | |
| | | Level 1 | | | Level 2 | | | Level 3 | | | Total | |
| | | | |
Common Stocks (continued) | | | | | | | | | | | | | | | | |
| | | | |
Poland | | $ | — | | | $ | 1,093,612 | | | $ | — | | | $ | 1,093,612 | |
Russia | | | — | | | | — | | | | 305 | | | | 305 | |
South Africa | | | 2,234,942 | | | | 720,539 | | | | — | | | | 2,955,481 | |
South Korea | | | — | | | | 10,475,525 | | | | — | | | | 10,475,525 | |
Taiwan | | | — | | | | 12,977,768 | | | | — | | | | 12,977,768 | |
Thailand | | | — | | | | 3,598,767 | | | | — | | | | 3,598,767 | |
United Arab Emirates | | | — | | | | 3,694,450 | | | | — | | | | 3,694,450 | |
United Kingdom | | | — | | | | 3,053,254 | | | | — | | | | 3,053,254 | |
United States | | | 1,584,291 | | | | — | | | | — | | | | 1,584,291 | |
Preferred Securities | | | | | | | | | | | | | | | | |
Preferred Stocks | | | — | | | | 279,614 | | | | — | | | | 279,614 | |
Short-Term Securities | | | | | | | | | | | | | | | | |
Money Market Funds | | | 5,275,604 | | | | — | | | | — | | | | 5,275,604 | |
| | | | | | | | | | | | | | | | |
| | | | |
| | $ | 27,956,071 | | | $ | 74,596,734 | | | $ | 305 | | | | 102,553,110 | |
| | | | | | | | | | | | | | | | |
Investments Valued at NAV | | | | | | | | | | | | | | | 1,689,789 | |
| | | | | | | | | | | | | | | | |
| | | | | | | | | | | | | | $ | 104,242,899 | |
| | | | | | | | | | | | | | | | |
Derivative Financial Instruments | | | | | | | | | | | | | | | | |
Liabilities | | | | | | | | | | | | | | | | |
Equity Contracts | | $ | — | | | $ | (300,528 | ) | | $ | — | | | $ | (300,528 | ) |
| | | | | | | | | | | | | | | | |
A reconciliation of Level 3 financial instruments is presented when the Fund had a significant amount of Level 3 investments at the beginning and/or end of the year in relation to net assets. The following table is a reconciliation of Level 3 investments for which significant unobservable inputs were used in determining fair value:
| | | | | | | | | | | | |
| | | Common
Stocks | | | Preferred
Stocks | | | Total | |
Assets | | | | | | | | | | | | |
| | | |
Opening balance, as of April 30, 2021 | | $ | — | | | $ | 2,967,493 | | | $ | 2,967,493 | |
| | | |
Transfers into Level 3 | | | — | | | | — | | | | — | |
| | | |
Transfers out of Level 3 | | | — | | | | — | | | | — | |
| | | |
Accrued discounts/premiums | | | — | | | | — | | | | — | |
| | | |
Net realized gain (loss) | | | (1,803,357 | ) | | | 562,997 | | | | (1,240,360 | ) |
| | | |
Net change in unrealized appreciation (depreciation)(a)(b) | | | (1,651,170 | ) | | | (1,172,674 | ) | | | (2,823,844 | ) |
| | | |
Purchases | | | 3,657,833 | | | | — | | | | 3,657,833 | |
| | | |
Sales | | | (203,001 | ) | | | (2,357,816 | ) | | | (2,560,817 | ) |
| | | | | | | | | | | | |
| | | |
Closing balance, as of April 30, 2022 | | $ | 305 | | | $ | — | | | $ | 305 | |
| | | | | | | | | | | | |
| | | |
Net change in unrealized appreciation (depreciation) on investments still held at April 30, 2022(b) | | $ | (1,651,170 | ) | | $ | — | | | $ | (1,651,170 | ) |
| | | | | | | | | | | | |
| | (a) | Included in the related net change in unrealized appreciation (depreciation) in the Statements of Operations. | |
| | (b) | Any difference between net change in unrealized appreciation (depreciation) and net change in unrealized appreciation (depreciation) on investments still held at April 30, 2022 is generally due to investments no longer held or categorized as Level 3 at period end. | |
See notes to financial statements.
| | |
SCHEDULE OF INVESTMENTS | | 31 |
Statements of Assets and Liabilities
April 30, 2022
| | | | | | | | | | | | | | | | |
| | | BlackRock Emerging Markets Fund, Inc. | | | BlackRock Latin America
Fund, Inc. | | | BlackRock
Unconstrained
Equity Fund | | | BlackRock
Sustainable
Emerging Markets Equity Fund | |
| |
| | | | |
ASSETS | | | | | | | | | | | | | | | | |
Investments, at value — unaffiliated(a)(b) | | $ | 3,981,986,987 | | | $ | 61,818,726 | | | $ | 252,867,532 | | | $ | 97,277,506 | |
Investments, at value — affiliated(c) | | | 311,497,517 | | | | 1,146,837 | | | | 7,783,672 | | | | 6,965,393 | |
Cash | | | — | | | | — | | | | — | | | | 2,734 | |
Cash pledged: | | | | | | | | | | | | | | | | |
Collateral — OTC derivatives | | | 430,000 | | | | — | | | | — | | | | — | |
Futures contracts | | | 2,047,000 | | | | — | | | | 419,000 | | | | — | |
Foreign currency, at value(d) | | | 14,404,622 | | | | 22,756 | | | | 337 | | | | 50,332 | |
Receivables: | | | | | | | | | | | | | | | | |
Investments sold | | | 26,454,690 | | | | — | | | | — | | | | 312,960 | |
Securities lending income — affiliated | | | 6,341 | | | | 82 | | | | 173 | | | | 335 | |
Swaps | | | — | | | | — | | | | — | | | | 39,633 | |
Capital shares sold | | | 66,331,224 | | | | 56,038 | | | | 7,227 | | | | 12,377 | |
Dividends — unaffiliated | | | 9,141,805 | | | | 639,269 | | | | 280,750 | | | | 243,603 | |
Dividends — affiliated | | | 60,294 | | | | 106 | | | | 1,854 | | | | 1,105 | |
Due from broker | | | 3,400,000 | | | | — | | | | — | | | | — | |
Variation margin on futures contracts | | | 125,827 | | | | — | | | | — | | | | — | |
Unrealized appreciation on OTC swaps | | | 1,944,432 | | | | — | | | | — | | | | — | |
Prepaid expenses | | | 300,884 | | | | 35,616 | | | | 38,829 | | | | 46,655 | |
| | | | | | | | | | | | | | | | |
Total assets | | | 4,418,131,623 | | | | 63,719,430 | | | | 261,399,374 | | | | 104,952,633 | |
| | | | | | | | | | | | | | | | |
| | | | |
LIABILITIES | | | | | | | | | | | | | | | | |
Bank overdraft | | | 6,565,347 | | | | 2,530 | | | | 108 | | | | — | |
Cash received as collateral for OTC derivatives | | | 1,700,000 | | | | — | | | | — | | | | — | |
Collateral on securities loaned | | | 22,859,455 | | | | 562,970 | | | | — | | | | 1,689,412 | |
Payables: | | | | | | | | | | | | | | | | |
Investments purchased | | | 21,398,173 | | | | — | | | | — | | | | 32 | |
Swaps | | | 616,773 | | | | — | | | | — | | | | — | |
Accounting services fees | | | 203,597 | | | | 11,599 | | | | 35,103 | | | | 24,866 | |
Capital shares redeemed | | | 28,927,122 | | | | 65,359 | | | | 384,701 | | | | 39,511 | |
Custodian fees | | | 985,569 | | | | 22,645 | | | | 16,323 | | | | 42,834 | |
Deferred foreign capital gain tax | | | 1,996,975 | | | | — | | | | — | | | | — | |
Investment advisory fees | | | 2,330,287 | | | | 53,613 | | | | 183,970 | | | | 36,211 | |
Directors’ and Officer’s fees | | | 3,101 | | | | 1,854 | | | | 1,616 | | | | 1,819 | |
Other accrued expenses | | | 45,509 | | | | 10,738 | | | | 18,850 | | | | 15,665 | |
Professional fees | | | 83,062 | | | | 65,623 | | | | 72,063 | | | | 67,546 | |
Service and distribution fees | | | 88,882 | | | | 11,508 | | | | 47,363 | | | | 11,539 | |
Transfer agent fees | | | 147,335 | | | | 23,378 | | | | 33,236 | | | | 14,321 | |
Variation margin on futures contracts | | | — | | | | — | | | | 288,596 | | | | — | |
Unrealized depreciation on OTC swaps | | | — | | | | — | | | | — | | | | 300,528 | |
| | | | | | | | | | | | | | | | |
Total liabilities | | | 87,951,187 | | | | 831,817 | | | | 1,081,929 | | | | 2,244,284 | |
| | | | | | | | | | | | | | | | |
| | | | |
NET ASSETS | | | 4,330,180,436 | | | $ | 62,887,613 | | | $ | 260,317,445 | | | $ | 102,708,349 | |
| | | | | | | | | | | | | | | | |
| | | | |
NET ASSETS CONSIST OF | | | | | | | | | | | | | | | | |
Paid-in capital | | $ | 5,234,785,533 | | | $ | 75,134,850 | | | $ | 225,032,622 | | | $ | 109,447,400 | |
Accumulated earnings (loss) | | | (904,605,097 | ) | | | (12,247,237 | ) | | | 35,284,823 | | | | (6,739,051 | ) |
| | | | | | | | | | | | | | | | |
NET ASSETS | | $ | 4,330,180,436 | | | $ | 62,887,613 | | | $ | 260,317,445 | | | $ | 102,708,349 | |
| | | | | | | | | | | | | | | | |
| | | | |
(a) Investments, at cost — unaffiliated | | $ | 4,391,617,291 | | | $ | 50,294,115 | | | $ | 250,254,508 | | | $ | 95,196,503 | |
(b) Securities loaned, at value | | $ | 20,860,440 | | | $ | 551,515 | | | $ | — | | | $ | 1,573,107 | |
(c) Investments, at cost — affiliated | | $ | 311,491,584 | | | $ | 1,146,759 | | | $ | 7,783,672 | | | $ | 6,965,351 | |
(d) Foreign currency, at cost | | $ | 14,369,511 | | | $ | 22,756 | | | $ | 338 | | | $ | 52,422 | |
| | |
| 32 | | 2 0 2 2 BLACK ROCK ANNUAL REPORT TO SHAREHOLDERS |
Statements of Assets and Liabilities (continued)
April 30, 2022
| | | | | | | | | | | | | | | | |
| | | BlackRock
Emerging Markets
Fund, Inc. | | | BlackRock
Latin America
Fund, Inc. | | | BlackRock
Unconstrained Equity Fund | | | BlackRock
Sustainable
Emerging Markets
Equity Fund | |
| |
| | | | |
NET ASSET VALUE | | | | | | | | | | | | | | | | |
Institutional | | | | | | | | | | | | | | | | |
Net assets | | $ | 3,261,325,363 | | | $ | 14,780,841 | | | $ | 49,302,677 | | | $ | 49,409,921 | |
| | | | | | | | | | | | | | | | |
Shares outstanding | | | 133,623,738 | | | | 373,934 | | | | 4,067,250 | | | | 3,797,838 | |
| | | | | | | | | | | | | | | | |
Net asset value | | $ | 24.41 | | | $ | 39.53 | | | $ | 12.12 | | | $ | 13.01 | |
| | | | | | | | | | | | | | | | |
Shares authorized | | | 1.1 billion | | | | 100 million | | | | Unlimited | | | | 100 million | |
| | | | | | | | | | | | | | | | |
Par value | | $ | 0.10 | | | $ | 0.10 | | | $ | 0.10 | | | $ | 0.10 | |
| | | | | | | | | | | | | | | | |
| | | | |
Investor A | | | | | | | | | | | | | | | | |
Net assets | | $ | 351,246,009 | | | $ | 46,572,603 | | | $ | 209,352,254 | | | $ | 51,392,859 | |
| | | | | | | | | | | | | | | | |
Shares outstanding | | | 14,964,479 | | | | 1,193,510 | | | | 17,282,516 | | | | 4,018,780 | |
| | | | | | | | | | | | | | | | |
Net asset value | | $ | 23.47 | | | $ | 39.02 | | | $ | 12.11 | | | $ | 12.79 | |
| | | | | | | | | | | | | | | | |
Shares authorized | | | 100 million | | | | 100 million | | | | Unlimited | | | | 100 million | |
| | | | | | | | | | | | | | | | |
Par value | | $ | 0.10 | | | $ | 0.10 | | | $ | 0.10 | | | $ | 0.10 | |
| | | | | | | | | | | | | | | | |
| | | | |
Investor C | | | | | | | | | | | | | | | | |
Net assets | | $ | 13,144,331 | | | $ | 908,512 | | | $ | 1,432,452 | | | | N/A | |
| | | | | | | | | | | | | | | | |
Shares outstanding | | | 673,288 | | | | 25,601 | | | | 116,947 | | | | N/A | |
| | | | | | | | | | | | | | | | |
Net asset value | | $ | 19.52 | | | $ | 35.49 | | | $ | 12.25 | | | | N/A | |
| | | | | | | | | | | | | | | | |
Shares authorized | | | 100 million | | | | 100 million | | | | Unlimited | | | | N/A | |
| | | | | | | | | | | | | | | | |
Par value | | $ | 0.10 | | | $ | 0.10 | | | $ | 0.10 | | | | N/A | |
| | | | | | | | | | | | | | | | |
| | | | |
Class K | | | | | | | | | | | | | | | | |
Net assets | | $ | 704,464,733 | | | $ | 625,657 | | | | N/A | | | $ | 1,274,787 | |
| | | | | | | | | | | | | | | | |
Shares outstanding | | | 28,851,139 | | | | 15,835 | | | | N/A | | | | 98,093 | |
| | | | | | | | | | | | | | | | |
Net asset value | | $ | 24.42 | | | $ | 39.51 | | | | N/A | | | $ | 13.00 | |
| | | | | | | | | | | | | | | | |
Shares authorized | | | 1 billion | | | | 2 billion | | | | N/A | | | | 2 billion | |
| | | | | | | | | | | | | | | | |
Par value | | $ | 0.10 | | | $ | 0.10 | | | | N/A | | | $ | 0.10 | |
| | | | | | | | | | | | | | | | |
| | | | |
Class R | | | | | | | | | | | | | | | | |
Net assets | | | N/A | | | | N/A | | | $ | 230,062 | | | $ | 630,782 | |
| | | | | | | | | | | | | | | | |
Shares outstanding | | | N/A | | | | N/A | | | | 18,697 | | | | 69,170 | |
| | | | | | | | | | | | | | | | |
Net asset value | | | N/A | | | | N/A | | | $ | 12.30 | | | $ | 9.12 | |
| | | | | | | | | | | | | | | | |
Shares authorized | | | N/A | | | | N/A | | | | Unlimited | | | | 200 million | |
| | | | | | | | | | | | | | | | |
Par value | | | N/A | | | | N/A | | | $ | 0.10 | | | $ | 0.10 | |
| | | | | | | | | | | | | | | | |
See notes to financial statements.
Statements of Operations
Year Ended April 30, 2022
| | | | | | | | | | | | | | | | |
| | | BlackRock
Emerging Markets
Fund, Inc. | | | BlackRock
Latin America
Fund, Inc. | | | BlackRock
Unconstrained Equity Fund | | | BlackRock
Sustainable
Emerging Markets
Equity Fund | |
| |
| | | | |
INVESTMENT INCOME | | | | | | | | | | | | | | | | |
Dividends — unaffiliated | | $ | 92,970,728 | | | $ | 4,086,057 | | | $ | 2,466,084 | | | $ | 2,971,015 | |
Dividends — affiliated | | | 103,800 | | | | 210 | | | | 2,688 | | | | 2,117 | |
Securities lending income — affiliated — net | | | 81,466 | | | | 1,280 | | | | 825 | | | | 3,139 | |
Foreign taxes withheld | | | (8,608,544 | ) | | | (195,064 | ) | | | (110,824 | ) | | | (250,854 | ) |
| | | | | | | | | | | | | | | | |
| | | | |
Total investment income | | | 84,547,450 | | | | 3,892,483 | | | | 2,358,773 | | | | 2,725,417 | |
| | | | | | | | | | | | | | | | |
| | | | |
EXPENSES | | | | | | | | | | | | | | | | |
Investment advisory | | | 33,850,881 | | | | 686,977 | | | | 2,461,407 | | | | 840,358 | |
Transfer agent — class specific | | | 4,754,774 | | | | 131,780 | | | | 213,228 | | | | 173,031 | |
Custodian | | | 2,209,183 | | | | 34,177 | | | | 37,512 | | | | 97,481 | |
Service and distribution — class specific | | | 1,262,956 | | | | 143,187 | | | | 642,601 | | | | 181,313 | |
Registration | | | 700,925 | | | | 63,749 | | | | 76,982 | | | | 82,167 | |
Accounting services | | | 503,708 | | | | 25,691 | | | | 78,977 | | | | 55,103 | |
Professional | | | 161,421 | | | | 127,639 | | | | 123,748 | | | | 158,648 | |
Directors and Officer | | | 18,502 | | | | 7,843 | | | | 8,383 | | | | 7,998 | |
Miscellaneous | | | 100,325 | | | | 23,501 | | | | 125,820 | | | | 33,794 | |
| | | | | | | | | | | | | | | | |
| | | | |
Total expenses | | | 43,562,675 | | | | 1,244,544 | | | | 3,768,658 | | | | 1,629,893 | |
Less: | | | | | | | | | | | | | | | | |
Fees paid indirectly | | | (215 | ) | | | (6 | ) | | | — | | | | — | |
Fees waived and/or reimbursed by the Manager | | | (1,594,006 | ) | | | (34,576 | ) | | | (171,770 | ) | | | (88,873 | ) |
Transfer agent fees waived and/or reimbursed — class specific | | | (2,784,330 | ) | | | — | | | | (13,326 | ) | | | (57,021 | ) |
| | | | | | | | | | | | | | | | |
| | | | |
Total expenses after fees waived and/or reimbursed | | | 39,184,124 | | | | 1,209,962 | | | | 3,583,562 | | | | 1,483,999 | |
| | | | | | | | | | | | | | | | |
| | | | |
Net investment income (loss) | | | 45,363,326 | | | | 2,682,521 | | | | (1,224,789 | ) | | | 1,241,418 | |
| | | | | | | | | | | | | | | | |
| | | | |
REALIZED AND UNREALIZED GAIN (LOSS) | | | | | | | | | | | | | | | | |
Net realized gain (loss) from: | | | | | | | | | | | | | | | | |
Investments — unaffiliated(a) | | | (430,448,483 | ) | | | 2,751,516 | | | | 49,956,217 | | | | 5,183,071 | |
Investments — affiliated | | | (12,623 | ) | | | 246 | | | | (108 | ) | | | 31 | |
Forward foreign currency exchange contracts | | | (551,259 | ) | | | — | | | | — | | | | — | |
Foreign currency transactions | | | (2,811,549 | ) | | | (63,204 | ) | | | (26,727 | ) | | | (127,144 | ) |
Futures contracts | | | (25,632,537 | ) | | | — | | | | (223,397 | ) | | | (470,051 | ) |
Swaps | | | 5,061,391 | | | | — | | | | — | | | | 426,268 | |
| | | | | | | | | | | | | | | | |
| | | | |
| | | (454,395,060 | ) | | | 2,688,558 | | | | 49,705,985 | | | | 5,012,175 | |
| | | | | | | | | | | | | | | | |
Net change in unrealized appreciation (depreciation) on: | | | | | | | | | | | | | | | | |
Investments — unaffiliated(b) | | | (953,520,165 | ) | | | (9,103,259 | ) | | | (73,187,915 | ) | | | (42,530,184 | ) |
Investments — affiliated | | | 5,933 | | | | 47 | | | | — | | | | 42 | |
Foreign currency translations | | | (207,558 | ) | | | (672 | ) | | | (20,673 | ) | | | (11,695 | ) |
Futures contracts | | | (2,515,001 | ) | | | — | | | | (120,722 | ) | | | — | |
Swaps | | | (1,134,351 | ) | | | — | | | | — | | | | (345,238 | ) |
| | | | | | | | | | | | | | | | |
| | | | |
| | | (957,371,142 | ) | | | (9,103,884 | ) | | | (73,329,310 | ) | | | (42,887,075 | ) |
| | | | | | | | | | | | | | | | |
| | | | |
Net realized and unrealized loss | | | (1,411,766,202 | ) | | | (6,415,326 | ) | | | (23,623,325 | ) | | | (37,874,900 | ) |
| | | | | | | | | | | | | | | | |
| | | | |
NET DECREASE IN NET ASSETS RESULTING FROM OPERATIONS | | $ | (1,366,402,876 | ) | | $ | (3,732,805 | ) | | $ | (24,848,114 | ) | | $ | (36,633,482 | ) |
| | | | | | | | | | | | | | | | |
| | | | |
(a) Net of foreign capital gain tax and capital gain tax refund, if applicable of | | $ | (6,209,854 | ) | | $ | (50,375 | ) | | $ | (217,870 | ) | | $ | (579,459 | ) |
(b) Net of reduction in deferred foreign capital gain tax of | | $ | 4,521,645 | | | $ | — | | | $ | 383,584 | | | $ | 35,750 | |
See notes to financial statements.
| | |
| 34 | | 2 0 2 2 BLACK ROCK ANNUAL REPORT TO SHAREHOLDERS |
Statements of Changes in Net Assets
| | | | | | | | | | | | | | | | |
| | | BlackRock Emerging Markets Fund, Inc. | | | BlackRock Latin America Fund, Inc. |
| | | Year Ended April 30, | | | Year Ended April 30, |
| | | 2022 | | | 2021 | | | 2022 | | | 2021 | |
|
INCREASE (DECREASE) IN NET ASSETS | |
| | | | |
OPERATIONS | | | | | | | | | | | | | | | | |
Net investment income | | $ | 45,363,326 | | | $ | 9,955,838 | | | $ | 2,682,521 | | | $ | 1,211,969 | |
Net realized gain (loss) | | | (454,395,060 | ) | | | 178,670,041 | | | | 2,688,558 | | | | (3,388,051 | ) |
Net change in unrealized appreciation (depreciation) | | | (957,371,142 | ) | | | 568,123,558 | | | | (9,103,884 | ) | | | 34,300,540 | |
| | | | | | | | | | | | | | | | |
Net increase (decrease) in net assets resulting from operations | | | (1,366,402,876 | ) | | | 756,749,437 | | | | (3,732,805 | ) | | | 32,124,458 | |
| | | | | | | | | | | | | | | | |
| | | | |
DISTRIBUTIONS TO SHAREHOLDERS(a) | | | | | | | | | | | | | | | | |
Institutional | | | (173,007,048 | ) | | | (13,811,964 | ) | | | (646,747 | ) | | | (505,278 | ) |
Investor A | | | (23,349,088 | ) | | | (2,570,314 | ) | | | (2,239,472 | ) | | | (734,372 | ) |
Investor C | | | (1,063,961 | ) | | | (21,438 | ) | | | (46,869 | ) | | | (12,114 | ) |
Class K | | | (28,474,812 | ) | | | (2,538,898 | ) | | | (23,279 | ) | | | (7,521 | ) |
| | | | | | | | | | | | | | | | |
Decrease in net assets resulting from distributions to shareholders | | | (225,894,909 | ) | | | (18,942,614 | ) | | | (2,956,367 | ) | | | (1,259,285 | ) |
| | | | | | | | | | | | | | | | |
| | | | |
CAPITAL SHARE TRANSACTIONS | | | | | | | | | | | | | | | | |
Net increase (decrease) in net assets derived from capital share transactions | | | 2,210,154,765 | | | | 1,926,136,388 | | | | (13,519,675 | ) | | | (27,448,414 | ) |
| | | | | | | | | | | | | | | | |
| | | | |
NET ASSETS | | | | | | | | | | | | | | | | |
Total increase (decrease) in net assets | | | 617,856,980 | | | | 2,663,943,211 | | | | (20,208,847 | ) | | | 3,416,759 | |
Beginning of year | | | 3,712,323,456 | | | | 1,048,380,245 | | | | 83,096,460 | | | | 79,679,701 | |
| | | | | | | | | | | | | | | | |
End of year | | $ | 4,330,180,436 | | | $ | 3,712,323,456 | | | $ | 62,887,613 | | | $ | 83,096,460 | |
| | | | | | | | | | | | | | | | |
| (a) | Distributions for annual periods determined in accordance with U.S. federal income tax regulations. |
See notes to financial statements.
Statements of Changes in Net Assets (continued)
| | | | | | | | | | | | | | | | |
| | | BlackRock Unconstrained Equity Fund | | | BlackRock Sustainable Emerging Markets Equity Fund |
| | | Year Ended April 30, | | | Year Ended April 30, |
| | | 2022 | | | 2021 | | | 2022 | | | 2021 | |
|
INCREASE (DECREASE) IN NET ASSETS | |
| | | | |
OPERATIONS | | | | | | | | | | | | | | | | |
Net investment income (loss) | | $ | (1,224,789 | ) | | $ | (197,316 | ) | | $ | 1,241,418 | | | $ | 980,624 | |
Net realized gain | | | 49,705,985 | | | | 66,484,283 | | | | 5,012,175 | | | | 11,065,376 | |
Net change in unrealized appreciation (depreciation) | | | (73,329,310 | ) | | | 41,953,149 | | | | (42,887,075 | ) | | | 38,820,989 | |
| | | | | | | | | | | | | | | | |
Net increase (decrease) in net assets resulting from operations | | | (24,848,114 | ) | | | 108,240,116 | | | | (36,633,482 | ) | | | 50,866,989 | |
| | | | | | | | | | | | | | | | |
| | | | |
DISTRIBUTIONS TO SHAREHOLDERS(a) | | | | | | | | | | | | | | | | |
Institutional | | | (11,530,562 | ) | | | (4,892,862 | ) | | | (10,999,049 | ) | | | (444,817 | ) |
Investor A | | | (50,954,106 | ) | | | (22,752,134 | ) | | | (11,086,055 | ) | | | (347,577 | ) |
Investor C | | | (369,771 | ) | | | (413,097 | ) | | | (127,892 | ) | | | (9,883 | ) |
Class K | | | — | | | | — | | | | (279,400 | ) | | | (5,860 | ) |
Class R | | | (50,938 | ) | | | (40,204 | ) | | | (188,107 | ) | | | (4,284 | ) |
| | | | | | | | | | | | | | | | |
Decrease in net assets resulting from distributions to shareholders | | | (62,905,377 | ) | | | (28,098,297 | ) | | | (22,680,503 | ) | | | (812,421 | ) |
| | | | | | | | | | | | | | | | |
| | | | |
CAPITAL SHARE TRANSACTIONS | | | | | | | | | | | | | | | | |
Net increase (decrease) in net assets derived from capital share transactions | | | 40,836,397 | | | | (1,412,263 | ) | | | (7,209,251 | ) | | | (2,773,047 | ) |
| | | | | | | | | | | | | | | | |
| | | | |
NET ASSETS | | | | | | | | | | | | | | | | |
Total increase (decrease) in net assets | | | (46,917,094 | ) | | | 78,729,556 | | | | (66,523,236 | ) | | | 47,281,521 | |
Beginning of year | | | 307,234,539 | | | | 228,504,983 | | | | 169,231,585 | | | | 121,950,064 | |
| | | | | | | | | | | | | | | | |
End of year | | $ | 260,317,445 | | | $ | 307,234,539 | | | $ | 102,708,349 | | | $ | 169,231,585 | |
| | | | | | | | | | | | | | | | |
| (a) | Distributions for annual periods determined in accordance with U.S. federal income tax regulations. |
See notes to financial statements.
| | |
| 36 | | 2 0 2 2 BLACK ROCK ANNUAL REPORT TO SHAREHOLDERS |
Financial Highlights
(For a share outstanding throughout each period)
| | | | | | | | | | | | | | | | | | | | | | | | | | | | |
| | | BlackRock Emerging Markets Fund, Inc. | |
| | | Institutional | |
| | | |
| | | Year Ended April 30, | | | Period from
11/01/19
to 04/30/20 | | | Year Ended October 31, | |
| | | | | | 2022 | | | 2021 | | | 2019 | | | 2018 | | | 2017 | |
| | | | | | | |
Net asset value, beginning of period | | | | | | $ | 34.51 | | | $ | 22.21 | | | $ | 24.51 | | | $ | 20.73 | | | $ | 22.74 | | | $ | 18.32 | |
| | | | | | | | | | | | | | | | | | | | | | | | | | | | |
| | | | | | | |
Net investment income(a) | | | | | | | 0.31 | | | | 0.15 | | | | 0.04 | | | | 0.40 | | | | 0.24 | | | | 0.14 | |
Net realized and unrealized gain (loss) | | | | | | | (8.70 | ) | | | 12.46 | | | | (1.94 | ) | | | 3.58 | | | | (2.14 | ) | | | 4.58 | |
| | | | | | | | | | | | | | | | | | | | | | | | | | | | |
| | | | | | | |
Net increase (decrease) from investment operations | | | | | | | (8.39 | ) | | | 12.61 | | | | (1.90 | ) | | | 3.98 | | | | (1.90 | ) | | | 4.72 | |
| | | | | | | | | | | | | | | | | | | | | | | | | | | | |
| | | | | | | |
Distributions(b) | | | | | | | | | | | | | | | | | | | | | | | | | | | | |
From net investment income | | | | | | | (0.28 | ) | | | (0.31 | ) | | | (0.40 | ) | | | (0.20 | ) | | | (0.11 | ) | | | (0.30 | ) |
From net realized gain | | | | | | | (1.43 | ) | | | — | | | | — | | | | — | | | | — | | | | — | |
| | | | | | | | | | | | | | | | | | | | | | | | | | | | |
| | | | | | | |
Total distributions | | | | | | | (1.71 | ) | | | (0.31 | ) | | | (0.40 | ) | | | (0.20 | ) | | | (0.11 | ) | | | (0.30 | ) |
| | | | | | | | | | | | | | | | | | | | | | | | | | | | |
| | | | | | | |
Net asset value, end of period | | | | | | $ | 24.41 | | | $ | 34.51 | | | $ | 22.21 | | | $ | 24.51 | | | $ | 20.73 | | | $ | 22.74 | |
| | | | | | | | | | | | | | | | | | | | | | | | | | | | |
| | | | | | | |
Total Return(c) | | | | | | | | | | | | | | | | | | | | | | | | | | | | |
Based on net asset value | | | | | | | (25.52 | )% | | | 57.05 | % | | | (7.95 | )%(d) | | | 19.39 | % | | | (8.39 | )% | | | 26.35 | % |
| | | | | | | | | | | | | | | | | | | | | | | | | | | | |
| | | | | | | |
Ratios to Average Net Assets(e) | | | | | | | | | | | | | | | | | | | | | | | | | | | | |
Total expenses | | | | | | | 0.96 | % | | | 1.02 | % | | | 1.04 | %(f) | | | 1.14 | % | | | 1.31 | % | | | 1.34 | % |
| | | | | | | | | | | | | | | | | | | | | | | | | | | | |
| | | | | | | |
Total expenses after fees waived and/or reimbursed | | | | | | | 0.86 | % | | | 0.86 | % | | | 0.86 | %(f) | | | 0.97 | % | | | 1.11 | % | | | 1.34 | % |
| | | | | | | | | | | | | | | | | | | | | | | | | | | | |
| | | | | | | |
Net investment income | | | | | | | 1.03 | % | | | 0.49 | % | | | 0.34 | %(f) | | | 1.73 | % | | | 1.05 | % | | | 0.72 | % |
| | | | | | | | | | | | | | | | | | | | | | | | | | | | |
| | | | | | | |
Supplemental Data | | | | | | | | | | | | | | | | | | | | | | | | | | | | |
Net assets, end of period (000) | | | | | | $ | 3,261,325 | | | $ | 2,771,663 | | | $ | 660,315 | | | $ | 308,719 | | | $ | 98,990 | | | $ | 77,115 | |
| | | | | | | | | | | | | | | | | | | | | | | | | | | | |
| | | | | | | |
Portfolio turnover rate | | | | | | | 132 | % | | | 109 | % | | | 63 | % | | | 119 | % | | | 121 | % | | | 126 | % |
| | | | | | | | | | | | | | | | | | | | | | | | | | | | |
| (a) | Based on average shares outstanding. |
| (b) | Distributions for annual periods determined in accordance with U.S. federal income tax regulations. |
| (c) | Where applicable, assumes the reinvestment of distributions. |
| (d) | Aggregate total return. |
| (e) | Excludes fees and expenses incurred indirectly as a result of investments in underlying funds. |
See notes to financial statements.
Financial Highlights (continued)
(For a share outstanding throughout each period)
| | | | | | | | | | | | | | | | | | | | | | | | | | | | |
| | | BlackRock Emerging Markets Fund, Inc. (continued) | |
| | | Investor A | |
| | | |
| | | Year Ended April 30, | | | Period from
11/01/19
to 04/30/20 | | | Year Ended October 31, | |
| | | | | | 2022 | | | 2021 | | | 2019 | | | 2018 | | | 2017 | |
| | | | | | | |
Net asset value, beginning of period | | | | | | $ | 33.26 | | | $ | 21.42 | | | $ | 23.62 | | | $ | 19.96 | | | $ | 21.88 | | | $ | 17.62 | |
| | | | | | | | | | | | | | | | | | | | | | | | | | | | |
| | | | | | | |
Net investment income(a) | | | | | | | 0.24 | | | | 0.11 | | | | 0.02 | | | | 0.29 | | | | 0.16 | | | | 0.07 | |
Net realized and unrealized gain (loss) | | | | | | | (8.40 | ) | | | 11.98 | | | | (1.89 | ) | | | 3.50 | | | | (2.04 | ) | | | 4.42 | |
| | | | | | | | | | | | | | | | | | | | | | | | | | | | |
| | | | | | | |
Net increase (decrease) from investment operations | | | | | | | (8.16 | ) | | | 12.09 | | | | (1.87 | ) | | | 3.79 | | | | (1.88 | ) | | | 4.49 | |
| | | | | | | | | | | | | | | | | | | | | | | | | | | | |
| | | | | | | |
Distributions(b) | | | | | | | | | | | | | | | | | | | | | | | | | | | | |
From net investment income | | | | | | | (0.20 | ) | | | (0.25 | ) | | | (0.33 | ) | | | (0.13 | ) | | | (0.04 | ) | | | (0.23 | ) |
From net realized gain | | | | | | | (1.43 | ) | | | — | | | | — | | | | — | | | | — | | | | — | |
| | | | | | | | | | | | | | | | | | | | | | | | | | | | |
| | | | | | | |
Total distributions | | | | | | | (1.63 | ) | | | (0.25 | ) | | | (0.33 | ) | | | (0.13 | ) | | | (0.04 | ) | | | (0.23 | ) |
| | | | | | | | | | | | | | | | | | | | | | | | | | | | |
| | | | | | | |
Net asset value, end of period | | | | | | $ | 23.47 | | | $ | 33.26 | | | $ | 21.42 | | | $ | 23.62 | | | $ | 19.96 | | | $ | 21.88 | |
| | | | | | | | | | | | | | | | | | | | | | | | | | | | |
| | | | | | | |
Total Return(c) | | | | | | | | | | | | | | | | | | | | | | | | | | | | |
Based on net asset value | | | | | | | (25.74 | )% | | | 56.67 | % | | | (8.09 | )%(d) | | | 19.11 | % | | | (8.62 | )% | | | 25.95 | % |
| | | | | | | | | | | | | | | | | | | | | | | | | | | | |
| | | | | | | |
Ratios to Average Net Assets(e) | | | | | | | | | | | | | | | | | | | | | | | | | | | | |
Total expenses | | | | | | | 1.25 | % | | | 1.28 | % | | | 1.36 | %(f) | | | 1.45 | % | | | 1.60 | % | | | 1.68 | % |
| | | | | | | | | | | | | | | | | | | | | | | | | | | | |
| | | | | | | |
Total expenses after fees waived and/or reimbursed | | | | | | | 1.11 | % | | | 1.11 | % | | | 1.11 | %(f) | | | 1.22 | % | | | 1.40 | % | | | 1.68 | % |
| | | | | | | | | | | | | | | | | | | | | | | | | | | | |
| | | | | | | |
Net investment income | | | | | | | 0.82 | % | | | 0.38 | % | | | 0.21 | %(f) | | | 1.31 | % | | | 0.72 | % | | | 0.39 | % |
| | | | | | | | | | | | | | | | | | | | | | | | | | | | |
| | | | | | | |
Supplemental Data | | | | | | | | | | | | | | | | | | | | | | | | | | | | |
Net assets, end of period (000) | | | | | | $ | 351,246 | | | $ | 463,032 | | | $ | 196,836 | | | $ | 204,061 | | | $ | 164,683 | | | $ | 210,355 | |
| | | | | | | | | | | | | | | | | | | | | | | | | | | | |
| | | | | | | |
Portfolio turnover rate | | | | | | | 132 | % | | | 109 | % | | | 63 | % | | | 119 | % | | | 121 | % | | | 126 | % |
| | | | | | | | | | | | | | | | | | | | | | | | | | | | |
| (a) | Based on average shares outstanding. |
| (b) | Distributions for annual periods determined in accordance with U.S. federal income tax regulations. |
| (c) | Where applicable, excludes the effects of any sales charges and assumes the reinvestment of distributions. |
| (d) | Aggregate total return. |
| (e) | Excludes fees and expenses incurred indirectly as a result of investments in underlying funds. |
See notes to financial statements.
| | |
| 38 | | 2 0 2 2 BLACK ROCK ANNUAL REPORT TO SHAREHOLDERS |
Financial Highlights (continued)
(For a share outstanding throughout each period)
| | | | | | | | | | | | | | | | | | | | | | | | | | | | |
| | | BlackRock Emerging Markets Fund, Inc. (continued) | |
| | | Investor C | |
| | | |
| | | Year Ended April 30, | | | Period from
11/01/19
to 04/30/20 | | | Year Ended October 31, | |
| | | | | | 2022 | | | 2021 | | | 2019 | | | 2018 | | | 2017 | |
| | | | | | | |
Net asset value, beginning of period | | | | | | $ | 28.01 | | | $ | 18.03 | | | $ | 19.83 | | | $ | 16.77 | | | $ | 18.50 | | | $ | 14.93 | |
| | | | | | | | | | | | | | | | | | | | | | | | | | | | |
| | | | | | | |
Net investment income (loss)(a) | | | | | | | 0.02 | | | | 0.04 | | | | (0.05 | ) | | | 0.09 | | | | (0.02 | ) | | | (0.09 | ) |
Net realized and unrealized gain (loss) | | | | | | | (7.01 | ) | | | 9.96 | | | | (1.60 | ) | | | 2.97 | | | | (1.71 | ) | | | 3.76 | |
| | | | | | | | | | | | | | | | | | | | | | | | | | | | |
| | | | | | | |
Net increase (decrease) from investment operations | | | | | | | (6.99 | ) | | | 10.00 | | | | (1.65 | ) | | | 3.06 | | | | (1.73 | ) | | | 3.67 | |
| | | | | | | | | | | | | | | | | | | | | | | | | | | | |
| | | | | | | |
Distributions(b) | | | | | | | | | | | | | | | | | | | | | | | | | | | | |
From net investment income | | | | | | | (0.07 | ) | | | (0.02 | ) | | | (0.15 | ) | | | — | | | | — | | | | (0.10 | ) |
From net realized gain | | | | | | | (1.43 | ) | | | — | | | | — | | | | — | | | | — | | | | — | |
| | | | | | | | | | | | | | | | | | | | | | | | | | | | |
| | | | | | | |
Total distributions | | | | | | | (1.50 | ) | | | (0.02 | ) | | | (0.15 | ) | | | — | | | | — | | | | (0.10 | ) |
| | | | | | | | | | | | | | | | | | | | | | | | | | | | |
| | | | | | | |
Net asset value, end of period | | | | | | $ | 19.52 | | | $ | 28.01 | | | $ | 18.03 | | | $ | 19.83 | | | $ | 16.77 | | | $ | 18.50 | |
| | | | | | | | | | | | | | | | | | | | | | | | | | | | |
| | | | | | | |
Total Return(c) | | | | | | | | | | | | | | | | | | | | | | | | | | | | |
Based on net asset value | | | | | | | (26.29 | )% | | | 55.48 | % | | | (8.42 | )%(d) | | | 18.25 | % | | | (9.35 | )% | | | 24.84 | % |
| | | | | | | | | | | | | | | | | | | | | | | | | | | | |
| | | | | | | |
Ratios to Average Net Assets(e) | | | | | | | | | | | | | | | | | | | | | | | | | | | | |
Total expenses | | | | | | | 2.02 | % | | | 2.13 | % | | | 2.22 | %(f) | | | 2.31 | % | | | 2.41 | % | | | 2.53 | % |
| | | | | | | | | | | | | | | | | | | | | | | | | | | | |
| | | | | | | |
Total expenses after fees waived and/or reimbursed | | | | | | | 1.86 | % | | | 1.86 | % | | | 1.86 | %(f) | | | 1.98 | % | | | 2.18 | % | | | 2.53 | % |
| | | | | | | | | | | | | | | | | | | | | | | | | | | | |
| | | | | | | |
Net investment income (loss) | | | | | | | 0.07 | % | | | 0.16 | % | | | (0.51 | )%(f) | | | 0.50 | % | | | (0.10 | )% | | | (0.57 | )% |
| | | | | | | | | | | | | | | | | | | | | | | | | | | | |
| | | | | | | |
Supplemental Data | | | | | | | | | | | | | | | | | | | | | | | | | | | | |
Net assets, end of period (000) | | | | | | $ | 13,144 | | | $ | 18,769 | | | $ | 24,639 | | | $ | 31,362 | | | $ | 34,756 | | | $ | 53,327 | |
| | | | | | | | | | | | | | | | | | | | | | | | | | | | |
| | | | | | | |
Portfolio turnover rate | | | | | | | 132 | % | | | 109 | % | | | 63 | % | | | 119 | % | | | 121 | % | | | 126 | % |
| | | | | | | | | | | | | | | | | | | | | | | | | | | | |
| (a) | Based on average shares outstanding. |
| (b) | Distributions for annual periods determined in accordance with U.S. federal income tax regulations. |
| (c) | Where applicable, excludes the effects of any sales charges and assumes the reinvestment of distributions. |
| (d) | Aggregate total return. |
| (e) | Excludes fees and expenses incurred indirectly as a result of investments in underlying funds. |
See notes to financial statements.
Financial Highlights (continued)
(For a share outstanding throughout each period)
| | | | | | | | | | | | | | | | | | | | | | | | |
| | | BlackRock Emerging Markets Fund, Inc. (continued) |
| | | Class K |
| | | | |
| | | Year Ended April 30, | | |
| Period from
11/01/19
to 04/30/20 |
| |
| Year Ended
10/31/19 |
| |
| Period from
01/25/18 to 10/31/18 |
(a) |
| | | | | | 2022 | | | 2021 | |
| | | | | | |
Net asset value, beginning of period | | | | | | $ | 34.53 | | | $ | 22.22 | | | $ | 24.52 | | | $ | 20.74 | | | $ | 25.97 | |
| | | | | | | | | | | | | | | | | | | | | | | | |
| | | | | | |
Net investment income(b) | | | | | | | 0.34 | | | | 0.19 | | | | 0.06 | | | | 0.48 | | | | 0.32 | |
| | | | | | |
Net realized and unrealized gain (loss) | | | | | | | (8.73 | ) | | | 12.44 | | | | (1.95 | ) | | | 3.52 | | | | (5.55 | ) |
| | | | | | | | | | | | | | | | | | | | | | | | |
| | | | | | |
Net increase (decrease) from investment operations | | | | | | | (8.39 | ) | | | 12.63 | | | | (1.89 | ) | | | 4.00 | | | | (5.23 | ) |
| | | | | | | | | | | | | | | | | | | | | | | | |
| | | | | | |
Distributions(c) | | | | | | | | | | | | | | | | | | | | | | | | |
From net investment income | | | | | | | (0.29 | ) | | | (0.32 | ) | | | (0.41 | ) | | | (0.22 | ) | | | — | |
From net realized gain | | | | | | | (1.43 | ) | | | — | | | | — | | | | — | | | | — | |
| | | | | | | | | | | | | | | | | | | | | | | | |
| | | | | | |
Total distributions | | | | | | | (1.72 | ) | | | (0.32 | ) | | | (0.41 | ) | | | (0.22 | ) | | | — | |
| | | | | | | | | | | | | | | | | | | | | | | | |
| | | | | | |
Net asset value, end of period | | | | | | $ | 24.42 | | | $ | 34.53 | | | $ | 22.22 | | | $ | 24.52 | | | $ | 20.74 | |
| | | | | | | | | | | | | | | | | | | | | | | | |
| | | | | | |
Total Return(d) | | | | | | | | | | | | | | | | | | | | | | | | |
Based on net asset value | | | | | | | (25.50 | )% | | | 57.13 | % | | | (7.91 | )%(e) | | | 19.48 | % | | | (20.14 | )%(e) |
| | | | | | | | | | | | | | | | | | | | | | | | |
| | | | | | |
Ratios to Average Net Assets(f) | | | | | | | | | | | | | | | | | | | | | | | | |
| | | | | | |
Total expenses | | | | | | | 0.85 | % | | | 0.85 | % | | | 0.92 | %(g) | | | 0.98 | % | | | 1.16 | %(g) |
| | | | | | | | | | | | | | | | | | | | | | | | |
| | | | | | |
Total expenses after fees waived and/or reimbursed | | | | | | | 0.81 | % | | | 0.81 | % | | | 0.81 | %(g) | | | 0.92 | % | | | 0.95 | %(g) |
| | | | | | | | | | | | | | | | | | | | | | | | |
| | | | | | |
Net investment income | | | | | | | 1.12 | % | | | 0.63 | % | | | 0.46 | %(g) | | | 2.08 | % | | | 1.82 | %(g) |
| | | | | | | | | | | | | | | | | | | | | | | | |
| | | | | | |
Supplemental Data | | | | | | | | | | | | | | | | | | | | | | | | |
Net assets, end of period (000) | | | | | | $ | 704,465 | | | $ | 458,860 | | | $ | 166,590 | | | $ | 109,569 | | | $ | 1,500 | |
| | | | | | | | | | | | | | | | | | | | | | | | |
| | | | | | |
Portfolio turnover rate | | | | | | | 132 | % | | | 109 | % | | | 63 | % | | | 119 | % | | | 121 | % |
| | | | | | | | | | | | | | | | | | | | | | | | |
| (a) | Commencement of operations. |
| (b) | Based on average shares outstanding. |
| (c) | Distributions for annual periods determined in accordance with U.S. federal income tax regulations. |
| (d) | Where applicable, assumes the reinvestment of distributions. |
| (e) | Aggregate total return. |
| (f) | Excludes fees and expenses incurred indirectly as a result of investments in underlying funds. |
See notes to financial statements.
| | |
| 40 | | 2 0 2 2 BLACK ROCK ANNUAL REPORT TO SHAREHOLDERS |
Financial Highlights (continued)
(For a share outstanding throughout each period)
| | | | | | | | | | | | | | | | | | | | | | | | | | | | |
| | | BlackRock Latin America Fund, Inc. | |
| | | Institutional | |
| | | |
| | | Year Ended April 30, | | | Period from
11/01/19
to 04/30/20 | | | Year Ended October 31, | |
| | | | | | 2022 | | | 2021 | | | 2019 | | | 2018 | | | 2017 | |
| | | | | | | |
Net asset value, beginning of period | | | | | | $ | 43.87 | | | $ | 31.44 | | | $ | 52.43 | | | $ | 48.89 | | | $ | 49.20 | | | $ | 45.22 | |
| | | | | | | | | | | | | | | | | | | | | | | | | | | | |
| | | | | | | |
Net investment income(a) | | | | | | | 1.81 | | | | 0.55 | | | | 0.44 | | | | 0.94 | | | | 0.56 | | | | 0.40 | |
Net realized and unrealized gain (loss) | | | | | | | (4.21 | ) | | | 12.47 | | | | (20.30 | ) | | | 3.15 | | | | (0.29 | ) | | | 4.15 | |
| | | | | | | | | | | | | | | | | | | | | | | | | | | | |
| | | | | | | |
Net increase (decrease) from investment operations | | | | | | | (2.40 | ) | | | 13.02 | | | | (19.86 | ) | | | 4.09 | | | | 0.27 | | | | 4.55 | |
| | | | | | | | | | | | | | | | | | | | | | | | | | | | |
| | | | | | | |
Distributions from net investment income(b) | | | | | | | (1.94 | ) | | | (0.59 | ) | | | (1.13 | ) | | | (0.55 | ) | | | (0.58 | ) | | | (0.57 | ) |
| | | | | | | | | | | | | | | | | | | | | | | | | | | | |
| | | | | | | |
Net asset value, end of period | | | | | | $ | 39.53 | | | $ | 43.87 | | | $ | 31.44 | | | $ | 52.43 | | | $ | 48.89 | | | $ | 49.20 | |
| | | | | | | | | | | | | | | | | | | | | | | | | | | | |
| | | | | | | |
Total Return(c) | | | | | | | | | | | | | | | | | | | | | | | | | | | | |
Based on net asset value | | | | | | | (5.28 | )% | | | 41.60 | % | | | (38.76 | )%(d)(e) | | | 8.53 | % | | | 0.58 | % | | | 10.37 | % |
| | | | | | | | | | | | | | | | | | | | | | | | | | | | |
| | | | | | | |
Ratios to Average Net Assets(f) | | | | | | | | | | | | | | | | | | | | | | | | | | | | |
Total expenses | | | | | | | 1.60 | % | | | 1.44 | % | | | 1.43 | %(g)(h) | | | 1.30 | % | | | 1.36 | % | | | 1.31 | % |
| | | | | | | | | | | | | | | | | | | | | | | | | | | | |
| | | | | | | |
Total expenses after fees waived and/or reimbursed | | | | | | | 1.55 | % | | | 1.39 | % | | | 1.43 | %(g)(h) | | | 1.30 | % | | | 1.35 | % | | | 1.31 | % |
| | | | | | | | | | | | | | | | | | | | | | | | | | | | |
| | | | | | | |
Net investment income | | | | | | | 4.32 | % | | | 1.45 | % | | | 1.88 | %(g) | | | 1.85 | % | | | 1.13 | % | | | 0.88 | % |
| | | | | | | | | | | | | | | | | | | | | | | | | | | | |
| | | | | | | |
Supplemental Data | | | | | | | | | | | | | | | | | | | | | | | | | | | | |
Net assets, end of period (000) | | | | | | $ | 14,781 | | | $ | 15,844 | | | $ | 26,218 | | | $ | 52,123 | | | $ | 59,535 | | | $ | 64,009 | |
| | | | | | | | | | | | | | | | | | | | | | | | | | | | |
| | | | | | | |
Portfolio turnover rate | | | | | | | 59 | % | | | 138 | % | | | 54 | % | | | 70 | % | | | 48 | % | | | 56 | % |
| | | | | | | | | | | | | | | | | | | | | | | | | | | | |
| (a) | Based on average shares outstanding. |
| (b) | Distributions for annual periods determined in accordance with U.S. federal income tax regulations. |
| (c) | Where applicable, assumes the reinvestment of distributions. |
| (d) | Aggregate total return. |
| (e) | Includes payment received from a settlement of litigation which impacted the Fund’s total return. Excluding the payment from a settlement of litigation, the Fund’s total return would have been (39.40)%. |
| (f) | Excludes fees and expenses incurred indirectly as a result of investments in underlying funds. |
| (h) | Audit, printing and tax costs were not annualized in the calculation of the expense ratios. If these expenses were annualized, the total expenses and total expenses after fees waived and/or reimbursed would have been 1.49%. |
See notes to financial statements.
Financial Highlights (continued)
(For a share outstanding throughout each period)
| | | | | | | | | | | | | | | | | | | | | | | | | | | | |
| | | BlackRock Latin America Fund, Inc. (continued) | |
| | | Investor A | |
| | | |
| | | Year Ended April 30, | | | Period from
11/01/19
to 04/30/20 | | | Year Ended October 31, | |
| | | | | | 2022 | | | 2021 | | | 2019 | | | 2018 | | | 2017 | |
| | | | | | | |
Net asset value, beginning of period | | | | | | $ | 43.30 | | | $ | 31.06 | | | $ | 51.70 | | | $ | 48.20 | | | $ | 48.49 | | | $ | 44.57 | |
| | | | | | | | | | | | | | | | | | | | | | | | | | | | |
| | | | | | | |
Net investment income(a) | | | | | | | 1.58 | | | | 0.52 | | | | 0.36 | | | | 0.78 | | | | 0.40 | | | | 0.26 | |
Net realized and unrealized gain (loss) | | | | | | | (4.05 | ) | | | 12.18 | | | | (20.05 | ) | | | 3.12 | | | | (0.27 | ) | | | 4.10 | |
| | | | | | | | | | | | | | | | | | | | | | | | | | | | |
| | | | | | | |
Net increase (decrease) from investment operations | | | | | | | (2.47 | ) | | | 12.70 | | | | (19.69 | ) | | | 3.90 | | | | 0.13 | | | | 4.36 | |
| | | | | | | | | | | | | | | | | | | | | | | | | | | | |
| | | | | | | |
Distributions from net investment income(b) | | | | | | | (1.81 | ) | | | (0.46 | ) | | | (0.95 | ) | | | (0.40 | ) | | | (0.42 | ) | | | (0.44 | ) |
| | | | | | | | | | | | | | | | | | | | | | | | | | | | |
| | | | | | | |
Net asset value, end of period | | | | | | $ | 39.02 | | | $ | 43.30 | | | $ | 31.06 | | | $ | 51.70 | | | $ | 48.20 | | | $ | 48.49 | |
| | | | | | | | | | | | | | | | | | | | | | | | | | | | |
| | | | | | | |
Total Return(c) | | | | | | | | | | | | | | | | | | | | | | | | | | | | |
Based on net asset value | | | | | | | (5.53 | )% | | | 41.05 | % | | | (38.84 | )%(d)(e) | | | 8.20 | % | | | 0.29 | % | | | 10.03 | % |
| | | | | | | | | | | | | | | | | | | | | | | | | | | | |
| | | | | | | |
Ratios to Average Net Assets(f) | | | | | | | | | | | | | | | | | | | | | | | | | | | | |
Total expenses | | | | | | | 1.85 | % | | | 1.79 | % | | | 1.74 | %(g)(h) | | | 1.60 | % | | | 1.66 | % | | | 1.62 | % |
| | | | | | | | | | | | | | | | | | | | | | | | | | | | |
| | | | | | | |
Total expenses after fees waived and/or reimbursed | | | | | | | 1.80 | % | | | 1.74 | % | | | 1.73 | %(g)(h) | | | 1.60 | % | | | 1.65 | % | | | 1.62 | % |
| | | | | | | | | | | | | | | | | | | | | | | | | | | | |
| | | | | | | |
Net investment income | | | | | | | 3.81 | % | | | 1.34 | % | | | 1.56 | %(g) | | | 1.57 | % | | | 0.83 | % | | | 0.58 | % |
| | | | | | | | | | | | | | | | | | | | | | | | | | | | |
| | | | | | | |
Supplemental Data | | | | | | | | | | | | | | | | | | | | | | | | | | | | |
Net assets, end of period (000) | | | | | | $ | 46,573 | | | $ | 65,278 | | | $ | 50,074 | | | $ | 89,686 | | | $ | 90,613 | | | $ | 107,992 | |
| | | | | | | | | | | | | | | | | | | | | | | | | | | | |
| | | | | | | |
Portfolio turnover rate | | | | | | | 59 | % | | | 138 | % | | | 54 | % | | | 70 | % | | | 48 | % | | | 56 | % |
| | | | | | | | | | | | | | | | | | | | | | | | | | | | |
| (a) | Based on average shares outstanding. |
| (b) | Distributions for annual periods determined in accordance with U.S. federal income tax regulations. |
| (c) | Where applicable, excludes the effects of any sales charges and assumes the reinvestment of distributions. |
| (d) | Aggregate total return. |
| (e) | Includes payment received from a settlement of litigation which impacted the Fund’s total return. Excluding the payment from a settlement of litigation, the Fund’s total return would have been (39.49)%. |
| (f) | Excludes fees and expenses incurred indirectly as a result of investments in underlying funds. |
| (h) | Audit, printing and tax costs were not annualized in the calculation of the expense ratios. If these expenses were annualized, the total expenses and total expenses after fees waived and/or reimbursed would have been 1.80% and 1.79%, respectively. |
See notes to financial statements.
| | |
| 42 | | 2 0 2 2 BLACK ROCK ANNUAL REPORT TO SHAREHOLDERS |
Financial Highlights (continued)
(For a share outstanding throughout each period)
| | | | | | | | | | | | | | | | | | | | | | | | | | | | |
| | | BlackRock Latin America Fund, Inc. (continued) | |
| | | Investor C | |
| | | |
| | | Year Ended April 30, | | | Period from
11/01/19
to 04/30/20 | | | Year Ended October 31, | |
| | | | | | 2022 | | | 2021 | | | 2019 | | | 2018 | | | 2017 | |
| | | | | | | |
Net asset value, beginning of period | | | | | | $ | 39.51 | | | $ | 28.39 | | | $ | 46.95 | | | $ | 43.75 | | | $ | 43.98 | | | $ | 40.45 | |
| | | | | | | | | | | | | | | | | | | | | | | | | | | | |
| | | | | | | |
Net investment income (loss)(a) | | | | | | | 1.07 | | | | 0.04 | | | | 0.16 | | | | 0.35 | | | | 0.03 | | | | (0.06 | ) |
Net realized and unrealized gain (loss) | | | | | | | (3.67 | ) | | | 11.21 | | | | (18.38 | ) | | | 2.85 | | | | (0.26 | ) | | | 3.72 | |
| | | | | | | | | | | | | | | | | | | | | | | | | | | | |
| | | | | | | |
Net increase (decrease) from investment operations | | | | | | | (2.60 | ) | | | 11.25 | | | | (18.22 | ) | | | 3.20 | | | | (0.23 | ) | | | 3.66 | |
| | | | | | | | | | | | | | | | | | | | | | | | | | | | |
| | | | | | | |
Distributions from net investment income(b) | | | | | | | (1.42 | ) | | | (0.13 | ) | | | (0.34 | ) | | | — | | | | — | | | | (0.13 | ) |
| | | | | | | | | | | | | | | | | | | | | | | | | | | | |
| | | | | | | |
Net asset value, end of period | | | | | | $ | 35.49 | | | $ | 39.51 | | | $ | 28.39 | | | $ | 46.95 | | | $ | 43.75 | | | $ | 43.98 | |
| | | | | | | | | | | | | | | | | | | | | | | | | | | | |
| | | | | | | |
Total Return(c) | | | | | | | | | | | | | | | | | | | | | | | | | | | | |
Based on net asset value | | | | | | | (6.41 | )% | | | 39.72 | % | | | (39.10 | )%(d)(e) | | | 7.31 | % | | | (0.52 | )% | | | 9.12 | % |
| | | | | | | | | | | | | | | | | | | | | | | | | | | | |
| | | | | | | |
Ratios to Average Net Assets(f) | | | | | | | | | | | | | | | | | | | | | | | | | | | | |
Total expenses | | | | | | | 2.80 | % | | | 2.72 | % | | | 2.58 | %(g)(h) | | | 2.42 | % | | | 2.47 | % | | | 2.47 | % |
| | | | | | | | | | | | | | | | | | | | | | | | | | | | |
| | | | | | | |
Total expenses after fees waived and/or reimbursed | | | | | | | 2.75 | % | | | 2.68 | % | | | 2.57 | %(g)(h) | | | 2.42 | % | | | 2.46 | % | | | 2.47 | % |
| | | | | | | | | | | | | | | | | | | | | | | | | | | | |
| | | | | | | |
Net investment income (loss) | | | | | | | 2.84 | % | | | 0.11 | % | | | 0.74 | %(g) | | | 0.77 | % | | | 0.06 | % | | | (0.16 | )% |
| | | | | | | | | | | | | | | | | | | | | | | | | | | | |
| | | | | | | |
Supplemental Data | | | | | | | | | | | | | | | | | | | | | | | | | | | | |
Net assets, end of period (000) | | | | | | $ | 909 | | | $ | 1,417 | | | $ | 2,952 | | | $ | 6,397 | | | $ | 12,014 | | | $ | 16,746 | |
| | | | | | | | | | | | | | | | | | | | | | | | | | | | |
| | | | | | | |
Portfolio turnover rate | | | | | | | 59 | % | | | 138 | % | | | 54 | % | | | 70 | % | | | 48 | % | | | 56 | % |
| | | | | | | | | | | | | | | | | | | | | | | | | | | | |
| (a) | Based on average shares outstanding. |
| (b) | Distributions for annual periods determined in accordance with U.S. federal income tax regulations. |
| (c) | Where applicable, excludes the effects of any sales charges and assumes the reinvestment of distributions. |
| (d) | Aggregate total return. |
| (e) | Includes payment received from a settlement of litigation which impacted the Fund’s total return. Excluding the payment from a settlement of litigation, the Fund’s total return would have been (39.74)%. |
| (f) | Excludes fees and expenses incurred indirectly as a result of investments in underlying funds. |
| (h) | Audit, printing and tax costs were not annualized in the calculation of the expense ratios. If these expenses were annualized, the total expenses and total expenses after fees waived and/or reimbursed would have been 2.64% and 2.63%, respectively. |
See notes to financial statements.
Financial Highlights (continued)
(For a share outstanding throughout each period)
| | | | | | | | | | | | | | | | | | | | | | | | | | | | |
| | | BlackRock Latin America Fund, Inc. (continued) |
| | | Class K |
| | | | |
| | | Year Ended April 30, | | |
| Period from
11/01/19
to 04/30/20 |
| |
| Year Ended
October 31, 2019 |
| |
| Period from
01/25/18 to 10/31/18 |
(a) |
| | | | | | 2022 | | | 2021 | |
| | | | | | | |
Net asset value, beginning of period | | | | | | $ | 43.85 | | | $ | 31.43 | | | $ | 52.43 | | | | | | | $ | 48.92 | | | $ | 55.91 | |
| | | | | | | | | | | | | | | | | | | | | | | | | | | | |
| | | | | | | |
Net investment income(b) | | | | | | | 1.87 | | | | 0.67 | | | | 0.44 | | | | | | | | 0.96 | | | | 0.31 | |
| | | | | | | |
Net realized and unrealized gain (loss) | | | | | | | (4.22 | ) | | | 12.34 | | | | (20.28 | ) | | | | | | | 3.14 | | | | (7.30 | ) |
| | | | | | | | | | | | | | | | | | | | | | | | | | | | |
| | | | | | | |
Net increase (decrease) from investment operations | | | | | | | (2.35 | ) | | | 13.01 | | | | (19.84 | ) | | | | | | | 4.10 | | | | (6.99 | ) |
| | | | | | | | | | | | | | | | | | | | | | | | | | | | |
| | | | | | | |
Distributions from net investment income(c) | | | | | | | (1.99 | ) | | | (0.59 | ) | | | (1.16 | ) | | | | | | | (0.59 | ) | | | — | |
| | | | | | | | | | | | | | | | | | | | | | | | | | | | |
| | | | | | | |
Net asset value, end of period | | | | | | $ | 39.51 | | | $ | 43.85 | | | $ | 31.43 | | | | | | | $ | 52.43 | | | $ | 48.92 | |
| | | | | | | | | | | | | | | | | | | | | | | | | | | | |
| | | | | | | |
Total Return(d) | | | | | | | | | | | | | | | | | | | | | | | | | | | | |
Based on net asset value | | | | | | | (5.16 | )% | | | 41.61 | % | | | (38.74 | )%(e)(f) | | | | | | | 8.55 | % | | | (12.50 | )%(e) |
| | | | | | | | | | | | | | | | | | | | | | | | | | | | |
| | | | | | | |
Ratios to Average Net Assets(g) | | | | | | | | | | | | | | | | | | | | | | | | | | | | |
Total expenses | | | | | | | 1.47 | % | | | 1.41 | % | | | 1.40 | %(h)(i) | | | | | | | 1.27 | % | | | 1.33 | %(h) |
| | | | | | | | | | | | | | | | | | | | | | | | | | | | |
| | | | | | | |
Total expenses after fees waived and/or reimbursed | | | | | | | 1.42 | % | | | 1.36 | % | | | 1.40 | %(h)(i) | | | | | | | 1.27 | % | | | 1.32 | %(h) |
| | | | | | | | | | | | | | | | | | | | | | | | | | | | |
| | | | | | | |
Net investment income | | | | | | | 4.46 | % | | | 1.71 | % | | | 1.89 | %(h) | | | | | | | 1.90 | % | | | 0.84 | %(h) |
| | | | | | | | | | | | | | | | | | | | | | | | | | | | |
| | | | | | | |
Supplemental Data | | | | | | | | | | | | | | | | | | | | | | | | | | | | |
Net assets, end of period (000) | | | | | | $ | 626 | | | $ | 558 | | | $ | 436 | | | | | | | $ | 758 | | | $ | 784 | |
| | | | | | | | | | | | | | | | | | | | | | | | | | | | |
| | | | | | | |
Portfolio turnover rate | | | | | | | 59 | % | | | 138 | % | | | 54 | % | | | | | | | 70 | % | | | 48 | % |
| | | | | | | | | | | | | | | | | | | | | | | | | | | | |
| (a) | Commencement of operations. |
| (b) | Based on average shares outstanding. |
| (c) | Distributions for annual periods determined in accordance with U.S. federal income tax regulations. |
| (d) | Where applicable, assumes the reinvestment of distributions. |
| (e) | Aggregate total return. |
| (f) | Includes payment received from a settlement of litigation which impacted the Fund’s total return. Excluding the payment from a settlement of litigation, the Fund’s total return would have been (39.38)%. |
| (g) | Excludes fees and expenses incurred indirectly as a result of investments in underlying funds. |
| (i) | Audit, printing and tax costs were not annualized in the calculation of the expense ratios. If these expenses were annualized, the total expenses and total expenses after fees waived and/or reimbursed would have been 1.46%. |
See notes to financial statements.
| | |
| 44 | | 2 0 2 2 BLACK ROCK ANNUAL REPORT TO SHAREHOLDERS |
Financial Highlights (continued)
(For a share outstanding throughout each period)
| | | | | | | | | | | | | | | | | | | | | | | | | | | | |
| | | BlackRock Unconstrained Equity Fund | |
| | | Institutional | |
| | | |
| | | Year Ended April 30, | | | Period from
11/01/19
to 04/30/20 | | | Year Ended October 31, | |
| | | | | | 2022 | | | 2021 | | | 2019 | | | 2018 | | | 2017 | |
| | | | | | | |
Net asset value, beginning of period | | | | | | $ | 16.41 | | | $ | 12.18 | | | $ | 14.58 | | | $ | 13.08 | | | $ | 13.09 | | | $ | 10.75 | |
| | | | | | | | | | | | | | | | | | | | | | | | | | | | |
| | | | | | | |
Net investment income (loss)(a) | | | | | | | (0.03 | ) | | | 0.02 | | | | 0.04 | | | | 0.10 | | | | 0.10 | | | | 0.08 | |
Net realized and unrealized gain (loss) | | | | | | | (0.95 | ) | | | 5.77 | | | | (0.80 | ) | | | 2.38 | | | | 0.42 | | | | 2.36 | |
| | | | | | | | | | | | | | | | | | | | | | | | | | | | |
| | | | | | | |
Net increase (decrease) from investment operations | | | | | | | (0.98 | ) | | | 5.79 | | | | (0.76 | ) | | | 2.48 | | | | 0.52 | | | | 2.44 | |
| | | | | | | | | | | | | | | | | | | | | | | | | | | | |
| | | | | | | |
Distributions(b) | | | | | | | | | | | | | | | | | | | | | | | | | | | | |
From net investment income | | | | | | | (0.08 | ) | | | (0.04 | ) | | | (0.12 | ) | | | (0.10 | ) | | | (0.08 | ) | | | (0.10 | ) |
From net realized gain | | | | | | | (3.23 | ) | | | (1.52 | ) | | | (1.52 | ) | | | (0.88 | ) | | | (0.45 | ) | | | — | |
| | | | | | | | | | | | | | | | | | | | | | | | | | | | |
| | | | | | | |
Total distributions | | | | | | | (3.31 | ) | | | (1.56 | ) | | | (1.64 | ) | | | (0.98 | ) | | | (0.53 | ) | | | (0.10 | ) |
| | | | | | | | | | | | | | | | | | | | | | | | | | | | |
| | | | | | | |
Net asset value, end of period | | | | | | $ | 12.12 | | | $ | 16.41 | | | $ | 12.18 | | | $ | 14.58 | | | $ | 13.08 | | | $ | 13.09 | |
| | | | | | | | | | | | | | | | | | | | | | | | | | | | |
| | | | | | | |
Total Return(c) | | | | | | | | | | | | | | | | | | | | | | | | | | | | |
Based on net asset value | | | | | | | (8.74 | )% | | | 50.41 | %(d) | | | (6.45 | )%(e) | | | 20.73 | % | | | 4.04 | % | | | 22.89 | % |
| | | | | | | | | | | | | | | | | | | | | | | | | | | | |
| | | | | | | |
Ratios to Average Net Assets(f) | | | | | | | | | | | | | | | | | | | | | | | | | | | | |
Total expenses | | | | | | | 1.02 | %(g) | | | 1.05 | %(h) | | | 1.04 | %(i)(j) | | | 1.01 | % | | | 1.01 | % | | | 1.01 | % |
| | | | | | | | | | | | | | | | | | | | | | | | | | | | |
| | | | | | | |
Total expenses after fees waived and/or reimbursed | | | | | | | 0.95 | %(g) | | | 1.00 | %(h) | | | 0.99 | %(i)(j) | | | 0.96 | % | | | 0.96 | % | | | 0.99 | % |
| | | | | | | | | | | | | | | | | | | | | | | | | | | | |
| | | | | | | |
Net investment income (loss) | | | | | | | (0.20 | )% | | | 0.15 | % | | | 0.67 | %(i) | | | 0.76 | % | | | 0.75 | % | | | 0.68 | % |
| | | | | | | | | | | | | | | | | | | | | | | | | | | | |
| | | | | | | |
Supplemental Data | | | | | | | | | | | | | | | | | | | | | | | | | | | | |
Net assets, end of period (000) | | | | | | $ | 49,303 | | | $ | 52,716 | | | $ | 38,428 | | | $ | 45,641 | | | $ | 44,879 | | | $ | 48,196 | |
| | | | | | | | | | | | | | | | | | | | | | | | | | | | |
| | | | | | | |
Portfolio turnover rate | | | | | | | 100 | % | | | 83 | % | | | 27 | % | | | 42 | % | | | 24 | % | | | 28 | % |
| | | | | | | | | | | | | | | | | | | | | | | | | | | | |
| (a) | Based on average shares outstanding. |
| (b) | Distributions for annual periods determined in accordance with U.S. federal income tax regulations. |
| (c) | Where applicable, assumes the reinvestment of distributions. |
| (d) | Includes payment from an affiliate, which had no impact on the Fund’s total return. |
| (e) | Aggregate total return. |
| (f) | Excludes fees and expenses incurred indirectly as a result of investments in underlying funds. |
| (g) | Includes non-recurring expenses of proxy costs. Without these costs, total expenses and total expenses after fees waived and/or reimbursed would have been 0.99% and 0.92%, respectively. |
| (h) | Includes non-recurring expenses of proxy costs. Without these costs, total expenses and total expenses after fees waived and/or reimbursed would have been 1.01% and 0.96%, respectively. |
| (j) | Audit, printing and tax cost expenses were not annualized in the calculation of the expense ratios. If these expenses were annualized, the total expenses and total expenses after fees waived and/or reimbursed would have been 1.07% and 1.02%, respectively. |
See notes to financial statements.
Financial Highlights (continued)
(For a share outstanding throughout each period)
| | | | | | | | | | | | | | | | | | | | | | | | | | | | |
| | | BlackRock Unconstrained Equity Fund (continued) | |
| | | Investor A | |
| | | |
| | | Year Ended April 30, | | | Period from
11/01/19
to 04/30/20 | | | Year Ended October 31, | |
| | | | | | 2022 | | | 2021 | | | 2019 | | | 2018 | | | 2017 | |
| | | | | | | |
Net asset value, beginning of period | | | | | | $ | 16.41 | | | $ | 12.17 | | | $ | 14.55 | | | $ | 13.05 | | | $ | 13.06 | | | $ | 10.72 | |
| | | | | | | | | | | | | | | | | | | | | | | | | | | | |
| | | | | | | |
Net investment income (loss)(a) | | | | | | | (0.06 | ) | | | (0.01 | ) | | | 0.03 | | | | 0.07 | | | | 0.07 | | | | 0.05 | |
Net realized and unrealized gain (loss) | | | | | | | (0.97 | ) | | | 5.77 | | | | (0.82 | ) | | | 2.38 | | | | 0.42 | | | | 2.36 | |
| | | | | | | | | | | | | | | | | | | | | | | | | | | | |
| | | | | | | |
Net increase (decrease) from investment operations | | | | | | | (1.03 | ) | | | 5.76 | | | | (0.79 | ) | | | 2.45 | | | | 0.49 | | | | 2.41 | |
| | | | | | | | | | | | | | | | | | | | | | | | | | | | |
| | | | | | | |
Distributions(b) | | | | | | | | | | | | | | | | | | | | | | | | | | | | |
From net investment income | | | | | | | (0.07 | ) | | | (0.03 | ) | | | (0.07 | ) | | | (0.07 | ) | | | (0.05 | ) | | | (0.07 | ) |
From net realized gain | | | | | | | (3.20 | ) | | | (1.49 | ) | | | (1.52 | ) | | | (0.88 | ) | | | (0.45 | ) | | | — | |
| | | | | | | | | | | | | | | | | | | | | | | | | | | | |
| | | | | | | |
Total distributions | | | | | | | (3.27 | ) | | | (1.52 | ) | | | (1.59 | ) | | | (0.95 | ) | | | (0.50 | ) | | | (0.07 | ) |
| | | | | | | | | | | | | | | | | | | | | | | | | | | | |
| | | | | | | |
Net asset value, end of period | | | | | | $ | 12.11 | | | $ | 16.41 | | | $ | 12.17 | | | $ | 14.55 | | | $ | 13.05 | | | $ | 13.06 | |
| | | | | | | | | | | | | | | | | | | | | | | | | | | | |
| | | | | | | |
Total Return(c) | | | | | | | | | | | | | | | | | | | | | | | | | | | | |
Based on net asset value | | | | | | | (9.04 | )% | | | 50.17 | %(d) | | | (6.61 | )%(e) | | | 20.42 | % | | | 3.78 | % | | | 22.59 | % |
| | | | | | | | | | | | | | | | | | | | | | | | | | | | |
| | | | | | | |
Ratios to Average Net Assets(f) | | | | | | | | | | | | | | | | | | | | | | | | | | | | |
Total expenses | | | | | | | 1.26 | %(g) | | | 1.30 | %(h) | | | 1.30 | %(i)(j) | | | 1.27 | % | | | 1.27 | % | | | 1.27 | % |
| | | | | | | | | | | | | | | | | | | | | | | | | | | | |
| | | | | | | |
Total expenses after fees waived and/or reimbursed | | | | | | | 1.21 | %(g) | | | 1.25 | %(h) | | | 1.25 | %(i)(j) | | | 1.22 | % | | | 1.22 | % | | | 1.25 | % |
| | | | | | | | | | | | | | | | | | | | | | | | | | | | |
| | | | | | | |
Net investment income (loss) | | | | | | | (0.44 | )% | | | (0.10 | )% | | | 0.43 | %(i) | | | 0.50 | % | | | 0.49 | % | | | 0.40 | % |
| | | | | | | | | | | | | | | | | | | | | | | | | | | | |
| | | | | | | |
Supplemental Data | | | | | | | | | | | | | | | | | | | | | | | | | | | | |
Net assets, end of period (000) | | | | | | $ | 209,352 | | | $ | 252,119 | | | $ | 182,892 | | | $ | 211,071 | | | $ | 194,416 | | | $ | 214,372 | |
| | | | | | | | | | | | | | | | | | | | | | | | | | | | |
| | | | | | | |
Portfolio turnover rate | | | | | | | 100 | % | | | 83 | % | | | 27 | % | | | 42 | % | | | 24 | % | | | 28 | % |
| | | | | | | | | | | | | | | | | | | | | | | | | | | | |
| (a) | Based on average shares outstanding. |
| (b) | Distributions for annual periods determined in accordance with U.S. federal income tax regulations. |
| (c) | Where applicable, excludes the effects of any sales charges and assumes the reinvestment of distributions. |
| (d) | Includes payment from an affiliate, which had no impact on the Fund’s total return. |
| (e) | Aggregate total return. |
| (f) | Excludes fees and expenses incurred indirectly as a result of investments in underlying funds. |
| (g) | Includes non-recurring expenses of proxy costs. Without these costs, total expenses and total expenses after fees waived and/or reimbursed would have been 1.23% and 1.18%, respectively. |
| (h) | Includes non-recurring expenses of proxy costs. Without these costs, total expenses and total expenses after fees waived and/or reimbursed would have been 1.26% and 1.21%, respectively. |
| (j) | Audit, printing and tax cost expenses were not annualized in the calculation of the expense ratios. If these expenses were annualized, the total expenses and total expenses after fees waived and/or reimbursed would have been 1.33% and 1.28%, respectively. |
See notes to financial statements.
| | |
| 46 | | 2 0 2 2 BLACK ROCK ANNUAL REPORT TO SHAREHOLDERS |
Financial Highlights (continued)
(For a share outstanding throughout each period)
| | | | | | | | | | | | | | | | | | | | | | | | | | | | |
| | | BlackRock Unconstrained Equity Fund (continued) | |
| | | Investor C | |
| | | |
| | | Year Ended April 30, | | | Period from
11/01/19
to 04/30/20 | | | Year Ended October 31, | |
| | | | | | 2022 | | | 2021 | | | 2019 | | | 2018 | | | 2017 | |
| | | | | | | |
Net asset value, beginning of period | | | | | | $ | 16.54 | | | $ | 12.22 | | | $ | 14.50 | | | $ | 12.87 | | | $ | 12.94 | | | $ | 10.65 | |
| | | | | | | | | | | | | | | | | | | | | | | | | | | | |
| | | | | | | |
Net investment loss(a) | | | | | | | (0.19 | ) | | | (0.18 | ) | | | (0.03 | ) | | | (0.05 | ) | | | (0.04 | ) | | | (0.03 | ) |
Net realized and unrealized gain (loss) | | | | | | | (0.97 | ) | | | 5.83 | | | | (0.82 | ) | | | 2.40 | | | | 0.42 | | | | 2.32 | |
| | | | | | | | | | | | | | | | | | | | | | | | | | | | |
| | | | | | | |
Net increase (decrease) from investment operations | | | | | | | (1.16 | ) | | | 5.65 | | | | (0.85 | ) | | | 2.35 | | | | 0.38 | | | | 2.29 | |
| | | | | | | | | | | | | | | | | | | | | | | | | | | | |
| | | | | | | |
Distributions | | | | | | | | | | | | | | | | | | | | | | | | | | | | |
From net investment income | | | | | | | (0.02 | ) | | | — | | | | — | | | | — | | | | — | | | | — | |
From net realized gain(b) | | | | | | | (3.11 | ) | | | (1.33 | ) | | | (1.43 | ) | | | (0.72 | ) | | | (0.45 | ) | | | — | |
| | | | | | | | | | | | | | | | | | | | | | | | | | | | |
| | | | | | | |
Total distributions | | | | | | | (3.13 | ) | | | (1.33 | ) | | | (1.43 | ) | | | (0.72 | ) | | | (0.45 | ) | | | — | |
| | | | | | | | | | | | | | | | | | | | | | | | | | | | |
| | | | | | | |
Net asset value, end of period | | | | | | $ | 12.25 | | | $ | 16.54 | | | $ | 12.22 | | | $ | 14.50 | | | $ | 12.87 | | | $ | 12.94 | |
| | | | | | | | | | | | | | | | | | | | | | | | | | | | |
| | | | | | | |
Total Return(c) | | | | | | | | | | | | | | | | | | | | | | | | | | | | |
Based on net asset value | | | | | | | (9.75 | )% | | | 48.76 | %(d) | | | (6.97 | )%(e) | | | 19.54 | % | | | 2.96 | % | | | 21.50 | % |
| | | | | | | | | | | | | | | | | | | | | | | | | | | | |
| | | | | | | |
Ratios to Average Net Assets(f) | | | | | | | | | | | | | | | | | | | | | | | | | | | | |
Total expenses | | | | | | | 2.14 | %(g) | | | 2.18 | %(h) | | | 2.13 | %(i)(j) | | | 2.07 | % | | | 2.03 | % | | | 2.07 | % |
| | | | | | | | | | | | | | | | | | | | | | | | | | | | |
| | | | | | | |
Total expenses after fees waived and/or reimbursed | | | | | | | 2.07 | %(g) | | | 2.13 | %(h) | | | 2.08 | %(i)(j) | | | 2.02 | % | | | 1.98 | % | | | 2.06 | % |
| | | | | | | | | | | | | | | | | | | | | | | | | | | | |
| | | | | | | |
Net investment loss | | | | | | | (1.30 | )% | | | (1.28 | )% | | | (0.42 | )%(i) | | | (0.35 | )% | | | (0.27 | )% | | | (0.26 | )% |
| | | | | | | | | | | | | | | | | | | | | | | | | | | | |
| | | | | | | |
Supplemental Data | | | | | | | | | | | | | | | | | | | | | | | | | | | | |
Net assets, end of period (000) | | | | | | $ | 1,432 | | | $ | 2,022 | | | $ | 6,501 | | | $ | 8,502 | | | $ | 18,464 | | | $ | 25,518 | |
| | | | | | | | | | | | | | | | | | | | | | | | | | | | |
| | | | | | | |
Portfolio turnover rate | | | | | | | 100 | % | | | 83 | % | | | 27 | % | | | 42 | % | | | 24 | % | | | 28 | % |
| | | | | | | | | | | | | | | | | | | | | | | | | | | | |
| (a) | Based on average shares outstanding. |
| (b) | Distributions for annual periods determined in accordance with U.S. federal income tax regulations. |
| (c) | Where applicable, excludes the effects of any sales charges and assumes the reinvestment of distributions. |
| (d) | Includes payment from an affiliate, which had no impact on the Fund’s total return. |
| (e) | Aggregate total return. |
| (f) | Excludes fees and expenses incurred indirectly as a result of investments in underlying funds. |
| (g) | Includes non-recurring expenses of proxy costs. Without these costs, total expenses and total expenses after fees waived and/or reimbursed would have been 2.11% and 2.04%, respectively. |
| (h) | Includes non-recurring expenses of proxy costs. Without these costs, total expenses and total expenses after fees waived and/or reimbursed would have been 2.15% and 2.10%, respectively. |
| (j) | Audit, printing and tax cost expenses were not annualized in the calculation of the expense ratios. If these expenses were annualized, the total expenses and total expenses after fees waived and/or reimbursed would have been 2.16% and 2.11%, respectively. |
See notes to financial statements.
Financial Highlights (continued)
(For a share outstanding throughout each period)
| | | | | | | | | | | | | | | | | | | | | | | | | | | | |
| | | BlackRock Unconstrained Equity Fund (continued) | |
| | | Class R | |
| | | |
| | | Year Ended April 30, | | | Period from
11/01/19
to 04/30/20 | | | Year Ended October 31, | |
| | | | | | 2022 | | | 2021 | | | 2019 | | | 2018 | | | 2017 | |
| | | | | | | |
Net asset value, beginning of period | | | | | | $ | 16.59 | | | $ | 12.28 | | | $ | 14.60 | | | $ | 13.06 | | | $ | 13.08 | | | $ | 10.72 | |
| | | | | | | | | | | | | | | | | | | | | | | | | | | | |
| | | | | | | |
Net investment income (loss)(a) | | | | | | | (0.13 | ) | | | (0.08 | ) | | | 0.00 | (b) | | | 0.01 | | | | 0.01 | | | | 0.01 | |
Net realized and unrealized gain (loss) | | | | | | | (0.99 | ) | | | 5.85 | | | | (0.82 | ) | | | 2.40 | | | | 0.42 | | | | 2.36 | |
| | | | | | | | | | | | | | | | | | | | | | | | | | | | |
| | | | | | | |
Net increase (decrease) from investment operations | | | | | | | (1.12 | ) | | | 5.77 | | | | (0.82 | ) | | | 2.41 | | | | 0.43 | | | | 2.37 | |
| | | | | | | | | | | | | | | | | | | | | | | | | | | | |
| | | | | | | |
Distributions(c) | | | | | | | | | | | | | | | | | | | | | | | | | | | | |
From net investment income | | | | | | | (0.03 | ) | | | — | | | | — | | | | — | | | | — | | | | (0.01 | ) |
From net realized gain | | | | | | | (3.14 | ) | | | (1.46 | ) | | | (1.50 | ) | | | (0.87 | ) | | | (0.45 | ) | | | — | |
| | | | | | | | | | | | | | | | | | | | | | | | | | | | |
| | | | | | | |
Total distributions | | | | | | | (3.17 | ) | | | (1.46 | ) | | | (1.50 | ) | | | (0.87 | ) | | | (0.45 | ) | | | (0.01 | ) |
| | | | | | | | | | | | | | | | | | | | | | | | | | | | |
| | | | | | | |
Net asset value, end of period | | | | | | $ | 12.30 | | | $ | 16.59 | | | $ | 12.28 | | | $ | 14.60 | | | $ | 13.06 | | | $ | 13.08 | |
| | | | | | | | | | | | | | | | | | | | | | | | | | | | |
| | | | | | | |
Total Return(d) | | | | | | | | | | | | | | | | | | | | | | | | | | | | |
Based on net asset value | | | | | | | (9.42 | )% | | | 49.61 | %(e) | | | (6.74 | )%(f) | | | 19.94 | % | | | 3.32 | % | | | 22.09 | % |
| | | | | | | | | | | | | | | | | | | | | | | | | | | | |
| | | | | | | |
Ratios to Average Net Assets(g) | | | | | | | | | | | | | | | | | | | | | | | | | | | | |
Total expenses | | | | | | | 1.83 | %(h) | | | 1.65 | %(i) | | | 1.71 | %(j)(k) | | | 1.67 | % | | | 1.65 | % | | | 1.70 | % |
| | | | | | | | | | | | | | | | | | | | | | | | | | | | |
| | | | | | | |
Total expenses after fees waived and/or reimbursed | | | | | | | 1.66 | %(h) | | | 1.59 | %(i) | | | 1.64 | %(j)(k) | | | 1.62 | % | | | 1.60 | % | | | 1.65 | % |
| | | | | | | | | | | | | | | | | | | | | | | | | | | | |
| | | | | | | |
Net investment income (loss) | | | | | | | (0.85 | )% | | | (0.55 | )% | | | 0.03 | %(j) | | | 0.09 | % | | | 0.07 | % | | | 0.05 | % |
| | | | | | | | | | | | | | | | | | | | | | | | | | | | |
| | | | | | | |
Supplemental Data | | | | | | | | | | | | | | | | | | | | | | | | | | | | |
Net assets, end of period (000) | | | | | | $ | 230 | | | $ | 377 | | | $ | 683 | | | $ | 806 | | | $ | 1,100 | | | $ | 2,099 | |
| | | | | | | | | | | | | | | | | | | | | | | | | | | | |
| | | | | | | |
Portfolio turnover rate | | | | | | | 100 | % | | | 83 | % | | | 27 | % | | | 42 | % | | | 24 | % | | | 28 | % |
| | | | | | | | | | | | | | | | | | | | | | | | | | | | |
| (a) | Based on average shares outstanding. |
| (b) | Amount is less than $0.00005 per share. |
| (c) | Distributions for annual periods determined in accordance with U.S. federal income tax regulations. |
| (d) | Where applicable, assumes the reinvestment of distributions. |
| (e) | Includes payment from an affiliate, which had no impact on the Fund’s total return. |
| (f) | Aggregate total return. |
| (g) | Excludes fees and expenses incurred indirectly as a result of investments in underlying funds. |
| (h) | Includes non-recurring expenses of proxy costs. Without these costs, total expenses and total expenses after fees waived and/or reimbursed would have been 1.79% and 1.62%, respectively |
| (i) | Includes non-recurring expenses of proxy costs. Without these costs, total expenses and total expenses after fees waived and/or reimbursed would have been 1.62% and 1.56%, respectively. |
| (k) | Audit, printing and tax cost expenses were not annualized in the calculation of the expense ratios. If these expenses were annualized, the total expenses and total expenses after fees waived and/or reimbursed would have been 1.74% and 1.67%, respectively. |
See notes to financial statements.
| | |
| 48 | | 2 0 2 2 BLACK ROCK ANNUAL REPORT TO SHAREHOLDERS |
Financial Highlights (continued)
(For a share outstanding throughout each period)
| | | | | | | | | | | | | | | | | | | | | | | | | | | | |
| | | BlackRock Sustainable Emerging Markets Equity Fund | |
| | | Institutional | |
| | | |
| | | Year Ended April 30, | | | Period from
01/01/20
to 04/30/20 | | | Year Ended December 31, | |
| | | | | | 2022 | | | 2021 | | | 2019 | | | 2018 | | | 2017 | |
| | | | | | | |
Net asset value, beginning of period | | | | | | $ | 20.51 | | | $ | 14.31 | | | $ | 16.41 | | | $ | 13.58 | | | $ | 17.15 | | | $ | 16.06 | |
| | | | | | | | | | | | | | | | | | | | | | | | | | | | |
| | | | | | | |
Net investment income (loss)(a) | | | | | | | 0.18 | | | | 0.15 | | | | (0.03 | ) | | | 0.15 | | | | 0.15 | | | | 0.21 | |
Net realized and unrealized gain (loss) | | | | | | | (4.73 | ) | | | 6.16 | | | | (2.07 | ) | | | 2.83 | | | | (3.00 | ) | | | 4.25 | |
| | | | | | | | | | | | | | | | | | | | | | | | | | | | |
| | | | | | | |
Net increase (decrease) from investment operations | | | | | | | (4.55 | ) | | | 6.31 | | | | (2.10 | ) | | | 2.98 | | | | (2.85 | ) | | | 4.46 | |
| | | | | | | | | | | | | | | | | | | | | | | | | | | | |
| | | | | | | |
Distributions(b) | | | | | | | | | | | | | | | | | | | | | | | | | | | | |
From net investment income | | | | | | | (0.15 | ) | | | (0.11 | ) | | | — | | | | (0.15 | ) | | | (0.12 | ) | | | (0.47 | ) |
From net realized gain | | | | | | | (2.80 | ) | | | — | | | | — | | | | — | | | | (0.60 | ) | | | (2.90 | ) |
| | | | | | | | | | | | | | | | | | | | | | | | | | | | |
| | | | | | | |
Total distributions | | | | | | | (2.95 | ) | | | (0.11 | ) | | | — | | | | (0.15 | ) | | | (0.72 | ) | | | (3.37 | ) |
| | | | | | | | | | | | | | | | | | | | | | | | | | | | |
| | | | | | | |
Net asset value, end of period | | | | | | $ | 13.01 | | | $ | 20.51 | | | $ | 14.31 | | | $ | 16.41 | | | $ | 13.58 | | | $ | 17.15 | |
| | | | | | | | | | | | | | | | | | | | | | | | | | | | |
| | | | | | | |
Total Return(c) | | | | | | | | | | | | | | | | | | | | | | | | | | | | |
Based on net asset value | | | | | | | (25.22 | )% | | | 44.25 | % | | | (12.80 | )%(d) | | | 21.97 | % | | | (16.73 | )% | | | 28.38 | % |
| | | | | | | | | | | | | | | | | | | | | | | | | | | | |
| | | | | | | |
Ratios to Average Net Assets(e) | | | | | | | | | | | | | | | | | | | | | | | | | | | | |
Total expenses | | | | | | | 1.03 | % | | | 0.99 | % | | | 1.14 | %(f)(g) | | | 0.99 | % | | | 1.06 | % | | | 1.22 | % |
| | | | | | | | | | | | | | | | | | | | | | | | | | | | |
| | | | | | | |
Total expenses after fees waived and/or reimbursed | | | | | | | 0.93 | % | | | 0.99 | % | | | 1.14 | %(f)(g) | | | 0.99 | % | | | 1.05 | % | | | 1.11 | % |
| | | | | | | | | | | | | | | | | | | | | | | | | | | | |
| | | | | | | |
Net investment income (loss) | | | | | | | 1.03 | % | | | 0.81 | % | | | (0.56 | )%(f) | | | 1.02 | % | | | 0.94 | % | | | 1.14 | % |
| | | | | | | | | | | | | | | | | | | | | | | | | | | | |
| | | | | | | |
Supplemental Data | | | | | | | | | | | | | | | | | | | | | | | | | | | | |
Net assets, end of period (000) | | | | | | $ | 49,410 | | | $ | 87,154 | | | $ | 58,412 | | | $ | 71,202 | | | $ | 68,280 | | | $ | 112,064 | |
| | | | | | | | | | | | | | | | | | | | | | | | | | | | |
| | | | | | | |
Portfolio turnover rate | | | | | | | 139 | % | | | 81 | % | | | 13 | % | | | 55 | % | | | 44 | % | | | 123 | % |
| | | | | | | | | | | | | | | | | | | | | | | | | | | | |
| (a) | Based on average shares outstanding. |
| (b) | Distributions for annual periods determined in accordance with U.S. federal income tax regulations. |
| (c) | Where applicable, assumes the reinvestment of distributions. |
| (d) | Aggregate total return. |
| (e) | Excludes fees and expenses incurred indirectly as a result of investments in underlying funds. |
| (g) | Audit, printing and tax costs were not annualized in the calculation of the expense ratios. If these expenses were annualized, the total expenses and total expenses after fees waived and/or reimbursed would have been 1.31%. |
See notes to financial statements.
Financial Highlights (continued)
(For a share outstanding throughout each period)
| | | | | | | | | | | | | | | | | | | | | | | | | | | | |
| | | BlackRock Sustainable Emerging Markets Equity Fund (continued) | |
| | | Investor A | |
| | | |
| | | Year Ended April 30, | | | Period from
01/01/20
to 04/30/20 | | | Year Ended December 31, | |
| | | | | | 2022 | | | 2021 | | | 2019 | | | 2018 | | | 2017 | |
| | | | | | | |
Net asset value, beginning of period | | | | | | $ | 20.21 | | | $ | 14.12 | | | $ | 16.20 | | | $ | 13.41 | | | $ | 16.94 | | | $ | 15.89 | |
| | | | | | | | | | | | | | | | | | | | | | | | | | | | |
| | | | | | | |
Net investment income (loss)(a) | | | | | | | 0.13 | | | | 0.10 | | | | (0.04 | ) | | | 0.11 | | | | 0.11 | | | | 0.17 | |
Net realized and unrealized gain (loss) | | | | | | | (4.65 | ) | | | 6.08 | | | | (2.04 | ) | | | 2.78 | | | | (2.96 | ) | | | 4.20 | |
| | | | | | | | | | | | | | | | | | | | | | | | | | | | |
| | | | | | | |
Net increase (decrease) from investment operations | | | | | | | (4.52 | ) | | | 6.18 | | | | (2.08 | ) | | | 2.89 | | | | (2.85 | ) | | | 4.37 | |
| | | | | | | | | | | | | | | | | | | | | | | | | | | | |
| | | | | | | |
Distributions(b) | | | | | | | | | | | | | | | | | | | | | | | | | | | | |
From net investment income | | | | | | | (0.10 | ) | | | (0.09 | ) | | | — | | | | (0.10 | ) | | | (0.08 | ) | | | (0.42 | ) |
From net realized gain | | | | | | | (2.80 | ) | | | — | | | | — | | | | — | | | | (0.60 | ) | | | (2.90 | ) |
| | | | | | | | | | | | | | | | | | | | | | | | | | | | |
| | | | | | | |
Total distributions | | | | | | | (2.90 | ) | | | (0.09 | ) | | | — | | | | (0.10 | ) | | | (0.68 | ) | | | (3.32 | ) |
| | | | | | | | | | | | | | | | | | | | | | | | | | | | |
| | | | | | | |
Net asset value, end of period | | | | | | $ | 12.79 | | | $ | 20.21 | | | $ | 14.12 | | | $ | 16.20 | | | $ | 13.41 | | | $ | 16.94 | |
| | | | | | | | | | | | | | | | | | | | | | | | | | | | |
| | | | | | | |
Total Return(c) | | | | | | | | | | | | | | | | | | | | | | | | | | | | |
Based on net asset value | | | | | | | (25.40 | )% | | | 43.86 | % | | | (12.84 | )%(d) | | | 21.63 | % | | | (16.95 | )% | | | 28.15 | % |
| | | | | | | | | | | | | | | | | | | | | | | | | | | | |
| | | | | | | |
Ratios to Average Net Assets(e) | | | | | | | | | | | | | | | | | | | | | | | | | | | | |
Total expenses | | | | | | | 1.28 | % | | | 1.23 | % | | | 1.40 | %(f)(g) | | | 1.25 | % | | | 1.31 | % | | | 1.43 | % |
| | | | | | | | | | | | | | | | | | | | | | | | | | | | |
| | | | | | | |
Total expenses after fees waived and/or reimbursed | | | | | | | 1.18 | % | | | 1.23 | % | | | 1.40 | %(f)(g) | | | 1.25 | % | | | 1.30 | % | | | 1.32 | % |
| | | | | | | | | | | | | | | | | | | | | | | | | | | | |
| | | | | | | |
Net investment income (loss) | | | | | | | 0.75 | % | | | 0.56 | % | | | (0.83 | )%(f) | | | 0.75 | % | | | 0.72 | % | | | 0.94 | % |
| | | | | | | | | | | | | | | | | | | | | | | | | | | | |
| | | | | | | |
Supplemental Data | | | | | | | | | | | | | | | | | | | | | | | | | | | | |
Net assets, end of period (000) | | | | | | $ | 51,393 | | | $ | 77,884 | | | $ | 59,493 | | | $ | 73,416 | | | $ | 70,891 | | | $ | 109,600 | |
| | | | | | | | | | | | | | | | | | | | | | | | | | | | |
| | | | | | | |
Portfolio turnover rate | | | | | | | 139 | % | | | 81 | % | | | 13 | % | | | 55 | % | | | 44 | % | | | 123 | % |
| | | | | | | | | | | | | | | | | | | | | | | | | | | | |
| (a) | Based on average shares outstanding. |
| (b) | Distributions for annual periods determined in accordance with U.S. federal income tax regulations. |
| (c) | Where applicable, excludes the effects of any sales charges and assumes the reinvestment of distributions. |
| (d) | Aggregate total return. |
| (e) | Excludes fees and expenses incurred indirectly as a result of investments in underlying funds. |
| (g) | Audit, printing and tax costs were not annualized in the calculation of the expense ratios. If these expenses were annualized, the total expenses and total expenses after fees waived and/or reimbursed would have been 1.57%. |
See notes to financial statements.
| | |
| 50 | | 2 0 2 2 BLACK ROCK ANNUAL REPORT TO SHAREHOLDERS |
Financial Highlights (continued)
(For a share outstanding throughout each period)
| | | | | | | | | | | | | | | | | | | | | | | | |
| | | BlackRock Sustainable Emerging Markets Equity Fund (continued) |
| | | Class K |
| | | | |
| | | Year Ended April 30, | | |
| Period from
01/01/20
to 04/30/20 |
| |
| Year Ended
12/31/19 |
| |
| Period from
01/25/18 to 12/31/18 |
(a) |
| | | | | | 2022 | | | 2021 | |
| | | | | | |
Net asset value, beginning of period | | | | | | $ | 20.49 | | | $ | 14.30 | | | $ | 16.40 | | | $ | 13.57 | | | $ | 18.69 | |
| | | | | | | | | | | | | | | | | | | | | | | | |
| | | | | | |
Net investment income (loss)(b) | | | | | | | 0.18 | | | | 0.14 | | | | (0.02 | ) | | | 0.16 | | | | 0.22 | |
Net realized and unrealized gain (loss) | | | | | | | (4.71 | ) | | | 6.16 | | | | (2.08 | ) | | | 2.82 | | | | (4.60 | ) |
| | | | | | | | | | | | | | | | | | | | | | | | |
| | | | | | |
Net increase (decrease) from investment operations | | | | | | | (4.53 | ) | | | 6.30 | | | | (2.10 | ) | | | 2.98 | | | | (4.38 | ) |
| | | | | | | | | | | | | | | | | | | | | | | | |
| | | | | | |
Distributions(c) | | | | | | | | | | | | | | | | | | | | | | | | |
From net investment income | | | | | | | (0.16 | ) | | | (0.11 | ) | | | — | | | | (0.15 | ) | | | (0.14 | ) |
From net realized gain | | | | | | | (2.80 | ) | | | — | | | | — | | | | — | | | | (0.60 | ) |
| | | | | | | | | | | | | | | | | | | | | | | | |
| | | | | | |
Total distributions | | | | | | | (2.96 | ) | | | (0.11 | ) | | | — | | | | (0.15 | ) | | | (0.74 | ) |
| | | | | | | | | | | | | | | | | | | | | | | | |
| | | | | | |
Net asset value, end of period | | | | | | $ | 13.00 | | | $ | 20.49 | | | $ | 14.30 | | | $ | 16.40 | | | $ | 13.57 | |
| | | | | | | | | | | | | | | | | | | | | | | | |
| | | | | | |
Total Return(d) | | | | | | | | | | | | | | | | | | | | | | | | |
Based on net asset value | | | | | | | (25.14 | )% | | | 44.18 | % | | | (12.80 | )%(e) | | | 22.05 | % | | | (23.55 | )%(e) |
| | | | | | | | | | | | | | | | | | | | | | | | |
| | | | | | |
Ratios to Average Net Assets(f) | | | | | | | | | | | | | | | | | | | | | | | | |
Total expenses | | | | | | | 1.01 | % | | | 1.01 | % | | | 1.10 | %(g)(h) | | | 0.96 | % | | | 1.00 | %(g)(i) |
| | | | | | | | | | | | | | | | | | | | | | | | |
| | | | | | |
Total expenses after fees waived and/or reimbursed | | | | | | | 0.87 | % | | | 1.01 | % | | | 1.10 | %(g)(h) | | | 0.96 | % | | | 1.00 | %(g) |
| | | | | | | | | | | | | | | | | | | | | | | | |
| | | | | | |
Net investment income (loss) | | | | | | | 1.03 | % | | | 0.80 | % | | | (0.42 | )%(g) | | | 1.03 | % | | | 1.52 | %(g) |
| | | | | | | | | | | | | | | | | | | | | | | | |
| | | | | | |
Supplemental Data | | | | | | | | | | | | | | | | | | | | | | | | |
Net assets, end of period (000) | | | | | | $ | 1,275 | | | $ | 1,488 | | | $ | 809 | | | $ | 699 | | | $ | 446 | |
| | | | | | | | | | | | | | | | | | | | | | | | |
| | | | | | |
Portfolio turnover rate | | | | | | | 139 | % | | | 81 | % | | | 13 | % | | | 55 | % | | | 44 | % |
| | | | | | | | | | | | | | | | | | | | | | | | |
| (a) | Commencement of operations. |
| (b) | Based on average shares outstanding. |
| (c) | Distributions for annual periods determined in accordance with U.S. federal income tax regulations. |
| (d) | Where applicable, assumes the reinvestment of distributions. |
| (e) | Aggregate total return. |
| (f) | Excludes fees and expenses incurred indirectly as a result of investments in underlying funds. |
| (h) | Audit, printing and tax costs were not annualized in the calculation of the expense ratios. If these expenses were annualized, the total expenses and total expenses after fees waived and/or reimbursed would have been 1.27% and 1.27%, respectively. |
| (i) | Offering costs were not annualized in the calculation of the expense ratios. If these expenses were annualized, the total expenses would have been 1.00%. |
See notes to financial statements.
Financial Highlights (continued)
(For a share outstanding throughout each period)
| | | | | | | | | | | | | | | | | | | | | | | | | | | | |
| | | BlackRock Sustainable Emerging Markets Equity Fund (continued) | |
| | | Class R | |
| | | |
| | | Year Ended April 30, | | | Period from
01/01/20
to 04/30/20 | | | Year Ended December 31, | |
| | | | | | 2022 | | | 2021 | | | 2019 | | | 2018 | | | 2017 | |
| | | | | | | |
Net asset value, beginning of period | | | | | | $ | 15.31 | | | $ | 10.73 | | | $ | 12.33 | | | $ | 10.20 | | | $ | 13.07 | | | $ | 12.89 | |
| | | | | | | | | | | | | | | | | | | | | | | | | | | | |
| | | | | | | |
Net investment income (loss)(a) | | | | | | | 0.05 | | | | 0.04 | | | | (0.05 | ) | | | 0.03 | | | | 0.04 | | | | 0.07 | |
Net realized and unrealized gain (loss) | | | | | | | (3.37 | ) | | | 4.60 | | | | (1.55 | ) | | | 2.12 | | | | (2.28 | ) | | | 3.38 | |
| | | | | | | | | | | | | | | | | | | | | | | | | | | | |
| | | | | | | |
Net increase (decrease) from investment operations | | | | | | | (3.32 | ) | | | 4.64 | | | | (1.60 | ) | | | 2.15 | | | | (2.24 | ) | | | 3.45 | |
| | | | | | | | | | | | | | | | | | | | | | | | | | | | |
| | | | | | | |
Distributions(b) | | | | | | | | | | | | | | | | | | | | | | | | | | | | |
From net investment income | | | | | | | (0.07 | ) | | | (0.06 | ) | | | — | | | | (0.02 | ) | | | (0.03 | ) | | | (0.37 | ) |
From net realized gain | | | | | | | (2.80 | ) | | | — | | | | — | | | | — | | | | (0.60 | ) | | | (2.90 | ) |
| | | | | | | | | | | | | | | | | | | | | | | | | | | | |
| | | | | | | |
Total distributions | | | | | | | (2.87 | ) | | | (0.06 | ) | | | — | | | | (0.02 | ) | | | (0.63 | ) | | | (3.27 | ) |
| | | | | | | | | | | | | | | | | | | | | | | | | | | | |
| | | | | | | |
Net asset value, end of period | | | | | | $ | 9.12 | | | $ | 15.31 | | | $ | 10.73 | | | $ | 12.33 | | | $ | 10.20 | | | $ | 13.07 | |
| | | | | | | | | | | | | | | | | | | | | | | | | | | | |
| | | | | | | |
Total Return(c) | | | | | | | | | | | | | | | | | | | | | | | | | | | | |
Based on net asset value | | | | | | | (25.72 | )% | | | 43.35 | % | | | (12.98 | )%(d) | | | 21.14 | % | | | (17.30 | )% | | | 27.53 | % |
| | | | | | | | | | | | | | | | | | | | | | | | | | | | |
| | | | | | | |
Ratios to Average Net Assets(e) | | | | | | | | | | | | | | | | | | | | | | | | | | | | |
Total expenses | | | | | | | 1.75 | % | | | 1.59 | % | | | 1.77 | %(f)(g) | | | 1.73 | % | | | 1.73 | % | | | 1.88 | % |
| | | | | | | | | | | | | | | | | | | | | | | | | | | | |
| | | | | | | |
Total expenses after fees waived and/or reimbursed | | | | | | | 1.56 | % | | | 1.59 | % | | | 1.77 | %(f)(g) | | | 1.73 | % | | | 1.72 | % | | | 1.76 | % |
| | | | | | | | | | | | | | | | | | | | | | | | | | | | |
| | | | | | | |
Net investment income (loss) | | | | | | | 0.38 | % | | | 0.31 | % | | | (1.21 | )%(f) | | | 0.27 | % | | | 0.30 | % | | | 0.50 | % |
| | | | | | | | | | | | | | | | | | | | | | | | | | | | |
| | | | | | | |
Supplemental Data | | | | | | | | | | | | | | | | | | | | | | | | | | | | |
Net assets, end of period (000) | | | | | | $ | 631 | | | $ | 982 | | | $ | 844 | | | $ | 1,115 | | | $ | 2,062 | | | $ | 2,967 | |
| | | | | | | | | | | | | | | | | | | | | | | | | | | | |
| | | | | | | |
Portfolio turnover rate | | | | | | | 139 | % | | | 81 | % | | | 13 | % | | | 55 | % | | | 44 | % | | | 123 | % |
| | | | | | | | | | | | | | | | | | | | | | | | | | | | |
| (a) | Based on average shares outstanding. |
| (b) | Distributions for annual periods determined in accordance with U.S. federal income tax regulations. |
| (c) | Where applicable, assumes the reinvestment of distributions. |
| (d) | Aggregate total return. |
| (e) | Excludes fees and expenses incurred indirectly as a result of investments in underlying funds. |
| (g) | Audit, printing and tax costs were not annualized in the calculation of the expense ratios. If these expenses were annualized, the total expenses and total expenses after fees waived and/or reimbursed would have been 1.94%. |
See notes to financial statements.
| | |
| 52 | | 2 0 2 2 BLACK ROCK ANNUAL REPORT TO SHAREHOLDERS |
Notes to Financial Statements
BlackRock Emerging Markets Fund, Inc., BlackRock Latin America Fund, Inc., BlackRock Funds VII, Inc. (the “Corporations”) and BlackRock Unconstrained Equity Fund are registered under the Investment Company Act of 1940, as amended (the “1940 Act”), as open-end management investment companies. The Corporations are each organized as a Maryland corporation and BlackRock Unconstrained Equity Fund is organized as a Delaware statutory Trust. BlackRock Sustainable Emerging Markets Equity Fund is a series of BlackRock Funds VII, Inc. The following are referred to herein collectively as the “Funds” or individually as a “Fund”:
| | | | | | |
| Registrant Name | | Fund Name | | Herein Referred To As | | Diversification Classification |
BlackRock Emerging Markets Fund, Inc. | | BlackRock Emerging Markets Fund, Inc. | | Emerging Markets | | Non-diversified |
BlackRock Latin America Fund, Inc. | | BlackRock Latin America Fund, Inc. | | Latin America | | Non-diversified |
BlackRock Unconstrained Equity Fund | | BlackRock Unconstrained Equity Fund | | Unconstrained Equity | | Non-diversified* |
BlackRock Funds VII, Inc. | | BlackRock Sustainable Emerging Markets Equity Fund | | Sustainable Emerging Markets Equity | | Diversified |
| | * | The Fund’s classification changed from diversified to non-diversified during the reporting period. | |
Each Fund offers multiple classes of shares. All classes of shares have identical voting, dividend, liquidation and other rights and are subject to the same terms and conditions, except that certain classes bear expenses related to the shareholder servicing and distribution of such shares. Institutional and Class K Shares are sold only to certain eligible investors. Investor A, Investor C and Class R Shares bear certain expenses related to shareholder servicing of such shares, and Investor C and Class R Shares also bear certain expenses related to the distribution of such shares. Investor A and Investor C Shares are generally available through financial intermediaries. Class R Shares are sold only to certain employer-sponsored retirement plans. Each class has exclusive voting rights with respect to matters relating to its shareholder servicing and distribution expenditures (except that Investor C shareholders may vote on material changes to the Investor A Shares distribution and service plan).
| | | | | | | | |
| Share Class | | Initial Sales Charge | | | CDSC | | | Conversion Privilege |
| Institutional, Class K and Class R Shares | | No | | | No | | | None |
| Investor A Shares | | Yes | | | No | (a) | | None |
| Investor C Shares | | No | | | Yes | (b) | | To Investor A Shares after approximately 8 years |
| | (a) | Investor A Shares may be subject to a contingent deferred sales charge (“CDSC”) for certain redemptions where no initial sales charge was paid at the time of purchase. | |
| | (b) | A CDSC of 1.00% is assessed on certain redemptions of Investor C Shares made within one year after purchase. | |
The Board of Directors of Emerging Markets, Latin America and Sustainable Emerging Markets Equity and the Board of Trustees of Unconstrained Equity are collectively referred to throughout this report as the “Board of Directors” or the “Board,” and the directors/trustees thereof are collectively referred to throughout this report as “Directors”.
On February 10, 2021, the Board approved a proposal to change the name of BlackRock Long-Horizon Equity Fund to BlackRock Unconstrained Equity Fund and certain changes to the Fund’s investment objective, investment strategy and investment process. Additionally, the Board and the Fund’s shareholders each approved the Fund’s classification change from diversified to non-diversified. These changes were effective on March 1, 2022.
On July 27, 2021, the Board of BlackRock Asian Dragon Fund, Inc. (the “Corporation”) approved certain changes relating to the Corporation. In particular, the Board approved (i) the redesignation of the share classes of the Corporation to a new series of the Corporation named BlackRock Asian Dragon Fund and (ii) a change in the name of the Corporation to “BlackRock Funds VII, Inc.”. These changes were effective on July 30, 2021.
Additionally, the Board approved a proposal to change the name of the Fund from BlackRock Asian Dragon Fund to BlackRock Sustainable Emerging Markets Equity Fund and certain changes to the Fund’s investment objective, investment strategy and investment process. These changes were effective on November 2, 2021.
On October 28, 2021, the Sustainable Emerging Markets Equity Fund’s issued and outstanding Investor C Shares converted into Investor A Shares, with the same relative aggregate net asset value (“NAV”) as the original shares held immediately prior to the conversion.
On February 8, 2022, the Board of Directors of the Latin America Fund approved a proposal to close the Fund to new and subsequent investments and thereafter to liquidate and terminate the Fund. June 23, 2022, the Fund will no longer accept orders from new investors or existing shareholders to purchase Fund shares. On or about June 30, 2022 (the “Liquidation Date”), all of the assets of the Fund will have been liquidated completely, the shares of any shareholders holding shares on the Liquidation Date will be redeemed at the net asset value per share and the Fund will then be terminated.
The Funds, together with certain other registered investment companies advised by BlackRock Advisors, LLC (the “Manager”) or its affiliates, are included in a complex of open-end equity, multi-asset, index and money market funds referred to as the BlackRock Multi-Asset Complex.
| 2. | SIGNIFICANT ACCOUNTING POLICIES |
The financial statements are prepared in conformity with accounting principles generally accepted in the United States of America (“U.S. GAAP”), which may require management to make estimates and assumptions that affect the reported amounts of assets and liabilities in the financial statements, disclosure of contingent assets and
| | |
NOTES TO FINANCIAL STATEMENTS | | 53 |
Notes to Financial Statements (continued)
liabilities at the date of the financial statements and the reported amounts of increases and decreases in net assets from operations during the reporting period. Actual results could differ from those estimates. Each Fund is considered an investment company under U.S. GAAP and follows the accounting and reporting guidance applicable to investment companies. Below is a summary of significant accounting policies:
Investment Transactions and Income Recognition: For financial reporting purposes, investment transactions are recorded on the dates the transactions are executed. Realized gains and losses on investment transactions are determined using the specific identification method. Dividend income and capital gain distributions, if any, are recorded on the ex-dividend dates. Non-cash dividends, if any, are recorded on the ex-dividend dates at fair value. Dividends from foreign securities where the ex-dividend dates may have passed are subsequently recorded when the Funds are informed of the ex-dividend dates. Under the applicable foreign tax laws, a withholding tax at various rates may be imposed on capital gains, dividends and interest. Upon notification from issuers, a portion of the dividend income received from a real estate investment trust may be redesignated as a reduction of cost of the related investment and/or realized gain. Interest income, including amortization and accretion of premiums and discounts on debt securities, is recognized daily on an accrual basis. Income, expenses and realized and unrealized gains and losses are allocated daily to each class based on its relative net assets. For convertible securities, premiums attributable to the debt instrument are amortized, but premiums attributable to the conversion feature are not amortized.
Foreign Currency Translation: Each Fund’s books and records are maintained in U.S. dollars. Securities and other assets and liabilities denominated in foreign currencies are translated into U.S. dollars using exchange rates determined as of the close of trading on the New York Stock Exchange (“NYSE”). Purchases and sales of investments are recorded at the rates of exchange prevailing on the respective dates of such transactions. Generally, when the U.S. dollar rises in value against a foreign currency, the investments denominated in that currency will lose value; the opposite effect occurs if the U.S. dollar falls in relative value.
Each Fund does not isolate the effect of fluctuations in foreign exchange rates from the effect of fluctuations in the market prices of investments for financial reporting purposes. Accordingly, the effects of changes in exchange rates on investments are not segregated in the Statements of Operations from the effects of changes in market prices of those investments, but are included as a component of net realized and unrealized gain (loss) from investments. Each Fund reports realized currency gains (losses) on foreign currency related transactions as components of net realized gain (loss) for financial reporting purposes, whereas such components are generally treated as ordinary income for U.S. federal income tax purposes.
Foreign Taxes: The Funds may be subject to foreign taxes (a portion of which may be reclaimable) on income, stock dividends, capital gains on investments, or certain foreign currency transactions. All foreign taxes are recorded in accordance with the applicable foreign tax regulations and rates that exist in the foreign jurisdictions in which each Fund invests. These foreign taxes, if any, are paid by each Fund and are reflected in its Statements of Operations as follows: foreign taxes withheld at source are presented as a reduction of income, foreign taxes on securities lending income are presented as a reduction of securities lending income, foreign taxes on stock dividends are presented as “Foreign taxes withheld”, and foreign taxes on capital gains from sales of investments and foreign taxes on foreign currency transactions are included in their respective net realized gain (loss) categories. Foreign taxes payable or deferred as of April 30, 2022, if any, are disclosed in the Statements of Assets and Liabilities.
The Funds file withholding tax reclaims in certain jurisdictions to recover a portion of amounts previously withheld. The Funds may record a reclaim receivable based on collectability, which includes factors such as the jurisdiction’s applicable laws, payment history and market convention. The Statements of Operations include tax reclaims recorded as well as professional and other fees, if any, associated with recovery of foreign withholding taxes.
Segregation and Collateralization: In cases where a Fund enters into certain investments (e.g., futures contracts, forward foreign currency exchange contracts and swaps) that would be treated as “senior securities” for 1940 Act purposes, a Fund may segregate or designate on its books and records cash or liquid assets having a market value at least equal to the amount of its future obligations under such investments. Doing so allows the investments to be excluded from treatment as a “senior security.” Furthermore, if required by an exchange or counterparty agreement, the Funds may be required to deliver/deposit cash and/or securities to/with an exchange, or broker-dealer or custodian as collateral for certain investments or obligations.
Distributions: Distributions paid by the Funds are recorded on the ex-dividend dates. The character and timing of distributions are determined in accordance with U.S. federal income tax regulations, which may differ from U.S. GAAP.
Indemnifications: In the normal course of business, a Fund enters into contracts that contain a variety of representations that provide general indemnification. A Fund’s maximum exposure under these arrangements is unknown because it involves future potential claims against a Fund, which cannot be predicted with any certainty.
Other: Expenses directly related to a Fund or its classes are charged to that Fund or the applicable class. Expenses directly related to the Funds and other shared expenses prorated to the Funds are allocated daily to each class based on their relative net assets or other appropriate methods. Other operating expenses shared by several funds, including other funds managed by the Manager, are prorated among those funds on the basis of relative net assets or other appropriate methods.
The Funds have an arrangement with their custodian whereby credits are earned on uninvested cash balances, which could be used to reduce custody fees and/or overdraft charges. The Funds may incur charges on overdrafts, subject to certain conditions.
| 3. | INVESTMENT VALUATION AND FAIR VALUE MEASUREMENTS |
Investment Valuation Policies: Each Fund’s investments are valued at fair value (also referred to as “market value” within the financial statements) each day that the Fund is open for business and, for financial reporting purposes, as of the report date. U.S. GAAP defines fair value as the price a fund would receive to sell an asset or pay to transfer a liability in an orderly transaction between market participants at the measurement date. Each Fund determines the fair values of its financial instruments using various independent dealers or pricing services under policies approved by the Board. If a security’s market price is not readily available or does not otherwise accurately represent the fair value of the security, the security will be valued in accordance with a policy approved by the Board as reflecting fair value. The BlackRock Global Valuation Methodologies Committee (the “Global Valuation Committee”) is the committee formed by management to develop global pricing policies and procedures and to oversee the pricing function for all financial instruments.
| | |
| 54 | | 2 0 2 2 BLACK ROCK ANNUAL REPORT TO SHAREHOLDERS |
Notes to Financial Statements (continued)
Fair Value Inputs and Methodologies: The following methods and inputs are used to establish the fair value of each Fund’s assets and liabilities:
| | • | | Equity investments traded on a recognized securities exchange are valued at that day’s official closing price, as applicable, on the exchange where the stock is primarily traded. Equity investments traded on a recognized exchange for which there were no sales on that day may be valued at the last available bid (long positions) or ask (short positions) price. |
| | • | | Fixed-income investments for which market quotations are readily available are generally valued using the last available bid price or current market quotations provided by independent dealers or third-party pricing services. Pricing services generally value fixed-income securities assuming orderly transactions of an institutional round lot size, but a fund may hold or transact in such securities in smaller, odd lot sizes. Odd lots may trade at lower prices than institutional round lots. The pricing services may use matrix pricing or valuation models that utilize certain inputs and assumptions to derive values, including transaction data (e.g., recent representative bids and offers), market data, credit quality information, perceived market movements, news, and other relevant information. Certain fixed-income securities, including asset-backed and mortgage related securities may be valued based on valuation models that consider the estimated cash flows of each tranche of the entity, establish a benchmark yield and develop an estimated tranche specific spread to the benchmark yield based on the unique attributes of the tranche. The amortized cost method of valuation may be used with respect to debt obligations with sixty days or less remaining to maturity unless the Manager determines such method does not represent fair value. |
| | • | | Investments in open-end U.S. mutual funds (including money market funds) are valued at that day’s published NAV. |
| | • | | The Funds value their investment in SL Liquidity Series, LLC, Money Market Series (the “Money Market Series”) at fair value, which is ordinarily based upon their pro rata ownership in the underlying fund’s net assets. |
| | • | | Futures contracts are valued based on that day’s last reported settlement or trade price on the exchange where the contract is traded. |
| | • | | Swap agreements are valued utilizing quotes received daily by independent pricing services or through brokers, which are derived using daily swap curves and models that incorporate a number of market data factors, such as discounted cash flows, trades and values of the underlying reference instruments. |
Generally, trading in foreign instruments is substantially completed each day at various times prior to the close of trading on the NYSE. Each business day, the Funds use current market factors supplied by independent pricing services to value certain foreign instruments (“Systematic Fair Value Price”). The Systematic Fair Value Price is designed to value such foreign securities at fair value as of the close of trading on the NYSE, which follows the close of the local markets.
If events (e.g., market volatility, company announcement or a natural disaster) occur that are expected to materially affect the value of such investment, or in the event that application of these methods of valuation results in a price for an investment that is deemed not to be representative of the market value of such investment, or if a price is not available, the investment will be valued by the Global Valuation Committee, or its delegate, in accordance with a policy approved by the Board as reflecting fair value (“Fair Valued Investments”). The fair valuation approaches that may be used by the Global Valuation Committee include market approach, income approach and cost approach. Valuation techniques such as discounted cash flow, use of market comparables and matrix pricing are types of valuation approaches and are typically used in determining fair value. When determining the price for Fair Valued Investments, the Global Valuation Committee, or its delegate, seeks to determine the price that each Fund might reasonably expect to receive or pay from the current sale or purchase of that asset or liability in an arm’s-length transaction. Fair value determinations shall be based upon all available factors that the Global Valuation Committee, or its delegate, deems relevant and consistent with the principles of fair value measurement. The pricing of all Fair Valued Investments is subsequently reported to the Board or a committee thereof on a quarterly basis.
For investments in equity or debt issued by privately held companies or funds (“Private Company” or collectively, the “Private Companies”) and other Fair Valued Investments, the fair valuation approaches that are used by the Global Valuation Committee and third-party pricing services utilize one or a combination of, but not limited to, the following inputs.
| | | | |
| | | Standard Inputs Generally Considered By Third-Party Pricing Services |
| Market approach | | (i) | | recent market transactions, including subsequent rounds of financing, in the underlying investment or comparable issuers; |
| | (ii) | | recapitalizations and other transactions across the capital structure; and |
| | | (iii) | | market multiples of comparable issuers. |
| Income approach | | (i) | | future cash flows discounted to present and adjusted as appropriate for liquidity, credit, and/or market risks; |
| | (ii) | | quoted prices for similar investments or assets in active markets; and |
| | | (iii) | | other risk factors, such as interest rates, yield curves, volatilities, prepayment speeds, loss severities, credit risks, recovery rates, liquidation amounts and/or default rates. |
| Cost approach | | (i) | | audited or unaudited financial statements, investor communications and financial or operational metrics issued by the Private Company; |
| | (ii) | | changes in the valuation of relevant indices or publicly traded companies comparable to the Private Company; |
| | (iii) | | relevant news and other public sources; and |
| | | (iv) | | known secondary market transactions in the Private Company’s interests and merger or acquisition activity in companies comparable to the Private Company. |
Investments in series of preferred stock issued by Private Companies are typically valued utilizing market approach in determining the enterprise value of the company. Such investments often contain rights and preferences that differ from other series of preferred and common stock of the same issuer. Enterprise valuation techniques such as an option pricing model (“OPM”), a probability weighted expected return model (“PWERM”), current value method or a hybrid of those techniques are used as deemed appropriate under the circumstances. The use of these valuation techniques involve a determination of the exit scenarios of the investment in order to appropriately allocate the enterprise value of the company among the various parts of its capital structure.
| | |
NOTES TO FINANCIAL STATEMENTS | | 55 |
Notes to Financial Statements (continued)
The Private Companies are not subject to the public company disclosure, timing, and reporting standards applicable to other investments held by a Fund. Typically, the most recently available information by a Private Company is as of a date that is earlier than the date a Fund is calculating its NAV. This factor may result in a difference between the value of the investment and the price a Fund could receive upon the sale of the investment.
Fair Value Hierarchy: Various inputs are used in determining the fair value of financial instruments. These inputs to valuation techniques are categorized into a fair value hierarchy consisting of three broad levels for financial reporting purposes as follows:
| | • | | Level 1 – Unadjusted price quotations in active markets/exchanges for identical assets or liabilities that each Fund has the ability to access; |
| | • | | Level 2 – Other observable inputs (including, but not limited to, quoted prices for similar assets or liabilities in markets that are active, quoted prices for identical or similar assets or liabilities in markets that are not active, inputs other than quoted prices that are observable for the assets or liabilities (such as interest rates, yield curves, volatilities, prepayment speeds, loss severities, credit risks and default rates) or other market–corroborated inputs); and |
| | • | | Level 3 – Unobservable inputs based on the best information available in the circumstances, to the extent observable inputs are not available (including the Global Valuation Committee’s assumptions used in determining the fair value of financial instruments). |
The hierarchy gives the highest priority to unadjusted quoted prices in active markets for identical assets or liabilities (Level 1 measurements) and the lowest priority to unobservable inputs (Level 3 measurements). Accordingly, the degree of judgment exercised in determining fair value is greatest for instruments categorized in Level 3. The inputs used to measure fair value may fall into different levels of the fair value hierarchy. In such cases, for disclosure purposes, the fair value hierarchy classification is determined based on the lowest level input that is significant to the fair value measurement in its entirety. Investments classified within Level 3 have significant unobservable inputs used by the Global Valuation Committee in determining the price for Fair Valued Investments. Level 3 investments include equity or debt issued by Private Companies that may not have a secondary market and/or may have a limited number of investors. The categorization of a value determined for financial instruments is based on the pricing transparency of the financial instruments and is not necessarily an indication of the risks associated with investing in those securities.
As of April 30, 2022, certain investments of Emerging Markets and Latin America were fair valued using NAV per share as no quoted market value is available and therefore have been excluded from the fair value hierarchy.
| 4. | SECURITIES AND OTHER INVESTMENTS |
Preferred Stocks: Preferred stock has a preference over common stock in liquidation (and generally in receiving dividends as well), but is subordinated to the liabilities of the issuer in all respects. As a general rule, the market value of preferred stock with a fixed dividend rate and no conversion element varies inversely with interest rates and perceived credit risk, while the market price of convertible preferred stock generally also reflects some element of conversion value. Because preferred stock is junior to debt securities and other obligations of the issuer, deterioration in the credit quality of the issuer will cause greater changes in the value of a preferred stock than in a more senior debt security with similar stated yield characteristics. Unlike interest payments on debt securities, preferred stock dividends are payable only if declared by the issuer’s board of directors. Preferred stock also may be subject to optional or mandatory redemption provisions.
Securities Lending: Certain Funds may lend their securities to approved borrowers, such as brokers, dealers and other financial institutions. The borrower pledges and maintains with the Funds collateral consisting of cash, an irrevocable letter of credit issued by a bank, or securities issued or guaranteed by the U.S. Government. The initial collateral received by each Fund is required to have a value of at least 102% of the current value of the loaned securities for securities traded on U.S. exchanges and a value of at least 105% for all other securities. The collateral is maintained thereafter at a value equal to at least 100% of the current market value of the securities on loan. The market value of the loaned securities is determined at the close of each business day of the Fund and any additional required collateral is delivered to the Fund, or excess collateral returned by the Fund, on the next business day. During the term of the loan, the Funds are entitled to all distributions made on or in respect of the loaned securities, but do not receive interest income on securities received as collateral. Loans of securities are terminable at any time and the borrower, after notice, is required to return borrowed securities within the standard time period for settlement of securities transactions.
As of period end, any securities on loan were collateralized by cash and/or U.S. Government obligations. Cash collateral invested by the securities lending agent, BlackRock Investment Management, LLC (“BIM”), if any, is disclosed in the Schedules of Investments. Any non-cash collateral received cannot be sold, re-invested or pledged by the Fund, except in the event of borrower default. The securities on loan, if any, are disclosed in the Funds’ Schedules of Investments. The market value of any securities on loan and the value of any related collateral are shown separately in the Statements of Assets and Liabilities as a component of investments at value – unaffiliated and collateral on securities loaned, respectively.
Securities lending transactions are entered into by the Funds under Master Securities Lending Agreements (each, an “MSLA”), which provide the right, in the event of default (including bankruptcy or insolvency), for the non-defaulting party to liquidate the collateral and calculate a net exposure to the defaulting party or request additional collateral. In the event that a borrower defaults, the Funds, as lender, would offset the market value of the collateral received against the market value of the securities loaned. When the value of the collateral is greater than that of the market value of the securities loaned, the lender is left with a net amount payable to the defaulting party. However, bankruptcy or insolvency laws of a particular jurisdiction may impose restrictions on or prohibitions against such a right of offset in the event of an MSLA counterparty’s bankruptcy or insolvency. Under the MSLA, absent an event of default, the borrower can resell or re-pledge the loaned securities, and the Funds can reinvest cash collateral received in connection with loaned securities. Upon an event of default, the parties’ obligations to return the securities or collateral to the other party are extinguished, and the parties can resell or re-pledge the loaned securities or the collateral received in connection with the loaned securities in order to satisfy the defaulting party’s net payment obligation for all transactions under the MSLA. The defaulting party remains liable for any deficiency.
| | |
| 56 | | 2 0 2 2 BLACK ROCK ANNUAL REPORT TO SHAREHOLDERS |
Notes to Financial Statements (continued)
As of period end, the following table is a summary of the Funds’ securities on loan by counterparty which are subject to offset under an MSLA:
| | | | | | | | | | | | | | | | |
| Fund Name/Counterparty | |
| Securities
Loaned at Value |
| |
| Cash Collateral
Received |
(a) | |
| Non-Cash Collateral
Received at Fair Value |
(a) | |
| Net
Amount |
(b) |
Emerging Markets | | | | | | | | | | | | | | | | |
Barclays Capital, Inc. | | $ | 974,034 | | | $ | (974,034 | ) | | $ | — | | | $ | — | |
BofA Securities, Inc. | | | 88,011 | | | | (88,011 | ) | | | — | | | | — | |
Citigroup Global Markets, Inc. | | | 6,940,356 | | | | (6,664,529 | ) | | | — | | | | 275,827 | |
Credit Suisse Securities (USA) LLC | | | 13,273 | | | | (13,273 | ) | | | — | | | | — | |
J.P. Morgan Securities LLC | | | 3,587,612 | | | | (3,587,612 | ) | | | — | | | | — | |
Jefferies LLC | | | 3,677,017 | | | | (3,538,200 | ) | | | — | | | | 138,817 | |
Morgan Stanley | | | 1,545,925 | | | | (1,545,925 | ) | | | — | | | | — | |
State Street Bank & Trust Co. | | | 4,034,212 | | | | (4,034,212 | ) | | | — | | | | — | |
| | | | | | | | | | | | | | | | |
| | $ | 20,860,440 | | | $ | (20,445,796 | ) | | $ | — | | | $ | 414,644 | |
| | | | | | | | | | | | | | | | |
Latin America | | | | | | | | | | | | | | | | |
Citigroup Global Markets, Inc. | | $ | 37,775 | | | $ | (37,775 | ) | | $ | — | | | $ | — | |
Morgan Stanley | | | 513,740 | | | | (513,740 | ) | | | — | | | | — | |
| | | | | | | | | | | | | | | | |
| | $ | 551,515 | | | $ | (551,515 | ) | | $ | — | | | $ | — | |
| | | | | | | | | | | | | | | | |
Sustainable Emerging Markets Equity | | | | | | | | | | | | | | | | |
Morgan Stanley | | $ | 1,573,107 | | | $ | (1,573,107 | ) | | $ | — | | | $ | — | |
| | | | | | | | | | | | | | | | |
| | (a) | Collateral received in excess of the market value of securities on loan is not presented in this table. The total cash collateral received by each Fund is disclosed in the Fund’s Statements of Assets and Liabilities. | |
| | (b) | The market value of the loaned securities is determined as of April 30, 2022. Additional collateral is delivered to each Fund on the next business day in accordance with the MSLA. The net amount would be subject to the borrower default indemnity in the event of default by the counterparty. | |
The risks of securities lending include the risk that the borrower may not provide additional collateral when required or may not return the securities when due. To mitigate these risks, the Funds benefit from a borrower default indemnity provided by BIM. BIM’s indemnity allows for full replacement of the securities loaned to the extent the collateral received does not cover the value on the securities loaned in the event of borrower default. Each Fund could incur a loss if the value of an investment purchased with cash collateral falls below the market value of loaned securities or if the value of an investment purchased with cash collateral falls below the value of the original cash collateral received. Such losses are borne entirely by the Funds.
| 5. | DERIVATIVE FINANCIAL INSTRUMENTS |
The Funds engage in various portfolio investment strategies using derivative contracts both to increase the returns of the Funds and/or to manage their exposure to certain risks such as credit risk, equity risk, interest rate risk, foreign currency exchange rate risk, commodity price risk or other risks (e.g., inflation risk). Derivative financial instruments categorized by risk exposure are included in the Schedules of Investments. These contracts may be transacted on an exchange or over-the-counter (“OTC”).
Futures Contracts: Futures contracts are purchased or sold to gain exposure to, or manage exposure to, changes in interest rates (interest rate risk) and changes in the value of equity securities (equity risk) or foreign currencies (foreign currency exchange rate risk).
Futures contracts are exchange-traded agreements between the Funds and a counterparty to buy or sell a specific quantity of an underlying instrument at a specified price and on a specified date. Depending on the terms of a contract, it is settled either through physical delivery of the underlying instrument on the settlement date or by payment of a cash amount on the settlement date. Upon entering into a futures contract, the Funds are required to deposit initial margin with the broker in the form of cash or securities in an amount that varies depending on a contract’s size and risk profile. The initial margin deposit must then be maintained at an established level over the life of the contract. Amounts pledged, which are considered restricted, are included in cash pledged for futures contracts in the Statements of Assets and Liabilities.
Securities deposited as initial margin are designated in the Schedules of Investments and cash deposited, if any, are shown as cash pledged for futures contracts in the Statements of Assets and Liabilities. Pursuant to the contract, the Funds agree to receive from or pay to the broker an amount of cash equal to the daily fluctuation in market value of the contract (“variation margin”). Variation margin is recorded as unrealized appreciation (depreciation) and, if any, shown as variation margin receivable (or payable) on futures contracts in the Statements of Assets and Liabilities. When the contract is closed, a realized gain or loss is recorded in the Statements of Operations equal to the difference between the notional amount of the contract at the time it was opened and the notional amount at the time it was closed. The use of futures contracts involves the risk of an imperfect correlation in the movements in the price of futures contracts and interest rates, foreign currency exchange rates or underlying assets.
Swaps: Swap contracts are entered into to manage exposure to issuers, markets and securities. Such contracts are agreements between the Funds and a counterparty to make periodic net payments on a specified notional amount or a net payment upon termination. Swap agreements are privately negotiated in the OTC market and may be entered into as a bilateral contract (“OTC swaps”) or centrally cleared (“centrally cleared swaps”).
For OTC swaps, any upfront premiums paid and any upfront fees received are shown as swap premiums paid and swap premiums received, respectively, in the Statements of Assets and Liabilities and amortized over the term of the contract. The daily fluctuation in market value is recorded as unrealized appreciation (depreciation) on OTC Swaps in the Statements of Assets and Liabilities. Payments received or paid are recorded in the Statements of Operations as realized gains or losses, respectively. When an OTC swap is terminated, a realized gain or loss is recorded in the Statements of Operations equal to the difference between the proceeds from (or cost of) the closing transaction and the Funds’ basis in the contract, if any. Generally, the basis of the contract is the premium received or paid.
| | |
NOTES TO FINANCIAL STATEMENTS | | 57 |
Notes to Financial Statements (continued)
In a centrally cleared swap, immediately following execution of the swap contract, the swap contract is novated to a central counterparty (the “CCP”) and the CCP becomes the Funds’ counterparty on the swap. Each Fund is required to interface with the CCP through the broker. Upon entering into a centrally cleared swap, each Fund is required to deposit initial margin with the broker in the form of cash or securities in an amount that varies depending on the size and risk profile of the particular swap. Securities deposited as initial margin are designated in the Schedules of Investments and cash deposited is shown as cash pledged for centrally cleared swaps in the Statements of Assets and Liabilities. Amounts pledged, which are considered restricted cash, are included in cash pledged for centrally cleared swaps in the Statements of Assets and Liabilities. Pursuant to the contract, each Fund agrees to receive from or pay to the broker an amount of cash equal to the daily fluctuation in market value of the contract (“variation margin”). Variation margin is recorded as unrealized appreciation (depreciation) and shown as variation margin receivable (or payable) on centrally cleared swaps in the Statements of Assets and Liabilities. Payments received from (paid to) the counterparty are amortized over the term of the contract and recorded as realized gains (losses) in the Statements of Operations, including those at termination.
| | • | | Total return swaps — Total return swaps are entered into to obtain exposure to a security or market without owning such security or investing directly in such market or to exchange the risk/return of one security or market (e.g., fixed-income) with another security or market (e.g., equity or commodity prices) (equity risk, commodity price risk and/or interest rate risk). |
Total return swaps are agreements in which there is an exchange of cash flows whereby one party commits to make payments based on the total return (distributions plus capital gains/losses) of an underlying instrument, or basket of underlying instruments, in exchange for fixed or floating rate interest payments. If the total return of the instrument(s) or index underlying the transaction exceeds or falls short of the offsetting fixed or floating interest rate obligation, the Funds receive payment from or make a payment to the counterparty.
Certain total return swaps are designed to function as a portfolio of direct investments in long and short equity positions. This means that the Fund has the ability to trade in and out of these long and short positions within the swap and will receive the economic benefits and risks equivalent to direct investment in these positions, subject to certain adjustments due to events related to the counterparty. Benefits and risks include capital appreciation (depreciation), corporate actions and dividends received and paid, all of which are reflected in the swap’s market value. The market value also includes interest charges and credits (“financing fees”) related to the notional values of the long and short positions and cash balances within the swap. These interest charges and credits are based on a specified benchmark rate plus or minus a specified spread determined based upon the country and/or currency of the positions in the portfolio.
Positions within the swap and financing fees are reset periodically. During a reset, any unrealized appreciation (depreciation) on positions and accrued financing fees become available for cash settlement between the Funds and the counterparty. The amounts that are available for cash settlement are recorded as realized gains or losses in the Statements of Operations. Cash settlement in and out of the swap may occur at a reset date or any other date, at the discretion of the Funds and the counterparty, over the life of the agreement. Certain swaps have no stated expiration and can be terminated by either party at any time.
Swap transactions involve, to varying degrees, elements of interest rate, credit and market risk in excess of the amounts recognized in the Statements of Assets and Liabilities. Such risks involve the possibility that there will be no liquid market for these agreements, that the counterparty to the agreements may default on its obligation to perform or disagree as to the meaning of the contractual terms in the agreements, and that there may be unfavorable changes in interest rates and/or market values associated with these transactions.
Master Netting Arrangements: In order to define its contractual rights and to secure rights that will help it mitigate its counterparty risk, a Fund may enter into an International Swaps and Derivatives Association, Inc. Master Agreement (“ISDA Master Agreement”) or similar agreement with its counterparties. An ISDA Master Agreement is a bilateral agreement between a Fund and a counterparty that governs certain OTC derivatives and typically contains, among other things, collateral posting terms and netting provisions in the event of a default and/or termination event. Under an ISDA Master Agreement, a Fund may, under certain circumstances, offset with the counterparty certain derivative financial instruments’ payables and/or receivables with collateral held and/or posted and create one single net payment. The provisions of the ISDA Master Agreement typically permit a single net payment in the event of default including the bankruptcy or insolvency of the counterparty. However, bankruptcy or insolvency laws of a particular jurisdiction may impose restrictions on or prohibitions against the right of offset in bankruptcy, insolvency or other events.
Collateral Requirements: For derivatives traded under an ISDA Master Agreement, the collateral requirements are typically calculated by netting the mark-to-market amount for each transaction under such agreement and comparing that amount to the value of any collateral currently pledged by the Funds and the counterparty.
Cash collateral that has been pledged to cover obligations of the Funds and cash collateral received from the counterparty, if any, is reported separately in the Statements of Assets and Liabilities as cash pledged as collateral and cash received as collateral, respectively. Non-cash collateral pledged by the Funds, if any, is noted in the Schedules of Investments. Generally, the amount of collateral due from or to a counterparty is subject to a certain minimum transfer amount threshold before a transfer is required, which is determined at the close of business of the Funds. Any additional required collateral is delivered to/pledged by the Funds on the next business day. Typically, the counterparty is not permitted to sell, re-pledge or use cash and non-cash collateral it receives. A Fund generally agrees not to use non-cash collateral that it receives but may, absent default or certain other circumstances defined in the underlying ISDA Master Agreement, be permitted to use cash collateral received. In such cases, interest may be paid pursuant to the collateral arrangement with the counterparty. To the extent amounts due to the Funds from the counterparties are not fully collateralized, each Fund bears the risk of loss from counterparty non-performance. Likewise, to the extent the Funds have delivered collateral to a counterparty and stand ready to perform under the terms of their agreement with such counterparty, each Fund bears the risk of loss from a counterparty in the amount of the value of the collateral in the event the counterparty fails to return such collateral. Based on the terms of agreements, collateral may not be required for all derivative contracts.
For financial reporting purposes, the Funds do not offset derivative assets and derivative liabilities that are subject to netting arrangements, if any, in the Statements of Assets and Liabilities.
| | |
| 58 | | 2 0 2 2 BLACK ROCK ANNUAL REPORT TO SHAREHOLDERS |
Notes to Financial Statements (continued)
| 6. | INVESTMENT ADVISORY AGREEMENT AND OTHER TRANSACTIONS WITH AFFILIATES |
Investment Advisory: Each Fund entered into an Investment Advisory Agreement with the Manager, the Funds’ investment adviser and an indirect, wholly-owned subsidiary of BlackRock, Inc. (“BlackRock”), to provide investment advisory and administrative services. The Manager is responsible for the management of each Fund’s portfolio and provides the personnel, facilities, equipment and certain other services necessary to the operations of each Fund.
For such services, each Fund pays the Manager a monthly fee at an annual rate equal to the following percentages of the average daily value of each Fund’s net assets:
| | | | | | | | |
| | | Investment Advisory Fees |
| | |
| Average Daily Net Assets | | Emerging Markets | | Latin America | | Unconstrained Equity | | Sustainable Emerging Markets Equity |
| | | | |
First $1 billion | | 0.81% | | 1.00% | | 0.80% | | 0.60% |
$1 billion — $3 billion | | 0.76 | | 0.94 | | 0.75 | | 0.56 |
$3 billion — $5 billion | | 0.73 | | 0.90 | | 0.72 | | 0.54 |
$5 billion — $10 billion | | 0.70 | | 0.87 | | 0.70 | | 0.52 |
Greater than $10 billion | | 0.69 | | 0.85 | | 0.68 | | 0.51 |
For the year ended April 30, 2022, the Funds reimbursed the Manager for certain accounting services, which is included in accounting services in the Statements of Operations. The reimbursements were as follows:
| | | | |
| |
| Fund Name | | Amounts Reimbursed | |
| |
Emerging Markets | | $ | 1,913 | |
Latin America | | | 165 | |
Unconstrained Equity | | | 463 | |
Sustainable Emerging Markets Equity | | | 171 | |
| |
With respect to Emerging Markets and Sustainable Emerging Markets Equity, the Manager entered into separate sub-advisory agreements with BlackRock Asset Management North Asia Limited (“BAMNA”) and with respect to Emerging Markets, Unconstrained Equity and Sustainable Emerging Markets Equity, the Manager entered into a sub-advisory agreement with BlackRock International Limited (“BIL”), each an affiliate of the Manager. The Manager pays BAMNA and BIL for services they provide for that portion of each Fund for which BAMNA and BIL, as applicable, acts as sub-adviser, a monthly fee that is equal to a percentage of the investment advisory fees paid by each Fund to the Manager.
Service and Distribution Fees: The Funds entered into a Distribution Agreement and Distribution and Service Plans with BlackRock Investments, LLC (“BRIL”), an affiliate of the Manager. Pursuant to the Distribution and Service Plan and in accordance with Rule 12b-1 under the 1940 Act, each Fund pays BRIL ongoing service and distribution fees. The fees are accrued daily and paid monthly at annual rates based upon the average daily net assets of the relevant share class of each Fund as follows:
| | | | | | | | | | | | | | | | | | | | | | | | | | | | | | |
| | | | |
| | | | | | | Emerging Markets | | | | Latin America | | | | Unconstrained Equity | | | | | Sustainable Emerging Markets Equity | | |
| | | | | | | | | | | | | | | | | | | | | | |
| | | Share Class | | | | Service Fees | | Distribution Fees | | | | Service Fees | | Distribution Fees | | | | Service Fees | | Distribution Fees | | | | | Service Fees | | Distribution Fees | | |
| | | | |
| | Investor A | | | | 0.25% | | N/A | | | | 0.25% | | N/A | | | | 0.25% | | N/A | | | | | | 0.25% | | N/A | | |
| | Investor C | | | | 0.25 | | 0.75% | | | | 0.25 | | 0.75% | | | | 0.25 | | 0.75% | | | | | | N/A | | N/A | | |
| | Class R | | | | N/A | | N/A | | | | N/A | | N/A | | | | 0.25 | | 0.25 | | | | | | 0.25 | | 0.25% | | |
| | | | |
Prior to October 28, 2021, Sustainable Emerging Markets Investor C class paid BRIL ongoing services and distribution fees. The fees were accrued daily and paid monthly at annual rates based upon the average daily net assets of the Fund. The rates were 0.25% and 0.75%, respectively.
BRIL and broker-dealers, pursuant to sub-agreements with BRIL, provide shareholder servicing and distribution services to the Funds. The ongoing service and/or distribution fee compensates/reimburses BRIL and each broker-dealer for providing shareholder servicing and/or distribution related services to shareholders.
For the year ended April 30, 2022, the following table shows the class specific service and distribution fees borne directly by each share class of each Fund:
| | | | | | | | | | | | | | |
| Fund Name | | Investor A | | | Investor C | | | Class R | | | Total |
Emerging Markets | | $ | 1,088,816 | | | $ | 174,140 | | | $ | — | | | $1,262,956 |
Latin America | | | 130,878 | | | | 12,309 | | | | — | | | 143,187 |
Unconstrained Equity | | | 622,952 | | | | 18,225 | | | | 1,424 | | | 642,601 |
Sustainable Emerging Markets Equity | | | 169,440 | | | | 7,563 | | | | 4,310 | | | 181,313 |
Transfer Agent: Pursuant to written agreements, certain financial intermediaries, some of which may be affiliates, provide the Funds with sub-accounting, recordkeeping, sub-transfer agency and other administrative services with respect to servicing of underlying investor accounts. For these services, these entities receive an asset-based fee or an annual fee per shareholder account, which will vary depending on share class and/or net assets. For the year ended April 30, 2022, the Funds paid the following amounts to affiliates of BlackRock in return for these services, which are included in transfer agent — class specific in the Statements of Operations:
| | | | |
| |
| Fund Name | | Institutional | |
| |
Emerging Markets | | $ | 103 | |
Sustainable Emerging Markets Equity | | | 4 | |
| |
| | |
NOTES TO FINANCIAL STATEMENTS | | 59 |
Notes to Financial Statements (continued)
The Manager maintains a call center that is responsible for providing certain shareholder services to the Funds. Shareholder services include responding to inquiries and processing purchases and sales based upon instructions from shareholders. For the year ended April 30, 2022, each Fund reimbursed the Manager the following amounts for costs incurred in running the call center, which are included in transfer agent — class specific in the Statements of Operations:
| | | | | | | | | | | | | | | | | | | | | | |
| Fund Name | | Institutional | | | Investor A | | | Investor C | | | Class K | | | Class R | | | Total |
Emerging Markets | | $ | 3,922 | | | $ | 10,994 | | | $ | 2,497 | | | $ | 490 | | | $ | — | | | $17,903 |
Latin America | | | 845 | | | | 8,613 | | | | 750 | | | | 13 | | | | — | | | 10,221 |
Unconstrained Equity | | | 356 | | | | 3,685 | | | | 747 | | | | — | | | | 14 | | | 4,802 |
Sustainable Emerging Markets Equity | | | 6,315 | | | | 3,123 | | | | 362 | | | | 45 | | | | 12 | | | 9,857 |
For the year ended April 30, 2022, the following table shows the class specific transfer agent fees borne directly by each share class of each Fund:
| | | | | | | | | | | | | | | | | | | | | | |
| Fund Name | | Institutional | | | Investor A | | | Investor C | | | Class K | | | Class R | | | Total |
Emerging Markets | | $ | 4,033,000 | | | $ | 667,375 | | | $ | 30,492 | | | $ | 23,907 | | | $ | — | | | $4,754,774 |
Latin America | | | 27,458 | | | | 99,284 | | | | 4,737 | | | | 301 | | | | — | | | 131,780 |
Unconstrained Equity | | | 39,633 | | | | 168,971 | | | | 3,558 | | | | — | | | | 1,066 | | | 213,228 |
Sustainable Emerging Markets Equity | | | 84,086 | | | | 82,571 | | | | 1,872 | | | | 1,548 | | | | 2,954 | | | 173,031 |
Other Fees: For the year ended April 30, 2022, affiliates earned underwriting discounts, direct commissions and dealer concessions on sales of each Fund’s Investor A Shares as follows:
| | | | | | |
| Fund Name | | | | Investor A | |
Emerging Markets | | | | $ | 15,100 | |
Latin America | | | | | 571 | |
Unconstrained Equity | | | | | 2,236 | |
Sustainable Emerging Markets Equity | | | | | 1,783 | |
For the year ended April 30, 2022, affiliates received CDSCs as follows:
| | | | | | | | |
| |
| Fund Name | | Investor A | | | Investor C | |
| |
Emerging Markets | | $ | 5,128 | | | $ | 6,532 | |
Unconstrained Equity | | | 428 | | | | 31 | |
Sustainable Emerging Markets Equity | | | 630 | | | | 71 | |
| |
Expense Limitations, Waivers and Reimbursements: With respect to Latin America, the Manager voluntarily agreed to waive a portion of its investment advisory fees equal to the annual rate of 0.05% of the Fund’s average daily net assets. This amount is included in fees waived and/or reimbursed by the Manager in the Statements of Operations. For the year ended April 30, 2022, the Manager waived $34,407 pursuant to this agreement.
Prior to March 1, 2022, for Unconstrained Equity, the Manager voluntarily agreed to waive a portion of its investment advisory fees equal to the annual rate of 0.05% of the Fund’s average daily net assets. This amount is included in fees waived and/or reimbursed by the Manager in the Statements of Operations. For the year ended April 30, 2022, the Manager waived $130,407 pursuant to this agreement.
With respect to each Fund, the Manager contractually agreed to waive its investment advisory fees by the amount of investment advisory fees each Fund pays to the Manager indirectly through its investment in affiliated money market funds (the “affiliated money market fund waiver”) through June 30, 2023. These contractual agreements may be terminated upon 90 days’ notice by a majority of the directors who are not “interested persons” of a Fund, as defined in the 1940 Act (“Independent Directors”), or by a vote of a majority of the outstanding voting securities of a Fund. With respect to Emerging Markets and Unconstrained Equity, the amount of waivers and/or reimbursements of fees and expenses made pursuant to the expense limitation described below will be reduced by the amount of the affiliated money market fund waiver. These amounts are included in fees waived and/or reimbursed by the Manager in the Statements of Operations. For the year ended April 30, 2022, the amounts waived were as follows:
| | | | |
| Fund Name | | Fees Waived and/or Reimbursed
by the Manager | |
Emerging Markets | | $ | 79,575 | |
Latin America | | | 169 | |
Unconstrained Equity | | | 754 | |
Sustainable Emerging Markets Equity | | | 1,709 | |
With respect to each Fund, the Manager has contractually agreed to waive its investment advisory fee with respect to any portion of each Fund’s assets invested in affiliated equity and fixed-income mutual funds and affiliated exchange-traded funds that have a contractual management fee through June 30, 2023. These contractual agreements may be terminated upon 90 days’ notice by a majority of the Independent Directors or by a vote of a majority of the outstanding voting securities of a Fund. For the year ended April 30, 2022, there were no fees waived and/or reimbursed by the Manager pursuant to these arrangements.
With respect to Emerging Markets, Unconstrained Equity and beginning November 2, 2021, Sustainable Emerging Markets Equity, the Manager contractually agreed to waive and/or reimburse fees or expenses in order to limit expenses, excluding interest expense, dividend expense, tax expense, acquired fund fees and expenses, and certain other
| | |
| 60 | | 2 0 2 2 BLACK ROCK ANNUAL REPORT TO SHAREHOLDERS |
Notes to Financial Statements (continued)
fund expenses, which constitute extraordinary expenses not incurred in the ordinary course of each Fund’s business (“expense limitation”). The expense limitations as a percentage of average daily net assets are as follows:
| | | | | | | | | | | | | | | | | | | | |
| Fund Name | | Institutional | | | Investor A | | | Investor C | | | Class K | | | Class R | |
| | | | | |
Emerging Markets | | | 0.86 | % | | | 1.11 | % | | | 1.86 | % | | | 0.81 | % | | | — | % |
Unconstrained Equity | | | 0.95 | | | | 1.20 | | | | 1.95 | | | | — | | | | 1.45 | |
Sustainable Emerging Markets Equity | | | 0.86 | | | | 1.11 | | | | — | | | | 0.81 | | | | 1.36 | |
Prior to March 1, 2022, the expense limitations as a percentage of average daily net assets were as follows:
| | | | | | | | | | | | | | | | |
Fund Name | | Institutional | | | Investor A | | | Investor C | | | Class R | |
| | | | |
Unconstrained Equity | | | 1.15 | % | | | 1.43 | % | | | 2.29 | % | | | 1.70 | % |
The Manager has agreed not to reduce or discontinue the contractual expense limitations through June 30, 2023, unless approved by the Board, including a majority of the Independent Directors, or by a vote of a majority of the outstanding voting securities of a Fund. For the year ended April 30, 2022, the Manager waived and/or reimbursed amounts as follows, which is included in fees waived and/or reimbursed by the Manager in the Statements of Operations.
| | | | |
| |
| Fund Name | | Fees Waived and/or Reimbursed
by the Manager | |
| |
| |
Emerging Markets | | $ | 1,514,431 | |
Unconstrained Equity | | | 40,609 | |
Sustainable Emerging Markets Equity | | | 87,164 | |
| |
In addition, these amounts waived and/or reimbursed by the Manager are included in transfer agent fees waived and/or reimbursed—class specific in the Statements of Operations. For the year ended April 30, 2022, class specific expense waivers and/or reimbursements are as follows:
| | | | | | | | | | | | | | | | | | | | | | | | |
| |
| | | Transfer Agent Fees Waived and/or Reimbursed - Class Specific | |
| | | | |
| Fund Name | | Institutional | | | Investor A | | | Investor C | | | Class K | | | Class R | | | Total | |
| |
| | | | | | |
Emerging Markets | | $ | 2,297,796 | | | $ | 442,832 | | | $ | 21,504 | | | $ | 22,198 | | | $ | — | | | $ | 2,784,330 | |
Unconstrained Equity | | | 3,065 | | | | 9,658 | | | | 284 | | | | — | | | | 319 | | | | 13,326 | |
Sustainable Emerging Markets Equity | | | 27,369 | | | | 27,238 | | | | — | | | | 1,264 | | | | 1,150 | | | | 57,021 | |
| |
Securities Lending: The U.S. Securities and Exchange Commission (“SEC”) has issued an exemptive order which permits BIM, an affiliate of the Manager, to serve as securities lending agent for the Funds, subject to applicable conditions. As securities lending agent, BIM bears all operational costs directly related to securities lending. The Funds are responsible for expenses in connection with the investment of cash collateral received for securities on loan (the “collateral investment expenses”). The cash collateral is invested in a private investment company, Money Market Series, managed by the Manager or its affiliates. However, BIM has agreed to cap the collateral investment expenses of the Money Market Series to an annual rate of 0.04%. The investment adviser to the Money Market Series will not charge any advisory fees with respect to shares purchased by the Funds. The Money Market Series may, under certain circumstances, impose a liquidity fee of up to 2% of the value withdrawn or temporarily restrict withdrawals for up to 10 business days during a 90 day period, in the event that the private investment company’s weekly liquid assets fall below certain thresholds. The Money Market Series seeks current income consistent with maintaining liquidity and preserving capital. Although the Money Market Series is not registered under the 1940 Act, its investments may follow the parameters of investments by a money market fund that is subject to Rule 2a-7 under the 1940 Act.
Securities lending income is equal to the total of income earned from the reinvestment of cash collateral, net of fees and other payments to and from borrowers of securities, and less the collateral investment expenses. Each Fund retains a portion of securities lending income and remits a remaining portion to BIM as compensation for its services as securities lending agent.
Pursuant to the current securities lending agreement, Emerging Markets, Latin America and Sustainable Emerging Markets Equity each retains 82% of securities lending income (which excludes collateral investment expenses), and this amount retained can never be less than 70% of the total of securities lending income plus the collateral investment expenses.
In addition, commencing the business day following the date that the aggregate securities lending income earned across the BlackRock Multi-Asset Complex in a calendar year exceeds a specified threshold, Emerging Markets, Latin America and Sustainable Emerging Markets Equity each, pursuant to the securities lending agreement, will retain for the remainder of that calendar year securities lending income in an amount equal to 85% of securities lending income (which excludes collateral investment expenses), and this amount retained can never be less than 70% of the total of securities lending income plus the collateral investment expenses.
Prior to January 1, 2022, Unconstrained Equity retained 82% of securities lending income (which excluded collateral investment expenses) and the amount retained could never be less than 70% of the total of securities lending income plus the collateral investment expenses. In addition, commencing the business day following the date that the aggregate securities lending income earned across the BlackRock Multi-Asset Complex in a calendar year exceeded a specified threshold, Unconstrained Equity would retain for the remainder of that calendar year 85% of securities lending income (which excluded collateral investment expenses), and the amount retained could never be less than 70% of the total of securities lending income plus the collateral investment expenses.
In addition, commencing the business day following the date that the aggregate securities lending income earned across the BlackRock Multi-Asset Complex in a calendar year exceeds a specified threshold, Unconstrained Equity, pursuant to the securities lending agreement, will retain for the remainder of that calendar year securities lending income in an amount equal to 81% of securities lending income (which excluded collateral investment expenses), and this amount retained can never be less than 70% of the total of securities lending income plus the collateral investment expenses.
| | |
NOTES TO FINANCIAL STATEMENTS | | 61 |
Notes to Financial Statements (continued)
The share of securities lending income earned by each Fund is shown as securities lending income — affiliated — net in the Statements of Operations. For the year ended April 30, 2022, each Fund paid BIM the following amounts for securities lending agent services:
| | | | |
| |
| Fund Name | | Amounts | |
| |
Emerging Markets | | $ | 20,581 | |
Latin America | | | 464 | |
Unconstrained Equity | | | 292 | |
Sustainable Emerging Markets Equity | | | 719 | |
| |
Interfund Lending: In accordance with an exemptive order (the “Order”) from the SEC, each Fund may participate in a joint lending and borrowing facility for temporary purposes (the “Interfund Lending Program”), subject to compliance with the terms and conditions of the Order, and to the extent permitted by each Fund’s investment policies and restrictions. Sustainable Emerging Markets Equity and Unconstrained Equity are currently permitted to borrow and lend under the Interfund Lending Program. Emerging Markets and Latin America are currently permitted to borrow under the Interfund Lending Program.
A lending BlackRock fund may lend in aggregate up to 15% of its net assets but may not lend more than 5% of its net assets to any one borrowing fund through the Interfund Lending Program. A borrowing BlackRock fund may not borrow through the Interfund Lending Program or from any other source more than 33 1/3% of its total assets (or any lower threshold provided for by the fund’s investment restrictions). If a borrowing BlackRock fund’s total outstanding borrowings exceed 10% of its total assets, each of its outstanding interfund loans will be subject to collateralization of at least 102% of the outstanding principal value of the loan. All interfund loans are for temporary or emergency purposes and the interest rate to be charged will be the average of the highest current overnight repurchase agreement rate available to a lending fund and the bank loan rate, as calculated according to a formula established by the Board.
During the period ended April 30, 2022, the Funds did not participate in the Interfund Lending Program.
Directors and Officers: Certain directors and/or officers of the Funds are directors and/or officers of BlackRock or its affiliates. The Funds reimburse the Manager for a portion of the compensation paid to the Funds’ Chief Compliance Officer, which is included in Directors and Officer in the Statements of Operations.
Other Transactions: The Funds may purchase securities from, or sell securities to, an affiliated fund provided the affiliation is due solely to having a common investment adviser, common officers, or common directors. For the year ended April 30, 2022, the purchase and sale transactions and any net realized gains (losses) with affiliated funds in compliance with Rule 17a-7 under the 1940 Act were as follows:
| | | | | | | | | | | | |
| |
| Fund Name | | Purchases | | | Sales | | | Net Realized
Gain (Loss) | |
| |
Emerging Markets | | $ | 7,369,318 | | | $ | — | | | $ | — | |
| |
7. PURCHASES AND SALES
For the year ended April 30, 2022, purchases and sales of investments, excluding short-term investments, were as follows:
| | | | | | | | |
| |
| Fund Name | | Purchases | | | Sales | |
| |
Emerging Markets | | $ | 7,332,543,878 | | | $ | 5,416,815,688 | |
Latin America | | | 40,148,062 | | | | 54,084,046 | |
Unconstrained Equity | | | 304,892,627 | | | | 335,539,485 | |
Sustainable Emerging Markets Equity | | | 185,539,924 | | | | 216,005,629 | |
| |
8. INCOME TAX INFORMATION
It is each Fund’s policy to comply with the requirements of the Internal Revenue Code of 1986, as amended, applicable to regulated investment companies, and to distribute substantially all of its taxable income to its shareholders. Therefore, no U.S. federal income tax provision is required.
Each Fund files U.S. federal and various state and local tax returns. No income tax returns are currently under examination. The statute of limitations on each Fund’s U.S. federal tax returns generally remains open for a period of three fiscal years after they are filed. The statutes of limitations on each Fund’s state and local tax returns may remain open for an additional year depending upon the jurisdiction.
Management has analyzed tax laws and regulations and their application to the Funds as of April 30, 2022, inclusive of the open tax return years, and does not believe that there are any uncertain tax positions that require recognition of a tax liability in the Funds’ financial statements.
U.S. GAAP requires that certain components of net assets be adjusted to reflect permanent differences between financial and tax reporting. These reclassifications have no effect on net assets or NAVs per share. As of period end, permanent differences attributable to certain deemed distributions were reclassified to the following accounts:
| | | | |
|
| Fund Name | | Paid-in Capital | | Accumulated
Earnings (Loss) |
|
| Unconstrained Equity | | $ 335,741 | | $ (335,741) |
|
| | |
| 62 | | 2 0 2 2 BLACK ROCK ANNUAL REPORT TO SHAREHOLDERS |
Notes to Financial Statements (continued)
The tax character of distributions paid was as follows:
| | | | | | | | | | | | |
| |
| Fund Name | | | | | Year Ended
04/30/22 | | | Year Ended
04/30/21 | |
| |
| | | |
Emerging Markets(a) | | | | | | | | | | | | |
Ordinary income | | | | | | $ | 152,507,553 | | | $ | 26,096,572 | |
Long-term capital gains | | | | | | | 73,387,356 | | | | 2,031,200 | |
| | | | | | | | | | | | |
| | | | | | $ | 225,894,909 | | | $ | 28,127,772 | |
| | | | | | | | | | | | |
Latin America | | | | | | | | | | | | |
Ordinary income | | | | | | $ | 2,956,367 | | | $ | 1,259,285 | |
| | | | | | | | | | | | |
| | | |
Unconstrained Equity(a) | | | | | | | | | | | | |
Ordinary income | | | | | | $ | 16,929,925 | | | $ | 5,501,003 | |
Long-term capital gains | | | | | | | 45,975,452 | | | | 23,205,517 | |
| | | | | | | | | | | | |
| | | | | | $ | 62,905,377 | | | $ | 28,706,520 | |
| | | | | | | | | | | | |
Sustainable Emerging Markets Equity | | | | | | | | | | | | |
Ordinary income | | | | | | $ | 9,733,918 | | | $ | 812,421 | |
Long-term capital gains | | | | | | | 12,946,585 | | | | — | |
| | | | | | | | | | | | |
| | | | | | $ | 22,680,503 | | | $ | 812,421 | |
| | | | | | | | | | | | |
| | (a) | Distribution amounts may include a portion of the proceeds from redeemed shares. | |
As of April 30, 2022, the tax components of accumulated earnings (loss) were as follows:
| | | | | | | | | | | | | | | | | | | | | | |
| |
| Fund Name | | Undistributed Ordinary Income | |
| Undistributed
Long-Term
Capital Gains |
| |
| Non-Expiring
Capital Loss
Carryforwards(a) |
| |
| Net Unrealized
Gains (Losses)(b) |
| |
| Qualified
Late-Year Loss(c) |
| | | Total | |
| |
| | | | | | |
Emerging Markets | | $20,004,764 | | $ | — | | | $ | — | | | $ | (525,316,066 | ) | | $ | (399,293,795 | ) | | $ | (904,605,097 | ) |
Latin America | | 747,546 | | | — | | | | (21,348,360 | ) | | | 8,353,577 | | | | — | | | | (12,247,237 | ) |
Unconstrained Equity | | — | | | 36,659,393 | | | | — | | | | 4,342,574 | | | | (5,717,144 | ) | | | 35,284,823 | |
Sustainable Emerging Markets Equity | | 533,711 | | | — | | | | — | | | | (88,020 | ) | | | (7,184,742 | ) | | | (6,739,051 | ) |
| |
| | (a) | Amounts available to offset future realized capital gains. | |
| | (b) | The difference between book-basis and tax-basis net unrealized gains (losses) was attributable primarily to the tax deferral of losses on wash sales, the realization for tax purposes of unrealized gains/losses on certain futures and foreign currency contracts, the realization for tax purposes of unrealized gains on investments in passive foreign investment companies, the accounting for swap agreements, the characterization of corporate actions and the timing and recognitiion of partnership income. | |
| | (c) | The Fund has elected to defer certain qualified late-year losses and recognize such losses in the next taxable year. | |
During the year ended April 30, 2022, the Fund listed below utilized the following amount of its capital loss carryforward:
| | | | |
| |
Fund Name | | Amounts | |
| |
Latin America | | $ | 1,917,172 | |
| |
As of April 30, 2022, gross unrealized appreciation and depreciation based on cost of investments (including short positions and derivatives, if any) for U.S. federal income tax purposes were as follows:
| | | | | | | | | | | | | | | | |
| |
| Fund Name | | Tax Cost | | | Gross Unrealized
Appreciation | | | Gross Unrealized
Depreciation | | | Net Unrealized
Appreciation
(Depreciation) | |
| |
| | | | |
Emerging Markets | | $ | 4,816,801,710 | | | $ | 211,679,911 | | | $ | (734,997,117 | ) | | $ | (523,317,206 | ) |
Latin America | | | 54,614,559 | | | | 12,069,681 | | | | (3,718,677 | ) | | | 8,351,004 | |
Unconstrained Equity | | | 256,299,284 | | | | 22,728,386 | | | | (18,376,466 | ) | | | 4,351,920 | |
Sustainable Emerging Markets Equity | | | 104,307,510 | | | | 15,725,593 | | | | (15,790,204 | ) | | | (64,611 | ) |
| |
9. BANK BORROWINGS
Each Fund, along with certain other funds managed by the Manager and its affiliates (“Participating Funds”), is a party to a 364-day, $2.50 billion credit agreement with a group of lenders. Under this agreement, the Funds may borrow to fund shareholder redemptions. Excluding commitments designated for certain individual funds, the Participating Funds, including the Funds, can borrow up to an aggregate commitment amount of $1.75 billion at any time outstanding, subject to asset coverage and other limitations as specified in the agreement. The credit agreement has the following terms: a fee of 0.10% per annum on unused commitment amounts and interest at a rate equal to the higher of (a) Overnight Bank Funding Rate (“OBFR”) (but, in any event, not less than 0.00%) on the date the loan is made plus 0.80% per annum, (b) the Fed Funds rate (but, in any event, not less than 0.00%) in effect from time to time plus 0.80% per annum on amounts borrowed or (c) the sum of (x) Daily Simple Secured Overnight Financing Rate (“SOFR”) (but, in any event, not less than 0.00%) on the date the loan is made plus 0.10% and (y) 0.80% per annum. The agreement expires in April 2023 unless extended or renewed. These fees were allocated among such funds based upon portions of the aggregate commitment available to them and relative net assets of Participating Funds. These fees were allocated among such funds based upon portions of the aggregate commitment available to them and relative net assets of Participating Funds. During the year ended April 30, 2022, the Funds did not borrow under the credit agreement.
| | |
NOTES TO FINANCIAL STATEMENTS | | 63 |
Notes to Financial Statements (continued)
10. PRINCIPAL RISKS
In the normal course of business, the Funds invest in securities or other instruments and may enter into certain transactions, and such activities subject each Fund to various risks, including among others, fluctuations in the market (market risk) or failure of an issuer to meet all of its obligations. The value of securities or other instruments may also be affected by various factors, including, without limitation: (i) the general economy; (ii) the overall market as well as local, regional or global political and/or social instability; (iii) regulation, taxation or international tax treaties between various countries; or (iv) currency, interest rate and price fluctuations. Local, regional or global events such as war, acts of terrorism, the spread of infectious illness or other public health issues, recessions, or other events could have a significant impact on the Funds and their investments. Each Fund’s prospectus provides details of the risks to which each Fund is subject.
The Funds may be exposed to additional risks when reinvesting cash collateral in money market funds that do not seek to maintain a stable NAV per share of $1.00, which may be subject to redemption gates or liquidity fees under certain circumstances.
Market Risk: Investments in the securities of issuers domiciled in countries with emerging capital markets involve certain additional risks that do not generally apply to investments in securities of issuers in more developed capital markets, such as (i) low or nonexistent trading volume, resulting in a lack of liquidity and increased volatility in prices for such securities; (ii) uncertain national policies and social, political and economic instability, increasing the potential for expropriation of assets, confiscatory taxation, high rates of inflation or unfavorable diplomatic developments; (iii) lack of publicly available or reliable information about issuers as a result of not being subject to the same degree of regulatory requirements and accounting, auditing and financial reporting standards; and (iv) possible fluctuations in exchange rates, differing legal systems and the existence or possible imposition of exchange controls, custodial restrictions or other foreign or U.S. governmental laws or restrictions applicable to such investments.
Each Fund may be exposed to prepayment risk, which is the risk that borrowers may exercise their option to prepay principal earlier than scheduled during periods of declining interest rates, which would force each Fund to reinvest in lower yielding securities. Each Fund may also be exposed to reinvestment risk, which is the risk that income from each Fund’s portfolio will decline if each Fund invests the proceeds from matured, traded or called fixed-income securities at market interest rates that are below each Fund portfolio’s current earnings rate.
An outbreak of respiratory disease caused by a novel coronavirus has developed into a global pandemic and has resulted in closing borders, quarantines, disruptions to supply chains and customer activity, as well as general concern and uncertainty. The impact of this pandemic, and other global health crises that may arise in the future, could affect the economies of many nations, individual companies and the market in general in ways that cannot necessarily be foreseen at the present time. This pandemic may result in substantial market volatility and may adversely impact the prices and liquidity of a fund’s investments. Although vaccines have been developed and approved for use by various governments, the duration of this pandemic and its effects cannot be determined with certainty.
Valuation Risk: The market values of equities, such as common stocks and preferred securities or equity related investments, such as futures and options, may decline due to general market conditions which are not specifically related to a particular company. They may also decline due to factors which affect a particular industry or industries. A Fund may invest in illiquid investments. An illiquid investment is any investment that a Fund reasonably expects cannot be sold or disposed of in current market conditions in seven calendar days or less without the sale or disposition significantly changing the market value of the investment. A Fund may experience difficulty in selling illiquid investments in a timely manner at the price that it believes the investments are worth. Prices may fluctuate widely over short or extended periods in response to company, market or economic news. Markets also tend to move in cycles, with periods of rising and falling prices. This volatility may cause each Fund’s NAV to experience significant increases or decreases over short periods of time. If there is a general decline in the securities and other markets, the NAV of a Fund may lose value, regardless of the individual results of the securities and other instruments in which a Fund invests.
The price a Fund could receive upon the sale of any particular portfolio investment may differ from a Fund’s valuation of the investment, particularly for securities that trade in thin or volatile markets or that are valued using a fair valuation technique or a price provided by an independent pricing service. Changes to significant unobservable inputs and assumptions (i.e., publicly traded company multiples, growth rate, time to exit) due to the lack of observable inputs may significantly impact the resulting fair value and therefore a Fund’s results of operations. As a result, the price received upon the sale of an investment may be less than the value ascribed by a Fund, and a Fund could realize a greater than expected loss or lesser than expected gain upon the sale of the investment. A Fund’s ability to value its investments may also be impacted by technological issues and/or errors by pricing services or other third-party service providers.
Counterparty Credit Risk: The Funds may be exposed to counterparty credit risk, or the risk that an entity may fail to or be unable to perform on its commitments related to unsettled or open transactions, including making timely interest and/or principal payments or otherwise honoring its obligations. The Funds manage counterparty credit risk by entering into transactions only with counterparties that the Manager believes have the financial resources to honor their obligations and by monitoring the financial stability of those counterparties. Financial assets, which potentially expose the Funds to market, issuer and counterparty credit risks, consist principally of financial instruments and receivables due from counterparties. The extent of the Funds’ exposure to market, issuer and counterparty credit risks with respect to these financial assets is approximately their value recorded in the Statements of Assets and Liabilities, less any collateral held by the Funds.
A derivative contract may suffer a mark-to-market loss if the value of the contract decreases due to an unfavorable change in the market rates or values of the underlying instrument. Losses can also occur if the counterparty does not perform under the contract.
With exchange-traded futures, there is less counterparty credit risk to the Funds since the exchange or clearinghouse, as counterparty to such instruments, guarantees against a possible default. The clearinghouse stands between the buyer and the seller of the contract; therefore, credit risk is limited to failure of the clearinghouse. While offset rights may exist under applicable law, a Fund does not have a contractual right of offset against a clearing broker or clearinghouse in the event of a default (including the bankruptcy or insolvency). Additionally, credit risk exists in exchange-traded futures with respect to initial and variation margin that is held in a clearing broker’s customer accounts. While
| | |
| 64 | | 2 0 2 2 BLACK ROCK ANNUAL REPORT TO SHAREHOLDERS |
Notes to Financial Statements (continued)
clearing brokers are required to segregate customer margin from their own assets, in the event that a clearing broker becomes insolvent or goes into bankruptcy and at that time there is a shortfall in the aggregate amount of margin held by the clearing broker for all its clients, typically the shortfall would be allocated on a pro rata basis across all the clearing broker’s customers, potentially resulting in losses to the Funds.
Concentration Risk: A diversified portfolio, where this is appropriate and consistent with a fund’s objectives, minimizes the risk that a price change of a particular investment will have a material impact on the NAV of a fund. The investment concentrations within each Fund’s portfolio are disclosed in its Schedule of Investments.
Certain Funds invest a substantial amount of their assets in issuers located in a single country or a limited number of countries. When a Fund concentrates its investments in this manner, it assumes the risk that economic, regulatory, political and social conditions in those countries may have a significant impact on their investment performance and could affect the income from, or the value or liquidity of, the Fund’s portfolio. Unanticipated or sudden political or social developments may cause uncertainty in the markets and as a result adversely affect the Fund’s investments. Foreign issuers may not be subject to the same uniform accounting, auditing and financial reporting standards and practices as used in the United States. Foreign securities markets may also be more volatile and less liquid than U.S. securities and may be less subject to governmental supervision not typically associated with investing in U.S. securities. Investment percentages in specific countries are presented in the Schedules of Investments.
Certain Funds invest a significant portion of their assets in securities of issuers located in Asia or with significant exposure to Asian issuers or countries. The Asian financial markets have recently experienced volatility and adverse trends due to concerns in several Asian countries regarding monetary policy, government intervention in the markets, rising government debt levels or economic downturns. These events may spread to other countries in Asia and may affect the value and liquidity of certain of the Funds’ investments.
Certain Funds invest a significant portion of their assets in securities of issuers located in China or with significant exposure to Chinese issuers or countries. Investments in Chinese securities, including certain Hong Kong-listed securities, involves risks specific to China. China may be subject to considerable degrees of economic, political and social instability and demonstrates significantly higher volatility from time to time in comparison to developed markets. Chinese markets generally continue to experience inefficiency, volatility and pricing anomalies resulting from governmental influence, a lack of publicly available information and/or political and social instability. Internal social unrest or confrontations with other neighboring countries may disrupt economic development in China and result in a greater risk of currency fluctuations, currency non-convertibility, interest rate fluctuations and higher rates of inflation. Incidents involving China’s or the region’s security may cause uncertainty in Chinese markets and may adversely affect the Chinese economy and the Fund’s investments. Reduction in spending on Chinese products and services, institution of tariffs or other trade barriers, or a downturn in any of the economies of China’s key trading partners may have an adverse impact on the Chinese economy. In addition, measures may be taken to limit the flow of capital and/or sanctions may be imposed, which could prohibit or restrict the ability to own or transfer fund assets and may also include retaliatory actions, such as seizure of fund assets.
Significant Shareholder Redemption Risk: Certain shareholders may own or manage a substantial amount of fund shares and/or hold their fund investments for a limited period of time. Large redemptions of fund shares by these shareholders may force a Fund to sell portfolio securities, which may negatively impact the fund’s NAV, increase the fund’s brokerage costs, and/or accelerate the realization of taxable income/gains and cause the fund to make additional taxable distributions to shareholders.
LIBOR Transition Risk: The United Kingdom’s Financial Conduct Authority announced a phase out of the London Interbank Offered Rate (“LIBOR”). Although many LIBOR rates ceased to be published or no longer are representative of the underlying market they seek to measure after December 31, 2021, a selection of widely used USD LIBOR rates will continue to be published through June 2023 in order to assist with the transition. The Funds may be exposed to financial instruments tied to LIBOR to determine payment obligations, financing terms, hedging strategies or investment value. The transition process away from LIBOR might lead to increased volatility and illiquidity in markets for, and reduce the effectiveness of new hedges placed against instruments whose terms currently include LIBOR. The ultimate effect of the LIBOR transition process on the Funds is uncertain.
11. CAPITAL SHARE TRANSACTIONS
Transactions in capital shares for each class were as follows:
| | | | | | | | | | | | | | | | |
| |
| | | Year Ended
04/30/22 | | | Year Ended
04/30/21 | |
| Fund Name / Share Class | | Shares | | | Amounts | | | Shares | | | Amounts | |
| |
Emerging Markets | | | | | | | | | | | | | | | | |
Institutional | | | | | | | | | | | | | | | | |
Shares sold | | | 111,684,432 | | | $ | 3,406,868,036 | | | | 68,873,921 | | | $ | 2,143,871,430 | |
Shares issued in reinvestment of distributions | | | 4,880,264 | | | | 158,860,447 | | | | 404,775 | | | | 11,886,082 | |
Shares redeemed | | | (63,250,079 | ) | | | (1,870,376,025 | ) | | | (18,697,657 | ) | | | (567,264,765 | ) |
| | | | | | | | | | | | | | | | |
| | | 53,314,617 | | | $ | 1,695,352,458 | | | | 50,581,039 | | | $ | 1,588,492,747 | |
| | | | | | | | | | | | | | | | |
Investor A | | | | | | | | | | | | | | | | |
Shares sold and automatic conversion of shares | | | 6,258,745 | | | $ | 185,937,543 | | | | 7,563,202 | | | $ | 230,262,345 | |
Shares issued in reinvestment of distributions | | | 699,008 | | | | 22,005,602 | | | | 84,502 | | | | 2,374,530 | |
Shares redeemed | | | (5,916,753 | ) | | | (173,951,842 | ) | | | (2,914,033 | ) | | | (85,232,133 | ) |
| | | | | | | | | | | | | | | | |
| | | 1,041,000 | | | $ | 33,991,303 | | | | 4,733,671 | | | $ | 147,404,742 | |
| | | | | | | | | | | | | | | | |
| | |
NOTES TO FINANCIAL STATEMENTS | | 65 |
Notes to Financial Statements (continued)
| | | | | | | | | | | | | | | | |
| |
| | | Year Ended
04/30/22 | | | Year Ended
04/30/21 | |
| Fund Name / Share Class (continued) | | Shares | | | Amounts | | | Shares | | | Amounts | |
| |
Emerging Markets (continued) | | | | | | | | | | | | | | | | |
Investor C | | | | | | | | | | | | | | | | |
Shares sold | | | 231,332 | | | $ | 5,885,094 | | | | 324,426 | | | $ | 8,719,645 | |
Shares issued in reinvestment of distributions | | | 39,779 | | | | 1,050,050 | | | | 971 | | | | 20,032 | |
Shares redeemed and automatic conversion of shares | | | (267,979 | ) | | | (6,630,263 | ) | | | (1,022,090 | ) | | | (22,477,675 | ) |
| | | | | | | | | | | | | | | | |
| | | 3,132 | | | $ | 304,881 | | | | (696,693 | ) | | $ | (13,737,998 | ) |
| | | | | | | | | | | | | | | | |
| | | | |
Class K | | | | | | | | | | | | | | | | |
Shares sold | | | 20,841,017 | | | $ | 642,279,625 | | | | 9,127,401 | | | $ | 301,594,124 | |
Shares issued in reinvestment of distributions | | | 881,942 | | | | 28,473,961 | | | | 86,421 | | | | 2,538,837 | |
Shares redeemed | | | (6,162,402 | ) | | | (190,247,463 | ) | | | (3,421,779 | ) | | | (100,156,064 | ) |
| | | | | | | | | | | | | | | | |
| | | 15,560,557 | | | $ | 480,506,123 | | | | 5,792,043 | | | $ | 203,976,897 | |
| | | | | | | | | | | | | | | | |
| | | 69,919,306 | | | $ | 2,210,154,765 | | | | 60,410,060 | | | $ | 1,926,136,388 | |
| | | | | | | | | | | | | | | | |
| | | | | | | | | | | | | | | | |
| |
| | | Year Ended
04/30/22 | | | Year Ended
04/30/21 | |
| Fund Name / Share Class | | Shares | | | Amounts | | | Shares | | | Amounts | |
| |
Latin America | | | | | | | | | | | | | | | | |
Institutional | | | | | | | | | | | | | | | | |
Shares sold | | | 295,638 | | | $ | 12,772,491 | | | | 2,104,582 | | | $ | 76,962,313 | |
Shares issued in reinvestment of distributions | | | 13,100 | | | | 502,854 | | | | 11,583 | | | | 461,234 | |
Shares redeemed | | | (295,977 | ) | | | (12,584,788 | ) | | | (2,588,763 | ) | | | (98,913,570 | ) |
| | | | | | | | | | | | | | | | |
| | | 12,761 | | | $ | 690,557 | | | | (472,598 | ) | | $ | (21,490,023 | ) |
| | | | | | | | | | | | | | | | |
| | | | |
Investor A | | | | | | | | | | | | | | | | |
Shares sold and automatic conversion of shares | | | 53,804 | | | $ | 2,233,813 | | | | 338,733 | | | $ | 12,681,036 | |
Shares issued in reinvestment of distributions | | | 49,314 | | | | 1,859,887 | | | | 16,111 | | | | 627,665 | |
Shares redeemed | | | (417,119 | ) | | | (18,068,676 | ) | | | (459,740 | ) | | | (16,802,190 | ) |
| | | | | | | | | | | | | | | | |
| | | (314,001 | ) | | $ | (13,974,976 | ) | | | (104,896 | ) | | $ | (3,493,489 | ) |
| | | | | | | | | | | | | | | | |
| | | | |
Investor C | | | | | | | | | | | | | | | | |
Shares sold | | | 3,705 | | | $ | 142,289 | | | | 10,327 | | | $ | 355,135 | |
Shares issued in reinvestment of distributions | | | 1,351 | | | | 46,289 | | | | 322 | | | | 10,853 | |
Shares redeemed and automatic conversion of shares | | | (15,310 | ) | | | (564,017 | ) | | | (78,776 | ) | | | (2,796,688 | ) |
| | | | | | | | | | | | | | | | |
| | | (10,254 | ) | | $ | (375,439 | ) | | | (68,127 | ) | | $ | (2,430,700 | ) |
| | | | | | | | | | | | | | | | |
| | | | |
Class K | | | | | | | | | | | | | | | | |
Shares sold | | | 8,945 | | | $ | 375,034 | | | | 6,122 | | | $ | 244,415 | |
Shares issued in reinvestment of distributions | | | 421 | | | | 16,167 | | | | 137 | | | | 5,396 | |
Shares redeemed | | | (6,256 | ) | | | (251,018 | ) | | | (7,417 | ) | | | (284,013 | ) |
| | | | | | | | | | | | | | | | |
| | | 3,110 | | | $ | 140,183 | | | | (1,158 | ) | | $ | (34,202 | ) |
| | | | | | | | | | | | | | | | |
| | | (308,384 | ) | | $ | (13,519,675 | ) | | | (646,779 | ) | | $ | (27,448,414 | ) |
| | | | | | | | | | | | | | | | |
| | | | | | | | | | | | | | | | |
| |
| | | Year Ended
04/30/22 | | | Year Ended
04/30/21 | |
| Fund Name / Share Class | | Shares | | | Amounts | | | Shares | | | Amounts | |
| |
Unconstrained Equity | | | | | | | | | | | | | | | | |
Institutional | | | | | | | | | | | | | | | | |
Shares sold | | | 1,084,283 | | | $ | 16,057,880 | | | | 417,078 | | | $ | 5,769,827 | |
Shares issued in reinvestment of distributions | | | 680,844 | | | | 9,877,009 | | | | 296,321 | | | | 4,074,008 | |
Shares redeemed | | | (909,369 | ) | | | (12,966,292 | ) | | | (657,040 | ) | | | (9,238,780 | ) |
| | | | | | | | | | | | | | | | |
| | | 855,758 | | | $ | 12,968,597 | | | | 56,359 | | | $ | 605,055 | |
| | | | | | | | | | | | | | | | |
| | | | |
Investor A | | | | | | | | | | | | | | | | |
Shares sold and automatic conversion of shares | | | 535,066 | | | $ | 7,890,308 | | | | 618,582 | | | $ | 8,526,589 | |
Shares issued in reinvestment of distributions | | | 3,087,344 | | | | 44,774,956 | | | | 1,436,825 | | | | 19,746,396 | |
Shares redeemed | | | (1,707,647 | ) | | | (24,646,359 | ) | | | (1,709,843 | ) | | | (24,266,553 | ) |
| | | | | | | | | | | | | | | | |
| | | 1,914,763 | | | $ | 28,018,905 | | | | 345,564 | | | $ | 4,006,432 | |
| | | | | | | | | | | | | | | | |
| | |
| 66 | | 2 0 2 2 BLACK ROCK ANNUAL REPORT TO SHAREHOLDERS |
Notes to Financial Statements (continued)
| | | | | | | | | | | | | | | | |
| |
| | | Year Ended
04/30/22 | | | Year Ended
04/30/21 | |
| Fund Name / Share Class (continued) | | Shares | | | Amounts | | | Shares | | | Amounts | |
| |
Unconstrained Equity (continued) | | | | | | | | | | | | | | | | |
Investor C | | | | | | | | | | | | | | | | |
Shares sold | | | 24,377 | | | $ | 374,635 | | | | 25,739 | | | $ | 361,120 | |
Shares issued in reinvestment of distributions | | | 23,808 | | | | 349,402 | | | | 28,694 | | | | 385,868 | |
Shares redeemed and automatic conversion of shares | | | (53,516 | ) | | | (798,322 | ) | | | (464,273 | ) | | | (6,331,031 | ) |
| | | | | | | | | | | | | | | | |
| | | (5,331 | ) | | $ | (74,285 | ) | | | (409,840 | ) | | $ | (5,584,043 | ) |
| | | | | | | | | | | | | | | | |
| | | | |
Class R | | | | | | | | | | | | | | | | |
Shares sold | | | 1,561 | | | $ | 22,992 | | | | 9,573 | | | $ | 134,528 | |
Shares issued in reinvestment of distributions | | | 3,353 | | | | 49,398 | | | | 2,852 | | | | 39,509 | |
Shares redeemed | | | (8,956 | ) | | | (149,210 | ) | | | (45,329 | ) | | | (613,744 | ) |
| | | | | | | | | | | | | | | | |
| | | (4,042 | ) | | $ | (76,820 | ) | | | (32,904 | ) | | $ | (439,707 | ) |
| | | | | | | | | | | | | | | | |
| | | 2,761,148 | | | $ | 40,836,397 | | | | (40,821 | ) | | $ | (1,412,263 | ) |
| | | | | | | | | | | | | | | | |
| | | | | | | | | | | | | | | | |
| |
| | | Year Ended
04/30/22 | | | Year Ended
04/30/21 | |
| Fund Name / Share Class | | Shares | | | Amounts | | | Shares | | | Amounts | |
| |
Sustainable Emerging Markets Equity | | | | | | | | | | | | | | | | |
Institutional | | | | | | | | | | | | | | | | |
Shares sold | | | 134,454 | | | $ | 2,290,268 | | | | 630,325 | | | $ | 12,567,552 | |
Shares issued in reinvestment of distributions | | | 565,819 | | | | 9,681,124 | | | | 21,769 | | | | 384,431 | |
Shares redeemed | | | (1,151,391 | ) | | | (21,024,778 | ) | | | (483,905 | ) | | | (8,486,261 | ) |
| | | | | | | | | | | | | | | | |
| | | (451,118 | ) | | $ | (9,053,386 | ) | | | 168,189 | | | $ | 4,465,722 | |
| | | | | | | | | | | | | | | | |
| | | | |
Investor A | | | | | | | | | | | | | | | | |
Shares sold and automatic conversion of shares | | | 301,558 | | | $ | 5,375,329 | | | | 284,040 | | | $ | 5,198,964 | |
Shares issued in reinvestment of distributions | | | 591,428 | | | | 9,950,472 | | | | 18,181 | | | | 310,669 | |
Shares redeemed | | | (727,805 | ) | | | (12,558,206 | ) | | | (662,177 | ) | | | (11,523,000 | ) |
| | | | | | | | | | | | | | | | |
| | | 165,181 | | | $ | 2,767,595 | | | | (359,956 | ) | | $ | (6,013,367 | ) |
| | | | | | | | | | | | | | | | |
| | | | |
Investor C(a) | | | | | | | | | | | | | | | | |
Shares sold | | | 1,730 | | | $ | 20,693 | | | | 14,549 | | | $ | 181,850 | |
Shares issued in reinvestment of distributions | | | 10,354 | | | | 127,360 | | | | 913 | | | | 9,548 | |
Shares redeemed and automatic conversion of shares | | | (141,616 | ) | | | (1,676,810 | ) | | | (141,625 | ) | | | (1,623,093 | ) |
| | | | | | | | | | | | | | | | |
| | | (129,532 | ) | | $ | (1,528,757 | ) | | | (126,163 | ) | | $ | (1,431,695 | ) |
| | | | | | | | | | | | | | | | |
Class K | | | | | | | | | | | | | | | | |
Shares sold | | | 47,662 | | | $ | 877,079 | | | | 42,279 | | | $ | 841,351 | |
Shares issued in reinvestment of distributions | | | 14,548 | | | | 247,712 | | | | 267 | | | | 4,682 | |
Shares redeemed | | | (36,736 | ) | | | (586,754 | ) | | | (26,469 | ) | | | (474,562 | ) |
| | | | | | | | | | | | | | | | |
| | | 25,474 | | | $ | 538,037 | | | | 16,077 | | | $ | 371,471 | |
| | | | | | | | | | | | | | | | |
| | | | |
Class R | | | | | | | | | | | | | | | | |
Shares sold | | | 18,445 | | | $ | 234,172 | | | | 20,658 | | | $ | 291,819 | |
Shares issued in reinvestment of distributions | | | 15,353 | | | | 186,602 | | | | 346 | | | | 4,284 | |
Shares redeemed | | | (28,778 | ) | | | (353,514 | ) | | | (35,508 | ) | | | (461,281 | ) |
| | | | | | | | | | | | | | | | |
| | | 5,020 | | | $ | 67,260 | | | | (14,504 | ) | | $ | (165,178 | ) |
| | | | | | | | | | | | | | | | |
| | | (384,975 | ) | | $ | (7,209,251 | ) | | | (316,357 | ) | | $ | (2,773,047 | ) |
| | | | | | | | | | | | | | | | |
| | (a) | On October 28, 2021, the Fund’s issued and outstanding Investor C Shares converted into Investor A Shares. | |
As of April 30, 2022, shares owned by BlackRock Financial Management, Inc., an affiliate of the Funds, were as follows:
| | | | |
| Fund Name | | Class K | |
Latin America | | | 3,577 | |
Sustainable Emerging Markets Equity | | | 10,701 | |
12. SUBSEQUENT EVENTS
Management has evaluated the impact of all subsequent events on the Funds through the date the financial statements were issued and has determined that there were no subsequent events requiring adjustment or additional disclosure in the financial statements.
| | |
NOTES TO FINANCIAL STATEMENTS | | 67 |
Report of Independent Registered Public Accounting Firm
To the Shareholders and Board of Directors/Trustees of BlackRock Emerging Markets Fund, Inc., BlackRock Latin America Fund, Inc., and BlackRock Unconstrained Equity Fund and to the Shareholders of BlackRock Sustainable Emerging Markets Equity Fund and the Board of Directors of BlackRock Funds VII, Inc.:
Opinion on the Financial Statements and Financial Highlights
We have audited the accompanying statements of assets and liabilities of BlackRock Emerging Markets Fund, Inc., BlackRock Latin America Fund, Inc., BlackRock Unconstrained Equity Fund (formerly, BlackRock Long-Horizon Equity Fund), and BlackRock Sustainable Emerging Markets Equity Fund (formerly, BlackRock Asian Dragon Fund, Inc.) of BlackRock Funds VII, Inc. (the “Funds”), including the schedules of investments, as of April 30, 2022, the related statements of operations for the year then ended, the statements of changes in net assets for each of the two years in the period then ended, the financial highlights for the periods indicated in the table below, and the related notes. In our opinion, the financial statements and financial highlights present fairly, in all material respects, the financial position of the Funds as of April 30, 2022, and the results of their operations for the year then ended, the changes in their net assets for each of the two years in the period then ended, and the financial highlights for the periods indicated in the table below, in conformity with accounting principles generally accepted in the United States of America.
| | |
Fund | | Financial Highlights |
BlackRock Emerging Markets Fund, Inc. | | For each of the two years in the period ended April 30, 2022, for the period from November 1, 2019 through April 30, 2020, and for each of the three years in the period ended October 31, 2019 |
BlackRock Latin America Fund, Inc. | | For each of the two years in the period ended April 30, 2022, for the period from November 1, 2019 through April 30, 2020, and for each of the three years in the period ended October 31, 2019 |
BlackRock Unconstrained Equity Fund | | For each of the two years in the period ended April 30, 2022, for the period from November 1, 2019 through April 30, 2020, and for each of the three years in the period ended October 31, 2019 |
BlackRock Sustainable Emerging Markets Equity Fund | | For each of the two years in the period ended April 30, 2022, for the period from January 1, 2020 through April 30, 2020, and for each of the three years in the period ended December 31, 2019 |
Basis for Opinion
These financial statements and financial highlights are the responsibility of the Funds’ management. Our responsibility is to express an opinion on the Funds’ financial statements and financial highlights based on our audits. We are a public accounting firm registered with the Public Company Accounting Oversight Board (United States) (PCAOB) and are required to be independent with respect to the Funds in accordance with the U.S. federal securities laws and the applicable rules and regulations of the Securities and Exchange Commission and the PCAOB.
We conducted our audits in accordance with the standards of the PCAOB. Those standards require that we plan and perform the audit to obtain reasonable assurance about whether the financial statements and financial highlights are free of material misstatement, whether due to error or fraud. The Funds are not required to have, nor were we engaged to perform, an audit of their internal control over financial reporting. As part of our audits we are required to obtain an understanding of internal control over financial reporting but not for the purpose of expressing an opinion on the effectiveness of the Funds’ internal control over financial reporting. Accordingly, we express no such opinion.
Our audits included performing procedures to assess the risks of material misstatement of the financial statements and financial highlights, whether due to error or fraud, and performing procedures that respond to those risks. Such procedures included examining, on a test basis, evidence regarding the amounts and disclosures in the financial statements and financial highlights. Our audits also included evaluating the accounting principles used and significant estimates made by management, as well as evaluating the overall presentation of the financial statements and financial highlights. Our procedures included confirmation of securities owned as of April 30, 2022, by correspondence with the custodians or counterparties; when replies were not received, we performed other auditing procedures. We believe that our audits provide a reasonable basis for our opinion.
Deloitte & Touche LLP
Boston, Massachusetts
June 28, 2022
We have served as the auditor of one or more BlackRock investment companies since 1992.
| | |
| 68 | | 2 0 2 2 BLACK ROCK ANNUAL REPORT TO SHAREHOLDERS |
Important Tax Information (unaudited)
The following amounts, or maximum amounts allowable by law, are hereby designated as qualified dividend income for individuals for the fiscal year ended April 30, 2022:
| | | | |
| Fund Name | | Qualified Dividend
Income | |
Emerging Markets | | $ | 62,125,541 | |
Latin America | | | 3,714,368 | |
Unconstrained Equity | | | 2,839,250 | |
Sustainable Emerging Markets Equity | | | 1,555,115 | |
The Funds hereby designate the following amounts, or maximum amounts allowable by law, as capital gain dividends, subject to a long-term capital gains tax rate as noted below, for the fiscal year ended April 30, 2022:
| | | | |
| Fund Name | | 20% Rate Long-Term
Capital Gain Dividends | |
Emerging Markets | | $ | 73,387,356 | |
Unconstrained Equity | | | 46,311,193 | |
Sustainable Emerging Markets Equity | | | 12,946,585 | |
The Funds intend to pass through to their shareholders the following amounts, or maximum amounts allowable by law, of foreign source income earned and foreign taxes paid for the fiscal year ended April 30, 2022:
| | | | | | | | |
| Fund Name | | Foreign Source
Income Earned | | | Foreign
Taxes Paid | |
Emerging Markets | | $ | 46,052,861 | | | $ | 14,722,381 | |
Latin America | | | 3,128,285 | | | | 250,973 | |
Sustainable Emerging Markets Equity | | | 1,231,869 | | | | 830,536 | |
The following percentages, or maximum percentages allowable by law, of ordinary income distributions paid during the fiscal year ended April 30, 2022 qualified for the dividends-received deduction for corporate shareholders:
| | | | |
| Fund Name | | Dividends-Received
Deduction | |
Emerging Markets | | | 1.92 | % |
Unconstrained Equity | | | 18.90 | |
Sustainable Emerging Markets Equity | | | 1.66 | |
The Fund hereby designates the following amount, or maximum amount allowable by law, as interest-related dividends and qualified short-term capital gains eligible for exemption from U.S. withholding tax for nonresident aliens and foreign corporations for the fiscal year ended April 30, 2022:
| | | | |
| Fund Name | | Qualified
Short-Term
Capital Gains | |
Unconstrained Equity | | $ | 4,365,802 | |
Sustainable Emerging Markets Equity | | | 997,798 | |
Disclosure of Investment Sub-Advisory Agreement
The Board of Directors (the “Board,” the members of which are referred to as “Board Members”) of BlackRock Funds VII, Inc. (the “Corporation”) met on November 8-10, 2021 (the “Meeting”) to consider the initial approval of the proposed sub-advisory agreement (the “Sub-Advisory Agreement”) between BlackRock Advisors, LLC (the “Manager”), the Corporation’s investment advisor, and BlackRock International Limited (the “Sub-Advisor”) with respect to BlackRock Sustainable Emerging Markets Equity Fund (the “Fund”), a series of the Corporation.
Consistent with the requirements of the Investment Company Act of 1940 (the “1940 Act”), at the Meeting, the Board reviewed materials relating to its consideration of the Sub-Advisory Agreement. The Board Members whom are not “interested persons” of the Corporation, as defined in the 1940 Act, are considered independent Board members (the “Independent Board Members”). The Board previously met on May 10-12, 2021 (the “May 2021 Meeting”) to consider the approval of the continuation of the Corporation’s investment advisory agreement (the “Advisory Agreement”) between the Corporation and the Manager, on behalf of the Fund. At the May 2021 Meeting, the Board, including the Independent Board Members, unanimously approved the continuation of the Advisory Agreement for a one-year term ending June 30, 2022. A discussion of the basis for the Board’s approval of the Advisory Agreement at the May 2021 Meeting is included in the semi-annual shareholder report for the Fund for the period ended October 31, 2021. The factors considered by the Board at the Meeting in connection with the approval of the proposed Sub-Advisory Agreement were substantially the same as the factors considered at the May 2021 Meeting with respect to approval of the Advisory Agreement.
Following discussion, the Board, including the Independent Board Members, unanimously approved the Sub-Advisory Agreement between the Manager and the Sub-Advisor, with respect to the Fund, for a two-year term beginning on the effective date of the Sub-Advisory Agreement. Based upon its evaluation of all of the aforementioned factors in their totality, as well as other information, the Board, including a majority of the Independent Board Members, was satisfied that the terms of the Sub-Advisory Agreement were fair and reasonable and in the best interest of the Fund and its shareholders. In arriving at its decision to approve the Sub-Advisory Agreement, the Board did not identify any single factor or group of factors as all-important or controlling, but considered all factors together, and different Board Members may have attributed different weights to the various factors considered. The Independent Board Members were also assisted by the advice of independent legal counsel in making this determination.
| | |
| 70 | | 2 0 2 2 BLACK ROCK ANNUAL REPORT TO SHAREHOLDERS |
Statement Regarding Liquidity Risk Management Program
In compliance with Rule 22e-4 under the Investment Company Act of 1940, as amended (the “Liquidity Rule”), BlackRock Emerging Markets Fund, Inc., BlackRock Latin America Fund, Inc., BlackRock Funds VII, Inc. (collectively the “Corporations”) and BlackRock Unconstrained Equity Fund (the “Trust”) have adopted and implemented a liquidity risk management program (the “Program”) for BlackRock Emerging Markets Fund, Inc., BlackRock Latin America Fund, Inc., BlackRock Unconstrained Equity Fund and BlackRock Sustainable Emerging Market Equity Fund (the “Funds”), each a series of the Corporations or the Trust, which is reasonably designed to assess and manage each Fund’s liquidity risk.
The Board of Directors (the “Board”) of the Corporations and the Trust, on behalf of the Funds, met on November 9-10, 2021 (the “Meeting”) to review the Program. The Board previously appointed BlackRock Advisors, LLC or BlackRock Fund Advisors (“BlackRock”), each an investment adviser to certain BlackRock funds, as the program administrator for each Fund’s Program, as applicable. BlackRock also previously delegated oversight of the Program to the 40 Act Liquidity Risk Management Committee (the “Committee”). At the Meeting, the Committee, on behalf of BlackRock, provided the Board with a report that addressed the operation of the Program and assessed its adequacy and effectiveness of implementation, including the management of each Fund’s Highly Liquid Investment Minimum (“HLIM”) where applicable, and any material changes to the Program (the “Report”). The Report covered the period from October 1, 2020 through September 30, 2021 (the “Program Reporting Period”).
The Report described the Program’s liquidity classification methodology for categorizing each Fund’s investments (including derivative transactions) into one of four liquidity buckets. It also referenced the methodology used by BlackRock to establish each Fund’s HLIM and noted that the Committee reviews and ratifies the HLIM assigned to each Fund no less frequently than annually. The Report also discussed notable events affecting liquidity over the Program Reporting Period, including the imposition of capital controls in certain countries.
The Report noted that the Program complied with the key factors for consideration under the Liquidity Rule for assessing, managing and periodically reviewing each Fund’s liquidity risk, as follows:
| | a) | The Fund’s investment strategy and liquidity of portfolio investments during both normal and reasonably foreseeable stressed conditions. During the Program Reporting Period, the Committee reviewed whether each Fund’s strategy is appropriate for an open-end fund structure with a focus on funds with more significant and consistent holdings of less liquid and illiquid assets. The Committee also factored a fund’s concentration in an issuer into the liquidity classification methodology by taking issuer position sizes into account. Where a fund participated in borrowings for investment purposes (such as tender option bonds or reverse repurchase agreements), such borrowings were factored into the Program’s calculation of a fund’s liquidity bucketing. Derivative exposure was also considered in such calculation. |
| | b) | Short-term and long-term cash flow projections during both normal and reasonably foreseeable stressed conditions. During the Program Reporting Period, the Committee reviewed historical redemption activity and used this information as a component to establish each Fund’s reasonably anticipated trading size (“RATS”). Each Fund has adopted an in-kind redemption policy which may be utilized to meet larger redemption requests. The Committee may also take into consideration a fund’s shareholder ownership concentration (which, depending on product type and distribution channel, may or may not be available), a fund’s distribution channels, and the degree of certainty associated with a fund’s short-term and long-term cash flow projections. |
| | c) | Holdings of cash and cash equivalents, as well as borrowing arrangements. The Committee considered the terms of the credit facility committed to each Fund, the financial health of the institution providing the facility and the fact that the credit facility is shared among multiple funds (including that a portion of the aggregate commitment amount is specifically designated for BlackRock Floating Rate Income Portfolio, a series of BlackRock Funds V). The Committee also considered other types of borrowing available to the Funds, such as the ability to use reverse repurchase agreements and interfund lending, as applicable. |
There were no material changes to the Program during the Program Reporting Period other than the enhancement of certain model components in the Program’s methodology. The Report provided to the Board stated that the Committee concluded that based on the operation of the functions, as described in the Report, the Program is operating as intended and is effective in implementing the requirements of the Liquidity Rule.
| | |
STATEMENT REGARDING LIQUIDITY RISK MANAGEMENT PROGRAM | | 71 |
Director and Officer Information
| | | | | | | | |
| Independent Directors(a) |
| | | | |
Name Year of Birth(b) | | Position(s) Held (Length of Service)(c) | | Principal Occupation(s) During Past Five Years | | Number of BlackRock-Advised
Registered Investment Companies (“RICs”) Consisting of Investment Portfolios
(“Portfolios”) Overseen | | Public Company
and Other
Investment
Company
Directorships Held
During Past Five Years |
| | | | |
Mark Stalnecker 1951 | | Chair of the Board (Since 2019) and Director (Since 2015) | | Chief Investment Officer, University of Delaware from 1999 to 2013; Trustee and Chair of the Finance and Investment Committees, Winterthur Museum and Country Estate from 2005 to 2016; Member of the Investment Committee, Delaware Public Employees’ Retirement System since 2002; Member of the Investment Committee, Christiana Care Health System from 2009 to 2017; Member of the Investment Committee, Delaware Community Foundation from 2013 to 2014; Director and Chair of the Audit Committee, SEI Private Trust Co. from 2001 to 2014. | | 29 RICs consisting of 163 Portfolios | | None |
| | | | |
Susan J. Carter 1956 | | Director (Since 2016) | | Trustee, Financial Accounting Foundation from 2017 to 2021; Advisory Board Member, Center for Private Equity and Entrepreneurship at Tuck School of Business from 1997 to 2021; Director, Pacific Pension Institute from 2014 to 2018; Senior Advisor, Commonfund Capital, Inc. (“CCI”) (investment adviser) in 2015; Chief Executive Officer, CCI from 2013 to 2014; President & Chief Executive Officer, CCI from 1997 to 2013; Advisory Board Member, Girls Who Invest from 2015 to 2018 and Board Member thereof since 2018; Advisory Board Member, Bridges Fund Management since 2016; Practitioner Advisory Board Member, Private Capital Research Institute (“PCRI”) since 2017; Lecturer in the Practice of Management, Yale School of Management since 2019; Advisor to Finance Committee, Altman Foundation since 2020; Investment Committee Member, Tostan since 2021. | | 29 RICs consisting of 163 Portfolios | | None |
| | | | |
Collette Chilton 1958 | | Director (Since 2015) | | Chief Investment Officer, Williams College since 2006; Chief Investment Officer, Lucent Asset Management Corporation from 1998 to 2006; Director, Boys and Girls Club of Boston since 2017; Director, B1 Capital since 2018; Director, David and Lucile Packard Foundation since 2020. | | 29 RICs consisting of 163 Portfolios | | None |
| | | | |
Neil A. Cotty 1954 | | Director (Since 2016) | | Bank of America Corporation from 1996 to 2015, serving in various senior finance leadership roles, including Chief Accounting Officer from 2009 to 2015, Chief Financial Officer of Global Banking, Markets and Wealth Management from 2008 to 2009, Chief Accounting Officer from 2004 to 2008, Chief Financial Officer of Consumer Bank from 2003 to 2004, Chief Financial Officer of Global Corporate Investment Bank from 1999 to 2002. | | 29 RICs consisting of 163 Portfolios | | None |
| | | | |
Lena G. Goldberg 1949 | | Director (Since 2019) | | Director, Charles Stark Draper Laboratory, Inc. since 2013; Senior Lecturer, Harvard Business School from 2008 to 2021; FMR LLC/Fidelity Investments (financial services) from 1996 to 2008, serving in various senior roles including Executive Vice President - Strategic Corporate Initiatives and Executive Vice President and General Counsel; Partner, Sullivan & Worcester LLP from 1985 to 1996 and Associate thereof from 1979 to 1985. | | 29 RICs consisting of 163 Portfolios | | None |
| | |
| 72 | | 2 0 2 2 BLACK ROCK ANNUAL REPORT TO SHAREHOLDERS |
Director and Officer Information (continued)
| | | | | | | | |
| Independent Directors(a) (continued) |
| | | | |
Name Year of Birth(b) | | Position(s) Held (Length of Service)(c) | | Principal Occupation(s) During Past Five Years | | Number of BlackRock-Advised
Registered Investment Companies (“RICs”) Consisting of
Investment Portfolios
(“Portfolios”) Overseen | | Public Company and Other Investment Company
Directorships Held
During Past Five Years |
| | | | |
Henry R. Keizer 1956 | | Director (Since 2019) | | Director, Park Indemnity Ltd. (captive insurer) since 2010; Director, MUFG Americas Holdings Corporation and MUFG Union Bank, N.A. (financial and bank holding company) from 2014 to 2016; Director, American Institute of Certified Public Accountants from 2009 to 2011; Director, KPMG LLP (audit, tax and advisory services) from 2004 to 2005 and 2010 to 2012; Director, KPMG International in 2012, Deputy Chairman and Chief Operating Officer thereof from 2010 to 2012 and U.S. Vice Chairman of Audit thereof from 2005 to 2010; Global Head of Audit, KPMGI (consortium of KPMG firms) from 2006 to 2010; Director, YMCA of Greater New York from 2006 to 2010. | | 29 RICs consisting of 163 Portfolios | | Hertz Global Holdings (car rental); GrafTech International Ltd. (materials manufacturing); Montpelier Re Holdings, Ltd. (publicly held property and casualty reinsurance) from 2013 to 2015; WABCO (commercial vehicle safety systems) from 2015 to 2020; Sealed Air Corp. (packaging) from 2015 to 2021. |
| | | | |
Cynthia A. Montgomery 1952 | | Director (Since 2007) | | Professor, Harvard Business School since 1989. | | 29 RICs consisting of 163 Portfolios | | Newell Rubbermaid, Inc. (manufacturing) from 1995 to 2016. |
| | | | |
Donald C. Opatrny 1952 | | Director (Since 2019) | | Director, Athena Capital Advisors LLC (investment management firm) from 2013 to 2020; Trustee, Vice Chair, Member of the Executive Committee and Chair of the Investment Committee, Cornell University from 2004 to 2019; President and Trustee, the Center for the Arts, Jackson Hole from 2011 to 2018; Member of the Board and Investment Committee, University School from 2007 to 2018; Trustee, Artstor (a Mellon Foundation affiliate) from 2010 to 2015; Member of the Investment Committee, Mellon Foundation from 2009 to 2015; President, Trustee and Member of the Investment Committee, The Aldrich Contemporary Art Museum from 2007 to 2014; Trustee and Chair of the Investment Committee, Community Foundation of Jackson Hole since 2014; Member of Affordable Housing Supply Board of Jackson, Wyoming since 2017; Member, Investment Funds Committee, State of Wyoming since 2017; Trustee, Phoenix Art Museum since 2018; Trustee, Arizona Community Foundation and Member of Investment Committee since 2020. | | 29 RICs consisting of 163 Portfolios | | None |
| | | | |
Joseph P. Platt 1947 | | Director (Since 2007) | | General Partner, Thorn Partners, LP (private investments) since 1998; Director, WQED Multi-Media (public broadcasting not-for-profit) since 2001; Chair, Basic Health International (non-profit) since 2015. | | 29 RICs consisting of 163 Portfolios | | Greenlight Capital Re, Ltd. (reinsurance company); Consol Energy Inc. |
| | |
DIRECTOR AND OFFICER INFORMATION | | 73 |
Director and Officer Information (continued)
| | | | | | | | |
| Independent Directors(a) (continued) |
| | | | |
Name Year of Birth(b) | | Position(s) Held (Length of Service)(c) | | Principal Occupation(s) During Past Five Years | | Number of BlackRock-Advised
Registered Investment Companies (“RICs”) Consisting of Investment Portfolios (“Portfolios”) Overseen | | Public Company and Other Investment Company
Directorships Held
During Past Five Years |
| | | | |
| Kenneth L. Urish 1951 | | Director (Since 2007) | | Managing Partner, Urish Popeck & Co., LLC (certified public accountants and consultants) since 1976; Past- Chairman of the Professional Ethics Committee of the Pennsylvania Institute of Certified Public Accountants and Committee Member thereof since 2007; Member of External Advisory Board, The Pennsylvania State University Accounting Department since founding in 2001; Principal, UP Strategic Wealth Investment Advisors, LLC since 2013; Trustee, The Holy Family Institute from 2001 to 2010; President and Trustee, Pittsburgh Catholic Publishing Associates from 2003 to 2008; Director, Inter- Tel from 2006 to 2007; Member, Advisory Board, ESG Competent Boards since 2020. | | 29 RICs consisting of 163 Portfolios | | None |
| | | | |
Claire A. Walton 1957 | | Director (Since 2016) | | Chief Operating Officer and Chief Financial Officer of Liberty Square Asset Management, LP from 1998 to 2015; General Partner of Neon Liberty Capital Management, LLC since 2003; Director, Boston Hedge Fund Group from 2009 to 2018; Director, Woodstock Ski Runners since 2013; Director, Massachusetts Council on Economic Education from 2013 to 2015. | | 29 RICs consisting of 163 Portfolios | | None |
|
| Interested Directors(a)(d) |
| | | | |
Name Year of Birth(b) | | Position(s) Held (Length of Service)(c) | | Principal Occupation(s) During Past Five Years | | Number of BlackRock-Advised
Registered Investment Companies
(“RICs”) Consisting of Investment Portfolios
(“Portfolios”) Overseen | | Public Company and Other Investment Company
Directorships Held
During Past Five Years |
| | | | |
Robert Fairbairn 1965 | | Director (Since 2018) | | Vice Chairman of BlackRock, Inc. since 2019; Member of BlackRock’s Global Executive and Global Operating Committees; Co-Chair of BlackRock’s Human Capital Committee; Senior Managing Director of BlackRock, Inc. from 2010 to 2019; oversaw BlackRock’s Strategic Partner Program and Strategic Product Management Group from 2012 to 2019; Member of the Board of Managers of BlackRock Investments, LLC from 2011 to 2018; Global Head of BlackRock’s Retail and iShares® businesses from 2012 to 2016. | | 98 RICs consisting of 262 Portfolios | | None |
| | | | |
John M. Perlowski(e) 1964 | | Director (Since 2015) President and Chief Executive Officer (Since 2010) | | Managing Director of BlackRock, Inc. since 2009; Head of BlackRock Global Accounting and Product Services since 2009; Advisory Director of Family Resource Network (charitable foundation) since 2009. | | 100 RICs consisting of 264 Portfolios | | None |
| (a) | The address of each Director is c/o BlackRock, Inc., 55 East 52nd Street, New York, New York 10055. |
| (b) | Independent Directors serve until their resignation, retirement, removal or death, or until December 31 of the year in which they turn 75. The Board may determine to extend the terms of Independent Trustees on a case-by-case basis, as appropriate. |
| (c) | Following the combination of Merrill Lynch Investment Managers, L.P. (“MLIM”) and BlackRock, Inc. in September 2006, the various legacy MLIM and legacy BlackRock fund boards were realigned and consolidated into three new fund boards in 2007. Furthermore, effective January 1, 2019, three BlackRock Fund Complexes were realigned and consolidated into two BlackRock Fund Complexes. As a result, although the chart shows the year that each Independent Director joined the Board, certain Independent Directors first became members of the boards of other BlackRock-advised Funds, legacy MLIM funds or legacy BlackRock funds as follows: Cynthia A. Montgomery, 1994; Joseph P. Platt, 1999; Kenneth L. Urish, 1999; Lena G. Goldberg, 2016; Henry R. Keizer, 2016; Donald C. Opatrny, 2015. |
| (d) | Mr. Fairbairn and Mr. Perlowski are both “interested persons,” as defined in the 1940 Act, of the Fund based on their positions with BlackRock, Inc. and its affiliates. Mr. Fairbairn and Mr. Perlowski are also board members of the BlackRock Fixed-Income Complex. |
| | |
| 74 | | 2 0 2 2 BLACK ROCK ANNUAL REPORT TO SHAREHOLDERS |
Director and Officer Information (continued)
| (e) | Mr. Perlowski is also a trustee of the BlackRock Credit Strategies Fund and BlackRock Private Investments Fund. |
| | | | |
| Officers Who Are Not Directors(a) |
| | |
| Name | | Position(s) Held | | |
| Year of Birth(b) | | (Length of Service) | | Principal Occupation(s) During Past Five Years |
| | |
Jennifer McGovern 1977 | | Vice President (Since 2014) | | Managing Director of BlackRock, Inc. since 2016; Director of BlackRock, Inc. from 2011 to 2015; Head of Americas Product Development and Governance for BlackRock’s Global Product Group since 2019; Head of Product Structure and Oversight for BlackRock’s U.S. Wealth Advisory Group from 2013 to 2019. |
| | |
Trent Walker 1974 | | Chief Financial Officer (Since 2021) | | Managing Director of BlackRock, Inc. since September 2019; Executive Vice President of PIMCO from 2016 to 2019; Senior Vice President of PIMCO from 2008 to 2015; Treasurer from 2013 to 2019 and Assistant Treasurer from 2007 to 2017 of PIMCO Funds, PIMCO Variable Insurance Trust, PIMCO ETF Trust, PIMCO Equity Series, PIMCO Equity Series VIT, PIMCO Managed Accounts Trust, 2 PIMCO-sponsored interval funds and 21 PIMCO-sponsored closed-end funds. |
| | |
Jay M. Fife 1970 | | Treasurer (Since 2007) | | Managing Director of BlackRock, Inc. since 2007. |
| | |
Charles Park 1967 | | Chief Compliance Officer (Since 2014) | | Anti-Money Laundering Compliance Officer for certain BlackRock-advised Funds from 2014 to 2015; Chief Compliance Officer of BlackRock Advisors, LLC and the BlackRock-advised Funds in the BlackRock Multi-Asset Complex and the BlackRock Fixed-Income Complex since 2014; Principal of and Chief Compliance Officer for iShares® Delaware Trust Sponsor LLC since 2012 and BlackRock Fund Advisors (“BFA”) since 2006; Chief Compliance Officer for the BFA-advised iShares® exchange traded funds since 2006; Chief Compliance Officer for BlackRock Asset Management International Inc. since 2012. |
| | |
Lisa Belle 1968 | | Anti-Money Laundering Compliance Officer (Since 2019) | | Managing Director of BlackRock, Inc. since 2019; Global Financial Crime Head for Asset and Wealth Management of JP Morgan from 2013 to 2019; Managing Director of RBS Securities from 2012 to 2013; Head of Financial Crimes for Barclays Wealth Americas from 2010 to 2012. |
| | |
Janey Ahn 1975 | | Secretary (Since 2019) | | Managing Director of BlackRock, Inc. since 2018; Director of BlackRock, Inc. from 2009 to 2017. |
| (a) | The address of each Officer is c/o BlackRock, Inc., 55 East 52nd Street, New York, New York 10055. |
| (b) | Officers of the Fund serve at the pleasure of the Board. |
Further information about the Fund’s Directors and Officers is available in the Fund’s Statement of Additional Information, which can be obtained without charge by calling (800) 441-7762.
|
| |
Effective December 31, 2021, Bruce R. Bond retired as a Director of the Funds. |
| | |
DIRECTOR AND OFFICER INFORMATION | | 75 |
Additional Information
Proxy Results
At a Joint Special Meeting of Shareholders of BlackRock Unconstrained Equity Fund, formerly known as BlackRock Long-Horizon Equity Fund, held on October 26, 2021 and adjourned to November 19, 2021 and further adjourned to December 23, 2021, Fund shareholders were asked to vote on the following proposals:
Proposal 1. To approve the amendment or elimination, as applicable, of certain of the fundamental investment restrictions of the Fund.
Proposal 1a. To Approve the Amendment of the Fundamental Investment Restriction Regarding Concentration.
With respect to this Proposal, the shares of the Fund were voted as follows:
| | | | | | | | | | | | | | |
| | | Fund Name | | For | | | Against | | | Abstain | |
| | BlackRock Unconstrained Equity Fund | | | 8,539,162 | | | | 929,804 | | | | 2,162,716 | |
Proposal 1c. To Approve the Amendment of the Fundamental Investment Restriction Regarding Borrowing.
With respect to this Proposal, the shares of the Fund were voted as follows:
| | | | | | | | | | | | | | |
| | | Fund Name | | For | | | Against | | | Abstain | |
| | BlackRock Unconstrained Equity Fund | | | 8,456,061 | | | | 1,004,155 | | | | 2,171,466 | |
Proposal 1d. To Approve the Amendment of the Fundamental Investment Restriction Regarding the Issuance of Senior Securities.
With respect to this Proposal, the shares of the Fund were voted as follows:
| | | | | | | | | | | | | | |
| | | Fund Name | | For | | | Against | | | Abstain | |
| | BlackRock Unconstrained Equity Fund | | | 8,526,571 | | | | 941,237 | | | | 2,163,874 | |
Proposal 1e. To Approve the Amendment of the Fundamental Investment Restriction Regarding Investing in Real Estate.
With respect to this Proposal, the shares of the Fund were voted as follows:
| | | | | | | | | | | | | | |
| | | Fund Name | | For | | | Against | | | Abstain | |
| | BlackRock Unconstrained Equity Fund | | | 8,611,525 | | | | 870,201 | | | | 2,149,956 | |
Proposal 1f. To Approve the Amendment of the Fundamental Investment Restriction Regarding Underwriting.
With respect to this Proposal, the shares of the Fund were voted as follows:
| | | | | | | | | | | | | | |
| | | Fund Name | | For | | | Against | | | Abstain | |
| | BlackRock Unconstrained Equity Fund | | | 8,700,122 | | | | 753,289 | | | | 2,178,271 | |
Proposal 1g. To Approve the Amendment of the Fundamental Investment Restriction Regarding Investing in Commodities.
With respect to this Proposal, the shares of the Fund were voted as follows:
| | | | | | | | | | | | | | |
| | | Fund Name | | For | | | Abstain | | | Abstain | |
| | BlackRock Unconstrained Equity Fund | | | 8,592,833 | | | | 903,109 | | | | 2,135,740 | |
Proposal 1h. To Approve the Amendment of the Fundamental Investment Restriction Regarding Lending.
With respect to this Proposal, the shares of the Fund were voted as follows:
| | | | | | | | | | | | | | |
| | | Fund Name | | For | | | Against | | | Abstain | |
| | BlackRock Unconstrained Equity Fund | | | 8,491,467 | | | | 975,625 | | | | 2,164,590 | |
| | |
| 76 | | 2 0 2 2 BLACK ROCK ANNUAL REPORT TO SHAREHOLDERS |
Additional Information (continued)
Proposal 1j. To Approve the Elimination of the Fundamental Investment Restriction Regarding Investing for the Purpose of Exercising Control or Management.
With respect to this Proposal, the shares of the Fund were voted as follows:
| | | | | | | | | | | | | | |
| | | Fund Name | | For | | | Against | | | Abstain | |
| | BlackRock Unconstrained Equity Fund | | | 8,374,256 | | | | 1,017,362 | | | | 2,240,064 | |
Proposal 6. To Approve a change in BlackRock Unconstrained Equity Fund, formerly known as BlackRock Long-Horizon Equity Fund’s status from diversified to non-diversified as such terms are defined under the Investment Company Act of 1940, as amended.
With respect to this Proposal, the shares of the Fund were voted as follows:
| | | | | | | | | | | | | | |
| | | Fund Name | | For | | | Against | | | Abstain | |
| | BlackRock Unconstrained Equity Fund | | | 8,417,878 | | | | 1,033,814 | | | | 2,179,989 | |
Regulation Regarding Derivatives
On October 28, 2020, the Securities and Exchange Commission (the “SEC”) adopted regulations governing the use of derivatives by registered investment companies (“Rule 18f-4”). The Funds will be required to implement and comply with Rule 18f-4 by August 19, 2022. Once implemented, Rule 18f-4 will impose limits on the amount of derivatives a fund can enter into, eliminate the asset segregation framework currently used by funds to comply with Section 18 of the 1940 Act, treat derivatives as senior securities and require funds whose use of derivatives is more than a limited specified exposure amount to establish and maintain a comprehensive derivatives risk management program and appoint a derivatives risk manager.
General Information
Quarterly performance, semi-annual and annual reports, current net asset value and other information regarding the Funds may be found on BlackRock’s website, which can be accessed at blackrock.com. Any reference to BlackRock’s website in this report is intended to allow investors public access to information regarding the Funds and does not, and is not intended to, incorporate BlackRock’s website in this report.
Householding
The Funds will mail only one copy of shareholder documents, including prospectuses, annual and semi-annual reports, Rule 30e-3 notices and proxy statements, to shareholders with multiple accounts at the same address. This practice is commonly called “householding” and is intended to reduce expenses and eliminate duplicate mailings of shareholder documents. Mailings of your shareholder documents may be householded indefinitely unless you instruct us otherwise. If you do not want the mailing of these documents to be combined with those for other members of your household, please call the Funds at (800) 441-7762.
Availability of Quarterly Schedule of Investments
The Funds file their complete schedules of portfolio holdings with the SEC for the first and third quarters of each fiscal year as an exhibit to their reports on Form N-PORT. The Funds’ Forms N-PORT are available on the SEC’s website at sec.gov. Additionally, each Fund makes its portfolio holdings for the first and third quarters of each fiscal year available at blackrock.com/fundreports.
Availability of Proxy Voting Policies, Procedures and Voting Records
A description of the policies and procedures that the Funds use to determine how to vote proxies relating to portfolio securities and information about how the Funds voted proxies relating to securities held in the Funds’ portfolios during the most recent 12-month period ended June 30 is available without charge, upon request (1) by calling (800) 441-7762; (2) on the BlackRock website at blackrock.com; and (3) on the SEC’s website at sec.gov.
BlackRock’s Mutual Fund Family
BlackRock offers a diverse lineup of open-end mutual funds crossing all investment styles and managed by experts in equity, fixed-income and tax-exempt investing. Visit blackrock.com for more information.
Shareholder Privileges
Account Information
Call us at (800) 441-7762 from 8:00 AM to 6:00 PM ET on any business day to get information about your account balances, recent transactions and share prices. You can also visit blackrock.com for more information.
| | |
ADDITIONAL INFORMATION | | 77 |
Additional Information (continued)
Automatic Investment Plans
Investor class shareholders who want to invest regularly can arrange to have $50 or more automatically deducted from their checking or savings account and invested in any of the BlackRock funds.
Systematic Withdrawal Plans
Investor class shareholders can establish a systematic withdrawal plan and receive periodic payments of $50 or more from their BlackRock funds, as long as their account balance is at least $10,000.
Retirement Plans
Shareholders may make investments in conjunction with Traditional, Rollover, Roth, Coverdell, Simple IRAs, SEP IRAs and 403(b) Plans.
BlackRock Privacy Principles
BlackRock is committed to maintaining the privacy of its current and former fund investors and individual clients (collectively, “Clients”) and to safeguarding their non-public personal information. The following information is provided to help you understand what personal information BlackRock collects, how we protect that information and why in certain cases we share such information with select parties.
If you are located in a jurisdiction where specific laws, rules or regulations require BlackRock to provide you with additional or different privacy-related rights beyond what is set forth below, then BlackRock will comply with those specific laws, rules or regulations.
BlackRock obtains or verifies personal non-public information from and about you from different sources, including the following: (i) information we receive from you or, if applicable, your financial intermediary, on applications, forms or other documents; (ii) information about your transactions with us, our affiliates, or others; (iii) information we receive from a consumer reporting agency; and (iv) from visits to our websites.
BlackRock does not sell or disclose to non-affiliated third parties any non-public personal information about its Clients, except as permitted by law or as is necessary to respond to regulatory requests or to service Client accounts. These non-affiliated third parties are required to protect the confidentiality and security of this information and to use it only for its intended purpose.
We may share information with our affiliates to service your account or to provide you with information about other BlackRock products or services that may be of interest to you. In addition, BlackRock restricts access to non-public personal information about its Clients to those BlackRock employees with a legitimate business need for the information. BlackRock maintains physical, electronic and procedural safeguards that are designed to protect the non-public personal information of its Clients, including procedures relating to the proper storage and disposal of such information.
Fund and Service Providers
| | |
| Investment Adviser | | Transfer Agent |
| BlackRock Advisors, LLC | | BNY Mellon Investment Servicing (US) Inc. |
| Wilmington, DE 19809 | | Wilmington, DE 19809 |
| |
| Sub-Adviser | | Distributor |
| BlackRock Asset Management North Asia Limited(a) | | BlackRock Investments, LLC |
| Hong Kong | | New York, NY 10022 |
| |
| BlackRock International Limited(b) | | Independent Registered Public Accounting Firm |
| Edinburgh, EH3 8BL | | Deloitte & Touche LLP |
| United Kingdom | | Boston, MA 02116 |
| |
| Accounting Agent | | Legal Counsel |
| State Street Bank and Trust Company | | Sidley Austin LLP |
| Boston, MA 02111 | | New York, NY 10019 |
| |
| Custodian | | Address of the Funds |
| Brown Brothers Harriman & Co. | | 100 Bellevue Parkway |
| Boston, MA 02109 | | Wilmington, DE 19809 |
|
(a) For Emerging Markets and Sustainable Emerging Markets Equity. (b) For Emerging Markets, Unconstrained Equity and Sustainable Emerging Markets Equity. |
| | |
| 78 | | 2 0 2 2 BLACK ROCK ANNUAL REPORT TO SHAREHOLDERS |
Glossary of Terms Used in this Report
| | |
| Currency Abbreviation |
| |
| BRL | | Brazilian Real |
| |
| EUR | | Euro |
| |
| USD | | United States Dollar |
|
| Portfolio Abbreviation |
| |
| ADR | | American Depositary Receipt |
| |
| GDR | | Global Depositary Receipt |
| |
| JSC | | Joint Stock Company |
| |
| MSCI | | Morgan Stanley Capital International |
| |
| NVDR | | Non-Voting Depositary Receipt |
| |
| PCL | | Public Company Limited |
| |
| PJSC | | Public Joint Stock Company |
| |
| S&P | | Standard & Poor’s |
| | |
GLOSSARY OF TERMS USED IN THIS REPORT | | 79 |
Want to know more?
blackrock.com | 800-441-7762
This report is intended for current holders. It is not authorized for use as an offer of sale or a solicitation of an offer to buy shares of the Funds unless preceded or accompanied by the Funds’ current prospectus. Past performance results shown in this report should not be considered a representation of future performance. Investment returns and principal value of shares will fluctuate so that shares, when redeemed, may be worth more or less than their original cost. Statements and other information herein are as dated and are subject to change.
GLEQ4-04/22-AR
(b) Not Applicable
| Item 2 – | Code of Ethics – The registrant (or the “Fund”) has adopted a code of ethics, as of the end of the period covered by this report, applicable to the registrant’s principal executive officer, principal financial officer, principal accounting officer or controller, or persons performing similar functions. During the period covered by this report, the code of ethics was amended to update certain information and to make other non-material changes. During the period covered by this report, there have been no waivers granted under the code of ethics. The registrant undertakes to provide a copy of the code of ethics to any person upon request, without charge, who calls 1-800-441-7762. |
| Item 3 – | Audit Committee Financial Expert – The registrant’s board of directors (the “board of directors”), has determined that (i) the registrant has the following audit committee financial experts serving on its audit committee and (ii) each audit committee financial expert is independent: |
Neil A. Cotty
Henry R. Keizer
Kenneth L. Urish
Under applicable securities laws, a person determined to be an audit committee financial expert will not be deemed an “expert” for any purpose, including without limitation for the purposes of Section 11 of the Securities Act of 1933, as a result of being designated or identified as an audit committee financial expert. The designation or identification of a person as an audit committee financial expert does not impose on such person any duties, obligations, or liabilities greater than the duties, obligations, and liabilities imposed on such person as a member of the audit committee and board of directors in the absence of such designation or identification. The designation or identification of a person as an audit committee financial expert does not affect the duties, obligations, or liability of any other member of the audit committee or board of directors.
| Item 4 – | Principal Accountant Fees and Services |
The following table presents fees billed by Deloitte & Touche LLP (“D&T”) in each of the last two fiscal years for the services rendered to the Fund:
| | | | | | | | | | | | | | | | |
| | | (a) Audit Fees | | (b) Audit-Related Fees1 | | (c) Tax Fees2 | | (d) All Other Fees |
| Entity Name | | Current
Fiscal Year
End | | Previous
Fiscal Year
End3 | | Current
Fiscal Year
End | | Previous
Fiscal Year
End3 | | Current
Fiscal Year
End | | Previous
Fiscal Year
End3 | | Current
Fiscal Year
End | | Previous
Fiscal Year
End |
BlackRock Unconstrained Equity Fund (Formerly BlackRock Long-Horizon Equity Fund) | | $30,906 | | $30,603 | | $0 | | $0 | | $18,100 | | $14,600 | | $420 | | $0 |
The following table presents fees billed by D&T that were required to be approved by the registrant’s audit committee (the “Committee”) for services that relate directly to the operations or financial reporting of the Fund and that are rendered on behalf of BlackRock Advisors, LLC (the “Investment Adviser” or “BlackRock”) and entities controlling, controlled by, or under common control with BlackRock (not including any sub-adviser whose role is primarily portfolio management and is subcontracted with or overseen by another investment adviser) that provide ongoing services to the Fund (“Affiliated Service Providers”):
2
| | | | |
| | | Current Fiscal Year End | | Previous Fiscal Year End |
(b) Audit-Related Fees1 | | $0 | | $0 |
(c) Tax Fees2 | | $0 | | $0 |
(d) All Other Fees3 | | $2,098,000 | | $2,032,000 |
| 1 | The nature of the services includes assurance and related services reasonably related to the performance of the audit or review of financial statements not included in Audit Fees, including accounting consultations, agreed-upon procedure reports, attestation reports, comfort letters, out-of-pocket expenses and internal control reviews not required by regulators. |
| 2 | The nature of the services includes tax compliance and/or tax preparation, including services relating to the filing or amendment of federal, state or local income tax returns, regulated investment company qualification reviews, taxable income and tax distribution calculations. |
| 3 | Non-audit fees of $2,098,000 and $2,032,000 for the current fiscal year and previous fiscal year, respectively, were paid to the Fund’s principal accountant in their entirety by BlackRock, in connection with services provided to the Affiliated Service Providers of the Fund and of certain other funds sponsored and advised by BlackRock or its affiliates for a service organization review and an accounting research tool subscription. These amounts represent aggregate fees paid by BlackRock and were not allocated on a per fund basis. |
(e)(1) Audit Committee Pre-Approval Policies and Procedures:
The Committee has adopted policies and procedures with regard to the pre-approval of services. Audit, audit-related and tax compliance services provided to the registrant on an annual basis require specific pre-approval by the Committee. The Committee also must approve other non-audit services provided to the registrant and those non-audit services provided to the Investment Adviser and Affiliated Service Providers that relate directly to the operations and the financial reporting of the registrant. Certain of these non-audit services that the Committee believes are (a) consistent with the SEC’s auditor independence rules and (b) routine and recurring services that will not impair the independence of the independent accountants may be approved by the Committee without consideration on a specific case-by-case basis (“general pre-approval”). The term of any general pre-approval is 12 months from the date of the pre-approval, unless the Committee provides for a different period. Tax or other non-audit services provided to the registrant which have a direct impact on the operations or financial reporting of the registrant will only be deemed pre-approved provided that any individual project does not exceed $10,000 attributable to the registrant or $50,000 per project. For this purpose, multiple projects will be aggregated to determine if they exceed the previously mentioned cost levels.
Any proposed services exceeding the pre-approved cost levels will require specific pre-approval by the Committee, as will any other services not subject to general pre-approval (e.g., unanticipated but permissible services). The Committee is informed of each service approved subject to general pre-approval at the next regularly scheduled in-person board meeting. At this meeting, an analysis of such services is presented to the Committee for ratification. The Committee may delegate to the Committee Chairman the authority to approve the provision of and fees for any specific engagement of permitted non-audit services, including services exceeding pre-approved cost levels.
(e)(2) None of the services described in each of Items 4(b) through (d) were approved by the Committee pursuant to the de minimis exception in paragraph (c)(7)(i)(C) of Rule 2-01 of Regulation S-X.
3
(f) Not Applicable
(g) The aggregate non-audit fees, defined as the sum of the fees shown under “Audit-Related Fees,” “Tax Fees” and “All Other Fees,” paid to the accountant for services rendered by the accountant to the registrant, the Investment Adviser and the Affiliated Service Providers were:
| | | | |
| Entity Name | | Current Fiscal Year End | | Previous Fiscal Year End |
BlackRock Unconstrained Equity Fund (Formerly BlackRock Long-Horizon Equity Fund) | | $18,520 | | $14,600 |
Additionally, the amounts billed by D&T in connection with services provided to the Affiliated Service Providers of the Fund and of other funds sponsored and advised by BlackRock or its affiliates during the current and previous fiscal years for a service organization review and an accounting research tool subscription were:
| | |
| Current Fiscal Year End | | Previous Fiscal Year End |
| $2,098,000 | | $2,032,000 |
These amounts represent aggregate fees paid by BlackRock and were not allocated on a per fund basis.
(h) The Committee has considered and determined that the provision of non-audit services that were rendered to the Investment Adviser and the Affiliated Service Providers that were not pre-approved pursuant to paragraph (c)(7)(ii) of Rule 2-01 of Regulation S-X is compatible with maintaining the principal accountant’s independence.
(i) – Not Applicable
(j) – Not Applicable
| Item 5 – | Audit Committee of Listed Registrant – Not Applicable |
(a) The registrant’s Schedule of Investments is included as part of the Report to Stockholders filed under Item 1(a) of this Form.
(b) Not Applicable due to no such divestments during the semi-annual period covered since the previous Form N-CSR filing.
4
| Item 7 – | Disclosure of Proxy Voting Policies and Procedures for Closed-End Management Investment Companies – Not Applicable |
| Item 8 – | Portfolio Managers of Closed-End Management Investment Companies – Not Applicable |
| Item 9 – | Purchases of Equity Securities by Closed-End Management Investment Company and Affiliated Purchasers – Not Applicable |
| Item 10 – | Submission of Matters to a Vote of Security Holders – There have been no material changes to these procedures. |
| Item 11 – | Controls and Procedures |
(a) The registrant’s principal executive and principal financial officers, or persons performing similar functions, have concluded that the registrant’s disclosure controls and procedures (as defined in Rule 30a-3(c) under the Investment Company Act of 1940, as amended (the “1940 Act”)) are effective as of a date within 90 days of the filing of this report based on the evaluation of these controls and procedures required by Rule 30a-3(b) under the 1940 Act and Rule 15d-15(b) under the Securities Exchange Act of 1934, as amended.
(b) There were no changes in the registrant’s internal control over financial reporting (as defined in Rule 30a-3(d) under the 1940 Act) that occurred during the period covered by this report that have materially affected, or are reasonably likely to materially affect, the registrant’s internal control over financial reporting.
| Item 12 – | Disclosure of Securities Lending Activities for Closed-End Management Investment Companies – Not Applicable |
| Item 13 – | Exhibits attached hereto |
(a)(1) Code of Ethics – See Item 2
(a)(2) Section 302 Certifications are attached
(a)(3) Any written solicitation to purchase securities under Rule 23c-1 – Not Applicable
(a)(4) Change in Registrant’s independent public accountant – Not Applicable
(b) Section 906 Certifications are attached
5
Pursuant to the requirements of the Securities Exchange Act of 1934 and the Investment Company Act of 1940, the registrant has duly caused this report to be signed on its behalf by the undersigned, thereunto duly authorized.
BlackRock Unconstrained Equity Fund (Formerly BlackRock Long-Horizon Equity Fund)
| | | | |
| | By: | | /s/ John M. Perlowski |
| | | | John M. Perlowski |
| | | | Chief Executive Officer (principal executive officer) of |
| | | | BlackRock Unconstrained Equity Fund (Formerly BlackRock Long-Horizon Equity Fund) |
Date: June 28, 2022
Pursuant to the requirements of the Securities Exchange Act of 1934 and the Investment Company Act of 1940, this report has been signed below by the following persons on behalf of the registrant and in the capacities and on the dates indicated.
| | | | |
| | By: | | /s/ John M. Perlowski |
| | | | John M. Perlowski |
| | | | Chief Executive Officer (principal executive officer) of |
| | | | BlackRock Unconstrained Equity Fund (Formerly BlackRock Long-Horizon Equity Fund) |
Date: June 28, 2022
| | | | |
| | By: | | /s/ Trent Walker |
| | | | Trent Walker |
| | | | Chief Financial Officer (principal financial officer) of |
| | | | BlackRock Unconstrained Equity Fund (Formerly BlackRock Long-Horizon Equity Fund) |
Date: June 28, 2022
6