[LOGO]
[GRAPHIC]
CF Industries Holdings, Inc.
NYSE: CF
Safe Harbor Statement
Certain statements contained in this presentation may constitute “forward-looking statements” within the meaning of federal securities laws. All statements in this release, other than those relating to our historical information or current condition, are forward-looking statements. These forward-looking statements are subject to a number of risks and uncertainties, many of which are beyond our control, which could cause our actual results to differ materially from such statements. These risks and uncertainties include the relatively expensive and volatile cost of North American natural gas; the cyclical nature of our business; the nature of our products as global commodities; intense global competition in the consolidating markets in which we operate; conditions in the U.S. agricultural industry; weather conditions; our inability to accurately predict seasonal demand for our products; the concentration of our sales to pre-IPO owners and other large customers; the impact of changing market conditions on our forward pricing program; the significant risks and hazards involved in fertilizer manufacturing; unanticipated consequences related to future expansion of our business; our inability to expand our business, including consequences due to the significant resources that could be required; potential liabilities and expenditures related to environmental and health and safety laws and regulations; our inability to obtain or maintain required permits and governmental approvals; acts of terrorism; difficulties in securing the raw materials we use; changes in global fertilizer supply and demand and the other risks and uncertainties included from time to time in our filings with the Securities and Exchange Commission. We undertake no obligation to update or revise any forward-looking statements.
[LOGO]
2
CF Industries Holdings, Inc. Completed IPO on August 16, 2005
• 47,437,500 shares at $16 per share, including full over-allotment
• 7,562,500 additional shares issued to two of eight former owners, with 360-day lock-up, bringing total shares outstanding to 55,000,000
• Raised $715.4 million, with all proceeds going to pre-IPO owners
• Shares began trading on NYSE under symbol CF on August 11, 2005
3
The ‘Investable Idea’ for CF Industries . . .
• A business model transformation that effectively positioned the organization as a publicly traded company
• Important competitive strengths and flexibility to optimize performance and create value for shareholders in a volatile, challenging industry
4
The Fertilizer Market
• Three major nutrients: N, P, and K
• These plant nutrients are absolutely necessary for improved yield, growth, and durability
• There are no substitutes for these nutrients, and they are not substitutable for each other
• Growth has been consistent at approximately 2.7 percent annually
5
• Fertilizer is a global worldwide commodity
• Commodity prices may or may not fully reflect the cost of raw materials, such as natural gas…
• The cost of natural gas is critical, but more critical is the relationship between natural gas and nitrogen fertilizer prices…
• U.S. is net importer of nitrogen fertilizer but net exporter of phosphate fertilizer
6
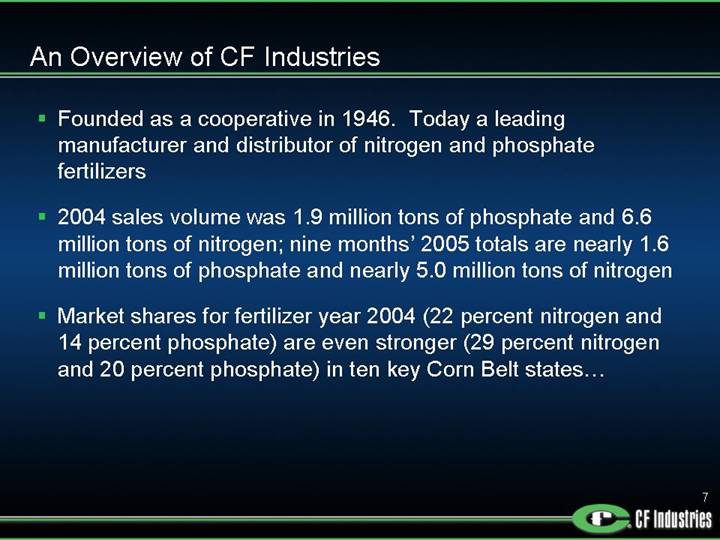
An Overview of CF Industries
• Founded as a cooperative in 1946. Today a leading manufacturer and distributor of nitrogen and phosphate fertilizers
• 2004 sales volume was 1.9 million tons of phosphate and 6.6 million tons of nitrogen; nine months’ 2005 totals are nearly 1.6 million tons of phosphate and nearly 5.0 million tons of nitrogen
• Market shares for fertilizer year 2004 (22 percent nitrogen and 14 percent phosphate) are even stronger (29 percent nitrogen and 20 percent phosphate) in ten key Corn Belt states…
7
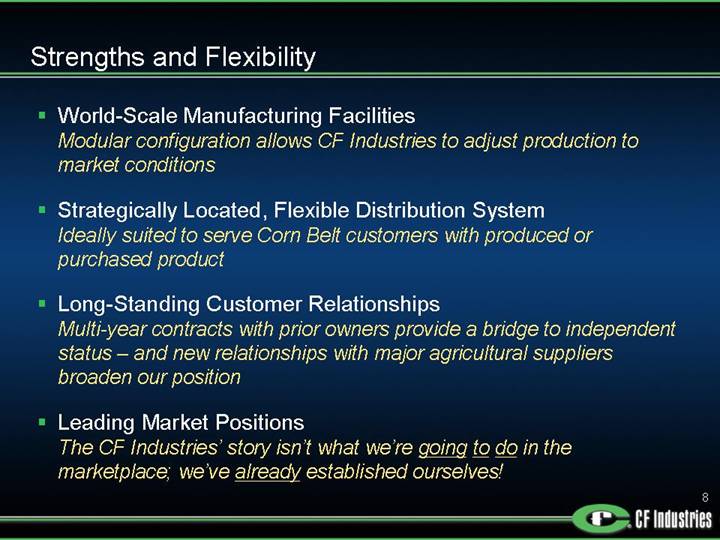
Strengths and Flexibility
• World-Scale Manufacturing Facilities
Modular configuration allows CF Industries to adjust production to market conditions
• Strategically Located, Flexible Distribution System
Ideally suited to serve Corn Belt customers with produced or purchased product
• Long-Standing Customer Relationships
Multi-year contracts with prior owners provide a bridge to independent status – and new relationships with major agricultural suppliers broaden our position
• Leading Market Positions
The CF Industries’ story isn’t what we’re going to do in the marketplace; we’ve already established ourselves!
8
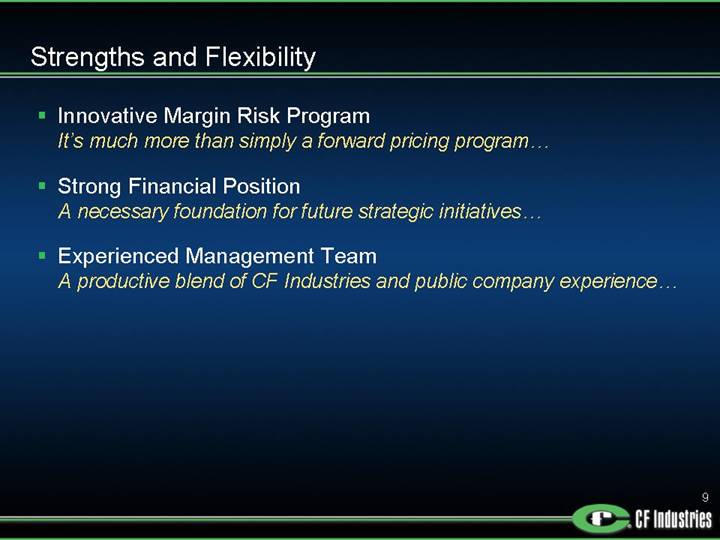
• Innovative Margin Risk Program
It’s much more than simply a forward pricing program…
• Strong Financial Position
A necessary foundation for future strategic initiatives…
• Experienced Management Team
A productive blend of CF Industries and public company experience…
9
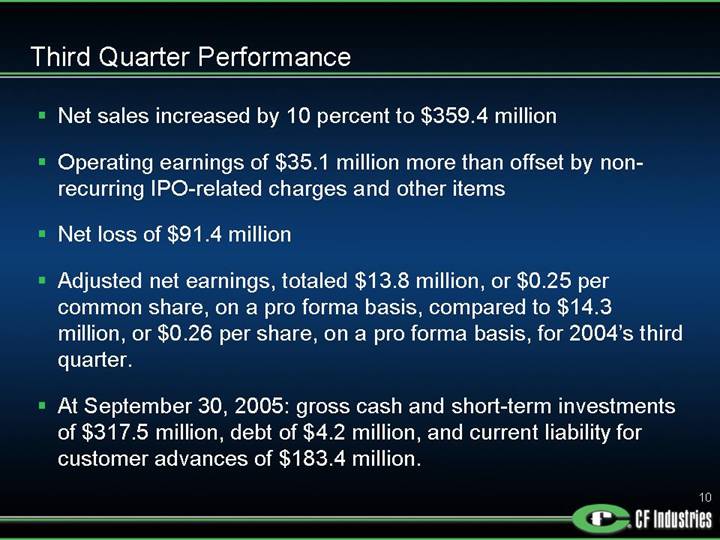
Third Quarter Performance
• Net sales increased by 10 percent to $359.4 million
• Operating earnings of $35.1 million more than offset by non-recurring IPO-related charges and other items
• Net loss of $91.4 million
• Adjusted net earnings, totaled $13.8 million, or $0.25 per common share, on a pro forma basis, compared to $14.3 million, or $0.26 per share, on a pro forma basis, for 2004’s third quarter.
• At September 30, 2005: gross cash and short-term investments of $317.5 million, debt of $4.2 million, and current liability for customer advances of $183.4 million
10
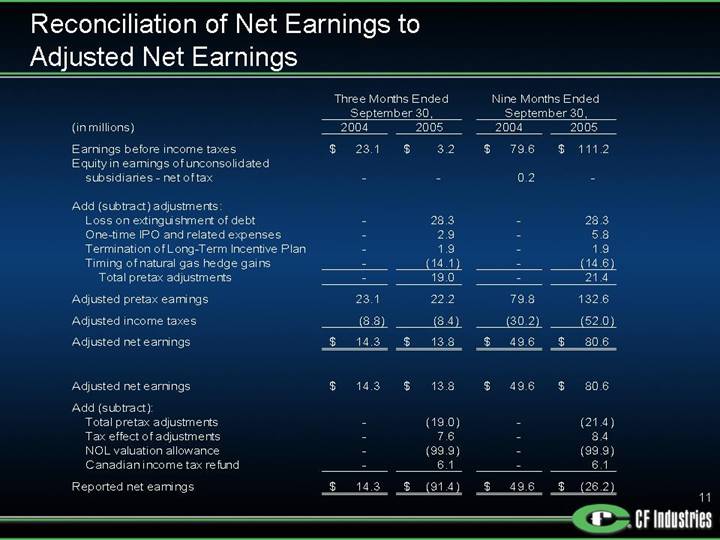
Reconciliation of Net Earnings to Adjusted Net Earnings
| | Three Months Ended
September 30, | | Nine Months Ended
September 30, | |
(in millions) | | 2004 | | 2005 | | 2004 | | 2005 | |
| | | | | | | | | |
Earnings before income taxes | | $ | 23.1 | | $ | 3.2 | | $ | 79.6 | | $ | 111.2 | |
Equity in earnings of unconsolidated subsidiaries - net of tax | | — | | — | | 0.2 | | — | |
| | | | | | | | | |
Add (subtract) adjustments: | | | | | | | | | |
Loss on extinguishment of debt | | — | | 28.3 | | — | | 28.3 | |
One-time IPO and related expenses | | — | | 2.9 | | — | | 5.8 | |
Termination of Long-Term Incentive Plan | | — | | 1.9 | | — | | 1.9 | |
Timing of natural gas hedge gains | | — | | (14.1 | ) | — | | (14.6 | ) |
Total pretax adjustments | | — | | 19.0 | | — | | 21.4 | |
| | | | | | | | | |
Adjusted pretax earnings | | 23.1 | | 22.2 | | 79.8 | | 132.6 | |
| | | | | | | | | |
Adjusted income taxes | | (8.8 | ) | (8.4 | ) | (30.2 | ) | (52.0 | ) |
| | | | | | | | | |
Adjusted net earnings | | $ | 14.3 | | $ | 13.8 | | $ | 49.6 | | $ | 80.6 | |
| | | | | | | | | |
Adjusted net earnings | | $ | 14.3 | | $ | 13.8 | | $ | 49.6 | | $ | 80.6 | |
| | | | | | | | | |
Add (subtract): | | | | | | | | | |
Total pretax adjustments | | — | | (19.0 | ) | — | | (21.4 | ) |
Tax effect of adjustments | | — | | 7.6 | | — | | 8.4 | |
NOL valuation allowance | | — | | (99.9 | ) | — | | (99.9 | ) |
Canadian income tax refund | | — | | 6.1 | | — | | 6.1 | |
| | | | | | | | | |
Reported net earnings | | $ | 14.3 | | $ | (91.4 | ) | $ | 49.6 | | $ | (26.2 | ) |
11
Reconciliation of Net Earnings to EBITDA and Adjusted EBITDA
| | Three Months Ended
September 30, | | Nine Months Ended
September 30, | |
(in millions) | | 2004 | | 2005 | | 2004 | | 2005 | |
| | | | | | | | | |
Net earnings (loss) | | $ | 14.3 | | $ | (91.4 | ) | $ | 49.6 | | $ | (26.2 | ) |
Interest - net | | 4.0 | | (0.9 | ) | 13.8 | | 1.9 | |
Income tax provision | | 8.8 | | 94.6 | | 30.2 | | 137.4 | |
Depreciation, depletion and amortization | | 27.5 | | 23.2 | | 81.1 | | 76.4 | |
Less: Loan fee amortization (a) | | (0.3 | ) | (0.1 | ) | (0.8 | ) | (0.7 | ) |
| | | | | | | | | |
EBITDA | | $ | 54.3 | | $ | 25.4 | | $ | 173.9 | | $ | 188.8 | |
| | | | | | | | | |
Add (subtract) adjustments: | | | | | | | | | |
Loss on extinguishment of debt | | — | | 28.3 | | — | | 28.3 | |
IPO and related expenses | | — | | 2.9 | | — | | 5.8 | |
Termination of Long-Term Incentive Plan | | — | | 1.9 | | — | | 1.9 | |
Timing of natural gas hedge gains | | — | | (14.1 | ) | — | | (14.6 | ) |
| | | | | | | | | |
Total adjustments | | — | | 19.0 | | — | | 21.4 | |
| | | | | | | | | |
Adjusted EBITDA | | $ | 54.3 | | $ | 44.4 | | $ | 173.9 | | $ | 210.2 | |
(a) To adjust for amount included in both interest and amortization.
12
Fourth Quarter and 2006 Prospects
• Natural gas prices off their peak but still troubling: for fertilizer producers and (with resulting fertilizer prices) for farmers
• Spring domestic demand the near-term uncertainty (due to prices)
• U.S. grain stocks and grain prices another near-term issue, but ethanol growth and low world grain stocks are long-term positives
(At today’s prices, fertilizer is 30 percent of a corn farmer’s operating costs.)
13
• FPP bookings rebounded in late October/early November, but still well below comparable 2004 levels
• Adjusting production and purchased product levels accordingly
• Adverse impact on margins due to market conditions and lost production
• Good news on Russian and Ukrainian urea from the ITC, but concerns over new urea capacity from other regions in 2006
14
Strengths and Flexibility in CF Industries’ Third Quarter Performance
• Flexible ‘Make versus Buy’ capability at Donaldsonville
• Strategic distribution network positioned to serve key Corn Belt states
• Innovative risk management program provided effective buffer in high-natural-gas-cost environment
• Strong market position and customer relationships
• And a strong financial position underlying it all…
15
Long-Term Strategic Priorities
• Reduce dependence on North American natural gas
• Expand usage and duration of FPP
• Identify next generation of cost-reduction efforts
• Develop new, post-cooperative market opportunities
16
Expand Formal Long-Term Strategic Planning Process
• Through February of 2005, limited strategic mission as a cooperative
• Today, new Strategic Leadership Team exploring opportunities
• A conscious decision: urgency but discipline!
17
Reduce Dependence on North American Natural Gas
• Trinidad joint venture to produce ammonia and UAN
• Petroleum coke option for Donaldsonville plant
• Longer-term, LNG may alter world competitive landscape for the better, with important implications for domestic production
18
Expand Usage and Duration of FPP
• In Q3, 68 percent of nitrogen and 50 percent of phosphate volume
• Benefits producer and customer: locks in margin and assures customers’ supply
19
Identify Next Generation of Cost-Reduction Efforts
• Achieved $50 million in sustainable estimated EBITDA improvements since 2002
• Next goal: ‘mid-hanging fruit’
20
Develop New, Post-Cooperative Market Opportunities
• New customers now account for almost 50 percent of sales
• Opportunities exist to optimize the mix
21
CF Industries Holdings, Inc.
The assets, the flexibility, the talent, and the financial strength to compete in a challenging, volatile marketplace
• Don’t bet the company on any one natural gas price scenario
• Optimize our strong distribution system
• Use our financial strength to improve/grow the business
22
Industry Overview
• Three key nutrients:
• Nitrogen (N)
• Phosphate (P)
• Potash (K)
Global Fertilizer Consumption
Total Tons 2004: 162MM
[CHART]
24
Long-term Demand Drivers
World Population is
Growing… | | …While World Meat Consumption
Is Increasing… | | …Requiring More Corn to
Feed More Livestock… |
| | | | |
[CHART] | | [CHART] | | [CHART] |
| | | | |
| | Global Fertilizer Consumption (1) | | |
| | | | |
| | [CHART] | | |
Notes: (1) Excludes former Soviet Union countries
25
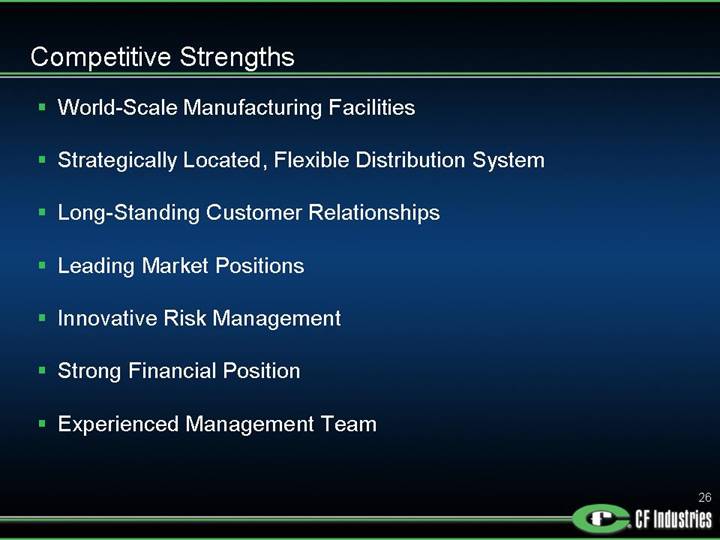
Competitive Strengths
• World-Scale Manufacturing Facilities
• Strategically Located, Flexible Distribution System
• Long-Standing Customer Relationships
• Leading Market Positions
• Innovative Risk Management
• Strong Financial Position
• Experienced Management Team
26
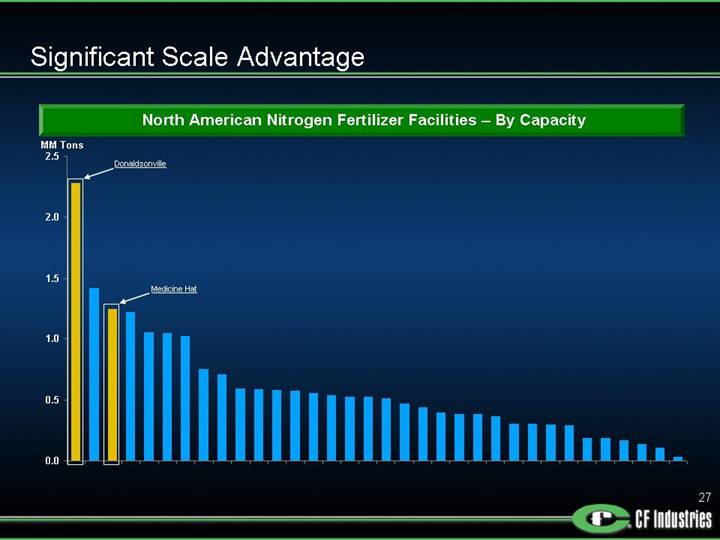
Significant Scale Advantage
North American Nitrogen Fertilizer Facilities – By Capacity
[CHART]
27
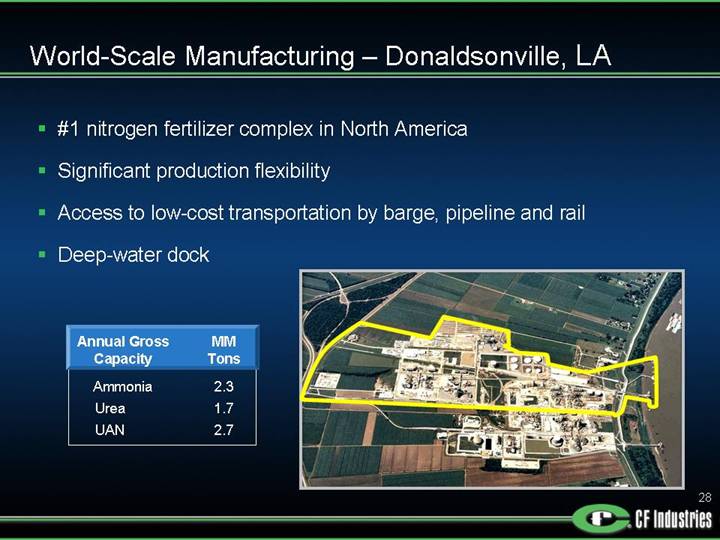
World-Scale Manufacturing – Donaldsonville, LA
• #1 nitrogen fertilizer complex in North America
• Significant production flexibility
• Access to low-cost transportation by barge, pipeline and rail
• Deep-water dock
Annual Gross
Capacity | | MM
Tons | |
Ammonia | | 2.3 | |
Urea | | 1.7 | |
UAN | | 2.7 | |
[GRAPHIC]
28
World-Scale Manufacturing – Medicine Hat, AB
• #1 nitrogen fertilizer complex in Canada, #3 in North America
• Access to attractive markets of western Canada and northern U.S.
• Supplied by lower-priced natural gas from Alberta
• Average advantage of $27/ton ammonia
Annual Gross | | MM | |
Capacity | | Tons | |
Ammonia | | 1.3 | |
Urea | | 0.8 | |
[GRAPHIC]
29
World-Scale Manufacturing – Central Florida
• Hardee Rock Mine – newest U.S. phosphate rock mine
• 27 years of reserves
• Plant City Complex – one of the largest, integrated DAP / MAP complexes in U.S.
• Port of Tampa – access to domestic and international markets
Annual Gross | | MM | |
Capacity | | Tons | |
Phosphate Rock | | 3.5 | |
Sulfuric Acid | | 2.6 | |
Phosphoric Acid | | 1.0 | |
DAP / MAP | | 2.0 | |
[GRAPHIC]
30
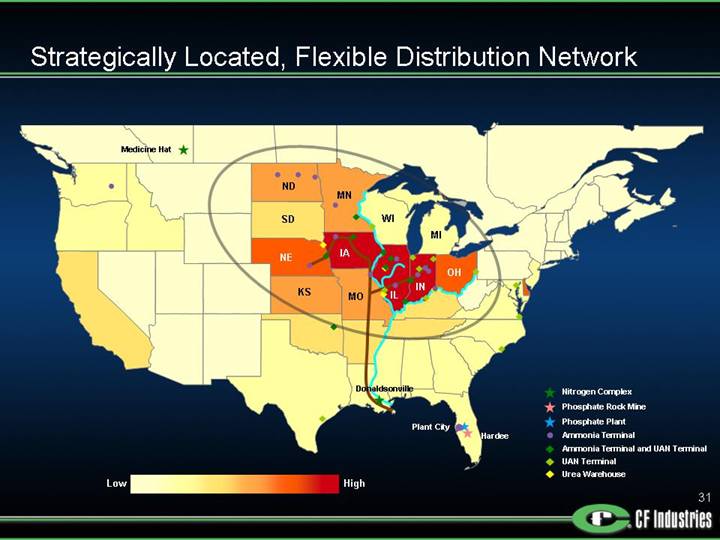
Strategically Located, Flexible Distribution Network
[GRAPHIC]
31
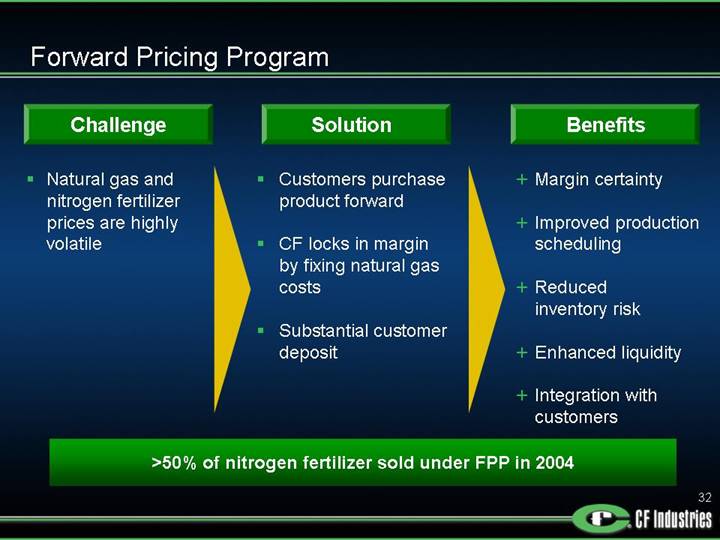
Forward Pricing Program
Challenge | | Solution | | Benefits |
| | | | |
• Natural gas and nitrogen fertilizer prices are highly volatile | | • Customers purchase product forward • CF locks in margin by fixing natural gas costs • Substantial customer deposit | | • Margin certainty • Improved production scheduling • Reduced inventory risk • Enhanced liquidity • Integration with customers |
>50% of nitrogen fertilizer sold under FPP in 2004
32
Leading Market Positions in North America
Market Share (2004)
Nitrogen | | Phosphate |
| | |
[CHART] | | [CHART] |
• Key Driver: Strategically located network of terminals and warehouses
33
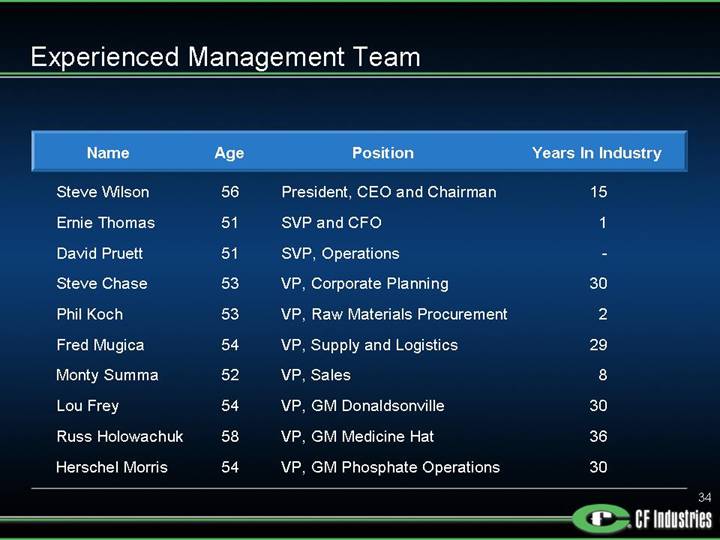
Experienced Management Team
Name | | Age | | Position | | Years In Industry |
| | | | | | |
Steve Wilson | | 56 | | President, CEO and Chairman | | 15 | |
Ernie Thomas | | 51 | | SVP and CFO | | 1 | |
David Pruett | | 51 | | SVP, Operations | | — | |
Steve Chase | | 53 | | VP, Corporate Planning | | 30 | |
Phil Koch | | 53 | | VP, Raw Materials Procurement | | 2 | |
Fred Mugica | | 54 | | VP, Supply and Logistics | | 29 | |
Monty Summa | | 52 | | VP, Sales | | 8 | |
Lou Frey | | 54 | | VP, GM Donaldsonville | | 30 | |
Russ Holowachuk | | 58 | | VP, GM Medicine Hat | | 36 | |
Herschel Morris | | 54 | | VP, GM Phosphate Operations | | 30 | |
34