


Searchable text section of graphics shown above
[GRAPHIC]
Strategic Issues and Opportunities at
CF Industries Holdings, Inc.
Presentation to
BMO Nesbitt Burns
Global Fertilizer Conference
April 3, 2006
Stephen R. Wilson
Chairman and Chief Executive Officer
Ernest Thomas
Senior Vice President and Chief Financial Officer
Safe Harbor Statement
Certain statements contained in this presentation may constitute “forward-looking statements” within the meaning of federal securities laws. All statements in this presentation, other than those relating to our historical information or current condition, are forward-looking statements. These forward-looking statements are subject to a number of risks and uncertainties, many of which are beyond our control, which could cause our actual results to differ materially from such statements. These risks and uncertainties include the relatively expensive and volatile cost of North American natural gas; the cyclical nature of our business; the nature of our products as global commodities; intense global competition in the consolidating markets in which we operate; conditions in the U.S. agricultural industry; weather conditions; our inability to accurately predict seasonal demand for our products; the concentration of our sales to pre-IPO owners and other large customers; the impact of changing market conditions on our forward pricing program; the significant risks and hazards involved in fertilizer manufacturing; unanticipated consequences related to future expansion of our business; our inability to expand our business, including consequences due to the significant resources that could be required; potential liabilities and expenditures related to environmental and health and safety laws and regulations; our inability to obtain or maintain required permits and governmental approvals; acts of terrorism; difficulties in securing the raw materials we use; changes in global fertilizer supply and demand and the other risks and uncertainties included from time to time in our filings with the Securities and Exchange Commission. We undertake no obligation to update or revise any forward-looking statements.
[LOGO]
2
Overview
A Quick Look at CF Industries Holdings, Inc.
• A leading manufacturer and distributor of nitrogen and phosphate fertilizer
• Founded as cooperative in 1946; new bottom line-oriented business model in 2003
• Operates the industry’s most extensive distribution network
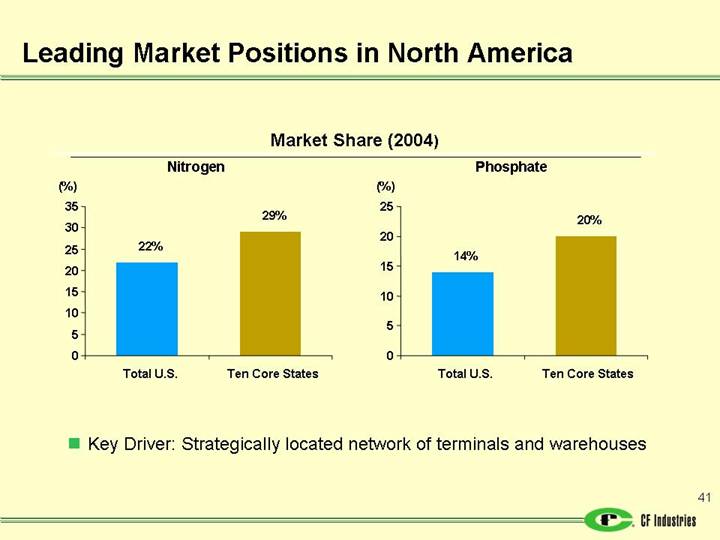
• Market shares: 22 percent nitrogen and 14 percent phosphate for fertilizer year 2004; 29 percent nitrogen and 20 percent phosphate in key Corn Belt states
• At capacity, use 350,000 MMBtu of natural gas daily
3
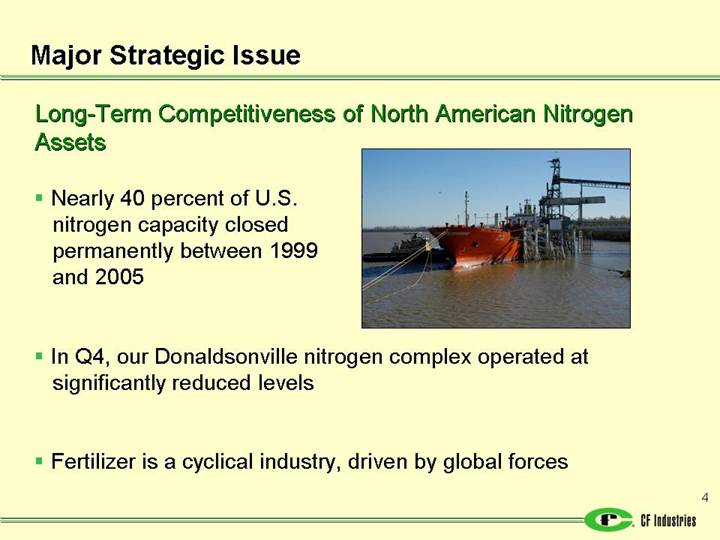
Major Strategic Issue
[GRAPHIC]
Long-Term Competitiveness of North American Nitrogen Assets
• Nearly 40 percent of U.S. nitrogen capacity closed permanently between 1999 and 2005
• In Q4, our Donaldsonville nitrogen complex operated at significantly reduced levels
• Fertilizer is a cyclical industry, driven by global forces
4
CF Perspectives
[GRAPHIC]
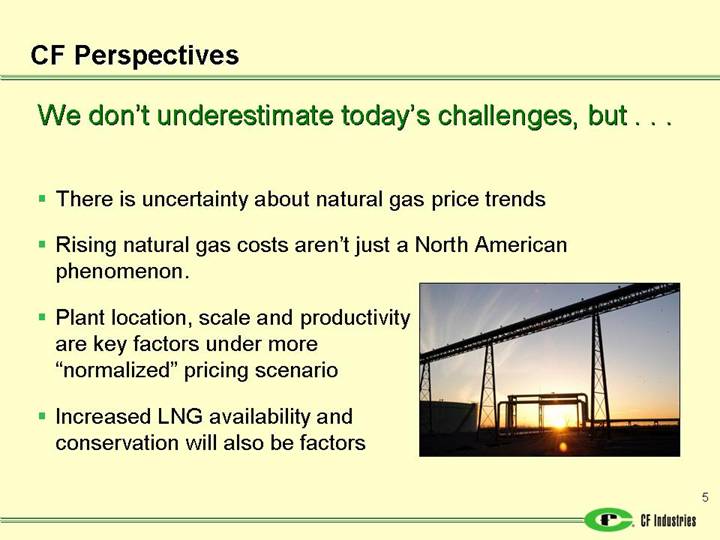
We don’t underestimate today’s challenges, but . . .
• There is uncertainty about natural gas price trends
• Rising natural gas costs aren’t just a North American phenomenon.
• Plant location, scale and productivity are key factors under more “normalized” pricing scenario
• Increased LNG availability and conservation will also be factors
5
CF Position
• The U.S. may not always be a relatively high-natural-gas-cost production point
• In any gas cost environment, CF Industries’ distribution system will provide a valuable asset, especially for ammonia
Today’s uncertainty demands flexibility and nimbleness to adapt to changing market conditions
6
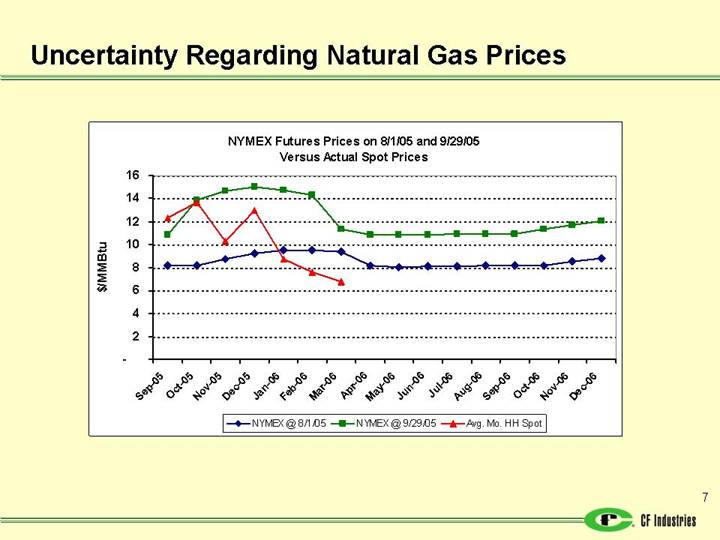
Uncertainty Regarding Natural Gas Prices
NYMEX Futures Prices on 8/1/05 and 9/29/05
Versus Actual Spot Prices
[CHART]
7
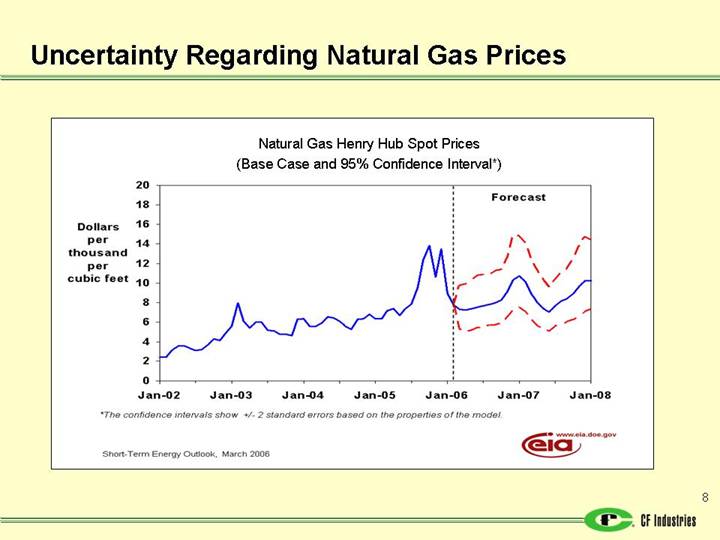
Natural Gas Henry Hub Spot Prices
(Base Case and 95% Confidence Interval*)
[CHART]
*The confidence intervals show +/-2 standard errors based on the properties of the model.
[LOGO]
Short-Term Energy Outlook, March 2006
8
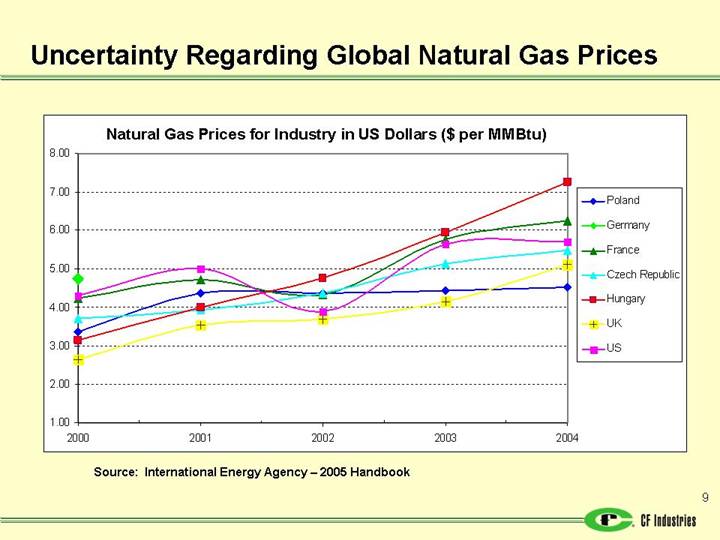
Uncertainty Regarding Global Natural Gas Prices
Natural Gas Prices for Industry in US Dollars ($ per MMBtu)
[CHART]
Source: International Energy Agency – 2005 Handbook
9
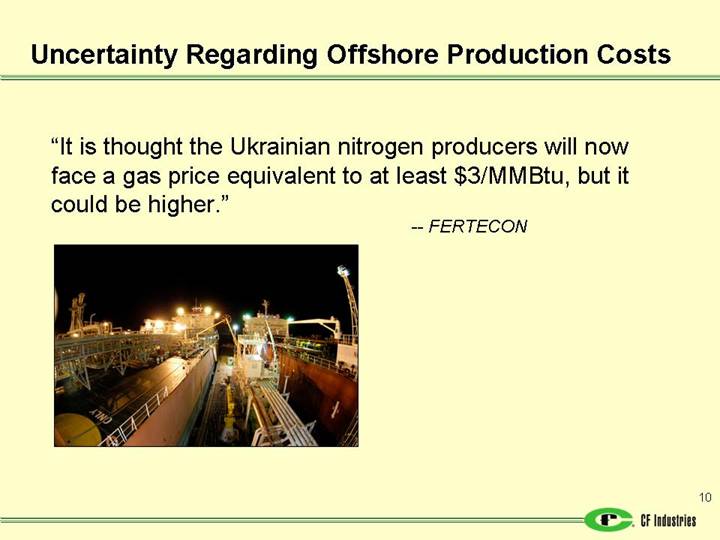
Uncertainty Regarding Offshore Production Costs
“It is thought the Ukrainian nitrogen producers will now face a gas price equivalent to at least $3/MMBtu, but it could be higher.”
— FERTECON
[GRAPHIC]
10
Uncertainty Regarding Plant Productivity
• Other producers (Western Europe) already face high, world market natural gas prices
• Eastern Europe producers face rising natural gas costs and major logistical disadvantages
‘Vulnerable’ capacity isn’t just North American
11
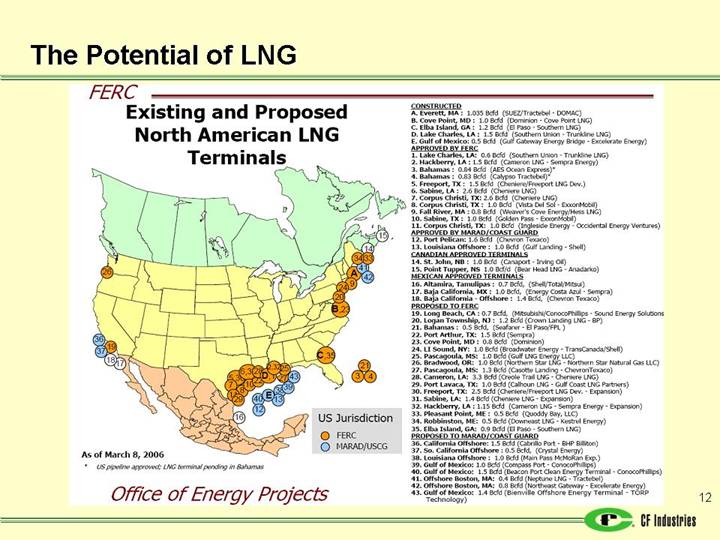
The Potential of LNG
[GRAPHIC]
12
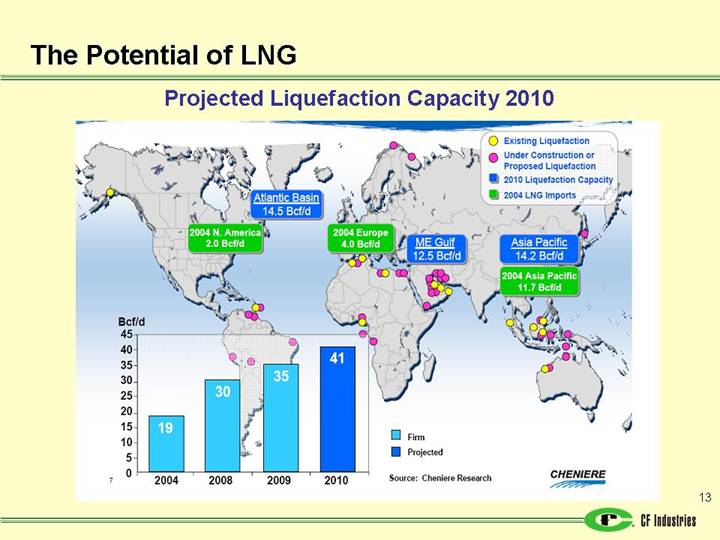
Projected Liquefaction Capacity 2010
[GRAPHIC]
13
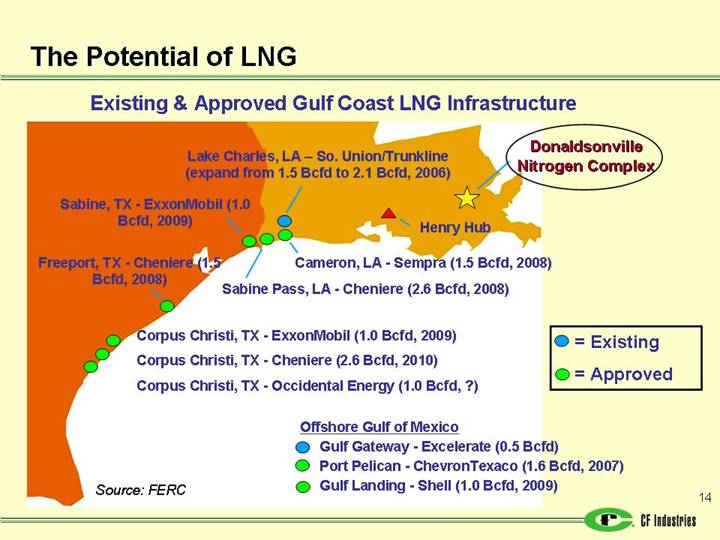
Existing & Approved Gulf Coast LNG Infrastructure
[GRAPHIC]
14
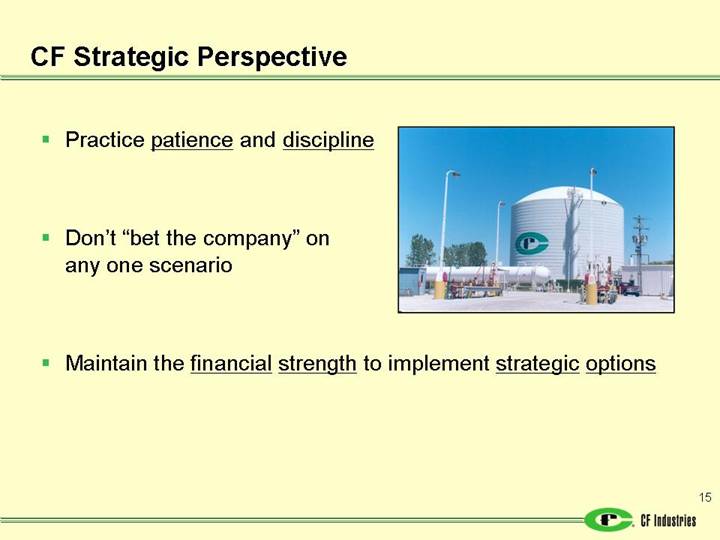
CF Strategic Perspective
[GRAPHIC]
• Practice patience and discipline
• Don’t “bet the company” on
any one scenario
• Maintain the financial strength to implement strategic options
15
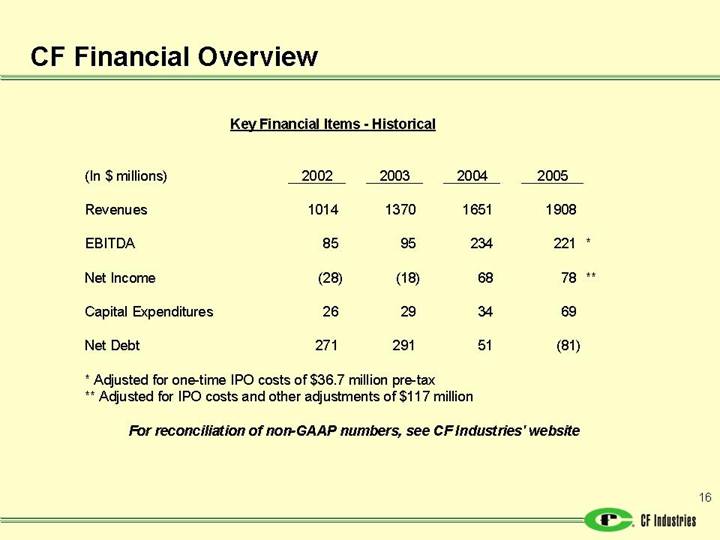
CF Financial Overview
Key Financial Items - Historical
(In $ millions) |
| 2002 |
| 2003 |
| 2004 |
| 2005 |
|
|
|
|
|
|
|
|
|
|
|
Revenues |
| 1014 |
| 1370 |
| 1651 |
| 1908 |
|
|
|
|
|
|
|
|
|
|
|
EBITDA |
| 85 |
| 95 |
| 234 |
| 221 | * |
|
|
|
|
|
|
|
|
|
|
Net Income |
| (28 | ) | (18 | ) | 68 |
| 78 | ** |
|
|
|
|
|
|
|
|
|
|
Capital Expenditures |
| 26 |
| 29 |
| 34 |
| 69 |
|
|
|
|
|
|
|
|
|
|
|
Net Debt |
| 271 |
| 291 |
| 51 |
| (81 | ) |
* Adjusted for one-time IPO costs of $36.7 million pre-tax
** Adjusted for IPO costs and other adjustments of $117 million
For reconciliation of non-GAAP numbers, see CF Industries’ website
16
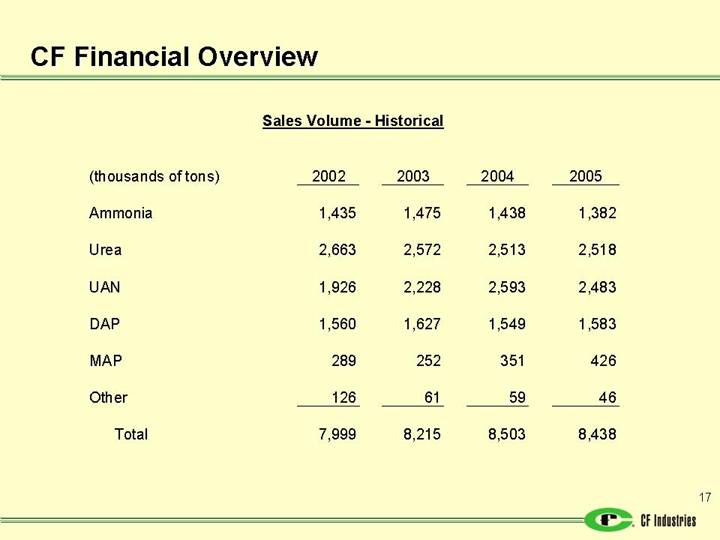
CF Financial Overview
Sales Volume - Historical
(thousands of tons) |
| 2002 |
| 2003 |
| 2004 |
| 2005 |
|
|
|
|
|
|
|
|
|
|
|
Ammonia |
| 1,435 |
| 1,475 |
| 1,438 |
| 1,382 |
|
|
|
|
|
|
|
|
|
|
|
Urea |
| 2,663 |
| 2,572 |
| 2,513 |
| 2,518 |
|
|
|
|
|
|
|
|
|
|
|
UAN |
| 1,926 |
| 2,228 |
| 2,593 |
| 2,483 |
|
|
|
|
|
|
|
|
|
|
|
DAP |
| 1,560 |
| 1,627 |
| 1,549 |
| 1,583 |
|
|
|
|
|
|
|
|
|
|
|
MAP |
| 289 |
| 252 |
| 351 |
| 426 |
|
|
|
|
|
|
|
|
|
|
|
Other |
| 126 |
| 61 |
| 59 |
| 46 |
|
|
|
|
|
|
|
|
|
|
|
Total |
| 7,999 |
| 8,215 |
| 8,503 |
| 8,438 |
|
17
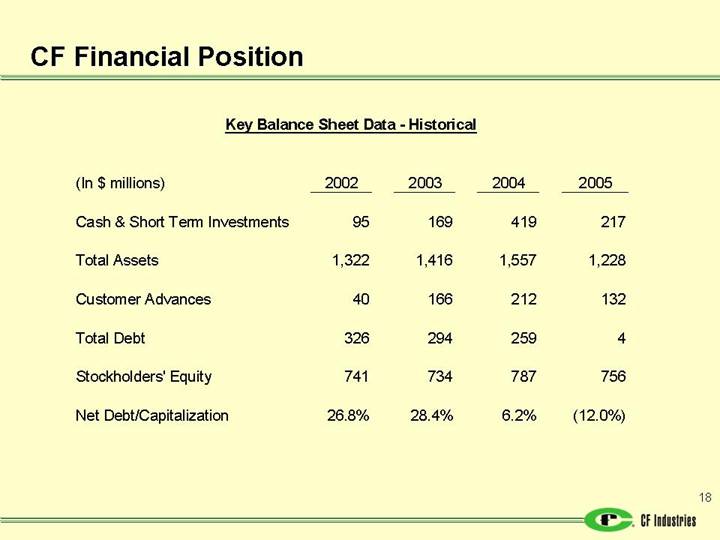
CF Financial Position
Key Balance Sheet Data - Historical
(In $ millions) |
| 2002 |
| 2003 |
| 2004 |
| 2005 |
|
|
|
|
|
|
|
|
|
|
|
Cash & Short Term Investments |
| 95 |
| 169 |
| 419 |
| 217 |
|
|
|
|
|
|
|
|
|
|
|
Total Assets |
| 1,322 |
| 1,416 |
| 1,557 |
| 1,228 |
|
|
|
|
|
|
|
|
|
|
|
Customer Advances |
| 40 |
| 166 |
| 212 |
| 132 |
|
|
|
|
|
|
|
|
|
|
|
Total Debt |
| 326 |
| 294 |
| 259 |
| 4 |
|
|
|
|
|
|
|
|
|
|
|
Stockholders’ Equity |
| 741 |
| 734 |
| 787 |
| 756 |
|
|
|
|
|
|
|
|
|
|
|
Net Debt/Capitalization |
| 26.8 | % | 28.4 | % | 6.2 | % | (12.0 | )% |
18
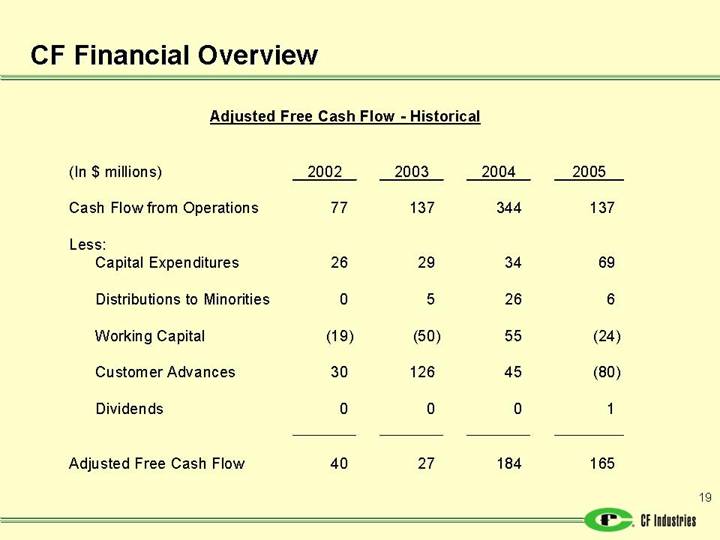
CF Financial Overview
Adjusted Free Cash Flow - Historical
(In $ millions) |
| 2002 |
| 2003 |
| 2004 |
| 2005 |
|
|
|
|
|
|
|
|
|
|
|
Cash Flow from Operations |
| 77 |
| 137 |
| 344 |
| 137 |
|
|
|
|
|
|
|
|
|
|
|
Less: |
|
|
|
|
|
|
|
|
|
Capital Expenditures |
| 26 |
| 29 |
| 34 |
| 69 |
|
|
|
|
|
|
|
|
|
|
|
Distributions to Minorities |
| 0 |
| 5 |
| 26 |
| 6 |
|
|
|
|
|
|
|
|
|
|
|
Working Capital |
| (19 | ) | (50 | ) | 55 |
| (24 | ) |
|
|
|
|
|
|
|
|
|
|
Customer Advances |
| 30 |
| 126 |
| 45 |
| (80 | ) |
|
|
|
|
|
|
|
|
|
|
Dividends |
| 0 |
| 0 |
| 0 |
| 1 |
|
|
|
|
|
|
|
|
|
|
|
Adjusted Free Cash Flow |
| 40 |
| 27 |
| 184 |
| 165 |
|
19
Priorities for Cash
• Liquidity to operate through fertilizer cycle
• Flexibility to fund strategic investments, i.e. Trinidad
• Options such as share repurchases
20
CF Strategic Response
• Establish a diversified feed stock base
Strategically, this makes sense – in any natural gas pricing scenario
• Intensify efforts to support domestic exploration
There is no shortage of North American natural gas.
• Maintain operational and financial flexibility
Despite near-term challenges, Donaldsonville provides important flexibility and options
• Expand the usage, utility and duration of our forward pricing program (FPP)
It benefits CF Industries and customer alike
21
Diversify the Feedstock
• We’re currently 100 percent North America natural gas based
• Options under consideration include:
• JV in Trinidad
• Conversion of a portion of Donaldsonville to proven petroleum coke gasification technology
• Medicine Hat provides a degree of diversification
• Donaldsonville location and infrastructure provide ‘make versus buy’ flexibility
22
Expand Domestic Natural Gas Supply
• North America has significant untapped natural gas reserves
• The political climate in Washington is changing
• Exploration and LNG can significantly change pricing
• Donaldsonville well positioned for LNG supply
23
Expand Domestic Supply
[GRAPHIC]
24
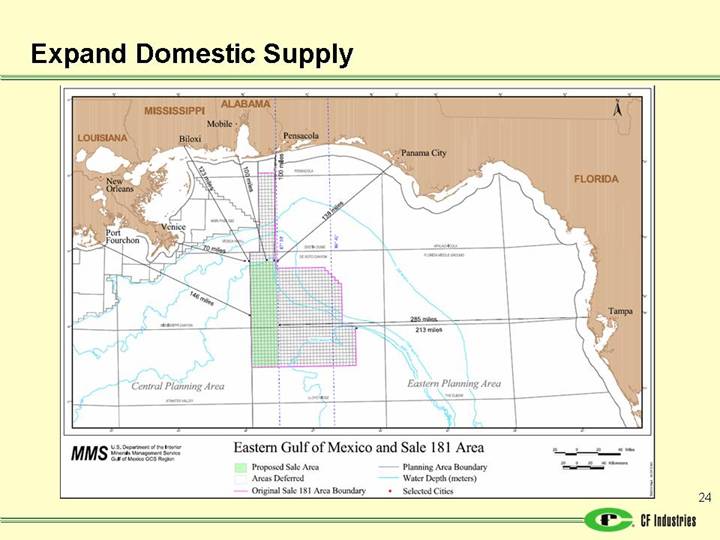
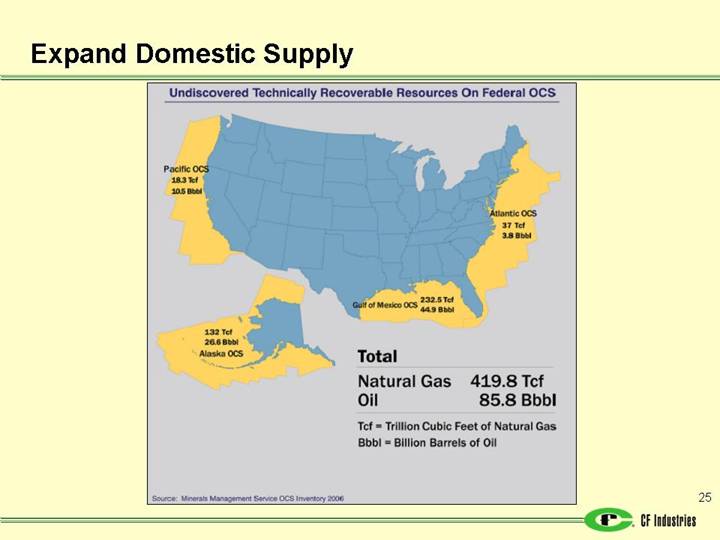
Expand Domestic Supply
[GRAPHIC]
25
Maintain Operational and Financial Flexibility
• Modular configuration a key plus at Donaldsonville
• Mississippi River location and significant import/handling/distribution capabilities are additional advantages
• Strong financial position supports additional flexibility
26
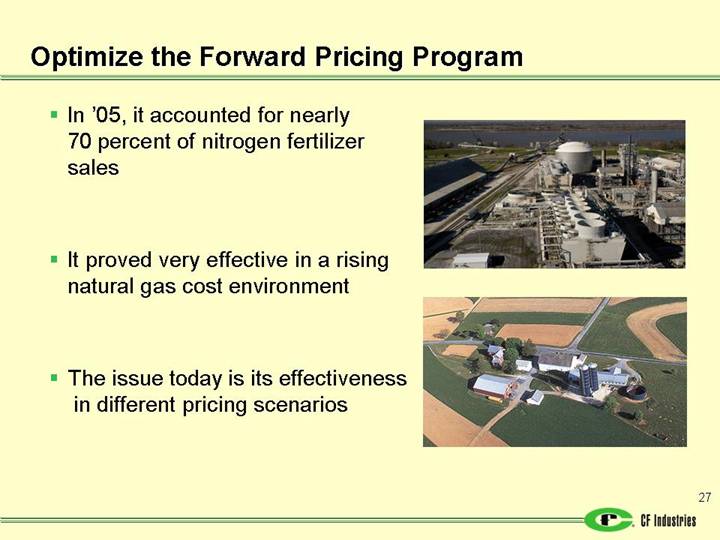
Optimize the Forward Pricing Program
[GRAPHIC]
• In ‘05, it accounted for nearly 70 percent of nitrogen fertilizer sales
• It proved very effective in a rising natural gas cost environment
• The issue today is its effectiveness in different pricing scenarios
27
One Last Strategic Thought
• CF Industries’ Phosphate Operations
• Newest U.S. phosphate rock mine (Hardee County)
• One of largest U.S. integrated DAP/MAP complexes (Plant City)
• Ammonia terminal and warehouse/shipping complex, with access to domestic and export markets
• 23% of sales and 17% of gross margin in 2005 – and important product and market diversification
28
Summary
The Long Term Competitiveness of North American Nitrogen Capacity?
• The markets, the infrastructure and the raw materials all exist
• Globalization in the natural gas market is happening
• The political climate in the U.S. is changing
• Alternative feed stocks offer additional options
29
[LOGO]
[GRAPHIC]
30
APPENDIX
31
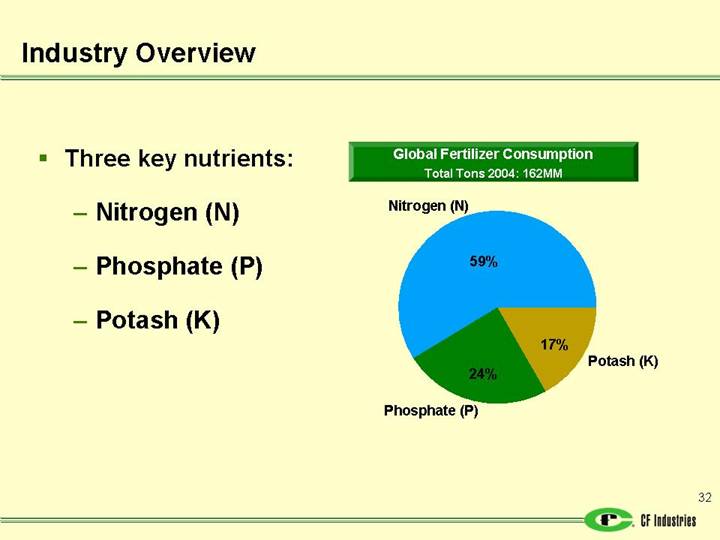
Industry Overview
• Three key nutrients:
• Nitrogen (N)
• Phosphate (P)
• Potash (K)
Global Fertilizer Consumption
Total Tons 2004: 162MM
[CHART]
32
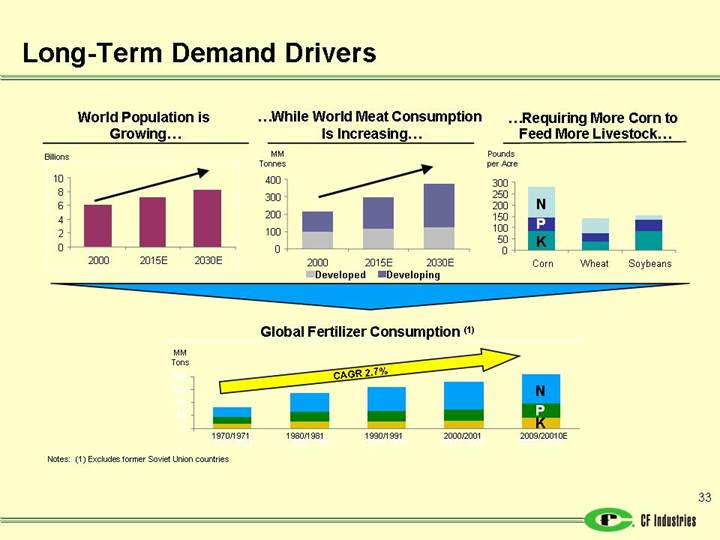
Long-Term Demand Drivers
World Population is |
| …While World Meat Consumption |
| …Requiring More Corn to |
|
|
|
|
|
|
|
[CHART] |
| [CHART] |
| [CHART] |
|
|
|
|
|
|
|
|
| [GRAPHIC] |
|
|
|
|
|
|
|
|
|
|
| Global Fertilizer Consumption (1) |
|
|
|
|
|
|
|
|
|
|
| [CHART] |
|
|
|
Notes: (1) Excludes former Soviet Union countries
33
Competitive Strengths
• World-Scale Manufacturing Facilities
• Strategically Located, Flexible Distribution System
• Long-Standing Customer Relationships
• Leading Market Positions
• Innovative Risk Management
• Strong Financial Position
• Experienced Management Team
34
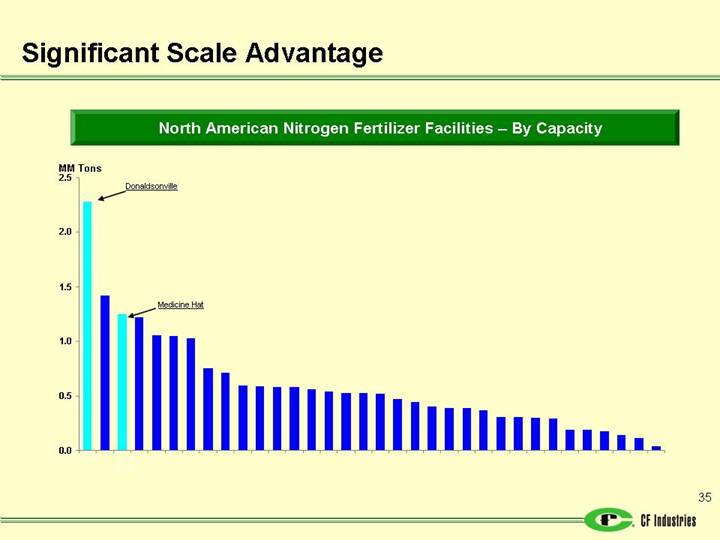
Significant Scale Advantage
North American Nitrogen Fertilizer Facilities – By Capacity
[CHART]
35
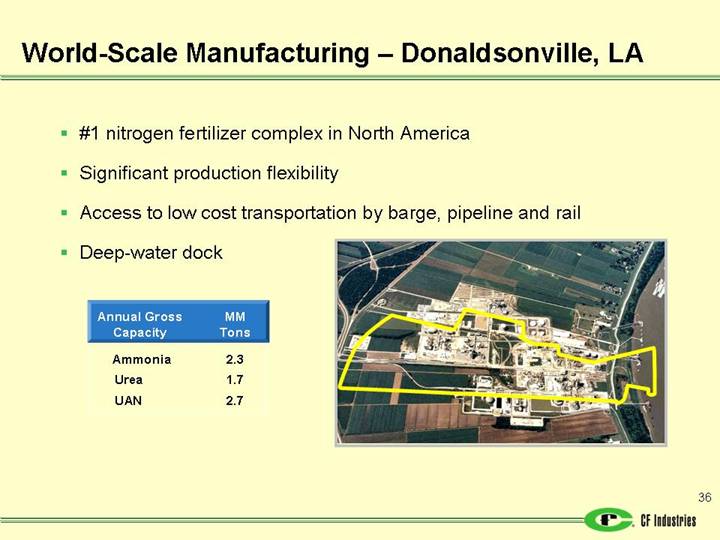
World-Scale Manufacturing – Donaldsonville, LA
• #1 nitrogen fertilizer complex in North America
• Significant production flexibility
• Access to low cost transportation by barge, pipeline and rail
• Deep-water dock
Annual Gross |
| MM |
|
Capacity |
| Tons |
|
|
|
|
|
Ammonia |
| 2.3 |
|
Urea |
| 1.7 |
|
UAN |
| 2.7 |
|
[GRAPHIC]
36
World-Scale Manufacturing – Medicine Hat, AB
• #1 nitrogen fertilizer complex in Canada, #3 in North America
• Access to attractive markets of western Canada and northern U.S.
• Supplied by lower-priced natural gas from Alberta
• Average advantage of $27/ton ammonia
Annual Gross |
| MM |
|
Capacity |
| Tons |
|
|
|
|
|
Ammonia |
| 1.3 |
|
Urea |
| 0.8 |
|
[GRAPHIC]
37
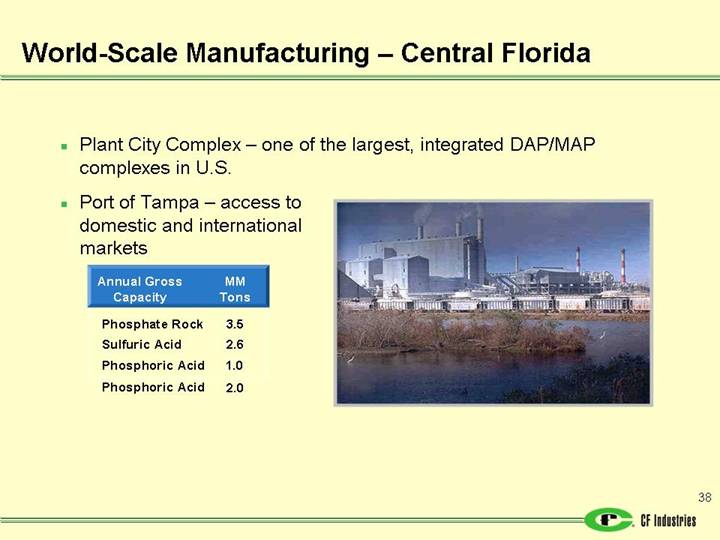
World-Scale Manufacturing – Central Florida
• Plant City Complex – one of the largest, integrated DAP/MAP complexes in U.S.
• Port of Tampa – access to domestic and international markets
Annual Gross |
| MM |
|
Capacity |
| Tons |
|
|
|
|
|
Phosphate Rock |
| 3.5 |
|
Sulfuric Acid |
| 2.6 |
|
Phosphoric Acid |
| 1.0 |
|
Phosphoric Acid |
| 2.0 |
|
[GRAPHIC]
38
Strategically Located, Flexible Distribution Network
[GRAPHIC]
39
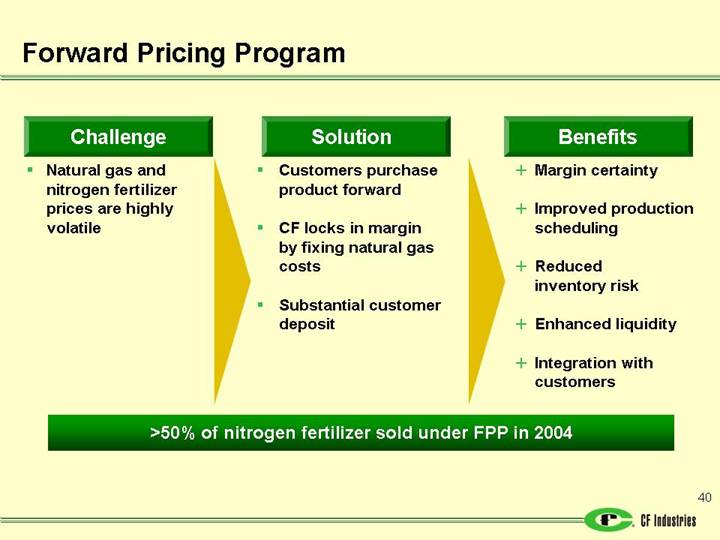
Forward Pricing Program
Challenge |
| Solution |
| Benefits | |||
|
|
|
|
| |||
• | Natural gas and nitrogen fertilizer prices are highly volatile |
| • | Customers purchase product forward |
| • | Margin certainty |
|
|
|
|
|
|
|
|
|
|
| • | CF locks in margin by fixing natural gas costs |
| • | Improved production scheduling |
|
|
|
|
|
|
|
|
|
|
| • | Substantial customer deposit |
| • | Reduced inventory risk |
|
|
|
|
|
|
|
|
|
|
|
|
|
| • | Enhanced liquidity |
|
|
|
|
|
| ||
|
|
|
| • | Integration with customers | ||
>50% of nitrogen fertilizer sold under FPP in 2004
40
Leading Market Positions in North America
Market Share (2004)
Nitrogen |
| Phosphate |
|
|
|
[CHART] |
| [CHART] |
• Key Driver: Strategically located network of terminals and warehouses
41
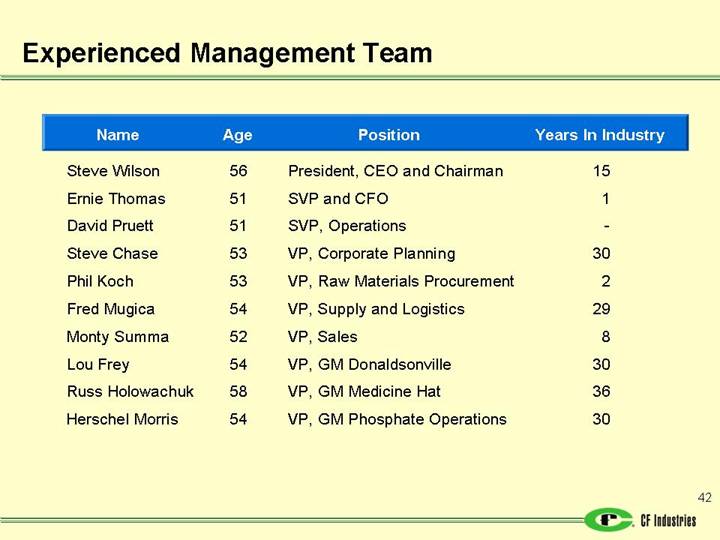
Experienced Management Team
Name |
| Age |
| Position |
| Years In Industry | |
Steve Wilson |
| 56 |
| President, CEO and Chairman |
| 15 |
|
Ernie Thomas |
| 51 |
| SVP and CFO |
| 1 |
|
David Pruett |
| 51 |
| SVP, Operations |
| — |
|
Steve Chase |
| 53 |
| VP, Corporate Planning |
| 30 |
|
Phil Koch |
| 53 |
| VP, Raw Materials Procurement |
| 2 |
|
Fred Mugica |
| 54 |
| VP, Supply and Logistics |
| 29 |
|
Monty Summa |
| 52 |
| VP, Sales |
| 8 |
|
Lou Frey |
| 54 |
| VP, GM Donaldsonville |
| 30 |
|
Russ Holowachuk |
| 58 |
| VP, GM Medicine Hat |
| 36 |
|
Herschel Morris |
| 54 |
| VP, GM Phosphate Operations |
| 30 |
|
42