Exhibit 99.1
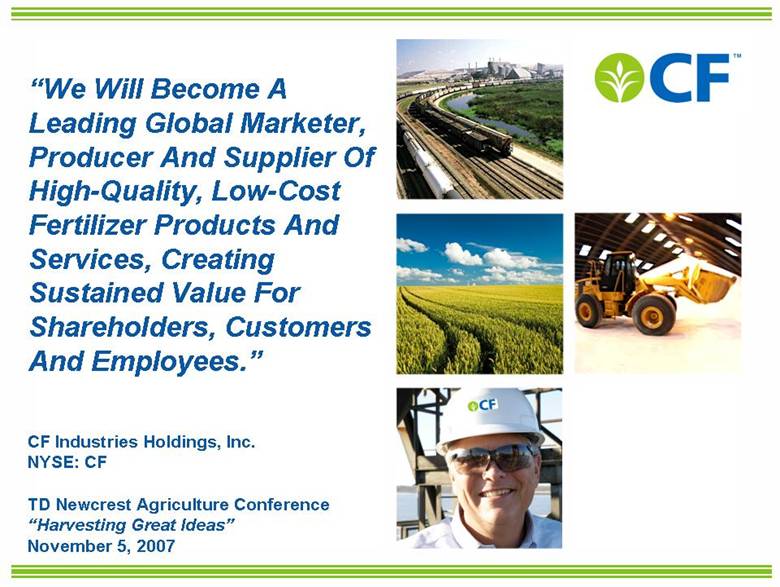
| “We Will Become A Leading Global Marketer, Producer And Supplier Of High-Quality, Low-Cost Fertilizer Products And Services, Creating Sustained Value For Shareholders, Customers And Employees.” CF Industries Holdings, Inc. NYSE: CF TD Newcrest Agriculture Conference “Harvesting Great Ideas” November 5, 2007 |
| Safe Harbor Statement Certain statements contained in this presentation may constitute “forward-looking statements” within the meaning of federal securities laws. All statements in this presentation, other than those relating to our historical information or current condition, are forward-looking statements. These forward-looking statements are subject to a number of risks and uncertainties, many of which are beyond our control, which could cause our actual results to differ materially from such statements. These risks and uncertainties include: the relatively expensive and volatile cost of North American natural gas; the cyclical nature of our business; the nature of our products as global commodities; intense global competition in the consolidating markets in which we operate; conditions in the U.S. agricultural industry; weather conditions; our inability to accurately predict seasonal demand for our products; the concentration of our sales with CF Industries’ pre-IPO owners and other large customers; the impact of changing market conditions on our forward pricing program; the significant risks and hazards against which we may not be fully insured; unanticipated consequences related to the future expansion of our business, including risks associated with international operations; our inability to expand our business, including that due to the significant resources that could be required; potential liabilities and expenditures related to environmental and health and safety laws and regulations; our inability to obtain or maintain required permits and governmental approvals; acts of terrorism; difficulties in securing the raw materials we use; changes in global fertilizer supply and demand; loss of key members of management; inability to meet financial reporting and other reporting requirements as a public company; and the other risks and uncertainties included from time to time in our filings with the Securities and Exchange Commission. We undertake no obligation to update or revise any forward-looking statements. |
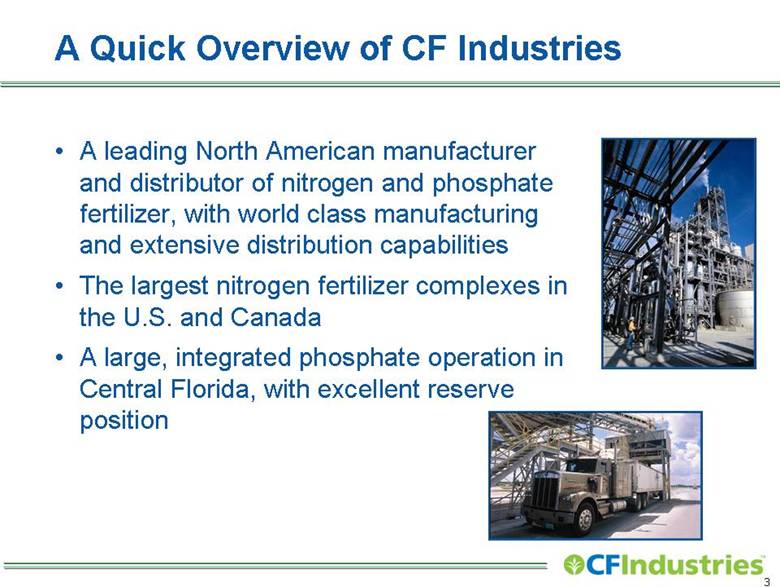
| A Quick Overview of CF Industries A leading North American manufacturer and distributor of nitrogen and phosphate fertilizer, with world class manufacturing and extensive distribution capabilities The largest nitrogen fertilizer complexes in the U.S. and Canada A large, integrated phosphate operation in Central Florida, with excellent reserve position |
| A Quick Overview of CF Industries Extensive Corn Belt-based distribution system U.S. market shares for fertilizer year 2006: 21% nitrogen 14% phosphate Corn Belt* states share in fertilizer year 2006: 26% nitrogen 19% phosphate KEYTRADE AG acquisition provides global growth platform *ND, SD, NE, MN, IA, MO, IL, OH, IN & WI |
| An Exceptional Third Quarter Performance Net earnings totaled $86.5 million, or $1.52 per common share, well above Q3’06 Improved pricing drove substantial margin improvement in nitrogen and phosphate CF Industries entered Q4’07 with strong forward order book at attractive margins Q3 is typically a seasonally weak quarter |
| The ‘Investable Idea’ Demand and prices for major crops are robust but volatile But it’s a demand-driven volatility – as crop prices bid for ‘08 acres Absent weather problems, overall planting should be strong in ‘08 – and that bodes well for fertilizer demand and pricing CF Industries is well positioned to adapt and capitalize on today’s opportunity |
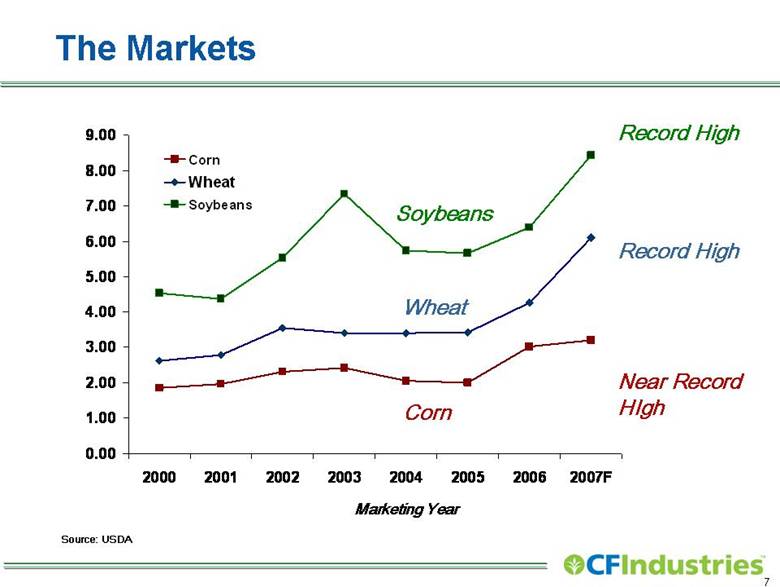
| The Markets Source: USDA Marketing Year Near Record HIgh Record High Record High Soybeans Wheat Corn 0.00 1.00 2.00 3.00 4.00 5.00 6.00 7.00 8.00 9.00 2000 2001 2002 2003 2004 2005 2006 2007F Corn Wheat Soybeans |
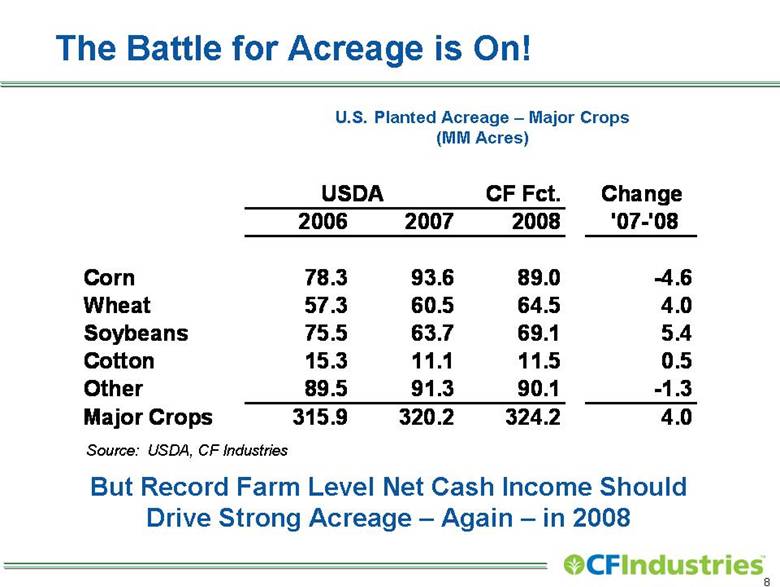
| The Battle for Acreage is On! U.S. Planted Acreage – Major Crops (MM Acres) But Record Farm Level Net Cash Income Should Drive Strong Acreage – Again – in 2008 Source: USDA, CF Industries CF Fct. Change 2006 2007 2008 ‘07- ‘08 Corn 78.3 93.6 89.0 -4.6 Wheat 57.3 60.5 64.5 4.0 Soybeans 75.5 63.7 69.1 5.4 Cotton 15.3 11.1 11.5 0.5 Other 89.5 91.3 90.1 -1.3 Major Crops 315.9 320.2 324.2 4.0 USDA |
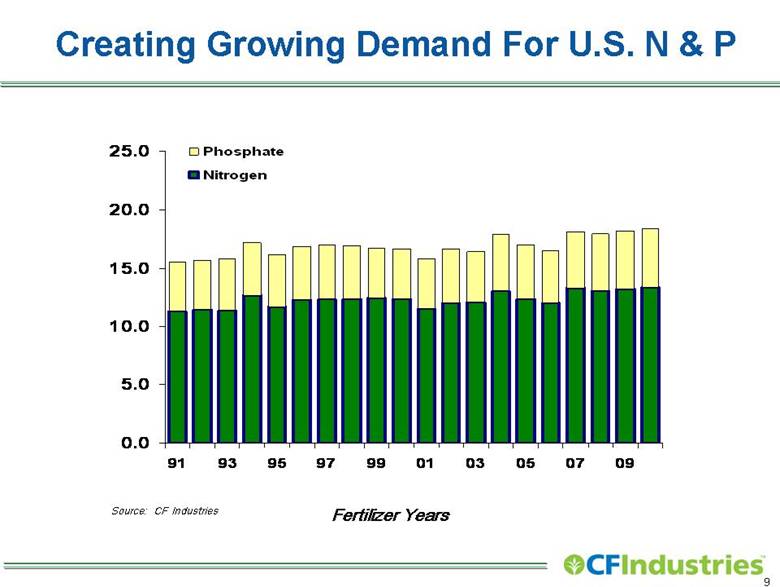
| Creating Growing Demand For U.S. N & P Source: CF Industries Fertilizer Years 0.0 5.0 10.0 15.0 20.0 25.0 91 93 95 97 99 01 03 05 07 09 Phosphate Nitrogen |
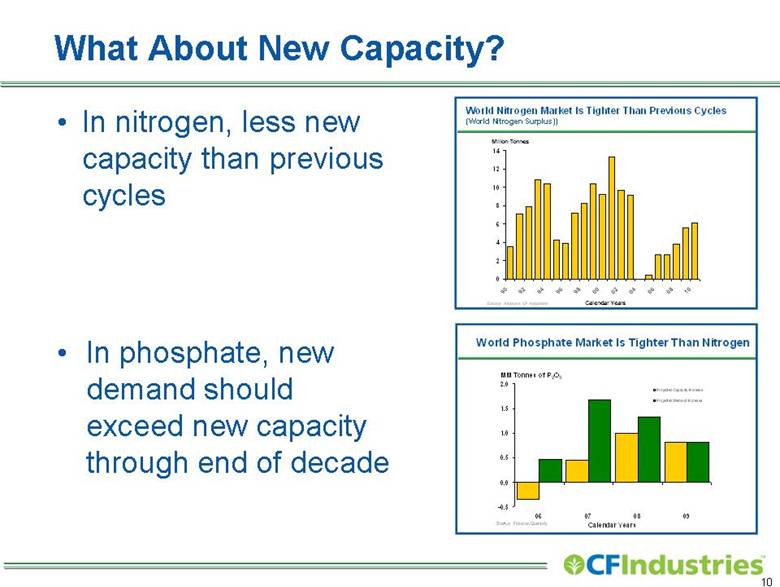
| What About New Capacity? In nitrogen, less new capacity than previous cycles In phosphate, new demand should exceed new capacity through end of decade 18 -0.5 0.0 0.5 1.0 1.5 2.0 06 07 08 09 Projected Capacity Increase Projected Demand Increase Calendar Years MM Tonnes of P 2 O 5 Source: Fertecon Quarterly World Phosphate Market Is Tighter Than Nitrogen World Nitrogen Market is Tighter Than Previous Cycles (World Nitrogen Surplus) Million Tonnes Calender Years |
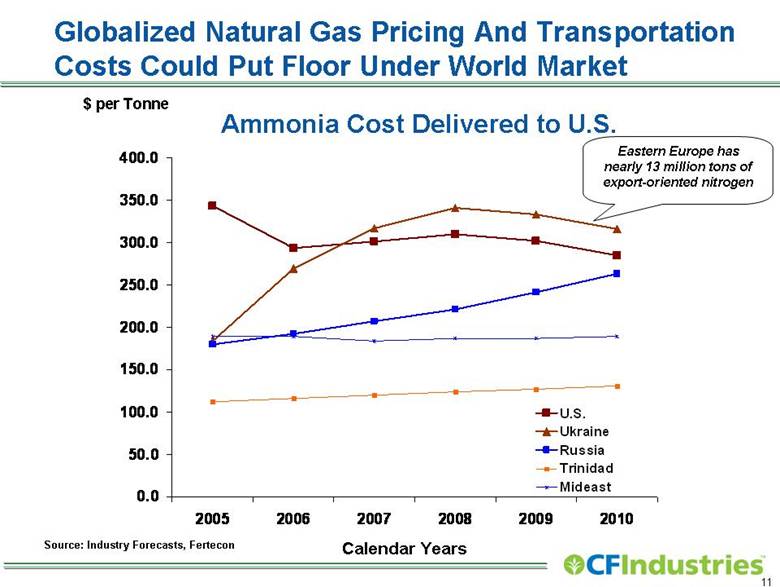
| Globalized Natural Gas Pricing And Transportation Costs Could Put Floor Under World Market Calendar Years Source: Industry Forecasts, Fertecon $ per Tonne Ammonia Cost Delivered to U.S. Eastern Europe has nearly 13 million tons of export-oriented nitrogen 0.0 50.0 100.0 150.0 200.0 250.0 300.0 350.0 400.0 2005 2006 2007 2008 2009 2010 U.S. Ukraine Russia Trinidad Mideast |
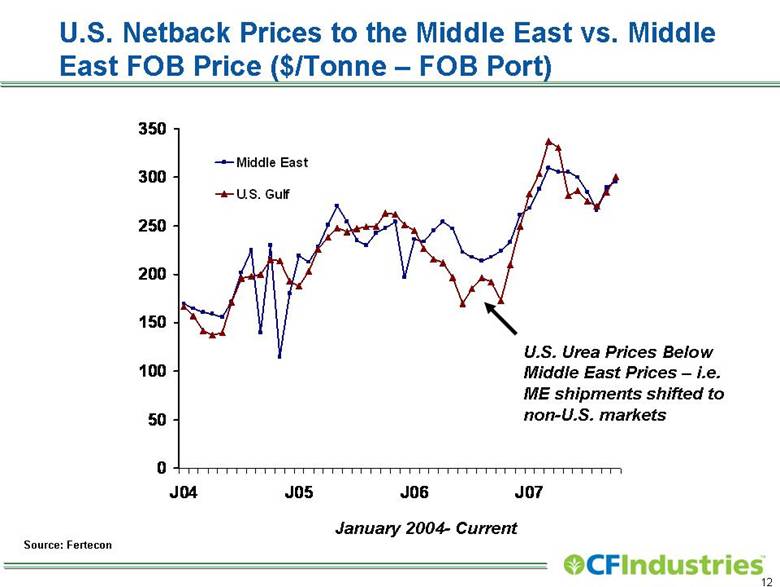
| U.S. Netback Prices to the Middle East vs. Middle East FOB Price ($/Tonne – FOB Port) Source: Fertecon January 2004- Current U.S. Urea Prices Below Middle East Prices – i.e. ME shipments shifted to non-U.S. markets 0 50 100 150 200 250 300 350 J04 J05 J06 J07 Middle East U.S. Gulf |
| Key Competitive Strengths Serving Fertilizer Markets World-scale manufacturing facilities Strategically located, flexible distribution system Long-standing customer relationships Leading positions in key U. S. Corn Belt states (26% nitrogen, 19% phosphate) Forward Pricing Program (FPP) Strong financial position |
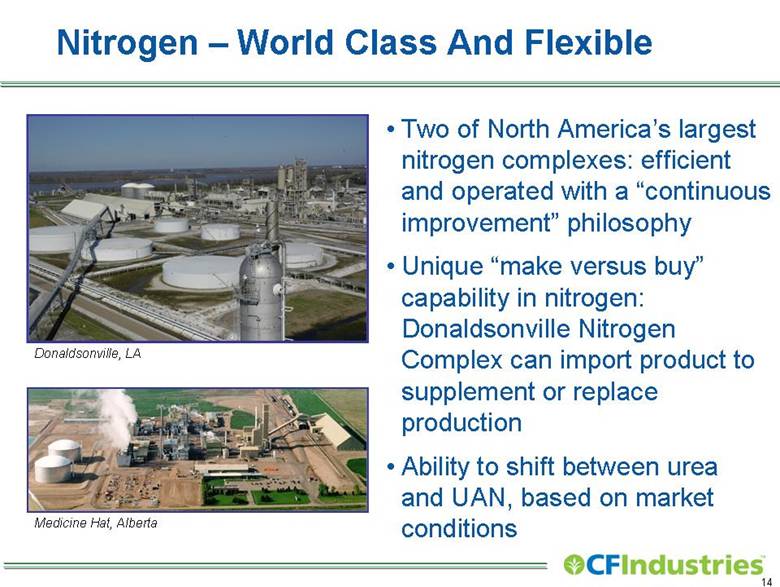
| Nitrogen – World Class And Flexible Two of North America’s largest nitrogen complexes: efficient and operated with a “continuous improvement” philosophy Unique “make versus buy” capability in nitrogen: Donaldsonville Nitrogen Complex can import product to supplement or replace production Ability to shift between urea and UAN, based on market conditions Donaldsonville, LA Medicine Hat, Alberta |
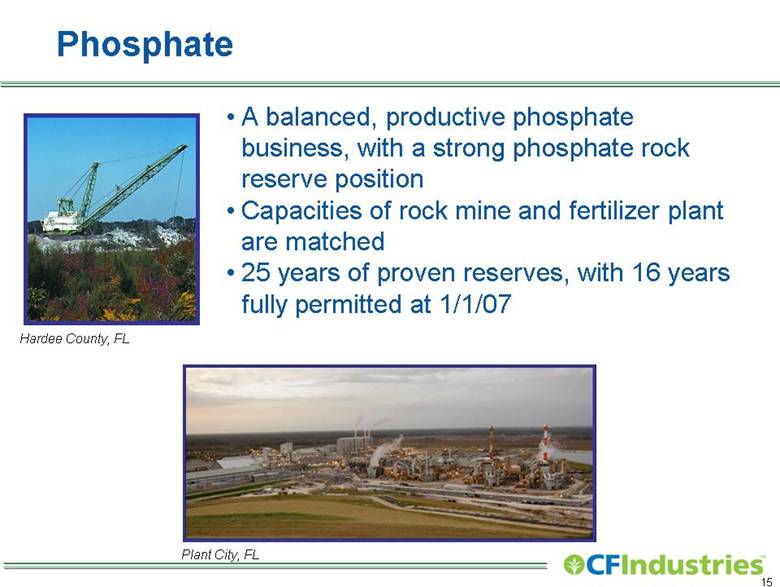
| Phosphate A balanced, productive phosphate business, with a strong phosphate rock reserve position Capacities of rock mine and fertilizer plant are matched 25 years of proven reserves, with 16 years fully permitted at 1/1/07 Hardee County, FL Plant City, FL |
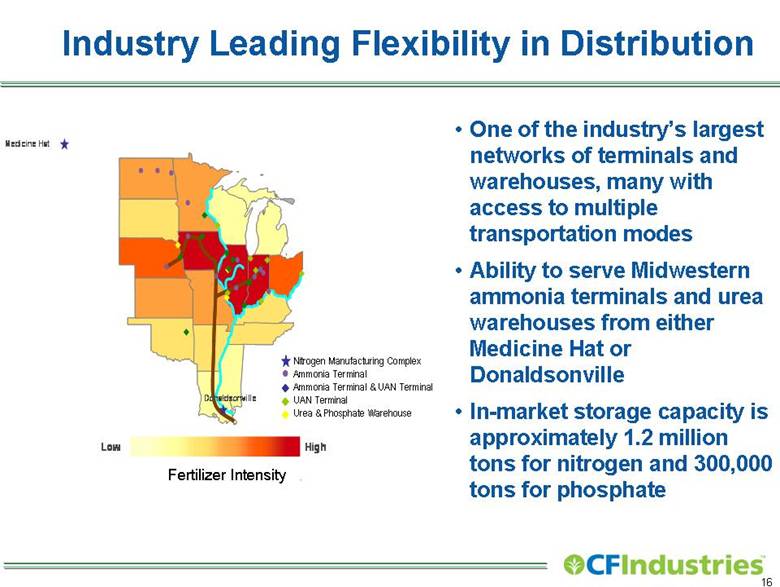
| Industry Leading Flexibility in Distribution One of the industry’s largest networks of terminals and warehouses, many with access to multiple transportation modes Ability to serve Midwestern ammonia terminals and urea warehouses from either Medicine Hat or Donaldsonville In-market storage capacity is approximately 1.2 million tons for nitrogen and 300,000 tons for phosphate Fertilizer Intensity Nitrogen Manufacturing Complex Ammonia Terminal Ammonia Terminal & UAN Terminal UAN Terminal Urea & Phosphate Warehouse Medicine Low High Donaldsonville |
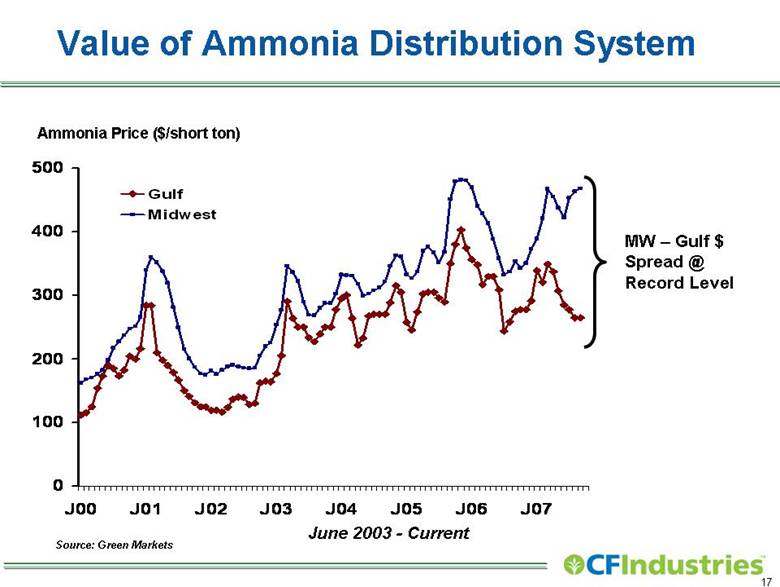
| Value of Ammonia Distribution System Source: Green Markets June 2003 - Current MW – Gulf $ Spread @ Record Level Ammonia Price ($/short ton) 0 100 200 300 400 500 J00 J01 J02 J03 J04 J05 J06 J07 Gulf Midwest |
| The ‘Investable Idea’ Demand and prices for major crops are robust but volatile But it’s a demand-driven volatility – as crop prices bid for ‘08 acres Absent weather problems, overall planting should be strong in ‘08 – and that bodes well for fertilizer demand and pricing CF Industries is well positioned to adapt and capitalize on today’s opportunity |
| LOGO |
| THANK YOU ! |
| APPENDIX |
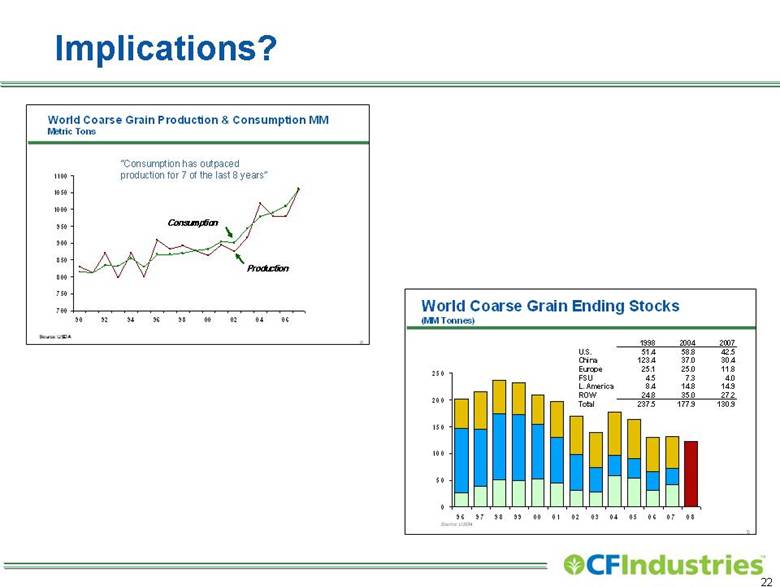
| Implications? 9 World Coarse Grain Ending Stocks (MM Tonnes) 0 50 100 150 200 250 96 97 98 99 00 01 02 03 04 05 06 07 08 Source: USDA 1998 2004 2007 U.S. 51.4 58.8 42.5 China 123.4 37.0 30.4 Europe 25.1 25.0 11.8 FSU 4.5 7.3 4.0 L. America 8.4 14.8 14.9 ROW 24.8 35.0 27.2 Total 237.5 177.9 130.9 World Coarse Grain Production & Consumption MM Metric Tons “Consumption has outpaced production for 7 of the las 8 years” Consumption Production |
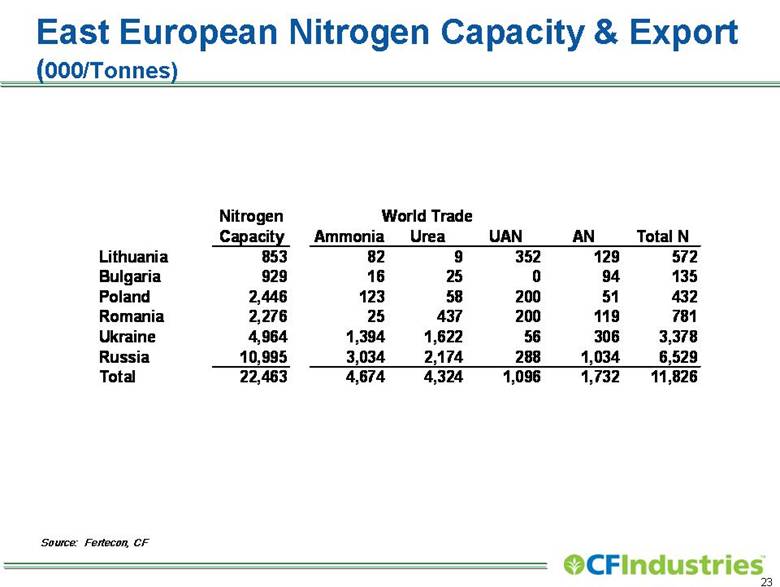
| East European Nitrogen Capacity & Export (000/Tonnes) Source: Fertecon, CF Nitrogen Capacity Ammonia Urea UAN AN Total N Lithuania 853 82 9 352 129 572 Bulgaria 929 16 25 0 94 135 Poland 2,446 123 58 200 51 432 Romania 2,276 25 437 200 119 781 Ukraine 4,964 1,394 1,622 56 306 3,378 Russia 10,995 3,034 2,174 288 1,034 6,529 Total 22,463 4,674 4,324 1,096 1,732 11,826 World Trade |
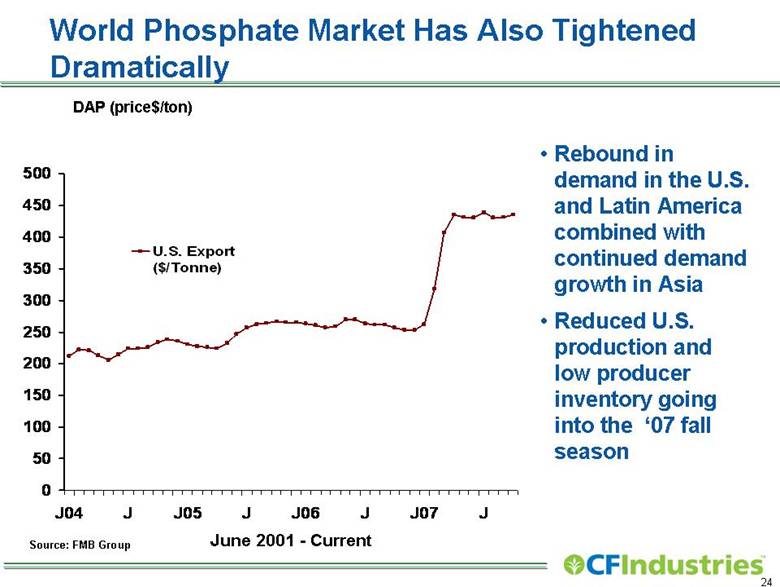
| World Phosphate Market Has Also Tightened Dramatically Source: FMB Group DAP (price$/ton) Rebound in demand in the U.S. and Latin America combined with continued demand growth in Asia Reduced U.S. production and low producer inventory going into the ‘07 fall season June 2001 - Current 0 50 100 150 200 250 300 350 400 450 500 J04 J J05 J J06 J J07 J U.S. Export ($/Tonne) |
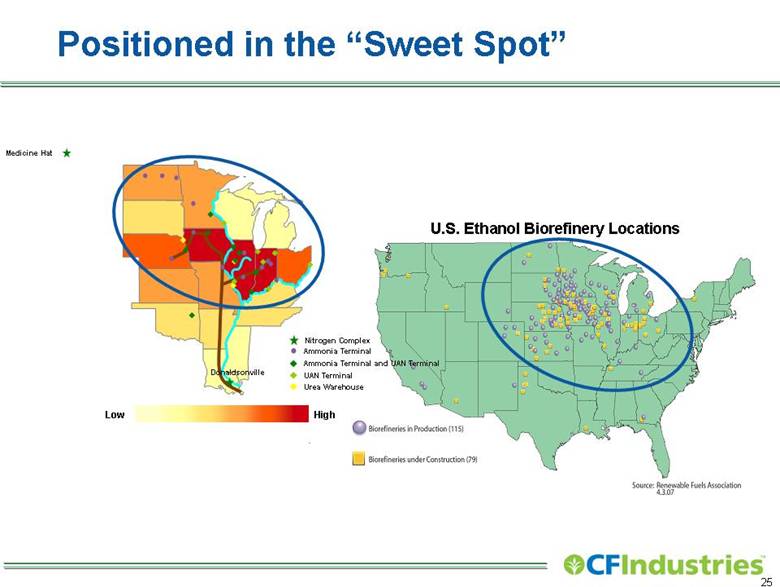
| Positioned in the “Sweet Spot” Medicine Hat Ammonia Terminal and UAN Terminal Urea Warehouse Ammonia Terminal UAN Terminal Low High Donaldsonville U.S. Ethanol Biorefinery Locations Nitrogen Complex Biorefineries in Production (115) Biorefinereis under Construction (79) Source: Renewable Fuels Association 4.3.07 |
| Strategic Themes Supply Base: Invest in supply sources to serve growth markets Distribution/Logistics: Strengthen our gateway position through the U.S. Gulf Continuous Improvement: Continually seek ways to improve our operations and management processes |
| Specific Strategic Initiatives: Gasification Project Gasification/ammonia complex at Donaldsonville Nitrogen Complex Reduce dependence on North American natural gas Convert substantial portion of complex to low-cost petcoke/coal blend Increase operational flexibility An equity investment with the potential for attractive returns |
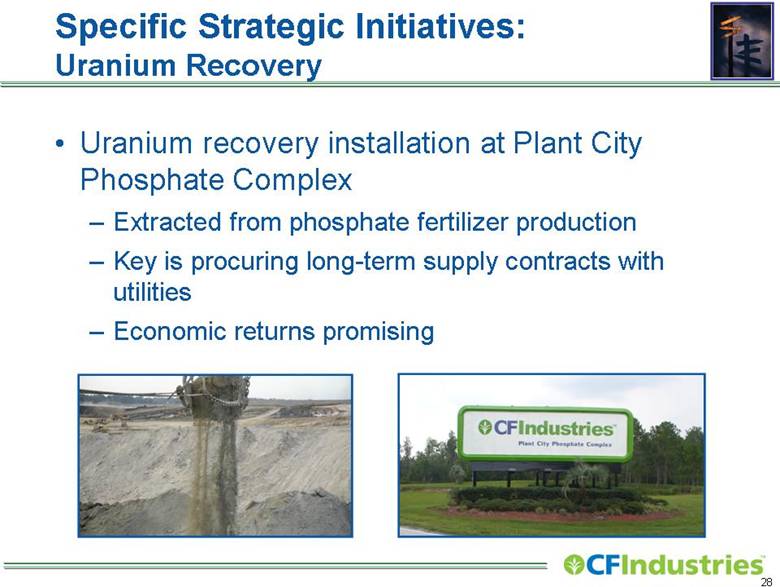
| Specific Strategic Initiatives: Uranium Recovery Uranium recovery installation at Plant City Phosphate Complex Extracted from phosphate fertilizer production Key is procuring long-term supply contracts with utilities Economic returns promising |
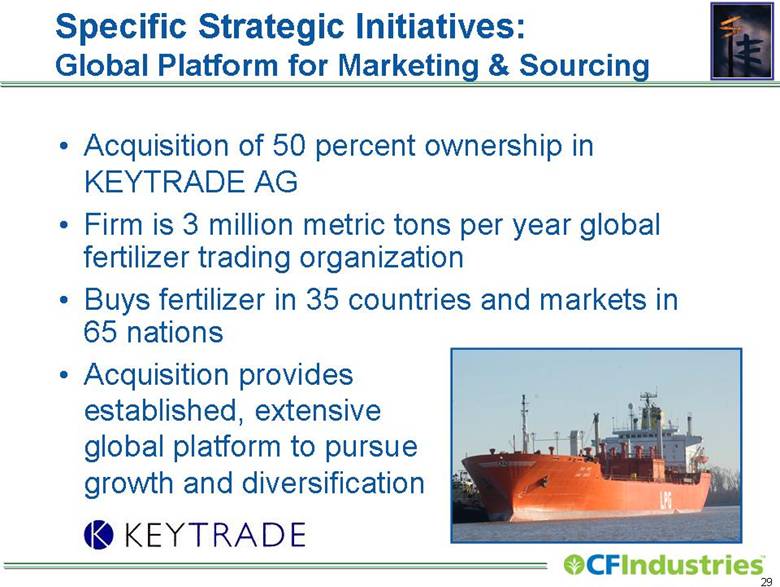
| Acquisition of 50 percent ownership in KEYTRADE AG Firm is 3 million metric tons per year global fertilizer trading organization Buys fertilizer in 35 countries and markets in 65 nations Acquisition provides established, extensive global platform to pursue growth and diversification Specific Strategic Initiatives: Global Platform for Marketing & Sourcing KEYTRADE |
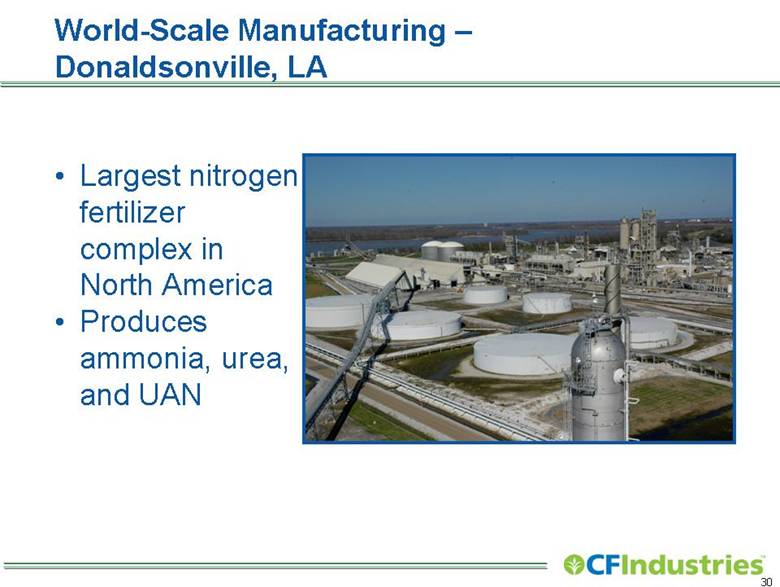
| World-Scale Manufacturing – Donaldsonville, LA Largest nitrogen fertilizer complex in North America Produces ammonia, urea, and UAN |
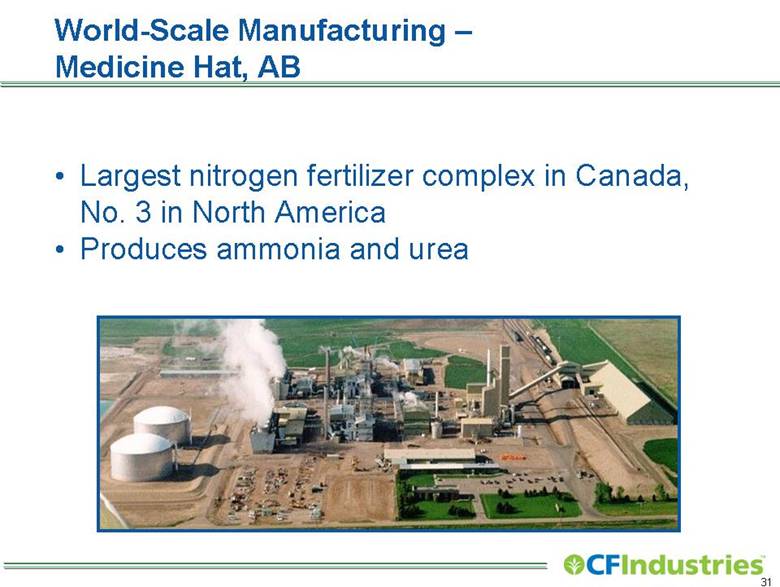
| World-Scale Manufacturing – Medicine Hat, AB Largest nitrogen fertilizer complex in Canada, No. 3 in North America Produces ammonia and urea |
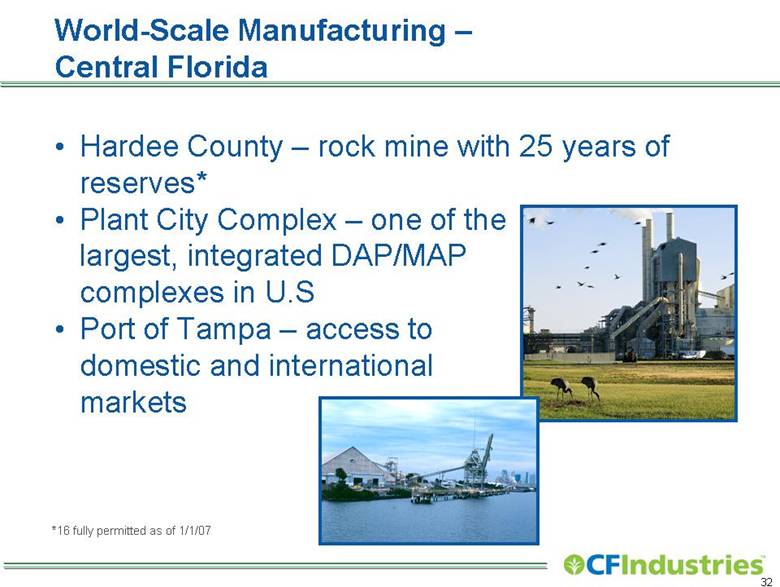
| World-Scale Manufacturing – Central Florida Hardee County – rock mine with 25 years of reserves* Plant City Complex – one of the largest, integrated DAP/MAP complexes in U.S Port of Tampa – access to domestic and international markets *16 fully permitted as of 1/1/07 |
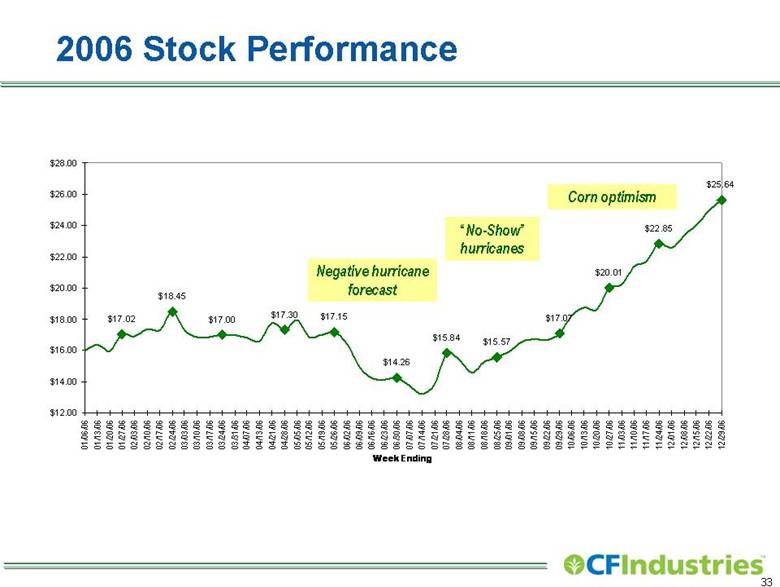
| 2006 Stock Performance Negative hurricane forecast “No-Show” hurricanes Corn optimism $25.64 $22.85 $20.01 $17.07 $15.57 $15.84 $14.26 $17.15 $17.30 $17.00 $18.45 $17.02 $12.00 $14.00 $16.00 $18.00 $20.00 $22.00 $24.00 $26.00 $28.00 01/06/06 01/13/06 01/20/06 01/27/06 02/03/06 02/10/06 02/17/06 02/24/06 03/03/06 03/10/06 03/17/06 03/24/06 03/31/06 04/07/06 04/13/06 04/21/06 04/28/06 05/05/06 05/12/06 05/19/06 05/26/06 06/02/06 06/09/06 06/16/06 06/23/06 06/30/06 07/07/06 07/14/06 07/21/06 07/28/06 08/04/06 08/11/06 08/18/06 08/25/06 09/01/06 09/08/06 09/15/06 09/22/06 09/29/06 10/06/06 10/13/06 10/20/06 10/27/06 11/03/06 11/10/06 11/17/06 11/24/06 12/01/06 12/08/06 12/15/06 12/22/06 12/29/06 Week Ending |
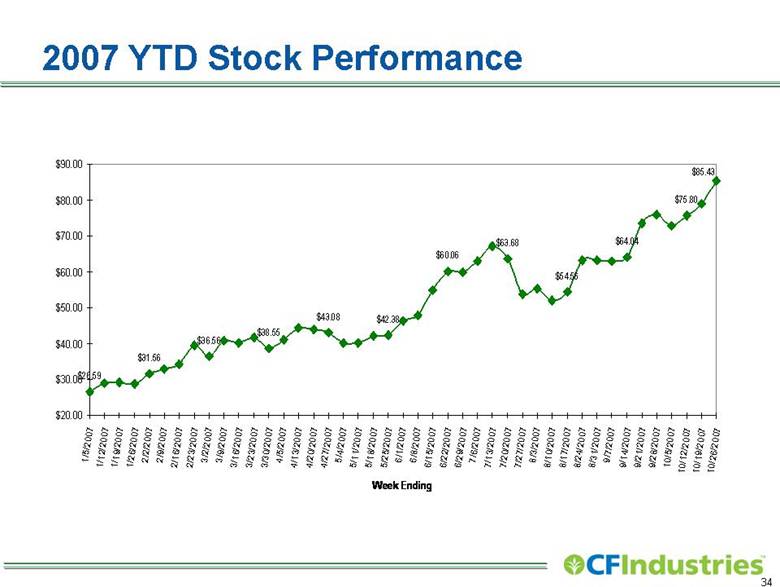
| 2007 YTD Stock Performance $85.43 $75.80 $26.59 $31.56 $36.56 $38.55 $43.08 $42.38 $60.06 $63.68 $54.56 $64.04 $20.00 $30.00 $40.00 $50.00 $60.00 $70.00 $80.00 $90.00 1/5/2007 1/12/2007 1/19/2007 1/26/2007 2/2/2007 2/9/2007 2/16/2007 2/23/2007 3/2/2007 3/9/2007 3/16/2007 3/23/2007 3/30/2007 4/5/2007 4/13/2007 4/20/2007 4/27/2007 5/4/2007 5/11/2007 5/18/2007 5/25/2007 6/1/2007 6/8/2007 6/15/2007 6/22/2007 6/29/2007 7/6/2007 7/13/2007 7/20/2007 7/27/2007 8/3/2007 8/10/2007 8/17/2007 8/24/2007 8/31/2007 9/7/2007 9/14/2007 9/21/2007 9/28/2007 10/5/2007 10/12/2007 10/19/2007 10/26/2007 Week Ending |
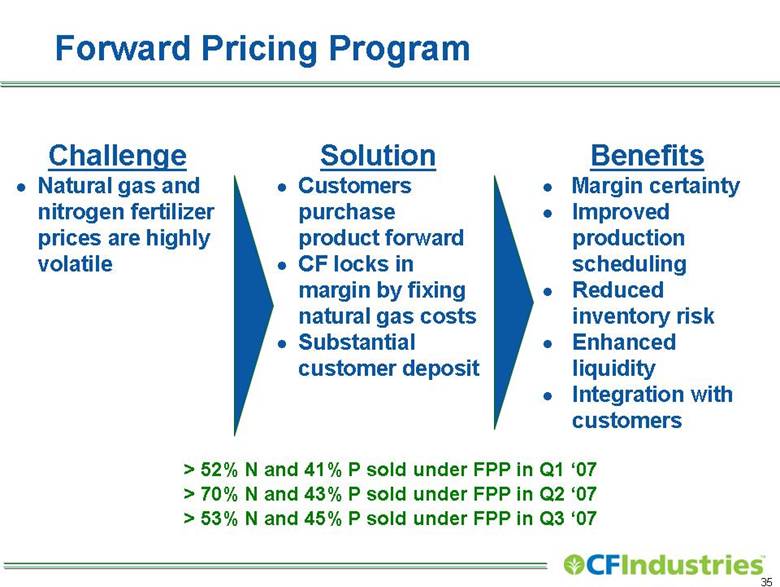
| Forward Pricing Program > 52% N and 41% P sold under FPP in Q1 ‘07 Challenge Natural gas and nitrogen fertilizer prices are highly volatile Benefits Margin certainty Improved production scheduling Reduced inventory risk Enhanced liquidity Integration with customers Solution Customers purchase product forward CF locks in margin by fixing natural gas costs Substantial customer deposit > 70% N and 43% P sold under FPP in Q2 ‘07 > 53% N and 45% P sold under FPP in Q3 ‘07 |