Exhibit 99.1
| 2014 Third Quarter Financial Results November 6, 2014 NYSE: CF |
| Safe Harbor Statement All statements in this communication, other than those relating to historical facts, are “forward-looking statements.” These forward-looking statements are not guarantees of future performance and are subject to a number of assumptions, risks and uncertainties, many of which are beyond our control, which could cause actual results to differ materially from such statements. These statements include, but are not limited to, statements about future strategic plans; and statements about future financial and operating results. Important factors that could cause actual results to differ materially from our expectations include, among others: the volatility of natural gas prices in North America; the cyclical nature of our business and the agricultural sector; the global commodity nature of our fertilizer products, the impact of global supply and demand on our selling prices, and the intense global competition from other fertilizer producers; conditions in the U.S. agricultural industry; reliance on third party providers of transportation services and equipment; risks associated with cyber security; weather conditions; our ability to complete our production capacity expansion projects on schedule as planned and on budget or at all; risks associated with other expansions of our business, including unanticipated adverse consequences and the significant resources that could be required; potential liabilities and expenditures related to environmental and health and safety laws and regulations; future regulatory restrictions and requirements related to greenhouse gas emissions; the seasonality of the fertilizer business; the impact of changing market conditions on our forward sales programs; risks involving derivatives and the effectiveness of our risk measurement and hedging activities; the significant risks and hazards involved in producing and handling our products against which we may not be fully insured; our reliance on a limited number of key facilities; risks associated with joint ventures; acts of terrorism and regulations to combat terrorism; difficulties in securing the supply and delivery of raw materials, increases in their costs or delays or interruptions in their delivery; risks associated with international operations; losses on our investments in securities; deterioration of global market and economic conditions; our ability to manage our indebtedness; and loss of key members of management and professional staff. More detailed information about factors that may affect our performance may be found in our filings with the Securities and Exchange Commission, including our most recent periodic reports filed on Form 10-K and Form 10-Q, which are available in the Investor Relations section of the CF Industries website. Forward-looking statements are given only as of the date of this release and we disclaim any obligation to update or revise the forward-looking statements, whether as a result of new information, future events or otherwise, except as required by law. 2 |
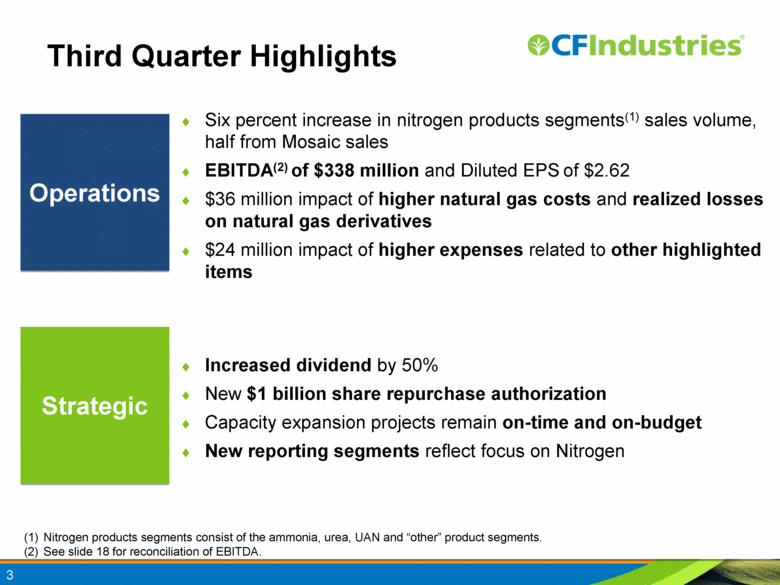
| 3 Increased dividend by 50% New $1 billion share repurchase authorization Capacity expansion projects remain on-time and on-budget New reporting segments reflect focus on Nitrogen Operations Strategic Nitrogen products segments consist of the ammonia, urea, UAN and “other” product segments. See slide 18 for reconciliation of EBITDA. Third Quarter Highlights Six percent increase in nitrogen products segments(1) sales volume, half from Mosaic sales EBITDA(2) of $338 million and Diluted EPS of $2.62 $36 million impact of higher natural gas costs and realized losses on natural gas derivatives $24 million impact of higher expenses related to other highlighted items |
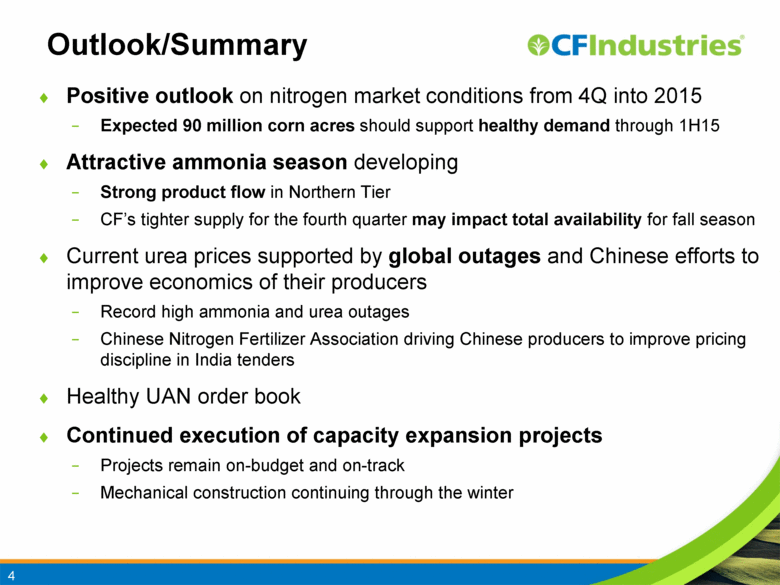
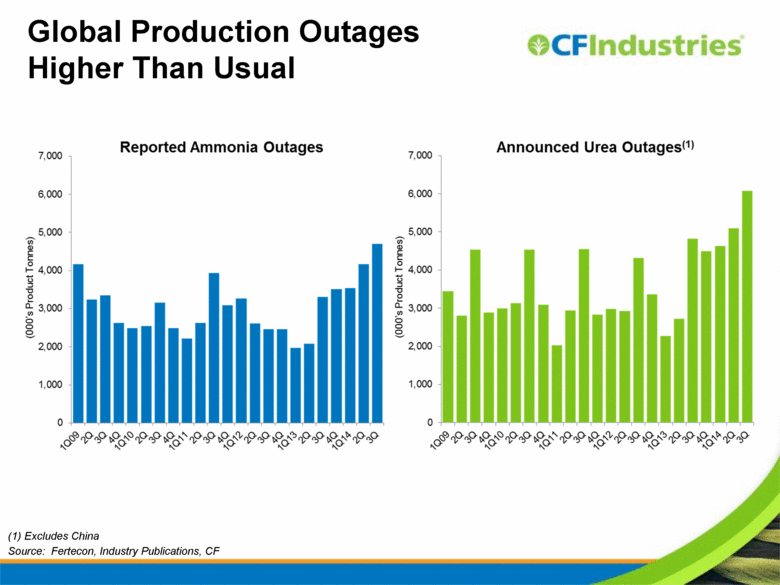
| Outlook/Summary 4 Positive outlook on nitrogen market conditions from 4Q into 2015 Expected 90 million corn acres should support healthy demand through 1H15 Attractive ammonia season developing Strong product flow in Northern Tier CF’s tighter supply for the fourth quarter may impact total availability for fall season Current urea prices supported by global outages and Chinese efforts to improve economics of their producers Record high ammonia and urea outages Chinese Nitrogen Fertilizer Association driving Chinese producers to improve pricing discipline in India tenders Healthy UAN order book Continued execution of capacity expansion projects Projects remain on-budget and on-track Mechanical construction continuing through the winter |
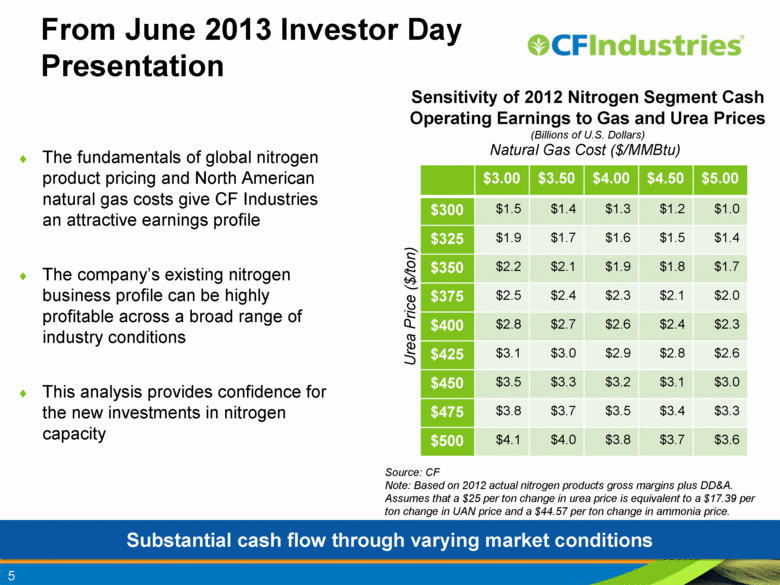
| 5 From June 2013 Investor Day Presentation Natural Gas Cost ($/MMBtu) Urea Price ($/ton) Sensitivity of 2012 Nitrogen Segment Cash Operating Earnings to Gas and Urea Prices (Billions of U.S. Dollars) $3.00 $3.50 $4.00 $4.50 $5.00 $300 $1.5 $1.4 $1.3 $1.2 $1.0 $325 $1.9 $1.7 $1.6 $1.5 $1.4 $350 $2.2 $2.1 $1.9 $1.8 $1.7 $375 $2.5 $2.4 $2.3 $2.1 $2.0 $400 $2.8 $2.7 $2.6 $2.4 $2.3 $425 $3.1 $3.0 $2.9 $2.8 $2.6 $450 $3.5 $3.3 $3.2 $3.1 $3.0 $475 $3.8 $3.7 $3.5 $3.4 $3.3 $500 $4.1 $4.0 $3.8 $3.7 $3.6 Source: CF Note: Based on 2012 actual nitrogen products gross margins plus DD&A. Assumes that a $25 per ton change in urea price is equivalent to a $17.39 per ton change in UAN price and a $44.57 per ton change in ammonia price. The fundamentals of global nitrogen product pricing and North American natural gas costs give CF Industries an attractive earnings profile The company’s existing nitrogen business profile can be highly profitable across a broad range of industry conditions This analysis provides confidence for the new investments in nitrogen capacity Substantial cash flow through varying market conditions |
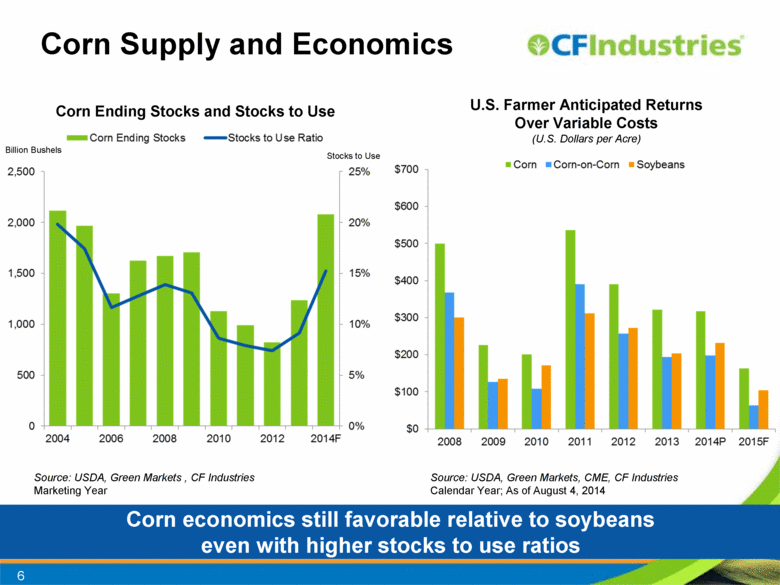
| Rest of World North America 6 Corn economics still favorable relative to soybeans even with higher stocks to use ratios Corn Supply and Economics Corn Ending Stocks and Stocks to Use U.S. Farmer Anticipated Returns Over Variable Costs (U.S. Dollars per Acre) Source: USDA, Green Markets, CME, CF Industries Calendar Year; As of August 4, 2014 Source: USDA, Green Markets , CF Industries Marketing Year Billion Bushels Stocks to Use |
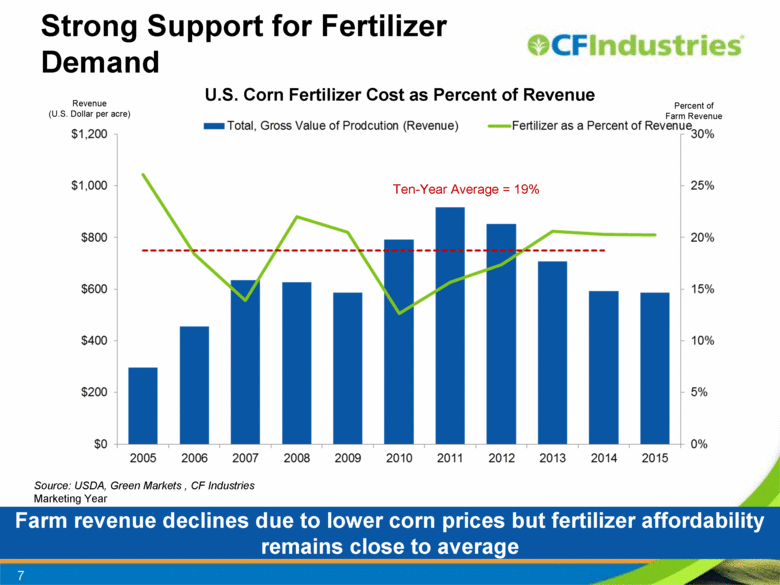
| Rest of World North America 7 Farm revenue declines due to lower corn prices but fertilizer affordability remains close to average Strong Support for Fertilizer Demand Source: USDA, Green Markets , CF Industries Marketing Year Revenue (U.S. Dollar per acre) Ten-Year Average = 19% U.S. Corn Fertilizer Cost as Percent of Revenue Percent of Farm Revenue |
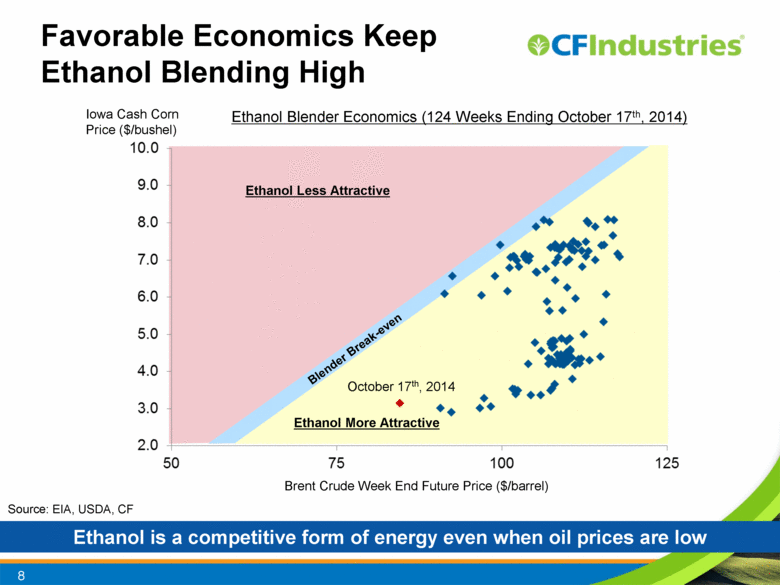
| Favorable Economics Keep Ethanol Blending High 8 Ethanol is a competitive form of energy even when oil prices are low Brent Crude Week End Future Price ($/barrel) Source: EIA, USDA, CF Iowa Cash Corn Price ($/bushel) Ethanol Blender Economics (124 Weeks Ending October 17th, 2014) Blender Break-even Ethanol More Attractive Ethanol Less Attractive October 17th, 2014 |
| Global Production Outages Higher Than Usual (1) Excludes China Source: Fertecon, Industry Publications, CF |
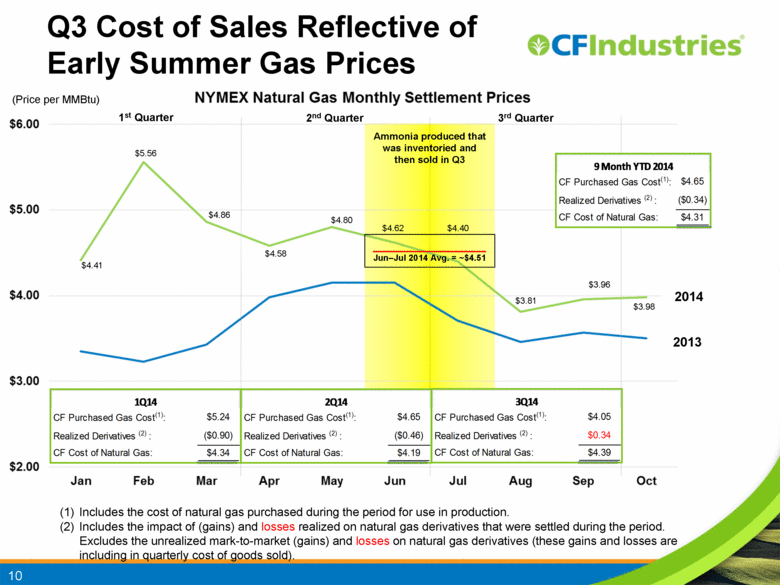
| Q3 Cost of Sales Reflective of Early Summer Gas Prices 10 Jun–Jul 2014 Avg. = ~$4.51 Ammonia produced that was inventoried and then sold in Q3 Includes the cost of natural gas purchased during the period for use in production. Includes the impact of (gains) and losses realized on natural gas derivatives that were settled during the period. Excludes the unrealized mark-to-market (gains) and losses on natural gas derivatives (these gains and losses are including in quarterly cost of goods sold). (Price per MMBtu) 1st Quarter 2nd Quarter 3rd Quarter 2014 2013 $4.41 $5.56 $4.86 $4.58 $4.80 $4.62 $4.40 $3.81 $3.96 $3.98 |
| (Price per MMBtu) 1st Quarter 2nd Quarter 3rd Quarter $4.41 $5.56 $4.86 $4.58 $4.80 $4.62 $4.40 $3.81 $3.96 $3.98 75% hedged at $3.66 50% hedged at $3.55 90% hedged with collars between $4.25 and $4.60 4th Quarter-to-date $3.73 Representative Derivative Gain/Loss Positions 11 Includes the cost of natural gas purchased during the period for use in production. Includes the impact of (gains) and losses realized on natural gas derivatives that were settled during the period. Excludes the unrealized mark-to-market (gains) and losses on natural gas derivatives (these gains and losses are including in quarterly cost of goods sold). $56M $28M ($20M) 90% hedged with collars between $3.41 and $4.25 through March, 2015 |
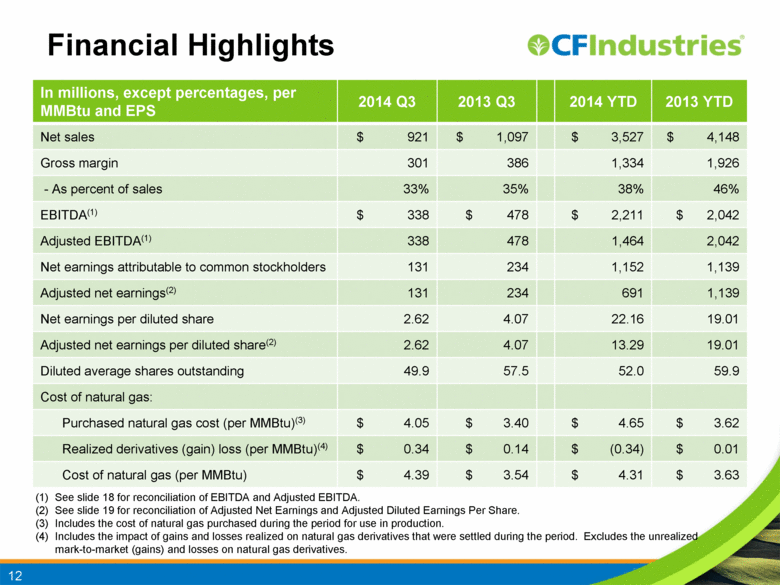
| Financial Highlights In millions, except percentages, per MMBtu and EPS 2014 Q3 2013 Q3 2014 YTD 2013 YTD Net sales $ 921 $ 1,097 $ 3,527 $ 4,148 Gross margin 301 386 1,334 1,926 - As percent of sales 33% 35% 38% 46% EBITDA(1) $ 338 $ 478 $ 2,211 $ 2,042 Adjusted EBITDA(1) 338 478 1,464 2,042 Net earnings attributable to common stockholders 131 234 1,152 1,139 Adjusted net earnings(2) 131 234 691 1,139 Net earnings per diluted share 2.62 4.07 22.16 19.01 Adjusted net earnings per diluted share(2) 2.62 4.07 13.29 19.01 Diluted average shares outstanding 49.9 57.5 52.0 59.9 Cost of natural gas: Purchased natural gas cost (per MMBtu)(3) $ 4.05 $ 3.40 $ 4.65 $ 3.62 Realized derivatives (gain) loss (per MMBtu)(4) $ 0.34 $ 0.14 $ (0.34) $ 0.01 Cost of natural gas (per MMBtu) $ 4.39 $ 3.54 $ 4.31 $ 3.63 See slide 18 for reconciliation of EBITDA and Adjusted EBITDA. See slide 19 for reconciliation of Adjusted Net Earnings and Adjusted Diluted Earnings Per Share. Includes the cost of natural gas purchased during the period for use in production. Includes the impact of gains and losses realized on natural gas derivatives that were settled during the period. Excludes the unrealized mark-to-market (gains) and losses on natural gas derivatives. 12 |
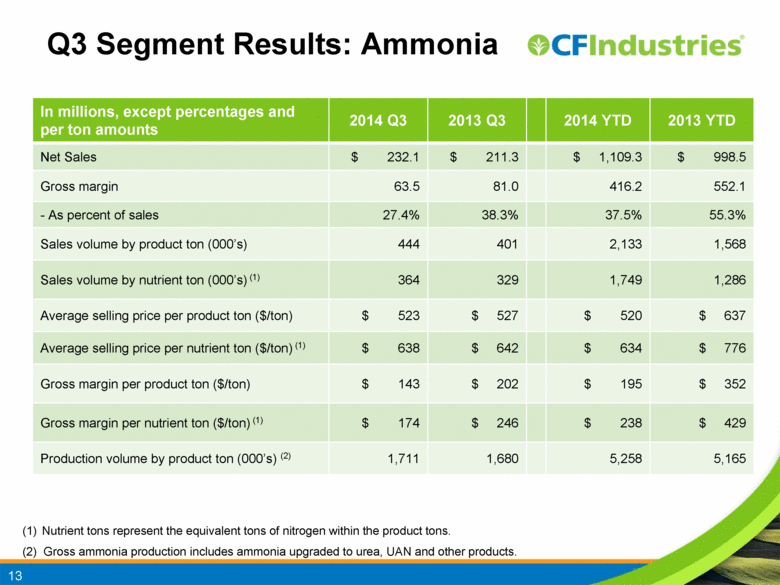
| Q3 Segment Results: Ammonia In millions, except percentages and per ton amounts 2014 Q3 2013 Q3 2014 YTD 2013 YTD Net Sales $ 232.1 $ 211.3 $ 1,109.3 $ 998.5 Gross margin 63.5 81.0 416.2 552.1 - As percent of sales 27.4% 38.3% 37.5% 55.3% Sales volume by product ton (000’s) 444 401 2,133 1,568 Sales volume by nutrient ton (000’s) (1) 364 329 1,749 1,286 Average selling price per product ton ($/ton) $ 523 $ 527 $ 520 $ 637 Average selling price per nutrient ton ($/ton) (1) $ 638 $ 642 $ 634 $ 776 Gross margin per product ton ($/ton) $ 143 $ 202 $ 195 $ 352 Gross margin per nutrient ton ($/ton) (1) $ 174 $ 246 $ 238 $ 429 Production volume by product ton (000’s) (2) 1,711 1,680 5,258 5,165 13 Nutrient tons represent the equivalent tons of nitrogen within the product tons. (2) Gross ammonia production includes ammonia upgraded to urea, UAN and other products. |
| Q3 Segment Results: Urea 14 Nutrient tons represent the equivalent tons of nitrogen within the product tons. In millions, except percentages and per ton amounts 2014 Q3 2013 Q3 2014 YTD 2013 YTD Net Sales $ 199.6 $ 185.3 $ 683.4 $ 720.0 Gross margin 78.9 84.7 305.3 395.6 - As percent of sales 39.5% 45.7% 44.7% 54.9% Sales volume by product ton (000’s) 558 548 1,813 1,895 Sales volume by nutrient ton (000’s) (1) 257 252 834 872 Average selling price per product ton ($/ton) $ 358 $ 338 $ 377 $ 380 Average selling price per nutrient ton ($/ton) (1) $ 777 $ 735 $ 819 $ 826 Gross margin per product ton ($/ton) $ 141 $ 155 $ 168 $ 209 Gross margin per nutrient ton ($/ton) (1) $ 307 $ 336 $ 366 $ 454 Production volume by product ton (000’s) 565 580 1,757 1,818 |
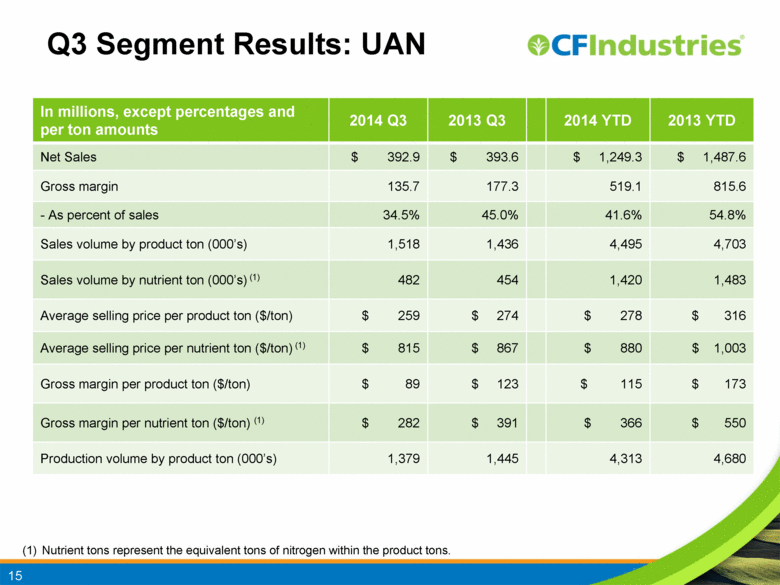
| Q3 Segment Results: UAN 15 Nutrient tons represent the equivalent tons of nitrogen within the product tons. In millions, except percentages and per ton amounts 2014 Q3 2013 Q3 2014 YTD 2013 YTD Net Sales $ 392.9 $ 393.6 $ 1,249.3 $ 1,487.6 Gross margin 135.7 177.3 519.1 815.6 - As percent of sales 34.5% 45.0% 41.6% 54.8% Sales volume by product ton (000’s) 1,518 1,436 4,495 4,703 Sales volume by nutrient ton (000’s) (1) 482 454 1,420 1,483 Average selling price per product ton ($/ton) $ 259 $ 274 $ 278 $ 316 Average selling price per nutrient ton ($/ton) (1) $ 815 $ 867 $ 880 $ 1,003 Gross margin per product ton ($/ton) $ 89 $ 123 $ 115 $ 173 Gross margin per nutrient ton ($/ton) (1) $ 282 $ 391 $ 366 $ 550 Production volume by product ton (000’s) 1,379 1,445 4,313 4,680 |
| Q3 Segment Results: Other* 16 * Other Segment includes: ammonium nitrate (AN); diesel exhaust fluid (DEF); and urea liquor. Nutrient tons represent the equivalent tons of nitrogen within the product tons. In millions, except percentages and per ton amounts 2014 Q3 2013 Q3 2014 YTD 2013 YTD Net Sales $ 96.8 $ 86.1 $ 316.3 $ 293.0 Gross margin 23.0 15.4 83.5 89.9 - As percent of sales 23.8% 17.9% 26.4% 30.7% Sales volume by product ton (000’s) 427 396 1,314 1,219 Sales volume by nutrient ton (000’s) (1) 117 107 362 334 Average selling price per product ton ($/ton) $ 227 $ 217 $ 241 $ 240 Average selling price per nutrient ton ($/ton) (1) $ 827 $ 805 $ 874 $ 877 Gross margin per product ton ($/ton) $ 54 $ 39 $ 64 $ 74 Gross margin per nutrient ton ($/ton) (1) $ 197 $ 144 $ 231 $ 269 |
| For more information, please visit www.cfindustries.com |
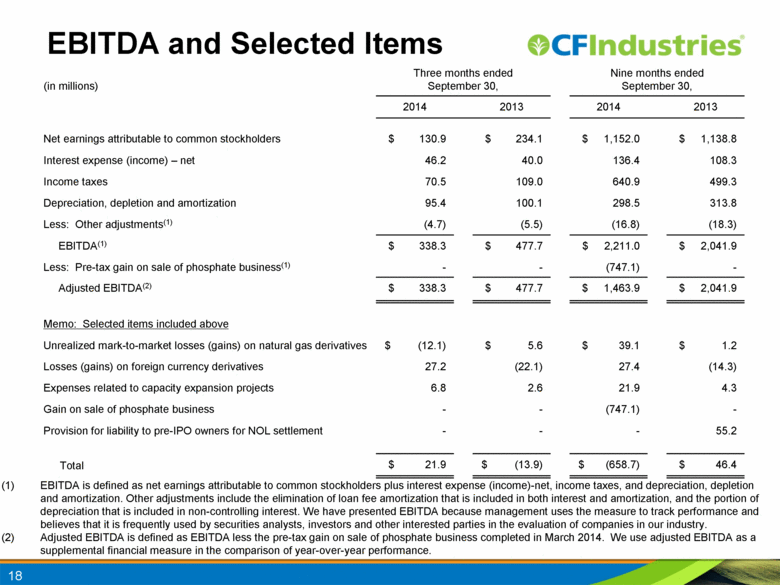
| EBITDA and Selected Items 18 (in millions) Three months ended September 30, Nine months ended September 30, 2014 2013 2014 2013 Net earnings attributable to common stockholders $ 130.9 $ 234.1 $ 1,152.0 $ 1,138.8 Interest expense (income) – net 46.2 40.0 136.4 108.3 Income taxes 70.5 109.0 640.9 499.3 Depreciation, depletion and amortization 95.4 100.1 298.5 313.8 Less: Other adjustments(1) (4.7) (5.5) (16.8) (18.3) EBITDA(1) $ 338.3 $ 477.7 $ 2,211.0 $ 2,041.9 Less: Pre-tax gain on sale of phosphate business(1) - - (747.1) - Adjusted EBITDA(2) $ 338.3 $ 477.7 $ 1,463.9 $ 2,041.9 Memo: Selected items included above Unrealized mark-to-market losses (gains) on natural gas derivatives $ (12.1) $ 5.6 $ 39.1 $ 1.2 Losses (gains) on foreign currency derivatives 27.2 (22.1) 27.4 (14.3) Expenses related to capacity expansion projects 6.8 2.6 21.9 4.3 Gain on sale of phosphate business - - (747.1) - Provision for liability to pre-IPO owners for NOL settlement - - - 55.2 Total $ 21.9 $ (13.9) $ (658.7) $ 46.4 EBITDA is defined as net earnings attributable to common stockholders plus interest expense (income)-net, income taxes, and depreciation, depletion and amortization. Other adjustments include the elimination of loan fee amortization that is included in both interest and amortization, and the portion of depreciation that is included in non-controlling interest. We have presented EBITDA because management uses the measure to track performance and believes that it is frequently used by securities analysts, investors and other interested parties in the evaluation of companies in our industry. Adjusted EBITDA is defined as EBITDA less the pre-tax gain on sale of phosphate business completed in March 2014. We use adjusted EBITDA as a supplemental financial measure in the comparison of year-over-year performance. |
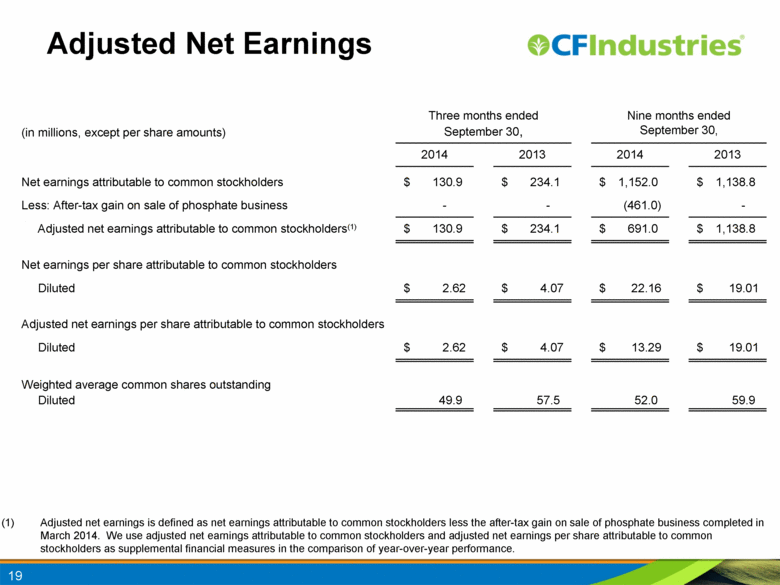
| Adjusted Net Earnings Adjusted net earnings is defined as net earnings attributable to common stockholders less the after-tax gain on sale of phosphate business completed in March 2014. We use adjusted net earnings attributable to common stockholders and adjusted net earnings per share attributable to common stockholders as supplemental financial measures in the comparison of year-over-year performance. (in millions, except per share amounts) Three months ended September 30, Nine months ended September 30, 2014 2013 2014 2013 Net earnings attributable to common stockholders $ 130.9 $ 234.1 $ 1,152.0 $ 1,138.8 Less: After-tax gain on sale of phosphate business - - (461.0) - Adjusted net earnings attributable to common stockholders(1) $ 130.9 $ 234.1 $ 691.0 $ 1,138.8 Net earnings per share attributable to common stockholders Diluted $ 2.62 $ 4.07 $ 22.16 $ 19.01 Adjusted net earnings per share attributable to common stockholders Diluted $ 2.62 $ 4.07 $ 13.29 $ 19.01 Weighted average common shares outstanding Diluted 49.9 57.5 52.0 59.9 19 |
| Donaldsonville – November 2014 20 Ammonia 3,640 TPD Urea 3,850 TPD UAN 5,050 TPD Urea Warehouse 90K Tons Ammonia Tank 30K Tons UAN Tank 50K Tons Urea Barge Dock |
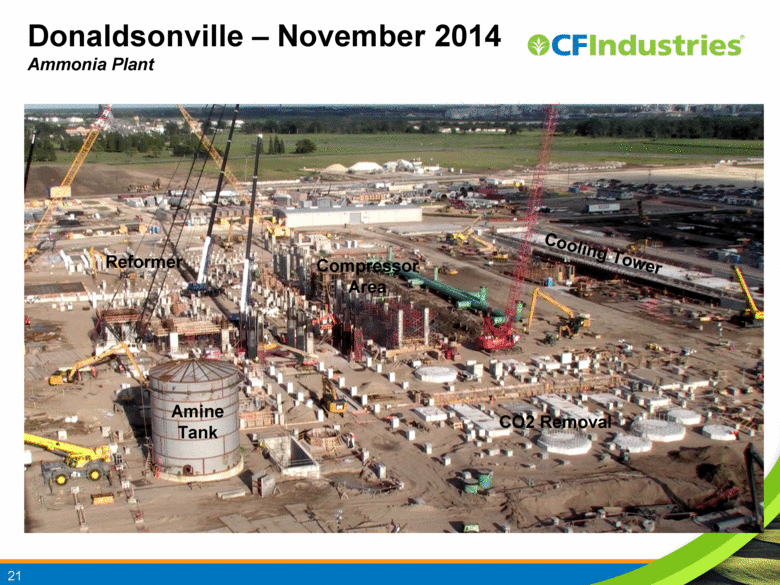
| Donaldsonville – November 2014 Ammonia Plant 21 Reformer Compressor Area Cooling Tower Amine Tank CO2 Removal |
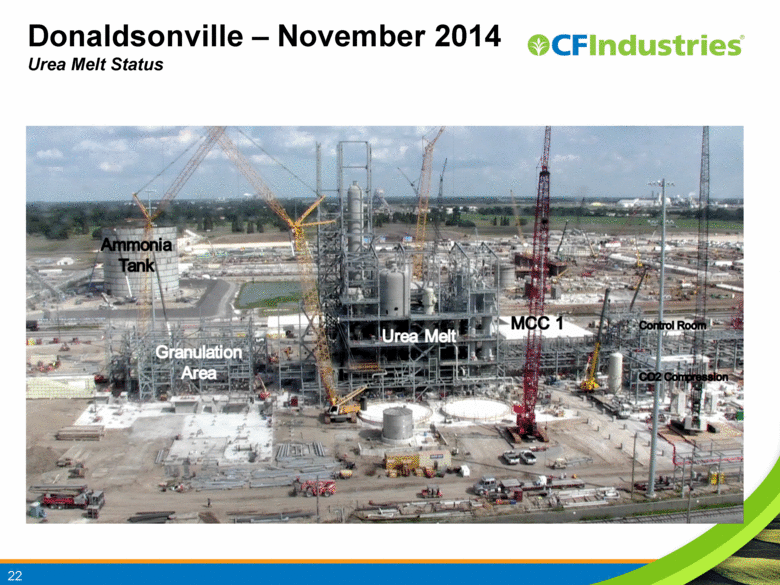
| Donaldsonville – November 2014 Urea Melt Status 22 |
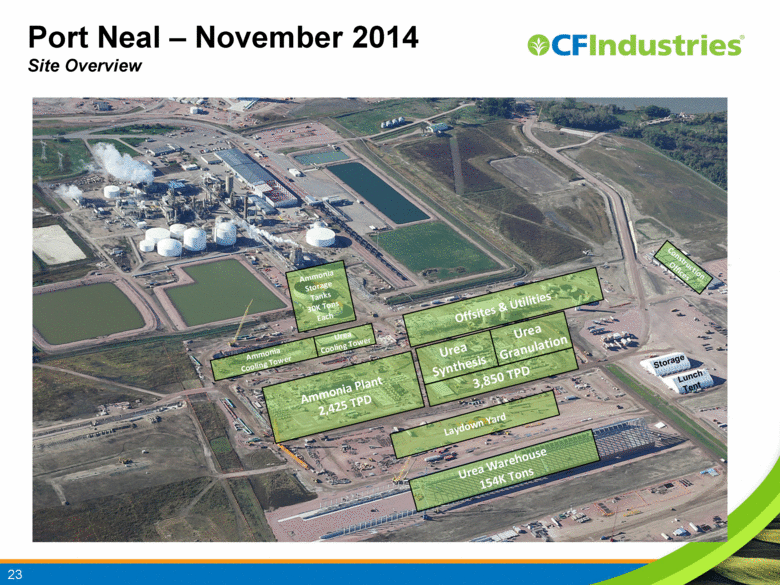
| Port Neal – November 2014 Site Overview 23 Urea Warehouse 154K Tons Laydown Yard Urea Granulation Ammonia Plant 2,425 TPD Ammonia Cooling Tower Urea Cooling Tower Ammonia Storage Tanks 30K Tons Each Offsites & Utilities Lunch Tent Storage Construction Offices |
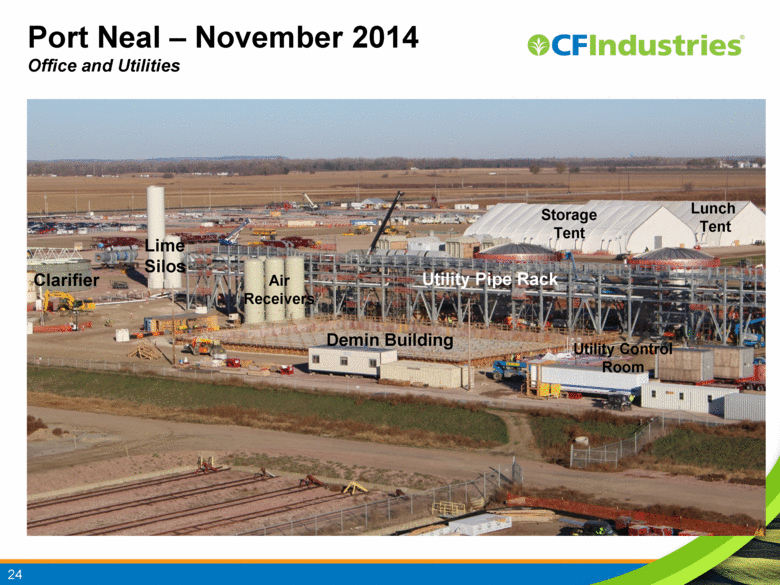
| Port Neal – November 2014 Office and Utilities 24 Air Receivers Demin Building Utility Control Room Storage Tent Lunch Tent Lime Silos Utility Pipe Rack Clarifier |
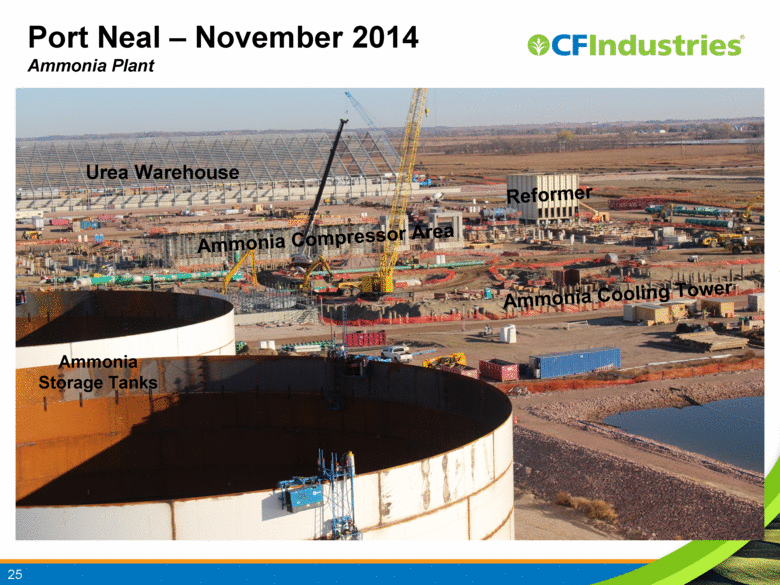
| Port Neal – November 2014 Ammonia Plant 25 Ammonia Compressor Area Reformer Urea Warehouse Ammonia Cooling Tower Ammonia Storage Tanks |
