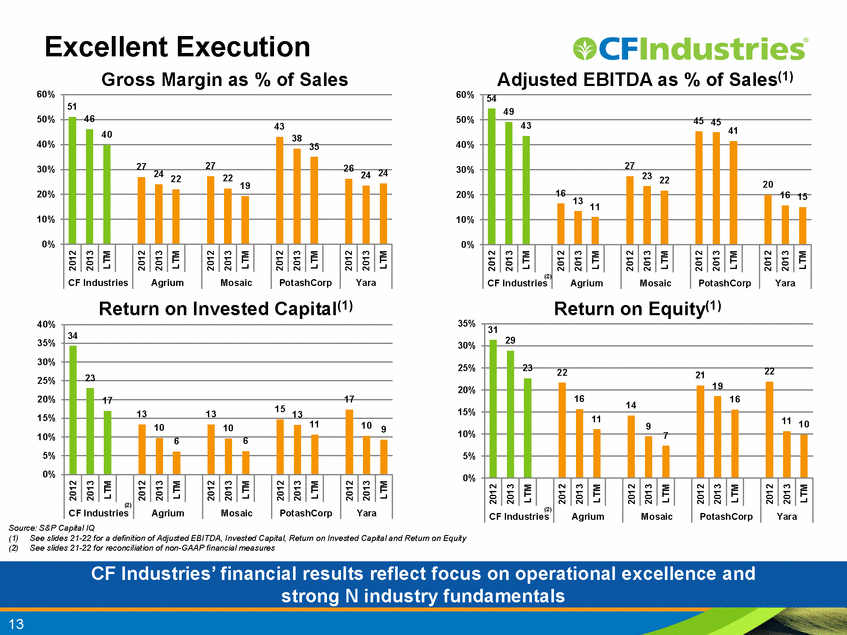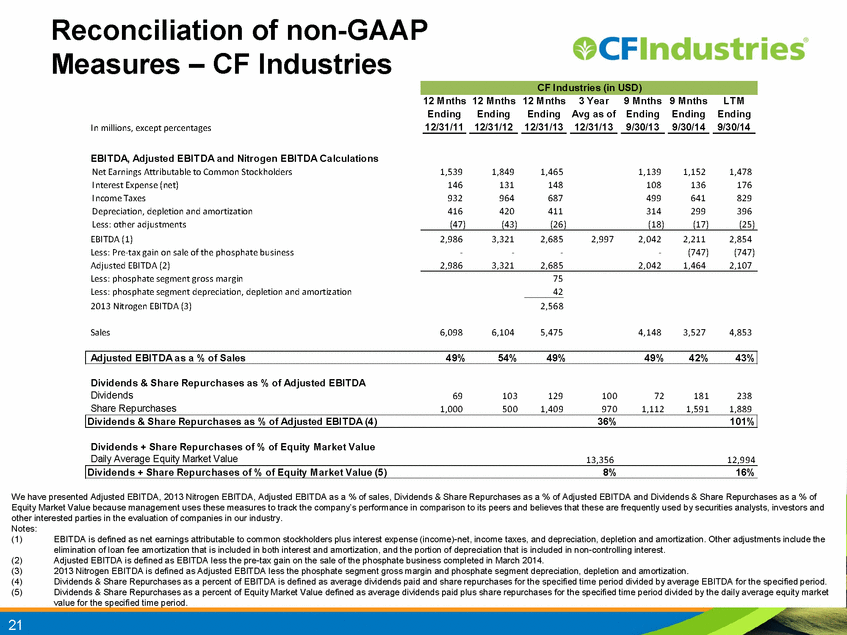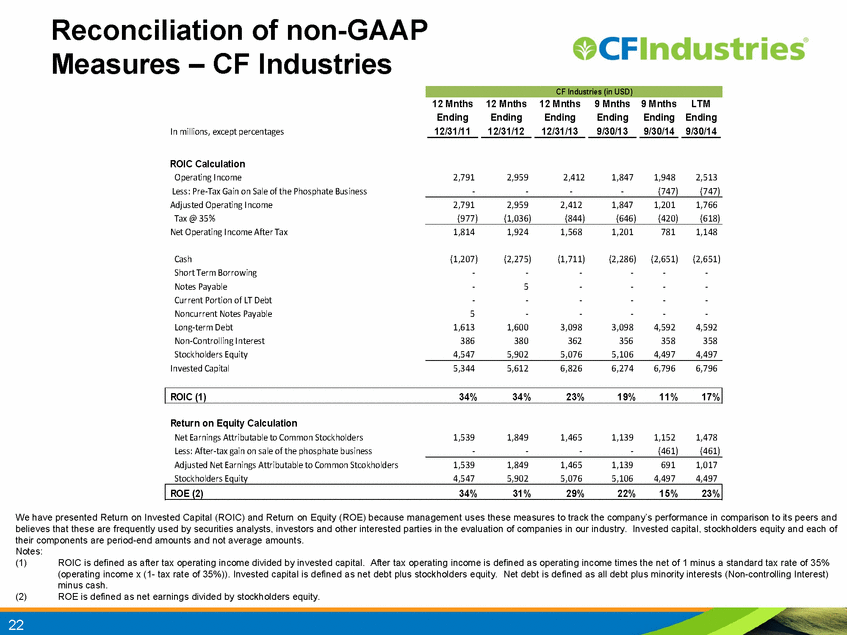
| Reconciliation of non-GAAP Measures – CF Industries 22 We have presented Return on Invested Capital (ROIC) and Return on Equity (ROE) because management uses these measures to track the company’s performance in comparison to its peers and believes that these are frequently used by securities analysts, investors and other interested parties in the evaluation of companies in our industry. Invested capital, stockholders equity and each of their components are period-end amounts and not average amounts. Notes: (1) ROIC is defined as after tax operating income divided by invested capital. After tax operating income is defined as operating income times the net of 1 minus a standard tax rate of 35% (operating income x (1- tax rate of 35%)). Invested capital is defined as net debt plus stockholders equity. Net debt is defined as all debt plus minority interests (Non-controlling Interest) minus cash. (2) ROE is defined as net earnings divided by stockholders equity. 12 Mnths 12 Mnths 12 Mnths 9 Mnths 9 Mnths LTM Ending Ending Ending Ending Ending Ending In millions, except percentages 12/31/11 12/31/12 12/31/13 9/30/13 9/30/14 9/30/14 ROIC Calculation Operating Income 2,791 2,959 2,412 1,847 1,948 2,513 Less: Pre-Tax Gain on Sale of the Phosphate Business - - - - (747) (747) Adjusted Operating Income 2,791 2,959 2,412 1,847 1,201 1,766 Tax @ 35% (977) (1,036) (844) (646) (420) (618) Net Operating Income After Tax 1,814 1,924 1,568 1,201 781 1,148 Cash (1,207) (2,275) (1,711) (2,286) (2,651) (2,651) Short Term Borrowing - - - - - - Notes Payable - 5 - - - - Current Portion of LT Debt - - - - - - Noncurrent Notes Payable 5 - - - - - Long-term Debt 1,613 1,600 3,098 3,098 4,592 4,592 Non-Controlling Interest 386 380 362 356 358 358 Stockholders Equity 4,547 5,902 5,076 5,106 4,497 4,497 Invested Capital 5,344 5,612 6,826 6,274 6,796 6,796 ROIC (1) 34% 34% 23% 19% 11% 17% Return on Equity Calculation Net Earnings Attributable to Common Stockholders 1,539 1,849 1,465 1,139 1,152 1,478 Less: After-tax gain on sale of the phosphate business - - - - (461) (461) Adjusted Net Earnings Attributable to Common Stcokholders 1,539 1,849 1,465 1,139 691 1,017 Stockholders Equity 4,547 5,902 5,076 5,106 4,497 4,497 ROE (2) 34% 31% 29% 22% 15% 23% CF Industries (in USD) |
