22001178TThhirirddQQuuaarrteterr FFininaanncciaial lRReessuultlsts November 1, 2017 October 31, 2018 NYSE: CF NYSE: CF 1

Safe harbor statement All statements in this communication by CF Industries Holdings, Inc. (together with its subsidiaries, the “Company”), other than those relating to historical facts, are forward-looking statements. Forward-looking statements can generally be identified by their use of terms such as “anticipate,” “believe,” “could,” “estimate,” “expect,” “intend,” “may,” “plan,” “predict,” “project,” “will” or “would” and similar terms and phrases, including references to assumptions. Forward-looking statements are not guarantees of future performance and are subject to a number of assumptions, risks and uncertainties, many of which are beyond the Company’s control, which could cause actual results to differ materially from such statements. These statements may include, but are not limited to, statements about strategic plans and statements about future financial and operating results. Important factors that could cause actual results to differ materially from those in the forward-looking statements include, among others, the cyclical nature of the Company’s business and the agricultural sector; the global commodity nature of the Company’s fertilizer products, the impact of global supply and demand on the Company’s selling prices, and the intense global competition from other fertilizer producers; conditions in the U.S. and European agricultural industry; the volatility of natural gas prices in North America and Europe; difficulties in securing the supply and delivery of raw materials, increases in their costs or delays or interruptions in their delivery; reliance on third party providers of transportation services and equipment; the significant risks and hazards involved in producing and handling the Company’s products against which the Company may not be fully insured; the Company’s ability to manage its indebtedness; operating and financial restrictions imposed on the Company by the agreements governing the Company’s senior secured indebtedness; risks associated with the Company’s incurrence of additional indebtedness; the Company's ability to maintain compliance with covenants under the agreements governing its indebtedness; downgrades of the Company’s credit ratings; risks associated with cyber security; weather conditions; risks associated with changes in tax laws and disagreements with taxing authorities; the Company’s reliance on a limited number of key facilities; potential liabilities and expenditures related to environmental, health and safety laws and regulations and permitting requirements; future regulatory restrictions and requirements related to greenhouse gas emissions; risks associated with expansions of the Company’s business, including unanticipated adverse consequences and the significant resources that could be required; the seasonality of the fertilizer business; the impact of changing market conditions on the Company’s forward sales programs; risks involving derivatives and the effectiveness of the Company’s risk measurement and hedging activities; risks associated with the operation or management of the strategic venture with CHS Inc. (the "CHS Strategic Venture"), risks and uncertainties relating to the market prices of the fertilizer products that are the subject of the supply agreement with CHS Inc. over the life of the supply agreement and the risk that any challenges related to the CHS Strategic Venture will harm the Company's other business relationships; risks associated with the Company’s Point Lisas Nitrogen Limited joint venture; acts of terrorism and regulations to combat terrorism; risks associated with international operations; and deterioration of global market and economic conditions. More detailed information about factors that may affect the Company’s performance and could cause actual results to differ materially from those in any forward-looking statements may be found in CF Industries Holdings, Inc.’s filings with the Securities and Exchange Commission, including CF Industries Holdings, Inc.’s most recent annual and quarterly reports on Form 10-K and Form 10-Q, which are available in the Investor Relations section of the Company’s website. Forward-looking statements are given only as of the date of this presentation and the Company disclaims any obligation to update or revise the forward-looking statements, whether as a result of new information, future events or otherwise, except as required by law. 2
Note regarding non-GAAP financial measures The company reports its financial results in accordance with U.S. generally accepted accounting principles (GAAP). Management believes that EBITDA and adjusted EBITDA which are non-GAAP financial measures, provide additional meaningful information regarding the company's performance and financial strength. Non-GAAP financial measures should be viewed in addition to, and not as an alternative for, the company's reported results prepared in accordance with GAAP. In addition, because not all companies use identical calculations, EBITDA and adjusted EBITDA included in this presentation may not be comparable to similarly titled measures of other companies. Reconciliations of EBITDA and adjusted EBITDA to the most directly comparable GAAP measures are provided in the tables accompanying this presentation. EBITDA is defined as net earnings (loss) attributable to common stockholders plus interest expense - net, income taxes, and depreciation and amortization. Other adjustments include the elimination of loan fee amortization that is included in both interest and amortization, and the portion of depreciation that is included in noncontrolling interests. The company has presented EBITDA because management uses the measure to track performance and believes that it is frequently used by securities analysts, investors and other interested parties in the evaluation of companies in the industry. Adjusted EBITDA is defined as EBITDA adjusted with the selected items included in EBITDA as summarized in the tables accompanying this presentation. The company has presented adjusted EBITDA because management uses adjusted EBITDA, and believes it is useful to investors, as a supplemental financial measure in the comparison of year-over-year performance. 3
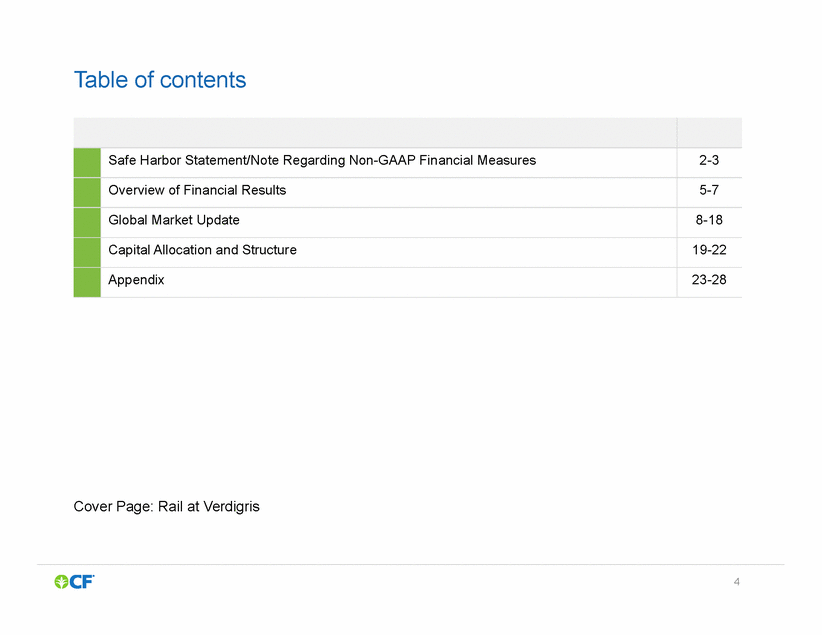
Table of contents Cover Page: Rail at Verdigris 4 Safe Harbor Statement/Note Regarding Non-GAAP Financial Measures 2-3 Overview of Financial Results 5-7 Global Market Update 8-18 Capital Allocation and Structure 19-22 Appendix 23-28
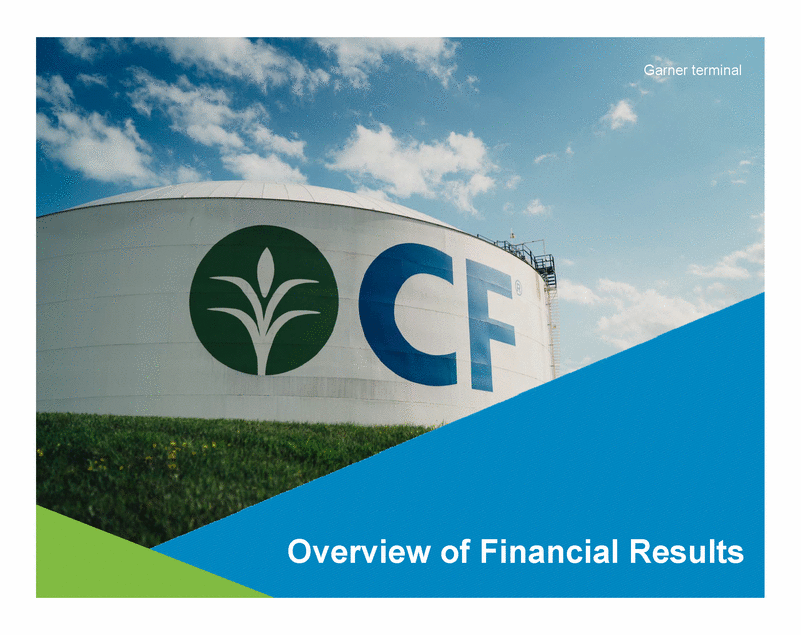
Garner terminal Overview of Financial Results 5
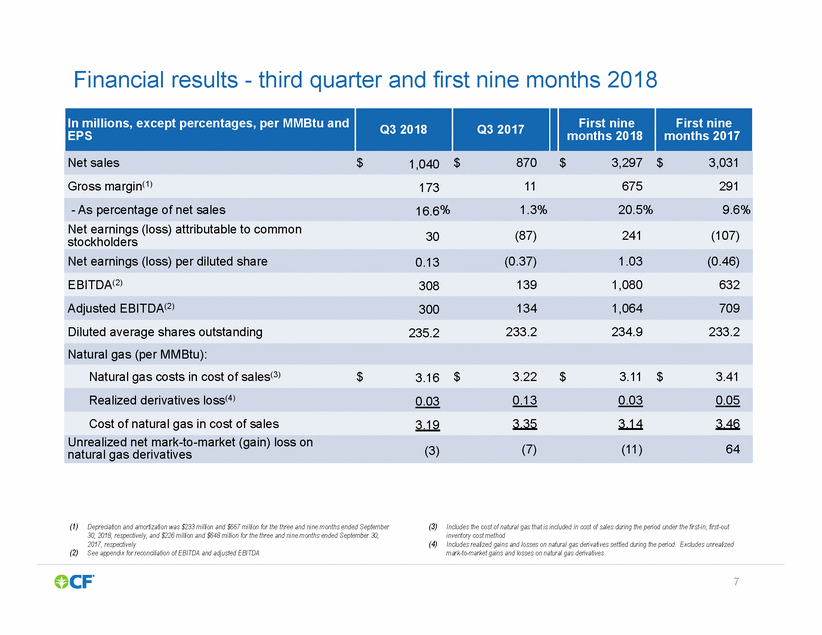
Third quarter and first nine months 2018 results • Q3 net earnings of $30 million; EBITDA(1) of $308 million and adjusted EBITDA(1) of $300 million Nine month net earnings of $241 million; EBITDA(1) of $1,080 million and adjusted EBITDA(1) of $1,064 million CF added $294 million of cash to the balance sheet during Q3; $1 billion cash on balance sheet as of September 30, 2018 Repurchased ~3 million shares through October 31, 2018 for ~$150 million • • • • Net sales were 20% higher for Q3 and 9% higher for first nine months of 2018 due primarily to higher average selling prices across all segments compared to 2017 Total sales volume for Q3 and first nine months 2018 slightly lower than 2017 Higher global nitrogen prices in 2018 driven by higher energy costs in Asia and Europe, continued enforcement of environmental regulations in China Cost of sales in the first nine months of 2018 decreased compared to the same period in 2017 driven by lower realized gas costs partially offset by higher costs related to increased turnaround and maintenance activity • • • • As of September 30, 2018, the 12-month rolling average recordable incident rate was 0.67 incidents per 200,000 work hours Compared to 2017, gross ammonia production was 1% lower at 2.5 million tons in Q3 2018, and 3% lower at 7.4 million tons for first nine months 2018 due to increased turnaround and maintenance activity • (1) See appendix for reconciliation of EBITDA and adjusted EBITDA 6 Safe and Efficient Operations Commercial Environment Financial Overview

Financial results - third quarter and first nine months 2018 months 2017 (87) 241 (107) 30 stockholders (7) (11) 64 (3) natural gas derivatives (1) Depreciation and amortization was $233 million and $667 million for the three and nine months ended September 30, 2018, respectively, and $226 million and $648 million for the three and nine months ended September 30, 2017, respectively (2) See appendix for reconciliation of EBITDA and adjusted EBITDA (3) (4) Includes the cost of natural gas that is included in cost of sales during the period under the first-in, first-out inventory cost method Includes realized gains and losses on natural gas derivatives settled during the period. Excludes unrealized mark-to-market gains and losses on natural gas derivatives 7 In millions, except percentages, per MMBtu and EPS Q3 2018 Q3 2017 First nine months 2018 First nine Net sales$1,040$870$3,297$3,031 Gross margin(1)17311675291 - As percentage of net sales16.6%1.3%20.5%9.6% Net earnings (loss) attributable to common Net earnings (loss) per diluted share0.13(0.37)1.03(0.46) EBITDA(2)3081391,080632 Adjusted EBITDA(2)3001341,064709 Diluted average shares outstanding235.2233.2234.9233.2 Natural gas (per MMBtu): Natural gas costs in cost of sales(3)$3.16$3.22$3.11$3.41 Realized derivatives loss(4)0.030.130.030.05 Cost of natural gas in cost of sales3.193.353.143.46 Unrealized net mark-to-market (gain) loss on
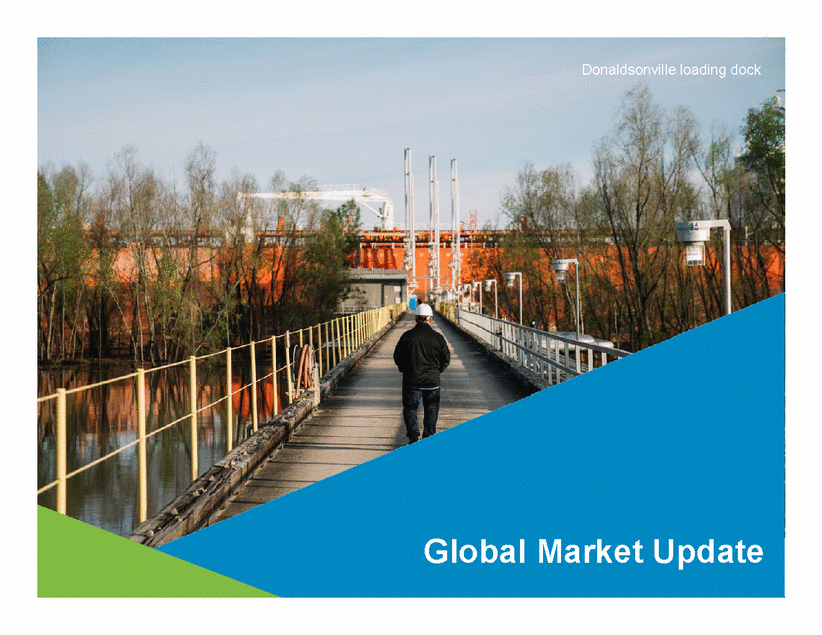
Donaldsonville loading dock Global Market Update 8
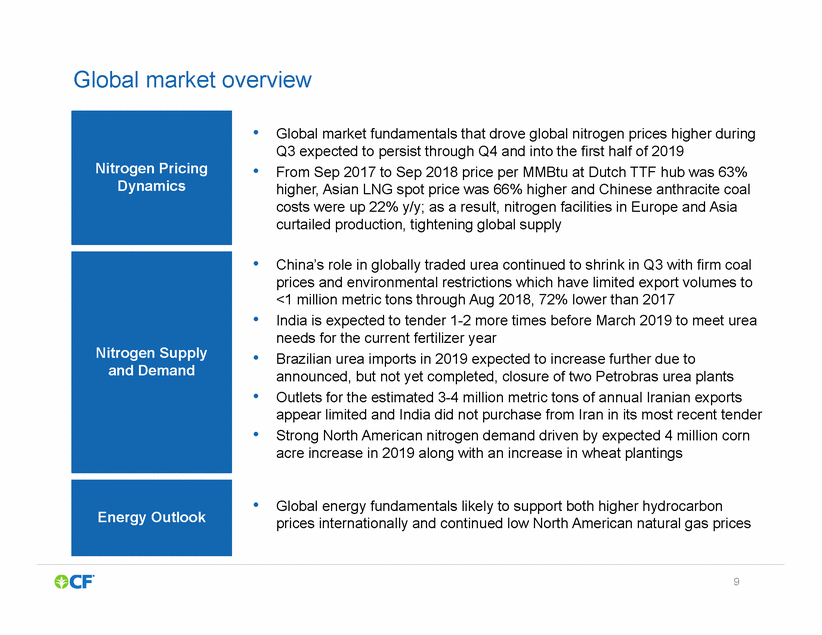
Global market overview • Global market fundamentals that drove global nitrogen prices higher during Q3 expected to persist through Q4 and into the first half of 2019 From Sep 2017 to Sep 2018 price per MMBtu at Dutch TTF hub was 63% higher, Asian LNG spot price was 66% higher and Chinese anthracite coal costs were up 22% y/y; as a result, nitrogen facilities in Europe and Asia curtailed production, tightening global supply • • China’s role in globally traded urea continued to shrink in Q3 with firm coal prices and environmental restrictions which have limited export volumes to <1 million metric tons through Aug 2018, 72% lower than 2017 India is expected to tender 1-2 more times before March 2019 to meet urea needs for the current fertilizer year Brazilian urea imports in 2019 expected to increase further due to announced, but not yet completed, closure of two Petrobras urea plants Outlets for the estimated 3-4 million metric tons of annual Iranian exports appear limited and India did not purchase from Iran in its most recent tender Strong North American nitrogen demand driven by expected 4 million corn acre increase in 2019 along with an increase in wheat plantings • • • • • Global energy fundamentals likely to support both higher hydrocarbon prices internationally and continued low North American natural gas prices 9 Energy Outlook Nitrogen Supply and Demand Nitrogen Pricing Dynamics
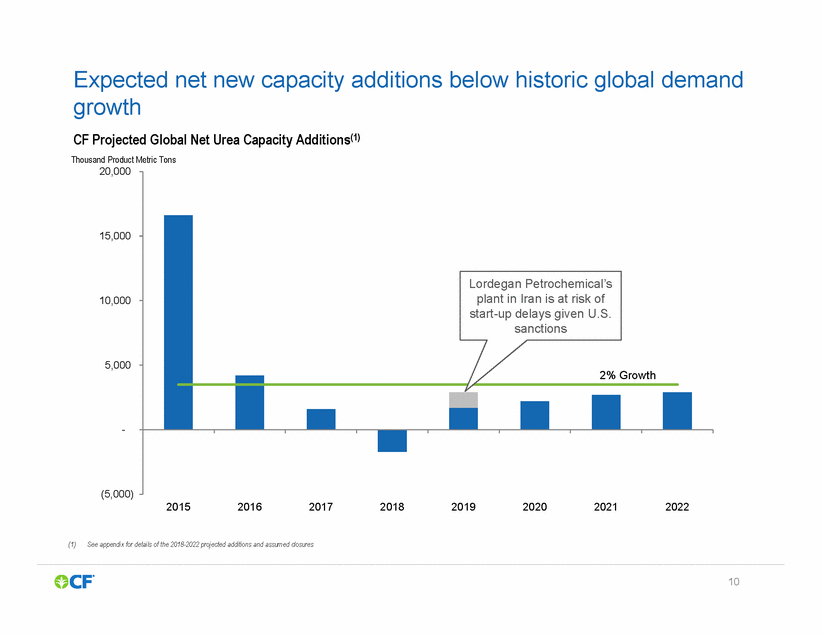
Expected net new capacity additions growth CF Projected Global Net Urea Capacity Additions(1) Thousand Product Metric Tons below historic global demand 20,000 15,000 10,000 5,000 2% Growth - (5,000) 2015 2016 2017 2018 2019 2020 2021 2022 (1)See appendix for details of the 2018-2022 projected additions and assumed closures 10 Lordegan Petrochemical’s plant in Iran is at risk of start-up delays given U.S. sanctions
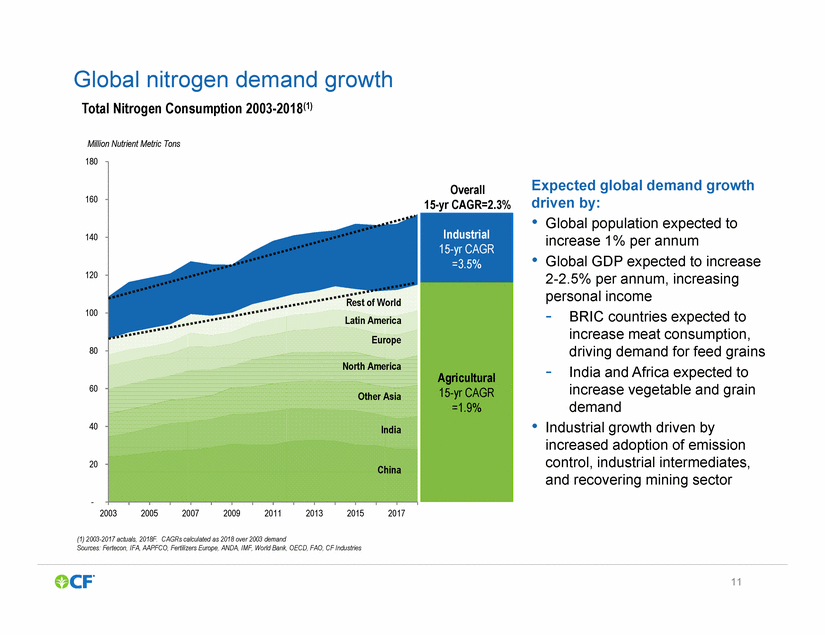
Global nitrogen demand Total Nitrogen Consumption 2003-2018(1) growth Million Nutrient Metric Tons 180 Expected global demand growth driven by: 160 • Global population expected to increase 1% per annum Global GDP expected to increase 2-2.5% per annum, increasing personal income 140 • 120 - 100 BRIC countries expected to increase meat consumption, driving demand for feed grains India and Africa expected to increase vegetable and grain demand 80 - 60 • Industrial growth driven by increased adoption of emission control, industrial intermediates, and recovering mining sector 40 20 - 2003 2005 2007 2009 2011 2013 2015 2017 (1) 2003-2017 actuals, 2018F. CAGRs calculated as 2018 over 2003 demand Sources: Fertecon, IFA, AAPFCO, Fertilizers Europe, ANDA, IMF, World Bank, OECD, FAO, CF Industries 11 Overall 15-yr CAGR=2.3% Rest of World Latin America Europe North America Other Asia India China Industrial 15-yr CAGR =3.5% Agricultural 15-yr CAGR =1.9%
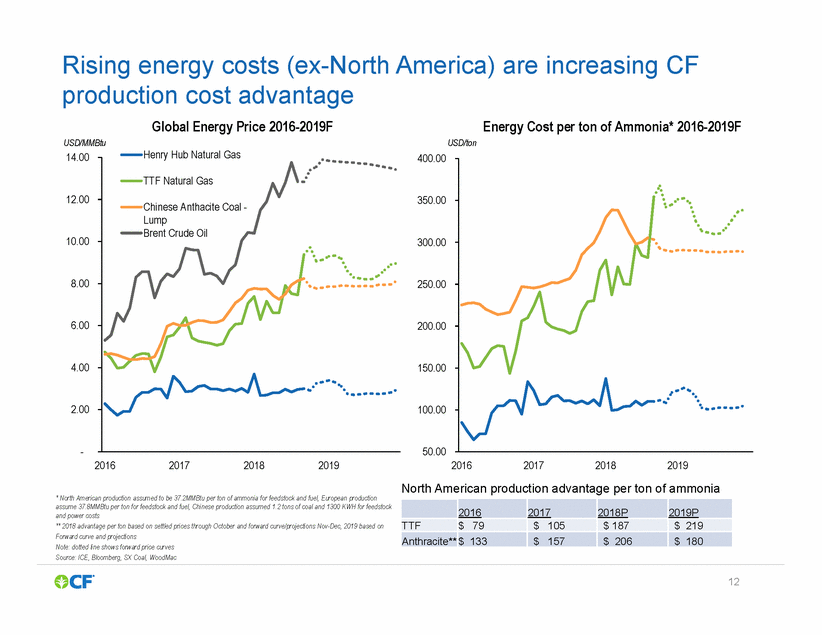
Rising energy costs (ex-North production cost advantage Global Energy Price 2016-2019F USD/MMBtu America) are increasing CF Energy Cost per ton of Ammonia* 2016-2019F USD/ton Henry Hub Natural Gas 14.00 400.00 12.00 350.00 10.00 300.00 8.00 250.00 6.00 200.00 4.00 150.00 2.00 100.00 - 50.00 2016 2017 2018 2019 2016 2017 2018 2019 North American production advantage per ton of ammonia * North American production assumed to be 37.2MMBtu per ton of ammonia for feedstock and fuel, European production assume 37.8MMBtu per ton for feedstock and fuel, Chinese production assumed 1.2 tons of coal and 1300 KWH for feedstock and power costs ** 2018 advantage per ton based on settled prices through October and forward curve/projections Nov-Dec, 2019 based on Forward curve and projections Note: dotted line shows forward price curves Source: ICE, Bloomberg, SX Coal, WoodMac 12 2016 2017 2018P 2019P TTF $ 79 $ 105 $ 187 $ 219 Anthracite** $ 133 $ 157 $ 206 $ 180 TTF Natural Gas Chinese Anthacite Coal - Lump Brent Crude Oil
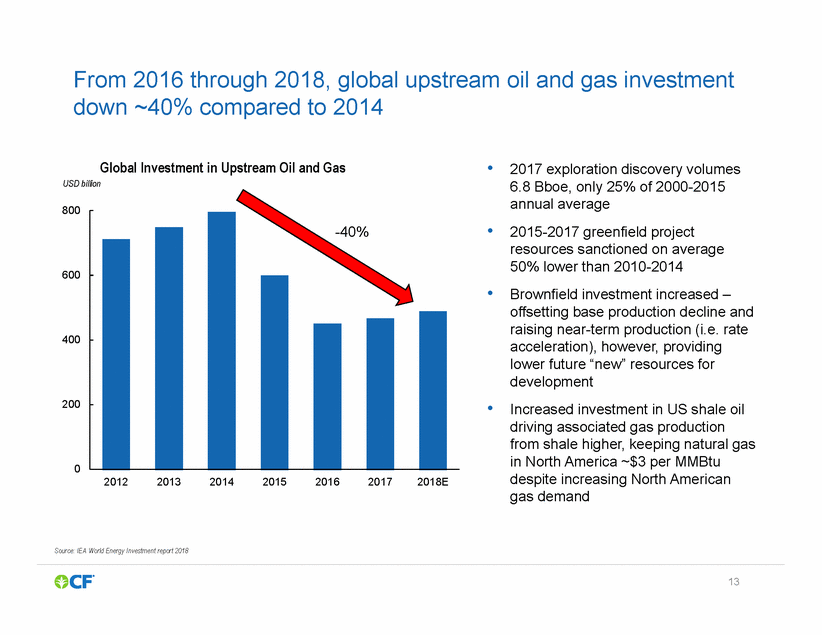
From 2016 through 2018, global down ~40% compared to 2014 upstream oil and gas investment • Global Investment in Upstream Oil and Gas USD billion 2017 exploration discovery volumes 6.8 Bboe, only 25% of 2000-2015 annual average 2015-2017 greenfield project resources sanctioned on average 50% lower than 2010-2014 Brownfield investment increased – offsetting base production decline and raising near-term production (i.e. rate acceleration), however, providing lower future “new” resources for development Increased investment in US shale oil driving associated gas production from shale higher, keeping natural gas in North America ~$3 per MMBtu despite increasing North American gas demand 800 • 600 • 400 200 • 0 2012 2013 2014 2015 2016 2017 2018E Source: IEA World Energy Investment report 2018 13 -40%
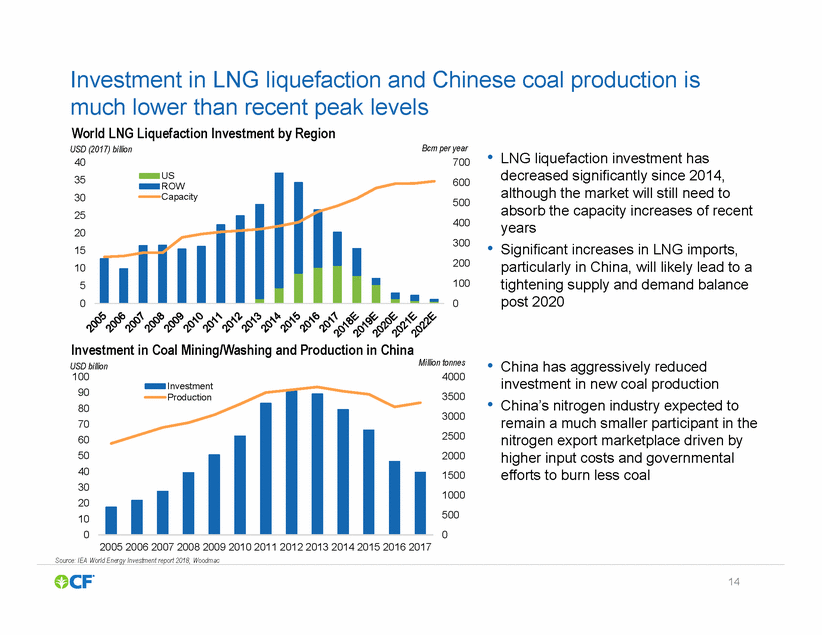
Investment in LNG liquefaction and Chinese coal production is much lower than recent peak World LNG Liquefaction Investment by Region USD (2017) billion 40 levels Bcm per year 700 600 • LNG liquefaction investment has decreased significantly since 2014, although the market will still need to absorb the capacity increases of recent years Significant increases in LNG imports, particularly in China, will likely lead to a tightening supply and demand balance post 2020 35 30 25 20 15 10 5 0 500 400 300 200 100 0 • Investment in Coal Mining/Washing and Production in China USD billion 100 • Million tonnes 4000 China has aggressively reduced investment in new coal production China’s nitrogen industry expected to remain a much smaller participant in the nitrogen export marketplace driven by higher input costs and governmental efforts to burn less coal Investment 90 80 70 60 50 40 30 20 10 0 3500 3000 2500 2000 1500 1000 500 0 • 2005 2006 2007 2008 2009 2010 2011 2012 2013 2014 2015 2016 2017 Source: IEA World Energy Investment report 2018, Woodmac 14 Production US ROW Capacity
2019 estimated cost curve – based on October 2018 inputs 2019 Monthly Delivered U.S. Gulf Urea Cost Curve Y-axis: USD/short ton, X-axis: Monthly Production Capacity at 95% Operating Rate, million short tons Shipments: 16.5 MM ST Avg $400 Monthly Range 300 200 100 (N.G.) 0 Russia South Latin Southeast North America MENA India China - Natural Gas Low 5 10 Eastern Europe 0 0 Asia America Asia China - Advanced Coastal Indonesia China - Advanced Inland Low China - cite High China - Other FSU Western Europe China - Advanced Inland High Lithuania China - Natural Gas High Anthracite Low Ukraine Source: Industry Publications, Fertecon, CRU, Integer, Argus, ICIS, PIRA, Bloomberg, CF 15 Appx. Appx. 2019 Price Range: $260-310 Freight Other Cash Energy (Coal) Energy 2 nthra A 15
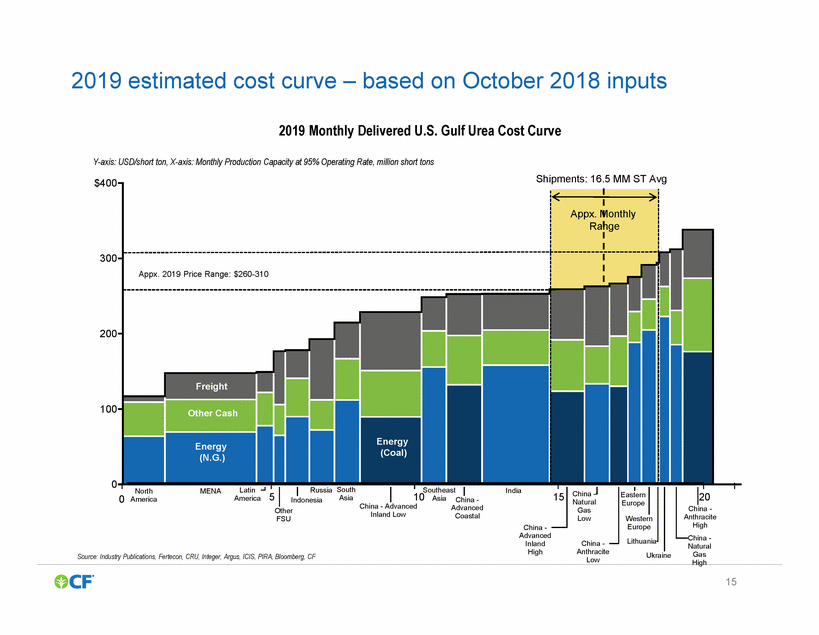
2019 cost curve assumptions – as of October 2018 Gas Prices ($/Mmbtu) 76 Brent Crude NYMEX 56 73 Thermal 65 SX Coal / 6.82 7.05 RMB/USD Bloomberg Composite Notes: Market prices updated as of 10/24/2018; Coal prices as of 10/15/2018 * 2018E represents assumptions from November 2017 forecast cost curve 2 Annual Average Energy Cost LocationSource2018E* 2019F Henry HubNYMEX3.032.87 TTFICE6.018.48 WEU-RussiaOil Index5.467.69 Oil ($/Bbl) China Coal ($/tonne) Anthracite PowderWoodmac116116 Anthracite135170 Exchange Rates USD/EURBloomberg Composite1.211.19 USD/GBPBloomberg Composite1.331.32

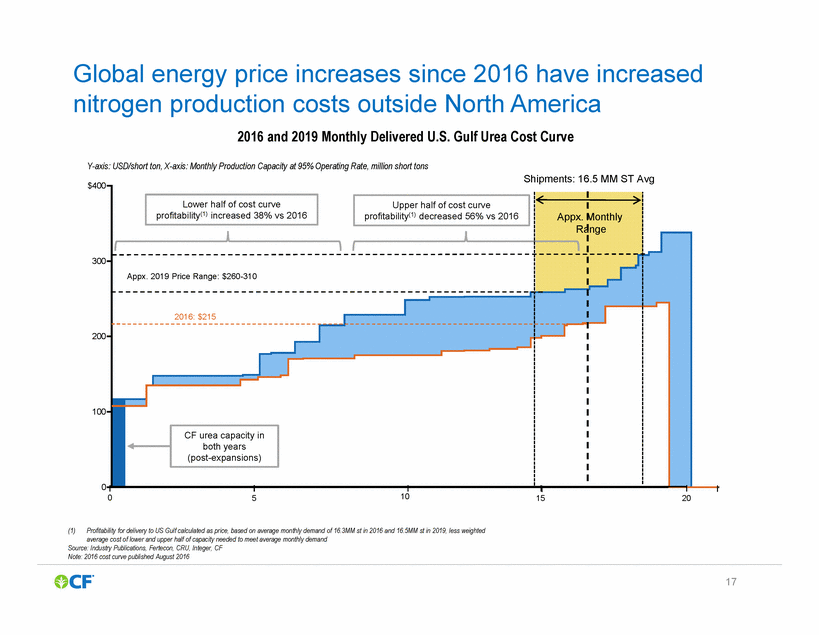
Global energy price increases since 2016 have increased nitrogen production costs outside North America 2016 and 2019 Monthly Delivered U.S. Gulf Urea Cost Curve Y-axis: USD/short ton, X-axis: Monthly Production Capacity at 95% Operating Rate, million short tons Shipments: 16.5 MM ST Avg $400 Lower half of cost curve profitability(1) increased 38% vs 2016 Upper half of cost curve profitability(1) decreased 56% vs 2016 Appx. Monthly 300 Appx. 2019 Price Range: $260-310 200 100 capacity in ears 0 10 0 5 15 20 (1)Profitability for delivery to US Gulf calculated as price, based on average monthly demand of 16.3MM st in 2016 and 16.5MM st in 2019, less weighted average cost of lower and upper half of capacity needed to meet average monthly demand Source: Industry Publications, Fertecon, CRU, Integer, CF Note: 2016 cost curve published August 2016 17 Ra nge 2016: $215 CF urea both y (post-expansi ons)
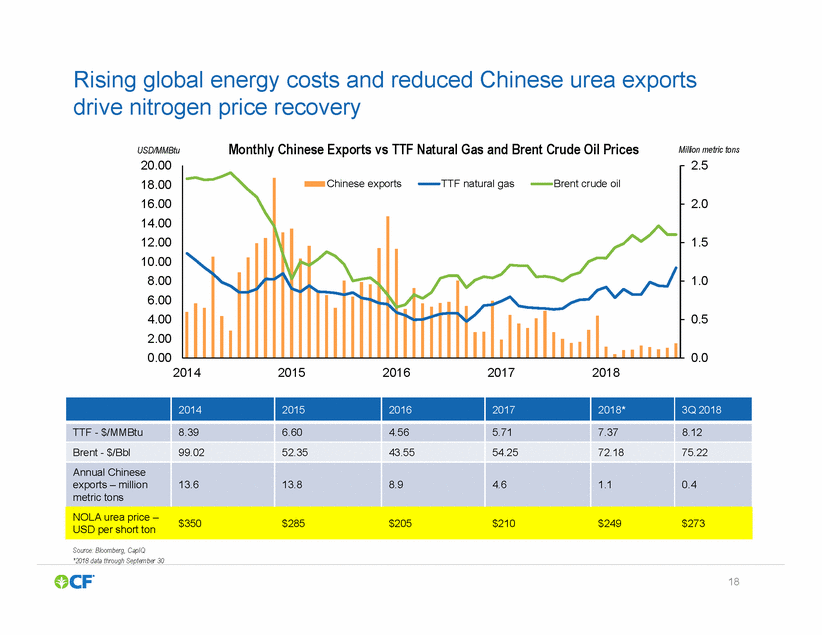
Rising global energy costs and reduced Chinese urea exports drive nitrogen price recovery Monthly Chinese Exports vs TTF Natural Gas and Brent Crude Oil Prices Million metric tons USD/MMBtu 20.00 18.00 16.00 14.00 12.00 10.00 8.00 6.00 4.00 2.00 0.00 2.5 2.0 1.5 1.0 0.5 0.0 2014 2015 2016 2017 2018 $350 $285 $205 $210 $249 $273 USD per short ton Source: Bloomberg, CapIQ *2018 data through September 30 18 2014 2015 2016 2017 2018* 3Q 2018 TTF - $/MMBtu 8.39 6.60 4.56 5.71 7.37 8.12 Brent - $/Bbl 99.02 52.35 43.55 54.25 72.18 75.22 Annual Chinese exports – million metric tons 13.6 13.8 8.9 4.6 1.1 0.4 NOLA urea price – Chinese exportsTTF natural gasBrent crude oil
Verdigris facility Capital Allocation and Structure 19
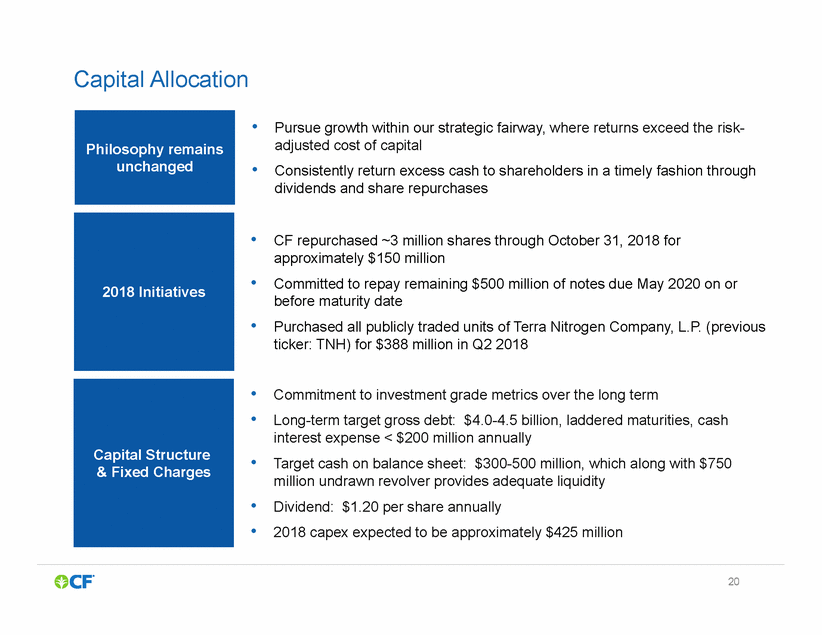
Capital Allocation • Pursue growth within our strategic fairway, where returns exceed the risk-adjusted cost of capital Consistently return excess cash to shareholders in a timely fashion through dividends and share repurchases • • CF repurchased ~3 million shares through October 31, 2018 for approximately $150 million Committed to repay remaining $500 million of notes due May 2020 on or before maturity date Purchased all publicly traded units of Terra Nitrogen Company, L.P. (previous ticker: TNH) for $388 million in Q2 2018 • • • • Commitment to investment grade metrics over the long term Long-term target gross debt: $4.0-4.5 billion, laddered maturities, cash interest expense < $200 million annually Target cash on balance sheet: $300-500 million, which along with $750 million undrawn revolver provides adequate liquidity Dividend: $1.20 per share annually 2018 capex expected to be approximately $425 million • • • 20 Capital Structure & Fixed Charges 2018 Initiatives Philosophy remains unchanged
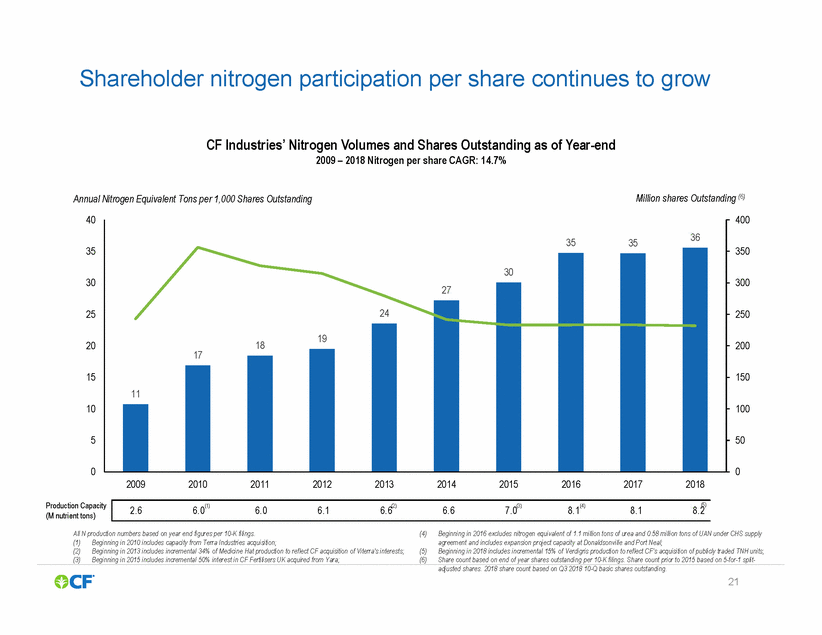
Shareholder nitrogen participation per share continues to grow CF Industries’ Nitrogen Volumes and Shares Outstanding as of Year-end 2009 – 2018 Nitrogen per share CAGR: 14.7% Million shares Outstanding (6) Annual Nitrogen Equivalent Tons per 1,000 Shares Outstanding 40 400 35 350 30 300 25 250 20 200 17 15 150 10 100 5 50 0 0 2009 2010 2011 2012 2013 2014 2015 2016 2017 2018 Production Capacity (M nutrient tons) (5) All N production numbers based on year end figures per 10-K filings. (4) Beginning in 2016 excludes nitrogen equivalent of 1.1 million tons of urea and 0.58 million tons of UAN under CHS supply agreement and includes expansion project capacity at Donaldsonville and Port Neal; Beginning in 2018 includes incremental 15% of Verdigris production to reflect CF’s acquisition of publicly traded TNH units; Share count based on end of year shares outstanding per 10-K filings. Share count prior to 2015 based on 5-for-1 split-(1) (2) (3) Beginning in 2010 includes capacity from Terra Industries acquisition; Beginning in 2013 includes incremental 34% of Medicine Hat production to reflect CF acquisition of Viterra's interests; Beginning in 2015 includes incremental 50% interest in CF Fertilisers UK acquired from Yara; (5) (6) adjusted shares. 2018 share count based on Q3 2018 10-Q basic shares outstanding. 21 2.66.0(1) 6.06.16.6(2) 6.67.0(3) 8.1(4) 8.18.2 353536 30 27 24 1819 11
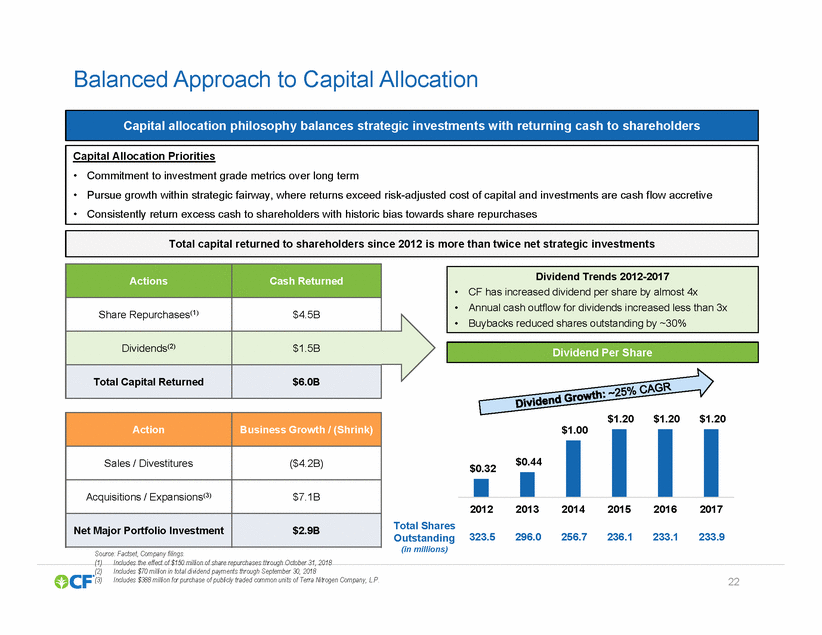
Balanced Approach to Capital Allocation • Buybacks reduced shares outstanding by ~30% $1.20 $1.20 $1.20 $1.00 2012 2013 2014 2015 2016 2017 Total Shares Outstanding (in millions) 323.5 296.0 256.7 236.1 233.1 233.9 Source: Factset, Company filings. (1) Includes the effect of $150 million of share repurchases through October 31, 2018 (2)Includes $70 million in total dividend payments through September 30, 2018 (3)Includes $388 million for purchase of publicly traded common units of Terra Nitrogen Company, L.P. 22 $0.32$0.44 Action Business Growth / (Shrink) Sales / Divestitures ($4.2B) Acquisitions / Expansions(3) $7.1B Net Major Portfolio Investment $2.9B Dividend Per Share Dividend Trends 2012-2017 •CF has increased dividend per share by almost 4x •Annual cash outflow for dividends increased less than 3x Actions Cash Returned Share Repurchases(1) $4.5B Dividends(2) $1.5B Total Capital Returned $6.0B Total capital returned to shareholders since 2012 is more than twice net strategic investments Capital Allocation Priorities • Commitment to investment grade metrics over long term • Pursue growth within strategic fairway, where returns exceed risk-adjusted cost of capital and investments are cash flow accretive • Consistently return excess cash to shareholders with historic bias towards share repurchases Capital allocation philosophy balances strategic investments with returning cash to shareholders
Woodward complex Appendix 23
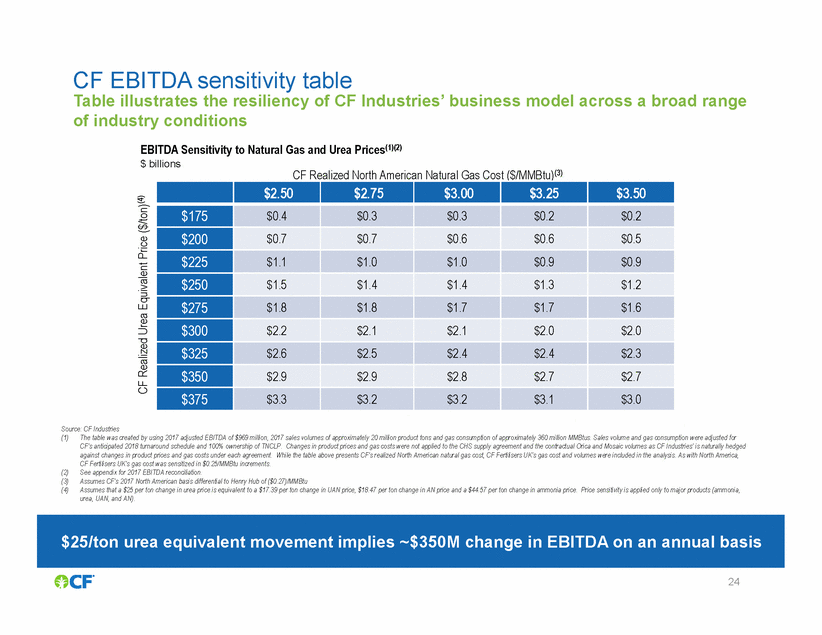
CF EBITDA sensitivity table Table illustrates the resiliency of CF Industries’ business model across a broad range of industry conditions EBITDA Sensitivity to Natural Gas and Urea Prices(1)(2) $ billions CF Realized North American Natural Gas Cost ($/MMBtu)(3) Source: CF Industries (1) The table was created by using 2017 adjusted EBITDA of $969 million, 2017 sales volumes of approximately 20 million product tons and gas consumption of approximately 360 million MMBtus. Sales volume and gas consumption were adjusted for CF’s anticipated 2018 turnaround schedule and 100% ownership of TNCLP. Changes in product prices and gas costs were not applied to the CHS supply agreement and the contractual Orica and Mosaic volumes as CF Industries’ is naturally hedged against changes in product prices and gas costs under each agreement. While the table above presents CF’s realized North American natural gas cost, CF Fertilisers UK’s gas cost and volumes were included in the analysis. As with North America, CF Fertilisers UK’s gas cost was sensitized in $0.25/MMBtu increments. See appendix for 2017 EBITDA reconciliation. Assumes CF’s 2017 North American basis differential to Henry Hub of ($0.27)/MMBtu Assumes that a $25 per ton change in urea price is equivalent to a $17.39 per ton change in UAN price, $18.47 per ton change in AN price and a $44.57 per ton change in ammonia price. Price sensitivity is applied only to major products (ammonia, urea, UAN, and AN). (2) (3) (4) 24 CF Realized Urea Equivalent Price ($/ton)(4) $25/ton urea equivalent movement implies ~$350M change in EBITDA on an annual basis $2.50 $2.75 $3.00 $3.25 $3.50 $175 $0.4 $0.3 $0.3 $0.2 $0.2 $200 $0.7 $0.7 $0.6 $0.6 $0.5 $225 $1.1 $1.0 $1.0 $0.9 $0.9 $250 $1.5 $1.4 $1.4 $1.3 $1.2 $275 $1.8 $1.8 $1.7 $1.7 $1.6 $300 $2.2 $2.1 $2.1 $2.0 $2.0 $325 $2.6 $2.5 $2.4 $2.4 $2.3 $350 $2.9 $2.9 $2.8 $2.7 $2.7 $375 $3.3 $3.2 $3.2 $3.1 $3.0
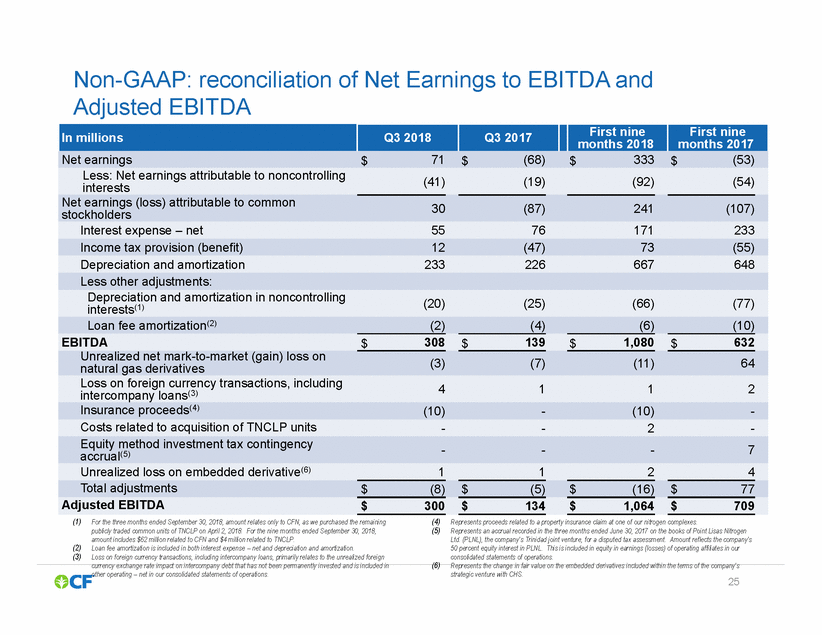
Non-GAAP: reconciliation of Net Earnings to EBITDA and Adjusted EBITDA months 2017 (41) (19) (92) (54) interests 30 (87) 241 (107) stockholders (20) (25) (66) (77) interests(1) (3) (7) (11) 64 natural gas derivatives 4 1 1 2 intercompany loans(3) - - - 7 accrual(5) (1) (4) (5) For the three months ended September 30, 2018, amount relates only to CFN, as we purchased the remaining publicly traded common units of TNCLP on April 2, 2018. For the nine months ended September 30, 2018, amount includes $62 million related to CFN and $4 million related to TNCLP. Loan fee amortization is included in both interest expense – net and depreciation and amortization. Loss on foreign currency transactions, including intercompany loans, primarily relates to the unrealized foreign Represents proceeds related to a property insurance claim at one of our nitrogen complexes. Represents an accrual recorded in the three months ended June 30, 2017 on the books of Point Lisas Nitrogen Ltd. (PLNL), the company’s Trinidad joint venture, for a disputed tax assessment. Amount reflects the company’s 50 percent equity interest in PLNL. This is included in equity in earnings (losses) of operating affiliates in our consolidated statements of operations. (2) (3) currency exchange rate impact on intercompany debt that has not been permanently invested and is included in (6) Represents the change in fair value on the embedded derivatives included within the terms of the company’s other operating – net in our consolidated statements of operations. strategic venture with CHS. 25 In millions Q3 2018 Q3 2017 First nine months 2018 First nine Net earnings$71$(68)$333$(53) Less: Net earnings attributable to noncontrolling Net earnings (loss) attributable to common Interest expense – net5576171233 Income tax provision (benefit)12(47)73(55) Depreciation and amortization233226667648 Less other adjustments: Depreciation and amortization in noncontrolling Loan fee amortization(2)(2)(4)(6)(10) EBITDA$308$139$1,080$632 Unrealized net mark-to-market (gain) loss on Loss on foreign currency transactions, including Insurance proceeds(4)(10)-(10)-Costs related to acquisition of TNCLP units--2-Equity method investment tax contingency Unrealized loss on embedded derivative(6)1124 Total adjustments$(8)$(5)$(16)$77 Adjusted EBITDA$300$134$1,064$709
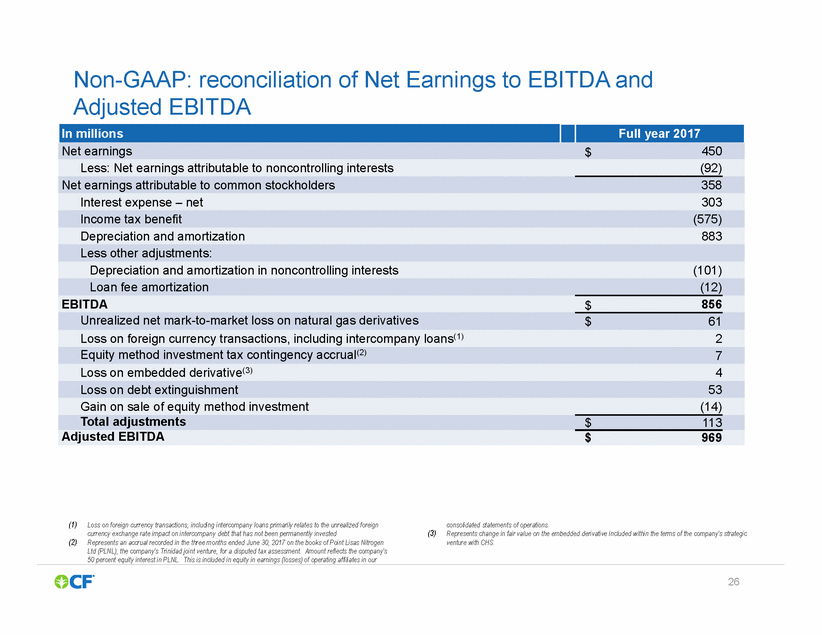
Non-GAAP: reconciliation of Net Earnings to EBITDA and Adjusted EBITDA (1)Loss on foreign currency transactions, including intercompany loans primarily relates to the unrealized foreign currency exchange rate impact on intercompany debt that has not been permanently invested (2)Represents an accrual recorded in the three months ended June 30, 2017 on the books of Point Lisas Nitrogen Ltd (PLNL), the company’s Trinidad joint venture, for a disputed tax assessment. Amount reflects the company’s 50 percent equity interest in PLNL. This is included in equity in earnings (losses) of operating affiliates in our consolidated statements of operations. (3)Represents change in fair value on the embedded derivative included within the terms of the company’s strategic venture with CHS. 26 In millions Full year 2017 Net earnings$450 Less: Net earnings attributable to noncontrolling interests(92) Net earnings attributable to common stockholders358 Interest expense – net303 Income tax benefit(575) Depreciation and amortization883 Less other adjustments: Depreciation and amortization in noncontrolling interests(101) Loan fee amortization(12) EBITDA$856 Unrealized net mark-to-market loss on natural gas derivatives$61 Loss on foreign currency transactions, including intercompany loans(1)2 Equity method investment tax contingency accrual(2)7 Loss on embedded derivative(3)4 Loss on debt extinguishment53 Gain on sale of equity method investment(14) Total adjustments$113 Adjusted EBITDA$969
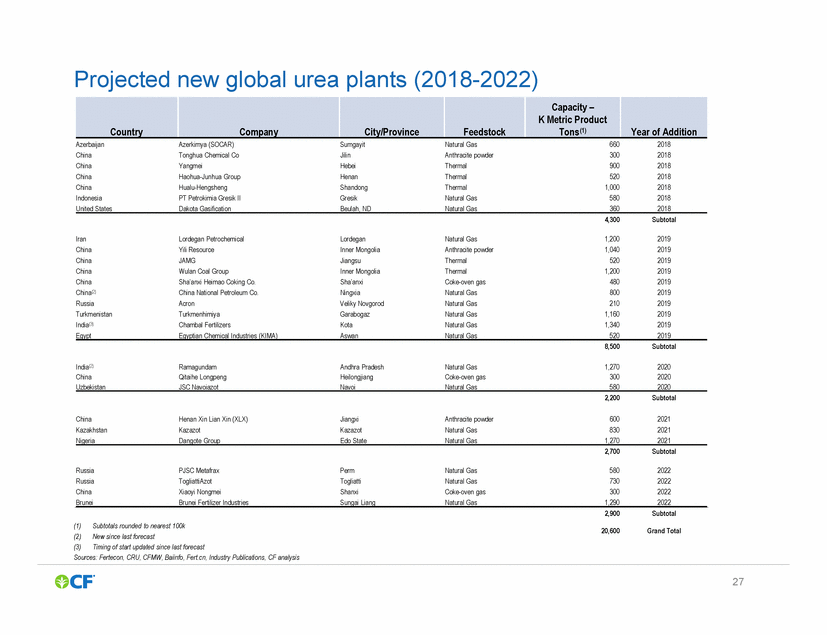
Projected new global urea plants (2018-2022) Russia Russia China PJSC Metafrax TogliattiAzot Xiaoyi Nongmei Perm Togliatti Shanxi Natural Gas Natural Gas Coke-oven gas 580 730 300 2022 2022 2022 2,900 Subtotal (1) (2) (3) Subtotals rounded to nearest 100k New since last forecast Timing of start updated since last forecast 20,600 Grand Total Sources: Fertecon, CRU, CFMW, Baiinfo, Fert.cn, Industry Publications, CF analysis 27 Brunei Brunei Fertilizer Industries Sungai Liang Natural Gas 1,290 2022 Country Company City/Province Feedstock Capacity – K Metric Product Tons(1) Year of Addition Azerbaijan Azerkimya (SOCAR) Sumgayit Natural Gas 660 2018 China Tonghua Chemical Co Jilin Anthracite powder 300 2018 China Yangmei Hebei Thermal 900 2018 China Haohua-Junhua Group Henan Thermal 520 2018 China Hualu-Hengsheng Shandong Thermal 1,000 2018 Indonesia PT Petrokimia Gresik II Gresik Natural Gas 580 2018 United States Dakota Gasification Beulah, ND Natural Gas 360 2018 4,300 Subtotal Iran Lordegan Petrochemical Lordegan Natural Gas 1,200 2019 China Yili Resource Inner Mongolia Anthracite powder 1,040 2019 China JAMG Jiangsu Thermal 520 2019 China Wulan Coal Group Inner Mongolia Thermal 1,200 2019 China Sha’anxi Heimao Coking Co. Sha’anxi Coke-oven gas 480 2019 China(2) China National Petroleum Co. Ningxia Natural Gas 800 2019 Russia Acron Veliky Novgorod Natural Gas 210 2019 Turkmenistan Turkmenhimiya Garabogaz Natural Gas 1,160 2019 India(3) Chambal Fertilizers Kota Natural Gas 1,340 2019 Egypt Egyptian Chemical Industries (KIMA) Aswan Natural Gas 520 2019 8,500 Subtotal India(2) Ramagundam Andhra Pradesh Natural Gas 1,270 2020 China Qitaihe Longpeng Heilongjiang Coke-oven gas 300 2020 Uzbekistan JSC Navoiazot Navoi Natural Gas 580 2020 2,200 Subtotal China Henan Xin Lian Xin (XLX) Jiangxi Anthracite powder 600 2021 Kazakhstan Kazazot Kazazot Natural Gas 830 2021 Nigeria Dangote Group Edo State Natural Gas 1,270 2021 2,700 Subtotal
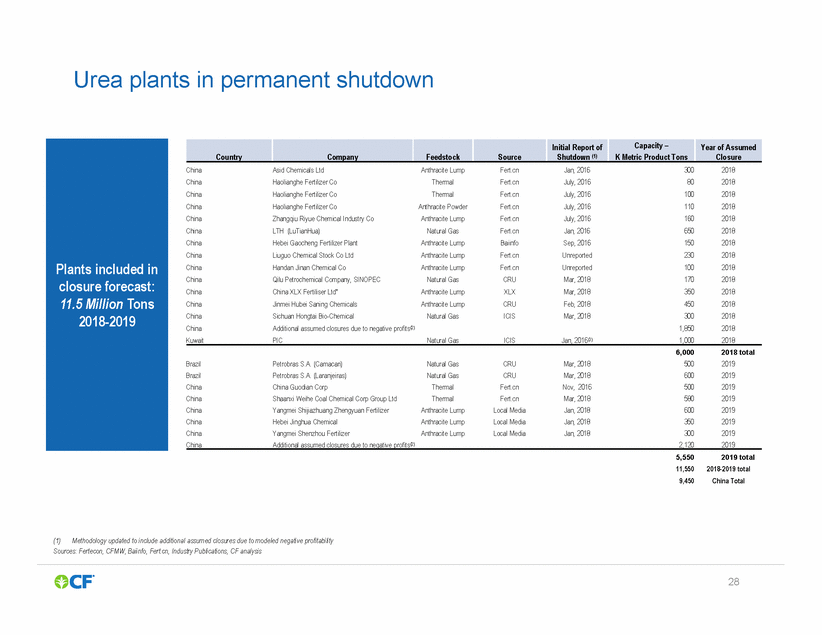
Urea plants in permanent shutdown China Kuwait Additional assumed closures due to negative profits(2) PIC 1,850 1,000 2018 2018 Natural Gas ICIS Jan, 2016(3) Brazil Brazil China China China China China Petrobras S.A. (Camacari) Petrobras S.A. (Laranjeiras) China Guodian Corp Shaanxi Weihe Coal Chemical Corp Group Ltd Yangmei Shijiazhuang Zhengyuan Fertilizer Hebei Jinghua Chemical Yangmei Shenzhou Fertilizer Natural Gas Natural Gas Thermal Thermal Anthracite Lump Anthracite Lump Anthracite Lump CRU CRU Fert.cn Fert.cn Local Media Local Media Local Media Mar, 2018 Mar, 2018 Nov, 2016 Mar, 2018 Jan, 2018 Jan, 2018 Jan, 2018 500 600 500 580 600 350 300 2019 2019 2019 2019 2019 2019 2019 (1)Methodology updated to include additional assumed closures due to modeled negative profitability Sources: Fertecon, CFMW, Baiinfo, Fert.cn, Industry Publications, CF analysis 28 ChinaAdditional assumed closures due to negative profits(2) 2,1202019 5,5502019 total 11,5502018-2019 total 9,450China Total 6,0002018 total Plants included in closure forecast: 11.5 Million Tons 2018-2019 Country Company Feedstock Source Initial Report of Shutdown (1) Capacity – K Metric Product Tons Year of Assumed Closure China Asid Chemicals Ltd Anthracite Lump Fert.cn Jan, 2016 300 2018 China Haolianghe Fertilizer Co Thermal Fert.cn July, 2016 80 2018 China Haolianghe Fertilizer Co Thermal Fert.cn July, 2016 100 2018 China Haolianghe Fertilizer Co Anthracite Powder Fert.cn July, 2016 110 2018 China Zhangqiu Riyue Chemical Industry Co Anthracite Lump Fert.cn July, 2016 160 2018 China LTH (LuTianHua) Natural Gas Fert.cn Jan, 2016 650 2018 China Hebei Gaocheng Fertilizer Plant Anthracite Lump Baiinfo Sep, 2016 150 2018 China Liuguo Chemical Stock Co Ltd Anthracite Lump Fert.cn Unreported 230 2018 China Handan Jinan Chemical Co Qilu Petrochemical Company, SINOPEC China XLX Fertiliser Ltd* Jinmei Hubei Saning Chemicals Sichuan Hongtai Bio-Chemical Anthracite Lump Fert.cn Unreported 100 2018 China Natural Gas CRUMar, 20181702018 XLXMar, 20183502018 CRUFeb, 20184502018 ICISMar, 20183002018 China Anthracite Lump China Anthracite Lump China Natural Gas
