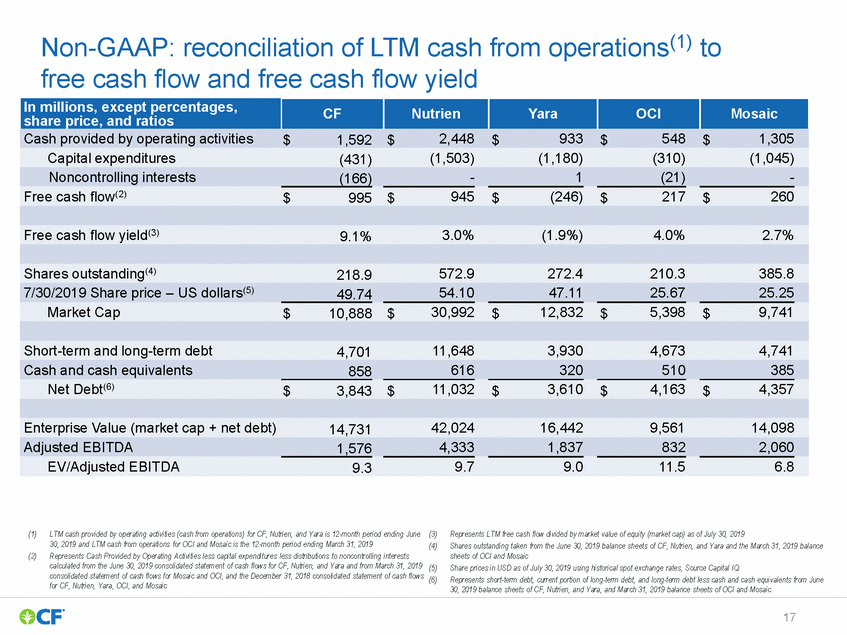
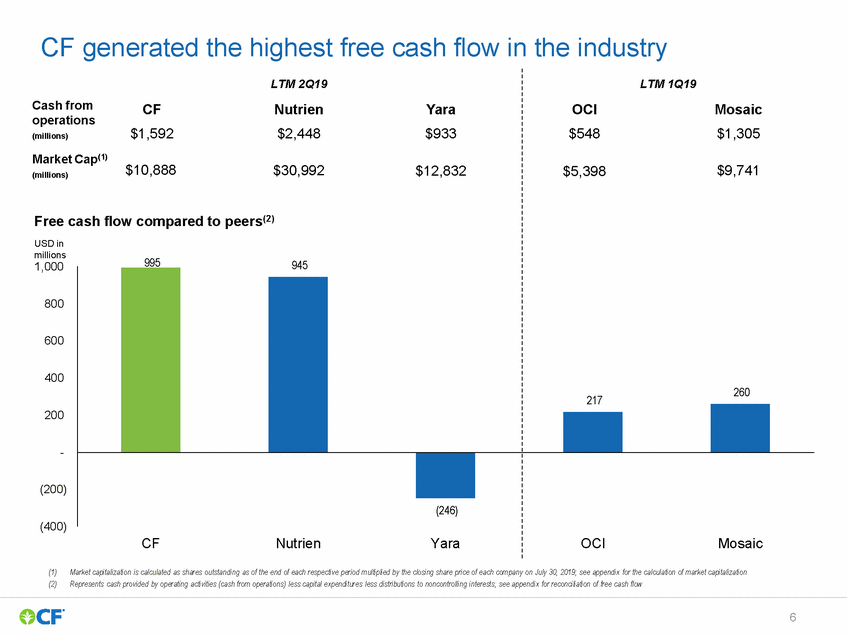
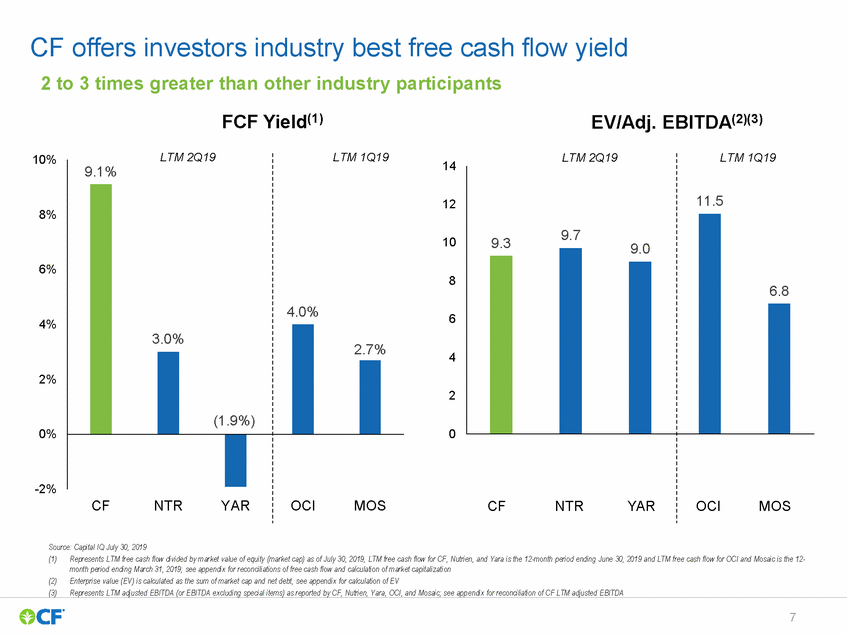
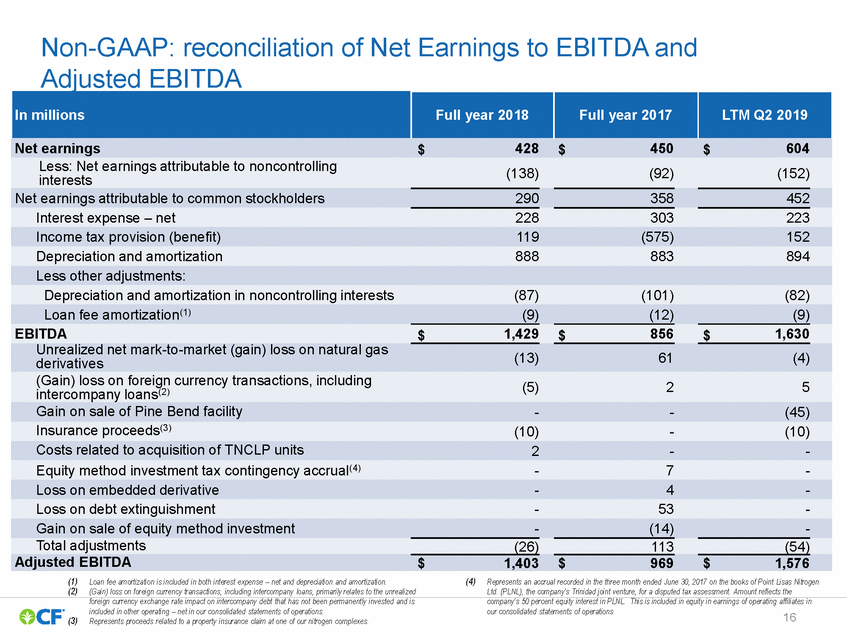
operations(1) Non-GAAP: reconciliation of LTM cash from to free cash flow and free cash flow yield (1)LTM cash provided by operating activities (cash from operations) for CF, Nutrien, and Yara is 12-month period ending June 30, 2019 and LTM cash from operations for OCI and Mosaic is the 12-month period ending March 31, 2019 (2)Represents Cash Provided by Operating Activities less capital expenditures less distributions to noncontrolling interests calculated from the June 30, 2019 consolidated statement of cash flows for CF, Nutrien, and Yara and from March 31, 2019 (3) (4) Represents LTM free cash flow divided by market value of equity (market cap) as of July 30, 2019 Shares outstanding taken from the June 30, 2019 balance sheets of CF, Nutrien, and Yara and the March 31, 2019 balance sheets of OCI and Mosaic Share prices in USD as of July 30, 2019 using historical spot exchange rates, Source Capital IQ Represents short-term debt, current portion of long-term debt, and long-term debt less cash and cash equivalents from June 30, 2019 balance sheets of CF, Nutrien, and Yara, and March 31, 2019 balance sheets of OCI and Mosaic (5) consolidated statement of cash flows for Mosaic and OCI, and the December 31, 2018 consolidated statement of cash flows (6) for CF, Nutrien, Yara, OCI, and Mosaic 17 In millions, except percentages, share price, and ratios CF Nutrien Yara OCI Mosaic Cash provided by operating activities$1,592$2,448$933$548$1,305 Capital expenditures(431)(1,503)(1,180)(310)(1,045) Noncontrolling interests(166)-1(21)-Free cash flow(2)$995$945$(246)$217$260 Free cash flow yield(3)9.1%3.0%(1.9%)4.0%2.7% Shares outstanding(4)218.9572.9272.4210.3385.8 7/30/2019 Share price – US dollars(5)49.7454.1047.1125.6725.25 Market Cap$10,888$30,992$12,832$5,398$9,741 Short-term and long-term debt4,70111,6483,9304,6734,741 Cash and cash equivalents858616320510385 Net Debt(6)$3,843$11,032$3,610$4,163$4,357 Enterprise Value (market cap + net debt)14,73142,02416,4429,56114,098 Adjusted EBITDA1,5764,3331,8378322,060 EV/Adjusted EBITDA9.39.79.011.56.8
