Exhibit 99.1

2021 Third Quarter Financial Results November 3, 2021 NYSE: CF

2 Safe harbor statement All statements in this presentation by CF Industries Holdings, Inc. (together with its subsidiaries, the “Company”), other th an those relating to historical facts, are forward - looking statements. Forward - looking statements can generally be identified by their use of terms s uch as “anticipate,” “believe,” “could,” “estimate,” “expect,” “intend,” “may,” “plan,” “predict,” “project,” “will” or “would” and similar terms and phrases, including references to assumptions. Forward - looking statements are not guarantees of future performance and are subject to a number of as sumptions, risks and uncertainties, many of which are beyond the Company’s control, which could cause actual results to differ materiall y f rom such statements. These statements may include, but are not limited to, statements about strategic plans and management’s expectati ons with respect to the production of green and blue (low - carbon) ammonia, the development of carbon capture and sequestration projects, the transit ion to and growth of a hydrogen economy, greenhouse gas reduction targets, projected capital expenditures, statements about future finan cia l and operating results, and other items described in this presentation. Important factors that could cause actual results to differ material ly from those in the forward - looking statements include, among others, the cyclical nature of the Company’s business and the impact of global supply and demand on the Company’s selling prices; the global commodity nature of the Company’s nitrogen products, the conditions in the internati ona l market for nitrogen products, and the intense global competition from other producers; conditions in the United States, Europe and other ag ricultural areas; the volatility of natural gas prices in North America and Europe; weather conditions; the seasonality of the fertilizer busin ess ; the impact of changing market conditions on the Company’s forward sales programs; difficulties in securing the supply and delivery of raw m ate rials, increases in their costs or delays or interruptions in their delivery; reliance on third party providers of transportation services and eq uipment; risks associated with cyber security; the Company’s reliance on a limited number of key facilities; acts of terrorism and regulations to comba t t errorism; risks associated with international operations; the significant risks and hazards involved in producing and handling the Company’s pro ducts against which the Company may not be fully insured; the Company’s ability to manage its indebtedness and any additional indebtedness tha t may be incurred; the Company’s ability to maintain compliance with covenants under its revolving credit agreement and the agreements go verning its indebtedness; downgrades of the Company’s credit ratings; risks associated with changes in tax laws and disagreements with ta xin g authorities; risks involving derivatives and the effectiveness of the Company’s risk measurement and hedging activities; potential liabili tie s and expenditures related to environmental, health and safety laws and regulations and permitting requirements; regulatory restrictions and req uir ements related to greenhouse gas emissions; the development and growth of the market for green and blue (low - carbon) ammonia and the risks and unc ertainties relating to the development and implementation of the Company’s green and blue (low - carbon) ammonia projects; risks associated w ith expansions of the Company’s business, including unanticipated adverse consequences and the significant resources that could b e r equired; risks associated with the operation or management of the strategic venture with CHS (the “CHS Strategic Venture”), risks and uncert ain ties relating to the market prices of the fertilizer products that are the subject of the supply agreement with CHS over the life of the suppl y a greement, and the risk that any challenges related to the CHS Strategic Venture will harm the Company’s other business relationships; and the impact of the novel coronavirus disease 2019 (COVID - 19) pandemic, including measures taken by governmental authorities to slow the spread of the vir us, on our business and operations. More detailed information about factors that may affect the Company’s performance and could cause ac tua l results to differ materially from those in any forward - looking statements may be found in CF Industries Holdings, Inc.’s filings with the S ecurities and Exchange Commission, including CF Industries Holdings, Inc.’s most recent annual and quarterly reports on Form 10 - K and Form 10 - Q, which are available in the Investor Relations section of the Company’s web site. It is not possible to predict or identify all risks an d u ncertainties that might affect the accuracy of our forward - looking statements and, consequently, our descriptions of such risks and uncertainties should not be considered exhaustive. There is no guarantee that any of the events, plans or goals anticipated by these forward - looking statements will oc cur, and if any of the events do occur, there is no guarantee what effect they will have on our business, results of operations, cash flows, fin anc ial condition and future prospects. Forward - looking statements are given only as of the date of this presentation and the Company disclaims any ob ligation to update or revise the forward - looking statements, whether as a result of new information, future events or otherwise, except as r equired by law.
3 Note regarding non - GAAP financial measures The Company reports its financial results in accordance with U.S. generally accepted accounting principles (GAAP). Management believes that EBITDA, adjusted EBITDA and free cash flow, which are non - GAAP financial measures, provide additional meaningful information regarding the Company's performance and financial strength. Non - GAAP financial measures should be viewed in addition to, and not as an alternative for, the Company's reported results prepared in accordance with GAAP. In addition, because not all companies use identical calculations, EBITDA, adjusted EBITDA and free cash flow included in this presentation may not be comparable to similarly titled measures of other companies. Reconciliations of EBITDA, adjusted EBITDA and free cash flow to the most directly comparable GAAP measures are provided in the tables accompanying this presentation. EBITDA is defined as net (loss) earnings attributable to common stockholders plus interest expense - net, income taxes, and depreciation and amortization. Other adjustments include the elimination of loan fee amortization that is included in both interest and amortization, and the portion of depreciation that is included in noncontrolling interest. The Company has presented EBITDA because management uses the measure to track performance and believes that it is frequently used by securities analysts, investors and other interested parties in the evaluation of companies in the industry. Adjusted EBITDA is defined as EBITDA adjusted with the selected items included in EBITDA as summarized in the tables accompanying this presentation. The Company has presented adjusted EBITDA because management uses adjusted EBITDA, and believes it is useful to investors, as a supplemental financial measure in the comparison of year - over - year performance. Free cash flow is defined as net cash provided by operating activities, as stated in the consolidated statements of cash flows, reduced by capital expenditures and distributions to noncontrolling interest. The Company has presented free cash flow because management uses this measure and believes it is useful to investors, as an indication of the strength of the Company and its ability to generate cash and to evaluate the Company’s cash generation ability relative to its industry competitors. It should not be inferred that the entire free cash flow amount is available for discretionary expenditures.
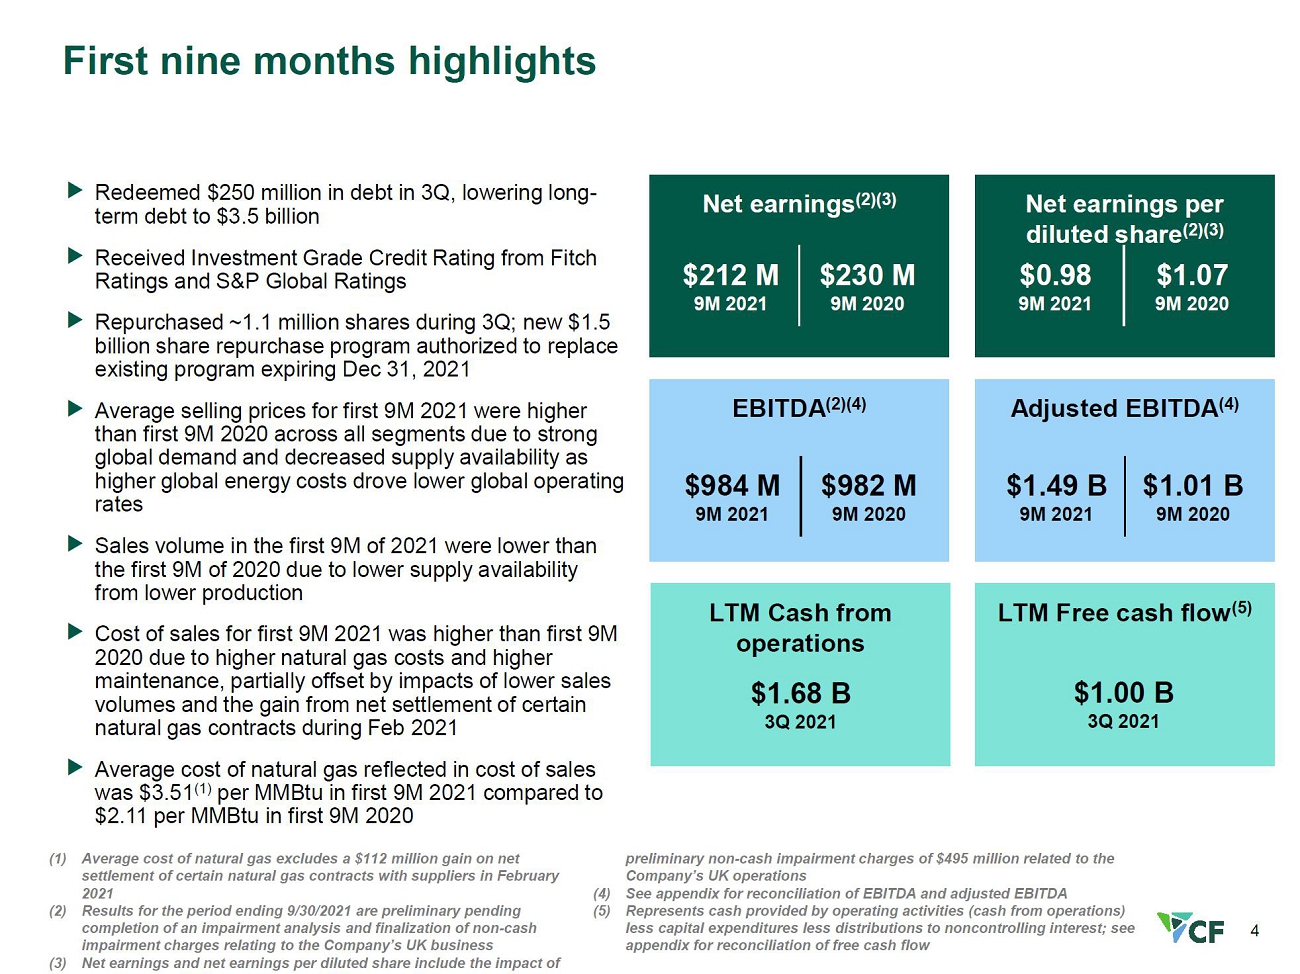
4 First nine months highlights (1) Average cost of natural gas excludes a $112 million gain on net settlement of certain natural gas contracts with suppliers in Fe bruary 2021 (2) Net earnings and net earnings per diluted share include the impact of non - cash impairment charges of $495 million related to the Company’s UK operations (3) See appendix for reconciliation of EBITDA and adjusted EBITDA (4) Represents cash provided by operating activities (cash from operations) less capital expenditures less distributions to nonco ntr olling interest; see appendix for reconciliation of free cash flow EBITDA (3) Net earnings (2) Net earnings per diluted share (2) Adjusted EBITDA (3) $1.49 B 9M 2021 $1.01 B 9M 2020 $0.98 9M 2021 $1.07 9M 2020 LTM Cash from operations LTM Free cash flow (4) Redeemed $250 million in debt in 3Q, lowering long - term debt to $3.5 billion Received Investment Grade Credit Rating from Fitch Ratings and S&P Global Ratings Repurchased ~1.1 million shares during 3Q; new $1.5 billion share repurchase program authorized to replace existing program expiring Dec 31, 2021 Average selling prices for first 9M 2021 were higher than first 9M 2020 across all segments due to strong global demand and decreased supply availability as higher global energy costs drove lower global operating rates Sales volume in the first 9M of 2021 were lower than the first 9M of 2020 due to lower supply availability from lower production Cost of sales for first 9M 2021 was higher than first 9M 2020 due to higher natural gas costs and higher maintenance, partially offset by impacts of lower sales volumes and the gain from net settlement of certain natural gas contracts during Feb 2021 Average cost of natural gas reflected in cost of sales was $3.51 (1) per MMBtu in first 9M 2021 compared to $2.11 per MMBtu in first 9M 2020 $1.68 B 3Q 2021 $984 M 9M 2021 $982 M 9M 2020 $212 M 9M 2021 $230 M 9M 2020 $1.00 B 3Q 2021
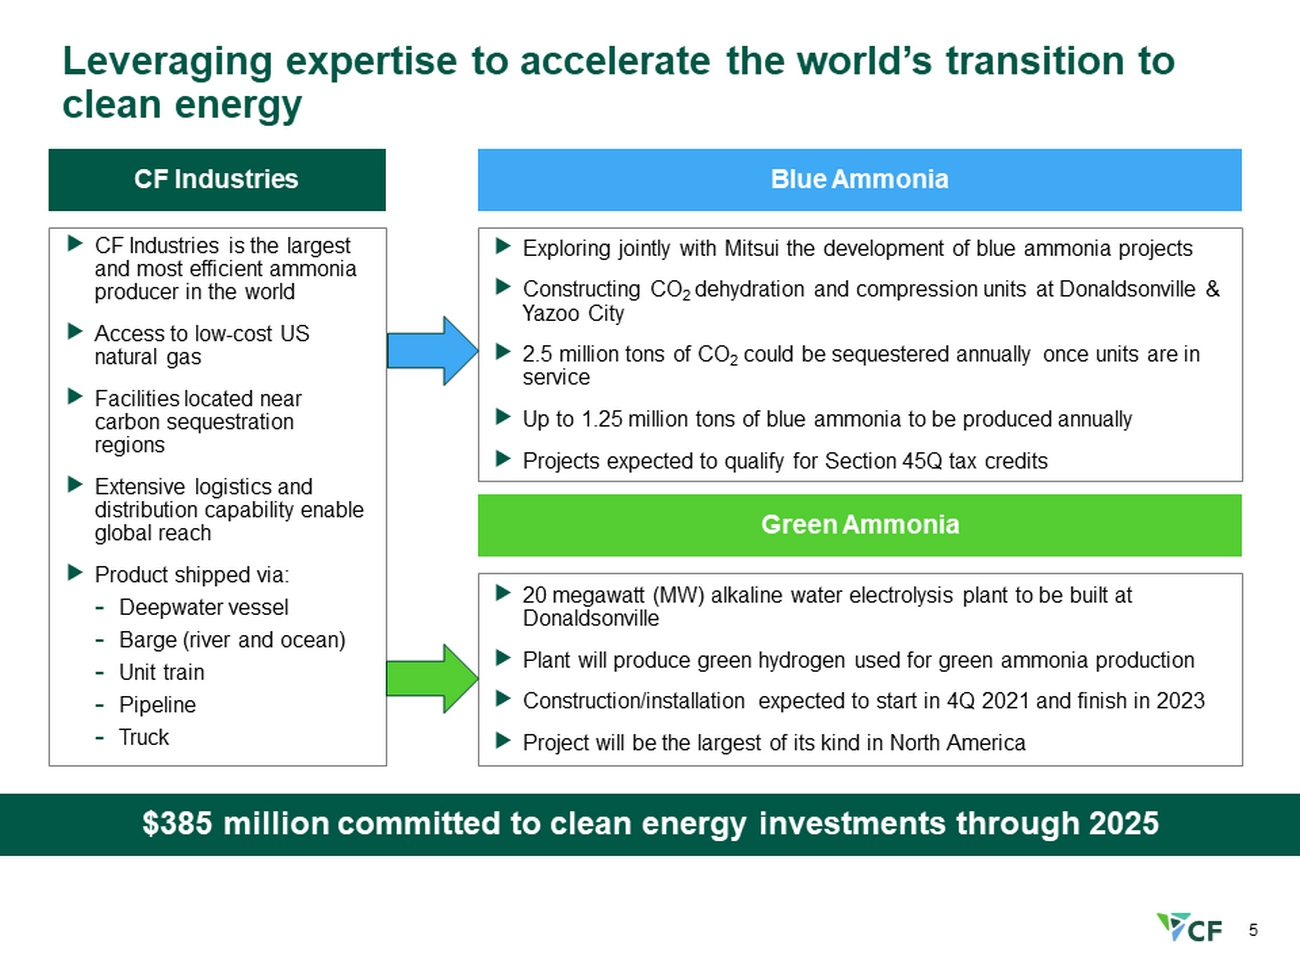
5 Leveraging expertise to accelerate the world’s transition to clean energy CF Industries is the largest and most efficient ammonia producer in the world Access to low - cost US natural gas Facilities located near carbon sequestration regions Extensive logistics and distribution capability enable global reach Product shipped via: - Deepwater vessel - Barge (river and ocean) - Unit train - Pipeline - Truck Exploring jointly with Mitsui the development of blue ammonia projects Constructing CO 2 dehydration and compression units at Donaldsonville & Yazoo City 2.5 million tons of CO 2 could be sequestered annually once units are in service Up to 1.25 million tons of blue ammonia to be produced annually Projects expected to qualify for Section 45Q tax credits 20 megawatt (MW) alkaline water electrolysis plant to be built at Donaldsonville Plant will produce green hydrogen used for green ammonia production Construction/installation expected to start in 4Q 2021 and finish in 2023 Project will be the largest of its kind in North America Blue Ammonia CF Industries $385 million committed to clean energy investments through 2025 Green Ammonia
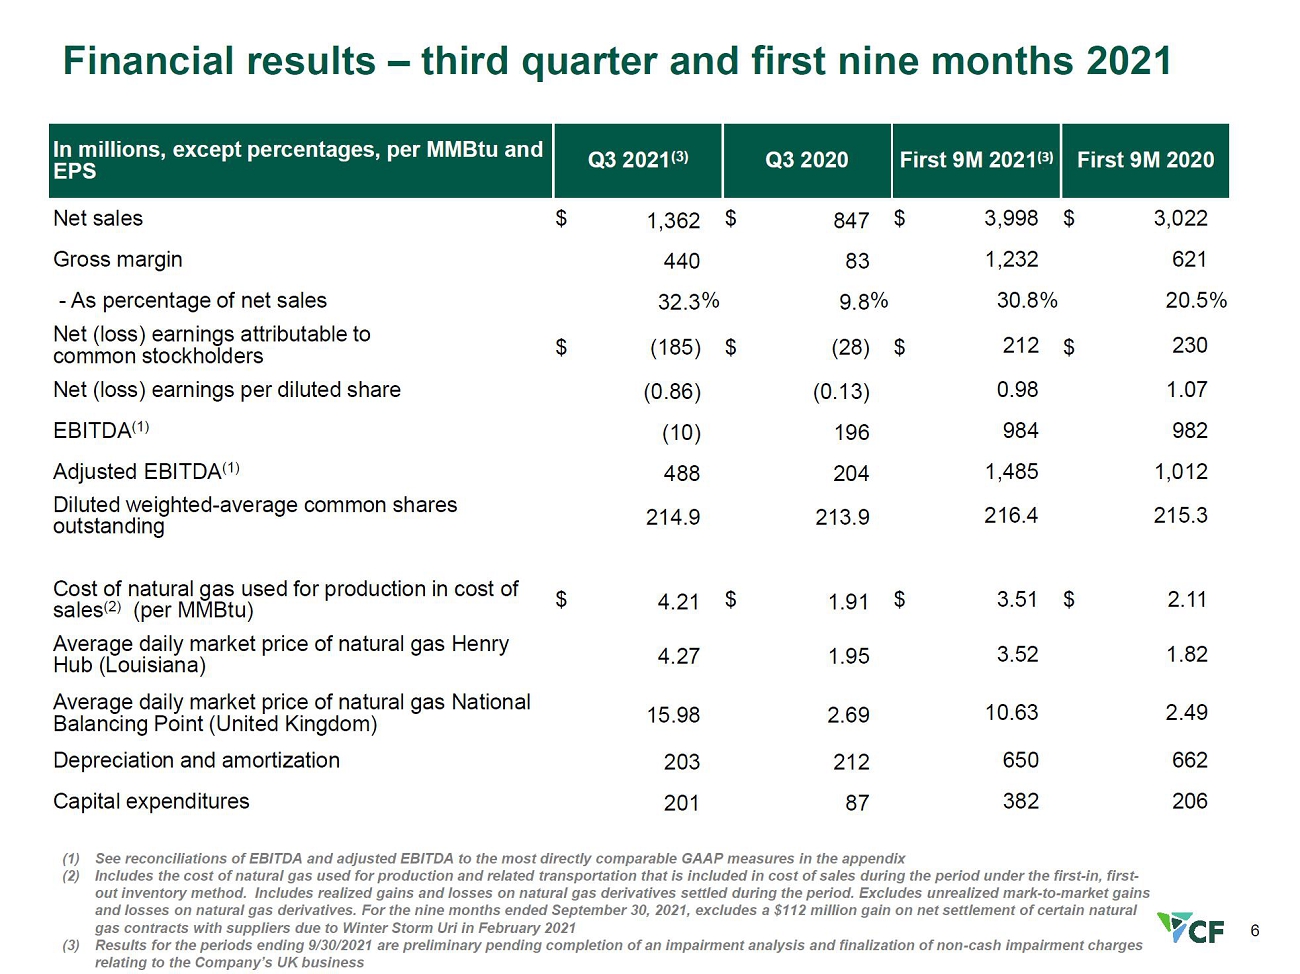
6 Financial results – third quarter and first nine months 2021 (1) See reconciliations of EBITDA and adjusted EBITDA to the most directly comparable GAAP measures in the appendix (2) Includes the cost of natural gas used for production and related transportation that is included in cost of sales during the per iod under the first - in, first - out inventory method. Includes realized gains and losses on natural gas derivatives settled during the period. Excludes unre ali zed mark - to - market gains and losses on natural gas derivatives. For the nine months ended September 30, 2021, excludes a $112 million gain on net sett lem ent of certain natural gas contracts with suppliers due to Winter Storm Uri in February 2021 I n millions, except percentages, per MMBtu and EPS Q3 20 21 Q3 20 20 First 9M 20 21 First 9M 20 20 Net sales $ 1,362 $ 847 $ 3,998 $ 3,022 Gross margin 440 83 1,232 621 - As percent age of net sales 32.3 % 9.8 % 30.8 % 20.5 % Net (loss) earnings attributable to common stockholders $ (185) $ (28) $ 212 $ 230 Net (loss) earnings p er diluted share (0.86) (0.13) 0.98 1.07 EBITDA ( 1 ) (10) 196 984 982 Adjusted EBITDA ( 1 ) 488 204 1,485 1,012 Diluted weighted - average common shares outstanding 214.9 213.9 216.4 215.3 Cost of n atural gas used for production in cost of sales ( 2 ) (per MMBtu) $ 4.21 $ 1.91 $ 3.51 $ 2.11 Average daily market price of natural gas Henry Hub (Louisiana) 4.27 1.95 3.52 1.82 Average daily market price of natural gas National Balancing Point (United Kingdom) 15.98 2.69 10.63 2.49 Depreciation and amortization 203 212 650 662 Capital expenditures 201 87 382 206

7 Strengthening global nitrogen outlook Global nitrogen price dynamics Global nitrogen supply and demand Global energy differentials Global nitrogen pricing outlook is favorable: high demand/low operating rates due to high energy prices should sustain a tight supply and demand balance into 2023 Forward curves indicate elevated crop prices through 2023, incentivizing strong global plantings and fertilizer use The rebound in global GDP growth and industrial activity has supported increased nitrogen demand US International Trade Commission issued an affirmative decision in the preliminary phase of its antidumping and countervailing duty investigations of UAN imports from Russia and Trinidad Global demand supported by high crop prices and the need to replenish global stocks Corn acres planted in the US in 2022 expected to be ~93 million acres Demand from India and Brazil should continue to lead global urea import demand Global supply expected to remain constrained with production in key regions affected by high energy prices Chinese exports are limited as the Chinese government implemented measures to promote availability/affordability of domestic fertilizer Forward natural gas curves in Europe remain high, suggesting a continued challenging commercial environment for regional producers in the near - term Energy differentials between Europe & Asia to Henry Hub have increased substantially, steepening the global nitrogen cost curve Forward curves suggest favorable energy spreads will persist into 2023

8 Lowest stocks - to - use ratios since 2012 drive higher grain values, expected to require two or more growing seasons to replenish (1) Crop futures price represents the January - September average daily settlement of new crop futures price (e.g. 2021 corn price=J anuary – September 2021 daily settlement of December 2021 corn future contract) Source: USDA, CME, CF Global Coarse Grains Stocks - to - Use Ratio vs Corn Futures Prices (1) Percent 0 1 2 3 4 5 6 7 0% 2% 4% 6% 8% 10% 12% 14% 16% World-ex China Crop Futures Price (RHS) USD per Bushel Global Oilseeds Stocks - to - Use Ratio vs Soybean Futures Prices Percent 0 2 4 6 8 10 12 14 16 0% 5% 10% 15% 20% 25% 30% World-ex China Crop Futures Price (RHS) USD per Bushel

9 Sharply higher natural gas prices in Europe and Asia have widened spreads to North American benchmark prices Global Energy Price 2019 - 2022F USD/ tonne North American Production Advantage (1) 0 5 10 15 20 25 30 35 40 2019 2020 2021 2022 Henry Hub natural gas TTF natural gas Chinese anthracite coal - lump JKM natural gas 0 100 200 300 400 500 600 Ammonia (2) Urea TTF Anthracite (3) ‘19 ‘20 ‘21F ’22F TTF Anthracite USD/ MMBtu (1) Advantage per tonne (feedstock and fuel cost differential) based on annualized costs including settled feedstock prices through October 2021 and No vember 2021 through December 2022 based on forward curve and projections as of November 2, 2021 (2) North American production assumed to be 37.2 MMBtu per tonne of ammonia for feedstock and fuel, European production assumed at 37.8 MMBtu per tonne for feedstock and fuel, Chinese production assumed to be 1.2 tonnes of coal and 1300 KWH for feedstock and power (3) Forecast Chinese anthracite coal prices based on WoodMac thermal coal price forecast (4) Coal MMBtu price includes efficiency factor of 1.3 (additional coal required for hydrogen yield equivalent to feedstock natur al gas) Note: dotted lines represent forward price curves Source: ICE, Bloomberg, SX Coal, WoodMac , CF Analysis Spreads projected to remain wide into 2022 Higher natural gas costs expected into early 2022 ‘19 ‘20 ‘21F ’22F ‘19 ‘20 ‘21F ’22F ‘19 ‘20 ‘21F ’22F (4)
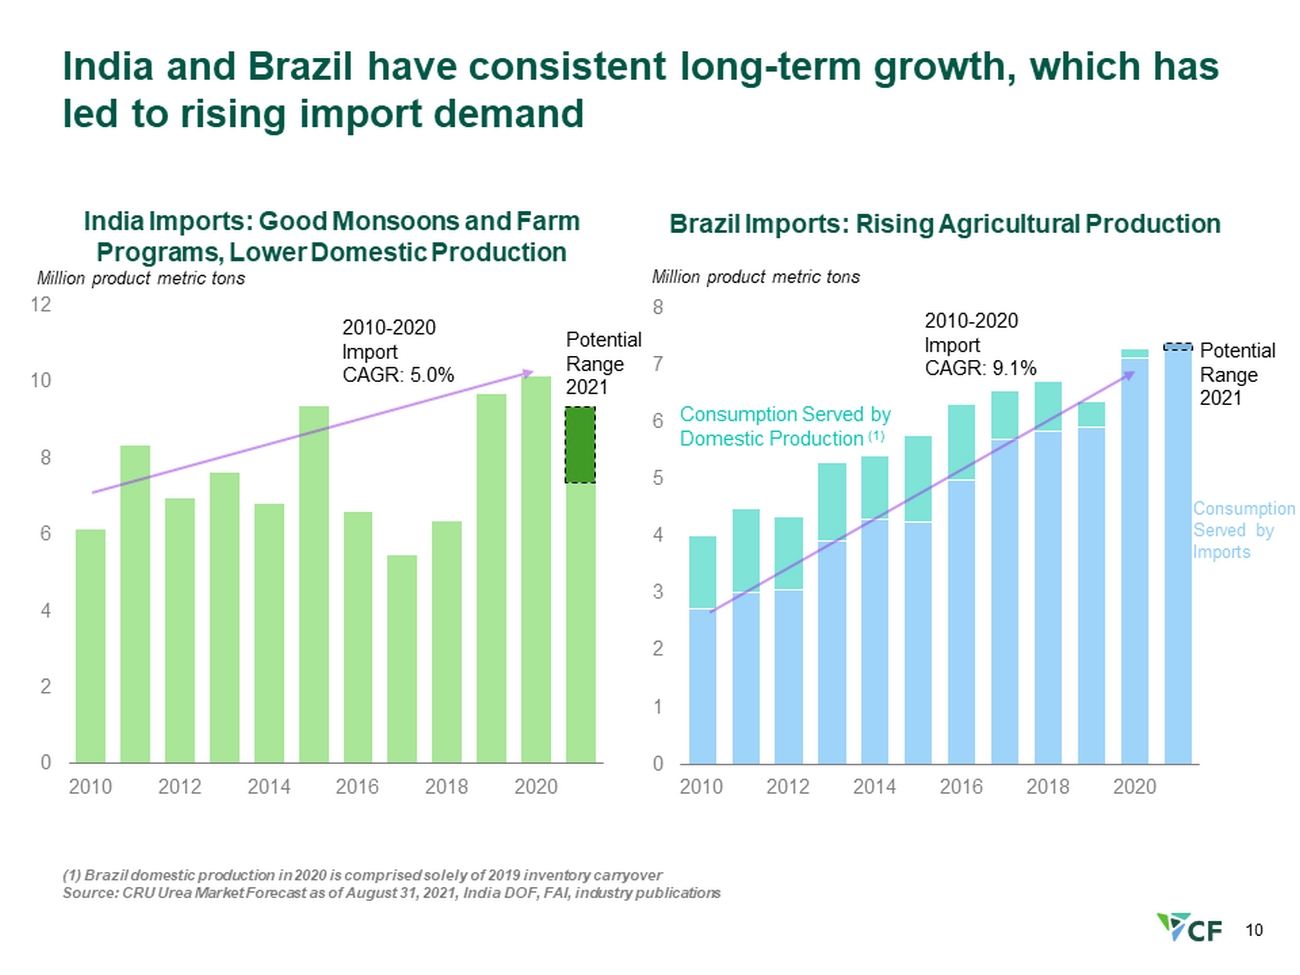
10 India and Brazil have consistent long - term growth, which has led to rising import demand (1) Brazil domestic production in 2020 is comprised solely of 2019 inventory carryover Source: CRU Urea Market Forecast as of August 31, 2021, India DOF, FAI, industry publications 0 2 4 6 8 10 12 2010 2012 2014 2016 2018 2020 0 1 2 3 4 5 6 7 8 2010 2012 2014 2016 2018 2020 India Imports: Good Monsoons and Farm Programs, Lower Domestic Production Million product metric tons 2010 - 2020 Import CAGR: 5.0% Potential Range 2021 Brazil Imports: Rising Agricultural Production Million product metric tons Consumption Served by Domestic Production (1) Consumption Served by Imports 2010 - 2020 Import CAGR: 9.1% Potential Range 2021

11 0 200 400 600 800 $1,000 North America MENA Russia Other FSU Latin America Indonesia India Western Europe Eastern Europe South Asia Ukraine Lithuania China - Advanced Inland Low Southeast Asia China - Advanced Coastal China - Advanced Inland High China - Natural Gas Low China - Anthracite Low China - Natural Gas High China - Anthracite High Estimated 2021 cost ranges in Q4 are sharply higher compared to previous forecast due to higher energy costs Y - axis: USD/short ton, X - axis: Monthly Production Capacity at 95% Operating Rate, million short tons 20 0 5 10 15 Energy (N.G.) Other Cash Energy (Coal) 2021E (1) Shipments: 16.6 MM ST Avg Appx . Monthly Range Freight 2021 Monthly Delivered U.S. Gulf Urea Cost Curve Q3 2020 Estimated 2021 Cost Range: $220 - 250 Estimated Q4 2021 (2) Cost Range: $410 - 545 (1) 2021E represents assumptions from November 2020 forecast 2021 cost curve (2) Q4 2021 represents assumptions based on forecast Q4 2021 average costs Source: Industry Publications, Woodmac , Bloomberg, CF

12 0 200 400 600 800 $1,000 MENA North America Other FSU Russia Indonesia Latin America South Asia Southeast Asia China - Advanced Inland Low China - Natural Gas Low China - Anthracite Low China - Advanced Coastal China - Advanced Inland High India China - Natural Gas High Ukraine Eastern Europe China - Anthracite High Western Europe Lithuania 2022 global urea cost curve range $365 - 445 per ton; energy prices expected to normalize from Q4 2021 levels Y - axis: USD/short ton, X - axis: Monthly Production Capacity at 95% Operating Rate, million short tons 20 0 5 10 15 Estimated 2022 Cost Range: $365 - 445 Energy (N.G.) Other Cash Energy (Coal) 2022 Shipments: 16.8 MM ST Avg Appx . Monthly Range Freight 2022 Monthly Delivered U.S. Gulf Urea Cost Curve Estimated Q4 2021 (1) Cost Range: $410 - 545 (1) Q4 2021 represents assumptions based on forecast Q4 2021 average costs Source: Industry Publications, Woodmac , Bloomberg, CF
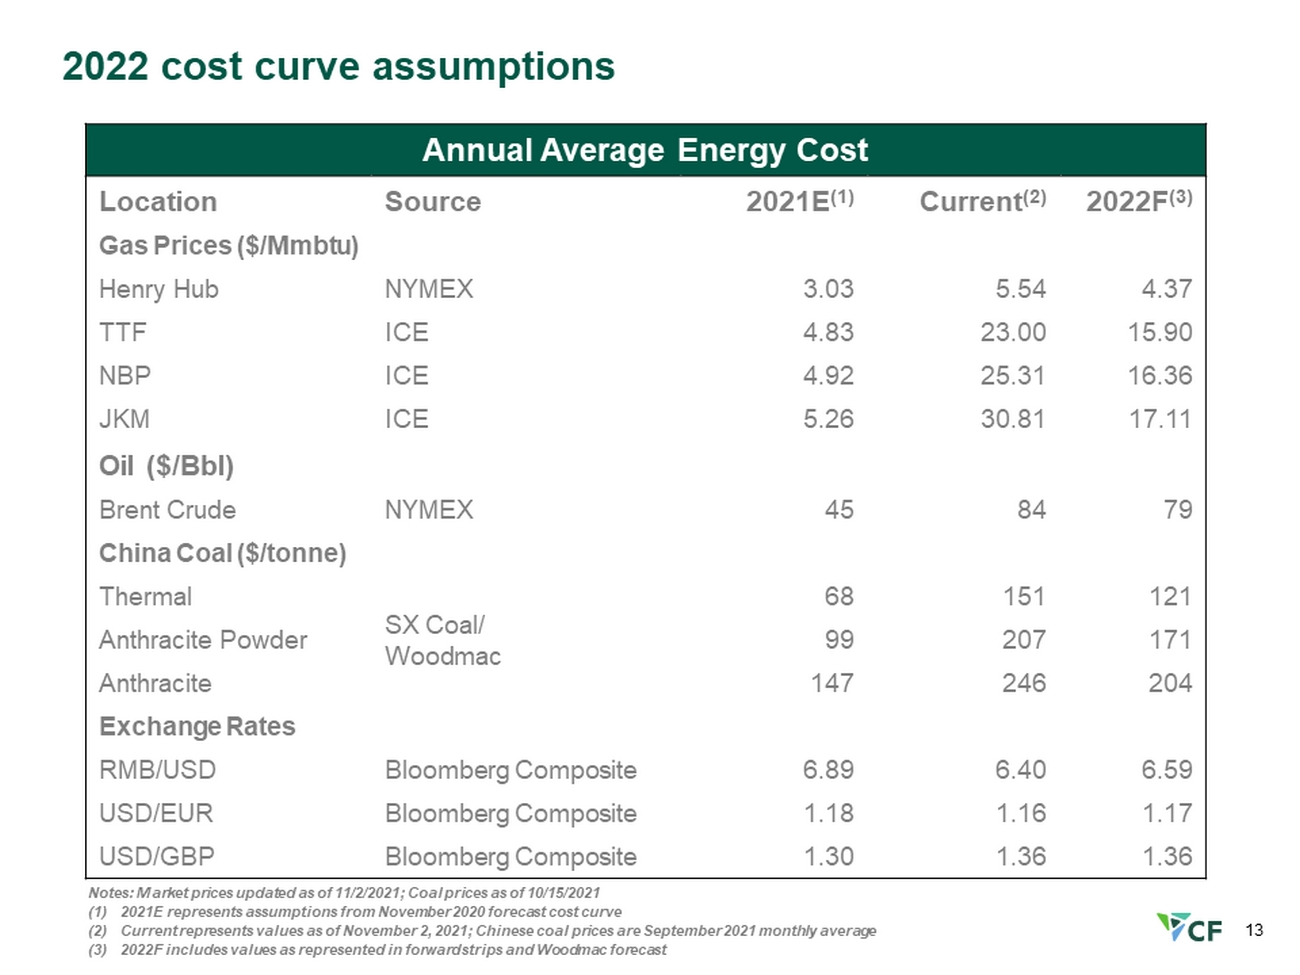
13 Notes: Market prices updated as of 11/2/2021; Coal prices as of 10/15/2021 (1) 2021E represents assumptions from November 2020 forecast cost curve (2) Current represents values as of November 2, 2021; Chinese coal prices are September 2021 monthly average (3) 2022F includes values as represented in forward strips and Woodmac forecast 2022 cost curve assumptions Annual Average Energy Cost Location Source 2021E (1) Current (2) 2022F (3) Gas Prices ($/ Mmbtu ) Henry Hub NYMEX 3.03 5.54 4.37 TTF ICE 4.83 23.00 15.90 NBP ICE 4.92 25.31 16.36 JKM ICE 5.26 30.81 17.11 Oil ($/ Bbl ) Brent Crude NYMEX 45 84 79 China Coal ($/ tonne ) Thermal SX Coal/ Woodmac 68 151 121 Anthracite Powder 99 207 171 Anthracite 147 246 204 Exchange Rates RMB/USD Bloomberg Composite 6.89 6.40 6.59 USD/EUR Bloomberg Composite 1.18 1.16 1.17 USD/GBP Bloomberg Composite 1.30 1.36 1.36

14 Capital management Capital structure and allocation Clean energy initiatives Capital expenditures Fitch Ratings and S&P Global Ratings issued investment - grade credit ratings with respect to CF Industries Redeemed $250 million in debt in 3Q, lowering long - term debt to $3.5 billion Repurchased ~1.1 million shares during 3Q; new $1.5 billion share repurchase program authorized to replace existing program expiring Dec 31, 2021 Company has paid a dividend of $1.20 per share annually since 2014 and intends to repurchase shares opportunistically CF Industries and Mitsui, one of the leading ammonia marketers in the world, have agreed to explore jointly the development of blue ammonia projects Company to construct carbon dioxide dehydration and compression units at its Donaldsonville and Yazoo City facilities, enabling the production of up to 1.25 million tons of blue ammonia annually CF Industries is participating in the Joint Study Framework established by Itochu Corporation to verify and organize common issues regarding the use of ammonia as a maritime fuel Capital expenditures in Q3 and first 9M of 2021 were $201 million and $382 million, respectively Expected capex for full year 2021 ~$500 million, reflecting higher activity in 2021 due to maintenance deferred from 2020 and activity previously planned to occur in 2022 $385 million committed to clean energy investment through 2025 will be included in annual capex
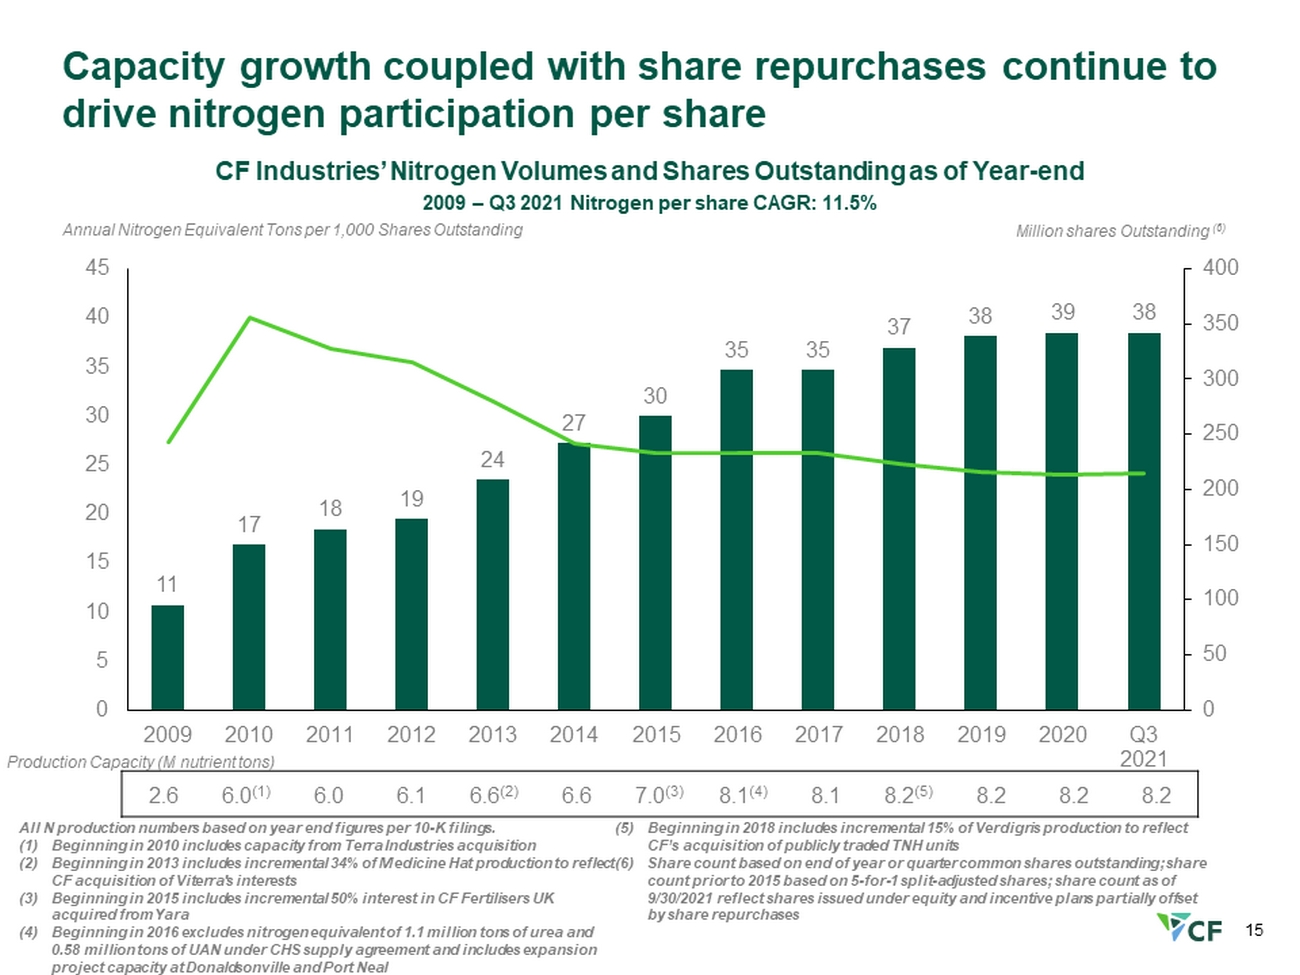
15 2.6 6.0 (1) 6.0 6.1 6.6 (2) 6.6 7.0 (3) 8.1 (4) 8.1 8.2 (5) 8.2 8.2 8.2 All N production numbers based on year end figures per 10 - K filings. (1) Beginning in 2010 includes capacity from Terra Industries acquisition (2) Beginning in 2013 includes incremental 34% of Medicine Hat production to reflect CF acquisition of Viterra's interests (3) Beginning in 2015 includes incremental 50% interest in CF Fertilisers UK acquired from Yara (4) Beginning in 2016 excludes nitrogen equivalent of 1.1 million tons of urea and 0.58 million tons of UAN under CHS supply agreement and includes expansion project capacity at Donaldsonville and Port Neal (5) Beginning in 2018 includes incremental 15% of Verdigris production to reflect CF’s acquisition of publicly traded TNH units (6) Share count based on end of year or quarter common shares outstanding; share count prior to 2015 based on 5 - for - 1 split - adjusted shares; share count as of 9/30/2021 reflect shares issued under equity and incentive plans partially offset by share repurchases Production Capacity (M nutrient tons) Annual Nitrogen Equivalent Tons per 1,000 Shares Outstanding CF Industries’ Nitrogen Volumes and Shares Outstanding as of Year - end Million shares Outstanding (6) 2009 – Q3 2021 Nitrogen per share CAGR: 11.5% 11 17 18 19 24 27 30 35 35 37 38 39 38 0 50 100 150 200 250 300 350 400 0 5 10 15 20 25 30 35 40 45 2009 2010 2011 2012 2013 2014 2015 2016 2017 2018 2019 2020 Q3 2021 Capacity growth coupled with share repurchases continue to drive nitrogen participation per share

Appendix

17 CF Industries EBITDA sensitivity table Table illustrates the CF Industries business model across a broad range of industry conditions $25/ton urea realized movement implies ~$375M change in EBITDA on an annual basis (1) Based on 2019 sales volumes of approximately 19.5 million product tons, 2019 gas consumption of 344 million MMBtus and 2020 n itr ogen product sales price relationships. Changes in product prices and gas costs are not applied to the CHS minority interest or industrial cont rac ts where CF Industries is naturally hedged against changes in product prices and gas costs (2) Assumes that a $25 per ton change in urea prices is also applied proportionally to all nitrogen products and is equivalent to a $17.39 per ton change in UAN price, $18.48 per ton change in AN price, a $44.57 per ton change in ammonia price, and a $10.60 per ton change in the pr ice of the Other segment EBITDA Sensitivity to Natural Gas and Urea Prices (1) $ billions CF Realized Natural Gas Cost ($/MMBtu) CF Realized Urea Price ($/ton) (2) 3.75 4.00 4.25 4.50 4.75 5.00 $300 $1.6 $1.5 $1.4 $1.4 $1.3 $1.2 $325 $2.0 $1.9 $1.8 $1.8 $1.7 $1.6 $350 $2.3 $2.3 $2.2 $2.1 $2.1 $2.0 $375 $2.7 $2.7 $2.6 $2.5 $2.4 $2.4 $400 $3.1 $3.0 $3.0 $2.9 $2.8 $2.8 $425 $3.5 $3.4 $3.3 $3.3 $3.2 $3.1 $450 $3.9 $3.8 $3.7 $3.6 $3.6 $3.5 $475 $4.2 $4.2 $4.1 $4.0 $4.0 $3.9 $500 $4.6 $4.5 $4.5 $4.4 $4.3 $4.3
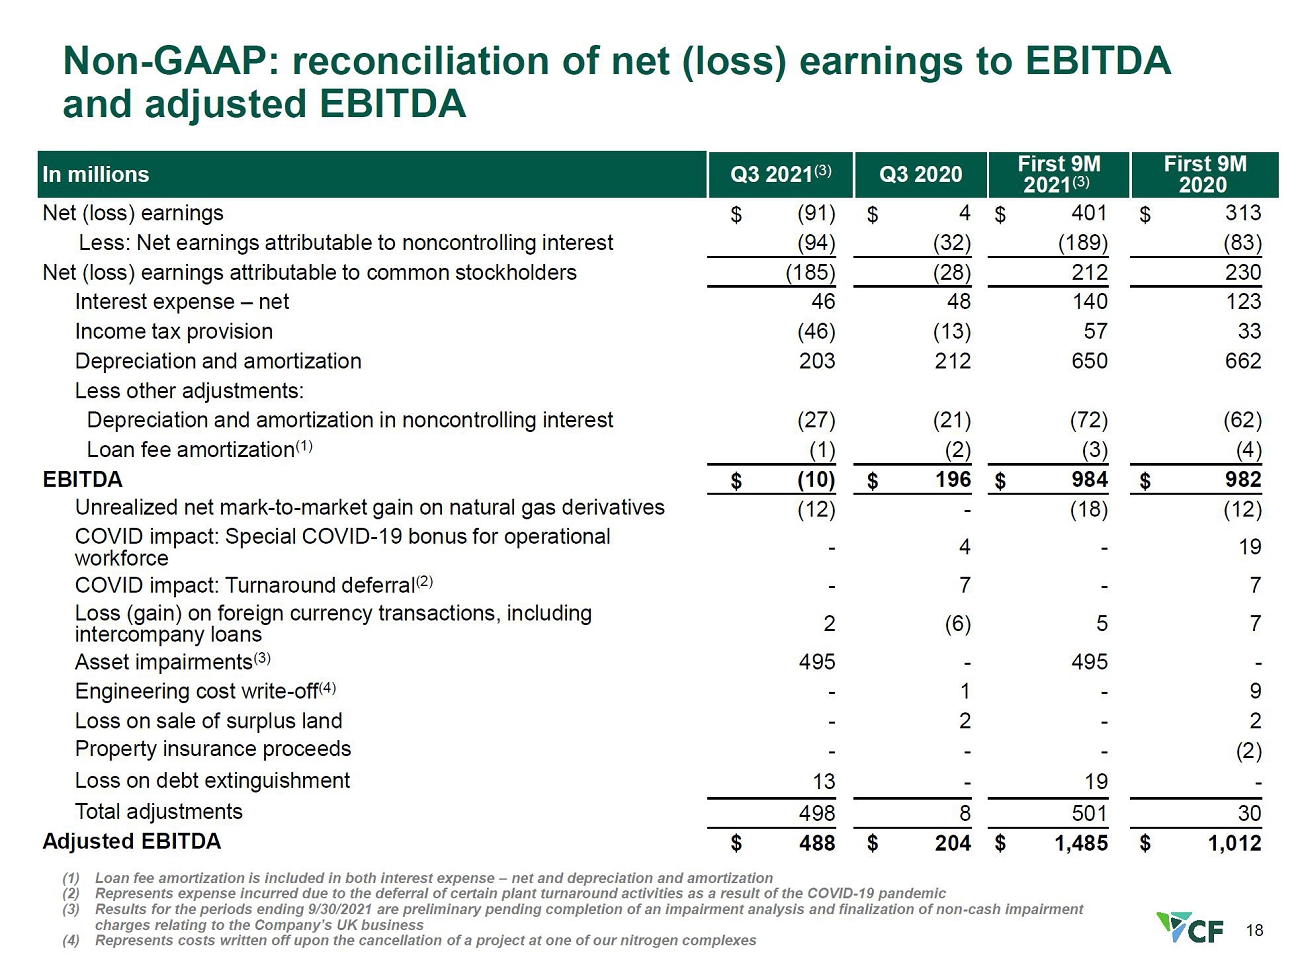
18 Non - GAAP: reconciliation of net (loss) earnings to EBITDA and adjusted EBITDA (1) Loan fee amortization is included in both interest expense – net and depreciation and amortization (2) Represents expense incurred due to the deferral of certain plant turnaround activities as a result of the COVID - 19 pandemic (3) Represents costs written off upon the cancellation of a project at one of our nitrogen complexes In millions Q3 20 21 Q3 2020 First 9M 20 21 First 9M 2020 Net (loss) earnings $ (91) $ 4 $ 401 $ 313 Less: Net earnings attributable to noncontrolling interest (94) (32) (189) (83) Net (loss) earnings attributable to common stockholders (185) (28) 212 230 Interest expense – net 46 48 140 123 Income tax provision (46) (13) 57 33 Depreciation and amortization 203 212 650 662 Less other adjustments: Depreciation and amortization in noncontrolling interest (27) (21) (72) (62) Loan fee amortization (1) (1) (2) (3) (4) EBITDA $ (10) $ 196 $ 984 $ 982 Unrealized net mark - to - market gain on natural gas derivatives (12) - (18) (12) COVID impact: Special COVID - 19 bonus for operational workforce - 4 - 19 COVID impact: Turnaround deferral (2) - 7 - 7 Loss (gain) on foreign currency transactions, including intercompany loans 2 (6) 5 7 Asset impairments 495 - 495 - Engineering cost write - off (3) - 1 - 9 Loss on sale of surplus land - 2 - 2 Property insurance proceeds - - - (2) Loss on debt extinguishment 13 - 19 - Total adjustments 498 8 501 30 Adjusted EBITDA $ 488 $ 204 $ 1,485 $ 1,012
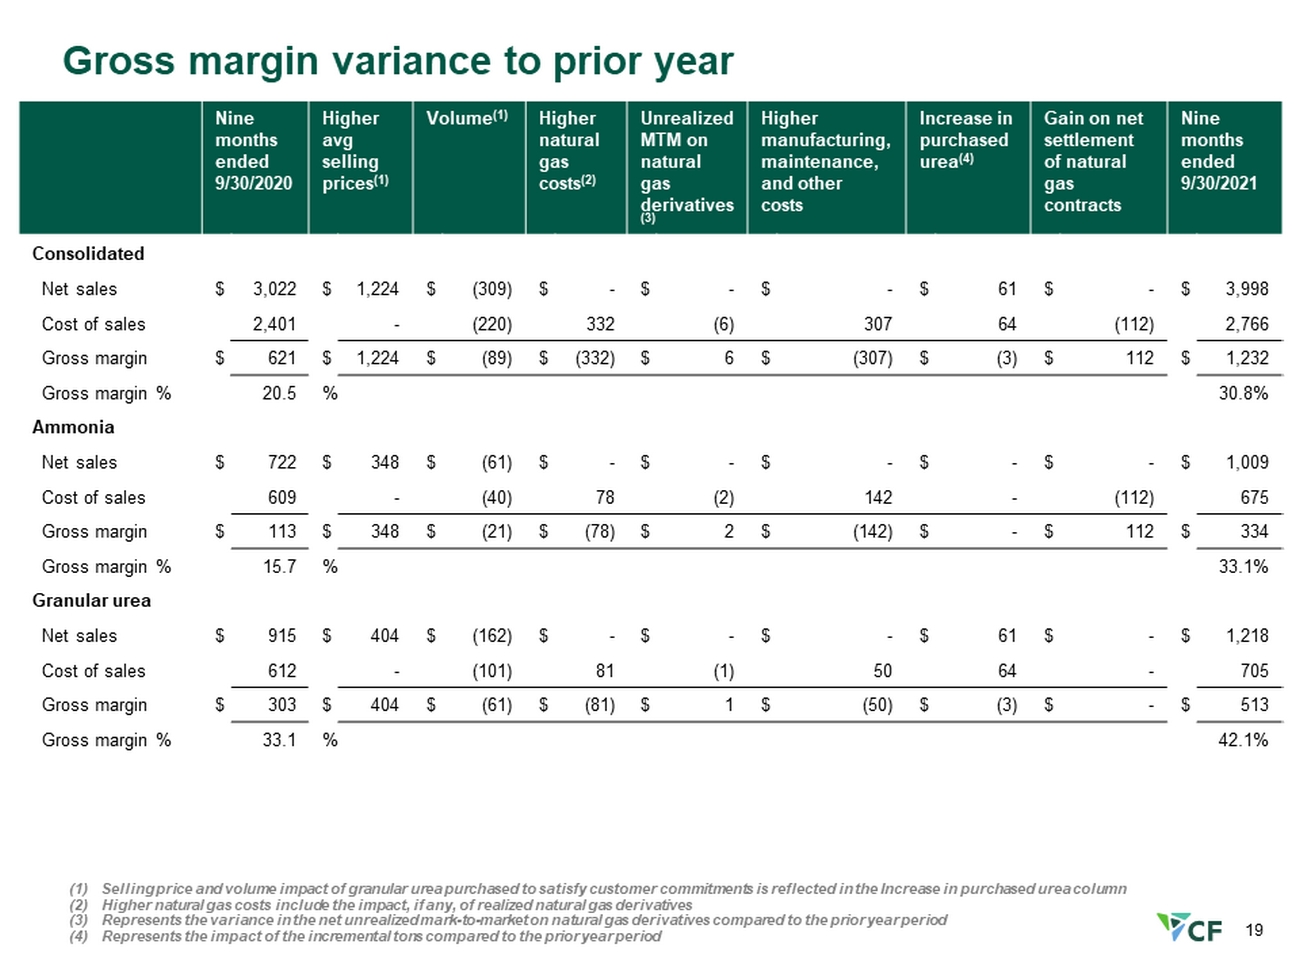
19 Gross margin variance to prior year Nine months ended 9/30/2020 Higher avg selling prices (1) Volume (1) Higher natural gas costs (2) Unrealized MTM on natural gas derivatives (3) Higher manufacturing, maintenance, and other costs Increase in purchased urea (4) Gain on net settlement of natural gas contracts Nine months ended 9/30/2021 Consolidated Net sales $ 3,022 $ 1,224 $ (309) $ - $ - $ - $ 61 $ - $ 3,998 Cost of sales 2,401 - (220) 332 (6) 307 64 (112) 2,766 Gross margin $ 621 $ 1,224 $ (89) $ (332) $ 6 $ (307) $ (3) $ 112 $ 1,232 Gross margin % 20.5 % 30.8% Ammonia Net sales $ 722 $ 348 $ (61) $ - $ - $ - $ - $ - $ 1,009 Cost of sales 609 - (40) 78 (2) 142 - (112) 675 Gross margin $ 113 $ 348 $ (21) $ (78) $ 2 $ (142) $ - $ 112 $ 334 Gross margin % 15.7 % 33.1% Granular urea Net sales $ 915 $ 404 $ (162) $ - $ - $ - $ 61 $ - $ 1,218 Cost of sales 612 - (101) 81 (1) 50 64 - 705 Gross margin $ 303 $ 404 $ (61) $ (81) $ 1 $ (50) $ (3) $ - $ 513 Gross margin % 33.1 % 42.1% (1) Selling price and volume impact of granular urea purchased to satisfy customer commitments is reflected in the Increase in pu rch ased urea column (2) Higher natural gas costs include the impact, if any, of realized natural gas derivatives (3) Represents the variance in the net unrealized mark - to - market on natural gas derivatives compared to the prior year period (4) Represents the impact of the incremental tons compared to the prior year period

20 Gross margin variance to prior year, continued Nine months ended 9/30/2020 Higher avg selling prices (1) Volume (1) Higher natural gas costs (2) Unrealized MTM on natural gas derivatives (3) Higher manufacturing, maintenance, and other costs Increase in purchased urea (4) Gain on net settlement of natural gas contracts Nine months ended 9/30/2021 UAN Net sales $ 791 $ 288 $ (23) $ - $ - $ - $ - $ - $ 1,056 Cost of sales 675 - (20) 85 (1) 20 - - 759 Gross margin $ 116 $ 288 $ (3) $ (85) $ 1 $ (20) $ - $ - $ 297 Gross margin % 14.7 % 28.1% AN Net sales $ 343 $ 83 $ (67) $ - $ - $ - $ - $ - $ 359 Cost of sales 290 - (51) 55 (1) 44 - - 337 Gross margin $ 53 $ 83 $ (16) $ (55) $ 1 $ (44) $ - $ - $ 12 Gross margin % 15.5 % 6.1% Other Net sales $ 251 $ 101 $ 4 $ - $ - $ - $ - $ - $ 356 Cost of sales 215 - (8) 33 (1) 51 - - 290 Gross margin $ 36 $ 101 $ 12 $ (33) $ 1 $ (51) $ - $ - $ 66 Gross margin % 14.3 % 18.5% (1) Selling price and volume impact of granular urea purchased to satisfy customer commitments is reflected in the Increase in pu rch ased urea column (2) Higher natural gas costs include the impact, if any, of realized natural gas derivatives (3) Represents the variance in the net unrealized mark - to - market on natural gas derivatives compared to the prior year period (4) Represents the impact of the incremental tons compared to the prior year period
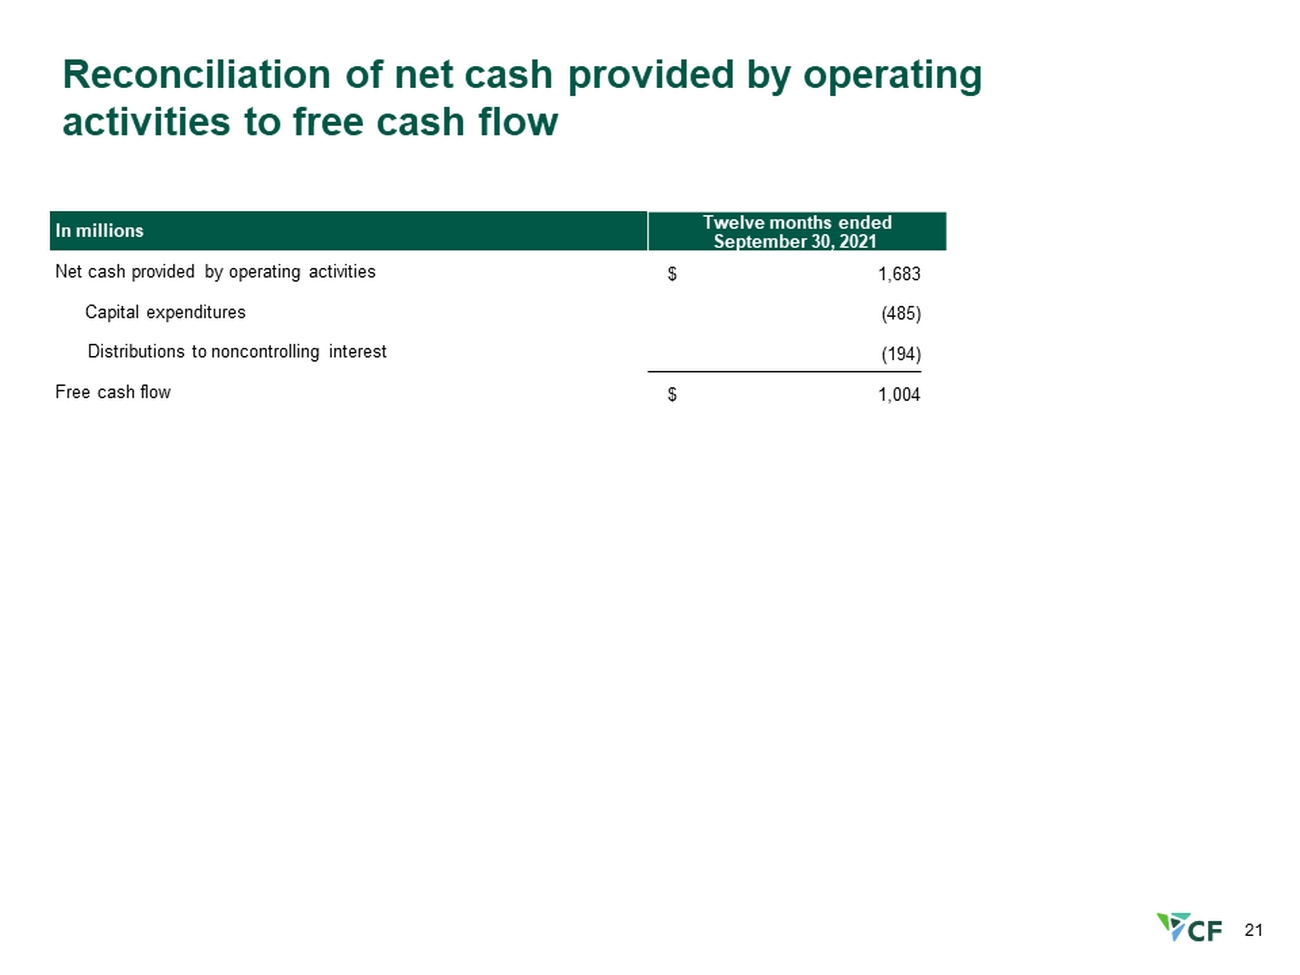
21 Reconciliation of net cash provided by operating activities to free cash flow In millions Twelve months ended September 30, 2021 Net cash provided by operating activities $ 1,683 C apital expenditures (485) Distributions to noncontrolling interest (194) Free cash flow $ 1,004