Exhibit 99.1
2022 First Half and Second Quarter Financial Results August 1, 2022 NYSE: CF
Safe harbor statement All statements in this presentation by CF Industries Holdings, Inc. (together with its subsidiaries, the “Company”), other th an those relating to historical facts, are forward - looking statements. Forward - looking statements can generally be identified by their use of terms s uch as “anticipate,” “believe,” “could,” “estimate,” “expect,” “intend,” “may,” “plan,” “predict,” “project,” “will” or “would” and similar terms and phrases, including references to assumptions. Forward - looking statements are not guarantees of future performance and are subject to a number of as sumptions, risks and uncertainties, many of which are beyond the Company’s control, which could cause actual results to differ materiall y f rom such statements. These statements may include, but are not limited to, statements about strategic plans and management’s expectati ons with respect to the production of green and blue (low - carbon) ammonia, the development of carbon capture and sequestration projects, the transit ion to and growth of a hydrogen economy, greenhouse gas reduction targets, projected capital expenditures, statements about future finan cia l and operating results, and other items described in this presentation. Important factors that could cause actual results to differ material ly from those in the forward - looking statements include, among others, the cyclical nature of the Company’s business and the impact of global supply and demand on the Company’s selling prices; the global commodity nature of the Company’s nitrogen products, the conditions in the internati ona l market for nitrogen products, and the intense global competition from other producers; conditions in the United States, Europe and other ag ricultural areas, including the influence of governmental policies and technological developments on the demand for agricultural products; the vol atility of natural gas prices in North America and the United Kingdom; weather conditions and the impact of severe adverse weather events; the s eas onality of the fertilizer business; the impact of changing market conditions on the Company’s forward sales programs; difficulties in securi ng the supply and delivery of raw materials, increases in their costs or delays or interruptions in their delivery; reliance on third party pro vid ers of transportation services and equipment; the Company’s reliance on a limited number of key facilities; risks associated with cyber security; a cts of terrorism and regulations to combat terrorism; risks associated with international operations; the significant risks and hazards involved i n p roducing and handling the Company’s products against which the Company may not be fully insured; the Company’s ability to manage its indebtedness a nd any additional indebtedness that may be incurred; the Company’s ability to maintain compliance with covenants under its revolving cr edit agreement and the agreements governing its indebtedness; downgrades of the Company’s credit ratings; risks associated with changes in t ax laws and disagreements with taxing authorities; risks involving derivatives and the effectiveness of the Company’s risk measurement an d h edging activities; potential liabilities and expenditures related to environmental, health and safety laws and regulations and permitting requir eme nts; regulatory restrictions and requirements related to greenhouse gas emissions; the development and growth of the market for green and blu e ( low - carbon) ammonia and the risks and uncertainties relating to the development and implementation of the Company’s green and blue ammoni a p rojects; risks associated with expansions of the Company’s business, including unanticipated adverse consequences and the significant res ources that could be required; risks associated with the operation or management of the strategic venture with CHS (the “CHS Strategic Ve ntu re”), risks and uncertainties relating to the market prices of the fertilizer products that are the subject of the supply agreement with CHS ove r the life of the supply agreement, and the risk that any challenges related to the CHS Strategic Venture will harm the Company’s other business relat ion ships; and the impact of the novel coronavirus disease 2019 (COVID - 19) pandemic on our business and operations. More detailed information about factors that may affect the Company’s performance and could cause actual results to differ materially from those in any forward - looking state ments may be found in CF Industries Holdings, Inc.’s filings with the Securities and Exchange Commission, including CF Industries Holdings , I nc.’s most recent annual and quarterly reports on Form 10 - K and Form 10 - Q, which are available in the Investor Relations section of the Company’s web site. It is not possible to predict or identify all risks and uncertainties that might affect the accuracy of our forward - looking statements and, consequently, our descriptions of such risks and uncertainties should not be considered exhaustive. There is no guarantee that any of the event s, plans or goals anticipated by these forward - looking statements will occur, and if any of the events do occur, there is no guarantee what effect they will have on our business, results of operations, cash flows, financial condition and future prospects. Forward - looking statements are given only as of the date of this presentation and the Company disclaims any obligation to update or revise the forward - looking statements, whether as a r esult of new information, future events or otherwise, except as required by law.
Note regarding non - GAAP financial measures The Company reports its financial results in accordance with U.S. generally accepted accounting principles (GAAP). Management believes that EBITDA, adjusted EBITDA, free cash flow, and free cash flow yield, which are non - GAAP financial measures, provide additional meaningful information regarding the Company's performance and financial strength. Non - GAAP financial measures should be viewed in addition to, and not as an alternative for, the Company's reported results prepared in accordance with GAAP. In addition, because not all companies use identical calculations, EBITDA, adjusted EBITDA, free cash flow, and free cash flow yield included in this presentation may not be comparable to similarly titled measures of other companies. Reconciliations of EBITDA, adjusted EBITDA, free cash flow, and free cash flow yield to the most directly comparable GAAP measures are provided in the tables accompanying this presentation. EBITDA is defined as net earnings attributable to common stockholders plus interest expense - net, income taxes, and depreciation and amortization. Other adjustments include the elimination of loan fee amortization that is included in both interest and amortization, and the portion of depreciation that is included in noncontrolling interest. The Company has presented EBITDA because management uses the measure to track performance and believes that it is frequently used by securities analysts, investors and other interested parties in the evaluation of companies in the industry. Adjusted EBITDA is defined as EBITDA adjusted with the selected items included in EBITDA as summarized in the tables accompanying this presentation. The Company has presented adjusted EBITDA because management uses adjusted EBITDA, and believes it is useful to investors, as a supplemental financial measure in the comparison of year - over - year performance. Free cash flow is defined as net cash provided by operating activities, as stated in the consolidated statements of cash flows, reduced by capital expenditures and distributions to noncontrolling interests. Free cash flow yield is defined as free cash flow divided by market value of equity (market cap).The Company has presented free cash flow and free cash flow yield because management uses these measures and believes they are useful to investors, as an indication of the strength of the Company and its ability to generate cash and to evaluate the Company’s cash generation ability relative to its industry competitors. It should not be inferred that the entire free cash flow amount is available for discretionary expenditures.
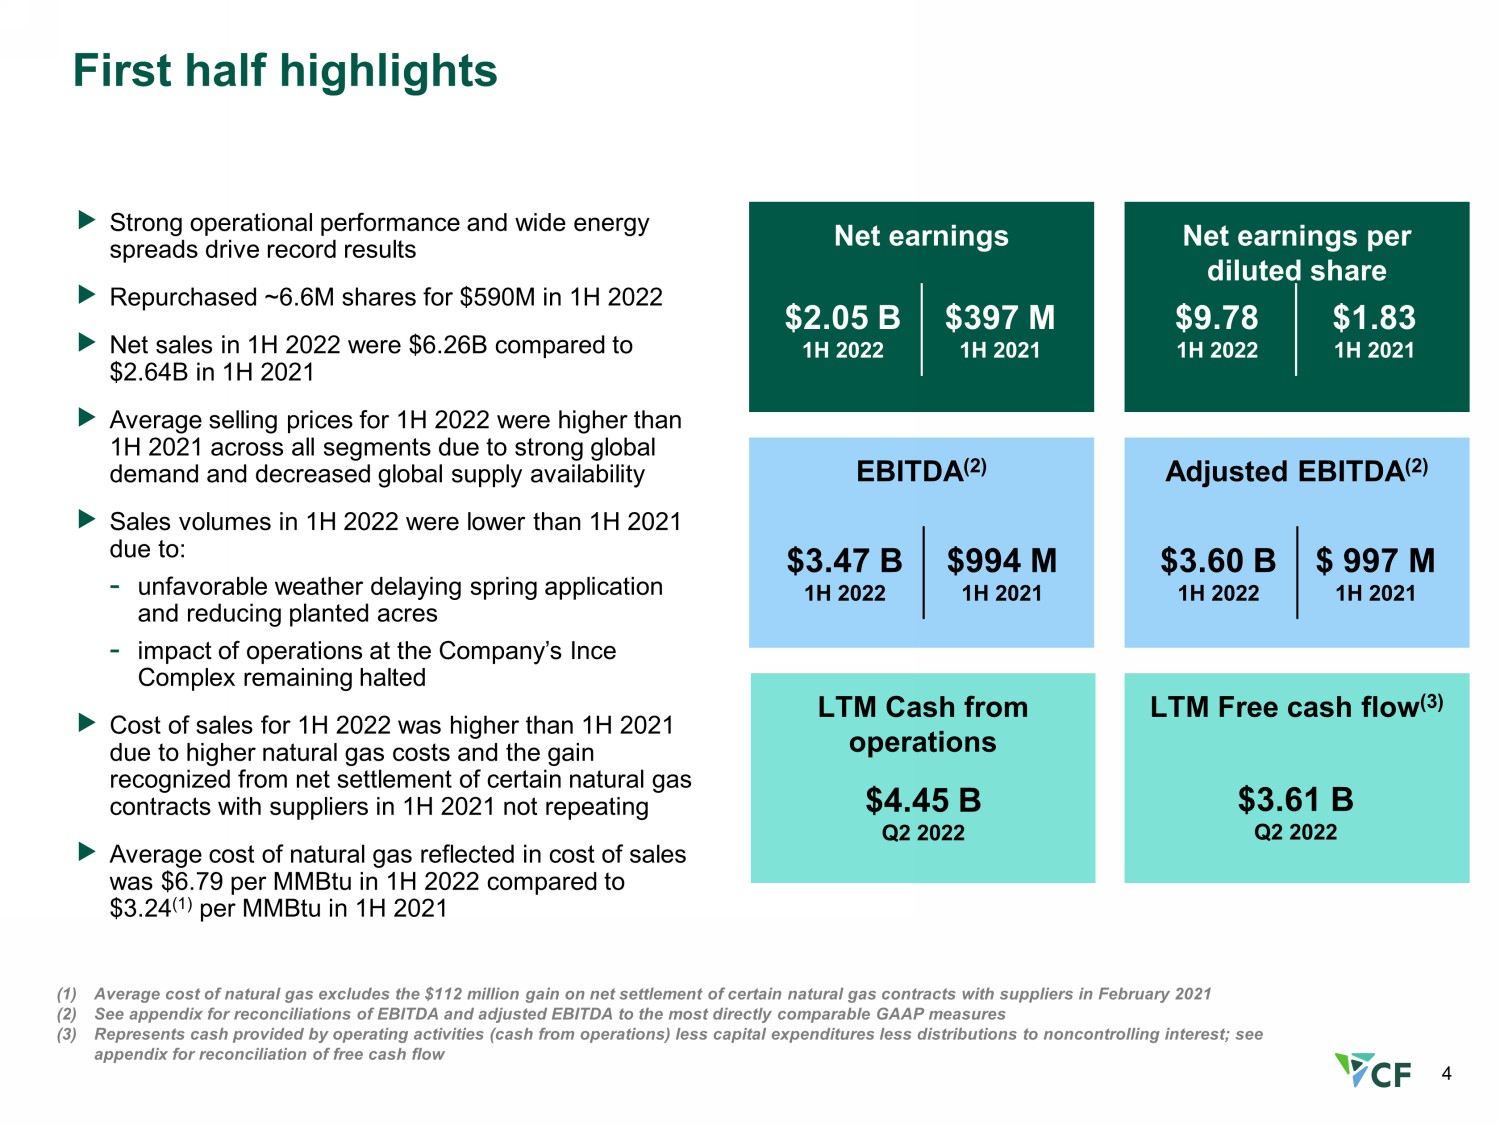
4 First half highlights (1) Average cost of natural gas excludes the $112 million gain on net settlement of certain natural gas contracts with suppliers in February 2021 (2) See appendix for reconciliations of EBITDA and adjusted EBITDA to the most directly comparable GAAP measures (3) Represents cash provided by operating activities (cash from operations) less capital expenditures less distributions to nonco ntr olling interest; see appendix for reconciliation of free cash flow EBITDA (2) Net earnings Net earnings per diluted share Adjusted EBITDA (2) $3.60 B 1H 2022 $ 997 M 1H 2021 $9.78 1H 2022 $1.83 1H 2021 LTM Cash from operations LTM Free cash flow (3) Strong operational performance and wide energy spreads drive record results Repurchased ~6.6M shares for $590M in 1H 2022 Net sales in 1H 2022 were $6.26B compared to $2.64B in 1H 2021 Average selling prices for 1H 2022 were higher than 1H 2021 across all segments due to strong global demand and decreased global supply availability Sales volumes in 1H 2022 were lower than 1H 2021 due to: - unfavorable weather delaying spring application and reducing planted acres - impact of operations at the Company’s Ince Complex remaining halted Cost of sales for 1H 2022 was higher than 1H 2021 due to higher natural gas costs and the gain recognized from net settlement of certain natural gas contracts with suppliers in 1H 2021 not repeating Average cost of natural gas reflected in cost of sales was $6.79 per MMBtu in 1H 2022 compared to $3.24 (1) per MMBtu in 1H 2021 $4.45 B Q2 2022 $3.47 B 1H 2022 $994 M 1H 2021 $2.05 B 1H 2022 $397 M 1H 2021 $3.61 B Q2 2022
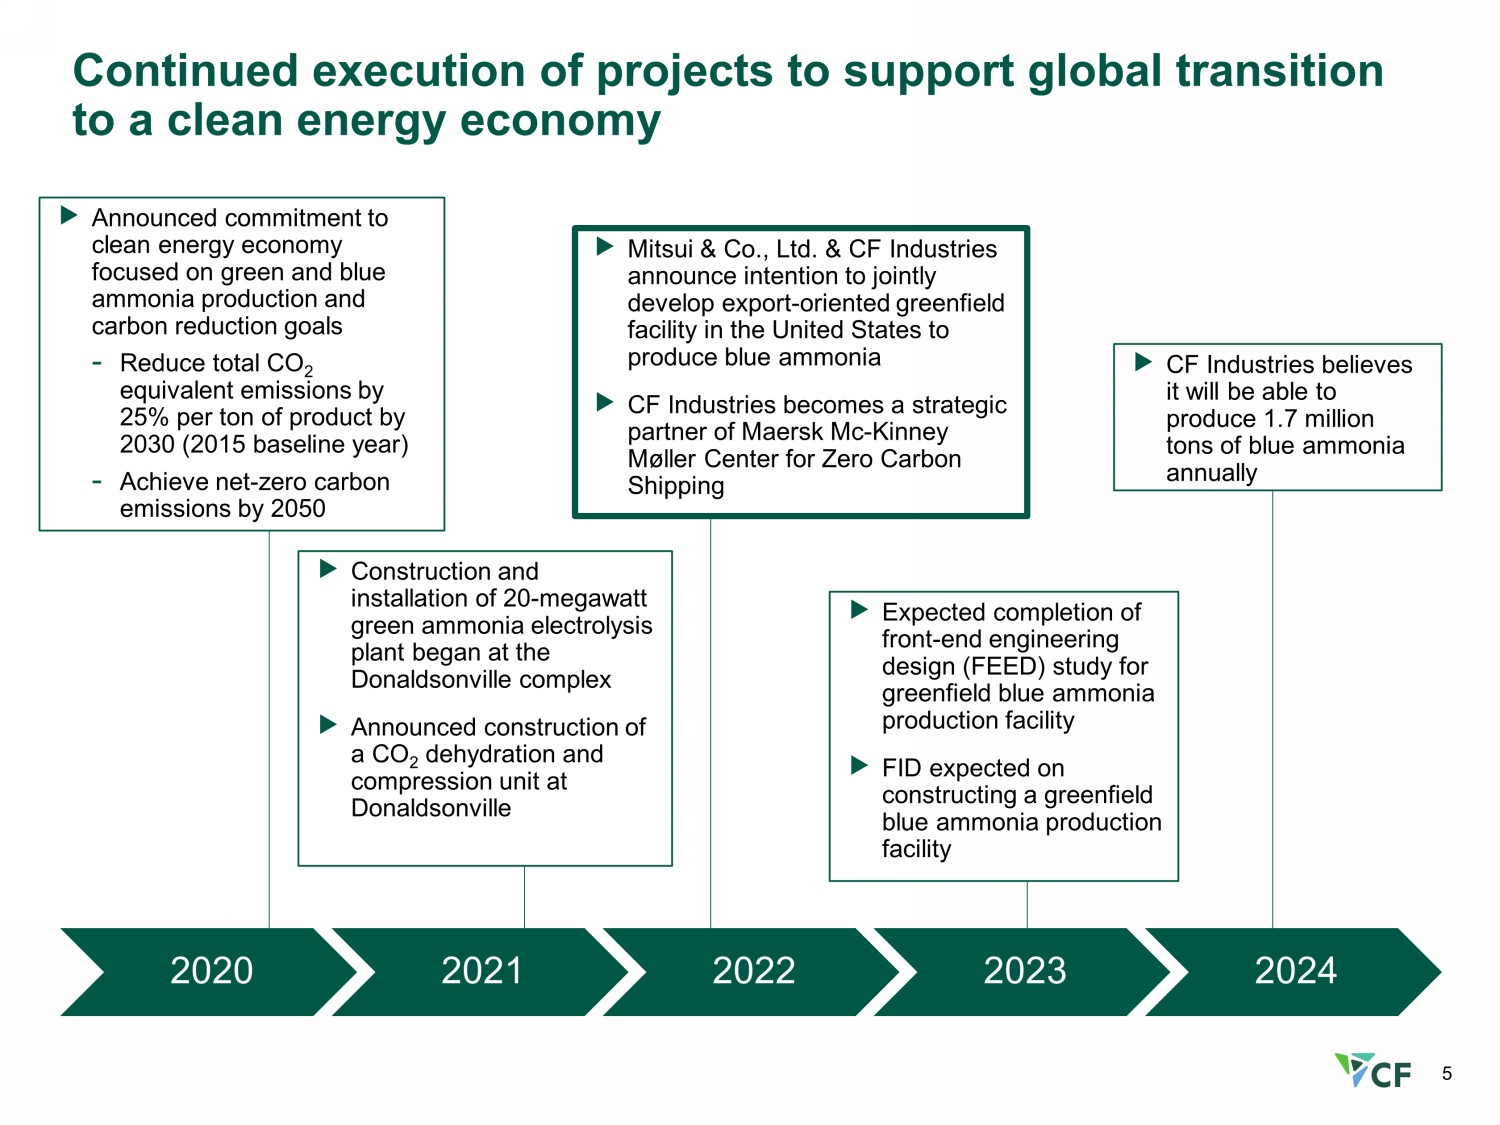
5 Continued execution of projects to support global transition to a clean energy economy 2020 2021 2022 2023 2024 Announced commitment to clean energy economy focused on green and blue ammonia production and carbon reduction goals - Reduce total CO 2 equivalent emissions by 25% per ton of product by 2030 (2015 baseline year) - Achieve net - zero carbon emissions by 2050 Construction and installation of 20 - megawatt green ammonia electrolysis plant began at the Donaldsonville complex Announced construction of a CO 2 dehydration and compression unit at Donaldsonville Expected completion of front - end engineering design (FEED) study for greenfield blue ammonia production facility FID expected on constructing a greenfield blue ammonia production facility Mitsui & Co., Ltd. & CF Industries announce intention to jointly develop export - oriented greenfield facility in the United States to produce blue ammonia CF Industries becomes a strategic partner of Maersk Mc - Kinney M ø ller Center for Zero Carbon Shipping CF Industries believes it will be able to produce 1.7 million tons of blue ammonia annually
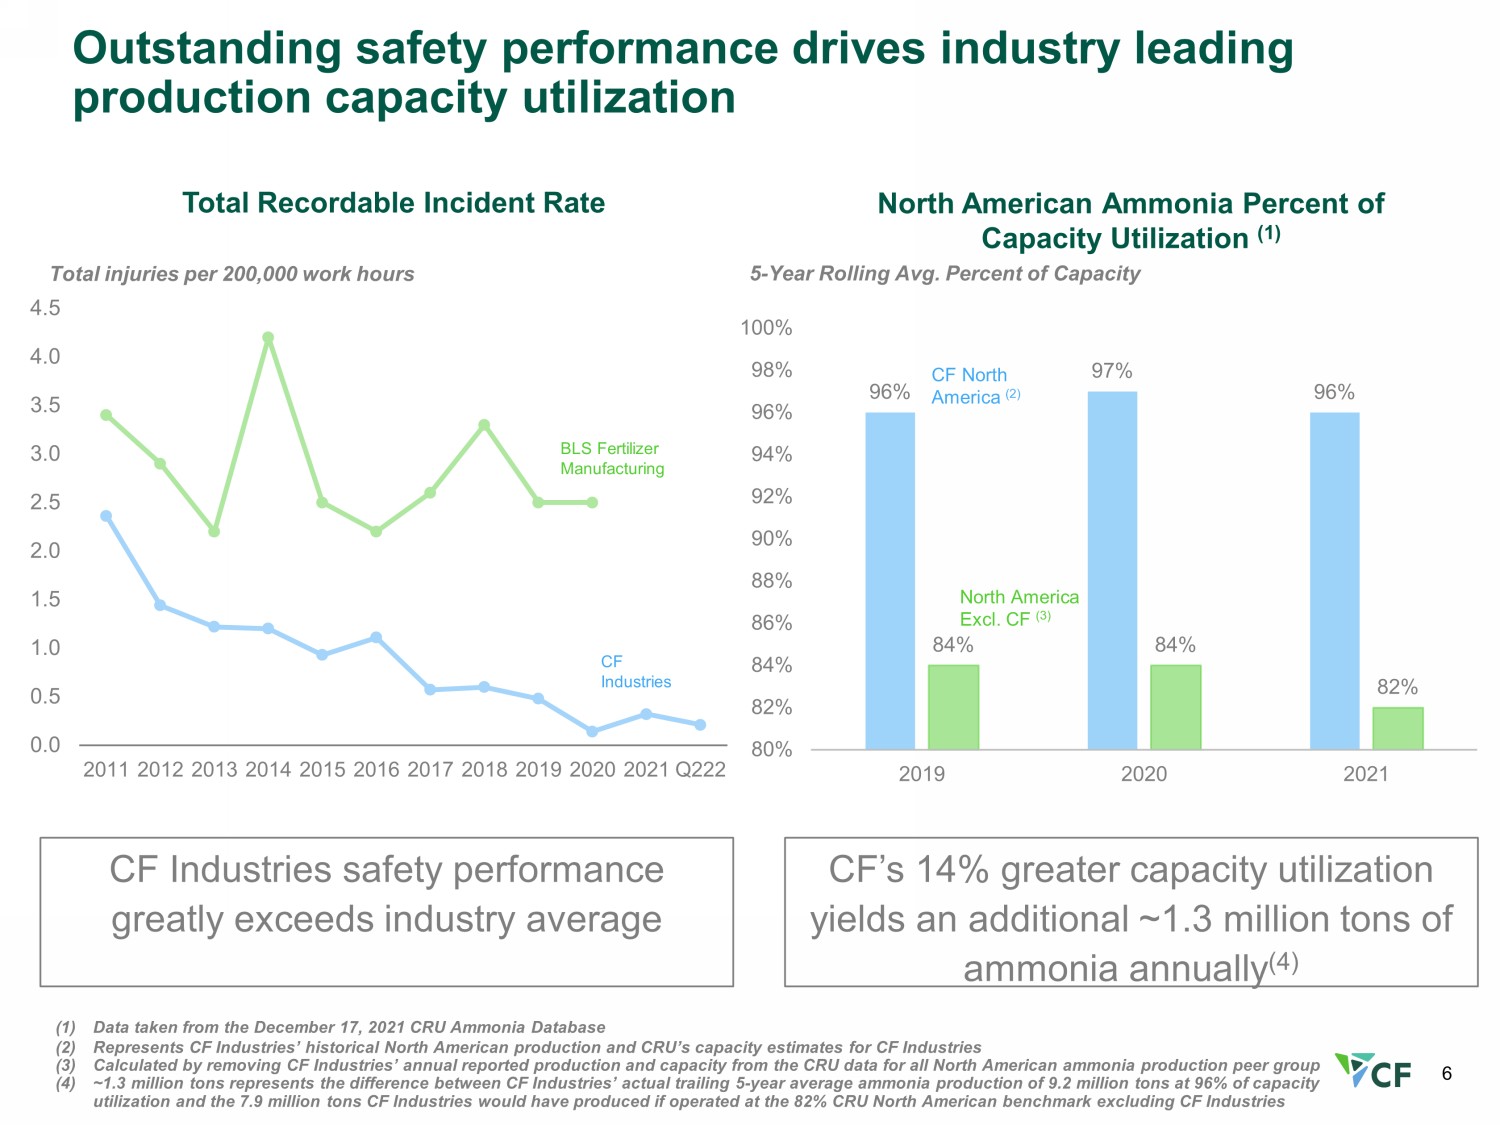
6 (1) Data taken from the December 17, 2021 CRU Ammonia Database (2) Represents CF Industries’ historical North American production and CRU’s capacity estimates for CF Industries (3) Calculated by removing CF Industries’ annual reported production and capacity from the CRU data for all North American ammoni a p roduction peer group (4) ~1.3 million tons represents the difference between CF Industries’ actual trailing 5 - year average ammonia production of 9.2 mill ion tons at 96% of capacity utilization and the 7.9 million tons CF Industries would have produced if operated at the 82% CRU North American benchmark ex clu ding CF Industries 96% 97% 96% 84% 84% 82% 80% 82% 84% 86% 88% 90% 92% 94% 96% 98% 100% 2019 2020 2021 North American Ammonia Percent of Capacity Utilization (1) 5 - Year Rolling Avg. Percent of Capacity CF North America (2) North America Excl. CF (3) CF’s 14% greater capacity utilization yields an additional ~1.3 million tons of ammonia annually (4) Outstanding safety performance drives industry leading production capacity utilization 0.0 0.5 1.0 1.5 2.0 2.5 3.0 3.5 4.0 4.5 2011 2012 2013 2014 2015 2016 2017 2018 2019 2020 2021 Q222 Total injuries per 200,000 work hours Total Recordable Incident Rate BLS Fertilizer Manufacturing CF Industries CF Industries safety performance greatly exceeds industry average
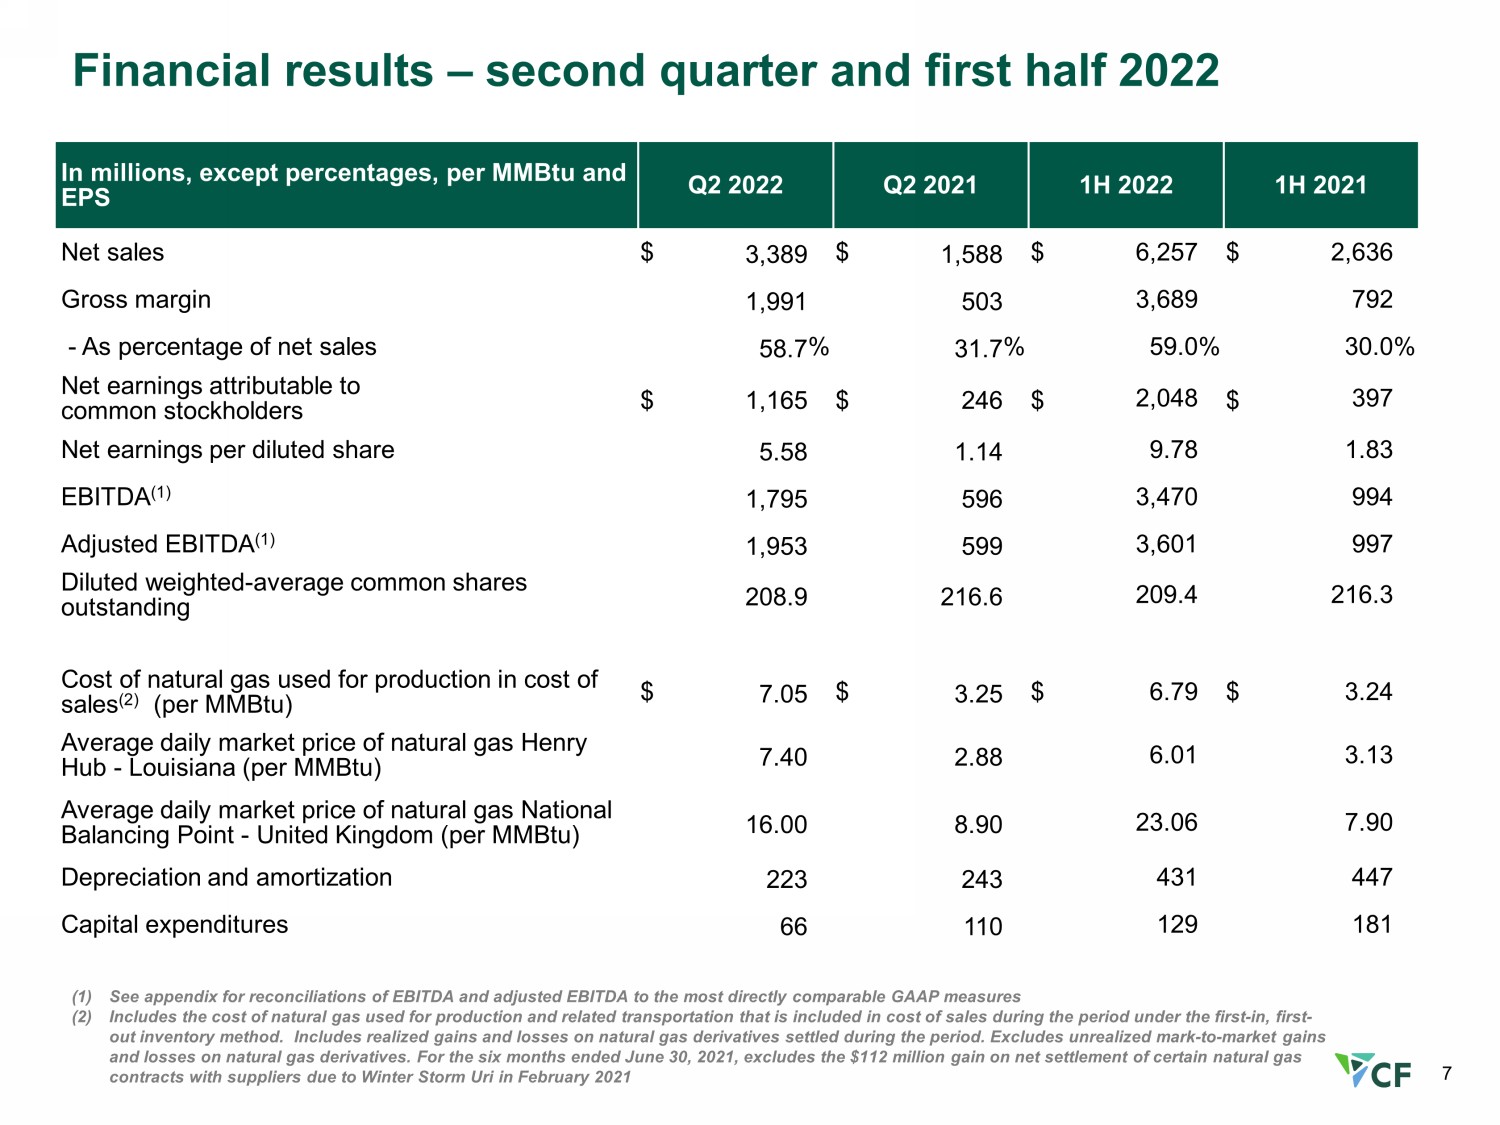
7 Financial results – second quarter and first half 2022 (1) See appendix for reconciliations of EBITDA and adjusted EBITDA to the most directly comparable GAAP measures (2) Includes the cost of natural gas used for production and related transportation that is included in cost of sales during the per iod under the first - in, first - out inventory method. Includes realized gains and losses on natural gas derivatives settled during the period. Excludes unre ali zed mark - to - market gains and losses on natural gas derivatives. For the six months ended June 30, 2021, excludes the $112 million gain on net settleme nt of certain natural gas contracts with suppliers due to Winter Storm Uri in February 2021 I n millions, except percentages, per MMBtu and EPS Q2 20 22 Q2 20 21 1H 20 22 1H 20 21 Net sales $ 3,389 $ 1,588 $ 6,257 $ 2,636 Gross margin 1,991 503 3,689 792 - As percent age of net sales 58.7 % 31.7 % 59.0 % 30.0 % Net earnings attributable to common stockholders $ 1,165 $ 246 $ 2,048 $ 397 Net earnings p er diluted share 5.58 1.14 9.78 1.83 EBITDA ( 1 ) 1,795 596 3,470 994 Adjusted EBITDA ( 1 ) 1,953 599 3,601 997 Diluted weighted - average common shares outstanding 208.9 216.6 209.4 216.3 Cost of n atural gas used for production in cost of sales ( 2 ) (per MMBtu) $ 7.05 $ 3.25 $ 6.79 $ 3.24 Average daily market price of natural gas Henry Hub - Louisiana (per MMBtu) 7.40 2.88 6.01 3.13 Average daily market price of natural gas National Balancing Point - United Kingdom (per MMBtu) 16.00 8.90 23.06 7.90 Depreciation and amortization 223 243 431 447 Capital expenditures 66 110 129 181
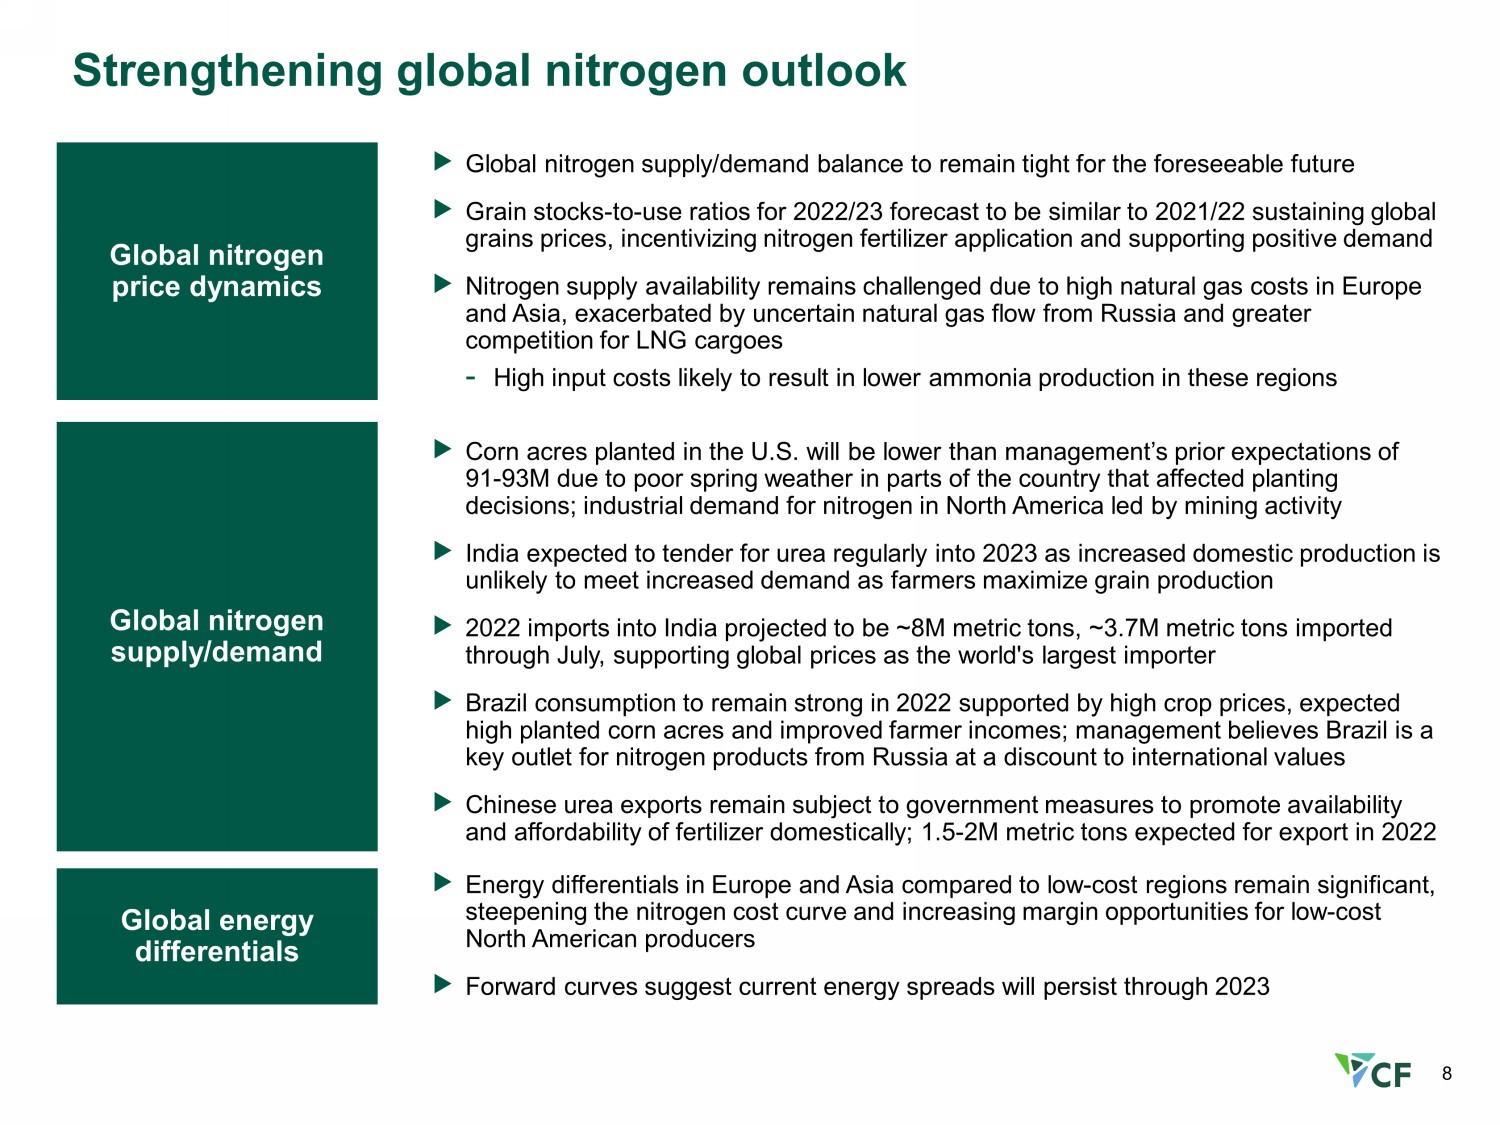
8 Strengthening global nitrogen outlook Global nitrogen price dynamics Global nitrogen supply/demand Global energy differentials Global nitrogen supply/demand balance to remain tight for the foreseeable future Grain stocks - to - use ratios for 2022/23 forecast to be similar to 2021/22 sustaining global grains prices, incentivizing nitrogen fertilizer application and supporting positive demand Nitrogen supply availability remains challenged due to high natural gas costs in Europe and Asia, exacerbated by uncertain natural gas flow from Russia and greater competition for LNG cargoes - High input costs likely to result in lower ammonia production in these regions Corn acres planted in the U.S. will be lower than management’s prior expectations of 91 - 93M due to poor spring weather in parts of the country that affected planting decisions; industrial demand for nitrogen in North America led by mining activity India expected to tender for urea regularly into 2023 as increased domestic production is unlikely to meet increased demand as farmers maximize grain production 2022 imports into India projected to be ~8M metric tons, ~3.7M metric tons imported through July, supporting global prices as the world's largest importer Brazil consumption to remain strong in 2022 supported by high crop prices, expected high planted corn acres and improved farmer incomes; management believes Brazil is a key outlet for nitrogen products from Russia at a discount to international values Chinese urea exports remain subject to government measures to promote availability and affordability of fertilizer domestically; 1.5 - 2M metric tons expected for export in 2022 Energy differentials in Europe and Asia compared to low - cost regions remain significant, steepening the nitrogen cost curve and increasing margin opportunities for low - cost North American producers Forward curves suggest current energy spreads will persist through 2023
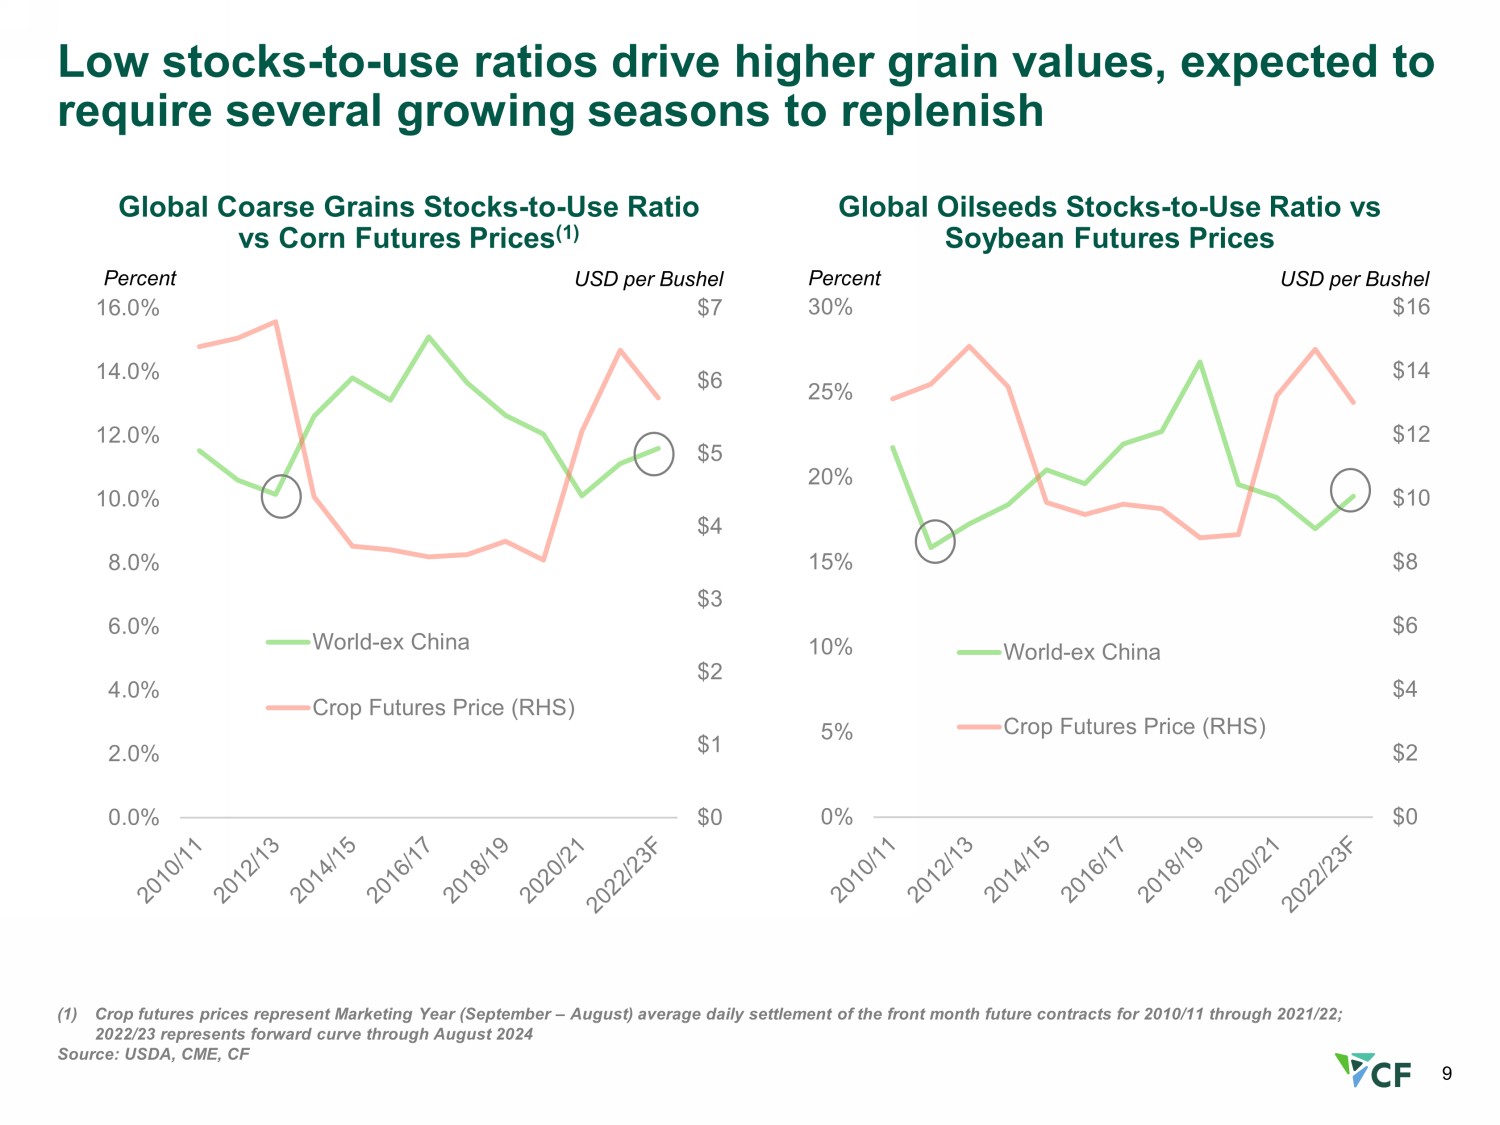
9 Low stocks - to - use ratios drive higher grain values, expected to require several growing seasons to replenish (1) Crop futures prices represent Marketing Year (September – August) average daily settlement of the front month future contracts f or 2010/11 through 2021/22; 2022/23 represents forward curve through August 202 4 Source: USDA, CME, CF Global Coarse Grains Stocks - to - Use Ratio vs Corn Futures Prices (1) Percent $0 $1 $2 $3 $4 $5 $6 $7 0.0% 2.0% 4.0% 6.0% 8.0% 10.0% 12.0% 14.0% 16.0% World-ex China Crop Futures Price (RHS) USD per Bushel Global Oilseeds Stocks - to - Use Ratio vs Soybean Futures Prices Percent $0 $2 $4 $6 $8 $10 $12 $14 $16 0% 5% 10% 15% 20% 25% 30% World-ex China Crop Futures Price (RHS) USD per Bushel
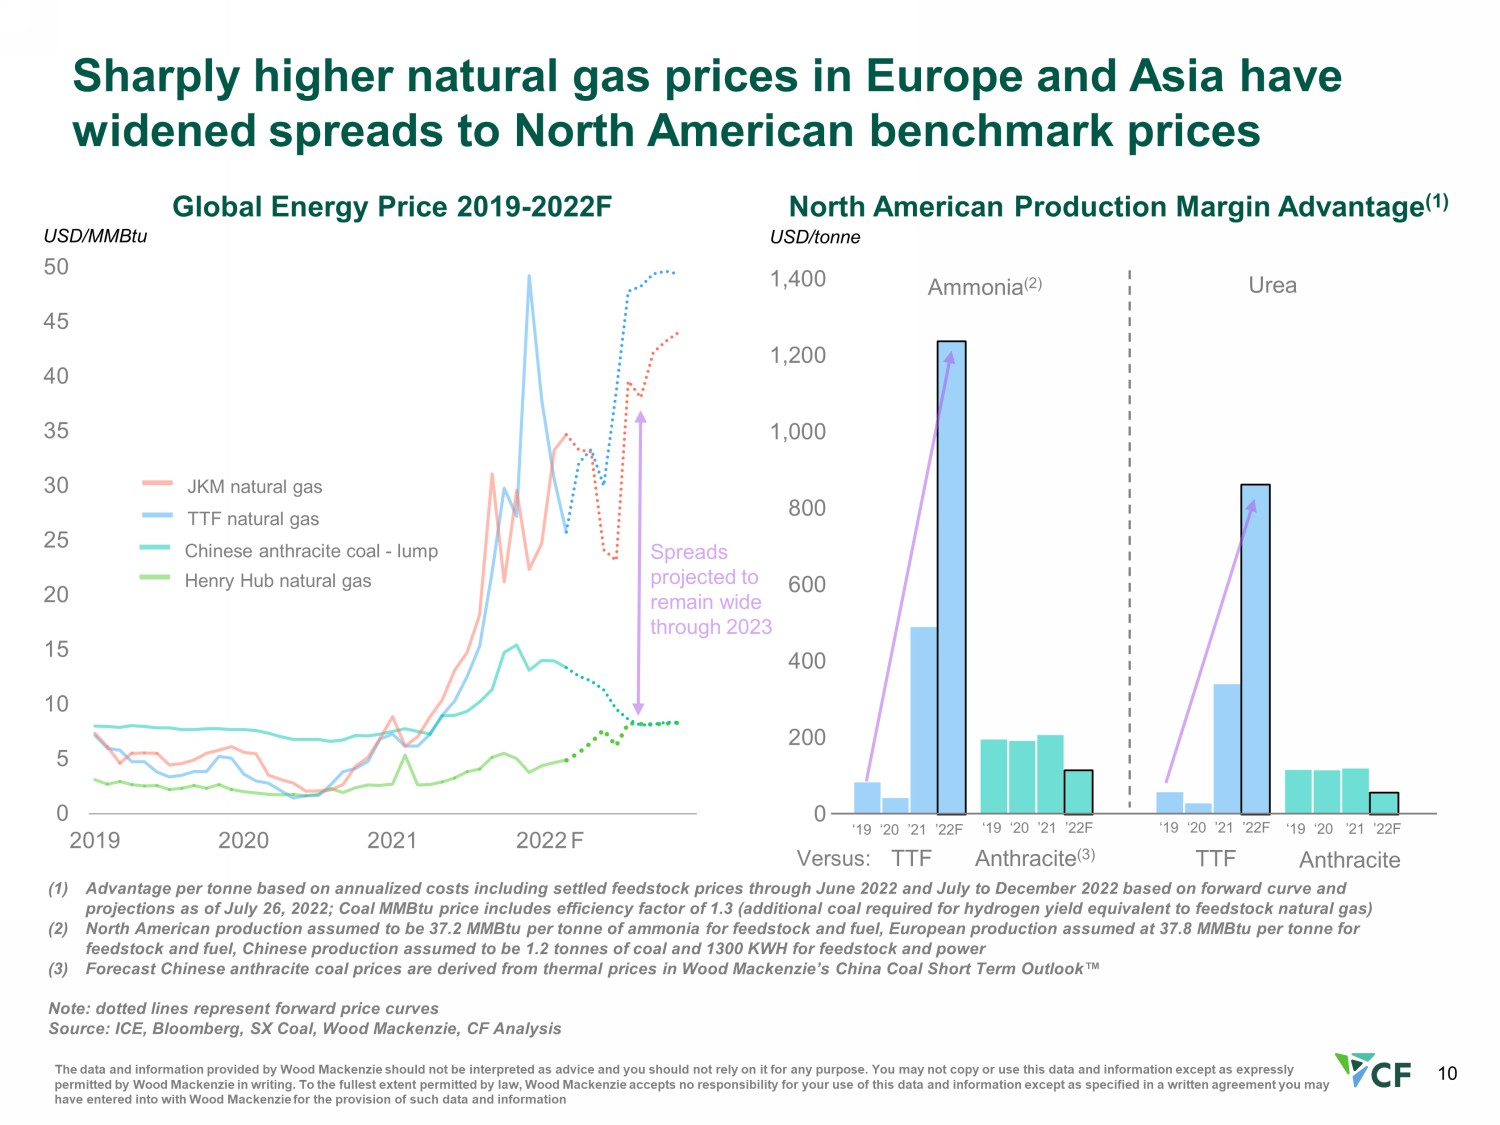
10 Sharply higher natural gas prices in Europe and Asia have widened spreads to North American benchmark prices Global Energy Price 2019 - 2022F USD/ tonne North American Production Margin Advantage (1) 0 5 10 15 20 25 30 35 40 45 50 2019 2020 2021 2022 Henry Hub natural gas TTF natural gas Chinese anthracite coal - lump JKM natural gas 0 200 400 600 800 1,000 1,200 1,400 Ammonia (2) Urea TTF Anthracite (3) ‘19 ‘20 ’21 ’22F TTF Anthracite USD/MMBtu (1) Advantage per tonne based on annualized costs including settled feedstock prices through June 2022 and July to December 2022 based on forward cur ve and projections as of July 26, 2022; Coal MMBtu price includes efficiency factor of 1.3 (additional coal required for hydrogen yi eld equivalent to feedstock natural gas) (2) North American production assumed to be 37.2 MMBtu per tonne of ammonia for feedstock and fuel, European production assumed at 37.8 MMBtu per tonne for feedstock and fuel, Chinese production assumed to be 1.2 tonnes of coal and 1300 KWH for feedstock and power (3) Forecast Chinese anthracite coal prices are derived from thermal prices in Wood Mackenzie’s China Coal Short Term Outlook Œ Note: dotted lines represent forward price curves Source: ICE, Bloomberg, SX Coal, Wood Mackenzie, CF Analysis Spreads projected to remain wide through 2023 ‘19 ‘20 ’21 ’22F ‘19 ‘20 ’21 ’22F ‘19 ‘20 ’21 ’22F F The data and information provided by Wood Mackenzie should not be interpreted as advice and you should not rely on it for any pu rpose. You may not copy or use this data and information except as expressly permitted by Wood Mackenzie in writing. To the fullest extent permitted by law, Wood Mackenzie accepts no responsibility for you r use of this data and information except as specified in a written agreement you may have entered into with Wood Mackenzie for the provision of such data and information Versus:
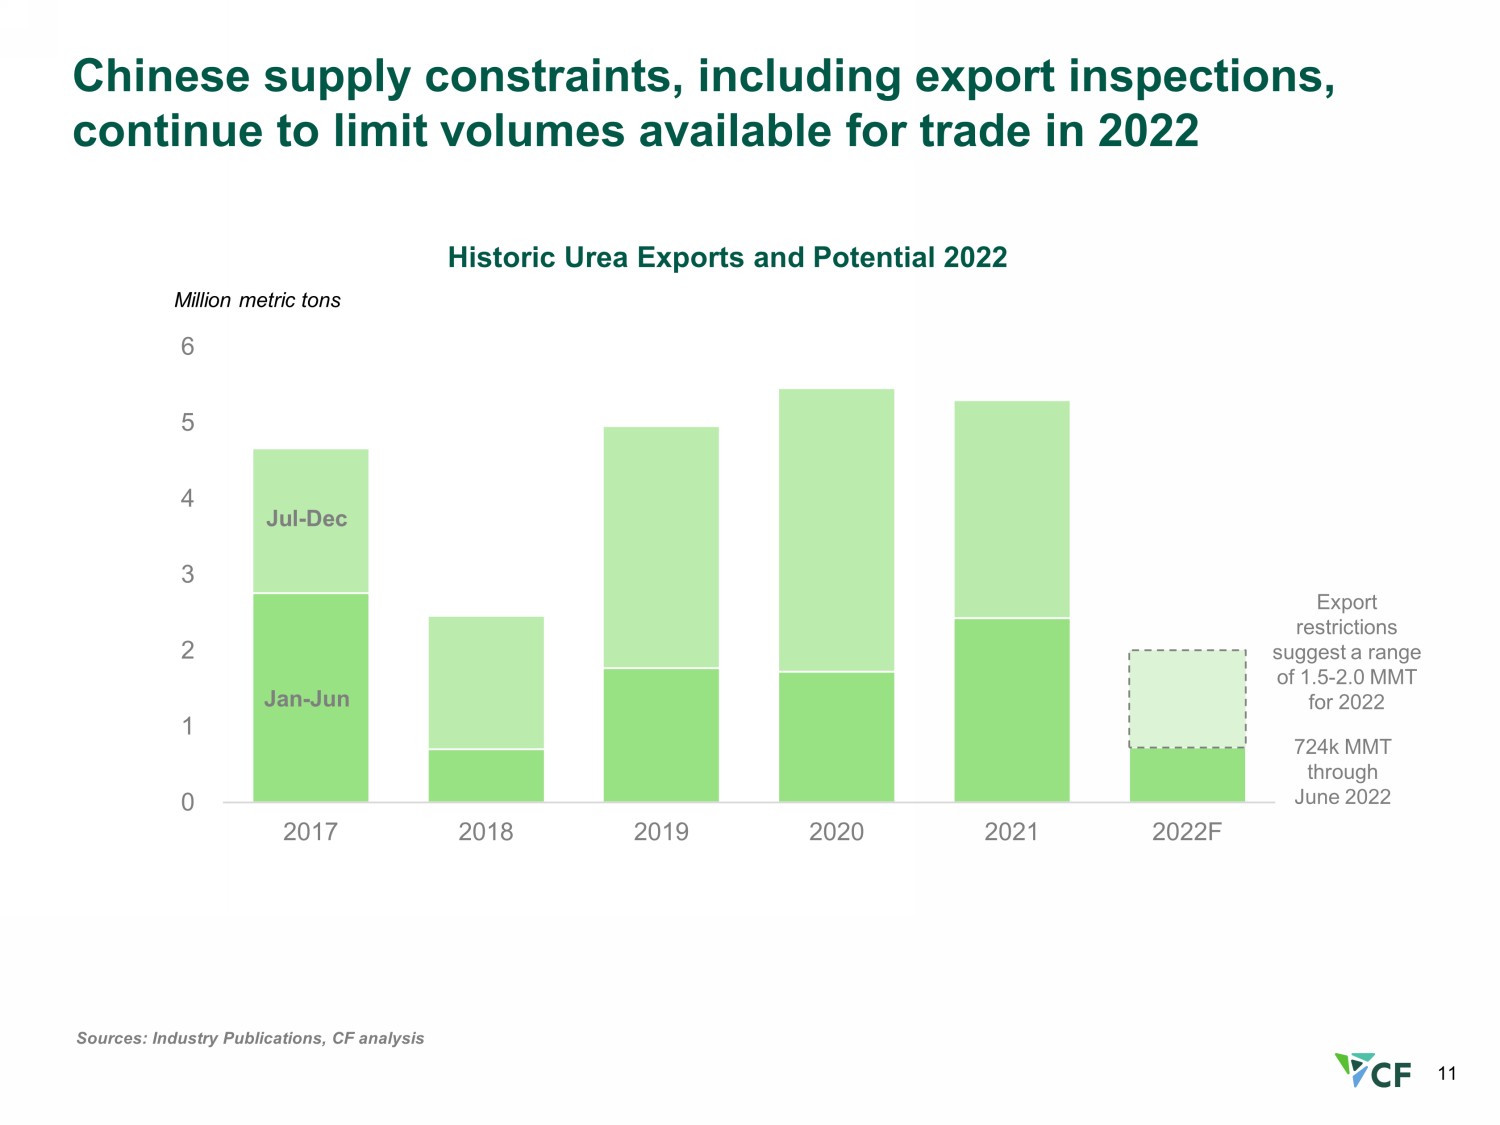
11 Chinese supply constraints, including export inspections, continue to limit volumes available for trade in 2022 Sources: Industry Publications, CF analysis 0 1 2 3 4 5 6 2017 2018 2019 2020 2021 2022F Historic Urea Exports and Potential 2022 Jan - Jun Jul - Dec Million metric t ons Export restrictions suggest a range of 1.5 - 2.0 MMT for 2022 724k MMT through June 2022
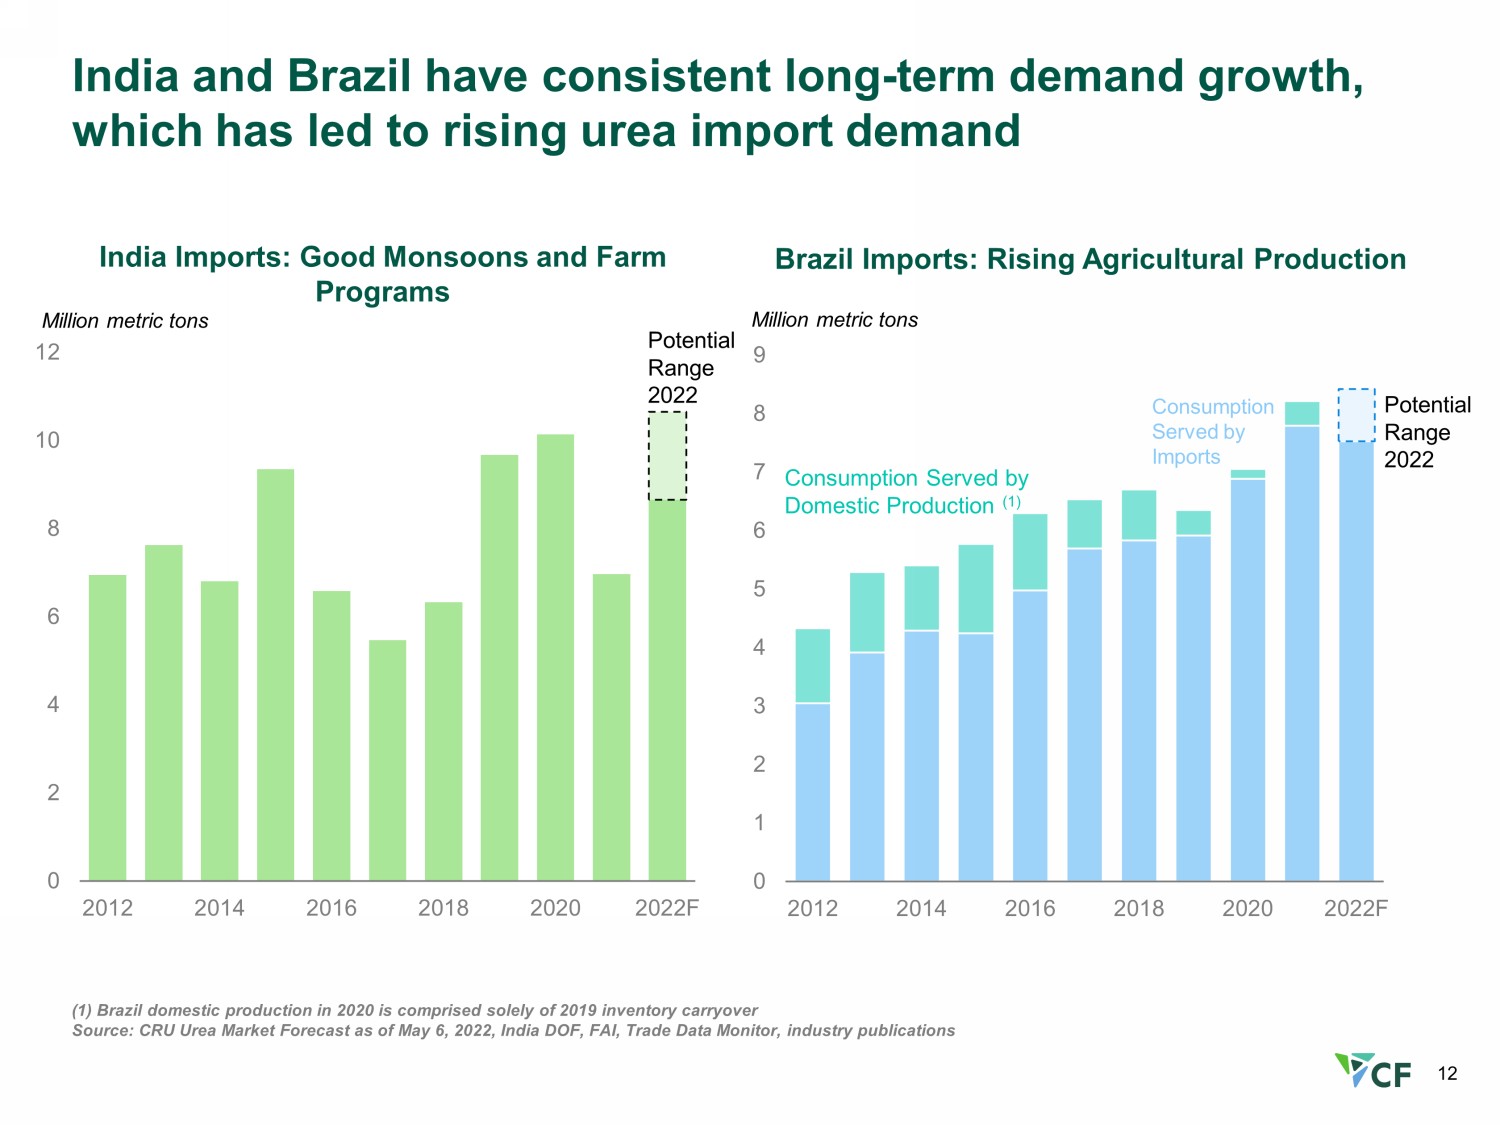
12 India and Brazil have consistent long - term demand growth, which has led to rising urea import demand (1) Brazil domestic production in 2020 is comprised solely of 2019 inventory carryover Source: CRU Urea Market Forecast as of May 6, 2022, India DOF, FAI, Trade Data Monitor, industry publications 0 2 4 6 8 10 12 2012 2014 2016 2018 2020 2022F 0 1 2 3 4 5 6 7 8 9 2012 2014 2016 2018 2020 2022F India Imports: Good Monsoons and Farm Programs Million metric tons Potential Range 2022 Brazil Imports: Rising Agricultural Production Million metric tons Consumption Served by Domestic Production (1) Consumption Served by Imports Potential Range 2022
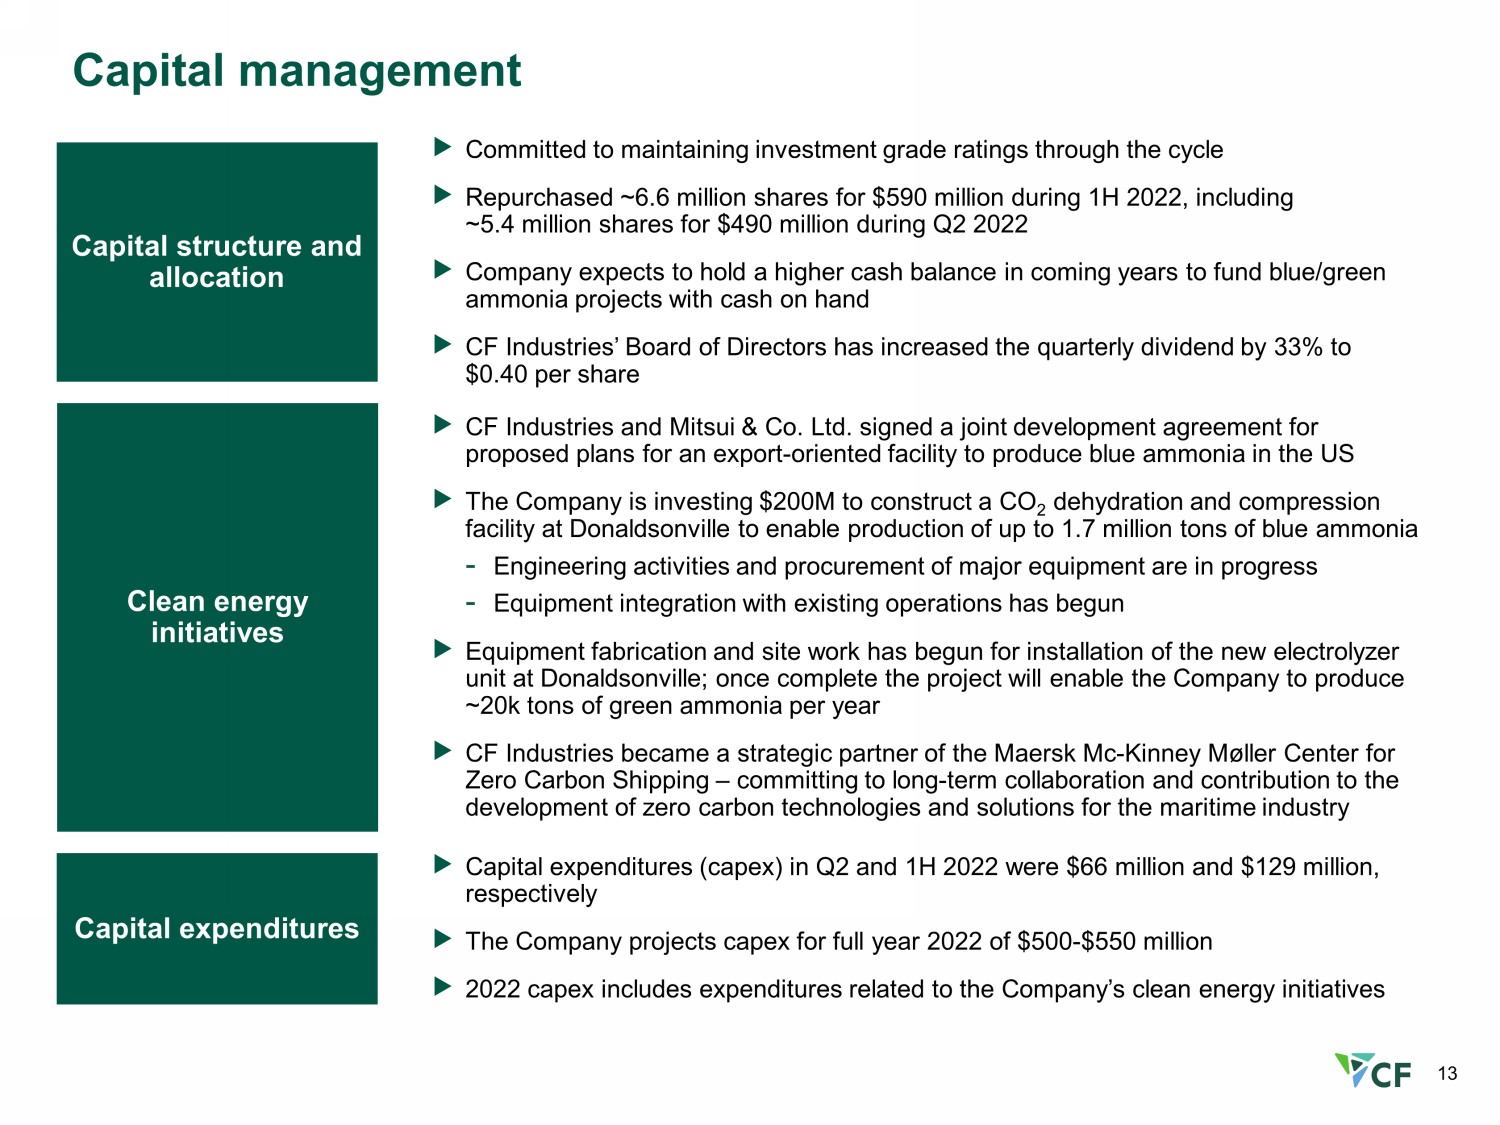
13 Capital management Capital structure and allocation Clean energy initiatives Capital expenditures Committed to maintaining investment grade ratings through the cycle Repurchased ~6.6 million shares for $590 million during 1H 2022, including ~5.4 million shares for $490 million during Q2 2022 Company expects to hold a higher cash balance in coming years to fund blue/green ammonia projects with cash on hand CF Industries’ Board of Directors has increased the quarterly dividend by 33% to $0.40 per share CF Industries and Mitsui & Co. Ltd. signed a joint development agreement for proposed plans for an export - oriented facility to produce blue ammonia in the US The Company is investing $200M to construct a CO 2 dehydration and compression facility at Donaldsonville to enable production of up to 1.7 million tons of blue ammonia - Engineering activities and procurement of major equipment are in progress - Equipment integration with existing operations has begun Equipment fabrication and site work has begun for installation of the new electrolyzer unit at Donaldsonville; once complete the project will enable the Company to produce ~20k tons of green ammonia per year CF Industries became a strategic partner of the Maersk Mc - Kinney M ø ller Center for Zero Carbon Shipping – committing to long - term collaboration and contribution to the development of zero carbon technologies and solutions for the maritime industry Capital expenditures (capex) in Q2 and 1H 2022 were $66 million and $129 million, respectively The Company projects capex for full year 2022 of $500 - $550 million 2022 capex includes expenditures related to the Company’s clean energy initiatives

14 2.6 6.0 (1) 6.0 6.1 6.6 (2) 6.6 7.0 (3) 8.1 (4) 8.1 8.2 (5) 8.2 8.2 8.2 8.2 All N production numbers based on year end figures per 10 - K filings. (1) Beginning in 2010 includes capacity from Terra Industries acquisition (2) Beginning in 2013 includes incremental 34% of Medicine Hat production to reflect CF acquisition of Viterra's interests (3) Beginning in 2015 includes incremental 50% interest in CF Fertilisers UK acquired from Yara (4) Beginning in 2016 excludes nitrogen equivalent of 1.1 million tons of urea and 0.58 million tons of UAN under CHS supply agreement and includes expansion project capacity at Donaldsonville and Port Neal (5) Beginning in 2018 includes incremental 15% of Verdigris production to reflect CF’s acquisition of publicly traded TNH units (6) Share count based on end of period common shares outstanding; share count prior to 2015 based on 5 - for - 1 split - adjusted shares Production Capacity (M nutrient tons) Annual Nitrogen Equivalent Tons per 1,000 Shares Outstanding CF Industries’ Nitrogen Volumes and Shares Outstanding as of Year - end and Quarter - end Shar es Outstanding (in millions) (6) 2009 – Q2 2022 Nitrogen per share CAGR: 11.2% 10.7 16.9 18.4 19.5 23.5 27.2 30.0 34.7 34.7 37.0 38.1 38.5 39.7 40.4 0 50 100 150 200 250 300 350 400 0 5 10 15 20 25 30 35 40 45 2009 2010 2011 2012 2013 2014 2015 2016 2017 2018 2019 2020 2021 Q222 By using free cash flow to grow capacity and repurchase shares, shareholders accrued more of the asset base…
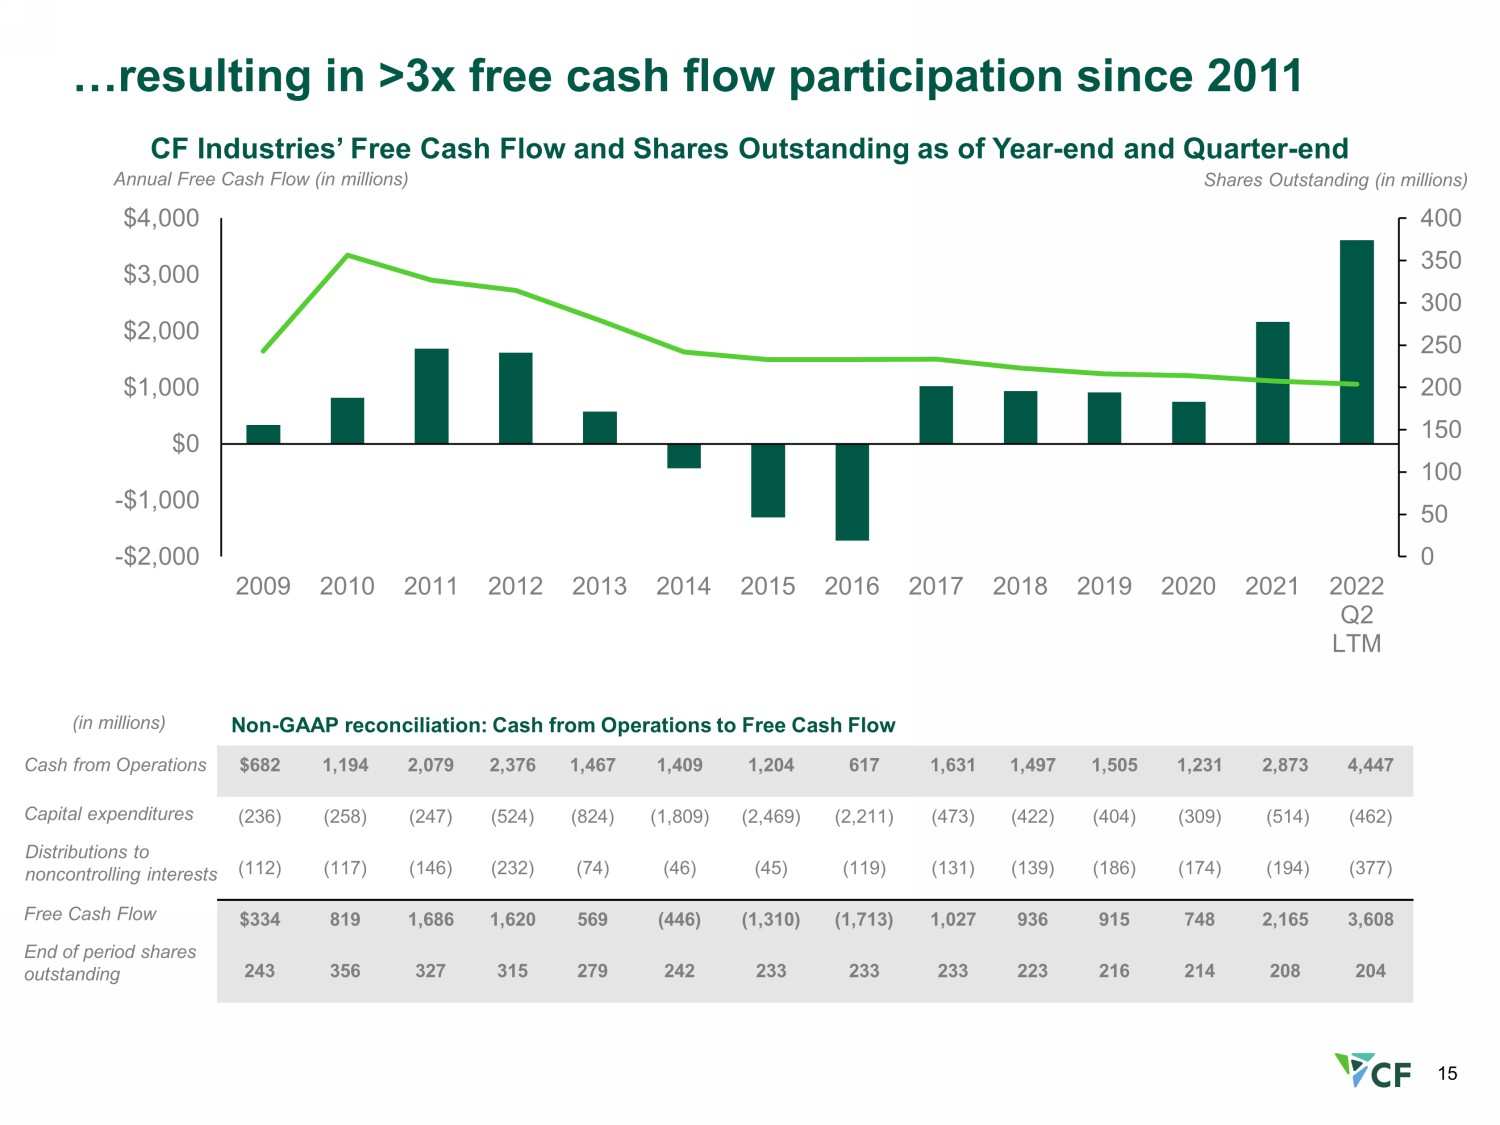
15 Annual Free Cash Flow (in millions) CF Industries’ Free Cash Flow and Shares Outstanding as of Year - end and Quarter - end Shar es Outstanding (in millions) 0 50 100 150 200 250 300 350 400 -$2,000 -$1,000 $0 $1,000 $2,000 $3,000 $4,000 2009 2010 2011 2012 2013 2014 2015 2016 2017 2018 2019 2020 2021 2022 Q2 LTM …resulting in >3x free cash flow participation since 2011 $682 1,194 2,079 2,376 1,467 1,409 1,204 617 1,631 1,497 1,505 1,231 2,873 4,447 (236) (258) (247) (524) (824) (1,809) (2,469) (2,211) (473) (422) (404) (309) (514) (462) (112) (117) (146) (232) (74) (46) (45) (119) (131) (139) (186) (174) (194) (377) $334 819 1,686 1,620 569 (446) (1,310) (1,713) 1,027 936 915 748 2,165 3,608 243 356 327 315 279 242 233 233 233 223 216 214 208 204 End of period shares outstanding Cash from Operations Capital expenditures Distributions to noncontrolling interests Free Cash Fl ow (in millions) Non - GAAP reconciliation: Cash from Operations to Free Cash Flow
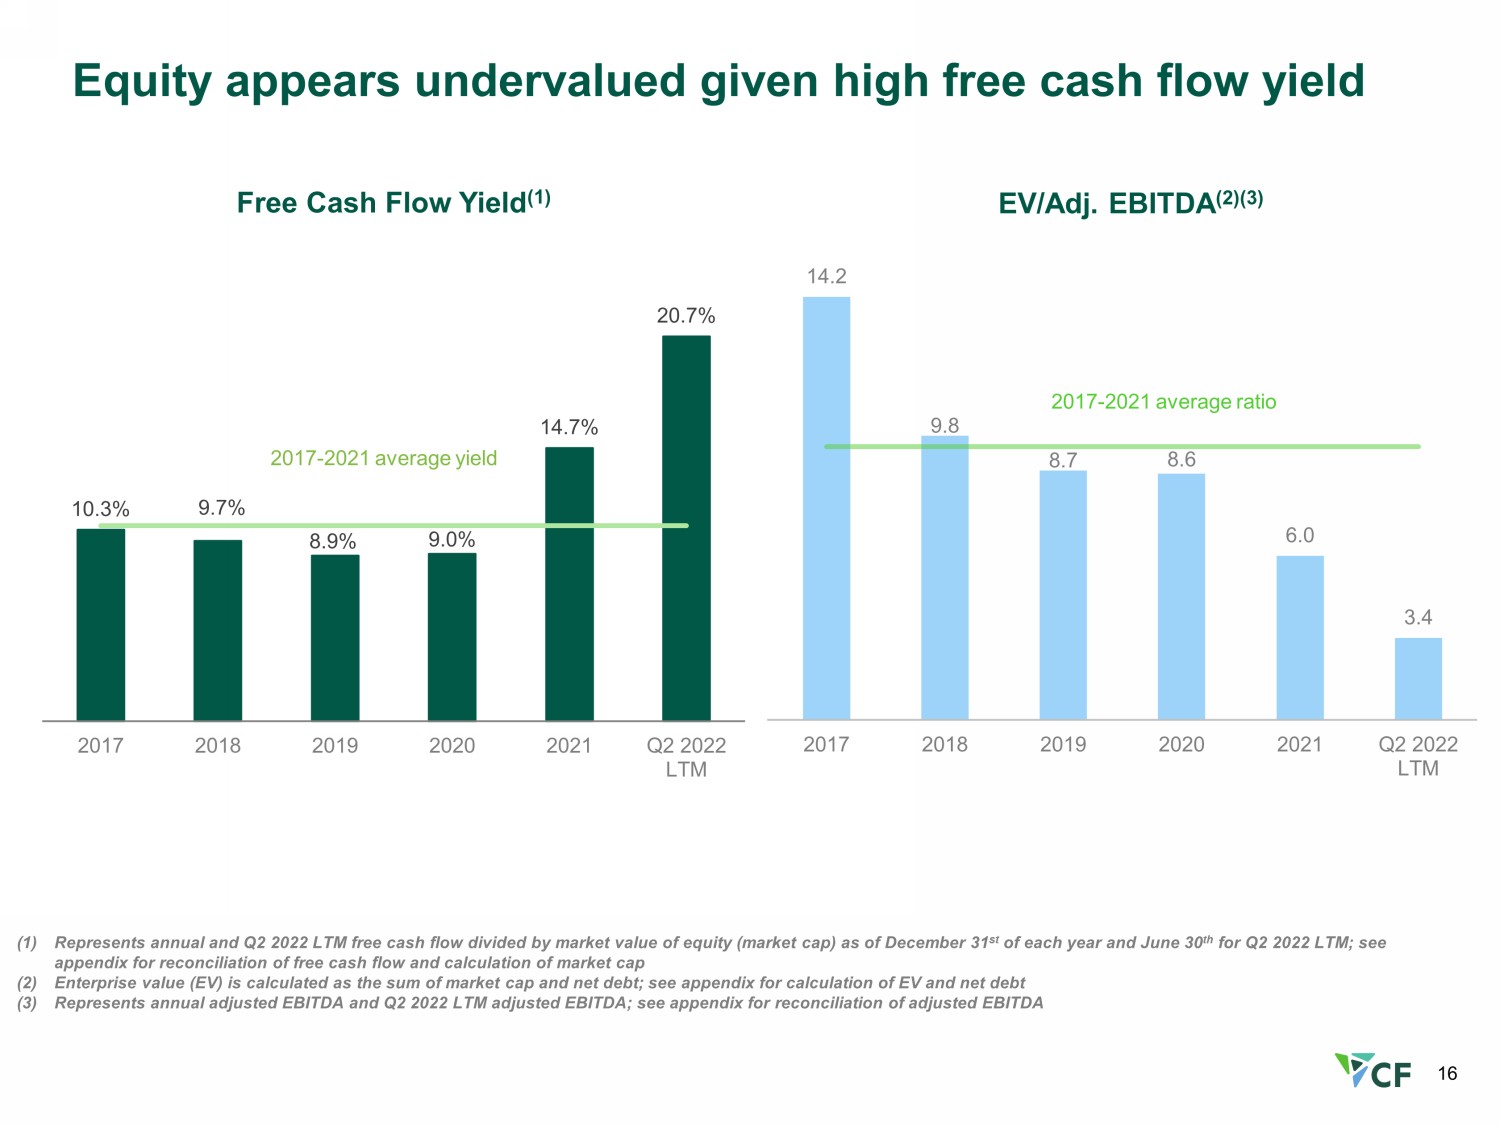
16 14.2 9.8 8.7 8.6 6.0 3.4 2017 2018 2019 2020 2021 Q2 2022 LTM 2017 - 2021 average ratio EV/Adj. EBITDA (2)(3) Equity appears undervalued given high free cash flow yield 10.3% 9.7% 8.9% 9.0% 14.7% 20.7% 2017 2018 2019 2020 2021 Q2 2022 LTM 2017 - 2021 average yield Free Cash Flow Yield (1) (1) Represents annual and Q2 2022 LTM free cash flow divided by market value of equity (market cap) as of December 31 st of each year and June 30 th for Q2 2022 LTM; see appendix for reconciliation of free cash flow and calculation of market cap (2) Enterprise value (EV) is calculated as the sum of market cap and net debt; see appendix for calculation of EV and net debt (3) Represents annual adjusted EBITDA and Q2 2022 LTM adjusted EBITDA; see appendix for reconciliation of adjusted EBITDA

Appendix

18 CF Industries EBITDA sensitivity table Table illustrates the CF Industries business model across a broad range of industry conditions $50/ton urea realized movement implies ~$750M change in EBITDA on an annual basis (1) Based on 2019 sales volumes of approximately 19.5 million product tons, 2019 gas consumption of 344 million MMBtus and 2021 n itr ogen product sales price relationships. Changes in product prices and gas costs are not applied to the CHS minority interest or industrial cont rac ts where CF Industries is naturally hedged against changes in product prices and gas costs (2) Assumes that a $50 per ton change in urea prices is also applied proportionally to all nitrogen products and is equivalent to a $34.78 per ton change in UAN price, $36.96 per ton change in AN price, $89.14 per ton change in ammonia price, and $21.20 per ton change in the price of the Other segment EBITDA Sensitivity to Natural Gas and Urea Prices (1) $ billions CF Realized Natural Gas Cost ($/MMBtu) CF Realized Urea Price ($/ton) (2) 4.50 5.00 5.50 6.00 6.50 7.00 7.50 8.00 8.50 $450 $3.3 $3.2 $3.1 $2.9 $2.8 $2.6 $2.5 $2.4 $2.2 $500 $4.1 $4.0 $3.8 $3.7 $3.5 $3.4 $3.3 $3.1 $3.0 $550 $4.8 $4.7 $4.6 $4.4 $4.3 $4.2 $4.0 $3.9 $3.7 $600 $5.6 $5.5 $5.3 $5.2 $5.0 $4.9 $4.8 $4.6 $4.5 $650 $6.4 $6.2 $6.1 $5.9 $5.8 $5.7 $5.5 $5.4 $5.2 $700 $7.1 $7.0 $6.8 $6.7 $6.6 $6.4 $6.3 $6.1 $6.0 $750 $7.9 $7.7 $7.6 $7.4 $7.3 $7.2 $7.0 $6.9 $6.8 $800 $8.6 $8.5 $8.3 $8.2 $8.1 $7.9 $7.8 $7.6 $7.5 $850 $9.4 $9.2 $9.1 $9.0 $8.8 $8.7 $8.5 $8.4 $8.3
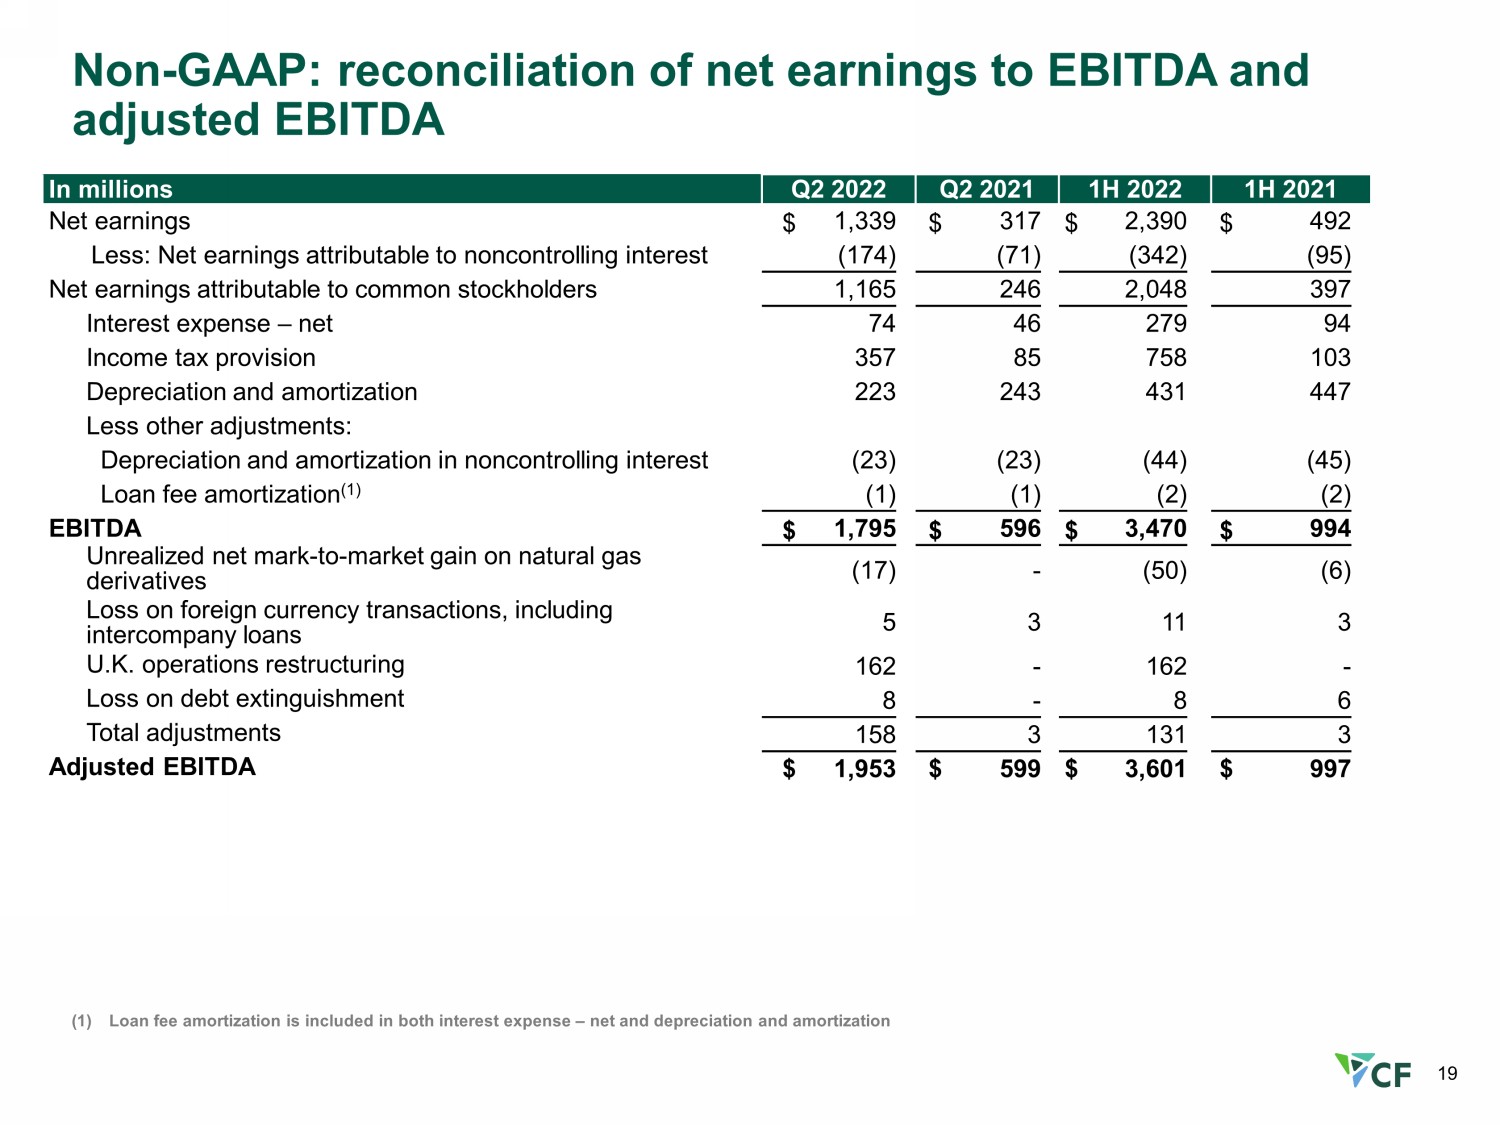
19 Non - GAAP: reconciliation of net earnings to EBITDA and adjusted EBITDA (1) Loan fee amortization is included in both interest expense – net and depreciation and amortization In millions Q2 20 22 Q2 2021 1H 20 22 1H 2021 Net earnings $ 1,339 $ 317 $ 2,390 $ 492 Less: Net earnings attributable to noncontrolling interest (174) (71) (342) (95) Net earnings attributable to common stockholders 1,165 246 2,048 397 Interest expense – net 74 46 279 94 Income tax provision 357 85 758 103 Depreciation and amortization 223 243 431 447 Less other adjustments: Depreciation and amortization in noncontrolling interest (23) (23) (44) (45) Loan fee amortization (1) (1) (1) (2) (2) EBITDA $ 1,795 $ 596 $ 3,470 $ 994 Unrealized net mark - to - market gain on natural gas derivatives (17) - (50) (6) Loss on foreign currency transactions, including intercompany loans 5 3 11 3 U.K. operations restructuring 162 - 162 - Loss on debt extinguishment 8 - 8 6 Total adjustments 158 3 131 3 Adjusted EBITDA $ 1,953 $ 599 $ 3,601 $ 997
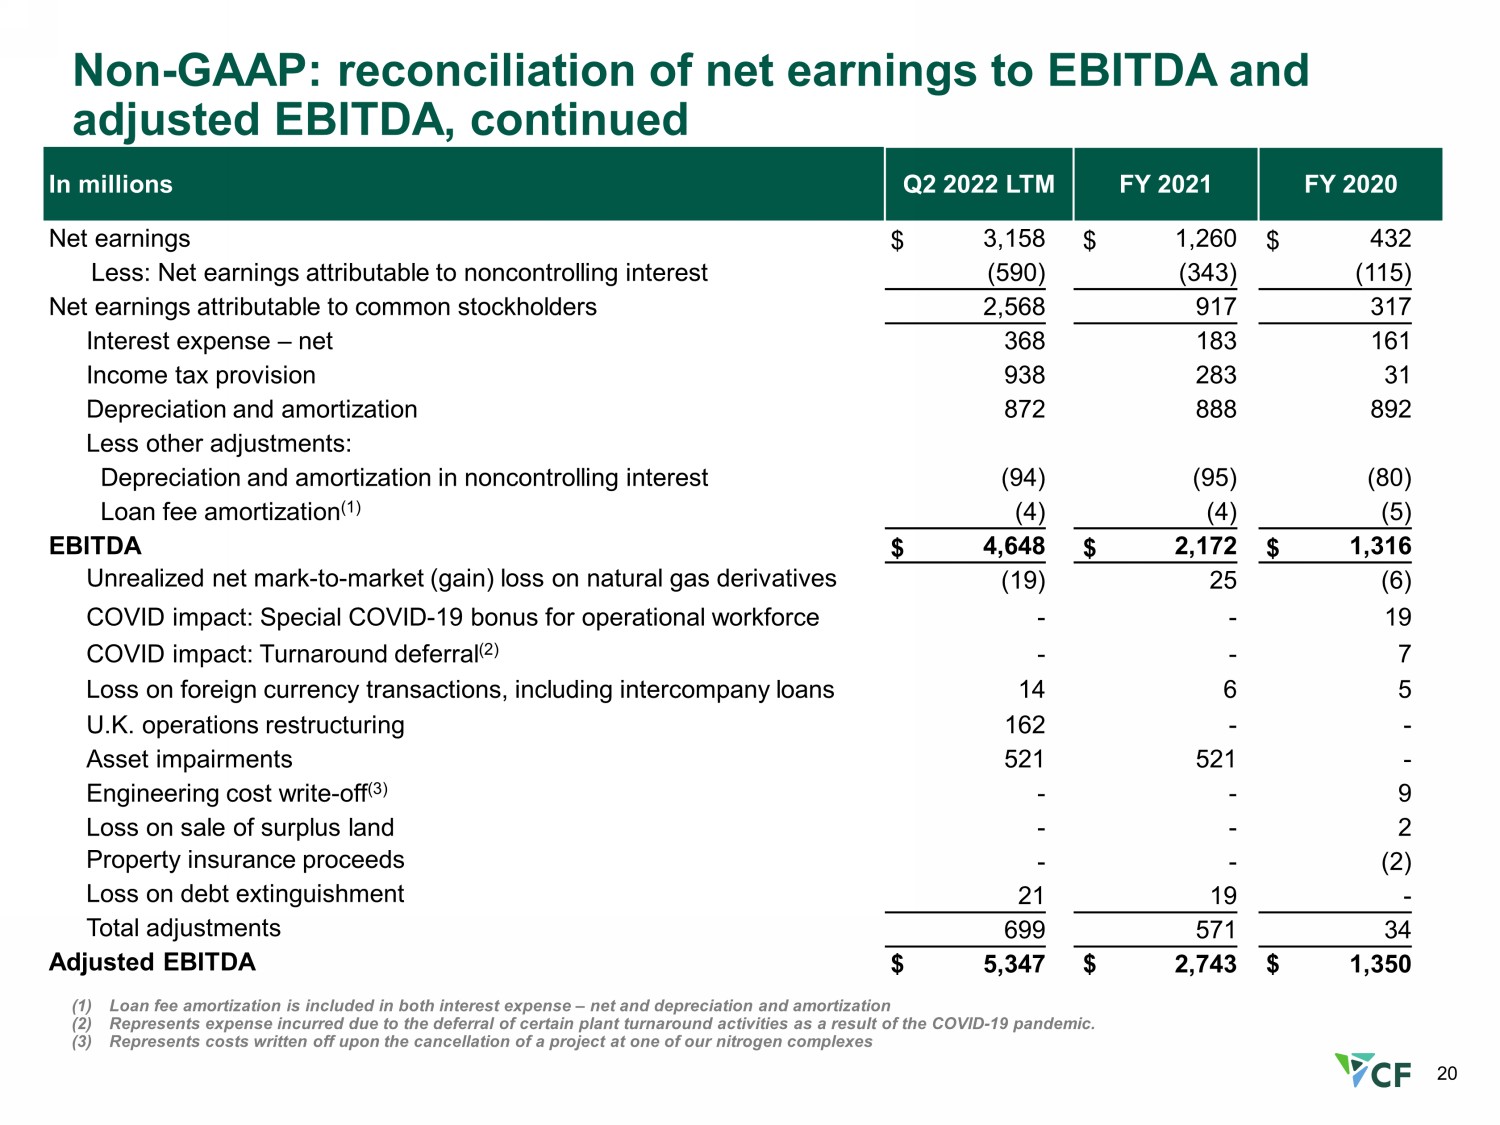
20 Non - GAAP: reconciliation of net earnings to EBITDA and adjusted EBITDA, continued (1) Loan fee amortization is included in both interest expense – net and depreciation and amortization (2) Represents expense incurred due to the deferral of certain plant turnaround activities as a result of the COVID - 19 pandemic. (3) Represents costs written off upon the cancellation of a project at one of our nitrogen complexes In millions Q2 2022 LTM FY 2021 FY 2020 Net earnings $ 3,158 $ 1,260 $ 432 Less: Net earnings attributable to noncontrolling interest (590) (343) (115) Net earnings attributable to common stockholders 2,568 917 317 Interest expense – net 368 183 161 Income tax provision 938 283 31 Depreciation and amortization 872 888 892 Less other adjustments: Depreciation and amortization in noncontrolling interest (94) (95) (80) Loan fee amortization (1) (4) (4) (5) EBITDA $ 4,648 $ 2,172 $ 1,316 Unrealized net mark - to - market (gain) loss on natural gas derivatives (19) 25 (6) COVID impact: Special COVID - 19 bonus for operational workforce - - 19 COVID impact: Turnaround deferral (2) - - 7 Loss on foreign currency transactions, including intercompany loans 14 6 5 U.K. operations restructuring 162 - - Asset impairments 521 521 - Engineering cost write - off (3) - - 9 Loss on sale of surplus land - - 2 Property insurance proceeds - - (2) Loss on debt extinguishment 21 19 - Total adjustments 699 571 34 Adjusted EBITDA $ 5,347 $ 2,743 $ 1,350
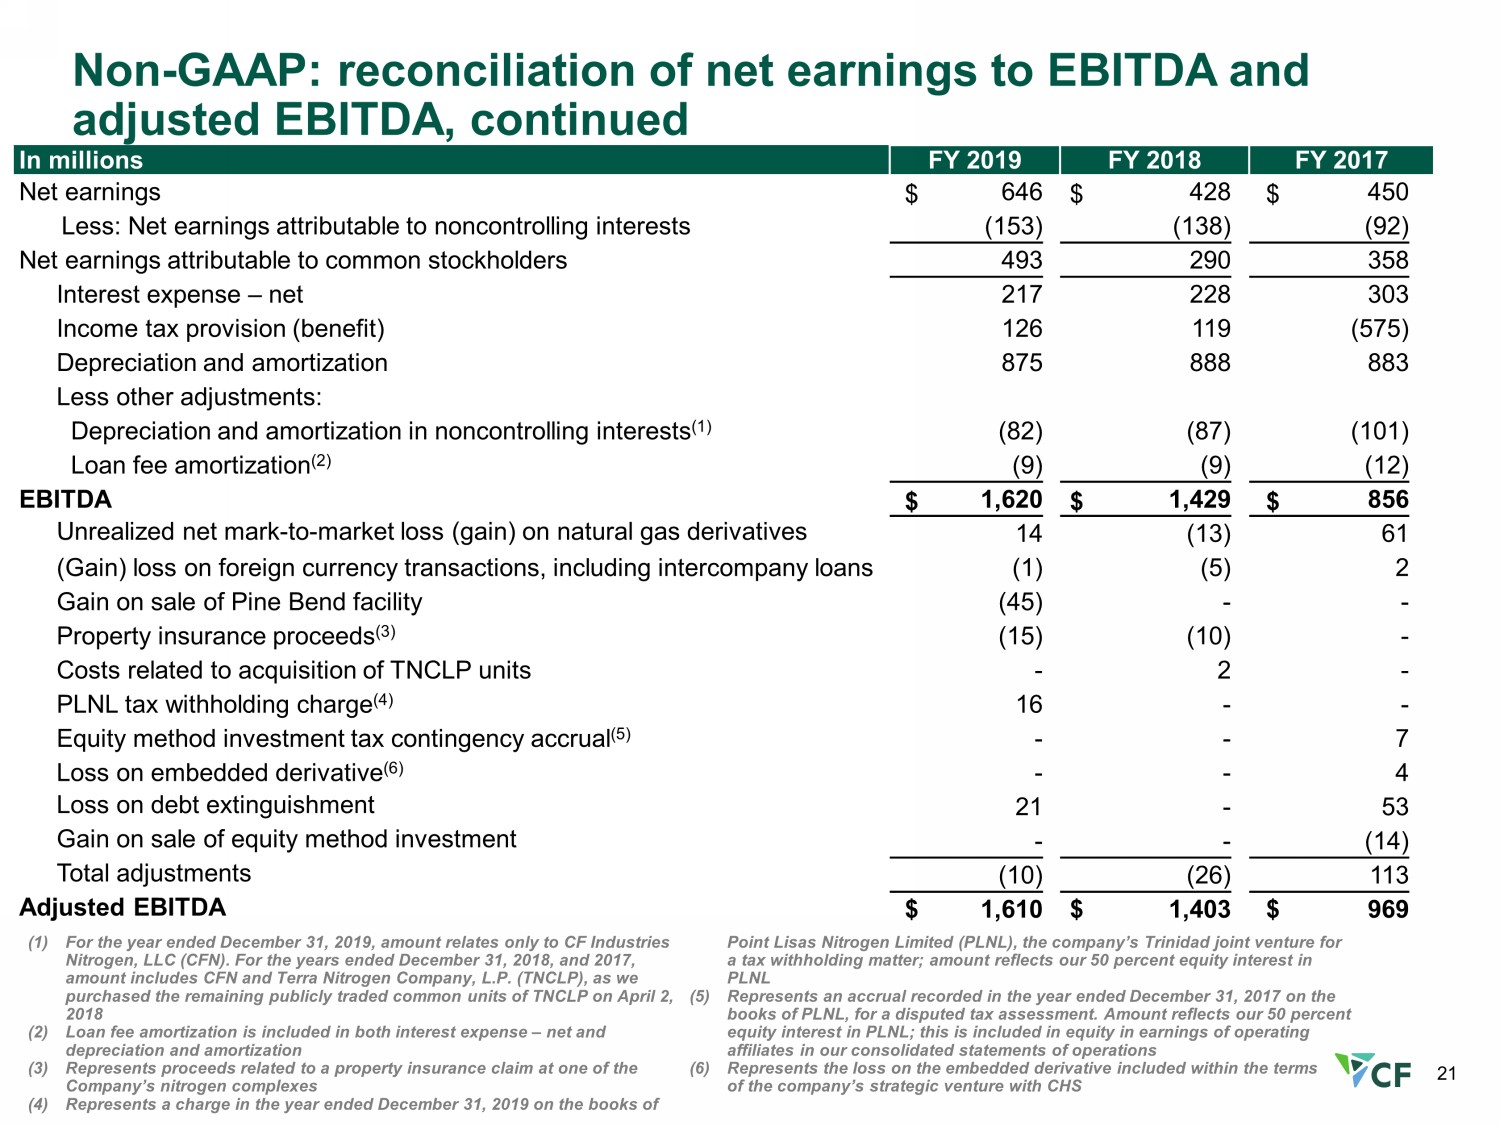
21 Non - GAAP: reconciliation of net earnings to EBITDA and adjusted EBITDA, continued (1) For the year ended December 31, 2019, amount relates only to CF Industries Nitrogen, LLC (CFN). For the years ended December 31, 2018, and 2017 , amount includes CFN and Terra Nitrogen Company, L.P. (TNCLP), as we purchased the remaining publicly traded common units of TNCLP on April 2, 2018 (2) Loan fee amortization is included in both interest expense – net and depreciation and amortization (3) Represents proceeds related to a property insurance claim at one of the Company’s nitrogen complexes (4) Represents a charge in the year ended December 31, 2019 on the books of Point Lisas Nitrogen Limited (PLNL), the company’s Trinidad joint venture for a tax withholding matter; amount reflects our 50 percent equity interest in PLNL (5) Represents an accrual recorded in the year ended December 31, 2017 on the books of PLNL, for a disputed tax assessment. Amount reflects our 50 percent equity interest in PLNL; this is included in equity in earnings of operating affiliates in our consolidated statements of operations (6) Represents the loss on the embedded derivative included within the terms of the company’s strategic venture with CHS In millions FY 2019 FY 20 18 FY 2017 Net earnings $ 646 $ 428 $ 450 Less: Net earnings attributable to noncontrolling interests (153) (138) (92) Net earnings attributable to common stockholders 493 290 358 Interest expense – net 217 228 303 Income tax provision (benefit) 126 119 (575) Depreciation and amortization 875 888 883 Less other adjustments: Depreciation and amortization in noncontrolling interests (1) (82) (87) (101) Loan fee amortization (2) (9) (9) (12) EBITDA $ 1,620 $ 1,429 $ 856 Unrealized net mark - to - market loss (gain) on natural gas derivatives 14 (13) 61 (Gain) loss on foreign currency transactions, including intercompany loans (1) (5) 2 Gain on sale of Pine Bend facility (45) - - Property insurance proceeds (3) (15) (10) - Costs related to acquisition of TNCLP units - 2 - PLNL tax withholding charge (4) 16 - - Equity method investment tax contingency accrual (5) - - 7 Loss on embedded derivative (6) - - 4 Loss on debt extinguishment 21 - 53 Gain on sale of equity method investment - - (14) Total adjustments (10) (26) 113 Adjusted EBITDA $ 1,610 $ 1,403 $ 969
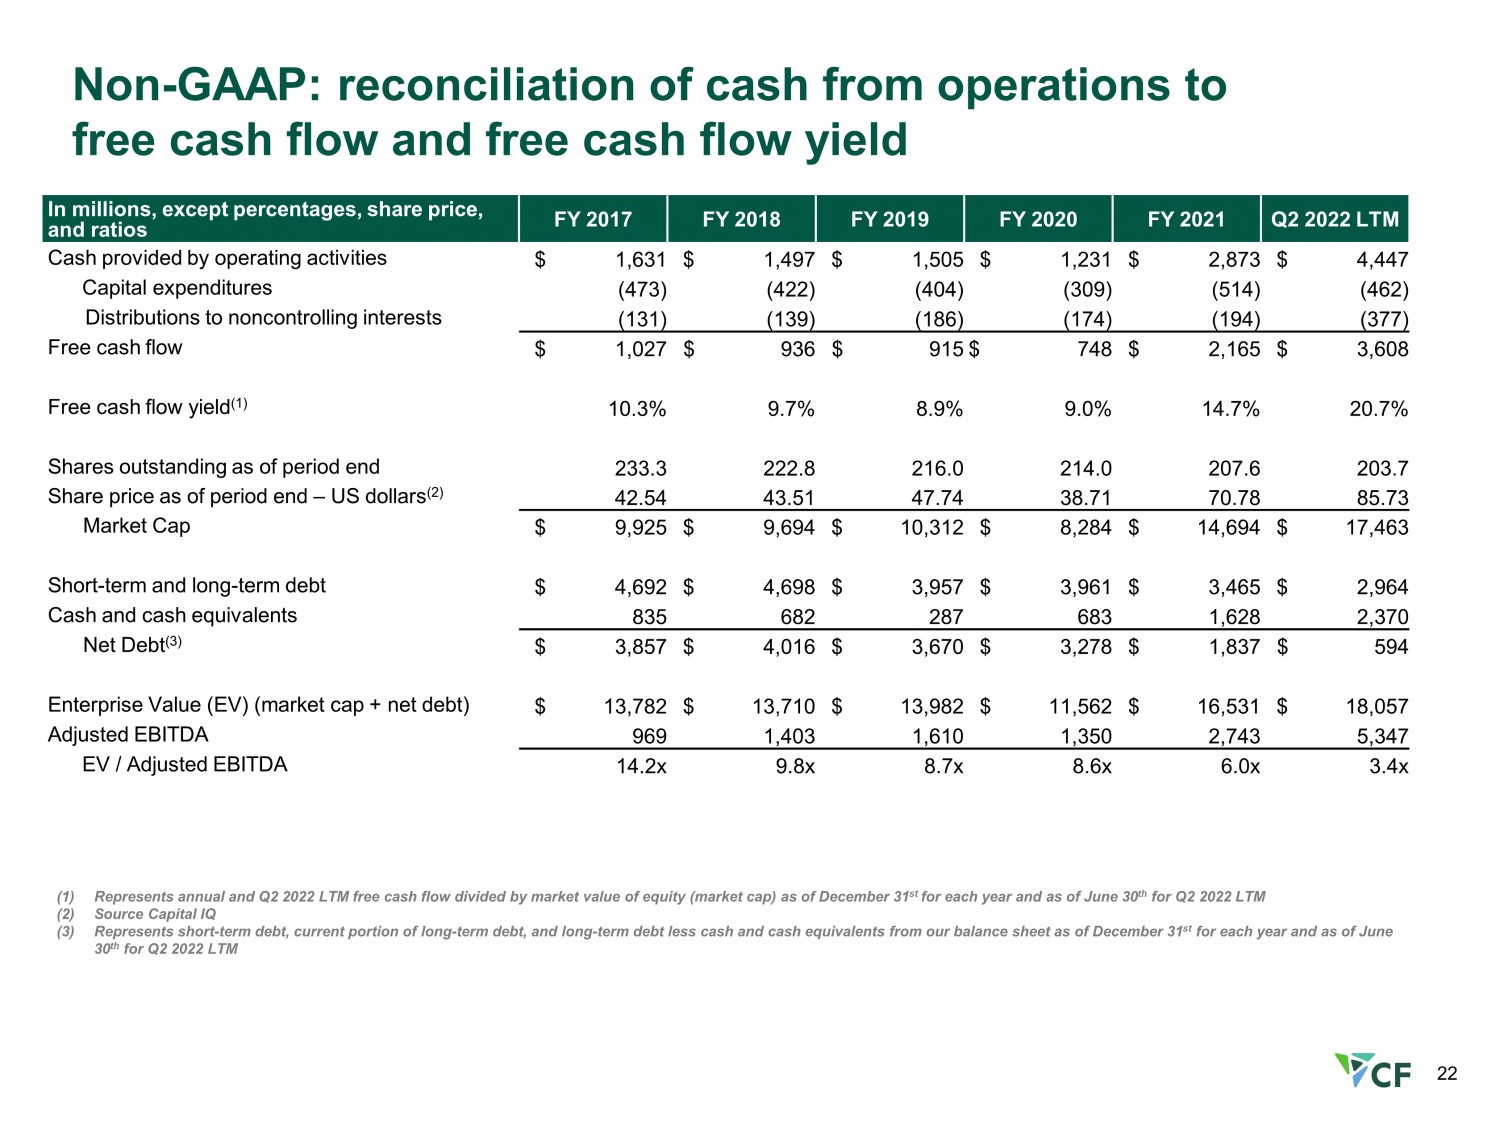
22 Non - GAAP: reconciliation of cash from operations to free cash flow and free cash flow yield In millions , except percentages , share price, and ratios FY 2017 FY 2018 FY 2019 FY 2020 FY 2021 Q2 2022 LTM Cash provided by operating activities $ 1,631 $ 1,497 $ 1,505 $ 1,231 $ 2,873 $ 4,447 C apital expenditures (473) (422) (404) (309) (514) (462) Distributions to noncontrolling interests (131) (139) (186) (174) (194) (377) Free cash flow $ 1,027 $ 936 $ 915 $ 748 $ 2,165 $ 3,608 Free cash flow yield (1) 10.3% 9.7% 8.9% 9.0% 14.7% 20.7% Shares outstanding as of period end 233.3 222.8 216.0 214.0 207.6 203.7 Share price as of period end – US dollars (2) 42.54 43.51 47.74 38.71 70.78 85.73 Market Cap $ 9,925 $ 9,694 $ 10,312 $ 8,284 $ 14,694 $ 17,463 Short - term and long - term debt $ 4,692 $ 4,698 $ 3,957 $ 3,961 $ 3,465 $ 2,964 Cash and cash equivalents 835 682 287 683 1,628 2,370 Net Debt (3) $ 3,857 $ 4,016 $ 3,670 $ 3,278 $ 1,837 $ 594 Enterprise Value (EV) (market cap + net debt) $ 13,782 $ 13,710 $ 13,982 $ 11,562 $ 16,531 $ 18,057 Adjusted EBITDA 969 1,403 1,610 1,350 2,743 5,347 EV / Adjusted EBITDA 14.2x 9.8x 8.7x 8.6x 6.0x 3.4x (1) Represents annual and Q2 2022 LTM free cash flow divided by market value of equity (market cap) as of December 31 st for each year and as of June 30 th for Q2 2022 LTM (2) Source Capital IQ (3) Represents short - term debt, current portion of long - term debt, and long - term debt less cash and cash equivalents from our balanc e sheet as of December 31 st for each year and as of June 30 th for Q2 2022 LTM