Table of Contents
UNITED STATES
SECURITIES AND EXCHANGE COMMISSION
Washington, D.C. 20549
FORM 10-K
| | |
ý |
|
ANNUAL REPORT PURSUANT TO SECTION 13 OR 15(d) OF THE SECURITIES EXCHANGE ACT OF 1934 |
For the fiscal year ended: December 31, 2008 |
or |
o |
|
TRANSITION REPORT PURSUANT TO SECTION 13 OR 15(d) OF THE SECURITIES EXCHANGE ACT OF 1934 |
For the transition period from to
|
Commission file number: 000-51556
GUARANTY BANCORP
(Exact name of registrant as specified in its charter)
| | |
Delaware
(State or other jurisdiction of incorporation or organization) | | 41-2150446
(I.R.S. Employer
Identification No.) |
1331 Seventeenth Street, Suite 300
Denver, Colorado
(Address of principal executive offices) |
|
80202
(Zip code) |
(303) 293-5563
(Registrant's telephone number, including area code)
Securities registered pursuant to Section 12(b) of the Act:
| | |
| Common Stock, $0.001 Par Value | | The NASDAQ Stock Market LLC |
|---|
| (Title of each class) | | (Name of each exchange on which registered) |
Securities registered pursuant to Section 12(g) of the Act: None
Indicate by check mark if the registrant is a well-known seasoned issuer, as defined in Rule 405 of the Securities Act. Yes o No ý
Indicate by check mark if the registrant is not required to file reports pursuant to Section 13 or Section 15(d) of the Act. Yes o No ý
Indicate by check mark whether the registrant (1) has filed all reports required to be filed by Section 13 or 15(d) of the Securities Exchange Act of 1934 during the preceding 12 months (or for such shorter period that the registrant was required to file such reports), and (2) has been subject to such filing requirements for the past 90 days. Yes ý No o
Indicate by check mark if disclosure of delinquent filers pursuant to Item 405 of Regulation S-K is not contained herein, and will not be contained, to the best of the registrant's knowledge, in definitive proxy or information statements incorporated by reference in Part III of this Form 10-K or any amendment to this Form 10-K. o
Indicate by check mark whether the registrant is a large accelerated filer, an accelerated filer, a non-accelerated filer, or a smaller reporting company. See the definitions of "large accelerated filer," "accelerated filer," and "smaller reporting company" in Rule 12b-2 of the Exchange Act.
| | | | | | |
| Large accelerated filer o | | Accelerated filer ý | | Non-accelerated filer o
(Do not check if a smaller reporting company) | | Smaller reporting company o |
Indicate by check mark whether the registrant is a shell company (as defined in Rule 12b-2 of the Act.) Yes o No ý
The aggregate market value of the voting common stock held by non-affiliates of the registrant, computed by reference to the closing price per share of the registrant's common stock as of the close of business on June 30, 2008, was approximately $135 million. For purposes of this computation, all executive officers, directors and 10% beneficial owners of the registrant are assumed to be affiliates. Such determination should not be deemed an admission that such officers, directors and beneficial owners are, in fact, affiliates of the registrant. Registrant does not have any nonvoting common equities.
As of February 1, 2009, there were 52,623,985 shares of the registrant's common stock outstanding, including 1,380,346 shares of unvested restricted stock and performance stock and excluding 4,777 shares to be issued under its deferred compensation plan.
DOCUMENTS INCORPORATED BY REFERENCE
The information required by Items 10, 11, 12, 13 and 14 of Part III of this Annual Report on Form 10-K will be found in the registrant's definitive proxy statement for its 2009 Annual Meeting of Stockholders, to be filed pursuant to Regulation 14A under the Securities Exchange Act of 1934, as amended, and such information is incorporated herein by reference.
Table of Contents
GUARANTY BANCORP
ANNUAL REPORT ON FORM 10-K
Table of Contents
2
Table of Contents
PART I
Forward-Looking Statements and Factors that Could Affect Future Results
Certain statements contained in this Annual Report on Form 10-K that are not statements of historical fact constitute forward-looking statements within the meaning of the Private Securities Litigation Reform Act of 1995 (the "Act"), notwithstanding that such statements are not specifically identified. In addition, certain statements may be contained in our future filings with the SEC, in press releases, and in oral and written statements made by or with our approval that are not statements of historical fact and constitute forward-looking statements within the meaning of the Act. Examples of forward-looking statements include, but are not limited to: (i) projections of revenues, expenses, income or loss, earnings or loss per share, the payment or nonpayment of dividends, capital structure and other financial items; (ii) statements of plans, objectives and expectations of the Company or its management or board of directors, including those relating to products or services; (iii) statements of future economic performance; and (iv) statements of assumptions underlying such statements. Words such as "believes", "anticipates", "expects", "intends", "targeted", "projected", "continue", "remain", "will", "should", "may" and other similar expressions are intended to identify forward-looking statements but are not the exclusive means of identifying such statements.
Forward-looking statements involve risks and uncertainties that may cause actual results to differ materially from those in such statements. Factors that could cause actual results to differ from those discussed in the forward-looking statements include, but are not limited to:
- •
- Local, regional, national and international economic conditions and the impact they may have on us and our customers, and our assessment of that impact on our estimates including, but not limited to the allowance for loan losses.
- •
- Changes in the level of nonperforming assets and charge-offs.
- •
- The effects of and changes in trade and monetary and fiscal policies and laws, including the interest rate policies of the Federal Open Market Committee of the Federal Reserve Board, the Federal Deposit Insurance Corporation's Temporary Liquidity Guaranty Program and U.S. Treasury's Capital Purchase Program and Troubled Asset Repurchase Program authorized by the Emergency Economic Stabilization Act of 2008.
- •
- The failure to obtain approval to participate in the U.S. Treasury's Capital Purchase Program and, if such approval is obtained, the failure to complete the sale of preferred stock under the program.
- •
- Changes in sources and uses of funds, including loans, deposits and borrowings, including the ability for the Bank to retain and grow core deposits, to purchase brokered deposits and maintain unsecured federal funds lines with correspondent banks and secured lines of credits.
- •
- Changes imposed by regulatory agencies to increase our capital to a level greater than the level required for well-capitalized financial institutions.
- •
- Inflation and interest rate, securities market and monetary fluctuations.
- •
- Political instability, acts of war or terrorism and natural disasters.
- •
- The timely development and acceptance of new products and services and perceived overall value of these products and services by customers.
- •
- Revenues are lower than expected.
- •
- Changes in consumer spending, borrowings and savings habits.
- •
- Changes in the financial performance and/or condition of our borrowers.
3
Table of Contents
- •
- Credit quality deterioration, which could cause an increase in the provision for loan losses.
- •
- Technological changes.
- •
- Acquisitions of acquired businesses and greater than expected costs or difficulties related to the integration of acquired businesses.
- •
- The ability to increase market share and control expenses.
- •
- Changes in the competitive environment among financial or bank holding companies and other financial service providers.
- •
- The effect of changes in laws and regulations with which we and our bank subsidiary must comply.
- •
- Changes in the securities markets.
- •
- The effect of changes in accounting policies and practices, as may be adopted by the regulatory agencies, as well as the Public Company Accounting Oversight Board, the Financial Accounting Standards Board and other accounting standard setters.
- •
- Changes in our organization, compensation and benefit plans.
- •
- The costs and effects of legal and regulatory developments, including the resolution of legal proceedings or regulatory or other governmental inquiries, the results of regulatory examinations or reviews, and the necessity of regulatory approval for dividend payments from the subsidiary bank to the holding company.
- •
- Our success at managing the risks involved in the foregoing items.
Forward-looking statements speak only as of the date on which such statements are made. We do not intend to update any forward-looking statement to reflect events or circumstances after the date on which such statement is made, or to reflect the occurrence of unanticipated events.
ITEM 1. BUSINESS
Guaranty Bancorp
We are a bank holding company registered under the Bank Holding Company Act of 1956, as amended. Our principal business is to serve as a holding company for our bank subsidiary. As of December 31, 2008, we had a single Bank subsidiary, Guaranty Bank and Trust Company ("Guaranty Bank" or "Bank").
When we say "we", "us", "our" or the "Company", we mean the Company on a consolidated basis with the Bank. When we refer to "Guaranty Bancorp" or the "holding company", we are referring to the parent company on a standalone basis.
On March 3, 2004, we were incorporated in Delaware under the name Centennial C Corp. On July 16, 2004, in an acquisition financed by a group of investors led by John M. Eggemeyer, we acquired Centennial Bank of the West (CBW) and changed our name to Centennial Bank Holdings, Inc. On December 31, 2004, we acquired Guaranty Corporation, a bank holding company and a Colorado corporation, which operated 18 branches in Colorado through its three banks, Guaranty Bank, Collegiate Peaks and First National Bank of Strasburg.
On April 14, 2005, we merged First National Bank of Strasburg into Guaranty Bank. On October 1, 2005, we acquired First MainStreet Financial, Ltd., pursuant to which First MainStreet Bank, N.A. was merged into CBW. On November 1, 2005, we acquired Foothills Bank, which was merged into Guaranty Bank.
4
Table of Contents
�� On March 1, 2006, we sold substantially all of the assets of First MainStreet Insurance, Ltd., an independent insurance agency. On November 1, 2006, we completed the sale of Collegiate Peaks Bank, which had been classified as held for sale since December 31, 2004.
On January 1, 2008, the Company completed the merger of CBW into Guaranty Bank.
On May 6, 2008, the stockholders of the Company approved the proposal to change the name of the holding company from Centennial Bank Holdings, Inc. to Guaranty Bancorp. This name change was effective on May 12, 2008.
At December 31, 2008, we had total assets of $2.1 billion, net loans of $1.8 billion, deposits of $1.7 billion and stockholders' equity of $161.6 million, and we operated 34 branches in Colorado through our banking subsidiary Guaranty Bank.
Our Business
The Bank is a full-service community bank offering an array of banking products and services to the communities it serves along the Front Range of Colorado, including accepting time and demand deposits and originating commercial loans (including energy loans), real estate loans, and small business and consumer loans. The Bank also provides trust services, including personal trust administration, estate settlement, investment management accounts and self-directed IRAs. Substantially all loans are secured by specific items of collateral, including business assets, consumer assets and commercial and residential real estate. Commercial loans are expected to be repaid from cash flow from operations of business. There are no significant concentrations of loans to any one industry or customer. The customers' ability to repay their loans is dependent on the real estate and general economic conditions of the area, among other factors.
We concentrate our lending activities in the following principal areas:
Commercial and Industrial Loans: Our commercial and industrial loan portfolio is comprised of operating loans secured by inventory and receivables. The portfolio is not concentrated in any particular industry. In 2006, the Company started an energy banking group, with a focus on exploration and production, midstream and gas storage sectors. Repayment of secured commercial and industrial loans depends substantially on the borrower's underlying business, financial condition and cash flows, as well as the sufficiency of the collateral. Compared to real estate, the collateral may be more difficult to monitor, evaluate and sell. It may also depreciate more rapidly than real estate. Such risks can be significantly affected by economic conditions.
Commercial Real Estate Loans: This portfolio is comprised of loans secured by commercial real estate. The portfolio is not concentrated in one area and ranges from owner occupied to motel properties. In addition, multi-family properties are included in this category. Commercial real estate and multi-family loans typically involve large balances to single borrowers or groups of related borrowers. Since payments on these loans are often dependent on the successful operation or management of the properties, as well as the business and financial condition of the borrower, repayment of such loans may be subject to adverse conditions in the real estate market, adverse economic conditions or changes in applicable government regulations. If the cash flow from the project decreases, or if leases are not obtained or renewed, the borrower's ability to repay the loan may be impaired.
Construction Loans: Our construction loan portfolio is comprised of single-family residential development, investor developer and owner occupied properties. In addition, this category includes loans for the construction of commercial buildings, which are primarily income producing properties. The repayment of construction loans is dependent upon the successful and timely completion of the construction of the subject property, as well as the sale of the property to third parties or the
5
Table of Contents
availability of permanent financing upon completion of all improvements. Construction loans expose us to the risk that improvements will not be completed on time in accordance with specifications and projected costs. Construction delays, the financial impairment of the builder, interest rate increases or economic downturn may further impair the borrower's ability to repay the loan. In addition, the ultimate sale or rental of the property may not occur as anticipated.
Installment Loans to Individuals and Other Loans: This category includes miscellaneous consumer loans including overdrafts and lines-of-credit. Consumer loans may be unsecured or secured by rapidly depreciable assets. Repossessed collateral for a defaulted consumer loan may not provide an adequate source of repayment for the outstanding loan, and the remaining deficiency may not warrant further substantial collection efforts against the borrower. In addition, consumer loan collections are dependent on the borrower's continued financial stability, which can be adversely affected by job loss, divorce, illness or personal bankruptcy. Furthermore, the application of various federal and state laws, including federal and state bankruptcy and insolvency laws, may limit the amount which can be recovered on such loans.
Equity Lines of Credit: Our home equity line portfolio is comprised of home equity lines to customers in our markets. Home equity lines of credit are underwritten in a manner such that they result in credit risk that is substantially similar to that of residential mortgage loans. Nevertheless, home equity lines of credit have greater credit risk than residential mortgage loans because they are often secured by mortgages that are subordinated to the existing first mortgage on the property, which we may or may not hold, and they are not covered by private mortgage insurance coverage.
Agriculture Loans: Our agriculture land secured portfolio is comprised primarily of real estate loans to working farms in Adams, Arapahoe, Elbert, Larimer, Morgan and Weld counties. Our agriculture operating loan portfolio is comprised of operating loans to working farms in the same counties. Repayments on agricultural mortgage loans are substantially dependent on the successful operation or management of the farm property collateralizing the loan, which is affected by many factors, including weather and changing market prices, which are outside of the control of the borrower. Payments on agricultural operating loans are dependent on the successful operation or management of the farm property for which the operating loan is generally utilized. Such loans are similarly subject to farming-related risks, including weather and changing market prices.
In addition, we provide traditional deposit accounts such as demand, NOW, Money Market, IRA, time deposits and savings accounts. Our certificate of deposit customers, excluding brokered deposits, primarily represent local relationships. The Company joined the Certificate of Deposit Account Registry Service (CDARS®) program in 2008, which enables our local customers to obtain expanded FDIC insurance coverage on their deposits. Our branch network enables us to offer a full range of deposits, loans and personalized services to our targeted commercial and consumer customers.
Our Philosophy and Strategy
We have established a philosophy of relationship banking: providing highly personalized and responsive services based on exceptional customer service.
Our strategy is to build a profitable, community-banking franchise along the Colorado Front Range spanning from Castle Rock to Fort Collins. We strive to be a premier community and business bank with an emphasis on high quality customer service, commercial banking and low-cost demand deposits, serving the needs of small to medium-sized businesses, the owners and employees of those businesses, as well as other executives and professionals. The strategy for serving our target markets is the delivery of a finely-focused set of value-added products and services that satisfy the primary needs of our customers, emphasizing superior service and relationships as opposed to transaction volume or low
6
Table of Contents
pricing. As a locally managed banking institution, we believe we are able to provide a superior level of customer service compared to larger regional and super-regional banks.
Our Principal Markets
We have a single banking subsidiary, Guaranty Bank, following the merger of CBW into Guaranty Bank on January 1, 2008. We operate 34 branches located in the Denver metropolitan area and throughout Colorado's Northern Front Range.
The Denver metropolitan area is composed of seven counties: Adams, Arapahoe, Boulder, Broomfield, Denver, Douglas and Jefferson. The metropolitan area stretches from the south in Castle Rock through downtown Denver northward to Boulder and Longmont. Denver is the largest city within a 600-mile radius.
Colorado's Northern Front Range region begins just 30 miles north of central Denver in southern Boulder County. The I-25 corridor north from Denver to Fort Collins is a contiguous stream of small communities/housing developments, open space, farm properties, and both small and large businesses. The region includes the cities of Fort Collins, Loveland, Greeley and Longmont, all located in Boulder, Larimer and Weld counties. Colorado's Northern Front Range has a regional economy that is a diverse mix of agriculture, advanced technology, tourism, manufacturing, service firms, government, education, retail, small business and construction.
Business Concentrations
No individual or single group of related accounts is considered material in relation to our total assets, or in relation to the overall business of the Company. Approximately 55% of our loan portfolio held for investment at December 31, 2008 consisted of real estate-related loans, including construction loans, miniperm loans and commercial real estate loans. Our business activities are currently focused in the Colorado Front Range. Consequently, our financial condition, results of operations and cash flows depend upon the general trends in the economy of the Colorado Front Range and, in particular, the residential and commercial real estate markets.
Competition
The banking business in Colorado is highly competitive. The market is characterized by a relatively small number of large financial institutions with a large number of offices and numerous small to moderate-sized community banks and credit unions. Other entities in both the public and private sectors seeking to raise capital through the issuance and sale of debt or equity securities also provide competition for us in the acquisition of deposits. We also compete with brokerage firms, money market funds and issuers of other money market instruments. In recent years, increased competition has also developed from specialized finance and non-finance companies that offer wholesale finance, credit card and other consumer finance services, including on-line banking services and personal finance software. Competition for deposit and loan products remains strong from both banking and non-banking firms and this competition directly affects the rates of those products and the terms on which they are offered to consumers. In order to compete with other competitors in our primary service area, we attempt to use to the fullest extent possible, the flexibility that our community bank status permits, including an emphasis on specialized services, local promotional activity and personal contacts.
Technological innovation continues to contribute to greater competition in domestic and international financial services markets. Technological innovation has, for example, made it possible for non-depository institutions to offer customers automated transfer payment services previously limited to traditional banking products. In addition, customers now expect a choice of several delivery systems and channels, including telephone, mail, home computer, automated teller machines (ATMs), debit cards,
7
Table of Contents
point-of-sale transactions, automated clearing house transactions (ACH), remote deposit, mobile banking via telephone or wireless devices and in-store branches.
Mergers between financial institutions have placed additional pressure on banks to consolidate their operations, reduce expenses and increase revenues to remain competitive. In addition, competition has intensified due to federal and state interstate banking laws, which permit banking organizations to expand geographically with fewer restrictions than in the past. These laws allow banks to merge with other banks across state lines, thereby enabling banks to establish or expand banking operations in our market. The competitive environment is also significantly impacted by federal and state legislation that makes it easier for non-bank financial institutions to compete with us.
Economic factors, along with legislative and technological changes, will have an ongoing impact on the competitive environment within the financial services industry. As an active participant in financial markets, we strive to anticipate and adapt to dynamic competitive conditions, but we cannot provide assurance as to their impact on our future business, financial condition, results of operations or cash flows or as to our continued ability to anticipate and adapt to changing conditions.
Supervision and Regulation
General
Set forth below is a description of the significant elements of the laws and regulations applicable to the Company. The description is qualified in its entirety by reference to the full text of the statutes, regulations and policies that are described. Also, such statutes, regulations and policies are continually under review by the U.S. Congress and state legislatures and federal and state regulatory agencies. A change in statutes, regulations or regulatory policies applicable to the holding company or its subsidiaries could have a material effect on our business.
Regulatory Agencies
Guaranty Bancorp is a legal entity separate and distinct from its bank subsidiary, Guaranty Bank. As a bank holding company, Guaranty Bancorp is regulated under the Bank Holding Company Act of 1956, as amended, or the BHC Act, and is subject to inspection, examination and supervision by the Board of Governors of the Federal Reserve System, or the Federal Reserve Board. Guaranty Bancorp is also under the jurisdiction of the SEC and is subject to the disclosure and regulatory requirements of the Securities Act of 1933, as amended, and the Securities Exchange Act of 1934, as amended. Guaranty Bancorp is listed on The NASDAQ Stock Market LLC (Nasdaq) under the trading symbol "GBNK," and is subject to the rules of Nasdaq for listed companies.
As a Colorado-chartered bank, the Bank is subject to supervision, periodic examination, and regulation by the Colorado Division of Banking, or CDB. As a member of the Federal Reserve System, the Bank is also subject to supervision, periodic examination and regulation by the Federal Reserve Bank of Kansas City. If, as a result of an examination of the Bank, the Federal Reserve Board or the CDB should determine that the financial condition, capital resources, asset quality, earnings prospects, management, liquidity, or other aspects of its operations are unsatisfactory or that it or its management is violating or has violated any law or regulation, various remedies are available to the Federal Reserve Board and the CDB. Such remedies include the power to enjoin "unsafe or unsound" practices, to require affirmative action to correct any conditions resulting from any violation or practice, to issue an administrative order that can be judicially enforced, to direct an increase in capital, to restrict our growth, to assess civil monetary penalties, to remove officers and directors, and ultimately to terminate our deposit insurance, which for a Colorado-chartered bank would result in the revocation of its charter.
8
Table of Contents
Bank Holding Company Regulation
In general, the BHC Act limits the business of bank holding companies to banking, managing or controlling banks and other activities that the Federal Reserve Board has determined to be so closely related to banking as to be a proper incident thereto.
The BHC Act generally limits acquisitions by bank holding companies to commercial banks and companies engaged in activities that the Federal Reserve Board has determined to be so closely related to banking as to be a proper incident thereto.
The BHC Act, the Bank Merger Act, the Colorado Banking Code and other federal and state statutes regulate acquisitions of commercial banks. The BHC Act requires the prior approval of the Federal Reserve Board for the direct or indirect acquisition of more than 5.0% of the voting shares of a commercial bank or its parent holding company. In reviewing applications seeking approval of merger and acquisition transactions, the bank regulatory authorities will consider, among other things, the competitive effect and public benefits of the transactions, the capital position of the combined organization, the applicant's performance record under the Community Reinvestment Act (see the section captioned "Community Reinvestment Act" included elsewhere in this item) and fair housing laws and the effectiveness of the subject organizations in combating money laundering activities.
Dividends
The principal source of the holding company's cash revenues is from dividends from its bank subsidiary, Guaranty Bank. Our earnings and activities are affected by legislation, by regulations and by local legislative and administrative bodies and decisions of courts in the jurisdictions in which we conduct business. For example, these include limitations on the ability of our bank subsidiary to pay dividends to the holding company and our ability to pay dividends to our stockholders. It is the policy of the Federal Reserve Board that bank holding companies should pay cash dividends on common stock only out of income available over the past year and only if prospective earnings retention is consistent with the organization's expected future needs and financial condition. The policy provides that bank holding companies should not maintain a level of cash dividends that undermines the bank holding company's ability to serve as a source of strength to its banking subsidiary.
As a member of the Federal Reserve System, the Bank is subject to Regulation H, which, among other things, provides that a member bank may not declare or pay a dividend if the total of all dividends declared during the calendar year, including the proposed dividend, exceeds the sum of the bank's net income (as reportable in its Reports of Condition and Income) during the current calendar year and its retained net income for the prior two calendar years, unless the Federal Reserve has approved the dividend. Regulation H also provides that a member bank may not declare or pay a dividend if the dividend would exceed the bank's undivided profits as reportable on its Reports of Condition and Income, unless the Federal Reserve and holders of at least two-thirds of the outstanding shares of each class of the bank's outstanding stock have approved the dividend. Additionally, there are potential additional restrictions and prohibitions if a bank were to be less than well-capitalized.
As a Colorado state-chartered bank, the Bank is subject to limitations under Colorado law on the payment of dividends. The Colorado Financial Institutions Code provides that a bank may declare dividends from retained earnings and other components of capital specifically approved by the Banking Board so long as the declaration is made in compliance with rules established by the Banking Board.
In addition to these explicit limitations, the federal regulatory agencies have general authority to prohibit a banking subsidiary or bank holding company from engaging in an unsafe or unsound banking practice. Depending upon the circumstances, the agencies could take the position that paying a dividend would constitute an unsafe or unsound banking practice.
9
Table of Contents
The holding company has expenses and repayment obligations with respect to our trust preferred securities and corresponding subordinated debt securities issued. As part of our capital and cash management practices at the holding company, management expects to utilize our bank subsidiary's excess capital above the well-capitalized requirement through the payment of dividends to the holding company to service the subordinated debt and meet operating needs. Due to the accumulated deficit as a result of goodwill impairments in 2007 and 2008, permission from the Federal Reserve and CDB is required before the Bank can pay a dividend to the holding company. In 2008, the Bank requested and was granted permission to pay $19 million in dividends to the holding company. The Bank remains well capitalized at December 31, 2008.
Affiliate Transactions
There are various restrictions on the ability of the holding company to borrow from, and engage in certain other transactions with, its bank subsidiary. In general, these restrictions require that any extensions of credit must be secured by designated amounts of specified collateral and are limited, as to transactions with Guaranty Bank, to 10% of Guaranty Bank's capital stock and surplus, and, as to the holding company, to 20% of Guaranty Bank's capital stock and surplus.
Federal law also provides that extensions of credit and other transactions between Guaranty Bank and the holding company must be on terms and conditions, including credit standards, that are substantially the same or at least as favorable to Guaranty Bank as those prevailing at the time for comparable transactions involving other non-affiliated companies or, in the absence of comparable transactions, on terms and conditions, including credit standards, that in good faith would be offered to, or would apply to, non-affiliated companies.
Source of Strength Doctrine
Federal Reserve Board policy requires bank holding companies to act as a source of financial and managerial strength to their subsidiary banks. Under this policy, the holding company is expected to commit resources to support its bank subsidiary, including at times when the holding company may not be in a financial position to provide it. Any capital loans by a bank holding company to its subsidiary bank are subordinate in right of payment to deposits and to certain other indebtedness of such subsidiary bank. The BHC Act provides that, in the event of a bank holding company's bankruptcy, any commitment by the bank holding company to a federal bank regulatory agency to maintain the capital of a bank subsidiary will be assumed by the bankruptcy trustee and entitled to priority of payment.
Capital Adequacy and Prompt Corrective Action
Banks and bank holding companies are subject to various regulatory capital requirements administered by state and federal banking agencies. Capital adequacy guidelines and, additionally for banks, prompt corrective action regulations, involve quantitative measures of assets, liabilities, and certain off-balance-sheet items calculated under regulatory accounting practices. Capital amounts and classifications are also subject to qualitative judgments by regulators about components, risk weighting and other factors.
The Federal Reserve Board has risk-based capital ratio and leverage ratio guidelines for banking organizations, which are intended to ensure that banking organizations have adequate capital given the risk levels of assets and off-balance sheet financial instruments. Under the guidelines, banking organizations are required to maintain minimum ratios for Tier 1 capital and total capital to total risk-weighted assets (including certain off-balance sheet items, such as letters of credit). For purposes of calculating the ratios, a banking organization's assets and some of its specified off-balance sheet
10
Table of Contents
commitments and obligations are assigned to various risk categories. A depository institution or holding company's capital, in turn, is classified in one of three tiers, depending on type:
Core Capital (Tier 1). Tier 1 capital includes common equity, retained earnings, qualifying trust preferred securities, qualifying noncumulative perpetual preferred stock, a limited amount of qualifying cumulative perpetual stock at the holding company level, minority interests in equity accounts of consolidated subsidiaries, less goodwill, most intangible assets and certain other assets.
Supplementary Capital (Tier 2). Tier 2 capital includes, among other things, perpetual preferred stock and trust preferred securities not meeting the Tier 1 definition, qualifying mandatory convertible debt securities, qualifying subordinated debt, and allowances for possible loan losses, subject to limitations.
Market Risk Capital (Tier 3). Tier 3 capital includes qualifying unsecured subordinated debt.
Guaranty Bancorp, like other bank holding companies, currently is required to maintain Tier 1 capital and "total capital" (the sum of Tier 1, Tier 2 and Tier 3 capital) equal to at least 4.0% and 8.0%, respectively, of its total risk-weighted assets (including various off-balance-sheet items, such as standby letters of credit). Guaranty Bank, like other depository institutions, is required to maintain similar capital levels under capital adequacy guidelines.
Bank holding companies and banks subject to the market risk capital guidelines are required to incorporate market and interest rate risk components into their risk-based capital standards. Under the market risk capital guidelines, capital is allocated to support the amount of market risk related to a financial institution's ongoing trading activities.
Bank holding companies and banks are also required to comply with minimum leverage ratio requirements. The leverage ratio is the ratio of a banking organization's Tier 1 capital to its total adjusted quarterly average assets (as defined for regulatory purposes). The requirements necessitate a minimum leverage ratio of 3.0% for bank holding companies and banks that either have the highest supervisory rating or have implemented the appropriate federal regulatory authority's risk-adjusted measure for market risk. All other bank holding companies and banks are required to maintain a minimum leverage ratio of 4.0%, unless a different minimum is specified by an appropriate regulatory authority. For a depository institution to be considered "well capitalized" under the regulatory framework for prompt corrective action, its leverage ratio must be at least 5.0%.
The Federal Deposit Insurance Act, as amended ("FDIA"), requires, among other things, that federal banking agencies take "prompt corrective action" in respect of depository institutions that do not meet minimum capital requirements. The FDIA sets forth the following five capital tiers: "well capitalized," "adequately capitalized," "undercapitalized," "significantly undercapitalized" and "critically undercapitalized." A depository institution's capital tier will depend upon how its capital levels compare with various relevant capital measures and certain other factors, as established by regulation. The relevant capital measures are the total capital ratio, the Tier 1 capital ratio and the leverage ratio.
Under the regulations adopted by the federal regulatory authorities, a bank will be: (i) "well capitalized" if the institution has a total risk-based capital ratio of 10.0% or greater, a Tier 1 risk-based capital ratio of 6.0% or greater, and a leverage ratio of 5.0% or greater, and is not subject to any order or written directive by any such regulatory authority to meet and maintain a specific capital level for any capital measure; (ii) "adequately capitalized" if the institution has a total risk-based capital ratio of 8.0% or greater, a Tier 1 risk-based capital ratio of 4.0% or greater, and a leverage ratio of 4.0% or greater (3.0% in certain circumstances) and is not "well capitalized"; (iii) "undercapitalized" if the institution has a total risk-based capital ratio that is less than 8.0%, a Tier 1 risk-based capital ratio of less than 4.0% or a leverage ratio of less than 4.0% (3.0% in certain circumstances); (iv) "significantly undercapitalized" if the institution has a total risk-based capital ratio of less than 6.0%, a Tier 1 risk-based capital ratio of less than 3.0% or a leverage ratio of less than 3.0%; and (v) "critically
11
Table of Contents
undercapitalized" if the institution's tangible equity is equal to or less than 2.0% of average quarterly tangible assets. An institution may be downgraded to, or deemed to be in, a capital category that is lower than indicated by its capital ratios if it is determined to be in an unsafe or unsound condition or if it receives an unsatisfactory examination rating with respect to certain matters. A bank's capital category is determined solely for the purpose of applying prompt corrective action regulations, and the capital category may not constitute an accurate representation of the bank's overall financial condition or prospects for other purposes.
The FDIA generally prohibits a depository institution from making any capital distributions (including payment of a dividend) or paying any management fee to its parent holding company if the depository institution would thereafter be undercapitalized. Undercapitalized institutions are subject to growth limitations and are required to submit a capital restoration plan. The agencies may not accept such a plan without determining, among other things, that the plan is based on realistic assumptions and is likely to succeed in restoring the depository institution's capital. In addition, for a capital restoration plan to be acceptable, the depository institution's parent holding company must guarantee that the institution will comply with such capital restoration plan. The aggregate liability of the parent holding company is limited to the lesser of (i) an amount equal to 5.0% of the depository institution's total assets at the time it became undercapitalized and (ii) the amount which is necessary (or would have been necessary) to bring the institution into compliance with all capital standards applicable with respect to such institution as of the time it fails to comply with the plan. If a depository institution fails to submit an acceptable plan, it is treated as if it is "significantly undercapitalized."
"Significantly undercapitalized" depository institutions may be subject to a number of requirements and restrictions, including orders to sell sufficient voting stock to become "adequately capitalized," requirements to reduce total assets, and cessation of receipt of deposits from correspondent banks. "Critically undercapitalized" institutions are subject to the appointment of a receiver or conservator.
For information regarding the capital ratios and leverage ratio of the holding company and its bank subsidiaries at December 31, 2008 and 2007, see the discussion under the section captioned "Capital" included in Item 7 Management's Discussion and Analysis of Financial Condition and Results of Operations and Note 19—Regulatory Capital Matters in the notes to consolidated financial statements included in Item 8. Financial Statements and Supplementary Data elsewhere in this report.
The federal bank regulatory authorities' risk-based capital guidelines are based upon the 1988 capital accord of the Basel Committee on Banking Supervision, or the BIS. The BIS is a committee of central banks and bank supervisors/regulators from the major industrialized countries that develops broad policy guidelines for use by each country's supervisors in determining the supervisory policies they apply. In 2004, the BIS published a new capital accord to replace its 1988 capital accord, with an update in November 2005 ("BIS II").
BIS II provides two approaches for setting capital standards for credit risk—an internal ratings-based approach tailored to individual institutions' circumstances (which for many asset classes is itself broken into a "foundation" approach and an "advanced or A-IRB" approach, the availability of which is subject to additional restrictions) and a standardized approach that bases risk weightings on external credit assessments to a much greater extent than permitted in existing risk-based capital guidelines. BIS II also sets capital requirements for operational risk and refines the existing capital requirements for market risk exposures.
In December 2006, the agencies issued a notice of proposed rulemaking describing proposed amendments to their existing risk-based capital guidelines to make them more risk-sensitive, generally following aspects of the standardized approach of BIS II. These latter proposed amendments, often referred to as "BIS I-A", would apply to banking organizations that are not internationally active banking organizations subject to the A-IRB approach for internationally active banking organizations and do not "opt in" to that approach. The agencies previously had issued advance notices of proposed
12
Table of Contents
rulemaking on both proposals (in August 2003 regarding the A-IRB approach of BIS II for internationally active banking organizations and in October 2005 regarding BIS II).
In July 2007, the U.S. banking and thrift agencies reached an agreement on the implementation of the capital adequacy regulations and standards based on BIS II. In November 2007, the agencies approved final rules to implement the new risk-based capital requirements in the United States for large, internationally active banking organizations, or "core banks"—defined as those with consolidated total assets of $250 billion or more or consolidated on-balance sheet foreign exposures of $10 billion or more. The final rule was effective as of April 1, 2008.
We are not a core bank and do not apply the BIS II approach to computing risk-weighted assets.
In June 2008, the U.S. banking and thrift agencies announced a proposed rule that would provide all non-core banking organizations (that is, banking organizations not required to adopt the advanced approaches) with the option to adopt a way to determine required regulatory capital that is more risk sensitive than the current Basel I-based rules, yet is less complex than the advanced approach final rule. The proposed standardized framework addresses (i) expanding the number of risk-weight categories to which credit exposures may be assigned, (ii) using loan-to-value ratios to risk weight most residential mortgages to enhance the risk sensitivity of the capital requirement, (iii) providing a capital charge for operational risk using the Basic Indicator Approach under the international Basel II capital accord, (iv) emphasizing the importance of a bank's assessment of its overall risk profile and capital adequacy and (v) providing for comprehensive disclosure requirements to complement the minimum capital requirements and supervisory process through market discipline. This new proposal would replace the agencies' earlier BIS I-A proposal, issued in December 2006.
Emergency Economic Stabilization Act of 2008
In response to recent unprecedented market turmoil, the Emergency Economic Stabilization Act of 2008 ("EESA") was enacted on October 3, 2008. EESA authorizes the U.S. Treasury Department to provide up to $700 billion in funding for the financial services industry. Pursuant to the EESA, the Treasury was initially authorized to use $350 billion for the Troubled Asset Relief Program (TARP). Of this amount, Treasury allocated $250 billion to the TARP Capital Purchase Program (see description below). On January 15, 2009, the second $350 billion of TARP monies was released to the Treasury. The Secretary's authority under TARP expires on December 31, 2009 unless the Secretary certifies to Congress that extension is necessary provided that his authority may not be extended beyond October 3, 2010.
Pursuant to authority under EESA, the Treasury created the TARP Capital Purchase Program under which the Treasury will invest up to $250 billion in senior preferred stock of U.S. banks and savings associations or their holding companies. Qualifying financial institutions may issue senior preferred stock with a value equal to not less than 1% of risk-weighted assets and not more than the lesser of $25 billion or 3% of risk-weighted assets. The senior preferred stock will pay dividends at the rate of 5% per annum until the fifth anniversary of the investment and thereafter at the rate of 9% per annum. The senior preferred stock may not be redeemed for three years except with the proceeds from an offering of common stock or preferred stock qualifying as Tier 1 capital in an amount equal to not less than 25% of the amount of the senior preferred. After three years, the senior preferred may be redeemed at any time in whole or in part by the financial institution. No dividends may be paid on common stock unless dividends have been paid on the senior preferred stock. Until the third anniversary of the issuance of the senior preferred, the consent of the Treasury will be required for any increase in the dividends on the common stock or for any stock repurchases unless the senior preferred has been redeemed in its entirety or the Treasury has transferred the senior preferred to third parties. The senior preferred will not have voting rights other than the right to vote as a class on the issuance of any preferred stock ranking senior, any change in its terms or any merger, exchange or similar
13
Table of Contents
transaction that would adversely affect its rights. The senior preferred will also have the right to elect two directors if dividends have not been paid for six periods. The senior preferred will be freely transferable and participating institutions will be required to file a shelf registration statement covering the senior preferred. The issuing institution must grant the Treasury piggyback registration rights. Prior to issuance, the financial institution and its senior executive officers must modify or terminate all benefit plans and arrangements to comply with EESA. Senior executives must also waive any claims against the Department of Treasury.
In connection with the issuance of the senior preferred, participating institutions must issue to the Treasury immediately exercisable 10-year warrants to purchase common stock with an aggregate market price equal to 15% of the amount of senior preferred. The exercise price of the warrants will equal the market price of the common stock on the date of the investment. The Treasury may only exercise or transfer one-half of the warrants prior to the earlier of December 31, 2009 or the date the issuing financial institution has received proceeds equal to the senior preferred investment from one or more offerings of common or preferred stock qualifying as Tier 1 capital. The Treasury will not exercise voting rights with respect to any shares of common stock acquired through exercise of the warrants. The financial institution must file a shelf registration statement covering the warrants and underlying common stock as soon as practicable after issuance and grant piggyback registration rights. The number of warrants will be reduced by one-half if the financial institution raises capital equal to the amount of the senior preferred through one or more offerings of common stock or preferred stock qualifying as Tier 1 capital. If the financial institution does not have sufficient authorized shares of common stock available to satisfy the warrants or their issuance otherwise requires shareholder approval, the financial institution must call a meeting of shareholders for that purpose as soon as practicable after the date of investment. The exercise price of the warrants will be reduced by 15% for each six months that lapse before shareholder approval, subject to a maximum reduction of 45%.
The Company has applied for up to three percent of its risk-weighted assets and is currently waiting to hear about the status of its application as of the filing date of this report.
Deposit Insurance
The deposits of the Bank are insured up to applicable limits by the Deposit Insurance Fund, or the DIF, of the FDIC and are subject to deposit insurance assessments to maintain the DIF. The FDIC utilizes a risk-based assessment system that imposes insurance premiums based upon a risk matrix that takes into account a bank's capital level and supervisory rating.
Effective January 1, 2007, the FDIC imposed deposit assessment rates based on the risk category of the bank. Risk Category I is the lowest risk category while Risk Category IV is the highest risk category. Because of favorable loss experience and a healthy reserve ratio in the Bank Insurance Fund, or the BIF, of the FDIC, well-capitalized and well-managed banks, have in recent years paid minimal premiums for FDIC insurance. With the additional deposit insurance, a deposit premium refund, in the form of credit offsets, was granted to banks that were in existence on December 31, 1996 and paid deposit insurance premiums prior to that date. For 2007, the holding company's two subsidiary banks utilized the credit offsets to eliminate nearly all of their 2007 FDIC insurance assessments.
For 2007 and 2008, the holding company's subsidiary banks qualified for Risk Category I. Risk Category I generally includes banks that are "well-capitalized" and that receive a composite CAMELS rating of 2 or higher. For banks under $10 billion in total assets in Risk Category I, the 2007 and 2008 deposit assessment ranged from 5 to 7 basis points of total qualified deposits. The actual assessment is dependent upon certain risk measures as defined in the final rule. For 2007, Guaranty Bank was assessed at the lowest point of the range, whereas CBW was assessed at a higher rate within the range. For 2008, Guaranty Bank was assessed at a higher point within the range.
14
Table of Contents
On October 16, 2008, the FDIC published a restoration plan designed to replenish the Deposit Insurance Fund over a period of five years and to increase the deposit insurance reserve ratio, which decreased to 1.01% of insured deposits on June 30, 2008, to the statutory minimum of 1.15% of insured deposits by December 31, 2013. In order to implement the restoration plan, the FDIC proposes to change both its risk-based assessment system and its base assessment rates. For the first quarter of 2009 only, the FDIC increased all FDIC deposit assessment rates by 7 basis points. These new rates range from 12-14 basis points for Risk Category I institutions to 50 basis points for Risk Category IV institutions. Under the FDIC's restoration plan, the FDIC proposes to establish new initial base assessment rates that will be subject to adjustment as described below. Beginning April 1, 2009, the base assessment rates would range from 10-14 basis points for Risk Category I institutions to 45 basis points for Risk Category IV institutions. Changes to the risk-based assessment system would include increasing premiums for institutions that rely on excessive amounts of brokered deposits, including CDARS, increasing premiums for excessive use of secured liabilities, including Federal Home Loan Bank advances, lowering premiums for smaller institutions with very high capital levels, and adding financial ratios and debt issuer ratings to the premium calculations for banks with over $10 billion in assets, while providing a reduction for their unsecured debt. Either an increase in the Risk Category of the Bank or adjustments to the base assessment rates could have a material adverse effect on our earnings.
In addition, all institutions with deposits insured by the FDIC are required to pay assessments to fund interest payments on bonds issued by the Financing Corporation (FICO), a mixed-ownership government corporation established to recapitalize a predecessor to the Deposit Insurance Fund. The current annualized assessment rate is 1.14 basis points, or approximately .285 basis points per quarter. These assessments will continue until the Financing Corporation bonds mature in 2019.
The enactment of EESA temporarily raised the basic limit on federal deposit insurance coverage from $100,000 to $250,000 per depositor. The temporary increase in deposit insurance coverage became effective on October 3, 2008. EESA provides that the basic deposit insurance limit will return to $100,000 after December 31, 2009.
On October 14, 2008, the FDIC announced the Temporary Liquidity Guarantee Program (TLGP). The final rule was adopted on November 21, 2008. The FDIC stated that its purpose is to strengthen confidence and encourage liquidity in the banking system by guaranteeing newly issued senior unsecured debt of banks of 31 days or greater, thrifts, and certain holding companies, and by providing full coverage of all transaction accounts, regardless of dollar amount. Inclusion in the program was voluntary. Participating institutions are assessed fees based on a sliding scale, depending on length of maturity. Shorter-term debt has a lower fee structure and longer-term debt has a higher fee. The range is from 50 basis points on debt of 180 days or less, and a maximum of 100 basis points for debt with maturities of one year or longer, on an annualized basis. A 10-basis point surcharge is added to a participating institution's current insurance assessment in order to fully cover all transaction accounts. Guaranty Bank elected to participate in both parts of the TLGP, and the holding company elected to participate in the senior unsecured debt portion of the program. The amount of greater than 30 day unsecured senior debt that is eligible for the program is limited to 125% of the amount of such debt outstanding as of September 30, 2008. If there was no unsecured senior debt outstanding at September 30, 2008, the amount available under the program is limited to two percent of total liabilities as of September 30, 2008. As the Company did not have any unsecured senior debt outstanding as of September 30, 2008, the maximum amount of unsecured senior debt that can be issued under the program is limited to two percent of its total liabilities as of September 30, 2008 (approximately $38 million).
15
Table of Contents
Depositor Preference
The FDIA provides that, in the event of the "liquidation or other resolution" of an insured depository institution, the claims of depositors of the institution, including the claims of the FDIC as subrogee of insured depositors, and certain claims for administrative expenses of the FDIC as a receiver, will have priority over other general unsecured claims against the institution. If an insured depository institution fails, insured and uninsured depositors, along with the FDIC, will have priority in payment ahead of unsecured, non-deposit creditors, including the parent bank holding company, with respect to any extensions of credit they have made to such insured depository institution.
Community Reinvestment Act
The Community Reinvestment Act of 1977, or the CRA, requires depository institutions to assist in meeting the credit needs of their market areas consistent with safe and sound banking practice. Under the CRA, each depository institution is required to help meet the credit needs of its market areas by, among other things, providing credit to low- and moderate-income individuals and communities. Depository institutions are periodically examined for compliance with the CRA and are assigned ratings. In order for a financial holding company to commence any new activity permitted by the BHC Act, or to acquire any company engaged in any new activity permitted by the BHC Act, each insured depository institution subsidiary of the financial holding company must have received a rating of at least "satisfactory" in its most recent examination under the CRA. Furthermore, banking regulators take into account CRA ratings when considering approval of a proposed transaction.
Financial Privacy
In accordance with the Gramm-Leach-Bliley Financial Modernization Act of 1999, or the GLB Act, federal banking regulators adopted rules that limit the ability of banks and other financial institutions to disclose non-public information about consumers to nonaffiliated third parties. These limitations require disclosure of privacy policies to consumers and, in some circumstances, allow consumers to prevent disclosure of certain personal information to a nonaffiliated third party. The privacy provisions of the GLB Act affect how consumer information is transmitted through diversified financial companies and conveyed to outside vendors.
Anti-Money Laundering Initiatives and the USA Patriot Act
A major focus of governmental policy on financial institutions this decade has been aimed at combating money laundering and terrorist financing. The USA PATRIOT Act of 2001, or the USA Patriot Act, substantially broadened the scope of United States anti-money laundering laws and regulations by imposing significant new compliance and due diligence obligations, creating new crimes and penalties and expanding the extra-territorial jurisdiction of the United States. The U.S. Treasury Department has issued a number of regulations that apply various requirements of the USA Patriot Act to financial institutions such as the Bank. These regulations impose obligations on financial institutions to maintain appropriate policies, procedures and controls to detect, prevent and report money laundering and terrorist financing and to verify the identity of their customers. Failure of a financial institution to maintain and implement adequate programs to combat money laundering and terrorist financing, or to comply with all of the relevant laws or regulations, could have serious legal and reputational consequences for the institution.
16
Table of Contents
Office of Foreign Assets Control Regulation
The United States has imposed economic sanctions that affect transactions with designated foreign countries, nationals and others. These are typically known as the "OFAC" rules based on their administration by the U.S. Treasury Department Office of Foreign Assets Control ("OFAC"). The OFAC-administered sanctions targeting countries take many different forms. Generally, however, they contain one or more of the following elements: (i) restrictions on trade with or investment in a sanctioned country, including prohibitions against direct or indirect imports from and exports to a sanctioned country and prohibitions on "U.S. persons" engaging in financial transactions relating to making investments in, or providing investment-related advice or assistance to, a sanctioned country; and (ii) a blocking of assets in which the government or specially designated nationals of the sanctioned country have an interest, by prohibiting transfers of property subject to U.S. jurisdiction (including property in the possession or control of U.S. persons). Blocked assets (e.g., property and bank deposits) cannot be paid out, withdrawn, set off or transferred in any manner without a license from OFAC. Failure to comply with these sanctions could have serious legal and reputational consequences.
Sarbanes-Oxley Act
As a publicly traded company, we are subject to the Sarbanes-Oxley Act of 2002 ("Sarbanes-Oxley Act"). The principal provisions of the Sarbanes-Oxley Act, many of which have been implemented or interpreted through regulations, provide for and include, among other things: (i) the creation of an independent accounting oversight board; (ii) auditor independence provisions that restrict non-audit services that accountants may provide to their audit clients; (iii) additional corporate governance and responsibility measures, including the requirement that the chief executive officer and chief financial officer of a public company certify financial statements; (iv) the forfeiture of bonuses or other incentive-based compensation and profits from the sale of an issuer's securities by directors and senior officers in the twelve month period following initial publication of any financial statements that later require restatement; (v) an increase in the oversight of, and enhancement of certain requirements relating to, audit committees of public companies and how they interact with the Company's independent auditors; (vi) requirements that audit committee members must be independent and are barred from accepting consulting, advisory or other compensatory fees from the issuer; (vii) requirements that companies disclose whether at least one member of the audit committee is a "financial expert" (as such term is defined by the SEC) and if not discussed, why the audit committee does not have a financial expert; (viii) expanded disclosure requirements for corporate insiders, including accelerated reporting of stock transactions by insiders and a prohibition on insider trading during pension blackout periods; (ix) a prohibition on personal loans to directors and officers, except certain loans made by insured financial institutions on nonpreferential terms and in compliance with other bank regulatory requirements; (x) disclosure of a code of ethics and filing a Form 8-K for a change or waiver of such code; (xi) a range of enhanced penalties for fraud and other violations; and (xii) expanded disclosure and certification relating to an issuer's disclosure controls and procedures and internal controls over financial reporting.
Legislative and Regulatory Initiatives
From time to time, various legislative and regulatory initiatives are introduced in the U.S. Congress and state legislatures, as well as by regulatory agencies. Such initiatives may include proposals to expand or contract the powers of bank holding companies and depository institutions or proposals to substantially change the financial institution regulatory system. Such legislation could change banking statutes and our operating environment in substantial and unpredictable ways. If enacted, such legislation could increase or decrease the cost of doing business, limit or expand permissible activities or affect the competitive balance among banks, savings associations, credit unions, and other financial institutions. We cannot predict whether any such legislation will be enacted, and, if enacted, the effect
17
Table of Contents
that it, or any implementing regulations, would have on our financial condition, results of operations or cash flows. A change in statutes, regulations or regulatory policies applicable to Guaranty or any of its subsidiaries could have a material effect on our business.
Employees
At December 31, 2008, we employed 387 full-time equivalent employees. None of our employees are represented by collective bargaining agreements. We believe our employee relations to be good.
Available Information
Guaranty Bancorp maintains an Internet website atwww.gbnk.com. At this website, our annual report on Form 10-K, quarterly reports on Form 10-Q, current reports on Form 8-K and proxy statements on Schedule 14A and amendments to such reports filed or furnished pursuant to Section 13(a) or 15(d) of the Exchange Act are available, free of charge, as soon as reasonably practicable after such forms are electronically filed with, or furnished to, the SEC. The public may read and copy any materials we file with the SEC at the SEC's Public Reference Room, located at 100 F Street, NE, Washington, D.C. 20549. The public may obtain information on the operation of the Public Reference Room by calling the SEC at 1-800-SEC-0330. The SEC also maintains an Internet site atwww.sec.gov that contains reports, proxy and information statements, and other information regarding issuers that file electronically with the SEC. You may obtain copies of the Company's filings on the SEC site. These documents may also be obtained in print upon request by our stockholders to our Investor Relations Department.
We have adopted a written code of ethics that applies to all directors, officers and employees of the Company, including our principal executive officer and senior financial officers, in accordance with Section 406 of the Sarbanes-Oxley Act of 2002 and the rules of the Securities and Exchange Commission promulgated thereunder. The code of ethics, which we call our Code of Business Conduct and Ethics, is available on our corporate website,www.gbnk.com, in the section entitled "Corporate Governance." In the event that we make changes in, or provide waivers from, the provisions of this code of ethics that the SEC requires us to disclose, we intend to disclose these events on our corporate website in such section. In the Corporate Governance section of our corporate website, we have also posted the charters for our Audit Committee and our Compensation, Nominating and Governance Committee, as well as our Corporate Governance Guidelines. In addition, information concerning purchases and sales of our equity securities by our executive officers and directors is posted on our website.
Our Investor Relations Department can be contacted at Guaranty Bancorp, 1331 Seventeenth Street, Suite 300, Denver, CO 80202, Attention: Investor Relations, telephone 303-293-5563, or via e-mail toinvestor.relations@gbnk.com.
Except for the documents specifically incorporated by reference into this document, information contained on our website or information that can be accessed through our website is not incorporated by reference into this document.
ITEM 1A. RISK FACTORS
An investment in our common stock is subject to risks inherent to our business. The material risks and uncertainties that management believes affect us are described below. Before making an investment decision, you should carefully consider the risks and uncertainties described below together with all of the other information included or incorporated by reference in this report. The risks and uncertainties described below are not the only ones we face. Additional risks and uncertainties that management is not aware of or focused on or that management currently deems immaterial may also impair our business operations. This report is qualified in its entirety by these risk factors.
18
Table of Contents
If any of the following risks actually occurs, our financial condition, results of operations or cash flows could be materially and adversely affected. If this were to happen, the value of our common stock could decline significantly, and you could lose all or part of your investment.
Our Business Has Been and May Continue to be Adversely Affected by Current Conditions in the Financial Markets And Economic Conditions Generally.
Negative developments in the latter half of 2007 and in 2008 in the financial services industry have resulted in uncertainty in the financial markets in general and a related general economic downturn, which have continued into 2009. In addition, as a consequence of the recession that the United States now finds itself in, business activity across a wide range of industries face serious difficulties due to the lack of consumer spending and the extreme lack of liquidity in the global credit markets. Unemployment has also increased significantly.
As a result of these financial economic crises, many lending institutions, including us, have experienced declines in the performance of their loans, including construction, land development and land loans, commercial loans and consumer loans. Moreover, competition among depository institutions for deposits and quality loans has increased significantly. In addition, the values of real estate collateral supporting many commercial loans and home mortgages have declined and may continue to decline. Bank and bank holding company stock prices have been negatively affected, as has the ability of banks and bank holding companies to raise capital or borrow in the debt markets has become more difficult compared to recent years. As a result, there is a potential for new federal or state laws and regulations regarding lending and funding practices and liquidity standards, and bank regulatory agencies are expected to be very aggressive in responding to concerns and trends identified in examinations, including the expected issuance of many formal or informal enforcement actions or orders. The impact of new legislation in response to those developments, may negatively impact our operations by restricting our business operations, including our ability to originate or sell loans, and adversely impact our financial performance or our stock price.
In addition, further negative market developments may affect consumer confidence levels and may cause adverse changes in payment patterns, causing increases in delinquencies and default rates, which may impact our charge-offs and provision for credit losses. A worsening of these conditions would likely exacerbate the adverse effects of these difficult market conditions on us and others in the financial services industry.
Overall, during the past year, the general business environment has had an adverse effect on our business, and there can be no assurance that the environment will improve in the near term. Until conditions improve, we expect our business, financial condition and results of operations to be adversely affected.
We Are Subject to Interest Rate Risk
Our earnings and cash flows are largely dependent upon our net interest income. Net interest income is the difference between interest income earned on interest-earning assets such as loans and securities and interest expense paid on interest-bearing liabilities such as deposits and borrowed funds. Interest rates are highly sensitive to many factors that are beyond our control, including general economic conditions, demand for loans, securities and deposits, and policies of various governmental and regulatory agencies and, in particular, the Board of Governors of the Federal Reserve System. Changes in monetary policy, including changes in interest rates, could influence not only the interest we receive on loans and securities and the amount of interest we pay on deposits and borrowings, but such changes could also affect (i) our ability to originate loans and obtain deposits, (ii) the fair value of our financial assets and liabilities, and (iii) the average duration of our loans and securities which are collateralized by mortgages. If the interest rates paid on deposits and other borrowings increase at a
19
Table of Contents
faster rate than the interest rates received on loans and other investments, our net interest income, and therefore earnings, could be adversely affected. Earnings could also be adversely affected if the interest rates received on loans and other investments fall more quickly than the interest rates paid on deposits and other borrowings.
Any substantial, unexpected, prolonged change in market interest rates could have a material adverse effect on our financial condition, results of operations and cash flows. See Item 7A. Quantitative and Qualitative Disclosures about Market Risk located elsewhere in this report for further discussion related to our management of interest rate risk.
We are Subject to Credit Risk
There are inherent risks associated with our lending activities. These risks include, among other things, the impact of changes in interest rates and changes in the economic conditions in the markets where we operate as well as those across the United States and abroad. Increases in interest rates and/or weakening economic conditions could adversely impact the ability of borrowers to repay outstanding loans or the value of the collateral securing these loans. We are also subject to various laws and regulations that affect our lending activities. Failure to comply with applicable laws and regulations could subject us to regulatory enforcement action that could result in the assessment of significant civil money penalties against us.
We seek to mitigate the risks inherent in our loan portfolio by adhering to specific underwriting practices. Although we believe that our underwriting criteria are appropriate for the various kinds of loans we make, we may incur losses on loans that meet our underwriting criteria, and these losses may exceed the amounts set aside as reserves in our allowance for loan losses. Due to recent economic conditions affecting the real estate market, many lending institutions, including us, have experienced substantial declines in the performance of their loans, including construction, land development loans and land loans. The value of real estate collateral supporting many construction and land development loans, land loans, commercial loans and multi-family loans have declined and may continue to decline. Recent negative developments in the financial industry and credit markets may continue to adversely impact our financial condition and results of operations.
Further Downturn in Our Real Estate Markets Could Hurt Our Business
Our business activities and credit exposure are primarily concentrated along the Front Range of Colorado. As of December 31, 2008, approximately 55% of the book value of our loan portfolio consisted of real estate loans. Substantially all of our real estate loans are located in Colorado. While we do not have any sub-prime loans, our construction, land development and land loan portfolio, along with our commercial and multi-family loan portfolios and certain of our other loans, have been affected by the recent downturn in the residential and commercial real estate market. Real estate values and real estate markets are generally affected by changes in national, regional or local economic conditions, fluctuations in interest rates and the availability of loans to potential purchasers, changes in tax laws and other governmental statutes, regulations and policies and acts of nature. We anticipate that further declines in the real estate markets in our primary market areas would affect our business. If real estate values continue to decline, the collateral for our loans will provide less security. As a result, our ability to recover on defaulted loans by selling the underlying real estate will be diminished, and we would be more likely to suffer losses on defaulted loans. The events and conditions described in this risk factor could therefore have a material adverse effect on our business, results of operations and financial condition.
20
Table of Contents
We May be Required to Make Further Increases in Our Provisions for Loan Losses and to Charge Off Additional Loans in the Future, Which Could Adversely Affect Our Results of Operations.
We maintain an allowance for loan losses, which is a reserve established through a provision for loan losses charged to expense, that represents management's best estimate of probable incurred losses within the existing portfolio of loans. The allowance, in the judgment of management, is necessary to reserve for estimated loan losses and risks inherent in the loan portfolio. The level of the allowance reflects management's continuing evaluation of specific credit risks; loan loss experience; current loan portfolio quality; present economic, political and regulatory conditions; industry concentrations and other unidentified losses inherent in the current loan portfolio. The determination of the appropriate level of the allowance for loan losses inherently involves a high degree of subjectivity and judgment and requires us to make significant estimates of current credit risks and future trends, all of which may undergo material changes. Changes in economic conditions affecting borrowers, new information regarding existing loans, identification of additional problem loans and other factors, both within and outside of our control, may require an increase in the allowance for loan losses. Increases in nonperforming loans have a significant impact on our allowance for loan losses. Generally, our non-performing loans and assets reflect operating difficulties of individual borrowers resulting from weakness in the economy of the Front Range of Colorado. If current trends in the real estate markets continue, we expect that we will continue to experience increased delinquencies and credit losses, particularly with respect to construction, land development and land loans. Moreover, with the country currently in a recession, we expect that it will negatively impact economic conditions in our market areas and that we could experience significantly higher delinquencies and credit losses.
In addition, bank regulatory agencies periodically review our allowance for loan losses and may require an increase in the provision for loan losses or the recognition of further loan charge-offs, based on judgments different than those of management. If charge-offs in future periods exceed the allowance for loan losses, we will need additional provisions to increase the allowance for loan losses. Furthermore, growth in the loan portfolio would generally lead to an increase in the provision for loan losses.
Any increases in the allowance for loan losses will result in a decrease in net income and capital, and may have a material adverse effect on our financial condition, results of operations and cash flows. See the section captioned "Allowance for Loan Losses" in Item 7. Management's Discussion and Analysis of Financial Condition and Results of Operations located elsewhere in this report for further discussion related to our process for determining the appropriate level of the allowance for loan losses.
Liquidity Risk Could Impair Our Ability to Fund Operations and Jeopardize Our Financial Condition.
Liquidity is essential to our business. An inability to raise funds through traditional deposits, brokered deposits, borrowings, the sale of securities or loans and other sources could have a substantial negative effect on our liquidity. Our access to funding sources in amounts adequate to finance our activities or the terms of which are acceptable to us could be impaired by factors that affect us specifically or the financial services industry or economy in general. Factors that could detrimentally impact our access to liquidity sources include a decrease in the level of our business activity as a result of a downturn in the markets in which our loans are concentrated or adverse regulatory action against us. Our ability to borrow could also be impaired by factors that are not specific to us, such as a disruption in the financial markets or negative views and expectations about the prospects for the financial services industry in light of the recent turmoil faced by banking organizations and the continued deterioration in credit markets.
We rely on commercial and retail deposits, brokered deposits, advances from the Federal Home Loan Bank ("FHLB") of Topeka and other borrowings to fund our operations. Although we have historically been able to replace maturing deposits and advances as necessary, we might not be able to
21
Table of Contents
replace such funds in the future if, among other things, our results of operations or financial condition or the results of operations or financial condition of the FHLB of Topeka or market conditions were to change. In addition, if we fall below the FDIC's thresholds to be considered "well capitalized", we will be unable to continue with uninterrupted access to the brokered funds markets.
Although we consider these sources of funds adequate for our liquidity needs, there can be no assurance in this regard and we may be compelled to seek additional sources of financing in the future. Likewise, we may seek additional debt in the future to achieve our business objectives, in connection with future acquisitions or for other reasons. There can be no assurance additional borrowings, if sought, would be available to us or, if available, would be on favorable terms. Bank and holding company stock prices have been negatively affected by the recent adverse economic trend, as has the ability of banks and holding companies to raise capital or borrow in the debt markets compared to recent years. If additional financing sources are unavailable or not available on reasonable terms, our financial condition, results of operations and future prospects could be materially adversely affected.
We actively monitor the depository institutions that hold our federal funds sold and due from banks cash balances. We are currently not able to provide assurances that access to our cash equivalents and federal funds sold will not be impacted by adverse conditions in the financial markets. Our emphasis is primarily on safety of principal and we diversify our due from banks and federal funds sold among counterparties to minimize exposure to any one of these entities. The financials of the counterparties are routinely reviewed as part of our asset/liability management process. Balances in our accounts with financial institutions in the U.S. may exceed the FDIC insurance limits. While we monitor and adjust the balances in our accounts as appropriate, these balances could be impacted if the financial institutions fail and could be subject to other adverse conditions in the financial markets.
Concern of Customers Over Deposit Insurance May Cause a Decrease in Deposits
With recent increased concerns about bank failures, customers increasingly are concerned about the extent to which their deposits are insured by the FDIC. Customers may withdraw deposits in an effort to ensure that the amount they have on deposit with their bank is fully insured. Decreases in deposits may adversely affect our funding costs and net income.
Our Deposit Insurance Premium Could be Substantially Higher in the Future, Which Could Have a Material Adverse Effect on Our Future Earnings
The FDIC insures deposits at FDIC insured financial institutions, including the Bank. The FDIC charges the insured financial institutions premiums to maintain the Deposit Insurance Fund at a certain level. Current economic conditions have increased bank failures and expectations for further failures, in which case the FDIC ensures payments of deposits up to insured limits from the Deposit Insurance Fund.
On October 16, 2008, the FDIC published a restoration plan designed to replenish the Deposit Insurance Fund over a period of five years and to increase the deposit insurance reserve ratio, which decreased to 1.01% of insured deposits on June 30, 2008, to the statutory minimum of 1.15% of insured deposits by December 31, 2013. In order to implement the restoration plan, the FDIC proposes to change both its risk-based assessment system and its base assessment rates. For the first quarter of 2009 only, the FDIC increased all FDIC deposit assessment rates by 7 basis points. These new rates range from 12-14 basis points for Risk Category I institutions to 50 basis points for Risk Category IV institutions. Under the FDIC's restoration plan, the FDIC proposes to establish new initial base assessment rates that will be subject to adjustment as described below. Beginning April 1, 2009, the base assessment rates would range from 10-14 basis points for Risk Category I institutions to 45 basis points for Risk Category IV institutions. Changes to the risk-based assessment system would include increasing premiums for institutions that rely on excessive amounts of brokered deposits, including
22
Table of Contents
CDARS, increasing premiums for excessive use of secured liabilities, including Federal Home Loan Bank advances, lowering premiums for smaller institutions with very high capital levels, and adding financial ratios and debt issuer ratings to the premium calculations for banks with over $10 billion in assets, while providing a reduction for their unsecured debt. Either an increase in the Risk Category of the Bank or adjustments to the base assessment rates could have a material adverse effect on our earnings.
We May Elect or be Compelled to Seek Additional Capital in the Future, But Capital May not be Available When it is Needed
We are required by federal and state regulatory authorities to maintain adequate levels of capital to support our operations. In addition, we may elect to raise additional capital to support our business or to finance acquisitions, if any, or we may otherwise elect to raise additional capital. In that regard, a number of financial institutions have recently raised considerable amounts of capital as a result of deterioration in their results of operations and financial condition arising from the turmoil in the mortgage loan market, deteriorating economic conditions, declines in real estate values and other factors, which may diminish our ability to raise additional capital.
On October 3, 2008, Congress approved the $700 billion Emergency Economic Stabilization Act of 2008 (EESA). The first phase of implementation of EESA included a $250 billion Treasury Capital Purchase Program. The Company applied for up to three-percent of its total risk-weighted assets in capital, which would be in the form of non-cumulative perpetual preferred stock of the institution with a dividend rate of 5% until the fifth anniversary of the investment, and 9% thereafter. If the Company's application is approved and the investment is completed, Treasury will also receive warrants for common stock of the Company equal to 15% of the capital invested. There is no guarantee that the Treasury will select the Company to participate in its Capital Purchase Program.
Our ability to raise additional capital, if needed, will depend on conditions in the capital markets, economic conditions and a number of other factors, many of which are outside our control, and on our financial performance. Accordingly, we cannot be assured of our ability to raise additional capital if needed or on terms acceptable to us. If we cannot raise additional capital when needed, it may have a material adverse effect on our financial condition, results of operations and prospects.
The Value of Securities in Our Investment Securities Portfolio May be Negatively Affected by Continued Disruptions In Securities Markets
The market for some of the investment securities held in our portfolio has become extremely volatile over the past twelve months. Volatile market conditions may detrimentally affect the value of these securities, such as through reduced valuations due to the perception of heightened credit and liquidity risks. There can be no assurance that the declines in market value associated with these disruptions will not result in other than temporary impairments of these assets, which would lead to accounting charges that could have a material adverse effect on our net income and capital levels.
The Soundness of Other Financial Institutions Could Adversely Affect Us
Since mid-2007, the financial services industry as a whole, as well as the securities markets generally, have been materially and adversely affected by very significant declines in the values of nearly all asset classes and by a very serious lack of liquidity. Financial institutions in particular have been subject to increased volatility and an overall loss in investor confidence.
Our ability to engage in routine funding transactions could be adversely affected by the actions and commercial soundness of other financial institutions. Financial services companies are interrelated as a result of trading, clearing, counterparty, or other relationships. We have exposure to many different industries and counterparties, and we routinely execute transactions with counterparties in the financial
23
Table of Contents
services industry, including brokers and dealers, commercial banks, investment banks, mutual and hedge funds, and other institutional clients. As a result, defaults by, or even rumors or questions about, one or more financial services companies, or the financial services industry generally, have led to market-wide liquidity problems and could lead to losses or defaults by us or by other institutions. Many of these transactions expose us to credit risk in the event of default of our counterparty or client. In addition, our credit risk may be exacerbated when the collateral held by us cannot be realized or is liquidated at prices not sufficient to recover the full amount of the loan or derivative exposure due us. There is no assurance that any such losses would not materially and adversely affect our business, financial condition or results of operations.
We Are Subject to Extensive Government Regulation and Supervision
We are subject to extensive regulation, supervision and examination. Any change in the laws or regulations applicable to us, or in banking regulators' supervisory policies or examination procedures, whether by the Colorado Division of Banking, the FDIC, the Federal Reserve Board, other state or federal regulators, the U.S. Congress or the Colorado legislature could have a material adverse effect on our business, financial condition, results of operations and cash flows.
The Bank is subject to regulations promulgated by the Colorado Division of Banking, as its chartering authority, and by the FDIC as the insurer of its deposits up to certain limits. The bank also belongs to the Federal Home Loan Bank System and, as a member, it is subject to certain limited regulations promulgated by the Federal Home Loan Bank of Topeka. In addition, the Federal Reserve Board regulates and oversees Guaranty Bancorp as a bank holding company, and the Bank, as a member of the Federal Reserve System.
This regulation and supervision limits the activities in which we may engage. The purpose of regulation and supervision is primarily to protect the FDIC's insurance fund and our depositors and borrowers, rather than our stockholders. Regulatory authorities have extensive discretion in the exercise of their supervisory and enforcement powers. They may, among other things, impose restrictions on the operation of a banking institution, the classification of assets by such institution and such institution's allowance for loan losses. Regulatory and law enforcement authorities also have wide discretion and extensive enforcement powers under various consumer protection and civil rights laws, including the Truth-in-Lending Act, the Equal Credit Opportunity Act, the Fair Housing Act, the Real Estate Settlement Procedures Act, the Red Flag Identity Theft rules under the Fair and Accurate Credit Transactions Act and Colorado's deceptive acts and practices law. These laws also permit private individual and class action lawsuits and provide for the recovery of attorneys fees in certain instances. Given the current disruption in the financial markets and regulatory initiatives that are likely to be proposed by the new administration and Congress, new regulations and laws that may affect us are increasingly likely. Compliance with such regulations and laws may increase our costs and limit our ability to pursue business opportunities. Also, participation in specific government stabilization programs may subject us to additional restrictions. No assurance can be given that the foregoing regulations and supervision will not change so as to affect us adversely.
There can be no Assurance That the Recently Enacted Emergency Economic Stabilization Act of 2008 (the "EESA") and Other Recently Enacted Government Programs Will Help Stabilize the U.S. Financial System
On October 3, 2008, the Emergency Economic Stabilization Act of 2008 (the "EESA") was enacted. The U.S. Treasury and banking regulators are implementing a number of programs under this legislation and otherwise to address capital and liquidity issues in the banking system, including the TARP Capital Purchase Program. In addition, other regulators have taken steps to attempt to stabilize and add liquidity to the financial markets, such as the FDIC Temporary Liquidity Guarantee Program ("TLG Program"), which we did not "opt-out" of. However, there can be no assurance that we will
24
Table of Contents
issue any guaranteed debt under the TLG Program, or that we will participate in any other stabilization programs in the future.
There can also be no assurance as to the actual impact that the EESA and other programs will have on the financial markets, including the extreme levels of volatility and limited credit availability currently being experienced. The failure of the EESA and other programs to stabilize the financial markets and a continuation or worsening of current financial market conditions could materially and adversely affect our business, financial condition, results of operations, access to credit or the trading price of our common stock.
The EESA is relatively new legislation and, as such, is subject to change and evolving interpretation. This is particularly true given the change in administration that occurred on January 20, 2009. There can be no assurances as to the effects that such changes will have on the effectiveness of the EESA or on our business, financial condition or results of operations.
Our Profitability Depends Significantly on Economic Conditions in the Colorado Front Range
Our success depends primarily on the general economic conditions in the counties in which we conduct business. Unlike larger banks that are more geographically diversified, we provide banking and financial services to customers primarily in the Colorado Front Range, which includes the Denver metropolitan area. The local economic conditions in our market area have a significant impact on our loans, the ability of the borrowers to repay these loans and the value of the collateral securing these loans. A significant decline in general economic conditions caused by inflation, natural disasters, recession, unemployment or other factors beyond our control would affect these local economic conditions and could adversely affect our financial condition, results of operations and cash flows. Further deterioration in economic conditions, in particular within our primary market areas, could result in the following consequences, among others, any of which could hurt our business materially: loan delinquencies on real estate, commercial and consumer loans may increase; problem assets and foreclosures may increase; demand for our products and services may decline; and collateral for loans made by us, especially real estate, may decline in value, in turn reducing a customer's borrowing power and reducing the value of assets and collateral securing our loans. In view of the concentration of our operations and the collateral securing our loan portfolio in Colorado's Front Range, we may be particularly susceptible to the adverse effects of any of these consequences, any of which could have a material adverse effect on our business, financial condition, results of operations and cash flows.
We Operate in a Highly Competitive Industry and Market Area
We face substantial competition in all areas of our operations from a variety of different competitors, many of which are larger and may have more financial resources. Such competitors primarily include national, regional, and community banks within the various markets we serve. We also face competition from many other types of financial institutions, including, without limitation, savings and loans, credit unions, finance companies, brokerage firms, insurance companies, factoring companies and other financial intermediaries. The financial services industry could become even more competitive as a result of legislative, regulatory and technological changes and continued consolidation. Banks, securities firms and insurance companies can merge under the umbrella of a financial holding company, which can offer virtually any type of financial service, including banking, securities underwriting, insurance (both agency and underwriting) and merchant banking. Additionally, we expect competition to intensify among financial services companies due to the recent consolidation of certain competing financial institutions and the conversion of certain investment banks to bank holding companies. Also, technology has lowered barriers to entry and made it possible for non-banks to offer products and services traditionally provided by banks, such as automatic funds transfer and automatic payment systems. Many of our competitors have fewer regulatory constraints and may have lower cost structures. Additionally, due to their size, many competitors may be able to achieve economies of scale and, as a
25
Table of Contents
result, may offer a broader range of products and services as well as better pricing for those products and services than we can.
Our ability to compete successfully depends on a number of factors, including, among other things:
- •
- The ability to develop, maintain and build upon long-term customer relationships based on quality service, high ethical standards and safe, sound assets.
- •
- The ability to expand our market position.
- •
- The scope, relevance and pricing of products and services offered to meet customer needs and demands.
- •
- The rate at which we introduce new products and services relative to our competitors.
- •
- Customer satisfaction with our level of service.
- •
- Industry and general economic trends.
Failure to perform in any of these areas could significantly weaken our competitive position, which could adversely affect our growth and profitability, which, in turn, could have a material adverse effect on our financial condition, results of operations and cash flows.
We Rely on Dividends from Our Subsidiary for Most of Our Revenue
Because we are a holding company with no significant assets other than the Bank, we currently depend upon dividends from the Bank for a substantial portion of our revenues. Our ability to pay dividends to our stockholders will therefore continue to depend in large part upon our receipt of dividends or other capital distributions from the Bank. Our ability to pay dividends is subject to the restrictions of the Delaware General Corporation Law.
The ability of the Bank to pay dividends or make other capital distributions to the holding company is also subject to the regulatory authority of the Federal Reserve Board and the Colorado Division of Banking (CDB). Because of the accumulated deficit resulting from goodwill impairment charges in 2008 and 2007, the Bank will be required to obtain permission from the Federal Reserve Board and the CDB prior to making any dividend to the holding company, as further described in the "Supervision and Regulation" section of Item 1 of this report. During 2008, the Bank requested and received permission to pay $19 million in dividends from the Bank to the holding company.
From time to time, we may become a party to financing agreements or other contractual arrangements that have the effect of limiting or prohibiting us or our bank subsidiary from declaring or paying dividends. Our holding company expenses and interest obligations on our trust preferred securities and corresponding subordinated debt securities issued by us may limit or impair our ability to declare or pay dividends. The holding company currently has approximately $3.5 million in cash on hand, which based on current projections, is sufficient to meet our short-term cash needs. If we are unable to obtain permission to pay dividends from the Bank to the holding company, or are unable to raise additional capital, it could cause us to elect to defer interest payments on the trust preferred securities and corresponding subordinated debt securities for up to 20 quarters. See "Item 5. Market for Registrant's Common Equity, Related Stockholder Matters and Issuer Purchases of Equity Securities—Dividends" for more information on these restrictions.
We are Dependent on Key Personnel and the Loss of One or More of Those Key Personnel Could Harm Our Business
Competition for qualified employees and personnel in the banking industry is intense and there are a limited number of qualified persons with knowledge of and experience in the Colorado community banking industry. The process of recruiting personnel with the combination of skills and
26
Table of Contents
attributes required to carry out our strategies is often lengthy. Our success depends to a significant degree upon our ability to attract and retain qualified management, loan origination, administrative, marketing and technical personnel and upon the continued contributions of our management and personnel. In particular, our success is highly dependent upon the abilities of our senior executive management. We believe this management team, comprised of individuals who have worked in the banking industry for many years, is integral to implementing our business plan. The loss of the services of one or more of them could harm our business.
Our Controls and Procedures May Fail or Be Circumvented
Management regularly reviews and updates our internal controls, disclosure controls and procedures, and corporate governance policies and procedures. Any system of controls, however well designed and operated, is based in part on certain assumptions and can provide only reasonable, not absolute, assurances that the objectives of the system are met. Any failure or circumvention of our controls and procedures or failure to comply with regulations related to controls and procedures could have a material adverse effect on our business, results of operations, cash flows and financial condition.
We are Subject to Security and Operational Risks Relating to Our Use of Technology That Could Damage Our Reputation and Our Business.
We rely heavily on communications and information systems to conduct our business. Any failure, interruption or breach in security of these systems could result in failures or disruptions in our customer relationship management, general ledger, deposit, loan and other systems. While we have policies and procedures designed to prevent or limit the effect of the failure, interruption or security breach of our information systems, there can be no assurance that any such failures, interruptions or security breaches will not occur or, if they do occur, that they will be adequately addressed. Additionally, we outsource our data processing to a third party. If our third party provider encounters difficulties or if we have difficulty in communicating with such third party, it will significantly affect our ability to adequately process and account for customer transactions, which would significantly affect our business operations. Furthermore, breaches of such third party's technology may also cause reimbursable loss to our consumer and business customers, through no fault of our own. The occurrence of any failures, interruptions or security breaches of information systems used to process customer transactions could damage our reputation, result in a loss of customer business, subject us to additional regulatory scrutiny, or expose us to civil litigation and possible financial liability, any of which could have a material adverse effect on our financial condition, results of operations and cash flows.
We Continually Encounter Technological Change
The financial services industry is continually undergoing rapid technological change with frequent introductions of new technology-driven products and services. The effective use of technology increases efficiency and enables financial institutions to better serve customers and to reduce costs. Our future success depends, in part, upon our ability to address the needs of our customers by using technology to provide products and services that will satisfy customer demands, as well as to create additional efficiencies in our operations. Many of our competitors have substantially greater resources to invest in technological improvements. We may not be able to effectively implement new technology-driven products and services or be successful in marketing these products and services to our customers. Failure to successfully keep pace with technological change affecting the financial services industry could have a material adverse impact on our business and, in turn, our financial condition, results of operations and cash flows.
27
Table of Contents
We Are Subject to Claims and Litigation Pertaining to Fiduciary Responsibility
From time to time, customers make claims and take legal action pertaining to our performance of our fiduciary responsibilities. Whether customer claims and legal action related to our performance of our fiduciary responsibilities are founded or unfounded, if such claims and legal actions are not resolved in a manner favorable to us, they may result in significant financial liability and/or adversely affect the market perception of us and our products and services as well as impact customer demand for our products and services. Any financial liability or reputation damage could have a material adverse effect on our business, which, in turn, could have a material adverse effect on our financial condition, results of operations and cash flows.
Concentrated Ownership of our Common Stock Creates a Risk of Sudden Changes in our Share Price
As of February 9, 2009, executive officers, directors and stockholders of more than 5% of our common stock owned or controlled approximately 40.3% of our common stock. Investors who purchase our common stock may be subject to certain risks due to the concentrated ownership of our common stock. The sale by any of our large stockholders of a significant portion of that stockholder's holdings could have a material adverse effect on the market price of our common stock.
We Face Risks Associated With Acquisitions or Mergers
We may pursue acquisition or merger opportunities in the future. Risks commonly encountered in merger and acquisitions include, among other things:
- •
- The difficulty of integrating the operations, systems and personnel of acquired companies and branches.
- •
- The potential disruption of our ongoing business.
- •
- The potential diversion of our management's time and attention.
- •
- The inability of our management to maximize our financial and strategic position by the successful implementation of uniform product offerings and the incorporation of uniform technology into our product offerings and control systems.
- •
- The inability to maintain uniform standards, controls, procedures and policies and the impairment of relationships with employees and customers as a result of changes in management.
- •
- The potential exposure to unknown or contingent liabilities of the acquired or merged company.
- •
- Exposure to potential asset quality issues of the acquired or merged company.
- •
- The possible loss of key employees and customers of the acquired or merged company.
- •
- Difficulty in estimating the value of the acquired or merged company.
- •
- Potential changes in banking or tax laws or regulations that may affect the acquired or merged company.
- •
- Environmental liability with acquired loans, and their collateral, or with any real estate.
We may not be successful in overcoming these risks or any other problems encountered in connection with mergers or acquisitions. Our integration of operations of banks or branches that we acquire may not be successfully accomplished and may take a significant amount of time. Our inability to improve the operating performance of acquired banks and branches or to integrate successfully or in a timely manner their operations could have a material adverse effect on our business, financial condition, results of operations and cash flows. We expect to hire additional employees and retain
28
Table of Contents
consultants to assist with integrating our operations, and we cannot assure you that those individuals or firms will perform as expected or be successful in addressing these issues.
We are Exposed to Risk of Environmental Liabilities with Respect to Properties to Which We Take Title
In the course of our business, we may own or foreclose and take title to real estate, and could be subject to environmental liabilities with respect to these properties. We may be held liable to a governmental entity or to third parties for property damage, personal injury, investigation and clean-up costs incurred by these parties in connection with environmental contamination, or may be required to investigate or clean up hazardous or toxic substances, or chemical releases at a property. The costs associated with investigation or remediation activities could be substantial. In addition, as the owner or former owner of a contaminated site, we may be subject to common law claims by third parties based on damages and costs resulting from environmental contamination emanating from the property. If we ever become subject to significant environmental liabilities, our business, financial condition, cash flows, liquidity and results of operations could be materially and adversely affected.
Severe Weather, Natural Disasters, Acts of War or Terrorism and Other External Events Could Significantly Impact Our Business
Severe weather, natural disasters, acts of war or terrorism and other adverse external events could have a significant impact on our ability to conduct business. Such events could affect the stability of our deposit base; impair the ability of borrowers to repay outstanding loans, impair the value of collateral securing loans, cause significant property damage, result in loss of revenue and/or cause us to incur additional expenses. Although management has established disaster recovery policies and procedures, the occurrence of any such event could have a material adverse effect on our business, which, in turn, could have a material adverse effect on our financial condition, results of operations and cash flows.
ITEM 1B. UNRESOLVED STAFF COMMENTS
None.
ITEM 2. PROPERTIES
As of December 31, 2008, we had a total of 34 branch office properties, 21 of which we owned and 13 of which we leased. All of our properties are located in the Colorado Front Range. Each of Guaranty Bancorp's and Guaranty Bank's principal office is located at 1331 Seventeenth Street, Suite 300, Denver, Colorado 80202.
We consider our properties to be suitable and adequate for our needs.
ITEM 3. LEGAL PROCEEDINGS
In the ordinary course of our business, we are party to various legal actions, which we believe are incidental to the operation of our business. Although the ultimate outcome and amount of liability, if any, with respect to these legal actions to which we are currently a party cannot presently be ascertained with certainty, in the opinion of management, based upon information currently available to us, any resulting liability is not likely to have a material adverse effect on the Company's consolidated financial position, results of operations or cash flows.
ITEM 4. SUBMISSION OF MATTERS TO A VOTE OF SECURITY HOLDERS
No matters were submitted to a vote of the security holders during the fourth quarter 2008.
29
Table of Contents
PART II
ITEM 5. MARKET FOR REGISTRANT'S COMMON EQUITY, RELATED STOCKHOLDER MATTERS AND ISSUER PURCHASES OF EQUITY SECURITIES
Common Stock Market Prices
Our common stock is traded on the Nasdaq Global Select Market ("Nasdaq") under the symbol "GBNK". The table below sets forth the high and low sales prices per share of our common stock as reported by Nasdaq for each quarter in the preceding two fiscal years.
| | | | | | | | | | | | |
| | Sales Prices | |
|---|
| | High | | Low | | Close | |
|---|
Year/Quarter: | | | | | | | | | | |
| | 2008 | | | | | | | | | | |
| | | Fourth quarter | | $ | 6.35 | | $ | 1.42 | | $ | 2.00 | |
| | | Third quarter | | | 7.64 | | | 2.97 | | | 6.10 | |
| | | Second quarter | | | 6.75 | | | 3.59 | | | 3.60 | |
| | | First quarter | | | 7.00 | | | 4.89 | | | 6.28 | |
| | 2007 | | | | | | | | | | |
| | | Fourth quarter | | $ | 6.84 | | $ | 4.54 | | $ | 5.78 | |
| | | Third quarter | | | 8.64 | | | 5.06 | | | 6.40 | |
| | | Second quarter | | | 9.49 | | | 8.14 | | | 8.47 | |
| | | First quarter | | | 9.70 | | | 8.26 | | | 8.65 | |
On February 9, 2009, the closing price of our common stock on Nasdaq was $1.60 per share. As of that date, we believe, based on the records of our transfer agent, that there were approximately 240 record holders of our common stock.
Dividends
We have never declared or paid cash dividends on our common stock. Our board of directors reviews the appropriateness of declaring or paying cash dividends on an ongoing basis. Any determination to declare or pay dividends in the future will be at the discretion of our board of directors. Our board of directors will take into account such matters as general business conditions, our financial results, capital requirements, contractual, legal and regulatory restrictions on the payment of dividends by us to our stockholders or by our bank subsidiary to the holding company, and such other factors as our board of directors may deem relevant.
Our ability to pay dividends is subject to the restrictions of the Delaware General Corporation Law. Because we are a holding company with no significant assets other than our bank subsidiary, we currently depend upon dividends from our bank subsidiary for a substantial portion of our revenues. Our ability to pay dividends will therefore continue to depend in large part upon our receipt of dividends or other capital distributions from our bank subsidiary. See "Supervision and Regulation" in Item 1 of this report for a discussion of potential regulatory limitations on the holding company's receipt of funds from its bank subsidiary.
The ability of our bank subsidiary to pay dividends or make other capital distributions to us is also subject to the regulatory authority of the Federal Reserve Board and the Colorado Division of Banking, or the CDB. It is possible, depending upon the financial condition of the Bank, and other factors, that the Federal Reserve Board and/or the CDB could assert that payment of dividends or other payments is an unsafe or unsound practice. As part of our capital and cash management practices at the holding company, and subject to approval from the Federal Reserve Board and the CDB, we will utilize a portion of our bank subsidiary's excess capital above the well-capitalized requirement through the
30
Table of Contents
payment of dividends to the holding company. See "Item 1. Business—Supervision and Regulation—Dividends".
Our ability to pay dividends is also limited by certain covenants contained in the indentures governing trust preferred securities that have been issued, and in the debentures underlying the trust preferred securities. The indentures provide that if an Event of Default (as defined in the indentures) has occurred and is continuing, or if we are in default with respect to any obligations under our guarantee agreement which covers payments of the obligations on the trust preferred securities, or if we give notice of any intention to defer payments of interest on the debentures underlying the trust preferred securities, then we may not, among other restrictions, declare or pay any dividends (other than a dividend payable by the Bank to the holding company) with respect to our common stock.
Securities Authorized for Issuance Under Equity Compensation Plans
The following table provides information as of December 31, 2008, regarding securities issued and to be issued under our equity compensation plans that were in effect during the year ended December 31, 2008:
| | | | | | | | | | | | |
| | Plan Category | | Number of Securities to
be Issued Upon
Exercise of
Outstanding Options,
Warrants and Rights | | Weighted-Average
Exercise Price of
Outstanding
Options, Warrants
and Rights | | Number of Securities
Remaining Available for
Future Issuance Under
Equity Compensation
Plans (Excluding
Securities Reflected in
Column(a)) | |
|---|
| |
| | (a)
| | (b)
| | (c)
| |
|---|
Equity compensation plans approved by security holders | | 2005 Stock
Incentive Plan(1) | | | — | (2) | | — | | | 730,412 | (3)(4) |
Equity compensation plans not approved by security holders | | None | | | — | | | — | | | — | |
| | | | | | | | | | |
| | | | | — | | | — | | | 730,412 | |
| | | | | | | | | | |
- 1)
- The 2005 Stock Incentive Plan (the "Incentive Plan") was approved by the stockholders of the Company at our 2005 Annual Meeting of Stockholders.
- 2)
- Does not include the 1,420,345 shares of unvested stock grants outstanding as of December 31, 2008 with an exercise price of zero.
- 3)
- The total number of shares of common stock that have been approved for issuance pursuant to awards granted or which may be granted in the future under the Incentive Plan is 2,500,000 shares. The number of securities remaining available for future issuance has been reduced by 1,769,588 shares, which represents the number of vested shares and the number of unvested shares of service and performance stock awards outstanding at December 31, 2008.
- 4)
- All of the 730,412 shares remaining available for issuance under the Incentive Plan may be issued not only for future grants of options, warrants and rights, but also for future stock awards. The Company's current practice is to grant only awards of stock. While the Company has not issued any stock options, warrants or rights, it may do so in the future.
Repurchases of Common Stock
Stock repurchase programs allow us to proactively manage our capital position and return excess capital to stockholders. See "Supervision and Regulation" in Item 1 of this report for a discussion of
31
Table of Contents
potential regulatory limitations on the holdings company's receipt of dividends from its bank subsidiary, which may be used to repurchase our common stock. The following table provides information with respect to purchases made by or on behalf of the Company or any "affiliated purchaser" (as defined in Rule 10b-18(a)(3) under the Securities Exchange Act of 1934) of our common stock during the fourth quarter of 2008.
| | | | | | | | | | | | | |
| | Total Shares
Purchased | | Average Price
Paid per
Share | | Total Number of Shares
Purchased as Part of
Publicly Announced
Plans(1) | | Maximum Number of
Shares that May Yet be
Purchased Under the
Plans at The End of the
Period(1) | |
|---|
October 1 to October 31, 2008 | | | 497 | | $ | 4.64 | | | — | | | — | |
November 1 to November 30, 2008 | | | 932 | | | 3.20 | | | — | | | — | |
December 1 to December 31, 2008 | | | 8,193 | | | 2.00 | | | — | | | — | |
| | | | | | | | | | | | |
| | | 9,622 | | $ | 2.25 | | | — | (2) | | — | |
| | | | | | | | | | | | |
- (1)
- In October 2007, we announced the authorization of a new stock repurchase program to repurchase up to 1,200,000 shares of our common stock from time to time over a one-year period in the open market or through private transactions in accordance with applicable regulations of the Securities and Exchange Commission. This repurchase program lapsed in October 2008, with 1,200,000 shares expiring thereunder.
- (2)
- The difference of 9,622 shares between "Total Shares Purchased" and "Total Number of Shares Purchased as Part of Publicly Announced Plans" relates to the net settlement of vested, restricted stock awards.
Performance Graph
Our common stock trades on the Nasdaq Global Select Market® under the symbol "GBNK". The following graph shows a comparison from October 3, 2005 (the date the Company's common stock commenced trading on Nasdaq) through December 31, 2008 of cumulative total return for the Company's common stock, the Nasdaq Stock Market (U.S.) Index and Nasdaq Bank Stocks Index. Such returns are based on historical results and are not intended to suggest future performance. Data for the Nasdaq Stock Market (U.S.) Index and Nasdaq Bank Stocks Index assumes reinvestment of dividends. The Company has never paid dividends on its common stock. The total return on the Company's common stock is determined based on the change in the price of the Company's common stock and assumes an original investment of $100. The total return on each of the indicated indices also assumes an original investment in the index of $100.
32
Table of Contents
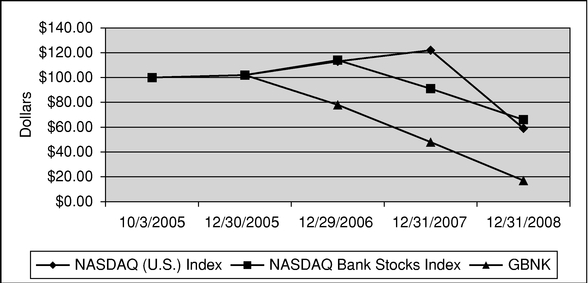
| | | | | | | | | | | | | | | | |
Index | | 10/3/2005 | | 12/30/2005 | | 12/29/2006 | | 12/31/2007 | | 12/31/2008 | |
|---|
NASDAQ (U.S.) Index | | | 100 | | | 102 | | | 113 | | | 122 | | | 59 | |
NASDAQ Bank Stocks Index | | | 100 | | | 102 | | | 114 | | | 91 | | | 66 | |
GBNK | | | 100 | | | 102 | | | 78 | | | 48 | | | 17 | |
ITEM 6. SELECTED FINANCIAL DATA
The following table sets forth certain of our financial and statistical information for each of the years in the five-year period ended December 31, 2008. The losses in 2008 and 2007 were primarily related to goodwill impairment charges of $250.7 million and $142.2 million in 2008 and 2007, respectively. This data should be read in conjunction with our audited consolidated financial statements as of December 31, 2008 and 2007, and for each of the years in the three-year period ended December 31, 2008, and related Notes to Consolidated Financial Statements contained in "Item 8. Financial Statements and Supplementary Data." The financial information for Guaranty Bancorp (formerly Centennial Bank Holdings, Inc.) and subsidiaries for the year ended December 31, 2004 separately reflects the activity for the Company for the period July 17, 2004 to December 31, 2004, which we refer to as Successor, and our predecessor for the period January 1, 2004 to July 16, 2004,
33
Table of Contents
which we refer to as Predecessor. All financial information relating to the Company prior to July 17, 2004 is for our Predecessor.
| | | | | | | | | | | | | | | | | | | |
| | (Successor) | | (Predecessor) | |
|---|
| | Year Ended December 31, | | Period July 17,
2004 to
December 31, | | Period January 1,
2004 to
July 16, | |
|---|
| | 2008 | | 2007 | | 2006 | | 2005 | | 2004 | | 2004 | |
|---|
| | (In thousands, except per share and percentage data)
| |
|---|
Consolidated Statement of Income (Loss) Data: | | | | | | | | | | | | | | | | | | | |
Interest income | | $ | 121,312 | | $ | 163,689 | | $ | 173,781 | | $ | 139,563 | | $ | 19,052 | | $ | 22,912 | |
Interest expense | | | 41,750 | | | 61,440 | | | 57,584 | | | 31,694 | | | 3,762 | | | 6,797 | |
| | | | | | | | | | | | | | |
Net interest income | | | 79,562 | | | 102,249 | | | 116,197 | | | 107,869 | | | 15,290 | | | 16,115 | |
Provision for loan losses | | | 33,775 | | | 24,666 | | | 4,290 | | | 3,400 | | | — | | | 4,700 | |
| | | | | | | | | | | | | | |
Net interest income after provision for loan losses | | | 45,787 | | | 77,583 | | | 111,907 | | | 104,469 | | | 15,290 | | | 11,415 | |
Noninterest income | | | 10,620 | | | 10,696 | | | 12,717 | | | 10,317 | | | 1,784 | | | 2,426 | |
Noninterest expense(1) | | | 319,656 | | | 226,556 | | | 90,908 | | | 91,983 | | | 10,947 | | | 14,514 | |
| | | | | | | | | | | | | | |
Income (loss) before income taxes | | | (263,249 | ) | | (138,227 | ) | | 33,716 | | | 22,803 | | | 6,127 | | | (673 | ) |
Income tax expense (benefit) | | | (6,513 | ) | | (185 | ) | | 11,286 | | | 7,639 | | | 2,331 | | | 411 | |
| | | | | | | | | | | | | | |
Income (loss) from continuing operations | | | (256,736 | ) | | (138,092 | ) | | 22,430 | | | 15,164 | | | 3,796 | | | (1,084 | ) |
Income (loss) from discontinued operations, net of tax | | | — | | | — | | | 1,988 | | | (482 | ) | | — | | | — | |
| | | | | | | | | | | | | | |
Net income (loss) | | $ | (256,736 | ) | $ | (138,092 | ) | $ | 24,418 | | $ | 14,682 | | $ | 3,796 | | $ | (1,084 | ) |
| | | | | | | | | | | | | | |
Share Data: | | | | | | | | | | | | | | | | | | | |
Basic earnings (loss) per share | | $ | (5.03 | ) | $ | (2.60 | ) | $ | 0.42 | | $ | 0.27 | | $ | 0.20 | | $ | (0.70 | ) |
Diluted earnings (loss) per share | | $ | (5.03 | ) | $ | (2.60 | ) | $ | 0.42 | | $ | 0.27 | | $ | 0.20 | | $ | (0.70 | ) |
Basic earnings (loss) from continuing operations per share | | $ | (5.03 | ) | $ | (2.60 | ) | $ | 0.39 | | $ | 0.28 | | $ | 0.20 | | $ | (0.70 | ) |
Diluted earnings (loss) from continuing operations per share | | $ | (5.03 | ) | $ | (2.60 | ) | $ | 0.39 | | $ | 0.28 | | $ | 0.20 | | $ | (0.70 | ) |
Book value per share | | $ | 3.07 | | $ | 7.96 | | $ | 10.30 | | $ | 10.13 | | $ | 9.85 | | $ | 37.17 | |
Weighted average shares outstanding—basic | | | 51,044,372 | | | 53,109,307 | | | 57,539,996 | | | 54,222,327 | | | 19,199,601 | | | 1,554,873 | |
Weighted average shares outstanding—diluted | | | 51,044,372 | | | 53,109,307 | | | 57,636,365 | | | 54,295,083 | | | 19,199,601 | | | 1,554,873 | |
Common shares outstanding at end of period | | | 52,654,131 | | | 52,616,991 | | | 57,236,795 | | | 60,403,764 | | | 52,333,334 | | | 1,557,568 | |
- (1)
- Noninterest expense in 2008 and 2007 includes a goodwill impairment charge of $250,748,000 and $142,210,000, respectively.
34
Table of Contents
| | | | | | | | | | | | | | | | |
| | Year Ended December 31, | | At December 31,
2004 or for the
period from
July 17, 2004
to December 31, | |
|---|
| | 2008 | | 2007 | | 2006 | | 2005 | | 2004 | |
|---|
| | (In thousands, except per share and percentage data)
| |
|---|
Consolidated Balance Sheet Data: | | | | | | | | | | | | | | | | |
Cash and cash equivalents | | $ | 45,711 | | $ | 52,356 | | $ | 49,620 | | $ | 98,942 | | $ | 90,927 | |
Investments and other securities | | | 144,264 | | | 166,317 | | | 200,322 | | | 175,753 | | | 145,502 | |
Net loans (including loans held for sale) | | | 1,787,105 | | | 1,756,428 | | | 1,919,588 | | | 2,046,938 | | | 1,624,100 | |
Total assets | | | 2,102,741 | | | 2,371,664 | | | 2,720,600 | | | 2,980,757 | | | 2,399,201 | |
Deposits | | | 1,698,651 | | | 1,799,507 | | | 1,960,105 | | | 2,048,352 | | | 1,678,499 | |
Debt | | | 229,424 | | | 128,571 | | | 134,340 | | | 215,872 | | | 109,341 | |
Stockholders' equity | | | 161,580 | | | 418,654 | | | 589,459 | | | 598,748 | | | 515,414 | |
Selected Other Balance Sheet Data: | | | | | | | | | | | | | | | | |
Average assets | | | 2,295,108 | | | 2,611,973 | | | 2,850,533 | | | 2,558,794 | | | 752,303 | |
Average earning assets | | | 1,966,668 | | | 2,073,569 | | | 2,172,141 | | | 1,956,050 | | | 657,485 | |
Average stockholders' equity | | | 356,646 | | | 551,532 | | | 597,491 | | | 542,684 | | | 119,776 | |
Selected Financial Ratios: | | | | | | | | | | | | | | | | |
Return on average assets(a) | | | (11.19 | )% | | (5.29 | )% | | 0.86 | % | | 0.57 | % | | 0.36 | %(b) |
Return on average stockholders' equity(c) | | | (71.99 | )% | | (25.04 | )% | | 4.09 | % | | 2.71 | % | | 2.26 | %(d) |
Net interest margin(e) | | | 4.05 | % | | 4.93 | % | | 5.35 | % | | 5.51 | % | | 5.06 | %(f) |
Efficiency ratio(g) | | | 68.17 | % | | 67.01 | % | | 61.35 | % | | 67.56 | % | | 64.12 | % |
Selected Asset Quality Ratios: | | | | | | | | | | | | | | | | |
Nonperforming assets to total assets | | | 2.63 | % | | 0.98 | % | | 1.25 | % | | 1.05 | % | | 0.84 | % |
Nonperforming loans to total loans | | | 3.00 | % | | 1.11 | % | | 1.69 | % | | 1.44 | % | | 0.88 | % |
Allowance for loan losses to total loans | | | 2.46 | % | | 1.44 | % | | 1.43 | % | | 1.33 | % | | 1.52 | % |
Allowance for loan losses to nonperforming loans | | | 82.06 | % | | 129.62 | % | | 84.91 | % | | 92.39 | % | | 173.78 | % |
Net charge-offs to average loans | | | 0.81 | % | | 1.44 | % | | 0.21 | % | | 0.23 | % | | 1.15 | %(h) |
- (a)
- Return on average assets is determined by dividing net income (loss) by average assets.
- (b)
- Represents net income for the period July 17, 2004 to December 31, 2004 divided by average assets for the same period.
- (c)
- Return on average stockholders' equity is determined by dividing net income (loss) by average stockholders' equity.
- (d)
- Represents net income for the period July 17, 2004 to December 31, 2004 divided by average stockholders' equity for the same period.
- (e)
- Net interest margin is determined by dividing net interest income (fully taxable equivalent) by average interest-earning assets.
- (f)
- Represents net income for the period July 17, 2004 to December 31, 2004 divided by average interest earning assets for the same period.
- (g)
- Efficiency ratio is determined by dividing total noninterest expense, less goodwill impairment and intangible amortization expense, by an amount equal to net interest income plus noninterest income.
- (h)
- Represents net charge-offs for the period July 17, 2004 to December 31, 2004 divided by average loans for the same period.
35
Table of Contents
ITEM 7. MANAGEMENT'S DISCUSSION AND ANALYSIS OF FINANCIAL CONDITION AND RESULTS OF OPERATIONS
This section should be read in conjunction with the disclosure regarding "Forward-Looking Statements and Factors that Could Affect Future Results" set forth in the beginning of Part I of this report, as well as the discussion set forth in "Item 1A. Risk Factors" and "Item 8. Financial Statements and Supplementary Data."
We are a bank holding company providing banking and other financial services throughout our targeted Colorado markets to consumers and to small- and medium-sized businesses, including the owners and employees of those businesses. We offer an array of banking products and services to the communities we serve, including accepting time and demand deposits and originating commercial loans (including energy loans), real estate loans, Small Business Administration guaranteed loans and consumer loans. We derive our income primarily from interest received on real estate related loans, commercial loans and leases and consumer loans and, to a lesser extent, interest on investment securities, fees received in connection with servicing loan and deposit accounts and fees from trust services. Our major operating expenses are the interest we pay on deposits and borrowings and general operating expenses. We rely primarily on locally generated deposits to provide us with funds for making loans.
We are subject to competition from other financial institutions and our operating results, like those of other financial institutions operating exclusively or primarily in Colorado, are significantly influenced by economic conditions in Colorado, including the strength of the real estate market. In addition, both the fiscal and regulatory policies of the federal government and regulatory authorities that govern financial institutions and market interest rates also impact our financial condition, results of operations and cash flows.
As detailed in Item 1—Business, Centennial Bank Holdings, Inc. became Guaranty Bancorp effective May 12, 2008. Guaranty Bancorp has a single bank subsidiary, Guaranty Bank and Trust Company. This structure is a result of a combination of four separate acquisitions and two divestitures as follows:
| | | | | | |
Acquisitions
Entity | | Date of Completion |
|---|
| Centennial Bank Holdings, Inc. (Predecessor) | | July 16, 2004 |
|
|
— |
|
Centennial Bank of the West (merged into Guaranty Bank on January 1, 2008) |
|
|
Guaranty Corporation |
|
December 31, 2004 |
|
|
— |
|
Guaranty Bank and Trust Company |
|
|
|
|
— |
|
First National Bank of Strasburg (merged into Guaranty Bank on April 14, 2005) |
|
|
|
|
— |
|
Collegiate Peaks Bank (divested on November 1, 2006) |
|
|
36
Table of Contents
| | | | | | |
Acquisitions
Entity | | Date of Completion |
|---|
| First MainStreet Financial, Ltd. | | October 1, 2005 |
|
|
— |
|
First MainStreet Bank, N.A. (merged into Centennial Bank of the West) |
|
|
|
|
— |
|
First MainStreet Insurance, Ltd. (divested on March 1, 2006) |
|
|
Foothills Bank (merged into Guaranty Bank) |
|
November 1, 2005 |
Divestitures |
|
|
Entity | | |
| First MainStreet Insurance, Ltd. (asset sale) | | March 1, 2006 |
Collegiate Peaks Bank |
|
November 1, 2006 |
Application of Critical Accounting Policies and Accounting Estimates
Our accounting policies are integral to understanding the financial results reported. Our most complex accounting policies require management's judgment to ascertain the valuation of assets, liabilities, commitments and contingencies. We have established detailed policies and control procedures that are intended to ensure valuation methods are well controlled and consistently applied from period to period. In addition, the policies and procedures are intended to ensure that the process for changing methodologies occurs in an appropriate manner. The following is a brief description of our current accounting policies that we believe are critical or involve significant management judgment.
Allowance for Loan Losses
The loan portfolio is the largest category of assets on our balance sheet. We determine probable incurred losses inherent in our loan portfolio and establish an allowance for those losses by considering factors including historical loss rates, expected cash flows and estimated collateral values. In assessing these factors, we use organizational history and experience with credit decisions and related outcomes. The allowance for loan losses represents our best estimate of losses inherent in the existing loan portfolio. The allowance for loan losses is increased by the provision for loan losses charged to expense and reduced by loans charged off, net of recoveries. We evaluate our allowance for loan losses quarterly. If our underlying assumptions later prove to be inaccurate based on subsequent loss evaluations, the allowance for loan losses is adjusted.
We estimate the appropriate level of allowance for loan losses by separately evaluating impaired and nonimpaired loans. A specific allowance is assigned to an impaired loan when expected cash flows or collateral do not justify the carrying amount of the loan. The methodology used to assign an allowance to a nonimpaired loan is more subjective. Generally, the allowance assigned to nonimpaired loans is determined by applying historical loss rates to existing loans with similar risk characteristics, adjusted for qualitative factors including the volume and severity of identified classified loans, changes in economic conditions, changes in credit policies or underwriting standards, and changes in the level of credit risk associated with specific industries and markets. Because the economic and business climate in any given industry or market, and its impact on any given borrower, can change rapidly, the risk profile of the loan portfolio is continually assessed and adjusted when appropriate. Notwithstanding these procedures, there still exists the possibility that our assessment could prove to be significantly incorrect and that an immediate adjustment to the allowance for loan losses would be required.
We estimate the appropriate level of loan loss allowance by conducting a detailed review of a number of smaller portfolio segments that comprise our loan portfolios. We segment the loan portfolio
37
Table of Contents
into as many components as practical. Each component would normally have similar characteristics, such as risk classification, past due status, type of loan, industry or collateral. The risk profile of certain segments of the loan portfolio may be improving, while the risk profile of others may be deteriorating. As a result, changes in the appropriate level of the allowance for different segments may offset one another. Adjustments to the allowance represent the aggregate impact from the analysis of all loan segments.
Other Real Estate Owned and Foreclosed Assets
Other real estate owned or other foreclosed assets acquired through loan foreclosure are initially recorded at fair value less costs to sell when acquired, establishing a new cost basis. The adjustment at the time of foreclosure is recorded through the allowance for loan losses. Due to the subjective nature of establishing the fair value when the asset is acquired, the actual fair value of the other real estate owned or foreclosed asset could differ from the original estimate. If it is determined that fair value declines subsequent to foreclosure, a valuation allowance is recorded through noninterest expense. Operating costs associated with the assets after acquisition are also recorded as noninterest expense. Gains and losses on the disposition of other real estate owned and foreclosed assets are netted and posted to other noninterest income.
Investment in Debt and Equity Securities
We classify our investments in debt and equity securities as either held-to-maturity or available-for-sale in accordance with Statement of Financial Accounting Standards No. 115,Accounting for Certain Investments in Debt and Equity Securities. Securities classified as held-to-maturity are recorded at cost or amortized cost. Available-for-sale securities are carried at fair value. Fair value calculations are based on quoted market prices when such prices are available. If quoted market prices are not available, estimates of fair value are computed using a variety of techniques, including extrapolation from the quoted prices of similar instruments or recent trades for thinly traded securities, fundamental analysis, or through obtaining purchase quotes. Due to the subjective nature of the valuation process, it is possible that the actual fair values of these investments could differ from the estimated amounts, thereby affecting our financial position, results of operations and cash flows. If the estimated value of investments is less than the cost or amortized cost, we evaluate whether an event or change in circumstances has occurred that may have a significant adverse effect on the fair value of the investment. If such an event or change has occurred and we determine that the impairment is other-than-temporary, we expense the impairment of the investment in the period in which the event or change occurred.
Deferred Income Tax Assets/Liabilities
Our net deferred income tax asset arises from differences in the dates that items of income and expense enter into our reported income and taxable income. Deferred tax assets and liabilities are established for these items as they arise. From an accounting standpoint, deferred tax assets are reviewed to determine if they are realizable based on the historical level of our taxable income, estimates of our future taxable income and the reversals of deferred tax liabilities. In most cases, the realization of the deferred tax asset is based on our future profitability. If we were to experience net operating losses for tax purposes in a future period, the realization of our deferred tax assets would be evaluated for a potential valuation reserve. Although we had a loss for financial reporting purposes in 2007 and 2008, for income tax purposes the Company reported taxable income and paid federal and state income tax.
Additionally, the Company reviews its uncertain tax positions annually under FASB Interpretation 48,Accounting for Uncertainty in Income Taxes. An uncertain tax position is recognized as a benefit only if it is "more likely than not" that the tax position would be sustained in a tax examination, with a tax examination being presumed to occur. The amount actually recognized is the largest amount of tax
38
Table of Contents
benefit that is greater than 50% likely to be recognized on examination. For tax positions not meeting the "more likely than not" test, no tax benefit is recorded. A significant amount of judgment is applied to determine both whether the tax position meets the "more likely than not" test as well as to determine the largest amount of tax benefit that is greater than 50% likely to be recognized. Differences between the position taken by management and that of taxing authorities could result in a reduction of a tax benefit or increase to tax liability, which could adversely affect future income tax expense.
Impairment of Goodwill and Intangible Assets
Core deposit and customer relationships, which are intangible assets with a finite life, are recorded on our balance sheets. These intangible assets were capitalized as a result of past acquisitions and are being amortized over their estimated useful lives of up to 15 years. Core deposit intangible assets, with finite lives will be tested for impairment when changes in events or circumstances indicate that its carrying amount may not be recoverable. Core deposits were tested for impairment during 2008 and 2007, as part of the goodwill impairment test and no impairment was deemed necessary.
As a result of our acquisition activity, goodwill, an intangible asset with an indefinite life, was reflected on our balance sheet in prior periods. Goodwill was evaluated for impairment annually, unless there were factors present that indicated a potential impairment, in which case, the goodwill impairment test was performed more frequently than annually.
This discussion has highlighted those accounting policies that we consider to be critical to our financial reporting process. However, all the accounting policies are important, and therefore you are encouraged to review each of the policies included in Note 2 to "Notes to Consolidated Financial Statements" in Item 8, "Financial Statements and Supplementary Data", to gain a better understanding of how our financial performance is measured and reported.
39
Table of Contents
RESULTS OF OPERATIONS
The following table presents certain key aspects of our performance. The comparability of these financial measures is impacted by the 2006 divestiture of Collegiate Peaks Bank.
Table 1
| | | | | | | | | | | | | | | | | |
| | Year Ended December 31, | | Change - Increase
(Decrease) | |
|---|
| | 2008 | | 2007 | | 2006 | | 2008 v 2007 | | 2007 v 2006 | |
|---|
| | (In thousands, except share data and ratios)
| |
|---|
Results of Operations: | | | | | | | | | | | | | | | | |
Interest income | | $ | 121,312 | | $ | 163,689 | | $ | 173,781 | | $ | (42,377 | ) | $ | (10,092 | ) |
Interest expense | | | 41,750 | | | 61,440 | | | 57,584 | | | 19,690 | | | (3,856 | ) |
| | | | | | | | | | | | |
| | Net interest income | | | 79,562 | | | 102,249 | | | 116,197 | | | (22,687 | ) | | (13,948 | ) |
Provision for loan losses | | | 33,775 | | | 24,666 | | | 4,290 | | | (9,109 | ) | | (20,376 | ) |
| | | | | | | | | | | | |
Net interest income after provision for loan losses | | | 45,787 | | | 77,583 | | | 111,907 | | | (31,796 | ) | | (34,324 | ) |
Noninterest income | | | 10,620 | | | 10,696 | | | 12,717 | | | (76 | ) | | (2,021 | ) |
Noninterest expense | | | 319,656 | | | 226,556 | | | 90,908 | | | (93,100 | ) | | (135,648 | ) |
| | | | | | | | | | | | |
Income (loss) before income taxes | | | (263,249 | ) | | (138,277 | ) | | 33,716 | | | (124,972 | ) | | (171,993 | ) |
Income tax expense | | | (6,513 | ) | | (185 | ) | | 11,286 | | | 6,328 | | | 11,471 | |
| | | | | | | | | | | | |
Income (loss) from continuing operations | | | (256,736 | ) | | (138,092 | ) | | 22,430 | | | (118,644 | ) | | (160,522 | ) |
Income from discontinued operations, net of tax | | | — | | | — | | | 1,988 | | | — | | | (1,988 | ) |
| | | | | | | | | | | | |
Net income (loss) | | $ | (256,736 | ) | $ | (138,092 | ) | $ | 24,418 | | $ | (118,644 | ) | $ | (162,510 | ) |
| | | | | | | | | | | | |
Share Data: | | | | | | | | | | | | | | | | |
Basic earnings (loss) per share | | $ | (5.03 | ) | $ | (2.60 | ) | $ | 0.42 | | $ | (2.43 | ) | $ | (3.02 | ) |
Diluted earnings (loss) per share | | $ | (5.03 | ) | $ | (2.60 | ) | $ | 0.42 | | $ | (2.43 | ) | $ | (3.02 | ) |
Average shares outstanding | | | 51,044,372 | | | 53,109,307 | | | 57,539,996 | | | (2,064,935 | ) | | (4,430,689 | ) |
Diluted average shares outstanding | | | 51,044,372 | | | 53,109,307 | | | 57,636,355 | | | (2,064,935 | ) | | (4,527,048 | ) |
Selected Ratios: | | | | | | | | | | | | | | | | |
Total risk based capital | | | 10.61 | % | | 10.87 | % | | 11.17 | % | | (0.26 | )% | | (0.30 | )% |
Nonperforming assets to total assets | | | 2.63 | % | | 0.98 | % | | 1.25 | % | | 1.65 | % | | (0.27 | )% |
Allowance for loan losses to nonperforming loans | | | 82.06 | % | | 129.62 | % | | 84.91 | % | | (47.56 | )% | | 44.71 | % |
Allowance for loan losses to loans, net of unearned discount | | | 2.46 | % | | 1.44 | % | | 1.43 | % | | 1.02 | % | | 0.01 | % |
2008 Compared to 2007
There was a net loss of $256.7 million for the year ended December 31, 2008 compared to a net loss of $138.1 million for the same period in 2007. Both years were affected by goodwill impairment charges of $250.7 million and $142.2 million in 2008 and 2007, respectively. Other changes in net income were a $22.7 million decrease in net interest income, primarily as a result of the Company being asset sensitive and interest rates being significantly lower in 2008 as compared to 2007. The increase in provision for loan losses of $9.1 million was primarily due to the increase in non-performing loans and the deterioration of the economic conditions during 2008 as compared to 2007. This is highlighted by a 102 basis point increase in our allowance for loan losses to loans, net to 2.46% at December 31, 2008 as compared to 1.44% at December 31, 2007. Without the goodwill impairment charges in both years, noninterest expense was $68.9 million and $84.3 million in 2008 and 2007, respectively. The decrease in noninterest expense, excluding goodwill impairment charges, is primarily a result of an $8.1 million decrease in salaries and employee benefits, as well as a $6.5 million decrease in other general and administrative expenses, as discussed below under noninterest expense.
40
Table of Contents
Our goodwill and other intangible asset balances caused a proportional reduction in our return on average assets and return on average equity when compared to entities with minimal intangible asset balances.
Goodwill and other intangible assets have always been excluded from regulatory capital, and therefore had no impact on total risk based capital year over year. The ending total risk capital ratio decreased by 26 basis points to 10.61% at December 31, 2008 as compared to 10.87% at December 31, 2007. This decrease is a result of the significant provision for loan losses taken in 2008, as well as a $44.7 million increase in loans, net of unearned discount during 2008.
2007 Compared to 2006
The Company had a net loss of $138.1 million for the year ended December 31, 2007 compared to net income of $24.4 million for the year ended December 31, 2006. The primary reasons for the decrease in net income year-over-year were due to a $142.2 million goodwill impairment charge, as well as a $20.4 million increase to the provision for loan losses. Additionally, there was a $6.5 million charge recorded in 2007 for the settlement of a lawsuit, as discussed under noninterest expense below.
Net Interest Income and Net Interest Margin
Net interest income is our primary source of income and represents the difference between income on interest-earning assets and expense on interest-bearing liabilities.
The following table summarizes the Company's net interest income and related spread and margin for the periods indicated:
Table 2
| | | | | | | | | | |
| | Year Ended December 31, | |
|---|
| | 2008 | | 2007 | | 2006 | |
|---|
| | (Dollars in thousands)
| |
|---|
Net interest income | | $ | 79,562 | | $ | 102,249 | | $ | 116,197 | |
Interest rate spread | | | 3.35 | % | | 3.94 | % | | 4.48 | % |
Net interest margin | | | 4.05 | % | | 4.93 | % | | 5.35 | % |
41
Table of Contents
The following table presents, for the years indicated, average assets, liabilities and stockholders' equity, as well as the net interest income from average interest-earning assets and the resultant yields expressed in percentages. Non-accrual loans are included in the calculation of average loans and leases while non-accrued interest thereon, is excluded from the computation of yields earned.
Table 3
| | | | | | | | | | | | | | | | | | | | | |
| | Year Ended December 31, | |
|---|
| | 2008 | | 2007 | |
|---|
| | Average
Balance | | Interest
Income or
Expense | | Average
Yield or
Cost | | Average
Balance | | Interest
Income or
Expense | | Average
Yield or
Cost | |
|---|
| | (Dollars in thousands)
| |
|---|
ASSETS: | | | | | | | | | | | | | | | | | | | |
Interest-earning assets: | | | | | | | | | | | | | | | | | | | |
| | Gross loans, net of unearned fees(1)(2)(3) | | $ | 1,797,357 | | $ | 112,844 | | | 6.28 | % | $ | 1,871,703 | | $ | 153,214 | | | 8.19 | % |
| | Investment securities(1) | | | | | | | | | | | | | | | | | | | |
| | | Taxable | | | 53,215 | | | 2,991 | | | 5.62 | % | | 52,166 | | | 2,515 | | | 4.82 | % |
| | | Tax-exempt | | | 69,830 | | | 3,404 | | | 4.88 | % | | 104,592 | | | 5,193 | | | 4.97 | % |
| | Bank Stocks(4) | | | 31,503 | | | 1,647 | | | 5.23 | % | | 32,091 | | | 1,853 | | | 5.78 | % |
| | Other earning assets | | | 14,763 | | | 426 | | | 2.89 | % | | 13,017 | | | 914 | | | 7.02 | % |
| | | | | | | | | | | | | | |
| | Total interest-earning assets | | | 1,966,668 | | | 121,312 | | | 6.17 | % | | 2,073,569 | | | 163,689 | | | 7.89 | % |
Non-earning assets: | | | | | | | | | | | | | | | | | | | |
| | Cash and due from banks | | | 36,846 | | | | | | | | | 48,283 | | | | | | | |
| | Other assets | | | 291,594 | | | | | | | | | 490,121 | | | | | | | |
| | | | | | | | | | | | | | | | | | |
Total assets | | $ | 2,295,108 | | | | | | | | $ | 2,611,973 | | | | | | | |
| | | | | | | | | | | | | | | | | | |
LIABILITIES AND STOCKHOLDERS' EQUITY: | | | | | | | | | | | | | | | | | | | |
Interest-bearing liabilities: | | | | | | | | | | | | | | | | | | | |
| | Deposits: | | | | | | | | | | | | | | | | | | | |
| | | Interest-bearing demand | | $ | 150,210 | | $ | 763 | | | 0.51 | % | $ | 157,806 | | $ | 1,009 | | | 0.64 | % |
| | | Money market | | | 507,610 | | | 9,968 | | | 1.96 | % | | 638,295 | | | 23,583 | | | 3.69 | % |
| | | Savings | | | 70,243 | | | 397 | | | 0.56 | % | | 77,602 | | | 602 | | | 0.78 | % |
| | | Time certificates of deposit | | | 514,362 | | | 21,434 | | | 4.17 | % | | 562,075 | | | 28,400 | | | 5.05 | % |
| | | | | | | | | | | | | | |
| | | Total interest-bearing deposits | | | 1,242,425 | | | 32,562 | | | 2.62 | % | | 1,435,778 | | | 53,594 | | | 3.73 | % |
| | Borrowings: | | | | | | | | | | | | | | | | | | | |
| | | Repurchase agreements | | | 18,698 | | | 390 | | | 2.09 | % | | 29,104 | | | 1,346 | | | 4.62 | % |
| | | Federal funds purchased | | | 6,181 | | | 137 | | | 2.21 | % | | 741 | | | 44 | | | 5.93 | % |
| | | Subordinated debentures | | | 41,239 | | | 3,328 | | | 8.07 | % | | 41,239 | | | 3,756 | | | 9.11 | % |
| | | Borrowings | | | 170,038 | | | 5,333 | | | 3.14 | % | | 47,895 | | | 2,700 | | | 5.64 | % |
| | | | | | | | | | | | | | |
| | | Total interest-bearing liabilities | | | 1,478,581 | | | 41,750 | | | 2.82 | % | | 1,554,757 | | | 61,440 | | | 3.95 | % |
Noninterest bearing liabilities: | | | | | | | | | | | | | | | | | | | |
| | Demand deposits | | | 440,359 | | | | | | | | | 476,876 | | | | | | | |
| | Other liabilities | | | 19,522 | | | | | | | | | 28,808 | | | | | | | |
| | | | | | | | | | | | | | | | | | |
| | Total liabilities | | | 1,938,462 | | | | | | | | | 2,060,441 | | | | | | | |
Stockholders' Equity | | | 356,646 | | | | | | | | | 551,532 | | | | | | | |
| | | | | | | | | | | | | | | | | | |
Total liabilities and stockholders' equity | | $ | 2,295,108 | | | | | | | | $ | 2,611,973 | | | | | | | |
| | | | | | | | | | | | | | | | | | |
Net interest income | | | | | $ | 79,562 | | | | | | | | $ | 102,249 | | | | |
| | | | | | | | | | | | | | | | | | |
Net interest margin | | | | | | | | | 4.05 | % | | | | | | | | 4.93 | % |
| | | | | | | | | | | | | | | | | | |
- (1)
- Yields on loans and securities have not been adjusted to a tax-equivalent basis. Net interest margin on a fully tax-equivalent basis would have been 4.14% and 5.08% for the year ended December 31, 2008 and December 31, 2007, respectively.
- (2)
- The loan average balances include nonaccrual loans.
42
Table of Contents
- (3)
- Net loan fees of $3.4 million and $5.2 million for the year ended December 31, 2008 and 2007 are included in the yield computation.
- (4)
- Includes Bankers' Bank of the West stock, Federal Agricultural Mortgage Corporation (Farmer Mac) stock, Federal Reserve Bank stock and Federal Home Loan Bank stock.
The following table presents the dollar amount of changes in interest income and interest expense for the major categories of our interest-earning assets and interest-bearing liabilities. Information is provided for each category of interest-earning assets and interest-bearing liabilities with respect to (i) changes attributable to changes in volume (i.e., changes in average balances multiplied by the prior-period average rate) and (ii) changes attributable to rate (i.e., changes in average rate multiplied by prior-period average balances). For purposes of this table, changes attributable to both rate and volume, which cannot be segregated, have been allocated proportionately to the change due to volume and the change due to rate.
Table 4
| | | | | | | | | | | | |
| | Year Ended December 31, 2008
Compared to
Year Ended December 31, 2007 | |
|---|
| | Net Change | | Rate | | Volume | |
|---|
| | (In thousands)
| |
|---|
Interest income: | | | | | | | | | | |
| | Gross Loans, net of unearned fees | | $ | (40,370 | ) | $ | (34,491 | ) | $ | (5,879 | ) |
| | Investment Securities | | | | | | | | | | |
| | | Taxable | | | 476 | | | 424 | | | 52 | |
| | | Tax-exempt | | | (1,789 | ) | | (93 | ) | | (1,696 | ) |
| | Bank Stocks | | | (206 | ) | | (173 | ) | | (33 | ) |
| | Other earning assets | | | (488 | ) | | (632 | ) | | 144 | |
| | | | | | | | |
| | Total interest income | | | (42,377 | ) | | (34,965 | ) | | (7,412 | ) |
Interest expense: | | | | | | | | | | |
| | Deposits: | | | | | | | | | | |
| | | Interest-bearing demand | | | (246 | ) | | (199 | ) | | (47 | ) |
| | | Money market | | | (13,615 | ) | | (9,475 | ) | | (4,140 | ) |
| | | Savings | | | (205 | ) | | (152 | ) | | (53 | ) |
| | | Time certificates of deposit | | | (6,966 | ) | | (4,693 | ) | | (2,273 | ) |
| | Repurchase agreements | | | (956 | ) | | (579 | ) | | (377 | ) |
| | Federal funds purchased | | | 93 | | | (9 | ) | | 102 | |
| | Subordinated debentures | | | (428 | ) | | (428 | ) | | 0 | |
| | Borrowings | | | 2,633 | | | (555 | ) | | 3,188 | |
| | | | | | | | |
| | Total interest expense | | | (19,690 | ) | | (16,090 | ) | | (3,600 | ) |
| | | | | | | | |
Net interest income | | $ | (22,687 | ) | $ | (18,875 | ) | $ | (3,812 | ) |
| | | | | | | | |
2008 Compared to 2007
Net interest income decreased by $22.7 million, or 22.2%, for 2008 as compared to 2007. This decrease is attributable to an $18.9 million unfavorable rate variance and a $3.8 million unfavorable volume variance as illustrated in Table 4 above.
The $18.9 million unfavorable rate variance is due mostly to a reduction in the yield on interest-earning assets during 2008. The yield on interest-earning assets fell from 7.89% to 6.17% year-over-year, a decrease of 172 basis points. This decrease lowered interest income by $35.0 million from 2007 to 2008. This decrease is primarily a result of 65% of our loan portfolio being variable rate loans tied to an index
43
Table of Contents
such as prime, federal funds or LIBOR. During 2008, the prime rate fell from 7.25% at December 31, 2007 to 3.25% at December 31, 2008, a decrease of 400 basis points. In 2007, the prime rate was 8.25% for almost three-fourths of the year before three decreases totaling 100 basis points reduced it from 8.25% to 7.25% in the last three and half-months of 2007. For 2008, the rate decreases started early with a 125 basis point decrease in January 2008 alone. The federal funds rate has a direct impact on overall rates in the economy, and in particular on the prime rate. Decreases in prime rate are generally identical in the amount of basis points as changes to the target federal funds rate by the Federal Open Markets Committee of the Federal Reserve Board (FOMC). The prime rate fell by 400 basis points in 2008, whereas the targeted federal funds rate fell by 400 to 425 basis points, as the last decrease in rates by the FOMC took the targeted federal rates to a point between 0 and 25 basis points. Although 65% of the Company's loans are variable rate loans, approximately $823.1 million of the Company's loans, including approximately $535 million of variable rate loans, are subject to renewal during 2009. Most of the variable rate loans are expected to be renewed with new terms including a floor above the current rate. Therefore, it is expected that net interest income will increase during 2009 even if there are no increases to the targeted federal funds rate by the FOMC.
Partially offsetting the $42.3 million decrease in interest income was a reduction in the interest paid on deposits and other borrowings of $19.7 million. The cost of funds decreased from 3.95% in 2007 to 2.82% in 2008. The cost of funds decreased by 113 basis points, as compared to the 172 basis point decrease in the yield on earning assets. Although interest rates on interest-bearing demand, savings and money market accounts can be changed at any time, the interest rate on time deposits and long-term borrowings cannot be changed until the time deposit or borrowing matures. Further, competition for deposits kept rates on deposits from decreasing at the same pace as the declines in yield on earning assets. During 2009, approximately $564 million of time deposits will mature. These time deposits have an existing weighted-average rate of 4.25%, which are expected to be renewed at current market rates on the renewal date. As current market rates on time deposits are significantly below 4.25%, it is expected that the cost of funds related to time deposits will decline in 2009 if there are no increases to the targeted federal funds rate by the FOMC.
The $3.8 million unfavorable volume variance is due mostly to a $74.3 million decrease in the average balances of gross loans, net of unearned discount and a $34.8 million decrease in average tax-exempt bonds in 2008 as compared to 2007. Although average loans decreased during 2008, the actual ending balance of loans increased by $44.7 million at December 31, 2008 as compared to December 31, 2007. All other average interest-earning assets increased by $2.2 million year-over-year as average interest-earning assets decreased by $106.9 million in 2008 as compared to 2007. The 2008 decrease in average loans is mostly attributable to an $87.9 million year-over-year decrease in average construction loans and a $10.6 million year-over-year decrease in average real estate mortgage loans, partially offset by a year-over-year increase in average commercial loans.
The following table presents for the years indicated, average assets, liabilities and stockholders' equity, as well as the net interest income from average interest-earning assets and the resultant yields
44
Table of Contents
expressed in percentages. Non-accrual loans are included in the calculation of average loans and leases while non-accrued interest thereon is excluded from the computation of yields earned.
Table 5
| | | | | | | | | | | | | | | | | | | | | |
| | Year Ended December 31, | |
|---|
| | 2007 | | 2006 | |
|---|
| | Average
Balance | | Interest
Income or
Expense | | Average
Yield or
Cost | | Average
Balance | | Interest
Income or
Expense | | Average
Yield or
Cost | |
|---|
| | (Dollars in thousands)
| |
|---|
ASSETS: | | | | | | | | | | | | | | | | | | | |
Interest-earning assets: | | | | | | | | | | | | | | | | | | | |
| | Gross loans, net of unearned fees(1)(2)(3) | | $ | 1,871,703 | | $ | 153,214 | | | 8.19 | % | $ | 1,978,003 | | $ | 163,830 | | | 8.28 | % |
| | Investment securities(1) | | | | | | | | | | | | | | | | | | | |
| | | Taxable | | | 52,166 | | | 2,515 | | | 4.82 | % | | 64,628 | | | 2,868 | | | 4.44 | % |
| | | Tax-exempt | | | 104,592 | | | 5,193 | | | 4.97 | % | | 93,683 | | | 4,869 | | | 5.20 | % |
| | Bank stocks(4) | | | 32,091 | | | 1,853 | | | 5.78 | % | | 30,331 | | | 1,805 | | | 5.95 | % |
| | Other earning assets | | | 13,017 | | | 914 | | | 7.02 | % | | 5,496 | | | 409 | | | 7.44 | % |
| | | | | | | | | | | | | | |
| | Total interest-earning assets | | | 2,073,569 | | | 163,689 | | | 7.89 | % | | 2,172,141 | | | 173,781 | | | 8.00 | % |
Non-earning assets: | | | | | | | | | | | | | | | | | | | |
| | Cash and due from banks | | | 48,283 | | | | | | | | | 71,562 | | | | | | | |
| | Other assets | | | 490,121 | | | | | | | | | 606,830 | | | | | | | |
| | | | | | | | | | | | | | | | | | |
Total assets | | $ | 2,611,973 | | | | | | | | $ | 2,850,533 | | | | | | | |
| | | | | | | | | | | | | | | | | | |
LIABILITIES AND STOCKHOLDERS' EQUITY: | | | | | | | | | | | | | | | | | | | |
Interest-bearing liabilities: | | | | | | | | | | | | | | | | | | | |
| | Deposits: | | | | | | | | | | | | | | | | | | | |
| | | Interest-bearing demand | | $ | 157,806 | | $ | 1,009 | | | 0.64 | % | $ | 167,381 | | $ | 968 | | | 0.58 | % |
| | | Money market | | | 638,295 | | | 23,583 | | | 3.69 | % | | 628,341 | | | 21,429 | | | 3.41 | % |
| | | Savings | | | 77,602 | | | 602 | | | 0.78 | % | | 93,622 | | | 700 | | | 0.75 | % |
| | | Time certificates of deposit | | | 562,075 | | | 28,400 | | | 5.05 | % | | 574,320 | | | 24,240 | | | 4.22 | % |
| | | | | | | | | | | | | | |
| | | Total interest-bearing deposits | | | 1,435,778 | | | 53,594 | | | 3.73 | % | | 1,463,664 | | | 47,337 | | | 3.23 | % |
| | Borrowings: | | | | | | | | | | | | | | | | | | | |
| | | Repurchase agreements | | | 29,104 | | | 1,346 | | | 4.62 | % | | 27,927 | | | 1,231 | | | 4.41 | % |
| | | Federal funds purchased | | | 741 | | | 44 | | | 5.93 | % | | 521 | | | 25 | | | 4.80 | % |
| | | Subordinated debentures | | | 41,239 | | | 3,756 | | | 9.11 | % | | 41,243 | | | 3,666 | | | 8.89 | % |
| | | Borrowings | | | 47,895 | | | 2,700 | | | 5.64 | % | | 102,327 | | | 5,325 | | | 5.18 | % |
| | | | | | | | | | | | | | |
| | | Total interest-bearing liabilities | | | 1,554,757 | | | 61,440 | | | 3.95 | % | | 1,635,682 | | | 57,584 | | | 3.52 | % |
Noninterest bearing liabilities: | | | | | | | | | | | | | | | | | | | |
| | Demand deposits | | | 476,876 | | | | | | | | | 519,893 | | | | | | | |
| | Other liabilities | | | 28,808 | | | | | | | | | 97,467 | | | | | | | |
| | | | | | | | | | | | | | | | | | |
| | Total liabilities | | | 2,060,441 | | | | | | | | | 2,253,042 | | | | | | | |
Stockholders' equity | | | 551,532 | | | | | | | | | 597,491 | | | | | | | |
| | | | | | | | | | | | | | | | | | |
Total liabilities and stockholders' equity | | $ | 2,611,973 | | | | | | | | $ | 2,850,533 | | | | | | | |
| | | | | | | | | | | | | | | | | | |
Net interest income | | | | | $ | 102,249 | | | | | | | | $ | 116,197 | | | | |
| | | | | | | | | | | | | | | | | | |
Net interest margin | | | | | | | | | 4.93 | % | | | | | | | | 5.35 | % |
| | | | | | | | | | | | | | | | | | |
- (1)
- Yields on loans and securities have not been adjusted to a tax-equivalent basis. Net interest margin on a fully tax-equivalent basis would have been 5.08% and 5.49% for the twelve months ended December 31, 2007 and December 31, 2006, respectively.
- (2)
- The loan average balances include nonaccrual loans.
- (3)
- Net loan fees of $5.2 million and $6.6 million at December 31, 2007 and 2006, respectively, are included in the yield computation.
45
Table of Contents
- (4)
- Includes Bankers' Bank of the West stock, Federal Agricultural Mortgage Corporation (Farmer Mac) stock, Federal Reserve Bank stock and Federal Home Loan Bank stock.
The following table presents the dollar amount of changes in interest income and interest expense for the major categories of our interest-earning assets and interest-bearing liabilities. Information is provided for each category of interest-earning assets and interest-bearing liabilities with respect to (i) changes attributable to changes in volume (i.e., changes in average balances multiplied by the prior-period average rate) and (ii) changes attributable to rate (i.e., changes in average rate multiplied by prior-period average balances). For purposes of this table, changes attributable to both rate and volume, which cannot be segregated, have been allocated proportionately to the change due to volume and the change due to rate.
Table 6
| | | | | | | | | | | | |
| | Year Ended December 31, 2007
Compared to
Year Ended December 31, 2006 | |
|---|
| | Net Change | | Rate | | Volume | |
|---|
| | (In thousands)
| |
|---|
Interest income: | | | | | | | | | | |
| | Gross loans, net of unearned fees | | $ | (10,616 | ) | $ | (1,896 | ) | $ | (8,720 | ) |
| | Investment securities | | | | | | | | | | |
| | | Taxable | | | (353 | ) | | 287 | | | (640 | ) |
| | | Tax-exempt | | | 324 | | | (202 | ) | | 526 | |
| | Equity securities | | | 48 | | | (50 | ) | | 98 | |
| | Other earning assets | | | 505 | | | (22 | ) | | 527 | |
| | | | | | | | |
| | Total interest income | | | (10,092 | ) | | (1,883 | ) | | (8,209 | ) |
Interest expense: | | | | | | | | | | |
| | Deposits: | | | | | | | | | | |
| | | Interest-bearing demand | | | 41 | | | 89 | | | (48 | ) |
| | | Money market | | | 2,154 | | | 1,810 | | | 344 | |
| | | Savings | | | (98 | ) | | 28 | | | (126 | ) |
| | | Time certificates of deposit | | | 4,160 | | | 4,664 | | | (504 | ) |
| | Repurchase agreements | | | 115 | | | 62 | | | 53 | |
| | Federal funds purchased | | | 19 | | | 7 | | | 12 | |
| | Subordinated debentures | | | 90 | | | 90 | | | — | |
| | Borrowings | | | (2,625 | ) | | 488 | | | (3,113 | ) |
| | | | | | | | |
| | Total interest expense | | | 3,856 | | | 7,238 | | | (3,381 | ) |
| | | | | | | | |
Net interest income | | $ | (13,948 | ) | $ | (9,121 | ) | $ | (4,827 | ) |
| | | | | | | | |
2007 Compared to 2006
Net interest income decreased by $13.9 million, or 12%, for 2007 as compared to 2006. This decrease is attributable to a $9.1 million unfavorable rate variance and a $4.8 million unfavorable volume variance as illustrated in Table 6 above.
The $9.1 million unfavorable rate variance is due mostly to an increase in the cost of funds in 2007 as compared to 2006. The cost of funds increased from 3.52% in 2006 to 3.95% in 2007, primarily due to higher rates paid on certificates of deposits. The rates on certificates of deposits increased to 5.05% in 2007 from 4.22% in 2006 due mostly to increased competition. Despite a 2.1% decline in average balances of certificate of deposits from 2006 to 2007, the interest expense related to these accounts
46
Table of Contents
increased by $4.2 million, or 17.2%. The actual balance of time deposit accounts fell by $97.5 million, or 16.9%, from December 31, 2006 to December 31, 2007.
During the second half of 2007, the FOMC decreased the federal funds rate three separate times by a total of 100 basis points. The overall federal funds rate declined from 5.25% at December 31, 2006 to 4.25% at December 31, 2007. The prime rate declined by 100 basis points to 7.25% at December 31, 2007 as compared to 8.25% at December 31, 2006.
The $4.8 million unfavorable volume variance is due mostly to a $98.6 million, or 4.5%, decline in average interest-earning assets from 2006 to 2007 as highlighted in Table 5 above. This decrease is mostly attributable to a decrease in overall loan balances. Specifically, the actual balance of construction loans declined by $192.2 million, or 45.0%, from 2006 to 2007 as part of a strategy to reduce the overall risk of the loan portfolio. This decline in construction loans was partially offset by increases in commercial real estate loans and commercial loans. In particular, the areas of focus have been on the energy and middle-market loan portfolios, which saw a $123.6 million increase in balances from 2006 to 2007.
Provision for Loan Losses
The provision for loan losses in each year represents a charge against earnings. The provision is the amount required to maintain the allowance for loan losses at a level that, in our judgment, is adequate to absorb probable incurred loan losses in the loan portfolio. The provision for loan losses is based on our reserve methodology and reflects our judgments about the adequacy of the allowance for loan losses. In determining the amount of the provision, we consider certain quantitative and qualitative factors including our historical loan loss experience, the volume and type of lending we conduct, the results of our credit review process, the amounts and severity of classified, criticized and nonperforming assets, regulatory policies, general economic conditions, underlying collateral values and other factors regarding collectability and impairment. The amount of expected loss on our loan portfolio is influenced by the collateral value associated with our loans. Loans with greater collateral value lessen our exposure to loan loss provision.
For further discussion of the methodology and factors impacting management's estimate of the allowance for loan losses, see "Financial Condition—Allowance for Loan Losses" below. For a discussion of impaired loans and associated collateral values, see "Financial Condition—Nonperforming Assets and Other Impaired Loans" below.
2008 Compared to 2007
The provision for loan losses increased by $9.1 million to $33.8 million for the year ended December 31, 2008 as compared to $24.7 million in 2007.
The Company has determined that the provision for loan losses made during 2008 of $33.8 million is necessary to have an allowance for loan losses (2.46% of total loans as of December 31, 2008) at a level necessary for the probable incurred losses inherent in the loan portfolio as of December 31, 2008. Specifically, the increase in impaired loans (impaired loans were $54.8 million at December 31, 2008 as compared to $23.3 million at December 31, 2007) and a corresponding higher specific allocation related to such loans accounted for approximately $21.3 million of provision for loan losses made during the year. Of this $21.3 million, $14.5 million was charged off during 2008. In addition to the $21.3 million, the impact of the level of charge-offs and the current economic climate on our historical loss and economic concerns components of our allowance for loan losses resulted in an additional provision for loan losses of $12.5 million. The provision for loan losses was driven primarily from an increase in nonperforming assets and related charge-offs, primarily due to weakness in the performance of residential construction, land and land development loans. We believe that continued economic weakness will likely result in elevated credit costs.
47
Table of Contents
Our allowance for loan losses compared to loans, net increased to 2.46% at December 31, 2008 compared to 1.44% at December 31, 2007.
2007 Compared to 2006
The provision for loan losses increased by $20.4 million to $24.7 million for the year ended December 31, 2007 as compared to $4.3 million in 2006.
In the second and third quarter of 2007, the Company recorded a provision for loan losses of $20.8 million primarily as a result of a modification of its credit management philosophy during the second quarter 2007 and a sale of nonperforming and classified loans in a bulk sale, rather than continuing to work out each credit individually. Specifically, the Company enhanced its risk rating methodology in 2007 and adopted an accelerated disposition strategy regarding problem credits.
Noninterest Income
The following table presents our major categories of noninterest income:
Table 7
| | | | | | | | | | | | | | | | |
| | Year Ended December 31, | |
| |
| |
|---|
| | 2008 v 2007 | | 2007 v 2006 | |
|---|
| | 2008 | | 2007 | | 2006 | |
|---|
| | (In thousands)
| |
|---|
Customer service and other fees | | $ | 9,682 | | $ | 9,509 | | $ | 10,385 | | $ | 173 | | $ | (876 | ) |
Gain (loss) on sale of securities | | | 138 | | | — | | | (4 | ) | | 138 | | | 4 | |
Gain on sale of loans | | | — | | | — | | | 719 | | | — | | | (719 | ) |
Other income | | | 800 | | | 1,187 | | | 1,617 | | | (387 | ) | | (430 | ) |
| | | | | | | | | | | | |
Total noninterest income | | $ | 10,620 | | $ | 10,696 | | $ | 12,717 | | $ | (76 | ) | $ | (2,021 | ) |
| | | | | | | | | | | | |
2008 Compared to 2007
Overall noninterest income remained relatively flat in 2008 as compared to 2007. Customer service and other fees increased by $0.2 million, or 1.8% in 2008 as compared to 2007, primarily due to an increase in analysis fee income. Analysis fee income is generally offset by an earnings credit rate. As interest rates decline, the earnings credit rate offset also decreases, which in turn increases analysis fees. As most of this increase occurred in the second half of 2008 with the lowering of the earnings credit rate, it is expected that this trend will continue in 2009 unless overall interest rates increase or if we have to increase our earnings credit rate due to competition.
Other income decreased by $0.4 million in 2008 as compared to 2007. Included in other income is net income on assets held by the Company for purposes of funding its nonqualified deferred compensation plan. These assets are required to be marked-to-market through the income statement. As income from these assets is used to offset the cost of our deferred compensation plan, they are invested in similar assets that are used to determine the value of the accounts of our deferred compensation plan participants. The value of these assets declined in 2008, which caused a decrease in other noninterest income. However, there was an offsetting reduction in compensation expense, which is recorded as a part of salaries and employee benefit expense, as discussed below under noninterest expense.
48
Table of Contents
2007 Compared to 2006
Overall noninterest income declined by $2.0 million, or 15.9%, in 2007 as compared to 2006. This decline was due in part to a $0.7 million decline in the gain on sale of loans as a result of the discontinuation of the Company's residential mortgage group at the end of the third quarter of 2006, as well as a $0.9 million decline in customer service and other fees. Customer service and other fees declined mostly due to a $0.5 million decrease in loan placement fees as a result of the discontinuation of the Company's residential mortgage group in 2006, as well as a $0.5 million decline in analysis charges as a result of greater earnings credits on compensating balances. Earnings credits on compensating balances are used by corporate deposit account customers to offset banking fees. As interest rates increase, the amount of service charge income generally declines.
Other income also decreased by $0.4 million, or 26.6%, from 2006 to 2007. Included in other income are net gains and losses on the sale of other real estate. There was a $0.4 million decrease in the gain on sale of other real estate and foreclosed assets from 2006 to 2007.
Noninterest Expense
The following table presents the major categories of noninterest expense:
Table 8
| | | | | | | | | | | | | | | | |
| | Year Ended December 31, | |
| |
| |
|---|
| | 2008 | | 2007 | | 2006 | | 2008 v 2007 | | 2007 v 2006 | |
|---|
| | (In thousands)
| |
|---|
Salaries and employee benefits | | $ | 31,086 | | $ | 39,179 | | $ | 46,185 | | $ | (8,093 | ) | $ | (7,006 | ) |
Occupancy expense | | | 7,815 | | | 7,813 | | | 7,977 | | | 2 | | | (164 | ) |
Furniture and equipment | | | 5,290 | | | 4,864 | | | 4,859 | | | 426 | | | 5 | |
Impairment of goodwill | | | 250,748 | | | 142,210 | | | — | | | 108,538 | | | 142,210 | |
Amortization | | | 7,433 | | | 8,666 | | | 11,815 | | | (1,232 | ) | | (3,150 | ) |
Other general and administrative | | | 17,284 | | | 23,824 | | | 20,072 | | | (6,541 | ) | | 3,753 | |
| | | | | | | | | | | | |
Total noninterest expense | | $ | 319,656 | | $ | 226,556 | | $ | 90,908 | | $ | 93,100 | | $ | 135,648 | |
| | | | | | | | | | | | |
2008 Compared to 2007
Overall noninterest expense increased by $93.1 million in 2008 as compared to 2007. This increase was mostly due to a $250.7 million goodwill impairment charge in 2008 as compared to a $142.2 million goodwill impairment charge in 2007. At December 31, 2008, there was no goodwill asset recorded on the Company's consolidated balance sheet.
Excluding the goodwill impairment charge in both years, noninterest expense would have been $68.9 million in 2008 as compared to $84.3 million in 2007, a decrease of $15.4 million.
Salaries and employee benefits decreased by $8.1 million, or 20.7%, from 2007 to 2008. The decrease is partially attributable to a $4.1 million decrease in base salaries and employee benefits expense in connection with a decline in full-time equivalent employees by 89 from December 2007 to December 2008. Of the remaining $4.0 million decrease, approximately $3.3 million is related to a decrease in equity-based compensation and $0.7 million is related to a decrease in bonus and incentive expense in 2008 as compared to 2007. The decline in equity-based compensation is mostly due to a change in expectation regarding the vesting criteria for performance-based shares. It is no longer expected that the performance-based shares will meet their vesting condition, which is based on earnings per share, prior to their expiration date of December 31, 2012. Should this expectation change, additional expense could be recorded in future periods. This change accounted for
49
Table of Contents
approximately $2.9 million of the total $3.3 million decrease in equity based compensation expense. Overall base salary and employee benefit expense is expected to remain lower throughout 2009 due to fewer employees. In the second quarter of 2008, we announced a major effort to better align our expenses with the current size of our business. This effort was expected to reduce overall noninterest expense by approximately $6.0 million once fully implemented. A significant portion of these annualized savings are expected to be from salaries and employee benefits expense and most of the progress toward the salary and employee benefit portion of this goal had been achieved by December 31, 2008.
Furniture and equipment expense increased by $0.4 million, or 8.8%, in 2008 as compared to 2007. This increase is mostly due to accelerating depreciation expense for assets that were abandoned upon the closing of two branches during 2008, as well as accelerated depreciation related to certain computer equipment no longer in service as of year-end as a result of our outsourcing of item processing and data processing in December 2008.
A goodwill impairment charge of $250.7 million was recorded in 2008 as compared to a goodwill impairment charge of $142.2 million in 2007. As of December 31, 2008, there was no goodwill asset recorded on the Company's balance sheet, therefore no future goodwill impairment charges are expected in 2009. Goodwill is recorded in nearly every purchase transaction when a company buys another entity. The purchase price is allocated among the various components of the acquired business. This allocation is based on the appraised value of the underlying assets. If the purchase price is higher than the fair market value of the acquired business' identifiable net assets, the excess purchase price is labeled goodwill and is recorded as an intangible non-earning asset as well as capital for financial reporting purposes, but not regulatory purposes. Prior to the implementation of Statement of Financial Accounting Standards No. 142,Goodwill and Other Intangible Assets, goodwill was written off as an expense over the estimated life of the goodwill. This caused the goodwill value to be reduced gradually over time. Under current accounting rules, goodwill is no longer written off slowly. Instead, a company must evaluate the value of goodwill each year, and write down any goodwill in excess of its current value. As goodwill is based on the purchase price paid, declines in value can cause goodwill impairment, which is recorded as a non-cash adjustment to income and a decrease to the value of the intangible asset. All of the Company's acquisitions occurred after the implementation of new accounting guidance in 2002, which ceased the amortization of goodwill. Thus, the Company has traditionally had a high level of goodwill to total equity. This made our goodwill more susceptible to the accounting considerations of market volatility in the financial services industry.
Step one of the impairment test involves comparing the fair value of the reporting unit which, in our case, is the entire entity to the carrying value of the reporting unit. If the fair value of the reporting unit is greater than the carrying value of the reporting unit, no additional testing is required. If the fair value of the reporting unit is less than the carrying value of the reporting unit, step two of the impairment test must be performed. Step two requires that the implied fair value of the reporting unit goodwill be compared to the carrying amount of that goodwill. The implied fair value of goodwill is determined by allocating the fair value determined in step one to all of the individual assets and liabilities of the reporting unit, including any unrecognized identifiable intangible assets. This allocation process is only performed for purposes of testing goodwill for impairment, as the other assets and liabilities are not actually written up or written down, nor is any additional unrecognized identifiable intangible asset recorded as a part of this process. Step one of the impairment test in 2008 indicated that the fair value of the reporting unit was $230.6 million less than its carrying value. The valuation employed in step one utilized different valuation techniques including the discounted cash flows method, as well as the change of control valuation method. The lower value in step one of the impairment test is attributable to lower market valuations for banking institutions in the latter part of 2008, the continued weakening of the credit market, and the decline in real estate values in our markets. The difference between fair value and carrying value in step one of the impairment test was
50
Table of Contents
increased by approximately $20.1 million as a result of overall increases to values of the remainder of the Company's assets and liabilities as determined in step two of the impairment test. The combined step one and step two impairments resulted in an overall non-cash goodwill impairment of $250.7 million (the entire balance of goodwill). This non-cash accounting write-off had no impact on our cash flow, liquidity or regulatory capital. The 2007 goodwill impairment charge is discussed below.
Amortization expense decreased in 2008 by $1.2 million, or 14.2%, as a result of accelerated amortization methods. Amortization expense is projected to decrease by $1.2 million, or 15.6%, in 2009 as compared to 2008 as presented in Note 8, Other Intangible Assets, to "Item 8. Financial Statements and Supplemental Date—Notes to Consolidated Financial Statements".
Other general and administrative expenses decreased by $6.5 million, or 27.5%, to $17.3 million in 2008 as compared to $23.8 million in 2007. The decrease is mostly due to a $6.5 million charge in 2007 as a result of a settlement of the Barnes action lawsuit. In 2008, the Company also recorded approximately $1.5 million of charges related to the reduction of the carrying value of other real estate owned, an increase of $0.9 million over 2007 for similar charges. Additionally, there was a $1.0 million increase in FDIC insurance on customer deposits in 2008 as compared to 2007. In 2007, the Company was able to utilize its one-time credit provided by the FDIC to offset the cost of its FDIC insurance premiums. It is expected that FDIC insurance premiums will increase by approximately $1.3 million in 2009 as compared to 2008, due to the FDIC increasing deposit rates by 7 basis points in 2009, as well as the 10 basis point additional assessment on certain deposits in 2009 for unlimited FDIC insurance coverage of non-interest bearing transaction accounts. If the proposed changes to FDIC insurance rates are finalized by the FDIC, or if our risk category changes, our FDIC insurance premiums will increase even further. In 2007 the Company recorded a $1.0 million charge for expenses associated with the combination of its subsidiary banks on January 1, 2008. The year-over-year impact of the increase in charges related to other real estate owned, the increase in FDIC insurance premiums was offset by the decrease in charges related to the combination of its subsidiary banks and overall decreases in other noninterest expense items, particularly professional fees and business development.
2007 Compared to 2006
Overall noninterest expense increased by $135.6 million in 2007 as compared to 2006. This increase was mostly due to a $142.2 million goodwill impairment charge taken in the fourth quarter 2007. Additionally, other general and administrative expenses increased mostly due to settlement of a lawsuit during the second quarter 2007. These increases were partly offset by decreases in salaries and employee benefits, as well as amortization of intangible assets.
Salaries and employee benefits decreased by $7.0 million, or 15.2%, from 2006 to 2007. The decrease is mostly attributable to a $5.0 million decrease in bonus and incentive expense in 2007. The remainder of the decrease from 2007 is due mostly to overall decreases in salary expense as a result of an 8% decline in full-time equivalent employees.
Goodwill impairment was $142.2 million in 2007 as compared to none in the prior year. Step one of the impairment test in 2007 indicated that the fair value of the reporting unit was $133.1 million less than its carrying value. The valuation employed in step one utilized different valuation techniques including the discounted cash flows method, as well as the change of control valuation method. The lower value in step one of the impairment test is attributable to lower market valuations for banking institutions in the latter part of 2007, the weakening of the credit market in the second half of 2007 and the decline in real estate values, particularly in Northern Colorado. The difference between fair value and carrying value in step one of the impairment test was increased by approximately $9.1 million as a result of the overall increase to values of the remainder of the Company's assets and liabilities as determined in step two of the impairment test.
51
Table of Contents
Amortization expense decreased in 2007 by $3.2 million, or 26.7%, as a result of accelerated amortization methods and the expiration of certain identifiable intangible assets including noncompete agreements.
Other general and administrative expenses increased by $3.8 million, or 18.7%, to $23.8 million in 2007 as compared to $20.1 million in 2006. The increase is mostly due to a $6.5 million charge in the second quarter 2007 as a result of a settlement of a lawsuit. Additionally, the Company incurred a $1.0 million charge as a result of merging its two subsidiary banks. Excluding these two charges, other general and administrative expense would have declined by $3.7 million in 2007 as compared to 2006. The largest portion of this decline relates to $1.8 million of expenses related to a management transition in 2006. The remainder of the decline is due to an overall decrease in several categories such as professional fees, and business development and office-related expenses.
Income Taxes Expense (Benefit)
2008 Compared to 2007
The effective tax benefit in 2008 was 2.5% as compared to 0.1% in 2007. The reason for the benefit in 2008 is due to tax-exempt income further reducing the net loss before taxes. No tax benefit was recorded in 2008 or 2007 as a result of the goodwill impairment charges, as goodwill impairment is not tax deductible. The taxable loss before taxes for financial reporting purposes in 2008 was $263.3 million. After adding back the nondeductible goodwill impairment charge of $250.7 million, the 2008 taxable loss before taxes for financial reporting purposes would have been $12.5 million. This was further decreased by tax-exempt income causing an overall $6.5 million tax benefit in 2008.
For 2007, the effective tax benefit was 0.1%. After adding back the nondeductible goodwill impairment charge of $142.2 million, the 2007 taxable income before taxes for financial reporting purposes would have been $3.9 million. This was mostly offset by tax-exempt income causing an overall small tax benefit in 2007.
2007 Compared to 2006
The effective tax benefit in 2007 was 0.1%, as compared to an effective tax rate of 33.5% in 2006. The reason for the small benefit in 2007 is mostly due to tax-exempt income offsetting most of the net income before taxes, but after the goodwill impairment charge.
For 2006, the effective tax rate was 33.5%. The primary difference between the expected tax rate of 35% and the effective tax rate was due to tax-exempt income, partially offset by state income tax.
FINANCIAL CONDITION
At December 31, 2008, we had total assets of $2.1 billion, compared to $2.4 billion and $2.7 billion at December 31, 2007 and 2006, respectively. The overall $268.9 million decline in total assets in 2008 as compared to 2007 is mostly attributable to a $258.2 million decrease in goodwill and other intangible assets.
52
Table of Contents
The overall $348.9 million decline in total assets in 2007 as compared to 2006 is mostly attributable to a $163.7 million decrease in net loans, and a $150.9 million decrease in goodwill and other intangible assets. The following table sets forth certain key consolidated balance sheet data:
Table 9
| | | | | | | | | | |
| | December 31, | |
|---|
| | 2008 | | 2007 | | 2006 | |
|---|
| | (In thousands)
| |
|---|
Total assets | | $ | 2,102,741 | | $ | 2,371,664 | | $ | 2,720,600 | |
Earning Assets | | | 1,989,884 | | | 1,949,211 | | | 2,152,053 | |
Deposits | | | 1,698,651 | | | 1,799,507 | | | 1,960,105 | |
Loans
The following table sets forth the amount of our loans outstanding at the dates indicated:
Table 10
| | | | | | | | | | | | | | |
| | December 31, | |
|---|
| | 2008 | | 2007 | |
|---|
| | Amount | | % of
Loans | | Amount | | % of
Total | |
|---|
| | (Dollars in thousands)
| |
|---|
Real estate: | | | | | | | | | | | | | |
| | Mortgage | | $ | 730,300 | | | 40 | % | $ | 762,102 | | | 43 | % |
| | Construction | | | 268,306 | | | 15 | % | | 235,236 | | | 13 | % |
Commercial | | | 746,241 | | | 41 | % | | 679,717 | | | 38 | % |
Agricultural | | | 22,738 | | | 1 | % | | 39,506 | | | 2 | % |
Consumer | | | 38,352 | | | 2 | % | | 40,835 | | | 2 | % |
Lease financing and other | | | 23,996 | | | 1 | % | | 27,653 | | | 2 | % |
| | | | | | | | | | |
Total gross loans | | | 1,829,933 | | | 100 | % | | 1,785,049 | | | 100 | % |
| | | | | | | | | | | | |
Less: allowance for loan losses | | | (44,988 | ) | | | | | (25,711 | ) | | | |
Unearned discount | | | (3,600 | ) | | | | | (3,402 | ) | | | |
| | | | | | | | | | | | |
Net Loans | | $ | 1,781,345 | | | | | $ | 1,755,936 | | | | |
| | | | | | | | | | | | |
Loans held for sale at lower of cost or market | | $ | 5,760 | | | | | $ | 492 | | | | |
| | | | | | | | | | | | |
There were $998.6 million of real estate loans at December 31, 2008. Management continues its efforts to decrease its exposure to residential real-estate and residential land and land development loans. The increase in construction loans in 2008 as compared to 2007 was due primarily to draws on existing commercial real estate construction projects during 2008.
Total loans, net of unearned discount (excluding loans held for sale), increased by $44.7 million, or 2.5%, from December 31, 2008 to December 31, 2007. Average loans declined by $74.3 million in 2008 as compared to 2007. The increase in commercial loans outstanding is primarily due to increases in middle-market and energy loan portfolios.
During 2007 and throughout 2008, the Company's approach to loan underwriting placed more emphasis on the borrower's cash equity invested in the project being financed, expertise and experience as it relates to the project, the borrower's capacity and ability to carry the projects beyond the underlying collateral pledged and continued efforts to reduce exposure with respect to residential construction and land development loans.
53
Table of Contents
With respect to group concentrations, most of the Company's business activity is with customers in the state of Colorado. At December 31, 2008, the Company did not have any significant concentrations in any particular industry.
Loan maturities
The following table shows the amounts of loans outstanding at December 31, 2008, which, based on remaining scheduled repayments of principal, were due in one year or less, more than one year through five years, and more than five years. Demand or other loans having no stated maturity and no stated schedule of repayments are reported as due in one year or less. The table also presents, for loans with maturities over one year, an analysis with respect to fixed interest rate loans and floating interest rate loans. The table excludes unearned discount.
Table 11
| | | | | | | | | | | | | | | | | | | |
| | Maturity | | Rate Structure for Loans with Maturities over One Year | |
|---|
| | One Year
or Less | | One
through
Five Years | | Over Five
Years | | Total | | Fixed
Rate | | Floating
Rate | |
|---|
| | (In thousands)
| |
|---|
Real estate—mortgage | | $ | 218,371 | | $ | 349,763 | | $ | 162,166 | | $ | 730,300 | | $ | 190,137 | | $ | 321,792 | |
Real estate—construction | | | 181,641 | | | 73,783 | | | 12,882 | | | 268,306 | | | 27,112 | | | 59,553 | |
Commercial | | | 398,741 | | | 228,347 | | | 119,153 | | | 746,241 | | | 107,795 | | | 239,705 | |
Agricultural | | | 11,455 | | | 7,638 | | | 3,645 | | | 22,738 | | | 4,932 | | | 6,351 | |
Consumer | | | 10,699 | | | 20,366 | | | 7,287 | | | 38,352 | | | 25,914 | | | 1,739 | |
Lease receivable and other | | | 2,168 | | | 2,961 | | | 18,867 | | | 23,996 | | | 1,035 | | | 20,793 | |
| | | | | | | | | | | | | | |
Total | | $ | 823,075 | | $ | 682,858 | | $ | 324,000 | | $ | 1,829,933 | | $ | 356,925 | | $ | 649,933 | |
| | | | | | | | | | | | | | |
Nonperforming Assets and Other Impaired Loans
Credit risk related to nonperforming assets arises as a result of lending activities. To manage this risk, we employ frequent monitoring procedures and take prompt corrective action when necessary. We employ a risk rating system that identifies the overall potential amount of risk associated with each loan in our loan portfolio. This monitoring and rating system is designed to help management determine current and potential problems so that corrective actions can be taken promptly.
Loans are generally placed on nonaccrual status when they become 90 days or more past due or at such time as management determines, after considering economic and business conditions and an analysis of the borrower's financial condition, that the timely recognition of principal and interest is doubtful.
A loan is impaired when, based on current information and events, it is probable that we will be unable to collect all amounts due according to the contractual terms of the loan agreement. Impaired loans consist of our nonaccrual loans, loans that are 90 days or more past due, and other loans for which we determine that noncompliance with contractual terms of the loan agreement is probable. Losses on individually identified impaired loans that are not collateral dependent are measured based on the present value of expected future cash flows discounted at the original effective interest rate of each loan. For loans that are collateral dependent, impairment is measured based on the fair value of the collateral less estimated selling costs.
54
Table of Contents
Table 12
| | | | | | | | | |
| | December 31,
2008 | | December 31,
2007 | |
|---|
| | (Dollars in thousands)
| |
|---|
Nonperforming assets: | | | | | | | |
| | Nonaccrual loans and leases, not restructured | | $ | 54,594 | | $ | 19,309 | |
| | Accruing loans past due 90 days or more | | | 228 | | | 527 | |
| | Foreclosed assets | | | 484 | | | 3,517 | |
| | | | | | |
| | | Total nonperforming assets | | $ | 55,306 | | $ | 23,353 | |
| | | | | | |
Impaired Loans: | | | | | | | |
| | Nonperforming loans | | $ | 54,822 | | $ | 19,836 | |
| | Other impaired loans | | | — | | | 3,492 | |
| | | | | | |
| | Total impaired loans | | $ | 54,822 | | $ | 23,328 | |
| | Allocated allowance for loan losses | | | (11,064 | ) | | (4,283 | ) |
| | | | | | |
| | | Net investment in impaired loans | | $ | 43,758 | | $ | 19,045 | |
| | | | | | |
| | Impaired loans with a valuation allowance | |
$ |
42,191 | |
$ |
16,663 | |
| | Impaired loans without a valuation allowance | | | 12,631 | | | 6,665 | |
| | | | | | |
| | | Total impaired loans | | $ | 54,822 | | $ | 23,328 | |
| | | | | | |
| | Valuation allowance related to impaired loans | | $ | 11,064 | | $ | 4,283 | |
| | | | | | |
| | Valuation allowance as a percent of impaired loans | | | 20.2 | % | | 18.4 | % |
| | | | | | |
Nonaccrual loans to loans, net of unearned discount | | |
2.99 |
% | |
1.08 |
% |
Nonperforming assets to loans, net of unearned discount, and other real estate owned | | | 3.03 | % | | 1.31 | % |
Allowance for loan losses to nonperforming loans | | | 82.06 | % | | 129.62 | % |
Allowance for loan losses to impaired loans | | | 82.06 | % | | 110.22 | % |
Nonperforming assets of $55.3 million at December 31, 2008 reflected an increase of $31.9 million from the December 31, 2007 balance of $23.4 million. The increase in nonperforming assets in 2008 occurred mostly in the second half of the year due to continued deterioration of the real estate market in Colorado.
The Company's loss exposure on its nonperforming loans continues to be mitigated by collateral positions on these loans. The value of these collateral positions further deteriorated during 2008 causing an increase in both nonperforming assets and the related allocated allowance for loan losses. The allocated allowance for loan losses associated with impaired loans is computed based upon related collateral value of the loans. The collateral values are determined by recent appraisals, but are generally discounted significantly by management based on historical collateral dispositions, changes in market conditions since the last valuation and management's expertise and knowledge of the client and the client's business.
At December 31, 2008, no additional funds are committed to be advanced in connection with impaired loans.
55
Table of Contents
The following table presents our nonperforming assets at the dates indicated:
Table 13
| | | | | | | | | | | | | | | | |
| | At December 31, | |
|---|
| | 2008 | | 2007 | | 2006 | | 2005 | | 2004 | |
|---|
| | (Dollars in thousands)
| |
|---|
Nonaccrual loans, not restructured | | $ | 54,594 | | $ | 19,309 | | $ | 32,852 | | $ | 29,608 | | $ | 11,905 | |
Accruing loans past due 90 days or more | | | 228 | | | 527 | | | 3 | | | 131 | | | 2,494 | |
| | | | | | | | | | | | |
Total nonperforming loans (NPLs) | | | 54,822 | | | 19,836 | | | 32,855 | | | 29,739 | | | 14,399 | |
Foreclosed assets | | | 484 | | | 3,517 | | | 1,207 | | | 1,465 | | | 5,707 | |
| | | | | | | | | | | | |
Total nonperforming assets (NPAs) | | $ | 55,306 | | $ | 23,353 | | $ | 34,062 | | $ | 31,204 | | $ | 20,106 | |
| | | | | | | | | | | | |
Selected ratios: | | | | | | | | | | | | | | | | |
NPLs to loans, net of unearned discount | | | 3.00 | % | | 1.11 | % | | 1.69 | % | | 1.44 | % | | 0.88 | % |
NPAs to total assets | | | 2.63 | % | | 0.98 | % | | 1.25 | % | | 1.05 | % | | 0.84 | % |
Allowance for Loan Losses
The allowance for loan losses is maintained at a level that, in our judgment, is adequate to absorb probable incurred loan losses in the loan portfolio. The amount of the allowance is based on management's evaluation of the collectability of the loan portfolio, historical loss experience, and other significant factors affecting loan portfolio collectability, including the level and trends in delinquent, nonaccrual and adversely classified loans, trends in volume and terms of loans, levels and trends in credit concentrations, effects of changes in underwriting standards, policies, procedures and practices, national and local economic trends and conditions, changes in capabilities and experience of lending management and staff, and other external factors including industry conditions, competition and regulatory requirements.
Our methodology for evaluating the adequacy of the allowance for loan losses has two basic elements: first, the specific identification of impaired loans and the measurement of an estimated loss for each individual loan identified; and second, estimating a nonspecific allowance for probable losses on all other loans. Impaired loans are discussed in the previous section. The specific allowance for impaired loans and the allowance calculated for probable incurred losses on other loans are combined to determine the required allowance for loan losses. The amount calculated is compared to the actual allowance for loan losses at each quarter end and any shortfall is covered by an additional provision for loan losses.
In estimating the nonspecific allowance for loan losses, we group the balance of the loan portfolio into segments that have common characteristics, such as loan type, collateral type or risk rating. For each nonspecific allowance portfolio segment, we apply loss factors to calculate the required allowance. These loss factors are based upon three years of historical loss rates and adjusted for qualitative factors affecting loan portfolio collectability as described above. Higher net charge-offs during 2008 and 2007 directly increased the historical loss factor. This also had a direct impact on the economic concerns factor which looks at historical losses by type of loan and applies a loss factor based on both historical losses and management's estimate of the economic climate for the remaining loans in the portfolio. Management also looks at risk weightings of loans and computes a factor for the volume and severity of classified loans using assigned risk ratings under regulatory definitions of "watch", "substandard"', "doubtful" and "loss". Loans graded as either doubtful or loss are treated as impaired and are included as part of the specific reserve computed above. Loans segregated by risk weighting categories watch or substandard are evaluated for trends in volume and severity.
56
Table of Contents
The table below summarizes loans held for investment, average loans held for investment, nonperforming loans and changes in the allowance for loan losses arising from loan losses and additions to the allowance from provisions charged to operating expense:
Table 14
| | | | | | | | | | | | | | | | | |
| | 2008 | | 2007 | | 2006 | | 2005 | | 2004 | |
|---|
| | (Dollars in Thousands)
| |
|---|
Balance, beginning of period | | $ | 25,711 | | $ | 27,899 | | $ | 27,475 | | $ | 25,022 | | $ | 7,653 | |
Allowance acquired through acquisition | | | — | | | — | | | — | | | 3,855 | | | 17,304 | |
Unfunded commitment allowance(1) | | | — | | | — | | | — | | | (718 | ) | | — | |
Loan charge-offs: | | | | | | | | | | | | | | | | |
| | Real estate—residential and commercial | | | 2,639 | | | 12,354 | | | 2,186 | | | 1,740 | | | 1,232 | |
| | Real estate—construction | | | 11,956 | | | 12,469 | | | 2,044 | | | 200 | | | 67 | |
| | Commercial | | | 1,340 | | | 2,825 | | | 1,154 | | | 2,848 | | | 2,413 | |
| | Agricultural | | | 17 | | | 654 | | | 40 | | | 35 | | | 709 | |
| | Consumer | | | 275 | | | 497 | | | 477 | | | 670 | | | 867 | |
| | Lease receivable and other | | | — | | | 174 | | | 26 | | | 48 | | | 23 | |
| | | | | | | | | | | | |
| | Total loan charge-offs: | | | 16,227 | | | 28,973 | | | 5,927 | | | 5,541 | | | 5,311 | |
| | | | | | | | | | | | |
Recoveries: | | | | | | | | | | | | | | | | |
| | Real estate—residential and commercial | | | 596 | | | 906 | | | 359 | | | 188 | | | 36 | |
| | Real estate—construction | | | 744 | | | 279 | | | 65 | | | 135 | | | 9 | |
| | Commercial | | | 259 | | | 385 | | | 1,023 | | | 802 | | | 302 | |
| | Agricultural | | | 15 | | | 394 | | | 84 | | | 73 | | | 190 | |
| | Consumer | | | 115 | | | 134 | | | 223 | | | 133 | | | 126 | |
| | Lease receivable and other | | | — | | | 21 | | | — | | | 126 | | | 13 | |
| | | | | | | | | | | | |
| | Total loan recoveries | | | 1,729 | | | 2,119 | | | 1,754 | | | 1,457 | | | 676 | |
| | | | | | | | | | | | |
Net loan charge-offs | | | 14,498 | | | 26,854 | | | 4,173 | | | 4,084 | | | 4,635 | |
Provision for loan losses(2) | | | 33,775 | | | 24,666 | | | 4,597 | | | 3,400 | | | 4,700 | |
| | | | | | | | | | | | |
Balance, end of period | | $ | 44,988 | | $ | 25,711 | | $ | 27,899 | | $ | 27,475 | | $ | 25,022 | |
| | | | | | | | | | | | |
Loans held for investment | | $ | 1,826,333 | | $ | 1,781,647 | | $ | 1,947,487 | | $ | 2,067,593 | | $ | 1,641,821 | |
Average loans held for investment | | | 1,797,304 | | | 1,868,856 | | | 1,975,055 | | | 1,774,241 | | | 614,543 | |
Nonperforming assets | | | 55,306 | | | 23,353 | | | 32,855 | | | 29,739 | | | 14,339 | |
Selected ratios: | | | | | | | | | | | | | | | | |
Net charge-offs to average loans held for investment | | | 0.81 | % | | 1.44 | % | | 0.21 | % | | 0.23 | % | | 0.76 | % |
Provision for the allowance for loans to average loans | | | 2.50 | % | | 1.38 | % | | 0.23 | % | | 0.19 | % | | 0.76 | % |
Allowance for loans to loans held for investment at end of period | | | 2.46 | % | | 1.44 | % | | 1.43 | % | | 1.33 | % | | 1.52 | % |
Allowance for loans to non-performing assets | | | 81.34 | % | | 110.10 | % | | 84.91 | % | | 92.39 | % | | 173.78 | % |
- (1)
- The reserve for unfunded loan commitments was reclassified from the allowance for loan losses to other liabilities at December 31, 2005.
57
Table of Contents
- (2)
- The provision for loan losses noted in the consolidated statements of income (loss) for the year ended December 31, 2006, includes a provision for loan losses of $4,597,000 and a recovery on the reserve for unfunded commitments of $307,000.
At December 31, 2008, the allowance for loan losses was $45.0 million, or 2.46% of total loans held for investment. This compares to an allowance for loan loss of $25.7 million, or 1.44% of total loans held for investment at December 31, 2007.
The increase in the allowance for loan losses is due primarily to the increase in the level of nonperforming loans during 2008. Actual net charge-offs related to loans were $14.5 million in 2008, as compared to $26.9 million in 2007, a decrease of $12.4 million. This decrease in charge-offs is mostly attributable to a loan sale in 2007, where the Company sold a portion of its nonperforming and classified loans.
Approximately $11.1 million, or 24.6%, of the $45.0 million allowance for loan losses at December 31, 2008, relates to loans specifically reserved. This compares to a specific reserve of $4.3 million, or 16.7% of the total allowance for loan losses at December 31, 2007. The increase in the percent of the portfolio from specific reserves is attributable to a higher overall balance of impaired loans at December 31, 2008 as compared to 2007, along with lower collateral values assigned, especially for construction loans. The general reserve as a percent of overall loans, net of unearned discount, was 1.86% at December 31, 2008 as compared to 1.21% at December 31, 2007. The increase in the general reserve as a percent of loans, net of unearned discount, is due to actual historical losses increased by management's review of internal classified loans, management's expectation of overall economic conditions in the areas in which we operate and management's expected losses with the overall level of real estate loans within our portfolio.
Management continues to monitor the allowance for loan losses closely and will adjust the allowance when necessary, based on its analysis, which includes ongoing evaluation of substandard loans and their collateral positions.
The following table allocates the allowance for loan losses based on our judgment of inherent losses in the respective categories. While we have allocated the allowance to various portfolio segments for purposes of this table, the allowance for loan losses is general and is available for the portfolio in its entirety:
Table 15
| | | | | | | | | | | | | | | | | | | | | | | | | | | | | | | |
| | At December 31, | |
|---|
| | 2008 | | 2007 | | 2006 | | 2005 | | 2004 | |
|---|
| | Allocation
of the
Allowance | | Percent of
Allocation
to Total | | Allocation
of the
Allowance | | Percent of
Allocation
to Total | | Allocation
of the
Allowance | | Percent of
Allocation
to Total | | Allocation
of the
Allowance | | Percent of
Allocation
to Total | | Allocation
of the
Allowance | | Percent of
Allocation
to Total | |
|---|
| | (Dollars in Thousands)
| |
|---|
Real estate—residential and commercial | | $ | 17,579 | | | 39.1 | % | $ | 16,072 | | | 62.5 | % | $ | 6,150 | | | 22.0 | % | $ | 10,611 | | | 38.6 | % | $ | 7,139 | | | 28.5 | % |
Real estate—construction | | | 18,696 | | | 41.6 | | | 4,180 | | | 16.3 | | | 8,520 | | | 30.5 | | | 1,928 | | | 7.0 | | | 2,844 | | | 11.4 | |
Commercial | | | 8,000 | | | 17.8 | | | 4,087 | | | 15.9 | | | 8,452 | | | 30.3 | | | 9,115 | | | 33.2 | | | 6,185 | | | 24.7 | |
Agricultural | | | 97 | | | 0.2 | | | 387 | | | 1.5 | | | 2,071 | | | 7.4 | | | 477 | | | 1.7 | | | 1,463 | | | 5.8 | |
Consumer | | | 559 | | | 1.2 | | | 909 | | | 3.5 | | | 2,027 | | | 7.3 | | | 721 | | | 2.6 | | | 1,458 | | | 5.8 | |
Leases receivable and other | | | 57 | | | 0.1 | | | 76 | | | 0.3 | | | 679 | | | 2.5 | | | 8 | | | 0.0 | | | 137 | | | 0.5 | |
Unallocated(a) | | | — | | | 0.0 | | | — | | | 0.0 | | | — | | | 0.0 | | | 4,615 | | | 16.9 | | | 5,796 | | | 23.3 | |
| | | | | | | | | | | | | | | | | | | | | | |
Total | | $ | 44,988 | | | 100.0 | % | $ | 25,711 | | | 100.0 | % | $ | 27,899 | | | 100.0 | % | $ | 27,475 | | | 100.0 | % | $ | 25,022 | | | 100.0 | % |
| | | | | | | | | | | | | | | | | | | | | | |
- (a)
- Represents our estimate of risk associated with general economic conditions and portfolio concentrations that are not directly correlated to a specific loan classification. This estimate was reallocated into the loan categories in 2006.
58
Table of Contents
During 2008, the allocation of the allowance for losses attributable to real estate construction loans increased by $14.5 million to $18.7 million at December 31, 2008 compared to $4.2 million at December 31, 2007. The increase in this allocation is due to a higher specific reserve attributable to construction loans at December 31, 2008 as compared to December 31, 2007, as well as a higher general reserve associated with construction loans. The increase in the general reserve associated with construction loans is due to management assigning a higher risk adjustment to the construction loan portfolio due to declines in real estate market conditions during 2008.
During 2007, the allocation of the reserve to real estate-mortgage loans is primarily attributable to higher balances of nonperforming and classified loans being associated with real estate mortgage loans. This was due in part to a general deterioration in real estate values, particularly in Northern Colorado, during 2007.
Securities
We manage our investment portfolio principally to provide collateral for certain deposits, in particular public deposits, as well as to balance our overall interest rate risk. To a lesser extent, we manage our investment portfolio to provide earnings with a view to minimizing credit risk. At December 31, 2008 and 2007, we did not own any preferred stock in either the Federal National Mortgage Association (FNMA) or the Federal Home Loan Mortgage Corporation (FHLMC). Additionally, we did own any private collateralized mortgage obligations, private mortgage backed securities or any trust preferred securities in other institutions.
The carrying value of our portfolio of investment securities at the dates indicated are as follows:
Table 16
| | | | | | | | |
| | At December 31, | |
|---|
| | 2008 | | 2007 | |
|---|
| | (In thousands)
| |
|---|
Securities available-for-sale: | | | | | | | |
U.S. Treasury securities | | $ | 3,495 | | $ | — | |
U.S. Government agencies and government-sponsored entities | | | 2,510 | | | 10,456 | |
Obligations of states and political subdivisions | | | 63,015 | | | 76,876 | |
Mortgage backed | | | 31,965 | | | 30,038 | |
Marketable equity | | | 1,345 | | | 1,047 | |
Other | | | 544 | | | 547 | |
| | | | | | |
Total securities available-for-sale | | $ | 102,874 | | $ | 118,964 | |
| | | | | | |
Securities held-to-maturity: | | | | | | | |
| | Mortgage-backed | | $ | 13,114 | | $ | 14,889 | |
| | | | | | |
Bank Stocks, at cost | | $ | 28,276 | | $ | 32,464 | |
| | | | | | |
Securities available-for-sale are carried at fair value, while securities held-to-maturity and bank stocks are carried at historical cost.
Fair values for municipal securities are generally determined by matrix pricing, which is a mathematical technique widely used in the industry to value debt securities without relying exclusively on quoted prices for the specific securities but rather by relying on the securities' relationship to other benchmark quoted securities. Characteristics utilized by matrix pricing include insurer, credit support, state of issuance, and bond rating. These factors are used to incorporate additional spreads and municipal curves. A separate curve structure is used for bank-qualified municipal bonds versus general market municipals. For the bank-qualified municipal bonds, active quotes are obtained when available.
59
Table of Contents
Fair values for U.S. Treasury securities, U.S. government agencies and government-sponsored entities are determined using a combination of daily closing prices, evaluations, income data, security master (descriptive) data, and terms and conditions data. Additional data used to compute the fair value of U.S. mortgage-backed pass-through issues (FHLMC, FNMA, GNMA, and SBA pools) includes daily composite seasoned, pool-specific, and generic coupon evaluations, and factors and descriptive data for individual pass-through pools. Additional data used to compute the fair value of U.S. collateralized mortgage obligations include daily evaluations and descriptive data.
One municipal bond related to a hospital was priced using significant unobservable inputs. Management reviewed the financials of the hospital, had discussions with hospital management and reviewed the underlying collateral for the municipal bond to determine an appropriate benchmark risk-adjusted interest rate based on transactions with similar risks. This benchmark rate was applied to a discounted cash flow analysis to determine the fair value as of December 31, 2008.
The carrying value of our investment securities at December 31, 2008 totaled $144.3 million compared to $166.3 million at December 31, 2007. The decline in securities during 2008 was mostly due to a decline in municipal bonds, as well as bonds issued by U.S. government agencies and government-sponsored entities. Generally, we did not replace the maturities or calls of agency and municipal bonds in 2008 or 2007.
Bank stocks are comprised mostly of stock of the Federal Reserve Bank of Kansas City, the Federal Home Loan Bank of Topeka and Bankers' Bank of the West. These stocks have restrictions placed on their transferability as only members of the entities can own the stock. During 2008, the Company reduced its required holdings in the Federal Reserve Bank of Kansas City by $4.6 million.
The following table shows the maturities of investment securities at December 31, 2008, and the weighted average yields of such securities, excluding the benefit of tax-exempt securities:
Table 17
| | | | | | | | | | | | | | | | | | | | | | | | | | |
| | At December 31, 2008 | |
|---|
| | Within One Year | | After One Year
but within
Five Years | | After Five Years
but within
Ten Years | | After Ten Years | |
|---|
| | Amount | | Yield(1) | | Amount | | Yield(1) | | Amount | | Yield(1) | | Amount | | Yield(1) | |
|---|
| | (Dollars in Thousands)
| |
|---|
Securities available-for-sale: | | | | | | | | | | | | | | | | | | | | | | | | | |
U.S. Treasury securities | | $ | 3,495 | | | 0.67 | % | $ | — | | | 0.00 | % | $ | — | | | 0.00 | % | $ | — | | | 0.00 | % |
U.S. Government agencies and sponsored entities | | | — | | | 0.00 | % | | — | | | 0.00 | % | | — | | | 0.00 | % | | 2,510 | | | 5.07 | % |
Obligations of states and political subdivisions | | | 2,105 | | | 6.68 | % | | 14,581 | | | 6.84 | % | | 3,239 | | | 7.05 | % | | 43,090 | | | 7.53 | % |
Mortgage backed securities | | | — | | | 0.00 | % | | 142 | | | 4.76 | % | | 931 | | | 4.37 | % | | 30,892 | | | 5.02 | % |
Marketable equity securities | | | 1,345 | | | 28.35 | % | | — | | | 0.00 | % | | — | | | 0.00 | % | | — | | | 0.00 | % |
Other securities | | | 184 | | | 6.25 | % | | 360 | | | 6.25 | % | | — | | | 0.00 | % | | — | | | 0.00 | % |
| | | | | | | | | | | | | | | | | | | | | | |
Total securities available-for-sale | | $ | 7,129 | | | 7.81 | % | $ | 15,083 | | | 6.81 | % | $ | 4,170 | | | 6.45 | % | $ | 76,492 | | | 6.44 | % |
| | | | | | | | | | | | | | | | | | | | | | |
Securities held-to-maturity: | | | | | | | | | | | | | | | | | | | | | | | | | |
| | Mortgage-backed | | $ | — | | | 0.00 | % | $ | — | | | 0.00 | % | $ | — | | | 0.00 | % | $ | 13,114 | | | 5.62 | % |
| | | | | | | | | | | | | | | | | | | | | | |
60
Table of Contents
| | | | | | | | | | | | | | | | | | | | | | | | | | |
| | At December 31, 2007 | |
|---|
| | Within One Year | | Within One Year | | After Five Years
but Within
One Year | | After Ten Years | |
|---|
| | Amount | | Yield(1) | | Amount | | Yield(1) | | Amount | | Yield(1) | | Amount | | Yield(1) | |
|---|
| | (Dollars in thousands)
| |
|---|
Securities available-for-sale: | | | | | | | | | | | | | | | | | | | | | | | | | |
U.S. Government agencies and sponsored entities | | $ | 7,981 | | | 4.59 | % | $ | 2,475 | | | 4.56 | % | $ | — | | | 0.00 | % | $ | — | | | 0.00 | % |
Obligations of states and political subdivisions | | | 4,812 | | | 5.79 | % | | 20,620 | | | 6.19 | % | | 6,852 | | | 6.15 | % | | 44,591 | | | 7.54 | % |
Mortgage backed securities | | | 655 | | | 4.08 | % | | 491 | | | 4.63 | % | | 13,477 | | | 4.55 | % | | 15,415 | | | 5.03 | % |
Marketable equity securities | | | — | | | 0.00 | % | | 1,047 | | | 24.84 | % | | — | | | 0.00 | % | | — | | | 0.00 | % |
Other securities | | | 4 | | | 6.25 | % | | 544 | | | 6.25 | % | | — | | | 0.00 | % | | — | | | 0.00 | % |
| | | | | | | | | | | | | | | | | | |
Total securities available-for-sale | | $ | 13,452 | | | 5.00 | % | $ | 25,177 | | | 6.77 | % | $ | 20,329 | | | 5.09 | % | $ | 60,006 | | | 6.89 | % |
| | | | | | | | | | | | | | | | | | | | | | |
Securities held-to-maturity: | | | | | | | | | | | | | | | | | | | | | | | | | |
| | | | | | | | | | | | | | | | | | | | | | |
| | Mortgage-backed | | $ | — | | | 0.00 | % | $ | — | | | 0.00 | % | $ | — | | | 0.00 | % | $ | 14,889 | | | 5.58 | % |
| | | | | | | | | | | | | | | | | | | | | | |
- (1)
- Yield is computed on a fully-tax equivalent basis for municipal bonds.
The marketable equity securities yield includes accretion income related to a purchase price adjustment on a security that will be redeemed at par in April 2009.
At December 31, 2008 and 2007, we held $28.3 million and $32.5 million, respectively, of other equity securities consisting of bank stocks with no maturity date, which are not reflected in the above schedule.
Deposits
Total deposits were $1.7 billion at December 31, 2008, as compared to $1.8 billion at December 31, 2007. Our 2008 average noninterest bearing deposits constituted 26.2% of our 2008 average total deposits, which compares to 2007 average noninterest bearing deposits to 2007 total average deposits of 24.9%. Our noninterest-bearing demand deposits decreased by $81.5 million, to $433.8 million at December 31, 2008. Our interest bearing demand deposits, including money market and savings accounts, decreased by $275.2 million, to $528.9 million at December 31, 2008. This decrease is primarily attributable to a shift in the mix of deposits primarily between money markets and time deposits. The Company joined the Certificate of Deposit Account Registry Service (CDARS®) program in 2008, and a part of the shift to time deposits was a result of existing customers moving funds into the CDARS® program in order to obtain expanded FDIC insurance coverage on their deposits. Additionally, the Company shifted its own funding sources from short-term and overnight funds to brokered deposits in order to provide longer-term funding to mitigate the impact of potential short-term liquidity fluctuations with the overall financial services industry in the second half of 2008.
61
Table of Contents
The following table shows the average amount and average rate paid on the categories of deposits for each of the periods indicated:
Table 18
| | | | | | | | | | | | | | | | | | | |
| | At December 31, | |
|---|
| | 2008 | | 2007 | | 2006 | |
|---|
| | Average
Balance | | Average
Rate | | Average
Balance | | Average
Rate | | Average
Balance | | Average
Rate | |
|---|
| | (Dollars in thousands)
| |
|---|
Noninterest bearing deposits | | $ | 440,359 | | | 0.00 | % | $ | 476,876 | | | 0.00 | % | $ | 519,893 | | | 0.00 | % |
Interest bearing demand | | | 150,210 | | | 0.51 | % | | 157,806 | | | 0.64 | % | | 167,381 | | | 0.58 | % |
Money market | | | 507,610 | | | 1.96 | % | | 638,295 | | | 3.69 | % | | 628,342 | | | 3.41 | % |
Savings | | | 70,243 | | | 0.56 | % | | 77,602 | | | 0.78 | % | | 93,622 | | | 0.75 | % |
Time | | | 514,362 | | | 4.17 | % | | 562,075 | | | 5.05 | % | | 574,320 | | | 4.22 | % |
| | | | | | | | | | | | | | | | | |
Total deposits | | $ | 1,682,784 | | | 2.62 | % | $ | 1,912,654 | | | 3.73 | % | $ | 1,983,558 | | | 3.23 | % |
| | | | | | | | | | | | | | | | | |
Additionally, the following table shows the maturities of time certificates of deposit and other time deposits of $100,000 or more, including brokered deposits, at the dates indicated:
Table 19
| | | | | | | |
| | At December 31, | |
|---|
| | 2008 | | 2007 | |
|---|
| | (In thousands)
| |
|---|
Due in three months or less | | $ | 89,232 | | $ | 68,578 | |
Due in over three months through six months | | | 33,336 | | | 61,917 | |
Due in over six months through twelve months | | | 157,399 | | | 88,693 | |
Due in over twelve months | | | 18,367 | | | 24,431 | |
| | | | | | |
Totals | | $ | 298,334 | | $ | 243,619 | |
| | | | | | |
The following table presents the mix of our deposits by type based on average balances for each of the periods indicated.
Table 20
| | | | | | | | | | | | | | | | | | | | | | | | | |
| | At December 31, | |
|---|
| | 2008 | | 2007 | | 2006 | | 2005 | |
|---|
| | Average
Balance | | % of
Total | | Average
Balance | | % of
Total | | Average
Balance | | % of
Total | | Average
Balance | | % of
Total | |
|---|
| | (Dollars in thousands)
| |
|---|
Noninterest bearing deposits | | $ | 440,359 | | | 26.17 | % | $ | 476,876 | | | 24.93 | % | $ | 519,893 | | | 26.21 | % | $ | 503,868 | | | 28.79 | % |
Interest bearing demand | | | 150,210 | | | 8.93 | % | | 157,806 | | | 8.25 | % | | 167,381 | | | 8.44 | % | | 122,967 | | | 7.03 | % |
Money market | | | 507,610 | | | 30.16 | % | | 638,295 | | | 33.37 | % | | 628,342 | | | 31.68 | % | | 535,974 | | | 30.63 | % |
Savings | | | 70,243 | | | 4.17 | % | | 77,602 | | | 4.06 | % | | 93,622 | | | 4.72 | % | | 85,539 | | | 4.89 | % |
Time | | | 514,362 | | | 30.57 | % | | 562,075 | | | 29.39 | % | | 574,320 | | | 28.95 | % | | 501,564 | | | 28.66 | % |
| | | | | | | | | | | | | | | | | | |
Total deposits | | $ | 1,682,784 | | | 100.00 | % | $ | 1,912,654 | | | 100.00 | % | $ | 1,983,558 | | | 100.00 | % | $ | 1,749,912 | | | 100.00 | % |
| | | | | | | | | | | | | | | | | | | | | | |
62
Table of Contents
Overall average time deposits decreased by $47.7 million, or 8.5%, to $514.4 million for 2008 compared to $562.1 million for 2007. The actual balance of time deposits increased by $255.9 million during 2008 to $736.0 million at December 31, 2008 compared to $480.1 million at December 31, 2007. Of the ending time deposit balance, approximately $63.2 million is from the CDARS® program, and $189.2 million is from brokered deposits, compared to $60.2 million at December 31, 2007. Overall time deposits as a percent of total deposits were 43.3% at December 31, 2008 as compared to 26.7% at December 31, 2007. The overall cost of time deposits decreased from 5.05% in 2007 to 4.17% in 2008.
Borrowings
Subordinated Debentures and Trust Preferred Securities
In September 2000, the predecessor to the Company formed CenBank Statutory Trust I and completed an offering of $10.0 million 10.6% Cumulative Trust Preferred Securities, which are guaranteed by us. The Trust also issued common securities to the predecessor and used the net proceeds from the offering to purchase $10.3 million in principal amount of 10.6% Subordinated Debentures. Interest paid on the 10.6% Debentures will be distributed to the holders of the 10.6% Preferred Securities. Distributions payable on the 10.6% Preferred Securities are recorded as interest expense in the consolidated statements of income. These 10.6% Debentures are unsecured, junior rank and are subordinate in right of payment to all senior debt of the Company. The 10.6% Preferred Securities are subject to mandatory redemption upon repayment of the 10.6% Debentures. We have the right, subject to events of default, to defer payments of interest on the 10.6% Debentures at any time by extending the interest payment period for a period not exceeding 10 consecutive semi-annual periods with respect to each deferral period, provided that no extension period may extend beyond the redemption or maturity date of the 10.6% Debentures. The 10.6% Debentures mature on September 7, 2030, which may be shortened by us to not earlier than September 7, 2010, if certain conditions are met, or at any time upon the occurrence and continuation of certain changes in either the tax treatment or the capital treatment of the Trust, the 10.6% Debentures or the 10.6% Preferred Securities.
In February 2001, the predecessor to the Company formed CenBank Statutory Trust II and completed an offering of $5.0 million 10.2% Cumulative Trust Preferred Securities, which are guaranteed by us. The Trust also issued common securities to the predecessor and used the net proceeds from the offering to purchase $5.2 million in principal amount of 10.2% Subordinated Debentures. Interest paid on the 10.2% Debentures will be distributed to the holders of the 10.2% Preferred Securities. Terms and conditions of the 10.2% Debentures are substantially similar to those as described under the CenBank Statutory Trust I. The 10.2% Debentures mature on February 22, 2031, which may be shortened by us to not earlier than February 22, 2011, if certain conditions are met, or at any time upon the occurrence and continuation of certain changes in either the tax treatment or the capital treatment of the Trust, the 10.2% Debentures or the 10.2% Preferred Securities.
In April 2004, the predecessor to the Company formed CenBank Statutory Trust III and completed an offering of $15.0 million LIBOR plus 2.65% Cumulative Trust Preferred Securities, which are guaranteed by us. The Trust also issued common securities to the predecessor and used the net proceeds from the offering to purchase $15.5 million in principal amount of floating rate Subordinated Debentures. Interest paid on the floating rate Debentures will be distributed to the holders of the floating rate Preferred Securities. Terms and conditions of the floating rate Debentures are substantially similar to those as described under the CenBank Statutory Trust I. The floating rate Debentures mature on April 15, 2034, which may be shortened by us to not earlier than April 15, 2009, if certain conditions are met, or at any time upon the occurrence and continuation of certain changes in either the tax treatment or the capital treatment of the Trust, the floating rate Debentures or the floating rate Preferred Securities.
63
Table of Contents
In June 2003, Guaranty Corporation formed Guaranty Capital Trust III and completed an offering of $10.0 million LIBOR plus 3.10% Cumulative Trust Preferred Securities, which are guaranteed by us. The Trust also issued common securities to Guaranty and used the net proceeds from the offering to purchase $10.3 million in principal amount of Junior Subordinated Debt Securities issued by Guaranty. We assumed Guaranty's obligations relating to such securities upon our acquisition of Guaranty. Interest paid on the debt securities will be distributed to the holders of the Preferred Securities. We have the right, subject to events of default, to defer payments of interest on the subordinated debt securities at any time by extending the interest payment period for a period not exceeding 20 consecutive quarterly periods with respect to each deferral period, provided that no extension period may extend beyond the redemption or maturity date of the subordinated debt securities. The subordinated debt securities mature on July 7, 2033. These securities were callable on July 7, 2008. The Company did not call these securities as these are variable rate securities that provide $10.0 million of additional Tier 1 capital. These securities remain callable at the end of each quarter. Management does not expect to call these securities in 2009.
For financial reporting purposes, the trusts were treated as our non-banking subsidiaries and consolidated in the consolidated financial statements prior to December 31, 2003. Since our adoption of FIN 46R on December 31, 2003, the trusts are treated as investments and not consolidated in the consolidated financial statements. Although the securities issued by each of the trusts are not included as a component of stockholders' equity in the consolidated balance sheets, the securities are treated as capital for regulatory purposes. Specifically, under applicable regulatory guidelines, the securities issued by the trusts qualify as Tier 1 capital up to a maximum of 25% of capital on an aggregate basis. Any amount that exceeds 25% qualifies as Tier 2 capital. At December 31, 2008, all of the trusts' securities outstanding qualified as Tier 1 capital. The Company's investment in the common stock of each trust is included in other assets on the consolidated balance sheets.
In March 2005, the Federal Reserve Board issued a final rule that continues to allow the inclusion of trust preferred securities in Tier 1 capital, but with stricter quantitative limits. Under the final rule, after a five-year transition period ending March 31, 2009, the aggregate amount of trust preferred securities and certain other capital elements would be limited to 25% of Tier 1 capital elements, net of goodwill, less any associated deferred tax liability. The amount of trust preferred securities and certain other elements in excess of the limit could be included in Tier 2 capital, subject to restrictions. The Company expects that the entire amount of its trust preferred securities will continue to be included as Tier 1 capital as of March 31, 2009, the first date the new regulations must be applied.
Other Borrowings
We have a revolving line of credit and several term notes with the FHLB of Topeka. At December 31, 2008, we had a balance of $166.4 million on the FHLB line compared to $47.3 million outstanding at December 31, 2007. The maximum credit allowance for future borrowings was $261.9 million and $316.2 million at December 31, 2008 and 2007, respectively, and includes term notes and the line of credit. The interest rate on the line of credit varies daily with the federal funds rate. The term notes have fixed interest rates that range from 2.52% to 6.22%, with a weighted average rate of 3.18%. We have executed a blanket pledge and security agreement with the Federal Home Loan Bank, which encompasses certain loans and securities as collateral for these borrowings.
Each advance with the Federal Home Loan Bank (FHLB) is payable at its maturity date, with a prepayment penalty if paid prior to maturity. At December 31, 2008, approximately $140 million of the FHLB fixed rate term notes with a weighted-average rate of 3.02% are convertible to floating rate on predetermined conversion dates at the discretion of the FHLB. If the bonds are converted by the FHLB, the Company has the option to prepay the advance without penalty. If the bonds are not converted by the FHLB, the bond becomes convertible quarterly thereafter, with the option to convert to floating rate continuing to be at the discretion of the FHLB. A $40 million fixed-rate bond with a
64
Table of Contents
rate of 3.17% is convertible quarterly with the next quarterly conversion option date of March 2, 2009. No other FHLB term bond has a conversion option available in 2009. The remaining $100 million of term notes with conversion options are layered with $40 million each having their first conversion option available in 2010 and 2011, and $20 million having its first conversion option in 2013.
As of December 31, 2008, we had a $20 million revolving credit agreement, as amended, with U.S. Bank National Association that contained financial covenants, including maintaining a minimum adjusted return (excludes goodwill impairment and intangible amortization) on average quarterly assets, a maximum nonperforming assets to total loans ratio, and regulatory capital ratios that qualify the Company as well-capitalized. As of December 31, 2008, we did not have an outstanding balance. At December 31, 2007, we had an outstanding balance of $15.2 million. At December 31, 2008, the Company was in compliance with all covenants except the minimum total risk-based capital amount. The minimum total risk-based capital amount was set by U.S. Bank and was based on the Company receiving additional capital from Treasury's Capital Purchase Program prior to December 31, 2008. As the Company's application to receive capital under Treasury's Capital Purchase Program was still pending as of December 31, 2008, the Company did not meet this financial covenant and voluntarily decided to terminate its line of credit with U.S. Bank in February 2009 to reduce the costs related to a non-use fee. The revolving credit agreement would have otherwise expired on March 31, 2009. As of December 31, 2008, the holding company had $3,595,000 of cash on hand. Based on cash flow projections for the holding company, we estimate that this cash is sufficient to meet the operating needs of the holding company.
CAPITAL
Current risk-based regulatory capital standards generally require banks and bank holding companies to maintain a ratio of "core" or "Tier 1" capital to total risk-weighted assets of at least 4%, a ratio of Tier 1 capital to total average assets (leverage ratio) of at least 4% and a ratio of total capital (which includes Tier 1 capital plus certain forms of subordinated debt, a portion of the allowance for loan and lease losses and preferred stock) to total risk-weighted assets of at least 8%. Total risk-weighted assets are calculated by multiplying the balance in each category of assets by a risk factor, which ranges from zero for cash assets and certain government obligations to 100% for high risk loans, and adding the products together.
Table 21
| | | | | | | | | | | | | | |
| | Ratio at
December 31,
2008 | | Ratio at
December 31,
2007 | | Minimum
Capital
Requirement | | Minimum
Requirement
for "Well
Capitalized"
Institution | |
|---|
Total Risk-Based Capital Ratio | | | | | | | | | | | | | |
| | Consolidated Guaranty Bancorp | | | 10.61 | % | | 10.87 | % | | 8.00 | % | | N/A | |
| | Guaranty Bank and Trust Company | | | 10.52 | % | | 10.55 | % | | 8.00 | % | | 10.00 | % |
| | Centennial Bank of the West(1) | | | N/A | | | 13.38 | % | | 8.00 | % | | 10.00 | % |
Tier 1 Risk Based Capital Ratio | | | | | | | | | | | | | |
| | Consolidated Guaranty Bancorp | | | 9.35 | % | | 9.62 | % | | 4.00 | % | | N/A | |
| | Guaranty Bank and Trust Company | | | 9.26 | % | | 9.35 | % | | 4.00 | % | | 6.00 | % |
| | Centennial Bank of the West(1) | | | N/A | | | 12.13 | % | | 4.00 | % | | 6.00 | % |
Leverage Ratio | | | | | | | | | | | | | |
| | Consolidated Guaranty Bancorp | | | 8.98 | % | | 8.55 | % | | 4.00 | % | | N/A | |
| | Guaranty Bank and Trust Company | | | 8.90 | % | | 8.82 | % | | 4.00 | % | | 5.00 | % |
| | Centennial Bank of the West(1) | | | N/A | | | 9.71 | % | | 4.00 | % | | 5.00 | % |
- (1)
- Centennial Bank of the West was merged into Guaranty Bank and Trust Company on January 1, 2008.
65
Table of Contents
The Company's total risk-based capital ratio declined to 10.61% at December 31, 2008 as compared to 10.87% at December 31, 2007. This decrease is primarily attributable to an increase to the provision for loan losses and an increase to total risk-weighted assets, primarily from an increase to loans, net of unearned discount.
On October 3, 2008, the Emergency Economic Stabilization Act of 2008 (EESA) was enacted, which provided up to $700 billion in funding for the financial services industry. The first phase of implementation of the EESA, also known as the Troubled Asset Relief Program (TARP), was the implementation of a $250 billion Treasury Capital Purchase Program. This program allows a qualifying institution to apply for up to three-percent of its total risk-weighted assets in capital, which will be in the form of non-cumulative perpetual preferred stock of the institution with a dividend rate of 5% until the fifth anniversary of the investment, and 9% thereafter. Treasury will also receive warrants for common stock of the institution equal to 15% of the capital invested. On January 15, 2009, the second $350 billion of TARP monies was released to the Treasury. The Company has applied for up to three-percent of its risk-weighted assets and is currently waiting to hear about the status of its application as of the filing date of this report.
LIQUIDITY
The Bank relies on deposits as its principal source of funds and, therefore, must be in a position to service depositors' needs as they arise. Fluctuations in the balances of a few large depositors may cause temporary increases and decreases in liquidity from time to time. We deal with such fluctuations by using existing liquidity sources.
Concerns over deposit fluctuations with respect to the overall banking industry were addressed by the FDIC in September and October 2008. The FDIC temporarily increased the individual account deposit insurance from $100,000 per account to $250,000 per account through December 31, 2009. The FDIC also implemented a Temporary Liquidity Guarantee Program, which provides for full FDIC coverage for transaction accounts, regardless of dollar amounts. The Bank elected to opt-in to this program, thus, our customers will receive full coverage for transaction accounts under the program.
Additionally, the Company has become a member of the Certificate of Deposit Account Registry Service (CDARS®) program. Through CDARS®, the Bank's customers can increase their FDIC insurance by up to $50 million through reciprocal certificate of deposit accounts. This is accomplished by the Bank entering into reciprocal depository relationships with other member banks. The individual customer's large deposit is broken into amounts below the $100,000 amount (or $250,000 if the time deposit matures prior to December 31, 2009) and placed with other banks that are members of the network. The reciprocal member bank issues certificate of deposits in amounts that ensure that the entire deposit is eligible for FDIC insurance.
When the level of liquid assets (our primary liquidity) does not meet our liquidity needs, other available sources of liquid assets (our secondary liquidity), including the purchase of federal funds, sales of securities under agreements to repurchase, purchase of brokered certificates of deposit, sales of loans, discount window borrowings from the Federal Reserve Bank, and our lines of credit with the Federal Home Loan Bank of Topeka (FHLB) are employed to meet current and presently anticipated funding needs. At December 31, 2008, the Company had approximately $261.9 million of availability on its FHLB line, $65 million of availability on its federal funds lines with correspondent banks, and $1.2 million of availability with the Federal Reserve discount window. The Company can also increase its amount of brokered deposits. However, if we would become less than well-capitalized under the capital adequacy guidelines, regulatory approval would have to obtained in order to continue purchasing brokered deposits. Additionally, as described above, the Company joined the CDARS® program and can purchase certificates of deposit through this program. At December 31, 2008, the Company is eligible to purchase certificates of deposit of up to five percent of its total assets through
66
Table of Contents
CDARS®. These sources provide significant secondary liquidity to the Company to service its depositors' needs.
The FDIC also implemented a Debt Guarantee Program where it guarantees all newly-issued senior unsecured debt up to prescribed limits by a participating bank on or after October 14, 2008 through and including June 30, 2009. The Company and its subsidiary bank elected to opt-in to this program, which would provide up to $38 million of additional unsecured senior debt to the Company and its subsidiary bank in the form of greater than 30 day term notes. As of December 31, 2008, no guaranteed senior unsecured debt had been issued by the Company.
The holding company relies on dividends from its Bank as a primary source of liquidity. We plan to continue to utilize the available dividends from the Bank for holding company operations, subject to regulatory and other restrictions. The ability of the Bank to pay dividends or make other capital distributions to the holding company is subject to the regulatory authority of the Federal Reserve Board and the Colorado Division of Banking. Because of the accumulated deficit at December 31, 2008 as a result of goodwill impairment charges in 2008 and 2007, the Bank is required to obtain permission from the Federal Reserve Board and the Colorado Division of Banking prior to making any dividend to the holding company. As the goodwill impairment charges did not have any impact on the Bank's liquidity, cash flows or regulatory capital, it is expected that permission will be granted if the Bank remains more than well-capitalized and if the payment of dividends is not deemed to be an unsafe or unsound practice. In 2008, the Bank requested and was granted permission from the two regulatory agencies to pay dividends of $19 million from the Bank to the Holding Company. The holding company requires liquidity for the payment of interest on the subordinated debentures, for operating expenses, principally salaries and benefits, for repurchases of our common stock, and, if declared by our board of directors, for the payment of dividends to our stockholders.
In February 2009, the holding company voluntarily decided to terminate its line of credit with U.S. Bank to reduce the costs related to a non-use fee, as the revolving credit agreement would have otherwise expired on March 31, 2009. As of December 31, 2008, the holding company had $3.6 million of cash on hand. Based on cash flow projections for the holding company, we estimate that this cash is sufficient to meet the operating needs of the holding company.
OFF BALANCE SHEET ARRANGEMENTS, COMMITMENTS, GUARANTEES, AND CONTRACTUAL OBLIGATIONS
Contractual Obligations
The following table sets forth our significant contractual obligations and off-balance sheet commitments at December 31, 2008:
Table 22
| | | | | | | | | | | | | | | | |
| | Payments Due by Period | |
|---|
| | Totals | | Less Than
1 Year | | 1 - 3 Years | | 4 - 5 Years | | Over 5
Years | |
|---|
| | (In thousands)
| |
|---|
Contractual Obligations | | | | | | | | | | | | | | | | |
Subordinated Debentures | | $ | 41,239 | | $ | — | | $ | — | | $ | — | | $ | 41,239 | |
Federal Home Loan Bank Obligations | | | 166,404 | | | 1,865 | | | 4,205 | | | 50,241 | | | 110,093 | |
Operating Lease Obligations | | | 18,756 | | | 3,143 | | | 6,151 | | | 4,578 | | | 4,884 | |
| | | | | | | | | | | | |
Totals | | $ | 226,399 | | $ | 5,008 | | $ | 10,356 | | $ | 54,819 | | $ | 156,216 | |
| | | | | | | | | | | | |
67
Table of Contents
| | | | | | | | | | | | | | | | |
| | Payments Due by Period | |
|---|
| | Totals | | Less Than
1 Year | | 1 - 3 Years | | 4 - 5 Years | | Over 5
Years | |
|---|
| | (In thousands)
| |
|---|
Off Balance Sheet Commitments | | | | | | | | | | | | | | | | |
Commitments to extend credit | | $ | 390,277 | | $ | 187,596 | | $ | 179,247 | | $ | 11,338 | | $ | 12,096 | |
Standby letters of credit | | | 24,792 | | | 399 | | | 24,227 | | | 166 | | | — | |
Commercial letters of credit | | | 11,000 | | | — | | | 11,000 | | | — | | | — | |
| | | | | | | | | | | | |
Totals | | $ | 426,069 | | $ | 187,995 | | $ | 214,474 | | $ | 11,504 | | $ | 12,096 | |
| | | | | | | | | | | | |
The amount of off-balance sheet commitments of $426.1 million at December 31, 2008 represents a $190.5 million decline from the amount of off-balance sheet commitments at December 31, 2007. Most of the decline has occurred in commitments of less than one year.
Of the $166.4 million of term advances at December 31, 2008 with the FHLB, approximately $140 million are convertible to floating rate on predetermined conversion dates at the discretion of the FHLB. If the bonds are converted by the FHLB, the Company has the option to prepay the advance without penalty. If the bonds are not converted by the FHLB, the bond becomes convertible quarterly thereafter, with the option to convert to a floating rate continuing to be at the discretion of the FHLB. A $40 million fixed-rate bond with a rate of 3.17% is convertible quarterly with the next quarterly conversion option date of March 2, 2009. No other FHLB term bond has a conversion option available in 2009. The remaining $100 million of term notes with conversion options are layered with $40 million each having their first conversion option available in 2010 and 2011 and $20 million having its first conversion option in 2013.
RECENTLY ISSUED ACCOUNTING PRONOUNCEMENTS
See Note 2 of the Notes to Consolidated Financial Statements contained in "Item 8. Financial Statements and Supplementary Data" for information on recent accounting pronouncements and their impact, if any, on our consolidated financial statements.
ITEM 7A. QUANTITATIVE AND QUALITATIVE DISCLOSURES ABOUT MARKET RISK
Market risk is the risk of loss in a financial instrument arising from adverse changes in market prices and rates, foreign currency exchange rates, commodity prices and equity prices. Our market risk arises primarily from interest rate risk inherent in our lending and deposit taking activities. To that end, management actively monitors and manages our interest rate risk exposure. We have not entered into any market risk sensitive instruments for trading purposes. We manage our interest rate sensitivity by matching the re-pricing opportunities on our earning assets to those on our funding liabilities. We use various asset/liability strategies to manage the re-pricing characteristics of our assets and liabilities designed to ensure that exposure to interest rate fluctuations is limited within our guidelines of acceptable levels of risk-taking. Balance sheet hedging strategies, including the terms and pricing of loans and deposits and managing the deployment of our securities, are used to reduce mismatches in interest rate re-pricing opportunities of portfolio assets and their funding sources.
Our Asset Liability Management Committee, or ALCO, addresses interest rate risk. The committee is composed of members of our senior management. The ALCO monitors interest rate risk by analyzing the potential impact on the net portfolio of equity value and net interest income from potential changes in interest rates, and considers the impact of alternative strategies or changes in balance sheet structure. The ALCO manages our balance sheet in part to maintain the potential impact on net portfolio value and net interest income within acceptable ranges despite changes in interest rates.
68
Table of Contents
Our exposure to interest rate risk is reviewed on at least a quarterly basis by the ALCO and our board of directors. Interest rate risk exposure is measured using interest rate sensitivity analysis to determine our change in net portfolio value and net interest income in the event of hypothetical changes in interest rates. If potential changes to net portfolio value and net interest income resulting from hypothetical interest rate changes are not within board-approved limits, the board may direct management to adjust the asset and liability mix to bring interest rate risk within board-approved limits.
We monitor and evaluate our interest rate risk position on a quarterly basis using net interest income simulation analysis under 100 and 200 basis point change scenarios (see below). Each of these analyses measures different interest rate risk factors inherent in the financial statements.
In 2008, this disclosure alternative was changed from prior year annual and quarterly reports filed by the Company, which used the Gap analysis disclosure method. The static gap analysis looked at the dollar amount of mismatches between assets and liabilities, at certain time periods, whose interest rates are subject to pricing at their contractual maturity date or repricing period. As this Gap analysis looked at contractual dates that assets and liabilities are subject to repricing, it caused the entire balance of interest-bearing NOW accounts, money market accounts and savings accounts to be treated as immediately repriceable. As our actual experience with repricing of these liabilities differed from the contractual maturities, management has chosen to disclose the sensitivity analysis alternative, which measures the impact on net interest income of hypothetical changes in interest rates. As discussed above, this tool is used internally by ALCO in monitoring interest rate risk of the Company and thus, the Company has chosen to change this disclosure alternative regarding market risk. Summarized comparable information, under the new disclosure method, is provided for the preceding year.
Net Interest Income Modeling
The Company's primary interest rate risk tool, the Net Interest Income Simulation Analysis, measures interest rate risk and the effect of interest rate changes on net interest income. This analysis incorporates all of the Company's assets and liabilities together with forecasted changes in the balance sheet and assumptions that reflect the current interest rate environment. Through these simulations, management estimates the impact on net interest income of a 100 and 200 basis point upward or downward change of market interest rates over a one year period. Assumptions are made to project rates for new loans and deposits based on historical analysis, management outlook and repricing strategies. Asset prepayments and other market risks are developed from industry estimates of prepayment speeds and other market changes. Since the results of these simulations can be significantly influenced by assumptions utilized, management evaluates the sensitivity of the simulation results to changes in assumptions.
69
Table of Contents
The following table shows the net interest income increase or decrease over the next twelve months as of December 31, 2008 and 2007:
Table 23
| | | | | | | |
| | Annualized Net Interest Income | |
|---|
| | December 31, 2008
Amount of Change | | December 31, 2007
Amount of Change | |
|---|
| | (In thousands)
| |
|---|
Change in rates (in basis points) | | | | | | | |
200 | | $ | 9,758 | | $ | 8,323 | |
100 | | | 4,628 | | | 4,193 | |
Static | | | — | | | — | |
(100) | | | 2,037 | | | (4,282 | ) |
(200) | | | 3,642 | | | (8,497 | ) |
Overall, the Company believes it is asset-sensitive, which is consistent with the decline in net interest income during 2008 as a result of lower rates. At December 31, 2008, the company is positioned to have a short-term favorable interest income impact in a rising rate environment as well as a falling rate environment. This is because of the extremely low rate environment at December 31, 2008. The prime rate has historically been set at a rate of 300 basis points over the target federal funds rate. The target federal funds rate is currently set by the FOMC at a rate between 0 and 25 basis points. The Company's interest rate risk modeling has an assumption that prime would continue to be set at a rate of 300 basis points over the target federal funds rate, therefore, a 200 basis point decline in overall rates would only have between a 0 and 25 basis point decline in both federal funds and the prime rate Further, other rates that are currently below 1% or 2% (e.g. U.S. Treasuries, LIBOR, etc.) are modeled to not fall below 0% with an overall 100 or 200 basis point decrease in rates. Many of our variable rate loans are set to an index tied to prime, federal funds or LIBOR, therefore, a further decrease in rates would not have a substantial impact on loan yields. Additionally, current deposit rates, especially time deposit rates, would continue to decrease in a falling rate environment. As a falling rate environment would potentially impact the cost of liabilities to a greater degree than earning assets for the above reasons, a falling rate environment is expected to have a favorable impact on net interest margin. However, if the actual prime rate falls below a 300 basis point spread to target federal funds rate, the Company could experience a continued decrease in net interest income as a result of falling yields on earning assets tied to prime.
At December 31, 2007, the Company had modeled a decrease in net interest income if rates fell either 100 or 200 basis points. In 2008, actual rates decreased by 400 basis points causing a larger decrease in net interest income in 2008.
70
Table of Contents
ITEM 8. FINANCIAL STATEMENTS AND SUPPLEMENTARY DATA
Index to Financial Statements
| | |
Guaranty Bancorp and Subsidiaries | | |
Management's Report On Internal Control Over Financial Reporting | |
72 |
Reports of Independent Registered Public Accounting Firms | |
73 |
Consolidated Balance Sheets at December 31, 2008 and 2007 | |
75 |
Consolidated Statements of Income (Loss), Years Ended December 31, 2008, 2007 and 2006 | |
76 |
Consolidated Statements of Changes in Stockholders' Equity and Comprehensive Income (Loss), Years Ended December 31, 2008, 2007 and 2006 | |
77 |
Consolidated Statements of Cash Flows, Years Ended December 31, 2008, 2007 and 2006 | |
78 |
Notes to Consolidated Financial Statements | |
79 |
71
Table of Contents
Management's Report On Internal Control Over Financial Reporting
The management of Guaranty Bancorp, including its consolidated subsidiary, is responsible for establishing and maintaining adequate internal control over financial reporting. The Company's internal control system was designed to provide reasonable assurance to the Company's management and Board of Directors regarding the preparation and fair presentation of published financial statements in accordance with U.S. generally accepted accounting principles. All internal control systems, no matter how well designed, have inherent limitations. Therefore, even those systems determined to be effective can provide only reasonable assurance with respect to financial statement preparation and presentation.
Management maintains a comprehensive system of controls intended to ensure that transactions are executed in accordance with management's authorization, assets are safeguarded, and financial records are reliable. Management also takes steps to see that information and communication flows are effective and to monitor performance, including performance of internal control procedures.
As of December 31, 2008, Guaranty Bancorp management assessed the effectiveness of the Company's internal control over financial reporting based on the framework established inInternal Control-Integrated Framework issued by the Committee of Sponsoring Organizations of the Treadway Commission (COSO). Based on this assessment, management has determined that the Company's internal control over financial reporting as of December 31, 2008, is effective.
Because of its inherent limitations, internal control over financial reporting may not prevent or detect misstatements should they occur. Also, projections of any evaluation of effectiveness to future periods are subject to the risk that controls may become inadequate because of changes in conditions, or that the degree or compliance with the control procedures may deteriorate.
Crowe Horwath LLP, the independent registered public accounting firm that audited the Company's consolidated financial statements for the years ended December 31, 2008 and 2007, included in this Annual Report on Form 10-K, has issued an attestation report on the Company's internal control over financial reporting as of December 31, 2008. The report, which expresses an unqualified opinion on the effectiveness of the Company's internal control over financial reporting as of December 31, 2008, is included in this Item under the heading "Report of Independent Registered Public Accounting Firm."
| | |
/s/ DANIEL M. QUINN
Daniel M. Quinn
President and Chief Executive Officer | | /s/ PAUL W. TAYLOR
Paul W. Taylor
Executive Vice President and
Chief Financial Officer |
February 11, 2009
72
Table of Contents
REPORT OF INDEPENDENT REGISTERED PUBLIC ACCOUNTING FIRM
Board of Directors and Stockholders
Guaranty Bancorp
Denver, Colorado
We have audited the accompanying consolidated balance sheets of Guaranty Bancorp as of December 31, 2008 and 2007, and the related consolidated statements of income (loss), changes in stockholders' equity and comprehensive income (loss), and cash flows for each of the years in the two-year period ended December 31, 2008. We also have audited Guaranty Bancorp's internal control over financial reporting as of December 31, 2008, based on criteria established in Internal Control—Integrated Framework issued by the Committee of Sponsoring Organizations of the Treadway Commission (COSO). Guaranty Bancorp's management is responsible for these financial statements, for maintaining effective internal control over financial reporting and for its assessment of the effectiveness of internal control over financial reporting included in the accompanying Management's Report on Internal Control Over Financial Reporting. Our responsibility is to express an opinion on these financial statements and an opinion on the effectiveness of the company's internal control over financial reporting based on our audits.
We conducted our audits in accordance with the standards of the Public Company Accounting Oversight Board (United States). Those standards require that we plan and perform the audits to obtain reasonable assurance about whether the financial statements are free of material misstatement and whether effective internal control over financial reporting was maintained in all material respects. Our audits of the financial statements included examining, on a test basis, evidence supporting the amounts and disclosures in the financial statements, assessing the accounting principles used and significant estimates made by management, and evaluating the overall financial statement presentation. Our audit of internal control over financial reporting included obtaining an understanding of internal control over financial reporting, assessing the risk that a material weakness exists, and testing and evaluating the design and operating effectiveness of internal control based on the assessed risk. Our audits also included performing such other procedures as we considered necessary in the circumstances. We believe that our audits provide a reasonable basis for our opinions.
A company's internal control over financial reporting is a process designed to provide reasonable assurance regarding the reliability of financial reporting and the preparation of financial statements for external purposes in accordance with generally accepted accounting principles. A company's internal control over financial reporting includes those policies and procedures that (1) pertain to the maintenance of records that, in reasonable detail, accurately and fairly reflect the transactions and dispositions of the assets of the company; (2) provide reasonable assurance that transactions are recorded as necessary to permit preparation of financial statements in accordance with generally accepted accounting principles, and that receipts and expenditures of the company are being made only in accordance with authorizations of management and directors of the company; and (3) provide reasonable assurance regarding prevention or timely detection of unauthorized acquisition, use, or disposition of the company's assets that could have a material effect on the financial statements.
Because of its inherent limitations, internal control over financial reporting may not prevent or detect misstatements. Also, projections of any evaluation of effectiveness to future periods are subject to the risk that controls may become inadequate because of changes in conditions, or that the degree of compliance with the policies or procedures may deteriorate.
In our opinion, the financial statements referred to above present fairly, in all material respects, the financial position of Guaranty Bancorp as of December 31, 2008 and 2007, and the results of its operations and its cash flows for each of the years in the two year-period ended December 31, 2008, in conformity with accounting principles generally accepted in the United States of America. Also, in our opinion, Guaranty Bancorp maintained, in all material respects, effective internal control over financial reporting as of December 31, 2008, based on criteria established in Internal Control—Integrated Framework issued by the Committee of Sponsoring Organizations of the Treadway Commission (COSO).
Sherman Oaks, California
February 12, 2009
73
Table of Contents
Report of Independent Registered Public Accounting Firm
The Board of Directors and Stockholders
Guaranty Bancorp:
We have audited the accompanying consolidated statements of income (loss), changes in stockholders' equity and comprehensive income (loss), and cash flows of Guaranty Bancorp (formerly, Centennial Bank Holdings, Inc.) and subsidiaries (the Company) for the year ended December 31, 2006. These consolidated financial statements are the responsibility of the Company's management. Our responsibility is to express an opinion on these consolidated financial statements based on our audit.
We conducted our audit in accordance with the standards of the Public Company Accounting Oversight Board (United States). Those standards require that we plan and perform the audit to obtain reasonable assurance about whether the financial statements are free of material misstatement. An audit includes examining, on a test basis, evidence supporting the amounts and disclosures in the financial statements. An audit also includes assessing the accounting principles used and significant estimates made by management, as well as evaluating the overall financial statement presentation. We believe that our audit provides a reasonable basis for our opinion.
In our opinion, the consolidated financial statements referred to above present fairly, in all material respects, the results of operations and the cash flows of Guaranty Bancorp and subsidiaries for the year ended December 31, 2006, in conformity with U.S. generally accepted accounting principles.
KPMG LLP
Denver, Colorado
March 23, 2007
74
Table of Contents
GUARANTY BANCORP AND SUBSIDIARIES
Consolidated Balance Sheets
December 31, 2008 and 2007
| | | | | | | | | | |
| | December 31,
2008 | | December 31,
2007 | |
|---|
| | (In thousands, except share
and per share data)
| |
|---|
Assets | | | | | | | |
Cash and due from banks | | $ | 32,189 | | $ | 51,611 | |
Federal funds sold | | | 13,522 | | | 745 | |
| | | | | | |
| | | | Cash and cash equivalents | | | 45,711 | | | 52,356 | |
| | | | | | |
Securities available for sale, at fair value | | | 102,874 | | | 118,964 | |
Securities held to maturity (fair value of $13,505 and $14,916 at December 31, 2008 and December 31, 2007) | | | 13,114 | | | 14,889 | |
Bank stocks, at cost | | | 28,276 | | | 32,464 | |
| | | | | | |
| | | | Total investments | | | 144,264 | | | 166,317 | |
| | | | | | |
Loans, net of unearned discount | | | 1,826,333 | | | 1,781,647 | |
| | Less allowance for loan losses | | | (44,988 | ) | | (25,711 | ) |
| | | | | | |
| | | | Net loans | | | 1,781,345 | | | 1,755,936 | |
| | | | | | |
Loans held for sale | | | 5,760 | | | 492 | |
Premises and equipment, net | | | 63,018 | | | 69,981 | |
Other real estate owned and foreclosed assets | | | 484 | | | 3,517 | |
Goodwill | | | — | | | 250,748 | |
Other intangible assets, net | | | 25,500 | | | 32,933 | |
Other assets | | | 36,659 | | | 39,384 | |
| | | | | | |
| | | | Total assets | | $ | 2,102,741 | | $ | 2,371,664 | |
| | | | | | |
Liabilities and Stockholders' Equity | | | | | | | |
Liabilities: | | | | | | | |
| | Deposits: | | | | | | | |
| | | Noninterest-bearing demand | | $ | 433,761 | | $ | 515,299 | |
| | | Interest-bearing demand | | | 460,856 | | | 732,156 | |
| | | Savings | | | 68,064 | | | 71,944 | |
| | | Time | | | 735,970 | | | 480,108 | |
| | | | | | |
| | | | Total deposits | | | 1,698,651 | | | 1,799,507 | |
| | | | | | |
Securities sold under agreements to repurchase and federal fund purchased | | | 21,781 | | | 23,617 | |
Borrowings | | | 166,404 | | | 63,715 | |
Subordinated debentures | | | 41,239 | | | 41,239 | |
Interest payable and other liabilities | | | 13,086 | | | 24,932 | |
| | | | | | |
| | | | Total liabilities | | | 1,941,161 | | | 1,953,010 | |
| | | | | | |
Commitments and Contingent Liabilities (Notes 14 and 15) | | | | | | | |
Stockholders' equity: | | | | | | | |
| | Common stock—$.001 par value; 100,000,000 shares authorized, 64,542,950 shares issued, 52,654,131 shares outstanding at December 31, 2008 (includes 1,420,345 shares of unvested restricted stock and 109,214 shares to be issued); 64,378,450 shares issued, 52,616,991 shares outstanding at December 31, 2007 (includes 1,651,345 shares of unvested restricted stock and 60,507 of shares to be issued). | | | 65 | | | 64 | |
| | Additional paid-in capital | | | 617,188 | | | 617,611 | |
| | Shares to be issued for deferred compensation obligations | | | 710 | | | 573 | |
| | Accumulated deficit | | | (352,003 | ) | | (95,196 | ) |
| | Accumulated other comprehensive loss | | | (1,302 | ) | | (1,472 | ) |
| | Treasury Stock, at cost, 10,966,513 and 10,983,653 shares, respectively | | | (103,078 | ) | | (102,926 | ) |
| | | | | | |
| | | | Total stockholders' equity | | | 161,580 | | | 418,654 | |
| | | | | | |
| | | | Total liabilities and stockholders' equity | | $ | 2,102,741 | | $ | 2,371,664 | |
| | | | | | |
See "Notes to Consolidated Financial Statements."
75
Table of Contents
GUARANTY BANCORP AND SUBSIDIARIES
Consolidated Statements of Income (Loss)
Years ended December 31, 2008, 2007 and 2006
| | | | | | | | | | | | |
| | Year Ended December 31, | |
|---|
| | 2008 | | 2007 | | 2006 | |
|---|
| | (In thousands, except share
and per share data)
| |
|---|
Interest income: | | | | | | | | | | |
| | Loans, including fees | | $ | 112,844 | | $ | 153,214 | | $ | 163,830 | |
| | Investment securities: | | | | | | | | | | |
| | | Taxable | | | 2,991 | | | 2,515 | | | 2,868 | |
| | | Tax-exempt | | | 3,404 | | | 5,193 | | | 4,869 | |
| | Dividends | | | 1,647 | | | 1,853 | | | 1,805 | |
| | Federal funds sold and other | | | 426 | | | 914 | | | 409 | |
| | | | | | | | |
| | | Total interest income | | | 121,312 | | | 163,689 | | | 173,781 | |
| | | | | | | | |
Interest expense: | | | | | | | | | | |
| | Deposits | | | 32,562 | | | 53,594 | | | 47,337 | |
| | Securities sold under agreement to repurchase and federal funds purchased | | | 527 | | | 1,390 | | | 1,274 | |
| | Borrowings | | | 5,333 | | | 2,700 | | | 5,307 | |
| | Subordinated debentures | | | 3,328 | | | 3,756 | | | 3,666 | |
| | | | | | | | |
| | | Total interest expense | | | 41,750 | | | 61,440 | | | 57,584 | |
| | | | | | | | |
| | | Net interest income | | | 79,562 | | | 102,249 | | | 116,197 | |
Provision for loan losses | | | 33,775 | | | 24,666 | | | 4,290 | |
| | | | | | | | |
| | | Net interest income, after provision for loan losses | | | 45,787 | | | 77,583 | | | 111,907 | |
Noninterest income: | | | | | | | | | | |
| | Customer service and other fees | | | 9,682 | | | 9,509 | | | 10,385 | |
| | Gain (loss) on sale of securities | | | 138 | | | — | | | (4 | ) |
| | Gain on sale of loans | | | — | | | — | | | 719 | |
| | Other | | | 800 | | | 1,187 | | | 1,617 | |
| | | | | | | | |
| | | Total noninterest income | | | 10,620 | | | 10,696 | | | 12,717 | |
Noninterest expense: | | | | | | | | | | |
| | Salaries and employee benefits | | | 31,086 | | | 39,179 | | | 46,185 | |
| | Occupancy expense | | | 7,815 | | | 7,813 | | | 7,977 | |
| | Furniture and equipment | | | 5,290 | | | 4,864 | | | 4,859 | |
| | Impairment of goodwill | | | 250,748 | | | 142,210 | | | — | |
| | Amortization of intangible assets | | | 7,433 | | | 8,666 | | | 11,815 | |
| | Other general and administrative | | | 17,284 | | | 23,824 | | | 20,072 | |
| | | | | | | | |
| | | Total noninterest expense | | | 319,656 | | | 226,556 | | | 90,908 | |
| | | | | | | | |
| | | Income (loss) before income taxes | | | (263,249 | ) | | (138,277 | ) | | 33,716 | |
Income tax expense (benefit) | | | (6,513 | ) | | (185 | ) | | 11,286 | |
| | | | | | | | |
| | | Income (loss) from continuing operations | | | (256,736 | ) | | (138,092 | ) | | 22,430 | |
Income from discontinued operations, net of tax | | | — | | | — | | | 1,988 | |
| | | | | | | | |
| | | Net income (loss) | | $ | (256,736 | ) | $ | (138,092 | ) | $ | 24,418 | |
| | | | | | | | |
Earnings (loss) per share—basic: | | | | | | | | | | |
| | Income (loss) from continuing operations | | $ | (5.03 | ) | $ | (2.60 | ) | $ | 0.39 | |
| | Income (loss) from discontinued operations, net of tax | | | — | | | — | | | 0.03 | |
| | Net income (loss) | | | (5.03 | ) | | (2.60 | ) | | 0.42 | |
Earnings (loss) per share—diluted: | | | | | | | | | | |
| | Income (loss) from continuing operations | | $ | (5.03 | ) | $ | (2.60 | ) | $ | 0.39 | |
| | Income (loss) from discontinued operations, net of tax | | | — | | | — | | | 0.03 | |
| | Net income (loss) | | | (5.03 | ) | | (2.60 | ) | | 0.42 | |
Weighted average shares outstanding—basic | | | 51,044,372 | | | 53,109,307 | | | 57,539,986 | |
Weighted average shares outstanding—diluted | | | 51,044,372 | | | 53,109,307 | | | 57,636,355 | |
See "Notes to Consolidated Financial Statements."
76
Table of Contents
GUARANTY BANCORP AND SUBSIDIARIES
Consolidated Statements of Changes in Stockholders' Equity and Comprehensive Income (Loss)
Years ended December 31, 2008, 2007 and 2006
| | | | | | | | | | | | | | | | | | | | | | | | |
| | Common
Stock
Shares
Outstanding | | Common
Stock and
Additional
Paid-in Capital | | Shares to
be Issued | | Treasury
Stock | | Retained
Earnings | | Accumulated
Other
Comprehensive
Income (Loss) | | Totals | |
|---|
| | (In thousands, except share data)
| |
|---|
Balance, December 31, 2005 | | | 60,403,764 | | $ | 612,152 | | $ | — | | $ | (31,975 | ) | $ | 18,478 | | $ | 93 | | $ | 598,748 | |
| | Comprehensive income: | | | | | | | | | | | | | | | | | | | | | | |
| | | Net income | | | — | | | — | | | — | | | — | | | 24,418 | | | — | | | 24,418 | |
| | | Other comprehensive income | | | — | | | — | | | — | | | — | | | — | | | 716 | | | 716 | |
| | | | | | | | | | | | | | | | | | | | | | |
| | | Total comprehensive income | | | | | | | | | | | | | | | | | | | | | 25,134 | |
| | Stock compensation awards, net of forfeitures | | | 479,992 | | | — | | | — | | | — | | | — | | | — | | | — | |
| | Earned stock award compensation | | | — | | | 2,899 | | | — | | | — | | | — | | | — | | | 2,899 | |
| | Repurchase of common stock | | | (3,724,500 | ) | | — | | | — | | | (37,599 | ) | | — | | | — | | | (37,599 | ) |
| | Deferred compensation | | | 77,539 | | | (500 | ) | | 775 | | | — | | | — | | | — | | | 275 | |
| | Tax effect of stock options exercised | | | — | | | 2 | | | — | | | — | | | — | | | — | | | 2 | |
| | | | | | | | | | | | | | | | |
Balance, December 31, 2006 | | | 57,236,795 | | | 614,553 | | | 775 | | | (69,574 | ) | | 42,896 | | | 809 | | | 589,459 | |
| | Comprehensive loss: | | | | | | | | | | | | | | | | | | | | | | |
| | | Net loss | | | — | | | — | | | — | | | — | | | (138,092 | ) | | — | | | (138,092 | ) |
| | | Other comprehensive loss | | | — | | | — | | | — | | | — | | | — | | | (2,281 | ) | | (2,281 | ) |
| | | | | | | | | | | | | | | | | | | | | | |
| | | Total comprehensive loss | | | | | | | | | | | | | | | | | | | | | (140,373 | ) |
| | Stock compensation awards, net of forfeitures | | | (13,267 | ) | | — | | | — | | | — | | | — | | | — | | | — | |
| | Earned stock award compensation | | | — | | | 2,871 | | | — | | | — | | | — | | | — | | | 2,871 | |
| | Repurchase of common stock | | | (4,618,438 | ) | | — | | | — | | | (33,386 | ) | | — | | | — | | | (33,386 | ) |
| | Deferred compensation | | | 11,901 | | | — | | | 83 | | | — | | | — | | | — | | | 83 | |
| | Common shares issued | | | — | | | 251 | | | (285 | ) | | 34 | | | — | | | — | | | — | |
| | | | | | | | | | | | | | | | |
Balance, December 31, 2007 | | | 52,616,991 | | �� | 617,675 | | | 573 | | | (102,926 | ) | | (95,196 | ) | | (1,472 | ) | | 418,654 | |
| | Cumulative adjustment to apply EITF 06-04 | | | | | | | | | | | | | | | (71 | ) | | | | | (71 | ) |
| | Comprehensive income: | | | | | | | | | | | | | | | | | | | | | | |
| | | Net loss | | | — | | | — | | | — | | | — | | | (256,736 | ) | | — | | | (256,736 | ) |
| | | Other comprehensive income | | | — | | | — | | | — | | | — | | | — | | | 170 | | | 170 | |
| | | | | | | | | | | | | | | | | | | | | | |
| | | Total comprehensive loss | | | | | | | | | | | | | | | | | | | | | (256,566 | ) |
| | Stock compensation awards, net of forfeitures | | | 24,232 | | | — | | | — | | | — | | | — | | | — | | | — | |
| | Earned stock award compensation, net | | | — | | | (422 | ) | | — | | | — | | | — | | | — | | | (422 | ) |
| | Repurchase of common stock | | | (39,354 | ) | | — | | | — | | | (179 | ) | | — | | | — | | | (179 | ) |
| | Deferred compensation | | | 52,262 | | | — | | | 164 | | | — | | | — | | | — | | | 164 | |
| | Common shares issued | | | — | | | — | | | (27 | ) | | 27 | | | — | | | — | | | — | |
| | | | | | | | | | | | | | | | |
Balance, December 31, 2008 | | | 52,654,131 | | $ | 617,253 | | $ | 710 | | $ | (103,078 | ) | $ | (352,003 | ) | $ | (1,302 | ) | $ | 161,580 | |
| | | | | | | | | | | | | | | | |
See "Notes to Consolidated Financial Statements."
77
Table of Contents
GUARANTY BANCORP AND SUBSIDIARIES
Consolidated Statements of Cash Flows
Years ended December 31, 2008, 2007 and 2006
| | | | | | | | | | | | | | | |
| | Year Ended December 31, | |
|---|
| | 2008 | | 2007 | | 2006 | |
|---|
| | (In thousands)
| |
|---|
Cash flows from operating activities: | | | | | | | | | | |
| | Net income (loss) | | $ | (256,736 | ) | $ | (138,092 | ) | $ | 24,418 | |
| | Adjustments to reconcile net income (loss) to net cash provided by operating activities: | | | | | | | | | | |
| | | | Depreciation and amortization | | | 11,848 | | | 12,914 | | | 18,107 | |
| | | | Provision for loan losses | | | 33,775 | | | 24,666 | | | 4,390 | |
| | | | Stock compensation, net | | | (422 | ) | | 2,871 | | | 2,899 | |
| | | | Loss (gain) on sale of securities | | | (138 | ) | | — | | | 4 | |
| | | | Loss (gain) on sale of real estate owned and assets | | | (26 | ) | | 269 | | | (329 | ) |
| | | | Real estate valuation adjustments | | | 1,484 | | | 203 | | | 910 | |
| | | | Impairment of assets from discontinued operations, net | | | — | | | — | | | (838 | ) |
| | | | Impairment of goodwill | | | 250,748 | | | 142,210 | | | — | |
| | | | Writedown of premises of equipment | | | 1,070 | | | — | | | — | |
| | | | Other | | | (33 | ) | | (886 | ) | | (1,575 | ) |
| | | | Proceeds from sales of loans held for sale | | | — | | | — | | | 58,128 | |
| | | | Originations of loans held for sale | | | — | | | — | | | (50,589 | ) |
| | | | Net change in: | | | | | | | | | | |
| | | | | Other assets | | | 3,526 | | | 1,756 | | | 139 | |
| | | | | Interest payable and other liabilities | | | (12,205 | ) | | (10,361 | ) | | (4,877 | ) |
| | | | | | | | |
| | | | | | Net cash provided by operating activities | | | 32,891 | | | 35,550 | | | 50,787 | |
| | | | | | | | |
Cash flows from investing activities: | | | | | | | | | | |
| | Activity in available-for-sale securities: | | | | | | | | | | |
| | | Sales, maturities, prepayments, and calls | | | 45,997 | | | 46,724 | | | 85,245 | |
| | | Purchases | | | (29,289 | ) | | (12,050 | ) | | (103,333 | ) |
| | Activity in held-to-maturity securities and bank stocks: | | | | | | | | | | |
| | | Maturities, prepayments, calls and redemption of bank stocks | | | 6,407 | | | 1,531 | | | 553 | |
| | | Purchases | | | — | | | (5,194 | ) | | (5,725 | ) |
| | Loan originations and principal collections, net | | | (68,178 | ) | | 103,190 | | | 108,319 | |
| | Proceeds from sale of loans held for sale | | | 492 | | | 31,459 | | | — | |
| | Proceeds from sales of other real estate owned and foreclosed assets | | | 3,705 | | | 1,424 | | | 5,689 | |
| | Proceeds from sales of premises and equipment | | | — | | | 933 | | | 9,238 | |
| | Proceeds from sale of assets held for sale | | | 2,462 | | | | | | | |
| | Additions to premises and equipment | | | (950 | ) | | (1,078 | ) | | (14,745 | ) |
| | Net cash and cash equivalents transferred in sale of subsidiary | | | — | | | — | | | (19,391 | ) |
| | | | | | | | |
| | | | | | Net cash provided (used) by investing activities | | | (39,354 | ) | | 166,939 | | | 65,850 | |
| | | | | | | | |
Cash flows from financing activities: | | | | | | | | | | |
| | Net decrease in deposits | | | (100,856 | ) | | (160,598 | ) | | (73,086 | ) |
| | Net change in short-term borrowings | | | (16,359 | ) | | (42,158 | ) | | (56,666 | ) |
| | Proceeds from issuance of long-term debt | | | 125,070 | | | 40,000 | | | — | |
| | Repayment of long-term debt | | | (6,022 | ) | | (1,759 | ) | | (5,877 | ) |
| | Net change in federal funds purchased and repurchase agreements | | | (1,836 | ) | | (1,852 | ) | | (10,597 | ) |
| | Repurchase of common stock | | | (179 | ) | | (33,386 | ) | | (37,854 | ) |
| | Costs associated with issuance of common stock | | | — | | | — | | | (1,750 | ) |
| | Tax benefit from vesting of stock compensation | | | — | | | — | | | 2 | |
| | | | | | | | |
| | | | | | Net cash provided (used) by financing activities | | | (182 | ) | | (199,753 | ) | | (185,828 | ) |
| | | | | | | | |
| | | | | | Net change in cash and cash equivalents | | | (6,645 | ) | | 2,736 | | | (69,191 | ) |
Cash and cash equivalents, beginning of year | | | 52,356 | | | 49,620 | | | 118,811 | |
| | | | | | | | |
Cash and cash equivalents, end of year | | $ | 45,711 | | $ | 52,356 | | $ | 49,620 | |
| | | | | | | | |
Supplemental disclosure of cash flow activity: | | | | | | | | | | |
| | Interest paid on deposits and borrowed funds | | $ | 41,945 | | $ | 62,416 | | $ | 58,232 | |
| | Income taxes paid | | | 3,371 | | | 8,398 | | | 18,393 | |
Supplemental disclosure of noncash activities: | | | | | | | | | | |
| | Loans transferred to other real estate owned and foreclosed assets | | | 2,789 | | | 4,125 | | | 6,170 | |
| | Loans transferred to loans held for sale | | | 5,760 | | | 31,951 | | | — | |
| | Premises and equipment transferred to assets held for sale | | | 2,418 | | | — | | | — | |
See "Notes to Consolidated Financial Statements."
78
Table of Contents
GUARANTY BANCORP AND SUBSIDIARIES
Notes to Consolidated Financial Statements
(1) Organization
Guaranty Bancorp (formerly Centennial Bank Holdings, Inc.) is a bank holding company registered under the Bank Holding Company Act of 1956, as amended. On May 6, 2008, the stockholders of the Company approved the proposal to change the name of the holding company from Centennial Bank Holdings, Inc. to Guaranty Bancorp. This name change was effective on May 12, 2008.
Our principal business is to serve as a holding company for our subsidiaries. As of December 31, 2008, Guaranty Bancorp has a single bank subsidiary, Guaranty Bank and Trust Company, referred to as Guaranty Bank or the Bank. At December 31, 2007, Guaranty Bancorp's subsidiaries were Guaranty Bank and Centennial Bank of the West, referred to as CBW. CBW was merged into Guaranty Bank on January 1, 2008.
At December 31, 2005, our subsidiaries were Guaranty Bank, CBW, Collegiate Peaks Bank, which was sold on November 1, 2006, and First MainStreet Insurance, Ltd., which was sold on March 1, 2006.
Reference to "Banks" means Guaranty Bank and CBW. Reference to "Bank" means Guaranty Bank after the merger of CBW and Guaranty Bank. Reference to "we" or "Company" means the Company on a consolidated basis with the Banks, Collegiate Peaks Bank and First MainStreet Insurance, as applicable. References to "Guaranty" or to the Holding Company refer to the parent company on a stand-alone basis.
(2) Summary of Significant Accounting Policies
- (a)
- Nature of Operations and Principles of Consolidation
The Bank is a full-service community bank offering an array of banking products and services to the communities it serves along the Front Range of Colorado, including accepting time and demand deposits and originating commercial loans (including energy loans), real estate loans, Small Business Administration guaranteed loans and consumer loans. The Bank also provides trust services, including personal trust administration, estate settlement, investment management accounts and self-directed IRAs. Substantially all loans are secured by specific items of collateral including business assets, consumer assets, and commercial and residential real estate. Commercial loans are expected to be repaid from cash flow from operations of businesses. There are no significant concentrations of loans to any one industry or customer. However, the customers' ability to repay their loans is dependent on the real estate and general economic conditions of the area, among other factors.
All significant intercompany transactions and balances are eliminated in consolidation.
The financial position and results of operations of Collegiate Peaks Bank have been segregated as discontinued operations in the 2006 statement of income. Collegiate Peaks Bank was sold as of November 1, 2006.
The accounting and reporting policies of the Company conform to generally accepted accounting principles in the United States of America.
- (b)
- Use of Estimates
The preparation of the consolidated financial statements in conformity with U.S. generally accepted accounting principles requires management to make estimates and assumptions that affect the reported amounts of assets and liabilities as of the dates of the consolidated balance sheet and
79
Table of Contents
GUARANTY BANCORP AND SUBSIDIARIES
Notes to Consolidated Financial Statements (Continued)
(2) Summary of Significant Accounting Policies (Continued)
income and expense for the periods presented. Actual results could differ significantly from those estimates. Material estimates that are particularly susceptible to significant changes include the assessment for impairment of certain investment securities, the allowance for loan losses, deferred tax assets and liabilities, impairment of goodwill and other intangible assets, stock compensation expense and other real estate owned. Assumptions and factors used in the estimates are evaluated on an annual basis or whenever events or changes in circumstance indicate that the previous assumptions and factors have changed. The result of the analysis could result in adjustments to the estimates.
- (c)
- Cash Flows
Cash and cash equivalents on the Company's consolidated balance sheets include cash, balances due from banks and federal funds sold that have an original maturity of three months or less. Interest-bearing deposits in other financial institutions mature within one year and are carried at cost. The Company's 2006 statement of cash flows includes cash activity of the Company's wholly owned subsidiary, Collegiate Peaks, which was classified as held for sale from its acquisition on December 31, 2004 through its sale on November 1, 2006. Net cash flows are reported for customer loan and deposit transactions, interest bearing deposits in other financial institutions, borrowings, federal funds purchased and repurchase agreements and sales of subsidiaries.
- (d)
- Securities
We determine the classification of securities at the time of purchase. If we have the positive intent and the ability at the time of purchase to hold debt securities until maturity, they are classified as held-to-maturity. Debt securities held-to-maturity are carried at amortized cost. Securities to be held for indefinite periods of time, but not necessarily to be held-to-maturity, are classified as available-for-sale and carried at fair value with unrealized gains or losses reported as a separate component of stockholders' equity in accumulated other comprehensive income (loss), net of applicable income taxes. Purchase premiums and discounts are recognized in interest income using the level-yield method over the terms of the securities. Gains and losses on the sale of securities are recorded on the trade date and are determined using the specific identification method. If a decline in the fair value of a security below its amortized cost is judged by management to be an other-than-temporary loss, the cost basis of the security is written down to fair value and the amount of the write-down is included in operations. In estimating other-than-
temporary losses, management considers: the length of time and extent that fair value has been less than cost, the financial condition and near term prospects of the issuer, and the Company's ability and intent to hold the security for a period sufficient to allow for any anticipated recovery in fair value.
- (e)
- Loans Held for Sale
Loans held for sale are carried at the lower of aggregate cost, net of discounts or premiums and a valuation allowance, or estimated fair market value. Estimated fair market value is determined using forward commitments to sell loans to permanent investors, or current market rates for loans of similar quality and type. Net unrealized losses, if any, are recognized in a valuation allowance by charges to earnings. Statement of Financial Accounting Standards (SFAS) No. 91,Accounting for Nonrefundable Fees and Costs Associated with Originating or Acquiring Loans and Initial Direct Costs of Leases, requires discounts or premiums on loans held for sale be
80
Table of Contents
GUARANTY BANCORP AND SUBSIDIARIES
Notes to Consolidated Financial Statements (Continued)
(2) Summary of Significant Accounting Policies (Continued)
deferred until the related loan is sold. Loans held for sale consist of certain classified loans and are generally secured by real estate. Loans held for sale are sold with servicing rights released.
Loans are considered sold when the Company surrenders control over the transferred assets to the purchaser, with standard representations and warranties. At such time, the loan is removed from the loan portfolio and a gain or loss is recorded on the sale. Gains and losses on loan sales are determined based on the difference between the carrying value of the assets sold, the estimated fair value of any assets or liabilities that are newly created as a result of the transaction, and the proceeds from the sale. Losses related to asset quality are recorded against the allowance for valuation losses at the time the loss is probable and quantifiable and charged to earnings.
- (f)
- Loans
The Company extends real estate, commercial, agricultural and consumer loans to customers. A substantial portion of the loan portfolio is represented by real estate and commercial loans throughout the Front Range of Colorado. The ability of the Company's borrowers to honor their contracts is dependent upon the real estate and general economic conditions of Colorado, among other factors.
Loans that management has the intent and ability to hold for the foreseeable future or until maturity or pay-off are reported at their outstanding unpaid principal balances, adjusted for charge-offs, the allowance for loan losses, and any deferred fees or costs on originated loans. Loans acquired in business combinations that have evidence of credit deterioration are recorded at the present value of expected amounts of principal and interest to be received, i.e., fair value. After acquisition, incurred losses are recognized in the allowance for loan losses.
Interest income is accrued on the unpaid principal balance. Loan origination fees, net of direct origination costs, are deferred and recognized as an adjustment of the related loan yield using the interest method without anticipating prepayments.
The accrual of interest on loans is discontinued at the time the loan is 90 days delinquent unless the credit is well secured and in process of collection. Past due status is based on the contractual terms of the loan. In all cases, loans are placed on nonaccrual or charged-off at an earlier date if collection of principal or interest is considered doubtful.
The interest on nonaccrual loans is accounted for on the cash-basis method, until qualifying for a return to the accrual basis of accounting. Loans are returned to accrual status when all the principal and interest amounts contractually due are brought current and future payments are reasonably assured.
- (g)
- Allowance for Loan Losses
The allowance for loan losses is a valuation allowance for probable incurred loan losses. The allowance for loan losses is reported as a reduction of outstanding loan balances.
The allowance for loan losses is evaluated on a regular basis by management and is based upon management's periodic review of the collectability of the loans in light of historical experience, the nature and volume of the loan portfolio, adverse situations that may affect borrowers' ability to repay, estimated value of any underlying collateral and prevailing economic conditions. This evaluation is inherently subjective as it requires estimates that are susceptible to
81
Table of Contents
GUARANTY BANCORP AND SUBSIDIARIES
Notes to Consolidated Financial Statements (Continued)
(2) Summary of Significant Accounting Policies (Continued)
significant revision as more information becomes available. An allowance for loan losses is maintained at a level deemed appropriate by management to adequately provide for known and inherent risks in the loan portfolio and other extensions of credit.
Loans that are deemed to be uncollectible are charged off and deducted from the allowance. The provision for loan losses and recoveries on loans previously charged off are added to the allowance.
The allowance consists of specific and general components. The specific component relates to loans that are individually classified as impaired. The general component covers all other loans and is based on historical loss experience adjusted for current factors. A loan is considered impaired when, based on current information and events, it is probable that the Company will be unable to collect the scheduled payments of principal or interest when due according to the contractual terms of the loan agreement. Factors considered by management in determining impairment include payment status and the probability of collecting scheduled principal and interest payments when due. Loans that experience insignificant payment delays and payment shortfalls generally are not classified as impaired.
Management determines the significance of payment delays and payment shortfalls on a case-by-case basis, taking into consideration all of the circumstances surrounding the loan and the borrower, including the length of the delay, the reasons for the delay, the borrower's prior payment record, and the amount of the shortfall in relation to the principal and interest owed. The allocated allowance for impaired loans is measured on a loan-by-loan basis for commercial, real estate and agricultural loans by either the present value of expected future cash flows discounted at the loan's effective interest rate, the loan's obtainable market price, or the fair value of the collateral if the loan is collateral dependent. Groups of smaller balance homogenous loans are collectively evaluated for impairment.
In addition to the allowance for loan losses, the Company records a reserve for unfunded commitments. Similar to the allowance for loan losses, the reserve for unfunded commitments is evaluated on a regular basis by management. This reserve is recorded in other liabilities and the provision for unfunded commitments is included in other noninterest expense.
- (h)
- Transfers of Financial Assets
Transfers of financial assets are accounted for as sales, when control over the assets has been relinquished. Control over transferred assets is deemed to be surrendered when the assets have been isolated from the Company, the transferee obtains the right (free of conditions that constrain it from taking advantage of that right) to pledge or exchange the transferred assets, and the Company does not maintain effective control over the transferred assets through an agreement to repurchase them before their maturity.
- (i)
- Other Real Estate Owned and Foreclosed Assets
Assets acquired through or instead of loan foreclosure are initially recorded at fair value less costs to sell when acquired, establishing a new cost basis. If fair value declines subsequent to foreclosure, a valuation allowance is recorded through expense. Operating revenues and expenses of such assets and reductions in the fair value of the assets are included in noninterest expense. Gains and losses on their disposition are included in noninterest income.
82
Table of Contents
GUARANTY BANCORP AND SUBSIDIARIES
Notes to Consolidated Financial Statements (Continued)
(2) Summary of Significant Accounting Policies (Continued)
- (j)
- Premises and Equipment
Land is carried at cost. Buildings, equipment and software are carried at cost, less accumulated depreciation and amortization computed on the straight-line method over the useful lives of the assets. Leasehold improvements are depreciated over the shorter of their estimated useful life or the lease term. Buildings and leasehold improvements carry an estimated useful life of five to forty years and equipment and software carry an estimated useful life of one to fifteen years. Repairs and maintenance are charged to noninterest expense as incurred.
- (k)
- Bank Stocks
The Bank is a member of the Federal Home Loan Bank (FHLB) system. Members are required to own a certain amount of stock based on the level of borrowings and other factors, and may invest in additional amounts. The Bank also owns Federal Reserve Bank (FRB) stock and Banker's Bank of the West (BBOW) stock. FHLB, FRB and BBOW stock is carried at cost, classified as a restricted security, and periodically reviewed for impairment based on ultimate recovery of par value. Both cash and stock dividends are reported as income.
- (l)
- Goodwill and Other Intangible Assets
Goodwill represents the excess of cost over the fair value of the net assets of businesses acquired. Goodwill and intangible assets acquired in a business combination and determined to have an indefinite useful life are tested for impairment and not amortized. Intangible assets with definite useful lives are amortized over their estimated useful lives to their estimated residual values.
Prior to the complete write-off of goodwill in 2008, goodwill was our only intangible asset with an indefinite life. The annual impairment analysis of goodwill included identification of reporting units, the determination of the carrying value of each reporting unit, including the existing goodwill and intangible assets, and the estimation of the fair value of each reporting unit. We identified one significant reporting unit—banking operations. The Company tested for impairment of goodwill annually as of October 31, or if an event occurred or circumstances changed that more likely than not reduced the fair value of the reporting unit. In the goodwill impairment test, we determine the fair value of our reporting unit and compare it to its carrying amount. If the carrying amount of a reporting unit exceeds its fair value, we are required to perform a second step to the impairment test to measure the extent of the impairment.
The second step of the goodwill impairment test is performed to determine the amount of the goodwill impairment, if any. Step two required us to compute the implied fair value of the reporting unit goodwill and compare it against the actual carrying amount of the reporting unit goodwill. The implied fair value of the reporting unit goodwill was determined in the same manner that goodwill recognized in a business combination is determined. That is, the fair value of the reporting unit was allocated to all of the individual assets and liabilities of the reporting unit, including any unrecognized identifiable intangible assets, as if the reporting unit had been acquired in a business combination and the fair value of the reporting unit determined in the first step was the price paid to acquire the reporting unit. The allocation process is only performed for purposes of testing goodwill for impairment, as the other assets and liabilities are not written up or down, nor is any additional unrecognized identifiable asset recorded as part of this process.
83
Table of Contents
GUARANTY BANCORP AND SUBSIDIARIES
Notes to Consolidated Financial Statements (Continued)
(2) Summary of Significant Accounting Policies (Continued)
Core deposit intangible assets, referred to as CDI, are recognized apart from goodwill at the time of acquisition based on valuations prepared by independent third parties or other estimates of fair value. In preparing such valuations, variables such as deposit servicing costs, attrition rates, and market discount rates are considered. CDI assets are amortized to expense over their useful lives, which we have estimated to range from 7 years to 15 years.
- (l)
- Impairment of Long-Lived Assets
Long-lived assets, such as premises and equipment, and definite-lived intangible assets subject to amortization, are reviewed for impairment whenever events or changes in circumstances indicate that the carrying value of an asset may not be recoverable. Recoverability of assets to be held and used is measured by a comparison of the carrying value of the asset to the estimated undiscounted future cash flows expected to be generated by the asset. If the carrying value of an asset exceeds its estimated undiscounted future cash flows, an impairment charge is recognized by the amount by which the carrying value of the asset exceeds the fair value of the asset, less costs to sell.
Assets to be disposed of are separately presented in the balance sheet and reported at the lower of the carrying value or fair value less costs to sell, and are no longer depreciated. The assets and liabilities of a disposal group classified as held for sale are presented separately in the appropriate asset and liability sections of the consolidated balance sheet. The gain or loss from a disposal group are recorded as discontinued operations on the statement of income.
- (m)
- Loan Commitments and Related Financial Instruments
Financial instruments include off-balance sheet credit instruments, such as commitments to make loans and commercial letters of credit, issued to meet customer financing needs. The face amount for these items represents the exposure to loss, before considering customer collateral or ability to repay. Such financial instruments are recorded when they are funded.
- (n)
- Stock Incentive Plan
The Company's Amended and Restated 2005 Stock Incentive Plan ("Plan") provides for up to 2,500,000 grants of stock options, stock awards, stock units awards, performance stock awards, stock appreciation rights, and other equity-based awards to key employees, nonemployee directors, consultants and prospective employees. As of December 31, 2008, the Company has only granted stock awards. The Company accounts for the equity-based compensation using the provisions of Statement of Financial Accounting Standards ("SFAS") No. 123R,Share-Based Payment. The Company recognizes stock compensation cost for services received in a share-based payment transaction over the required service period, generally defined as the vesting period. For awards with graded vesting, compensation cost is recognized on a straight-line basis over the requisite service period for the entire award. The compensation cost of employee and director services received in exchange for stock awards is based on the grant-date fair value of the award (as determined by quoted market prices). Stock compensation expense recognized reflects estimated forfeitures, adjusted as necessary for actual forfeitures. The Company has issued stock awards that vest based on service periods from one to four years, and stock awards that vest based on performance conditions. The maximum contractual term for the performance-based share awards is December 31, 2012. At the end of 2008, none of the performance-based restricted stock awards were expected to vest prior to the end of the contractual term. Should this expectation change, additional expense could be recorded in future periods.
84
Table of Contents
GUARANTY BANCORP AND SUBSIDIARIES
Notes to Consolidated Financial Statements (Continued)
(2) Summary of Significant Accounting Policies (Continued)
- (o)
- Company-Owned Life Insurance
The Company has life insurance policies on certain key executives. At December 31, 2008 and 2007, the carrying value of the company-owned life insurance polices was $13,640,000 and $13,230,000 million, respectively, which is included in other assets on the Consolidated Balance Sheets. In accordance with EITF 06-05,Accounting for Purchases of Life Insurance—Determining the Amount that Could be Realized in Accordance with FASB Technical Bulletin No. 85-4 (Accounting for Purchases of Life Insurance) ("EITF 06-5"), Company owned life insurance is recorded at the amount that can be realized under the insurance contract at the balance sheet date, which is the cash surrender value adjusted for other charges or other amounts due that are probable at settlement.
- (p)
- Deferred Compensation Plans
The Company has Deferred Compensation Plans (the "Plans") that allow directors and certain key employees to voluntarily defer compensation. Compensation expense is recorded for the deferred compensation and a related liability is recognized. Participants may elect designated investment options for the notional investment of their deferred compensation. The recorded obligations are adjusted for deemed income or loss related to the investments selected. Participants in the 2005 Deferred Compensation Plan (2005 Plan) are given the opportunity to elect to have all or a portion of their deferred compensation earn a rate of return equal to the total return on the Company's common stock. The 2005 Plan does not provide for diversification of a participant's assets allocated to Company common stock and assets allocated to Company common stock can only be settled with a fixed number of shares of stock. In accordance with Emerging Issues Task Force Issue 97-14,Accounting for Deferred Compensation Arrangements Where Amounts Earned Are Held in a Rabbi Trust and Invested, the deferred compensation obligation associated with Company common stock is classified as a component of stockholders' equity and the related shares are treated as shares to be issued and are included in total shares outstanding. At December 31, 2008 and 2007, there were 109,214 and 60,507 shares, respectively, to be issued included in total shares outstanding. Subsequent changes in the fair value of the common stock are not reflected in operations or stockholders' equity of the Company. Actual Company common stock held by the Company for the satisfaction of obligations of the 2005 Plan is classified as treasury stock.
- (q)
- Income Taxes
Income tax expense is the total of the current year income tax due or refundable and the change in deferred tax assets and liabilities. Deferred tax assets and liabilities are recognized for the future tax consequences attributable to differences between the financial statement carrying amounts of existing assets and liabilities and their respective tax bases and operating loss and tax credit carryforwards. Deferred tax assets and liabilities are measured using enacted tax rates expected to apply to taxable income in the years in which those temporary differences are expected to be recovered or settled. The effect on deferred tax assets and liabilities of a change in tax rates is recognized in income in the period that includes the enactment date.
At December 31, 2008 and 2007, the Company did not have any tax benefit disallowed under FASB Interpretation 48,Accounting for Uncertainty in Income Taxes ("FIN 48"). A tax position is recognized as a benefit only if it is "more likely than not" that the tax position would be sustained in a tax examination, with a tax examination being presumed to occur. The amount recognized is
85
Table of Contents
GUARANTY BANCORP AND SUBSIDIARIES
Notes to Consolidated Financial Statements (Continued)
(2) Summary of Significant Accounting Policies (Continued)
the largest amount of tax benefit that is greater than 50% likely of being realized on examination. For tax positions not meeting the "more likely than not" test, no tax benefit is recorded.
The Company recognizes interest related to income tax matters as interest expense and penalties related to income tax matter as other noninterest expense.
- (r)
- Segments of an Enterprise and Related Information
The Company operates as one segment. The operating information used by the Company's chief executive officer for purposes of assessing performance and making operating decisions about the Company is the consolidated financial statements presented in this report. For the year ended 2008, the Company had one active operating subsidiary, Guaranty Bank and Trust Company. For the years ended 2007 and 2006, the Company had two active operating subsidiaries, Centennial Bank of the West and Guaranty Bank and Trust Company. The Company applies the provisions of SFAS No. 131,Disclosures about Segments of an Enterprise and Related Information, in determining its reportable segments and related disclosures. The Company has determined that banking is its one reportable business segment. The Company's nonbanking subsidiary, which was sold in 2006, did not meet the 10% threshold for disclosure as an operating segment under SFAS No. 131.
- (s)
- Earnings (loss) per Common Share
Basic earnings (loss) per share represents income (loss) available to common stockholders divided by the weighted average number of common shares outstanding during the period. Diluted earnings (loss) per share reflect additional common shares that would have been outstanding if potential dilutive common shares had been issued. In accordance with SFAS No. 128 (As Amended),Earnings per Share, the Company's obligation to issue shares of stock to participants in its deferred compensation plan has been treated as outstanding shares of stock in the basic earnings per share calculation. Dilutive common shares that may be issued by the Company relate to unvested common share grants subject to a service condition for the years ended December 31, 2008, 2007 and 2006. Earnings (loss) per common share have been computed based on the following:
| | | | | | | | | | |
| | Year Ended December 31, | |
|---|
| | 2008 | | 2007 | | 2006 | |
|---|
Average common shares outstanding | | | 51,044,372 | | | 53,109,307 | | | 57,539,986 | |
Effect of dilutive unvested stock grants(1) | | | — | | | — | | | 96,369 | |
| | | | | | | | |
Average shares outstanding and calculated diluted earnings per common share | | | 51,044,372 | | | 53,109,307 | | | 57,636,355 | |
| | | | | | | | |
- (1)
- Impact of unvested stock grants is antidilutive in 2007 and 2008 due to the net loss for those years.
- (t)
- Other Comprehensive Income (Loss)
Accounting principles require that recognized revenue, expenses, gains and losses be included in net income. Although certain changes in assets and liabilities, such as unrealized gains and losses on available-for-sale securities, are reported as a separate component of the equity section
86
Table of Contents
GUARANTY BANCORP AND SUBSIDIARIES
Notes to Consolidated Financial Statements (Continued)
(2) Summary of Significant Accounting Policies (Continued)
of the balance sheet, such items, along with net income (loss), are components of comprehensive income (loss).
The entire balance of other comprehensive income (loss) at December 31, 2008, 2007 and 2006 was due to unrealized gains (losses) on securities available for sale.
Following are the components of other accumulated comprehensive income (loss) and related tax effects for the periods indicated:
| | | | | | | | | | | | |
| | Year Ended December 31, | |
|---|
| | 2008 | | 2007 | | 2006 | |
|---|
| | (In thousands)
| |
|---|
Net income (loss) | | $ | (256,736 | ) | $ | (138,092 | ) | $ | 24,418 | |
Other comprehensive loss: | | | | | | | | | | |
| | Change in net unrealized gains (losses), net | | | 414 | | | (3,684 | ) | | 1,384 | |
| | Less: Reclassification adjustments for losses (gains) included in income | | | (138 | ) | | — | | | 4 | |
| | | | | | | | |
| | Net unrealized holding gains (losses) | | | 276 | | | (3,684 | ) | | 1,388 | |
| | | Income tax benefit (expense) | | | (106 | ) | | 1,403 | | | (672 | ) |
| | | | | | | | |
| | Other comprehensive income (loss) | | | 170 | | | (2,281 | ) | | 716 | |
| | | | | | | | |
Total comprehensive income (loss) | | $ | (256,566 | ) | $ | (140,373 | ) | $ | 25,134 | |
| | | | | | | | |
Cash on hand or on deposit with the Federal Reserve Bank was required to meet regulatory reserve and clearing requirements. The clearing requirement was $500,000 at December 31, 2008 and 2007. At December 31, 2008 and 2007, there was no reserve requirement. These balances do not earn interest.
- (v)
- Dividend Restriction
Banking regulations require maintaining certain capital levels and may limit the dividends paid by the Bank to the holding company or by the holding company to stockholders.
- (w)
- Fair Value of Financial Instruments
Fair value of financial instruments are estimated using relevant market information and other assumptions, as more fully disclosed in a separate note. Fair value estimates involve uncertainties and matters of significant judgment regarding interest rates, credit risk, prepayments, and other factors, especially in the absence of broad markets for particular items. Changes in assumptions or in market conditions could significantly affect the estimates.
- (x)
- Loss Contingencies
Loss contingencies, including claims and legal actions arising in the ordinary course of business, are recorded as liabilities when the likelihood of a loss is probable and an amount or range of loss can be reasonably estimated. Loss contingencies at December 31, 2008 and 2007 are more fully disclosed in note 15 to the consolidated financial statements.
87
Table of Contents
GUARANTY BANCORP AND SUBSIDIARIES
Notes to Consolidated Financial Statements (Continued)
(2) Summary of Significant Accounting Policies (Continued)
- (y)
- Recently Issued Accounting Standards
Adoption of New Accounting Standards: In September 2006, the FASB issued Statement No. 157,Fair Value Measurements. This Statement defines fair value, establishes a framework for measuring fair value and expands disclosures about fair value measurements. This Statement establishes a fair value hierarchy about the assumptions used to measure fair value and clarifies assumptions about risk and the effect of a restriction on the sale or use of an asset. The standard is effective for fiscal years beginning after November 15, 2007. The impact of adoption in 2008 did not have a material impact on the Company's consolidated financial position or results of operations. In February 2008, the FASB issued Staff Position (FSP) 157-2,Effective Date of FASB Statement No. 157. This FSP delays the effective date of FAS 157 for all nonfinancial assets and nonfinancial liabilities, except those that are recognized or disclosed at fair value on a recurring basis (at least annually) to fiscal years beginning after November 15, 2008, and interim periods within those fiscal years. The impact of adoption was not material. In October 2008, the FASB issued Staff Position (FSP) 157-3,Determining the Fair Value of a Financial Asset when the Market for That Asset Is Not Active. This FSP clarifies the application of FAS 157 in a market that is not active. The impact of adoption was not material.
In February 2007, the FASB issued Statement No. 159,The Fair Value Option for Financial Assets and Financial Liabilities. The standard provides companies with an option to report selected financial assets and liabilities at fair value and establishes presentation and disclosure requirements designed to facilitate comparisons between companies that choose different measurement attributes for similar types of assets and liabilities. The new standard became effective for the Company on January 1, 2008. The Company did not elect the fair value option for any financial assets or financial liabilities as of January 1, 2008.
In September 2006, the FASB Emerging Issues Task Force finalized Issue No. 06-4,Accounting for Deferred Compensation and Postretirement Benefit Aspects of Endorsement Split-Dollar Life Insurance Arrangements. This issue requires that a liability be recorded during the service period when a split-dollar life insurance agreement continues after participants' employment or retirement. The required accrued liability will be based on either the post-employment benefit cost for the continuing life insurance or based on the future death benefit depending on the contractual terms of the underlying agreement. This issue is effective for fiscal years beginning after December 15, 2007. Upon adoption of this issue on January 1, 2008, the Company recognized a cumulative effect adjustment to reduce beginning retained earnings as of January 1, 2008 by $71,000.
On November 5, 2007, the SEC issued Staff Accounting Bulletin No. 109,Written Loan Commitments Recorded at Fair Value through Earnings ("SAB 109"). Previously, SAB 105,Application of Accounting Principles to Loan Commitments, stated that in measuring the fair value of a derivative loan commitment, a company should not incorporate the expected net future cash flows related to the associated servicing of the loan. SAB 109 supersedes SAB 105 and indicates that the expected net future cash flows related to the associated servicing of the loan should be included in measuring fair value for all written loan commitments that are accounted for at fair value through earnings. SAB 105 also indicated that internally-developed intangible assets should not be recorded as part of the fair value of a derivative loan commitment, and SAB 109 retains that view. SAB 109 is effective for derivative loan commitments issued or modified in fiscal
88
Table of Contents
GUARANTY BANCORP AND SUBSIDIARIES
Notes to Consolidated Financial Statements (Continued)
(2) Summary of Significant Accounting Policies (Continued)
quarters beginning after December 15, 2007. The impact of adoption in 2008 did not have a material impact on the Company's consolidated financial position or results of operations.
On September 12, 2008, The FASB issued Staff Position FSP No. FAS 133-1 and FIN 45-4,Disclosures and Credit Derivatives and Certain Guarantees: An Amendment of FASB Statement No. 133 and FASB Interpretation No. 45; and Clarification of the Effective Date of FASB Statement No. 161 (Issued September 12, 2008). This FSP is intended to improve disclosures about credit derivatives by requiring more information about the potential adverse effects of changes in credit risk on the financial position, financial performance, and cash flows of the sellers of credit derivatives. It amends FAS 133,Accounting for Derivative Instruments and Hedging Activities, to require disclosures by sellers of credit derivatives, including credit derivatives embedded in hybrid instruments. The FSP also amends FIN 45,Guarantor's Accounting and Disclosure Requirements for Guarantees, Including Indirect Guarantees of Indebtedness to Others, to require an additional disclosure about the current status of the payment/performance risk of a guarantee. This amendment of FIN 45 reflects the FASB Board's belief that instruments with similar risks should have similar disclosures. This FSP amended paragraph 13(a) of FIN 45 to require that the "current status (that is, as of the date of the statement of financial position) of the payment performance risk of the guarantee" be disclosed. The provisions that amend FAS 133 and FIN 45 are effective for reporting periods (annual or interim) ending after November 15, 2008. The adoption of the FSP did not have a material impact on the Company's consolidated financial position, results of operations or cash flows.
On December 11, 2008 the FASB issued Staff Position (FSP) 140-4 and FIN 46(R)-8, Disclosures by Public Entities about Transfers of Financial Assets and Interests in Variable Interest Entities. The FSP requires additional disclosure regarding Transfers of Financial Assets and Variable Interest Entities. The FSP became effective for the first interim or annual reporting period ending after December 15, 2008. As the Company does not have any variable interests in Variable Interest Entities, and does not securitize its loans or other financial assets the FSP did not have an impact on the Company's consolidated financial position, results of operations or cash flows, or our footnote disclosures.
Effect of Newly Issued But Not Yet Effective Accounting Standards:
In December 2007, the FASB issued Statement No. 141R, (revised 2007)Business Combinations ("SFAS 141R"). SFAS 141R replaces the current standard on business combinations and has significantly changed the accounting for and reporting of business combinations in consolidated financial statements. This statement requires an entity to measure the business acquired at fair value and to recognize goodwill attributable to any noncontrolling interests (previously referred to as minority interests) rather than just the portion attributable to the acquirer. The statement will also result in fewer exceptions to the principle of measuring assets acquired and liabilities assumed in a business combination at fair value. In addition, the statement requires payments to third parties for consulting, legal, audit, and similar services associated with an acquisition to be recognized as expenses when incurred rather than capitalized as part of the business combination. SFAS 141R is effective for fiscal years beginning on or after December 15, 2008.
89
Table of Contents
GUARANTY BANCORP AND SUBSIDIARIES
Notes to Consolidated Financial Statements (Continued)
(2) Summary of Significant Accounting Policies (Continued)
In March 2008, the FASB issued Statement No. 161,Disclosures about Derivative Instruments and Hedging Activities an Amendment of FASB Statement No. 133 ("SFAS 161"). SFAS 161 amends Statement 133 by requiring expanded disclosures about an entity's derivative instruments and hedging activities, but does not change Statement 133's scope or accounting. This statement requires increased qualitative, quantitative, and credit-risk disclosures. SFAS 161 also amends Statement No. 107 to clarify that derivative instruments are subject to Statement 107's concentration-of-credit-risk disclosures. SFAS 161 is effective for fiscal years beginning on or after November 15, 2008. As the Company did not have any derivatives or hedging activities as of December 31, 2008, the adoption of SFAS 161 in 2009 did not have a material impact on the Company's consolidated financial position, results of operations or cash flows.
In June 2008, the FASB issued Staff Position No. EITF 03-6-1,Determining Whether Instruments Granted in Share-Based Payment Transactions Are Participating Securities ("FSP EITF 03-6-1"). The FSP addresses whether instruments granted in share-based payment transactions are participating securities prior to vesting and, therefore, need to be included in the earnings allocation in computing EPS under the two-class method. The FSP affects entities that accrue cash dividends on share-based payment awards during the awards' service period when the dividends do not need to be returned if the employees forfeit the awards. FSP EITF 03-6-1 is effective for fiscal years beginning after December 15, 2008. The Company does not accrue cash dividends, therefore, the adoption of FSP EITF 03-6-1 in 2009 did not have a material impact on the Company's consolidated financial position, results of operations or cash flows.
In September 2008, FASB Emerging Issues Task Force issued Issue No. 08-5,Issuer's Accounting for Liabilities Measured at Fair Value With a Third-Party Credit Enhancement. The Task Force reached a consensus that an issuer of a liability with a third-party credit enhancement that is inseparable from the liability must treat the liability and the credit enhancement as two units of accounting. Under the consensus, the fair value measurement of the liability does not include the effect of the third-party credit enhancement; therefore, changes in the issuer's credit standing without the support of the credit enhancement affect the fair value measurement of the issuer's liability. Entities will need to provide disclosures about the existence of any third-party credit enhancements related to their liabilities that are within the scope of this Issue (i.e., that are measured at fair value). The consensus is effective beginning in the first reporting period on or after December 15, 2008. Entities must apply this Issue prospectively, with the effect of initial application included in the change in fair value of the liability in the period of adoption. The adoption of EITF 08-5 in 2009 did not have a material impact on the Company's consolidated financial position, results of operations or cash flows.
- (z)
- Reclassifications
Certain reclassifications of prior year balances have been made to conform to the current year presentation. These reclassifications had no impact on the Company's consolidated financial position, results of operations or net change in cash and cash equivalents.
90
Table of Contents
GUARANTY BANCORP AND SUBSIDIARIES
Notes to Consolidated Financial Statements (Continued)
(3) Securities
The amortized cost and estimated fair value of securities are as follows:
| | | | | | | | | | | | | | | |
| | Amortized cost | | Gross
unrealized
gains | | Gross
unrealized
losses | | Fair value | |
|---|
|
|
(In thousands)
December 31, 2008 |
|
|---|
Securities available for sale: | | | | | | | | | | | | | |
| | U.S. Treasury securities | | $ | 3,494 | | $ | 1 | | $ | — | | $ | 3,495 | |
| | U.S. government agencies and government-sponsored entities | | | 2,493 | | | 17 | | | — | | | 2,510 | |
| | State and municipal | | | 65,395 | | | 456 | | | (2,836 | ) | | 63,015 | |
| | Mortgage-backed | | | 31,706 | | | 299 | | | (40 | ) | | 31,965 | |
| | Marketable equity | | | 1,345 | | | — | | | — | | | 1,345 | |
| | Other securities | | | 544 | | | — | | | — | | | 544 | |
| | | | | | | | | | |
| | | Securities available-for-sale | | $ | 104,977 | | $ | 773 | | $ | (2,876 | ) | $ | 102,874 | |
| | | | | | | | | | |
Securities held to maturity: | | | | | | | | | | | | | |
| | Mortgage-backed | | $ | 13,114 | | $ | 391 | | $ | — | | $ | 13,505 | |
| | | | | | | | | | |
| | | | | | | | | | | | | | | |
| | December 31, 2007 | |
|---|
Securities available for sale: | | | | | | | | | | | | | |
| | U.S. government agencies and government-sponsored entities | | $ | 10,453 | | $ | 13 | | $ | (10 | ) | $ | 10,456 | |
| | State and municipal | | | 79,164 | | | 607 | | | (2,895 | ) | | 76,876 | |
| | Mortgage-backed | | | 30,132 | | | 108 | | | (202 | ) | | 30,038 | |
| | Marketable equity | | | 1,047 | | | — | | | — | | | 1,047 | |
| | Other securities | | | 547 | | | — | | | — | | | 547 | |
| | | | | | | | | | |
| | | Securities available-for-sale | | $ | 121,343 | | $ | 728 | | $ | (3,107 | ) | $ | 118,964 | |
| | | | | | | | | | |
Securities held to maturity: | | | | | | | | | | | | | |
| | Mortgage-backed | | $ | 14,889 | | $ | 93 | | $ | (66 | ) | $ | 14,916 | |
| | | | | | | | | | |
The amortized cost and estimated fair value of available for sale debt securities by contractual maturity at December 31, 2008 are shown below. Expected maturities will differ from contractual
91
Table of Contents
GUARANTY BANCORP AND SUBSIDIARIES
Notes to Consolidated Financial Statements (Continued)
(3) Securities (Continued)
maturities because borrowers may have the right to prepay obligations with or without prepayment penalties.
| | | | | | | | | | |
| | Available for sale (AFS) | |
|---|
| | Amortized cost | | Fair value | |
|---|
| | (In thousands)
| |
|---|
Debt securities available for sale: | | | | | | | |
| | | Due in one year or less | | $ | 5,576 | | $ | 5,600 | |
| | | Due after one year through five years | | | 14,366 | | | 14,581 | |
| | | Due after five years through ten years | | | 3,192 | | | 3,239 | |
| | | Due after ten years | | | 48,248 | | | 45,600 | |
| | | | | | |
| | | | Total AFS excluding MBS, marketable equity and other securities | | | 71,382 | | | 69,020 | |
| | Mortgage-backed securities, marketable equity and other securities | | | 33,595 | | | 33,854 | |
| | | | | | |
| | | | Total available for sale | | $ | 104,977 | | $ | 102,874 | |
| | | | | | |
| | | | | | | | |
| | Held to maturity | |
|---|
| | Amortized cost | | Fair value | |
|---|
| | (In thousands)
| |
|---|
Securities held to maturity: | | | | | | | |
| | Mortgage-backed securities | | $ | 13,114 | | $ | 13,505 | |
| | | | | | |
The following table presents the fair value and the unrealized loss on securities that were temporarily impaired and the length of time the individual securities have been in a continuous unrealized loss position as of December 31, 2008:
| | | | | | | | | | | | | | | | | | | | |
| | Less than 12 months | | 12 months or more | | Total | |
|---|
| | Fair value | | Unrealized
losses | | Fair
value | | Unrealized
losses | | Fair
value | | Unrealized
losses | |
|---|
| | (In thousands)
| |
|---|
Description of securities: | | | | | | | | | | | | | | | | | | | |
| | State and municipal | | $ | 2,670 | | $ | (23 | ) | $ | 35,897 | | $ | (2,813 | ) | $ | 38,567 | | $ | (2,836 | ) |
| | Mortgage-backed | | | 4,348 | | | (40 | ) | | — | | | — | | | 4,348 | | | (40 | ) |
| | | | | | | | | | | | | | |
| | Total temporarily impaired | | $ | 7,018 | | $ | (63 | ) | $ | 35,897 | | $ | (2,813 | ) | $ | 42,915 | | $ | (2,876 | ) |
| | | | | | | | | | | | | | |
All individual securities that have been in a continuous unrealized loss position for 12 months or longer at December 31, 2008 have fluctuated in value since their purchase dates as a result of changes in market interest rates. These securities include securities issued by U.S. government agencies and government-sponsored entities that have an AAA credit rating as determined by various rating agencies or state and municipal bonds that have either been rated as investment grade or higher by various rating agencies or have been subject to an annual internal review process by management. This annual review process considers a review of the issuers' current financial statements, including the related cash flows and interest payments. We concluded that the continuous unrealized loss positions on these securities is a result of the level of market interest rates and not a result of the underlying issuers'
92
Table of Contents
GUARANTY BANCORP AND SUBSIDIARIES
Notes to Consolidated Financial Statements (Continued)
(3) Securities (Continued)
ability to repay. In addition, we have the ability and intent to hold these securities until their fair value recovers to their cost. The fair value of these debt securities is expected to recover as the bonds approach maturity. Accordingly, we have not recognized any other-than-temporary impairment in our consolidated statements of income.
At December 31, 2008, there was a security of a single issuer with a book value of $38,710,000, which exceeded 10% of stockholders' equity. This security is a hospital revenue bond, funded by revenues from a hospital within the Company's footprint. This amortizing tax-exempt bond carries an interest rate of 4.75% and a maturity of December 1, 2031. At December 31, 2008, the bond had an unrealized loss of approximately $2.8 million, or 7.3% of book value. In addition to its annual review of nonrated municipal bonds completed in the fourth quarter 2008, the Company reviews the financial statements of the hospital quarterly. To date, the bond has paid principal and interest in accordance with its contractual terms. At December 31, 2007, there were no holdings of securities of any one issuer, other than the U.S. Government and its agencies, in an amount greater than 10% of stockholders' equity.
The following table presents the fair value and the unrealized loss on securities that were temporarily impaired as of December 31, 2007:
| | | | | | | | | | | | | | | | | | | | |
| | Less than 12 months | | 12 months or more | | Total | |
|---|
| | Fair value | | Unrealized
losses | | Fair
value | | Unrealized
losses | | Fair
value | | Unrealized
losses | |
|---|
| | (In thousands)
| |
|---|
Description of securities: | | | | | | | | | | | | | | | | | | | |
| | U.S. government agencies | | $ | 7,981 | | $ | (10 | ) | $ | — | | $ | — | | $ | 7,981 | | $ | (10 | ) |
| | State and municipal | | | 4,456 | | | (22 | ) | | 37,081 | | | (2,873 | ) | | 41,537 | | | (2,895 | ) |
| | Mortgage-backed | | | 1,528 | | | (2 | ) | | 20,667 | | | (266 | ) | | 22,195 | | | (268 | ) |
| | | | | | | | | | | | | | |
| | Total temporarily impaired | | $ | 13,965 | | $ | (34 | ) | $ | 57,748 | | $ | (3,139 | ) | $ | 71,713 | | $ | (3,173 | ) |
| | | | | | | | | | | | | | |
Sales of available for sale securities were as follows:
| | | | | | | | | | |
| | Year Ended December 31, | |
|---|
| | 2008 | | 2007 | | 2006 | |
|---|
| | (In thousands)
| |
|---|
Proceeds | | $ | 24,902 | | $ | 1,440 | | $ | 181 | |
Gross Gains | | | 179 | | | 1 | | | — | |
Gross Losses | | | (41 | ) | | (1 | ) | | (4 | ) |
The tax expense/benefit recorded related to the realized gain/losses on sale of securities was not material during 2008, 2007 and 2006, respectively.
Investment securities with carrying values of $74,436,000 and $90,613,000 were pledged at December 31, 2008 and 2007, respectively, as collateral for public deposits and for other purposes as required or permitted by law.
93
Table of Contents
GUARANTY BANCORP AND SUBSIDIARIES
Notes to Consolidated Financial Statements (Continued)
(4) Bank Stocks
The Company, through its subsidiary bank, is a member of both the Federal Reserve Bank of Kansas City and the Federal Home Loan Bank of Topeka, and is required to maintain an investment in the capital stock of each. The Federal Reserve, Federal Home Loan Bank and other bank stock are restricted in that they can only be redeemed by the issuer at par value. The Company's investment at December 31 was as follows:
| | | | | | | |
| | 2008 | | 2007 | |
|---|
| | (In thousands)
| |
|---|
Federal Reserve Bank of Kansas City | | $ | 13,768 | | $ | 18,395 | |
Federal Home Loan Bank of Topeka | | | 13,747 | | | 13,307 | |
Other bank stocks securities | | | 761 | | | 762 | |
| | | | | | |
Totals | | $ | 28,276 | | $ | 32,464 | |
| | | | | | |
The investments in bank stocks are reviewed by management quarterly for potential other-than-
temporary-impairment. This quarterly review considers the credit quality of the institution, the institution's ability to repurchase shares and for the other bank stocks, the Company's carrying value in the shares relative to the share's book value. Based on each of these reviews, Management concluded that there was no other-than-temporary-impairment during 2008 or 2007.
(5) Loans
A summary of the balances of loans at December 31 follows:
| | | | | | | | | |
| | 2008 | | 2007 | |
|---|
| | (In thousands)
| |
|---|
Loans on real estate: | | | | | | | |
| | Residential and commercial | | $ | 680,030 | | $ | 713,478 | |
| | Construction | | | 268,306 | | | 235,236 | |
| | Equity lines of credit | | | 50,270 | | | 48,624 | |
Commercial loans | | | 746,241 | | | 679,717 | |
Agricultural loans | | | 22,738 | | | 39,506 | |
Lease financing | | | 3,549 | | | 4,732 | |
Installment loans to individuals | | | 38,352 | | | 40,835 | |
Overdrafts | | | 855 | | | 1,329 | |
SBA and other | | | 19,592 | | | 21,592 | |
| | | | | | |
| | $ | 1,829,933 | | $ | 1,785,049 | |
Less: | | | | | | | |
| | Allowance for loan losses | | | (44,988 | ) | | (25,711 | ) |
| | Unearned discount | | | (3,600 | ) | | (3,402 | ) |
| | | | | | |
| | | Net Loans | | $ | 1,781,345 | | $ | 1,755,936 | |
| | | | | | |
94
Table of Contents
GUARANTY BANCORP AND SUBSIDIARIES
Notes to Consolidated Financial Statements (Continued)
(5) Loans (Continued)
Activity in the allowance for loan losses is as follows:
| | | | | | | | | | | |
| | Year Ended December 31, | |
|---|
| | 2008 | | 2007 | | 2006 | |
|---|
| | (In thousands)
| |
|---|
Balance, beginning of period | | $ | 25,711 | | $ | 27,899 | | $ | 27,475 | |
| | Provision for loan losses(1) | | | 33,775 | | | 24,666 | | | 4,597 | |
| | Loans charged off | | | (16,227 | ) | | (28,973 | ) | | (5,927 | ) |
| | Recoveries on loans previously charged-off | | | 1,729 | | | 2,119 | | | 1,754 | |
| | | | | | | | |
| | Balance, end of period | | $ | 44,988 | | $ | 25,711 | | $ | 27,899 | |
| | | | | | | | |
- (1)
- The provision for loan losses noted in the consolidated statements of income (loss) for the year ended December 31, 2006, includes a provision for loan losses of $4,597,000 and a recovery on the reserve for unfunded commitments of $307,000 presented below.
A summary of transactions in the reserve for unfunded commitments for the periods indicated is as follows:
| | | | | | | | | | | |
| | Year Ended December 31, | |
|---|
| | 2008 | | 2007 | | 2006 | |
|---|
| | (In thousands)
| |
|---|
Balance, beginning of period | | $ | 522 | | $ | 411 | | $ | 718 | |
| | Provision (credit) for losses on unfunded commitments | | | (299 | ) | | 111 | | | (307 | ) |
| | | | | | | | |
| | Balance, end of period | | $ | 223 | | $ | 522 | | $ | 411 | |
| | | | | | | | |
The following is a summary of information pertaining to impaired loans at December 31:
| | | | | | | | |
| | 2008 | | 2007 | |
|---|
| | (In thousands)
| |
|---|
Impaired loans with a valuation allowance | | $ | 42,191 | | $ | 16,663 | |
Impaired loans without a valuation allowance | | | 12,631 | | | 6,665 | |
| | | | | | |
| | Total impaired loans | | $ | 54,822 | | $ | 23,328 | |
| | | | | | |
Valuation allowance related to impaired loans | | $ | 11,064 | | $ | 4,283 | |
| | | | | | |
The following is a summary of nonaccrual loans and loans past due 90 days still on accrual status:
| | | | | | | |
| | 2008 | | 2007 | |
|---|
| | (In thousands)
| |
|---|
Nonaccrual loans | | $ | 54,594 | | $ | 19,309 | |
Loans past due over 90 days still on accrual | | $ | 228 | | $ | 527 | |
95
Table of Contents
GUARANTY BANCORP AND SUBSIDIARIES
Notes to Consolidated Financial Statements (Continued)
(5) Loans (Continued)
The following is a summary of interest recognized and cash-basis interest earned on impaired loans:
| | | | | | | | | | |
| | Year Ended December 31, | |
|---|
| | 2008 | | 2007 | | 2006 | |
|---|
| | (In thousands)
| |
|---|
Average of individually impaired loans during year | | $ | 36,773 | | $ | 35,160 | | $ | 42,660 | |
Interest income recognized during impairment | | $ | 147 | | $ | 1,410 | | $ | 350 | |
Cash-basis interest income recognized | | $ | 147 | | $ | 1,146 | | $ | 315 | |
The gross interest income that would have been recorded in the period that ended if the nonaccrual loans had been current in accordance with their original terms and had been outstanding throughout the period or since origination, if held for part of the period for December 31, 2008 and 2007 was $4,522,000 and $2,446,000, respectively.
(6) Premises and Equipment
A summary of the cost and accumulated depreciation and amortization of premises and equipment at December 31 is as follows:
| | | | | | | | |
| | 2008 | | 2007 | |
|---|
| | (In thousands)
| |
|---|
Land | | $ | 13,693 | | $ | 13,693 | |
Buildings | | | 45,033 | | | 48,023 | |
Leasehold improvements | | | 5,917 | | | 7,023 | |
Equipment and software | | | 17,012 | | | 16,283 | |
Leasehold interest in land | | | 684 | | | 684 | |
Construction in progress | | | — | | | 309 | |
| | | | | | |
| | Subtotal | | $ | 82,339 | | $ | 86,015 | |
Accumulated depreciation and amortization | | | (19,321 | ) | | (16,034 | ) |
| | | | | | |
| | Total premises and equipment | | $ | 63,018 | | $ | 69,981 | |
| | | | | | |
Depreciation expense for the years ended December 31, 2008, 2007 and 2006 was approximately $4,300,000, $4,200,000 and $4,500,000, respectively. Such amounts are classified in occupancy and furniture and equipment expense.
The construction in progress at December 31, 2007 represents signage. The signage was placed in service in February 2008.
96
Table of Contents
GUARANTY BANCORP AND SUBSIDIARIES
Notes to Consolidated Financial Statements (Continued)
(6) Premises and Equipment (Continued)
Operating Leases: Pursuant to the terms of non-cancelable lease agreements in effect at December 31, 2008 pertaining to banking premises, future minimum rent commitments under various operating leases are as follows (in thousands):
| | | | |
2009 | | $ | 3,143 | |
2010 | | | 3,098 | |
2011 | | | 3,053 | |
2012 | | | 2,490 | |
2013 | | | 2,088 | |
Thereafter | | | 4,884 | |
| | | | |
| | $ | 18,756 | |
| | | | |
Certain leases contain options to extend the lease terms for five to twenty one years. The cost of such rentals is not included in the above rental commitments. Rent expense for the years ended December 31, 2008, 2007 and 2006 was $3,458,000, $3,391,000 and $3,280,000, respectively.
(7) Goodwill
Changes in the carrying amount of the Company's goodwill for the years ended December 31, 2008 and 2007 were as follows (in thousands):
| | | | | |
Balance as of December 31, 2006 | | $ | 392,958 | |
| | Impairment | | | (142,210 | ) |
| | | | |
Balance as of December 31, 2007 | | $ | 250,748 | |
| | Impairment | | | (250,748 | ) |
| | | | |
Balance as of December 31, 2008 | | $ | — | |
| | | | |
Goodwill for the Company's single reporting unit is tested annually for impairment, unless an event occurs or circumstances change that would more likely than not reduce the fair value of the reporting unit.
In accordance with paragraph 28 of SFAS No. 142 Goodwill and Other Intangible Assets, one of the criteria to determine if an impairment test is necessary prior to the annual testing date is an adverse change in the business climate. Due to the uncertainty in the interest rate environment, continued softness in the real estate market, the recent market volatility of the financial services industry and the overall impact of these factors on the Company, management determined that the Company's single reporting unit was operating under an adverse business climate as of September 30, 2008. Furthermore, management believed that the adverse business climate made it more likely than not that the fair value of the reporting unit had fallen below its carrying value. As a result, the Company completed its 2008 goodwill impairment test as of September 30, 2008 instead of its normal annual testing date of October 31. The method for estimating the value of the reporting unit included a weighted average of the discounted cash flows method and the guideline change of control transactions method updated for recent economic conditions affecting the Company's markets and the overall financial services industry, including the continued softness in the real estate market. At the completion
97
Table of Contents
GUARANTY BANCORP AND SUBSIDIARIES
Notes to Consolidated Financial Statements (Continued)
(7) Goodwill (Continued)
of the Company's analysis it was determined that there was goodwill impairment of the remainder of our goodwill, or $250,748,000.
For the October 31, 2007 testing date, it was determined that the carrying value of the reporting unit was lower than the fair value of the reporting unit. The lower value in 2007 is attributable to lower market valuations for banking institutions in the latter part of 2007, the weakening of the credit market in the second half of 2007 and the decline in real estate values, particularly in Northern Colorado. The method for estimating the value of the reporting unit included a weighted average of the discounted cash flows method and the guideline change of control transactions method. The amount of the 2007 goodwill impairment was $142,210,000.
(8) Other Intangible Assets
Intangible assets with a finite life are recorded on our balance sheets. These intangible assets were capitalized as a result of past acquisitions and are being amortized over their estimated useful lives. At December 31, 2008 and 2007, the only such asset on the Company's balance sheet is the core deposits, which were tested for impairment during 2008 and 2007 as part of the goodwill impairment test, and no impairment was deemed necessary.
A summary of the core deposit intangible asset and the accumulated amortization is below:
| | | | | | | | | |
| | Useful life | | December 31,
2008 | | December 31,
2007 | |
|---|
| |
| | (In thousands)
| |
|---|
Core deposit intangible assets | | 7 - 15 years | | | 62,975 | | | 62,975 | |
Accumulated amortization | | | | | (37,475 | ) | | (30,042 | ) |
| | | | | | | | |
Other intangible assets, net | | | | $ | 25,500 | | $ | 32,933 | |
| | | | | | | | |
Amortization expense for the years ended December 31, 2008, 2007 and 2006 was $7,433,000, $8,666,000, and $11,815,000, respectively. Estimated amortization expense for the next five years, and thereafter, is as follows (amounts in thousands):
| | | | | |
| | Total | |
|---|
Fiscal year ending: | | | | |
| | 2009 | | $ | 6,277 | |
| | 2010 | | | 5,169 | |
| | 2011 | | | 4,091 | |
| | 2012 | | | 3,033 | |
| | 2013 | | | 2,566 | |
| | Thereafter | | | 4,364 | |
| | | | |
| | $ | 25,500 | |
| | | | |
(9) Deposits
The aggregate amount of time deposits in denominations of $100,000 or more at December 31, 2008 and 2007 was $298,334,000 and $243,619,000, respectively. Included in time deposits in
98
Table of Contents
GUARANTY BANCORP AND SUBSIDIARIES
Notes to Consolidated Financial Statements (Continued)
(9) Deposits (Continued)
denominations of $100,000 at December 31, 2008, are approximately $30.3 million of time deposits in denominations of more than $100,000 but less than $250,000 with maturities prior to December 31, 2009, as these qualify for expanded FDIC insurance coverage.
At December 31, 2008, the scheduled maturities of interest-bearing time deposits for the next five years are as follows (amounts in thousands):
| | | | |
2009 | | $ | 563,931 | |
2010 | | | 87,216 | |
2011 | | | 84,135 | |
2012 | | | 564 | |
2013 | | | 124 | |
Thereafter | | | — | |
| | | | |
| | $ | 735,970 | |
| | | | |
(10) Securities Sold Under Agreements to Repurchase
The following is a summary of information pertaining to securities sold under agreement to repurchase at December 31:
| | | | | | | |
| | 2008 | | 2007 | |
|---|
| | (Dollars in
thousands)
| |
|---|
Ending Balance | | $ | 21,781 | | $ | 22,384 | |
Weighted-average interest rate at year-end | | | 1.02 | % | | 3.73 | % |
Securities sold under agreements to repurchase, which are classified as secured borrowings, generally mature within one to four days from the transaction date. Securities sold under agreements to repurchase are reflected at the amount of cash received in connection with the transaction. The Company may be required to provide additional collateral based on the fair value of the underlying security. The securities sold under agreements to repurchase are collateralized by government agency and mortgage-backed securities held by the Company.
Information concerning securities sold under agreements to repurchase is summarized below:
| | | | | | | | | | |
| | Year Ended December 31, | |
|---|
| | 2008 | | 2007 | | 2006 | |
|---|
| | (Dollars in thousands)
| |
|---|
Average daily balance during the year | | $ | 18,698 | | $ | 29,104 | | $ | 27,927 | |
Average interest rate during the year | | | 2.09 | % | | 4.62 | % | | 4.41 | % |
Maximum month-end balance during the year | | $ | 22,332 | | $ | 40,020 | | $ | 36,502 | |
99
Table of Contents
GUARANTY BANCORP AND SUBSIDIARIES
Notes to Consolidated Financial Statements (Continued)
(11) Borrowings
A summary of borrowings is as follows:
| | | | | | | | | | | | | | | | |
| | Principal | | Interest rate | | Maturity
date | | Total
committed | |
|---|
| | (Dollars in thousands)
| |
|---|
| | December 31, 2008 | | | | | | | | | | | | | |
Short-term borrowings: | | | | | | | | | | | | | |
| | | FHLB line of credit | | $ | — | | | — | | | Apr-09 | | $ | 428,317 | |
| | | | | | | | | | | | | |
| | | | Total short-term borrowings | | $ | — | | | | | | | | | | |
| | | | | | | | | | | | | |
Long-term borrowings: | | | | | | | | | | | | | |
| | | FHLB term notes (fixed rate) | | | 166,404 | | | Range: 2.52 - 6.22% | | | 2009 - 2018 | | | See below | |
| | | | | | | | | | | | | |
| | | | Total borrowings | | $ | 166,404 | | | | | | | | | | |
| | | | | | | | | | | | | |
December 31, 2007 | | | | | | | | | | | | | |
Short-term borrowings: | | | | | | | | | | | | | |
| | | Treasury Tax and Loans | | $ | 1,199 | | | Variable | | | Revolving | | $ | 1,000 | |
| | | FHLB line of credit | | | — | | | — | | | Apr-08 | | | 316,208 | |
| | | U.S. Bank line of credit | | | 15,160 | | | 5.51% (variable) | | | Mar-08 | | | 70,000 | |
| | | | | | | | | | | | | |
| | | | Total short-term borrowings | | | 16,359 | | | | | | | | | | |
| | | | | | | | | | | | | |
Long-term borrowings: | | | | | | | | | | | | | |
| | | FHLB term notes (fixed rate) | | | 47,356 | | | Range: 3.25 - 6.22% | | | 2008 - 2017 | | | See below | |
| | | | | | | | | | | | | |
| | | | Total borrowings | | $ | 63,715 | | | | | | | | | | |
| | | | | | | | | | | | | |
Each advance with the Federal Home Loan Bank (FHLB) is payable at its maturity date, with a prepayment penalty if paid prior to maturity. The weighted-average rate on the FHLB term notes is 3.18% at December 31, 2008. At December 31, 2008, approximately $140 million of the FHLB fixed rate term notes with a weighted-average rate of 3.02% were convertible to floating rate on predetermined conversion dates at the discretion of the FHLB. If the bonds are converted by the FHLB, the Company has the option to prepay the advance without penalty. If the bonds are not converted by the FHLB, the bond becomes convertible quarterly thereafter, with the option to convert to floating rate continuing to be at the discretion of the FHLB. A $40 million fixed-rate bond with a rate of 3.17% is convertible quarterly with the next quarterly conversion option date of March 2, 2009. No other FHLB term bond has a conversion option available in 2009. The remaining $100 million of term notes with conversion options are layered with $40 million each having their first conversion option available in 2010 and 2011, respectively, and $20 million having its first conversion option available in 2013.
The Company has executed a blanket pledge and security agreement with the FHLB in the amount of $428,317,000 and $316,208,000 at December 31, 2008 and 2007, respectively, which encompasses certain loans and securities as collateral for these borrowings. The maximum credit allowance for future borrowings, including term notes and the line of credit, was $261,913,000 and $316,208,000 at December 31, 2008 and 2007, respectively.
100
Table of Contents
GUARANTY BANCORP AND SUBSIDIARIES
Notes to Consolidated Financial Statements (Continued)
(11) Borrowings (Continued)
As of December 31, 2008, the Company had a revolving credit agreement, as amended, with U.S. Bank National Association, which contained financial covenants, including maintaining a minimum adjusted return (excluding goodwill impairment and intangible asset amortization) on average assets, a maximum nonperforming assets to total loans ratio, regulatory capital ratios that qualify the Company as well-capitalized and a minimum total risk-based capital amount. At December 31, 2008, the Company was in compliance with all covenants except the minimum total risk-based capital amount. The minimum total risk-based capital amount was set by U.S. Bank and was based on the Company receiving additional capital from Treasury's Capital Purchase Program prior to December 31, 2008. As the Company's application to receive capital under Treasury's Capital Purchase Program was still pending as of December 31, 2008, the Company did not meet this financial covenant and voluntarily decided to terminate its line of credit on February 9, 2009 with U.S. Bank. The revolving credit agreement would have otherwise expired on March 31, 2009.
At December 31, 2008, the scheduled maturities of borrowings are as follows (in thousands):
| | | | | |
2009 | | $ | 1,865 | |
2010 | | | 1,190 | |
2011 | | | 3,015 | |
2012 | | | 18 | |
2013 | | | 50,223 | |
Thereafter | | | 110,093 | |
| | | | |
| | Total borrowings | | $ | 166,404 | |
| | | | |
(12) Income Taxes
The components of the income tax provision (benefit) are as follows:
| | | | | | | | | | | | |
| | Year ended December 31, | |
|---|
| | 2008 | | 2007 | | 2006 | |
|---|
| | (In thousands)
| |
|---|
Current tax provision: | | | | | | | | | | |
| | Federal | | $ | 1,585 | | $ | 3,709 | | $ | 16,950 | |
| | State | | | 1,080 | | | 943 | | | 2,246 | |
| | | | | | | | |
| | | Total current tax provision | | | 2,665 | | | 4,652 | | | 19,196 | |
| | | | | | | | |
Deferred tax provision (benefit): | | | | | | | | | | |
| | Federal | | | (8,452 | ) | | (4,561 | ) | | (6,946 | ) |
| | State | | | (726 | ) | | (276 | ) | | (964 | ) |
| | | | | | | | |
| | | Total deferred tax provision | | | (9,178 | ) | | (4,837 | ) | | (7,910 | ) |
| | | | | | | | |
| | | Total tax provision (benefit) | | $ | (6,513 | ) | $ | (185 | ) | $ | 11,286 | |
| | | | | | | | |
The total current and deferred tax provision associated with the Company's discontinued operations was $327,000 for the year ended December 31, 2006.
101
Table of Contents
GUARANTY BANCORP AND SUBSIDIARIES
Notes to Consolidated Financial Statements (Continued)
(12) Income Taxes (Continued)
Income tax expense attributable to income (loss) from continuing operations differed from the amounts computed by applying the U.S. federal statutory tax rate to pretax income (loss) from operations as a result of the following:
| | | | | | | | | | |
| | Year ended December 31, | |
|---|
| | 2008 | | 2007 | | 2006 | |
|---|
Tax (benefit) at statutory federal rate | | | (35.0 | )% | | (35.0 | )% | | 35.0 | % |
State tax, net of federal benefit | | | (0.2 | )% | | 0.1 | % | | 2.5 | % |
Tax exempt income | | | (0.4 | )% | | (1.6 | )% | | (4.6 | )% |
Goodwill impairment | | | 33.3 | % | | 36.0 | % | | 0.0 | % |
Other | | | (0.2 | )% | | 0.4 | % | | 0.6 | % |
| | | | | | | | |
| | | (2.5 | )% | | (0.1 | )% | | 33.5 | % |
| | | | | | | | |
Current taxes receivable included in other assets totaled approximately $3,397,000 and $3,250,000 at December 31, 2008 and December 31, 2007, respectively. The Company's net deferred tax asset is included in other assets at December 31, 2008. At December 31, 2007, the Company's net deferred tax liability is included in interest payable and other liabilities.
Deferred tax assets and liabilities result from the tax effects of temporary differences between the carrying amount of assets and liabilities for financial reporting purposes and the amounts used for income tax purposes at December 31 are as follows:
| | | | | | | | | |
| | 2008 | | 2007 | |
|---|
| | (In thousands)
| |
|---|
Deferred tax assets: | | | | | | | |
| | Allowance for loan losses | | $ | 17,100 | | $ | 9,773 | |
| | Fair value adjustments on securities, loans, deposits, and subordinated debentures | | | 407 | | | 640 | |
| | Other assets, accruals and other real estate owned | | | 2,867 | | | 2,725 | |
| | Unrealized loss on securities | | | 801 | | | 906 | |
| | Intangible assets | | | 1,106 | | | 714 | |
| | Stock compensation and other | | | 1,523 | | | 2,837 | |
| | | | | | |
| | | Total deferred tax assets | | | 23,804 | | | 17,595 | |
| | | | | | |
Deferred tax liabilities: | | | | | | | |
| | Premises and equipment | | | 5,861 | | | 5,799 | |
| | Fair value adjustments on core deposit intangibles and fixed rate loans | | | 9,723 | | | 12,804 | |
| | FHLB stock, prepaid assets, equity investments and other liabilities | | | 2,299 | | | 2,144 | |
| | | | | | |
| | | Total deferred tax liabilities | | | 17,883 | | | 20,747 | |
| | | | | | |
| | | Deferred tax asset (liability) | | $ | 5,921 | | $ | (3,152 | ) |
| | | | | | |
Realization of the Company's deferred tax assets is dependent upon the Company generating sufficient taxable income to obtain benefit from the reversal of net deductible temporary differences. The amount of deferred tax assets considered realizable is subject to adjustment in future periods based on estimates of future taxable income. In assessing the realization of deferred tax assets, the
102
Table of Contents
GUARANTY BANCORP AND SUBSIDIARIES
Notes to Consolidated Financial Statements (Continued)
(12) Income Taxes (Continued)
Company considers whether it is more likely than not that some portion or all of the deferred tax assets will not be realized. The ultimate realization of deferred tax assets is dependent upon the generation of future taxable income during the periods in which those temporary differences become deductible. Based upon the level of historical taxable income and projections for future taxable income over the periods in which the deferred tax assets are deductible, the Company believes it is more likely than not that the Company will realize the benefits of these deductible differences at December 31, 2008, 2007 and 2006, and therefore, no valuation allowance for deferred tax assets was recorded at December 31, 2008, 2007 and 2006.
At December 31, 2008, the Company had no net operating loss or tax credit carryforwards for federal or state income tax purposes.
As of December 31, 2008 and December 31, 2007, the Company did not have any unrecognized tax benefits. The Company does not expect the total amount of unrecognized tax benefits to significantly increase or decrease in the next twelve months. The Company recognizes interest related to income tax matters as interest expense and penalties related to income tax matters as other noninterest expense and did not have any accrued interest and/or penalties at December 31, 2008 or 2007. The Company received $41,000 of interest income on a tax refund in 2008. No other interest or penalties related to tax matters was incurred during 2008 or 2007. The Company and its subsidiaries are subject to U.S. federal income tax as well as income tax of the state of Colorado. The Company is no longer subject to examination by taxing authorities for years before 2005.
(13) Subordinated Debentures and Trust Preferred Securities
The Company had a $41,239,000 aggregate balance of subordinated debentures outstanding with a weighted average cost of 8.68% and 8.97% at December 31, 2008 and 2007, respectively. The subordinated debentures were issued in four separate series. Each issuance has a maturity of thirty years from its date of issue. The subordinated debentures were issued to trusts established by us, which in turn issued $40,000,000 of trust preferred securities. Generally and with certain limitations, the Company is permitted to call the debentures subsequent to the first five or ten years, as applicable, after issue if certain conditions are met, or at any time upon the occurrence and continuation of certain changes in either the tax treatment or the capital treatment of the trusts, the debentures or the preferred securities.
In September 2000, a predecessor to the Company formed CenBank Statutory Trust I and completed an offering of $10.0 million, 10.6% Cumulative Trust Preferred Securities (Preferred Securities), which are guaranteed by the Company. The Trust also issued common securities to the predecessor of the Company and used the net proceeds from the offering to purchase $10.3 million in principal amount of 10.6% Junior Subordinated Debentures (Debentures) issued. The Company assumed the predecessor's obligations relating to such securities upon the acquisition of the predecessor. Interest paid on the Debentures is distributed to the holders of the Preferred Securities. Distributions payable on the Preferred Securities are recorded as interest expense in the consolidated statements of income. These Debentures are unsecured, rank junior and are subordinate in right of payment to all senior debt of the Company. The Preferred Securities are subject to mandatory redemption upon repayment of the Debentures. The Company has the right, subject to events of default, to defer payments of interest on the Debentures at any time by extending the interest payment period for a period not exceeding 10 consecutive semi-annual periods with respect to each deferral
103
Table of Contents
GUARANTY BANCORP AND SUBSIDIARIES
Notes to Consolidated Financial Statements (Continued)
(13) Subordinated Debentures and Trust Preferred Securities (Continued)
period, provided that no extension period may extend beyond the redemption or maturity date of the Debentures. The Debentures mature on September 7, 2030, which may be shortened by us to not earlier than September 7, 2010, if certain conditions are met, or at any time upon the occurrence and continuation of certain changes in either the tax treatment or the capital treatment of the Trust, the Debentures or the Preferred Securities.
In February 2001, a predecessor to the Company formed CenBank Statutory Trust II and completed an offering of $5.0 million 10.2% Cumulative Trust Preferred Securities (Preferred Securities), which are guaranteed by the Company. The Trust also issued common securities to the predecessor of the Company and used the net proceeds from the offering to purchase $5.2 million in principal amount of 10.2% Junior Subordinated Debentures (Debentures) issued. The Company assumed the predecessor's obligations relating to such securities upon the acquisition of the predecessor. Interest paid on the Debentures is distributed to the holders of the Preferred Securities. Terms and conditions of these Debentures are substantially similar to those as described under the CenBank Statutory Trust I. The Debentures mature on February 22, 2031, which may be shortened by us to not earlier than February 22, 2011, if certain conditions are met, or at any time upon the occurrence and continuation of certain changes in either the tax treatment or the capital treatment of the Trust, the Debentures or the Preferred Securities.
In April 2004, a predecessor to the Company formed CenBank Statutory Trust III and completed an offering of $15.0 million LIBOR plus 2.65% Cumulative Trust Preferred Securities (Preferred Securities), which are guaranteed by the Company. The Trust also issued common securities to the predecessor of the Company and used the net proceeds from the offering to purchase $15.5 million in principal amount of floating rate Junior Subordinated Debentures (Debentures) issued. The Company assumed the predecessor's obligations relating to such securities upon the acquisition of the predecessor. Interest paid on the Debentures is distributed to the holders of the Preferred Securities. Terms and conditions of these Debentures are substantially similar to those as described under the CenBank Statutory Trust I. The Debentures mature on April 15, 2034, which may be shortened by us to not earlier than April 15, 2009, if certain conditions are met, or at any time upon the occurrence and continuation of certain changes in either the tax treatment or the capital treatment of the Trust, the Debentures or the Preferred Securities.
In June 2003, a predecessor to the Company formed Guaranty Capital Trust III and completed an offering of $10.0 million LIBOR plus 3.10% Cumulative Trust Preferred Securities (Preferred Securities), which are guaranteed by the Company. The Trust also issued common securities to the predecessor of the Company and used the net proceeds from the offering to purchase $10.3 million in principal amount of Junior Subordinated Debt Securities issued. The Company assumed the predecessor's obligations relating to such securities upon the acquisition of the predecessor. Interest is paid quarterly and is distributed to the holders of the Preferred Securities. The Company has the right, subject to events of default, to defer payments of interest on the Debentures at any time by extending the interest payment period for a period not exceeding 20 consecutive quarterly periods with respect to each deferral period, provided that no extension period may extend beyond the redemption or maturity date of the Debentures. The Debentures mature on July 7, 2033. The Guaranty Capital Trust III trust preferred issuance was initially callable on July 7, 2008. The Company did not call this security on July 7, 2008; however, this security remains callable on each quarterly interest payment date.
104
Table of Contents
GUARANTY BANCORP AND SUBSIDIARIES
Notes to Consolidated Financial Statements (Continued)
(13) Subordinated Debentures and Trust Preferred Securities (Continued)
For financial reporting purposes, the Trusts are treated as investments of the Company and not consolidated in the consolidated financial statements. Although the securities issued by each of the Trusts are not included as a component of stockholders' equity in the consolidated balance sheets, the securities are treated as capital for regulatory purposes. Specifically, under applicable regulatory guidelines, the securities issued by the Trusts qualify as Tier 1 capital up to a maximum of 25% of Tier 1 capital on an aggregate basis. Any amount that exceeds 25% qualifies as Tier 2 capital. At December 31, 2008 and 2007, all of such securities outstanding qualified as Tier 1 capital. The Company's investment in the common stock of each trust is included in other assets on the Consolidated Balance Sheets.
In March 2005, the Federal Reserve Board issued a final rule that continues to allow the inclusion of trust preferred securities in Tier 1 capital, but with stricter quantitative limits. Under the final rule, after a five-year transition period ending March 31, 2009, the aggregate amount of trust preferred securities and certain other capital elements would be limited to 25% of Tier I capital elements, net of goodwill, less any associated deferred tax liability. The amount of trust preferred securities and certain elements in excess of the limit could be included in Tier 2 capital, subject to restrictions. Based on Tier 1 capital balances at December 31, 2008, this final rule would not have any impact on the full inclusion of the Company's trust preferred securities as Tier 1 capital.
The following table summarizes the terms of each subordinated debenture issuance at December 31, 2008 (dollars in thousands):
| | | | | | | | | | | | | | | | | | | | | | | | |
| | Date Issued | | Amount | | Maturity
Date | | Call
Date* | | Fixed or
Variable | | Rate Adjuster | | Rate at
December 31,
2008 | | Next
Rate
Reset
Date | |
|---|
CenBank Trust I | | | 9/7/2000 | | $ | 10,310 | | | 9/7/2030 | | | 9/7/2010 | | Fixed | | | N/A | | | 10.60 | % | | N/A | |
CenBank Trust II | | | 2/22/2001 | | | 5,155 | | | 2/22/2031 | | | 2/22/2011 | | Fixed | | | N/A | | | 10.20 | % | | N/A | |
CenBank Trust III | | | 4/8/2004 | | | 15,464 | | | 4/15/2034 | | | 4/15/2009 | | Variable | | | LIBOR + 2.65 | % | | 7.40 | % | | 1/15/2009 | |
Guaranty Capital Trust III | | | 6/30/2003 | | | 10,310 | | | 7/7/2033 | | | 4/7/2009 | | Variable | | | LIBOR + 3.10 | % | | 7.92 | % | | 1/07/2009 | |
- *
- Call date represents the earliest date that the Company can call the debentures.
On January 7, 2009, the rate on the Guaranty Capital Trust III subordinated debentures reset to 4.19%. On January 15, 2009, the rate on the CenBank Trust III subordinated debentures reset to 3.74%.
(14) Commitments
The Company is a party to credit-related financial instruments with off-balance sheet risk in the normal course of business to meet the financing needs of its customers. These financial instruments include commitments to extend credit, stand-by letters of credit and commercial letters of credit. Such commitments involve, to varying degrees, elements of credit and interest rate risk in excess of the amount recognized in the consolidated balance sheets.
The Company's exposure to credit loss is represented by the contractual amount of these commitments. The Company follows the same credit policies in making commitments as it does for on-balance sheet instruments.
105
Table of Contents
GUARANTY BANCORP AND SUBSIDIARIES
Notes to Consolidated Financial Statements (Continued)
(14) Commitments (Continued)
At December 31, the following financial instruments were outstanding whose contract amounts represented credit risk:
| | | | | | | |
| | 2008 | | 2007 | |
|---|
| | (In thousands)
| |
|---|
Commitments to extend credit | | $ | 390,277 | | $ | 582,988 | |
Standby letters of credit | | | 24,792 | | | 33,573 | |
Commercial letters of credit | | | 11,000 | | | — | |
Commitments to extend credit are agreements to lend to a customer as long as there is no violation of any condition established in the contract. Commitments generally have fixed expiration dates or other termination clauses and may require payment of a fee. Several of the commitments may expire without being drawn upon. Therefore, the total commitment amounts do not necessarily represent future cash requirements. Off-balance sheet risk to credit loss exists up to the face amount of these instruments, although material losses are not anticipated. The same credit policies are used to make such commitments as are used for loans, including obtaining collateral, if necessary, at exercise of the commitment.
Commitments to extend credit under overdraft protection agreements are commitments for possible future extensions of credit to existing deposit customers. These lines of credit are uncollateralized and usually do not contain a specified maturity date and may not be drawn upon to the total extent to which the Company is committed.
Stand-by letters of credit are conditional commitments issued by the Company to guarantee the performance of a customer to a third party. Those letters of credit are primarily issued to support public and private borrowing arrangements. Essentially all letters of credit issued have expiration dates within one year. The credit risk involved in issuing letters of credit is essentially the same as that involved in extending loan facilities to customers. The Company generally holds collateral supporting those commitments if deemed necessary.
The Company enters into commercial letters of credit on behalf of its customers who authorize a third party to draw drafts on the Company up to a stipulated amount and with specific terms and conditions. A commercial letter of credit is a conditional commitment on the part of the Company to provide payment on drafts drawn in accordance with the terms of the commercial letter of credit.
(15) Contingencies
In the ordinary course of our business, we are party to various legal actions, which we believe are incidental to the operation of our business. Although the ultimate outcome and amount of liability, if any, with respect to these other legal actions to which we are currently a party, cannot presently be ascertained with certainty, in the opinion of management, based upon information currently available to us, any resulting liability is not likely to have a material adverse effect on the Company's consolidated financial position, results of operations or cash flows.
(16) Employee Benefit Plans
Substantially all employees are eligible to participate in the Company's 401(k) plan. Employees may contribute up to 100 percent of their compensation subject to certain limits based on federal tax
106
Table of Contents
GUARANTY BANCORP AND SUBSIDIARIES
Notes to Consolidated Financial Statements (Continued)
(16) Employee Benefit Plans (Continued)
laws. The Company makes matching contributions equal to a specified percentage of the employee's compensation as defined by the Plan. For years ended December 31, 2008, 2007 and 2006, expensed contributions to the 401(k) plan were $720,000, $801,000 and $781,000, respectively.
Under the Company's Amended and Restated 2005 Stock Incentive Plan (the "Incentive Plan"), the Company's Board of Directors may grant stock-based compensation awards to nonemployee directors, key employees, consultants and prospective employees under the terms described in the Incentive Plan. The allowable stock-based compensation awards include the grant of Options, Restricted Stock Awards, Restricted Stock Unit Awards, Performance Stock Awards, Stock Appreciation Rights and other Equity-Based Awards. The Incentive Plan provides that eligible participants may be granted shares of Company common stock that are subject to forfeiture until the grantee vests in the stock award based on the established conditions, which may include service conditions, established performance measures or both.
Prior to vesting of the stock awards with a service vesting condition, each grantee shall have the rights of a stockholder with respect to voting of the granted stock. The recipient is not entitled to dividend rights with respect to the shares of granted stock until vesting occurs. Prior to vesting of the stock awards with performance vesting conditions, each grantee shall have the rights of a stockholder with respect to voting of the granted stock. The recipient is not entitled to dividend rights with respect to the shares of granted stock until initial vesting occurs, at which time, the dividend rights will exist on vested and unvested shares of granted stock, subject to termination of such rights under the terms of the Incentive Plan.
Other than the stock awards with service and performance based vesting conditions, no grants have been made under the Incentive Plan.
The Incentive Plan authorized grants of stock-based compensation awards of up to 2,500,000 shares of authorized Company common stock, subject to adjustments provided by the Incentive Plan. As of December 31, 2008 and 2007, there were 1,420,345 and 1,651,345 shares of unvested stock granted (net of forfeitures), with 730,412 and 754,644 shares available for grant under the Incentive Plan, respectively. Of the 1,420,345 shares outstanding at December 31, 2008, approximately 690,000 shares are expected to vest.
A summary of the status of unearned stock awards and the change during the year is presented in the table below:
| | | | | | | | |
| | Shares | | Weighted Average Fair Value on Award Date | |
|---|
Unearned at December 31, 2007 | | | 1,651,345 | | $ | 10.21 | |
| | Awarded | | | 164,500 | | | 6.16 | |
| | Forfeited | | | (140,268 | ) | | 10.11 | |
| | Vested | | | (255,232 | ) | | 10.77 | |
| | | | | | | |
Unearned at December 31, 2008 | | | 1,420,345 | | $ | 9.65 | |
| | | | | | | |
107
Table of Contents
GUARANTY BANCORP AND SUBSIDIARIES
Notes to Consolidated Financial Statements (Continued)
(16) Employee Benefit Plans (Continued)
The Company recognized a benefit of $422,000 related to stock-based compensation for the year ended December 31, 2008. This benefit consisted of $2,292,000 in expense for stock-based compensation for services rendered for 2008, less a $2,714,000 cumulative adjustment related to performance-based shares not expected to vest prior to their expiration date as well as a cumulative forfeiture adjustment on remaining service-based restricted awards. The performance-based shares have a performance criterion that must be met on or before the expiration date of December 31, 2012 in order for the performance-based shares to fully or partially vest. Based on management's latest analysis completed in 2008, management determined that it was not probable that the Company would meet the performance criterion on or before December 31, 2012 and thus recorded a cumulative adjustment for the performance-based shares in 2008. Should this expectation change, additional expense could be recorded in future periods. The Company recognized $2,871,000 and $2,899,000 in compensation expense for services rendered for the years ended December 31, 2007and 2006, respectively. The total income tax effect recognized in the income statement for share-based compensation arrangements was an $824,000 expense for the year ended December 31, 2008, compared to a tax benefit of $1,019,000 and $1,102,000 for the years ended December 31, 2007 and 2006, respectively.
At December 31, 2008, compensation cost of $3,823,000 related to unearned awards not yet recognized is expected to be recognized over a weighted-average period of 2.1 years.
A summary of the Company's awards for the years ended December 31, 2008 and 2007 is presented in the table below:
| | | | | | | |
| | Year Ended December 31, | |
|---|
| | 2008 | | 2007 | |
|---|
Number of shares granted | | | 164,500 | | | 223,500 | |
Weighted-average grant-date fair value | | $ | 6.16 | | $ | 7.40 | |
Number of shares that vested | | | 255,232 | | | 61,213 | |
Fair value of shares vested | | $ | 1,003,930 | | $ | 460,584 | |
Tax benefit realized | | $ | 381,594 | | $ | 175,068 | |
Deferred Compensation Plans
The Company maintains a Deferred Compensation Plan for a select group of management or highly compensated employees and non-employee members of the Board. The plan, which is meant to be an unfunded deferred compensation plan, is intended to be exempt from certain requirements of the Employee Retirement Income Security Act of 1974. The plan allows the participants to defer up to 80% of their salary and up to 100% of their bonus or incentive compensation, and up to 100% of cash fees in the case of directors, until termination or upon the occurrence of other specified events (e.g., disability, previously specified dates, and unforeseeable emergencies). The plan permits participants to elect to have deferred amounts deemed to be invested in various investment funds or Company common stock. The plan does not guarantee any minimum rate of return. Participation in the plan is voluntary and participants may change their elections annually or otherwise as permitted by the plan and applicable regulations governing the deferred tax treatment of the plan. The Company may, in its sole discretion, make additional contributions to participants' accounts. A benefit of $341,000 was recognized for deferred compensation in 2008 as the deemed investments in the investment funds selected by the participants declined in value during 2008. The expense incurred for deferred
108
Table of Contents
GUARANTY BANCORP AND SUBSIDIARIES
Notes to Consolidated Financial Statements (Continued)
(16) Employee Benefit Plans (Continued)
compensation was $118,000 in 2007 and $107,000 in 2006. The deferred compensation liability was $904,000 and $1,351,000 at December 31, 2008 and 2007, respectively, and is reported with interest payable and other liabilities on the consolidated balance sheets.
(17) Related-Party Transactions
The Company has granted loans to directors and their affiliates amounting to $450,000 and $5,627,000 at December 31, 2008 and 2007, respectively. There were no related-party loans on past due or non-accrual status.
Activity during 2008 regarding outstanding loans to certain related-party loan customers (directors of the Company, including companies in which they are principal owners) was as follows (in thousands):
| | | | |
Balance, December 31, 2007 | | $ | 5,627 | |
Related party loans at the beginning of the year which ceased to be related party loans during the current year(1) | | | (5,627 | ) |
Advances | | | 490 | |
Repayments | | | (40 | ) |
| | | | |
Balance, December 31, 2008 | | $ | 450 | |
| | | | |
- (1)
- The loans to related-parties outstanding at December 31, 2007, were to customers, including companies in which they are principal owners, who were members of the Company's board of directors at December 31, 2007, but are no longer disclosed as related-party loans as the directors are no longer members of the Company's board of directors.
Deposits from related parties held by the Company at December 31, 2008 and 2007 amounted to $1,122,000 and $13,945,000, respectively.
Castle Creek Financial LLC ("Castle Creek Financial") serves as the exclusive financial advisor for the Company. Castle Creek Financial is an affiliate of Castle Creek Capital LLC, which is controlled by the Company's Chairman of the Board (who also served as the Company's Chief Executive Officer through May 2006). No payments to Castle Creek Financial were made in 2008, 2007 or 2006.
The Company has incurred costs for facility rental and related services from companies that were affiliated with either members of the Board of Directors or certain former members of executive management during 2008, 2007 and 2006. We paid $779,000 and $2,122,000 to companies with such relationships for facility rental and related services in 2007 and 2006, respectively. The facility rent for a company affiliated with a member of the Company's board of directors is not disclosed as related party rent expense in 2008 as the director to whom this company was affiliated is no longer a member of the Company's board of directors. In 2006, Guaranty paid $232,000 for construction services to a company that was affiliated with a former member of the Guaranty Bank board of directors.
109
Table of Contents
GUARANTY BANCORP AND SUBSIDIARIES
Notes to Consolidated Financial Statements (Continued)
(18) Fair Value
Effective January 1, 2008, the Company adopted FASB Statement No. 157, Fair Value Measurements ("SFAS No. 157"). SFAS No. 157 clarifies that fair value is an exit price, representing the amount that would be received to sell an asset or paid to transfer a liability in an orderly transaction between market participants. Under SFAS No. 157, fair value measurements are not adjusted for transaction costs. SFAS No. 157 establishes a fair value hierarchy that prioritizes the inputs to valuation techniques used to measure fair value. The hierarchy gives the highest priority to unadjusted quoted prices in active markets for identical assets or liabilities (level 1 measurements) and the lowest priority to unobservable inputs (level 3 measurements). The three levels of the fair value hierarchy under SFAS No. 157 are described below:
Basis of Fair Value Measurement:
Level 1—Unadjusted quoted prices in active markets that are accessible at the measurement date for identical, unrestricted assets.
Level 2—Significant other observable inputs other than Level 1 prices such as quoted prices in markets that are not active, quoted prices for similar assets, or other inputs that are observable, either directly or indirectly, for substantially the full term of the asset.
Level 3—Significant unobservable inputs that reflect a reporting entity's own assumptions about the assumptions that market participants would use in pricing an asset or liability.
A financial instrument's level within the fair value hierarchy is based on the lowest level of input that is significant to the fair value measurement.
The fair values of securities available for sale are generally determined by matrix pricing, which is a mathematical technique widely used in the industry to value debt securities without relying exclusively on quoted prices for the specific securities but rather by relying on the securities' relationship to other benchmark quoted securities (Level 2 inputs).
The fair value of loans held for sale is based upon binding contracts and quotes from third party investors (Level 2 inputs).
Impaired loans are evaluated and valued at the time the loan is identified as impaired, at the lower of cost or fair value. Fair value is measured based on the value of the collateral securing these loans and is classified at a level 3 in the fair value hierarchy. Collateral may be real estate and/or business assets including equipment, inventory and/or accounts receivable and is determined based on appraisals performed by qualified licensed appraisers hired by the Company. Appraised and reported values may be discounted based on management's historical knowledge, changes in market conditions from the time of valuation, and/or management's expertise and knowledge of the client and client's business. Such discounts are typically significant and result in a Level 3 classification of the inputs for determining fair value. Impaired loans are reviewed and evaluated on at least a quarterly basis for additional impairment and adjusted accordingly, based on the same factors identified above.
Level 3 is for positions that are not traded in active markets or are subject to transfer restrictions, and/or where valuations are adjusted to reflect illiquidity and/or non-transferability. Such adjustments are generally based on available market evidence. In the absence of such evidence, management's best estimate is used. At December 31, 2008, the Company had one investment that was classified as a level 3 investment, which is the hospital municipal bond discussed in Note 3. Management's best estimate consists of both internal and external support on the Level 3 investment. Internal cash flow
110
Table of Contents
GUARANTY BANCORP AND SUBSIDIARIES
Notes to Consolidated Financial Statements (Continued)
(18) Fair Value (Continued)
models using a present value formula along with indicative exit pricing obtained from broker/dealers were used to determine fair value for certain Level 3 investments. Subsequent to inception, management only changes level 3 inputs and assumptions when corroborated by evidence such as transactions in similar instruments, completed or pending third-party transactions in the underlying investment or comparable entities, subsequent rounds of financing, recapitalizations and other transactions across the capital structure, offerings in the equity or debt markets, and changes in financial ratios or cash flows.
Assets and Liabilities Measured on a Recurring Basis
Assets and liabilities measured at fair value on a recurring basis are summarized below:
| | | | | | | | | | | | | | |
| | Quoted Prices in
Active Markets
for Identical
Assets (Level 1) | | Significant
Other
Observable
Inputs
(Level 2) | | Significant
Unobservable
Inputs
(Level 3) | | Balance as of
December 31, 2008 | |
|---|
| | (In thousands)
| |
|---|
Assets at December 31, 2008 | | | | | | | | | | | | | |
| | Investment securities, available for sale | | $ | — | | $ | 66,977 | | $ | 35,897 | | $ | 102,874 | |
The table below presents a reconciliation and income statement classification of gains and losses for all assets measured at fair value on a recurring basis using significant unobservable inputs (Level 3) for the year ended December 31, 2008:
| | | | | | |
| | Available for Sale Securities | |
|---|
| | (In Thousands)
| |
|---|
Balance, December 31, 2007 | | $ | — | |
| | Total unrealized gains (losses) included in: | | | | |
| | | Net Income | | | — | |
| | | Other Comprehensive Income | | | — | |
| | Purchases, sales, issuances and settlements, net | | | — | |
| | Transfers in and (out) of level three | | | 35,897 | |
| | | | |
Balance December 31, 2008 | | $ | 35,897 | |
| | | | |
111
Table of Contents
GUARANTY BANCORP AND SUBSIDIARIES
Notes to Consolidated Financial Statements (Continued)
(18) Fair Value (Continued)
Assets and Liabilities Measured on a Non-Recurring Basis
The following represent assets and liabilities measured at fair value on a non-recurring basis as of December 31, 2008. The valuation methodology used to measure the fair value of these loans is described earlier in the Note.
| | | | | | | | | | | | | | |
| | Quoted Prices in
Active Markets
for Identical
Assets (Level 1) | | Significant
Other
Observable
Inputs
(Level 2) | | Significant
Unobservable
Inputs
(Level 3) | | Balance as of
December 31, 2008 | |
|---|
| | (In thousands)
| |
|---|
Assets at December 31, 2008 | | | | | | | | | | | | | |
| | Impaired loans | | $ | — | | $ | — | | $ | 42,191 | | $ | 42,191 | |
| | Loans held for sale | | $ | — | | $ | 5,760 | | $ | — | | $ | 5,760 | |
Loans held for sale, which are carried at the lower of cost or fair value, did not have an impairment charge for 2008.
Impaired loans, which are measured for impairment using the fair value of the collateral for collateral dependent loans, had a carrying amount of $42,191,000 with a valuation allowance of $11,064,000 resulting in additional provision for loan losses of $21,279,000 during 2008.
Fair Value of Financial Instruments
The estimated fair values, and related carrying amounts, of the Company's financial instruments are as follows:
| | | | | | | | | | | | | | |
| | December 31, 2008 | | December 31, 2007 | |
|---|
| | Carrying
amount | | Fair value | | Carrying
amount | | Fair value | |
|---|
| | (In thousands)
| |
|---|
Financial assets: | | | | | | | | | | | | | |
| | Cash and cash equivalents | | $ | 45,711 | | $ | 45,711 | | $ | 52,356 | | $ | 52,356 | |
| | Securities available for sale | | | 102,874 | | | 102,874 | | | 118,964 | | | 118,964 | |
| | Securities held to maturity | | | 13,114 | | | 13,505 | | | 14,889 | | | 14,916 | |
| | Bank stocks | | | 28,276 | | | n/a | | | 32,464 | | | n/a | |
| | Loans, net | | | 1,781,345 | | | 1,777,496 | | | 1,755,936 | | | 1,761,794 | |
| | Loans held for sale | | | 5,760 | | | 5,760 | | | 492 | | | 492 | |
| | Accrued interest receivable | | | 7,202 | | | 7,202 | | | 10,252 | | | 10,252 | |
Financial liabilities: | | | | | | | | | | | | | |
| | Deposits | | | 1,698,651 | | | 1,712,160 | | | 1,799,507 | | | 1,800,582 | |
| | Federal funds purchased and sold under agreements to repurchase | | | 21,781 | | | 21,781 | | | 23,617 | | | 23,617 | |
| | Short-term borrowings | | | — | | | — | | | 16,359 | | | 16,359 | |
| | Subordinated debentures | | | 41,239 | | | 35,938 | | | 41,239 | | | 43,187 | |
| | Long-term borrowings | | | 166,404 | | | 178,785 | | | 47,356 | | | 41,800 | |
| | Accrued interest payable | | | 3,927 | | | 3,927 | | | 4,122 | | | 4,122 | |
112
Table of Contents
GUARANTY BANCORP AND SUBSIDIARIES
Notes to Consolidated Financial Statements (Continued)
(18) Fair Value (Continued)
The fair value of a financial instrument is the current amount that would be exchanged between willing parties, other than in a forced liquidation. Fair value is best determined based upon quoted market prices. However, in many instances, there are no quoted market prices for the Company's various financial instruments. In cases where quoted market prices are not available, fair values are based on estimates using present value or other valuation techniques. Those techniques are significantly affected by the assumptions used, including the discount rate and estimates of future cash flows. Accordingly, the fair value estimates may not be realized in an immediate settlement of the instrument. Statement of Financial Accounting Standards No. 107 excludes certain financial instruments and all nonfinancial instruments from its disclosure requirements. Accordingly, the aggregate fair value amounts presented may not necessarily represent the underlying fair value of the Company.
The following methods and assumptions were used by the Company in estimating fair value disclosures for financial instruments:
Fair values for securities available for sale and held to maturity are generally determined by matrix pricing, which is a mathematical technique widely used in the industry to value debt securities without relying exclusively on quoted prices for the specific securities but rather by relying on the securities' relationship to other benchmark quoted securities.
It is not practical to determine the fair value of bank stocks due to restrictions placed on the transferability of FHLB stock, Federal Reserve Bank stock and Bankers' Bank of the West stock. These three stocks comprise the balance of bank stocks.
- (c)
- Loans
Loans exclude loans held-for-sale and impaired loans as these fair values are previously disclosed in this note. For variable-rate loans that reprice frequently and with no significant change in credit risk, fair values are based on carrying values. Fair values for other loans (e.g., commercial real estate and investment property mortgage loans, commercial and industrial loans) are estimated using discounted cash flow analyses, using interest rates currently being offered for loans with similar terms to borrowers of similar credit quality.
Loans held for sale are carried at lower cost or fair value. The fair value of loans held for sale is based upon binding contracts and quotes from third party investors.
- (d)
- Deposits
The fair values disclosed for demand deposits (e.g., interest and non-interest checking, passbook savings, and certain types of money market accounts) are, by definition, equal to the amount payable on demand at the reporting date (i.e., their carrying amount). The carrying amounts of variable-rate, fixed-term money market accounts and certificates of deposit approximate their fair values at the reporting date. Fair values for fixed-rate certificates of deposit are estimated using a discounted cash flows calculation that applies interest rates currently being offered on certificates to a schedule of aggregated expected monthly maturities on time deposits.
113
Table of Contents
GUARANTY BANCORP AND SUBSIDIARIES
Notes to Consolidated Financial Statements (Continued)
(18) Fair Value (Continued)
- (e)
- Short-term Borrowings
The carrying amounts of federal funds purchased, borrowings under repurchase agreements, and other short-term borrowings maturing within ninety days approximate their fair values.
- (f)
- Long-term Borrowings
The fair values of the Company's long-term borrowings are estimated using discounted cash flow analyses based on the Company's current incremental borrowing rates for similar types of borrowing arrangements.
- (g)
- Subordinated Debentures
The fair values of the Company's Subordinated Debentures are estimated using discounted cash flow analyses based on the Company's current incremental borrowing rates for similar types of borrowing arrangements.
- (h)
- Accrued Interest Payable
The carrying amounts of accrued interest approximate fair value.
- (i)
- Off-balance Sheet Instruments
Fair values for off-balance sheet, credit-related financial instruments are based on fees currently charged to enter into similar agreements, taking into account the remaining terms of the agreements and the counterparties' credit standing. The fair value of commitments is not material.
(19) Regulatory Capital Matters
The Company and the Bank are subject to various regulatory capital requirements administered by the federal banking agencies. Failure to meet minimum capital requirements can initiate certain mandatory and possibly additional discretionary actions by regulators that, if undertaken, could have a direct material effect on the Company's consolidated financial statements. Under capital adequacy guidelines and the regulatory framework for prompt corrective action, the Company must meet specific capital guidelines that involve quantitative measures of their assets, liabilities, and certain off-balance sheet items as calculated under regulatory accounting practices. The Company's capital amounts and classification are also subject to qualitative judgments by the regulators about components, risk weighting, and other factors.
Quantitative measures established by regulation to ensure capital adequacy require the Company and the Bank to maintain minimum amounts and ratios (set forth in the following table) of Total and Tier 1 capital to risk-weighted assets, and of Tier 1 capital to average assets. Management believes, as of December 31, 2008, that the Company and its bank subsidiary met all capital adequacy requirements to which they are subject.
114
Table of Contents
GUARANTY BANCORP AND SUBSIDIARIES
Notes to Consolidated Financial Statements (Continued)
(19) Regulatory Capital Matters (Continued)
As of December 31, 2008, the most recent notifications from the Company's bank regulatory agencies categorized the bank subsidiary as well capitalized under the regulatory framework for prompt corrective action. To be categorized as well capitalized, an institution must maintain minimum Total risk-based, Tier 1 risk-based, and Tier 1 leverage ratios, as set forth in the following table. Prompt corrective action provisions are not applicable to bank holding companies. There are no conditions or events since that notification that management believes have changed the categorization of the Company or its bank subsidiary as well capitalized. The Company's and the bank subsidiaries' actual capital amounts and ratios for 2008 and 2007 are presented in the table below.
| | | | | | | | | | | | | | | | | | | | | |
| | Actual | | Minimum Capital
Adequacy Requirement | | Minimum to be Well
Capitalized Under
Prompt Corrective
Action Provisions | |
|---|
| | Amount | | Ratio | | Amount | | Ratio | | Amount | | Ratio | |
|---|
| | (Dollars in thousands)
| |
|---|
As of December 31, 2008: | | | | | | | | | | | | | | | | | | | |
| | Total capital to risk weighted assets: | | | | | | | | | | | | | | | | | | | |
| | | Consolidated | | $ | 212,334 | | | 10.61 | % | $ | 160,065 | | | 8.00 | % | | N/A | | | N/A | |
| | | Guaranty Bank | | | 210,340 | | | 10.52 | | | 159,882 | | | 8.00 | | | 199,853 | | | 10.00 | |
| | Tier 1 capital to risk weighted assets: | | | | | | | | | | | | | | | | | | | |
| | | Consolidated | | | 187,074 | | | 9.35 | | | 80,033 | | | 4.00 | | | N/A | | | N/A | |
| | | Guaranty Bank | | | 185,109 | | | 9.26 | | | 79,941 | | | 4.00 | | | 119,912 | | | 6.00 | |
| | Tier 1 capital to average assets: | | | | | | | | | | | | | | | | | | | |
| | | Consolidated | | | 187,074 | | | 8.98 | | | 83,348 | | | 4.00 | | | N/A | | | N/A | |
| | | Guaranty Bank | | | 185,109 | | | 8.90 | | | 83,184 | | | 4.00 | | | 103,980 | | | 5.00 | |
As of December 31, 2007: | | | | | | | | | | | | | | | | | | | |
| | Total capital to risk weighted assets: | | | | | | | | | | | | | | | | | | | |
| | | Consolidated | | $ | 213,536 | | | 10.87 | % | $ | 157,129 | | | 8.00 | % | | N/A | | | N/A | |
| | | CBW | | | 89,956 | | | 13.38 | | | 53,779 | | | 8.00 | | $ | 67,223 | | | 10.00 | |
| | | Guaranty Bank | | | 136,255 | | | 10.55 | | | 103,347 | | | 8.00 | | | 129,184 | | | 10.00 | |
| | Tier 1 capital to risk weighted assets: | | | | | | | | | | | | | | | | | | | |
| | | Consolidated | | | 188,936 | | | 9.62 | | | 78,564 | | | 4.00 | | | N/A | | | N/A | |
| | | CBW | | | 81,524 | | | 12.13 | | | 26,889 | | | 4.00 | | | 40,334 | | | 6.00 | |
| | | Guaranty Bank | | | 120,828 | | | 9.35 | | | 51,673 | | | 4.00 | | | 77,510 | | | 6.00 | |
| | Tier 1 capital to average assets: | | | | | | | | | | | | | | | | | | | |
| | | Consolidated | | | 188,936 | | | 8.55 | | | 88,448 | | | 4.00 | | | N/A | | | N/A | |
| | | CBW | | | 81,524 | | | 9.71 | | | 33,591 | | | 4.00 | | | 41,989 | | | 5.00 | |
| | | Guaranty Bank | | | 120,828 | | | 8.82 | | | 54,818 | | | 4.00 | | | 68,523 | | | 5.00 | |
Dividend Restrictions
The Holding Company's principal source of funds for stock repurchases and operating expenses is dividends received from the Bank. Banking regulations limit the amount of dividends that may be paid without prior approval of regulatory agencies. Under these regulations, the amount of dividends that may be paid in any calendar year is limited to the current year's net profits, combined with the retained
115
Table of Contents
GUARANTY BANCORP AND SUBSIDIARIES
Notes to Consolidated Financial Statements (Continued)
(19) Regulatory Capital Matters (Continued)
net profits of the preceding two years, subject to the capital requirements described above. From time to time, the Bank dividends funds to the Holding Company to assist the Holding Company with its general obligations. During 2008, the Bank requested and was granted approval to pay $19 million in dividends from the Bank to the Holding Company. The Bank is required to obtain regulatory approval for future dividend payments to the Holding Company.
(20) Assets Held for Sale and Discontinued Operations
On March 1, 2006, the Company sold certain assets of its First MainStreet Insurance subsidiary. First MainStreet Insurance was acquired by the Company on October 1, 2005 as part of the First MainStreet Financial, Ltd. acquisition. The following table presents the results of operations that were reported as discontinued operations for the year ended December 31, 2006.
| | | | | |
| | Year Ended
December 31, 2006 | |
|---|
| | (In thousands)
| |
|---|
Results of operations: | | | | |
Interest expense | | $ | 1 | |
| | | | |
Noninterest income | | | 507 | |
| | | | |
Noninterest expense: | | | | |
| | Salaries and employee benefits | | | 253 | |
| | Occupancy expense | | | 21 | |
| | Furniture and equipment | | | 17 | |
| | Amortization | | | 46 | |
| | Merger, acquisition and transition | | | — | |
| | Other general and administrative | | | 143 | |
| | | | |
| | Total noninterest expense | | | 480 | |
| | | | |
Income before income taxes | | | 26 | |
| | Income taxes provision (benefit) | | | 9 | |
| | | | |
Income from discontinued operations, net of tax | | $ | 17 | |
| | | | |
On June 19, 2006, the Company signed a definitive agreement to sell Collegiate Peaks to a new group of investors. This agreement followed the August 25, 2005 definitive agreement for the sale of Collegiate Peaks that was terminated on April 25, 2006. The Company consummated the sale of Collegiate Peaks as of November 1, 2006. The following table presents the results of operations that are presented in discontinued operations for the year ended December 31, 2006:
| | | | | |
| | Year Ended
December 31, 2006 | |
|---|
| | (In Thousands)
| |
|---|
Selected Results of Operations: | | | | |
| | Interest income | | $ | 4,651 | |
| | Noninterest income | | | 300 | |
| | Income before income taxes | | | 1,583 | |
| | Net income from discontinued operations, net of tax | | | 1,141 | |
116
Table of Contents
GUARANTY BANCORP AND SUBSIDIARIES
Notes to Consolidated Financial Statements (Continued)
(20) Assets Held for Sale and Discontinued Operations (Continued)
The income from discontinued operations consisted of the following:
| | | | |
| | Year Ended
December 31, 2006 | |
|---|
| | (In Thousands)
| |
|---|
Collegiate Peaks income from operations | | $ | 1,141 | |
Impairment of Collegiate Peaks assets | | | (325 | ) |
Tax benefit from impaired Collegiate Peaks income | | | 124 | |
Gain on sale of Collegiate Peaks | | | 1,039 | |
First MainStreet Insurance net income | | | 17 | |
Elimination of intercompany income from Collegiate Peaks and First MainStreet Insurance | | | (8 | ) |
| | | | |
Income from discontinued operations, net of tax of $327 | | $ | 1,988 | |
| | | | |
(21) Supplemental Cash Flow Disclosures
The cash balances and activity associated with Collegiate Peaks Bank were classified as assets held for sale, and as such, did not affect cash and cash equivalents as classified in the Company's consolidated balance sheets as of December 31, 2005, and through November 1, 2006, the date of sale. The following table presents Collegiate Peaks Bank cash activity for the period from January 1, 2006 to November 1, 2006, which is included in the accompanying statements of cash flows for the year ended December 31, 2006. The consolidated statements of cash flows include all cash activity of the Company,
117
Table of Contents
GUARANTY BANCORP AND SUBSIDIARIES
Notes to Consolidated Financial Statements (Continued)
(21) Supplemental Cash Flow Disclosures (Continued)
including cash and cash equivalents classified within assets held for sale in the Company's consolidated balance sheets.
| | | | | | | | |
| | Period from
January 1, 2006 to
November 1, 2006 | |
|---|
| | (In Thousands)
| |
|---|
Cash flows from operating activities: | | | | |
| | Net income | | $ | 1,141 | |
| | Adjustments to reconcile net income (loss) to net cash provided by operating activities: | | | | |
| | | Provision for loan losses | | | 100 | |
| | | Depreciation and amortization | | | 77 | |
| | | Loss on sale of real estate owned and assets | | | 9 | |
| | | Other | | | (228 | ) |
| | | | Accrued interest receivable and other assets | | | (245 | ) |
| | | | Accrued interest payable and other liabilities | | | 60 | |
| | | | |
| | | | | Net cash provided by operating activities | | | 914 | |
| | | | |
Cash flows from investing activities: | | | | |
| | Activity in available-for-sale securities: | | | | |
| | | Maturities, prepayments, and calls | | | 11,550 | |
| | | Purchases | | | (12,231 | ) |
| | Activity in held-to-maturity securities and bank stocks: | | | | |
| | | Maturities, prepayments, and calls | | | 231 | |
| | Loan originations and principal collections, net | | | (1,594 | ) |
| | Proceeds from sales of premises and equipment | | | 8 | |
| | Additions to premises and equipment | | | (40 | ) |
| | | | |
| | | | | Net cash used by investing activities | | | (2,076 | ) |
| | | | |
Cash flows from financing activities: | | | | |
| | Net increase in deposits | | | 15,687 | |
| | Net change in federal funds purchased and repurchase agreements | | | 6,582 | |
| | Dividends paid on common stock | | | (1,750 | ) |
| | | | |
| | | | | Net cash provided by financing activities | | | 20,519 | |
| | | | |
| | | | | Net change in cash and cash equivalents | | | 19,357 | |
Cash and cash equivalents, beginning of period | | |
19,869 | |
| | | | |
Cash and cash equivalents, end of period | | $ | 39,226 | |
| | | | |
Supplemental disclosure of cash flow activity: | | | | |
| | Interest paid on deposits and borrowed funds | | $ | 926 | |
118
Table of Contents
GUARANTY BANCORP AND SUBSIDIARIES
Notes to Consolidated Financial Statements (Continued)
(22) Parent Company Only Condensed Financial Information
The following is condensed financial information of Guaranty Bancorp (parent company only):
Balance Sheets
(Parent Company Only)
December 31, 2008 and 2007
| | | | | | | | | |
| | 2008 | | 2007 | |
|---|
| | (In thousands)
| |
|---|
ASSETS | | | | | | | |
Cash | | $ | 3,595 | | $ | — | |
Other loans | | | 454 | | | 872 | |
Goodwill | | | — | | | 4,756 | |
Investment in subsidiaries | | | 199,614 | | | 467,446 | |
Other assets | | | 3,915 | | | 7,128 | |
| | | | | | |
| | | Total assets | | $ | 207,578 | | $ | 480,202 | |
| | | | | | |
LIABILITIES AND STOCKHOLDERS' EQUITY | | | | | | | |
Liabilities: | | | | | | | |
| | Borrowings | | $ | — | | $ | 15,160 | |
| | Subordinated debentures | | | 41,239 | | | 41,239 | |
| | Other liabilities | | | 4,759 | | | 5,149 | |
| | | | | | |
| | | Total liabilities | | | 45,998 | | | 61,548 | |
| | | | | | |
Stockholders' equity: | | | | | | | |
| | Common stock | | | 65 | | | 64 | |
| | Additional paid-in capital | | | 617,188 | | | 617,611 | |
| | Stock to be issued | | | 710 | | | 573 | |
| | Accumulated deficit | | | (352,003 | ) | | (95,196 | ) |
| | Accumulated other comprehensive loss | | | (1,302 | ) | | (1,472 | ) |
| | Treasury stock | | | (103,078 | ) | | (102,926 | ) |
| | | | | | |
| | | Total stockholders' equity | | | 161,580 | | | 418,654 | |
| | | | | | |
| | | Total liabilities and stockholders' equity | | $ | 207,578 | | $ | 480,202 | |
| | | | | | |
119
Table of Contents
GUARANTY BANCORP AND SUBSIDIARIES
Notes to Consolidated Financial Statements (Continued)
(22) Parent Company Only Condensed Financial Information (Continued)
Statements of Income (Loss)
(Parent Company Only)
Years ended December 31, 2008, 2007 and 2006
| | | | | | | | | | | | |
| | 2008 | | 2007 | | 2006 | |
|---|
| | (In thousands)
| |
|---|
Income: | | | | | | | | | | |
| | Interest income on other investments | | $ | 42 | | $ | 74 | | $ | 111 | |
| | Charges for services—subsidiary banks | | | 5,256 | | | 15,511 | | | 12,620 | |
| | Other | | | 52 | | | 289 | | | 405 | |
| | | | | | | | |
| | | Total income | | | 5,350 | | | 15,874 | | | 13,136 | |
Expenses: | | | | | | | | | | |
| | Interest expense | | | 3,597 | | | 4,912 | | | 4,420 | |
| | Salaries and benefits | | | 1,959 | | | 12,218 | | | 11,489 | |
| | Professional services | | | 2,210 | | | 3,024 | | | 3,798 | |
| | Merger, acquisitions and transition | | | — | | | — | | | 805 | |
| | Impairment of goodwill | | | 4,756 | | | — | | | — | |
| | Other | | | 1,066 | | | 5,377 | | | 4,603 | |
| | | | | | | | |
| | | Total expenses | | | 13,588 | | | 25,531 | | | 25,115 | |
| | | | | | | | |
Loss before federal income taxes and equity in undistributed net income of subsidiaries | | | (8,238 | ) | | (9,656 | ) | | (11,979 | ) |
Income tax benefit | | | (1,385 | ) | | (3,617 | ) | | (4,233 | ) |
| | | | | | | | |
Loss before equity in undistributed net income of subsidiaries | | | (6,853 | ) | | (6,039 | ) | | (7,746 | ) |
Equity in undistributed net income (loss) of subsidiaries | | | (249,883 | ) | | (132,053 | ) | | 31,327 | |
Income (loss) from discontinued operations, net of tax | | | — | | | — | | | 837 | |
| | | | | | | | |
| | | Net income (loss) | | $ | (256,736 | ) | $ | (138,092 | ) | $ | 24,418 | |
| | | | | | | | |
120
Table of Contents
GUARANTY BANCORP AND SUBSIDIARIES
Notes to Consolidated Financial Statements (Continued)
(22) Parent Company Only Condensed Financial Information (Continued)
Statements of Cash Flows
(Parent Company Only)
Years ended December 31, 2008, 2007 and 2006
| | | | | | | | | | | | | |
| | Years ended December 31, | |
|---|
| | 2008 | | 2007 | | 2006 | |
|---|
| | (Amounts in thousands)
| |
|---|
Cash flows from operating activities | | | | | | | | | | |
| | Net income (loss) | | $ | (256,736 | ) | $ | (138,092 | ) | $ | 24,418 | |
| | Adjustments to reconcile net income (loss) to net cash used by operating activities: | | | | | | | | | | |
| | | Depreciation | | | 8 | | | 942 | | | 831 | |
| | | Loss on sale of assets | | | | | | 1 | | | 3 | |
| | | Gain on discontinued operation | | | — | | | — | | | (442 | ) |
| | | Equity based compensation | | | (1,534 | ) | | 964 | | | 1,673 | |
| | | Deferred compensation—shares to be issued | | | 164 | | | 83 | | | 275 | |
| | | Impairment of goodwill | | | 4,756 | | | | | | | |
| | | Amortization of purchase adjustment | | | — | | | — | | | (36 | ) |
| | | Other | | | 3 | | | (3 | ) | | — | |
| | | Net change in: | | | | | | | | | | |
| | | | Other assets | | | 228 | | | 3,152 | | | 6,695 | |
| | | | Other liabilities | | | (234 | ) | | (3,935 | ) | | (3,502 | ) |
| | | | Due from subsidiaries | | | | | | 247 | | | — | |
| | | | Equity in (earnings) loss of consolidated subsidiaries | | | 249,883 | | | 132,053 | | | (31,327 | ) |
| | | | | | | | |
| | | | Net cash used by operating activities | | | (3,462 | ) | | (4,588 | ) | | (1,412 | ) |
| | | | | | | | |
Cash flow from investing activities: | | | | | | | | | | |
| | Net cash and cash equivalents paid in acquisitions | | | — | | | — | | | (4,122 | ) |
| | Proceeds from sale of assets | | | �� | | | — | | | 31 | |
| | Cash from sale of subsidiaries | | | — | | | — | | | 19,835 | |
| | Payments on discontinued operations | | | — | | | — | | | (189 | ) |
| | Loan principal collections | | | 418 | | | 386 | | | — | |
| | Transfers of premises and equipment to (from) affiliates | | | 2,978 | | | (35 | ) | | — | |
| | Additions to premises and equipment | | | — | | | (700 | ) | | — | |
| | Dividends received from subsidiaries | | | 19,000 | | | 25,000 | | | 29,653 | |
| | | | | | | | |
| | | | Net cash provided by investing activities | | | 22,396 | | | 24,651 | | | 45,208 | |
| | | | | | | | |
Cash flows from financing activities: | | | | | | | | | | |
| | Net changes in short-term borrowings | | | (15,160 | ) | | 12,710 | | | (5,358 | ) |
| | Repurchase of common stock | | | (179 | ) | | (33,386 | ) | | (37,854 | ) |
| | Tax benefit from vesting of stock compensation | | | — | | | — | | | 2 | |
| | | | | | | | |
| | | | Net cash used by financing activities | | | (15,339 | ) | | (20,676 | ) | | (43,210 | ) |
| | | | | | | | |
| | | | Net change in cash and cash equivalents | | | 3,595 | | | (613 | ) | | 586 | |
Cash and cash equivalents, beginning of year | | | — | | | 613 | | | 27 | |
| | | | | | | | |
Cash and cash equivalents, end of year | | $ | 3,595 | | $ | — | | $ | 613 | |
| | | | | | | | |
121
Table of Contents
GUARANTY BANCORP AND SUBSIDIARIES
Notes to Consolidated Financial Statements (Continued)
(23) Quarterly Results of Operations (Unaudited)
2008 Quarterly Results of Operations
| | | | | | | | | | | | | | | |
| | Quarter Ended | |
|---|
| | December 31,
2008 | | September 30,
2008 | | June 30,
2008 | | March 31,
2008 | |
|---|
| | (Amounts in thousands, except share data)
| |
|---|
Interest income | | $ | 27,974 | | $ | 29,719 | | $ | 30,216 | | $ | 33,403 | |
Interest expense | | | 10,295 | | | 9,877 | | | 9,825 | | | 11,753 | |
| | | | | | | | | | |
Net interest income | | | 17,679 | | | 19,842 | | | 20,391 | | | 21,650 | |
| | Provision for loan losses | | | 1,250 | | | 30,750 | | | 900 | | | 875 | |
| | | | | | | | | | |
| | | Net interest income after provision for loan losses | | | 16,429 | | | (10,908 | ) | | 19,491 | | | 20,775 | |
Noninterest income | | | 2,266 | | | 2,707 | | | 3,132 | | | 2,515 | |
Noninterest expense | | | 15,367 | | | 265,882 | | | 19,697 | | | 18,710 | |
| | | | | | | | | | |
| | | Income (loss) before income taxes | | | 3,328 | | | (274,083 | ) | | 2,926 | | | 4,580 | |
Income tax expense (benefit) | | | (495 | ) | | (8,254 | ) | | 901 | | | 1,335 | |
| | | | | | | | | | |
Net income (loss) | | $ | 3,823 | | $ | (265,829 | ) | $ | 2,025 | | $ | 3,245 | |
| | | | | | | | | | |
Earnings (loss) per share—basic and diluted | | $ | 0.06 | | $ | (5.21 | ) | $ | 0.04 | | $ | 0.06 | |
The third quarter 2008 results included a $250.7 million goodwill impairment charge, which is not deductible for income tax purposes, as well as a $30.8 million provision for loan losses.
2007 Quarterly Results of Operations
| | | | | | | | | | | | | | | |
| | Quarter Ended | |
|---|
| | December 31,
2007 | | September 30,
2007 | | June 30,
2007 | | March 31,
2007 | |
|---|
| | (Amounts in thousands, except per share data)
| |
|---|
Interest income | | $ | 38,542 | | $ | 41,084 | | $ | 41,703 | | $ | 42,360 | |
Interest expense | | | 14,358 | | | 15,848 | | | 15,716 | | | 15,517 | |
| | | | | | | | | | |
Net interest income | | | 24,184 | | | 25,236 | | | 25,987 | | | 26,843 | |
| | Provision for loan losses | | | 3,025 | | | 8,026 | | | 12,766 | | | 849 | |
| | | | | | | | | | |
| | | Net interest income after provision for loan losses | | | 21,159 | | | 17,210 | | | 13,221 | | | 25,994 | |
Noninterest income | | | 2,932 | | | 2,620 | | | 2,577 | | | 2,567 | |
Noninterest expense | | | 160,048 | | | 18,205 | | | 27,622 | | | 20,682 | |
| | | | | | | | | | |
| | | Income (loss) before income taxes | | | (135,957 | ) | | 1,625 | | | (11,824 | ) | | 7,879 | |
Income tax expense (benefit) | | | 2,253 | | | 122 | | | (5,030 | ) | | 2,470 | |
| | | | | | | | | | |
Net income (loss) | | $ | (138,210 | ) | $ | 1,503 | | $ | (6,794 | ) | $ | 5,409 | |
Earnings (loss) per share—basic and diluted | | $ | (2.68 | ) | $ | 0.03 | | $ | (0.13 | ) | $ | 0.10 | |
The primary difference between the first quarter and second quarter 2007 results is the provision for loan losses of $11.9 million and a $6.5 million charge for a litigation settlement recorded in the second quarter 2007. The fourth quarter 2007 results were affected primarily by the $142.2 million goodwill impairment charge, which was not deductible for income tax purposes.
122
Table of Contents
ITEM 9. CHANGES IN AND DISAGREEMENTS WITH ACCOUNTANTS ON ACCOUNTING AND FINANCIAL DISCLOSURE
None.
ITEM 9A. CONTROLS AND PROCEDURES
(a) Evaluation of disclosure controls and procedures. The Company's management, with the participation of the Chief Executive Officer and the Chief Financial Officer, conducted an evaluation of the effectiveness of the Company's disclosure controls and procedures (as defined in Rule 13a-15(e) under the Securities Exchange Act of 1934) as of December 31, 2008. Based on that evaluation, the Company's Chief Executive Officer and Chief Financial Officer have concluded that the Company's disclosure controls and procedures were effective as of December 31, 2008.
(b) Management's Report on Internal Control over Financial Reporting. The Company's management is responsible for establishing and maintaining adequate internal control over financial reporting (as defined in Rule 13a-15(f) under the Securities Exchange Act of 1934). The Company's management, with the participation of the Chief Executive Officer and the Chief Financial Officer, conducted an evaluation of the effectiveness, as of December 31, 2008, of the Company's internal control over financial reporting based on the framework in "Internal Control—Integrated Framework," issued by the Committee of Sponsoring Organizations of the Treadway Commission. Based on this evaluation, the Company's management concluded that the Company's internal control over financial reporting was effective as of December 31, 2008. Management's Report on Internal Control over Financial Reporting is set forth in Part II, Item 8 of this Annual Report on Form 10-K.
Attestation Report of the Independent Registered Public Accounting Firm. Crowe Horwath LLP, an independent registered public accounting firm, has audited the consolidated financial statements for the years ended December 31, 2008 and 2007, included in this Annual Report on Form 10-K and, as part of their audit, has issued its report on the effectiveness of the Company's internal control over financial reporting as of December 31, 2008. Crowe Horwath's report is set forth in Part II, Item 8 of this Annual Report on Form 10-K.
(c) Changes in Internal Control Over Financial Reporting. There were no changes in the Company's internal control over financial reporting that occurred during the fourth quarter of 2008 that have materially affected, or are reasonably likely to materially affect, the Company's internal control over financial reporting.
ITEM 9B. OTHER INFORMATION
None
123
Table of Contents
PART III
ITEM 10. DIRECTORS, EXECUTIVE OFFICERS AND CORPORATE GOVERNANCE OF THE REGISTRANT
Information required by this Item is incorporated herein by reference to our Proxy Statement (Schedule 14A) for our 2009 Annual Meeting of Stockholders to be filed with the SEC within 120 days of our fiscal year-end. Information relating to our Code of Business Conduct and Ethics that applies to our employees, including its senior financial officers, is included in Part I of this Annual Report on Form 10-K under "Item 1. Business—Available Information."
ITEM 11. EXECUTIVE COMPENSATION
The information required by this Item is incorporated herein by reference to our Proxy Statement (Schedule 14A) for our 2009 Annual Meeting of Stockholders to be filed with the SEC within 120 days of our fiscal year-end.
ITEM 12. SECURITY OWNERSHIP OF CERTAIN BENEFICIAL OWNERS AND MANAGEMENT AND RELATED STOCKHOLDER MATTERS
Certain information regarding securities authorized for issuance under our equity compensation plans is included under the section captioned "Securities Authorized for Issuance Under Equity Compensation Plans" in Item 5 in this Annual Report on Form 10-K. Other information required by this Item is incorporated herein by reference to our Proxy Statement (Schedule 14A) for our 2009 Annual Meeting of Stockholders to be filed with the SEC within 120 days of our fiscal year-end.
ITEM 13. CERTAIN RELATIONSHIPS AND RELATED TRANSACTIONS, AND DIRECTOR INDEPENDENCE
The information required by this Item is incorporated herein by reference to our Proxy Statement (Schedule 14A) for our 2009 Annual Meeting of Stockholders to be filed with the SEC within 120 days of our fiscal year-end.
ITEM 14. PRINCIPAL ACCOUNTANT FEES AND SERVICES
The information required by this Item is incorporated herein by reference to our Proxy Statement (Schedule 14A) for our 2009 Annual Meeting of Stockholders to be filed with the SEC within 120 days of our fiscal year-end.
124
Table of Contents
PART IV
ITEM 15. EXHIBITS AND FINANCIAL STATEMENT SCHEDULES
(a) 1. Financial Statements
The consolidated financial statements of Guaranty Bancorp and its subsidiaries and independent auditors' reports are included in Part II (Item 8) of this Form 10 K.
2. Financial Statement Schedules
All financial statement schedules have been omitted, as they are either inapplicable or included in the Notes to Consolidated Financial Statements.
3. Exhibits
The following documents are included or incorporated by reference in this Annual Report on Form 10-K:
| | | |
Exhibit
Number | | Description of Exhibit |
|---|
| | 3.1 | | Amended and Restated Certification of Incorporation of the Registrant (incorporated herein by reference from Exhibit 3.1 to Registrant's Registration Statement on Form S-1 (File No. 333-124855), as amended) |
|
3.2 |
|
Certificate of Amendment to Registrant's Certificate of Incorporation (incorporated by reference to Exhibit 3.1 to Registrant's Form 8-K filed on May 7, 2008.) |
|
3.3 |
|
Amended and Restated Bylaws of the Registrant (incorporated by reference to Exhibit 3.2 to Registrant's Form 8-K filed on May 7, 2008.) |
|
4.1 |
|
Specimen stock certificate representing shares of common stock of the Registrant (filed herewith) |
|
4.2 |
|
Indenture, dated September 7, 2000, between State Street Bank and Trust Company of Connecticut, National Association, and the Registrant (incorporated herein by reference from Exhibit 4.2 to Registrant's Registration Statement on Form S-1 (File No. 333-124855), as amended) |
|
4.3 |
|
Amended and Restated Declaration of Trust, dated September 7, 2000, by and among State Street Bank and Trust Company of Connecticut, National Association, the Administrators and the Registrant (incorporated herein by reference from Exhibit 4.3 to Registrant's Registration Statement on Form S-1 (File No. 333-124855), as amended) |
|
4.4 |
|
Guarantee Agreement, dated September 7, 2000, by and between State Street Bank and Trust Company of Connecticut, National Association, and the Registrant (incorporated herein by reference from Exhibit 4.4 to Registrant's Registration Statement on Form S-1 (File No. 333-124855), as amended) |
|
4.5 |
|
Indenture, dated February 22, 2001, State Street Bank and Trust Company of Connecticut, National Association, and the Registrant (incorporated herein by reference from Exhibit 4.5 to Registrant's Registration Statement on Form S-1 (File No. 333-124855), as amended) |
|
4.6 |
|
Amended and Restated Declaration of Trust, dated February 22, 2001, by and among State Street Bank and Trust Company of Connecticut, National Association, the Administrators and the Registrant (incorporated herein by reference from Exhibit 4.6 to Registrant's Registration Statement on Form S-1 (File No. 333-124855), as amended) |
125
Table of Contents
| | | |
Exhibit
Number | | Description of Exhibit |
|---|
| | 4.7 | | Guarantee Agreement, dated February 22, 2001, by and between State Street Bank and Trust Company of Connecticut, National Association, and the Registrant (incorporated herein by reference from Exhibit 4.7 to Registrant's Registration Statement on Form S-1 (File No. 333-124855), as amended) |
|
4.8 |
|
Junior Subordinated Indenture, dated April 8, 2004, between Deutsche Bank Trust Company Americas and the Registrant (incorporated herein by reference from Exhibit 4.8 to Registrant's Registration Statement on Form S-1 (File No. 333-124855), as amended) |
|
4.9 |
|
Amended and Restated Trust Agreement, dated April 8, 2004, among Deutsche Bank Trust Company Americas, Deutsche Bank Trust Company Delaware, the Administrative Trustees and the Registrant (incorporated herein by reference from Exhibit 4.9 to Registrant's Registration Statement on Form S-1 (File No. 333-124855), as amended) |
|
4.10 |
|
Guarantee Agreement, dated April 8, 2004, between Deutsche Bank Trust Company Americas and the Registrant (incorporated herein by reference from Exhibit 4.10 to Registrant's Registration Statement on Form S-1 (File No. 333-124855), as amended) |
|
4.11 |
|
Assumption Letter, dated December 31, 2004, to Wells Fargo Bank, National Association, and Wells Fargo Delaware Trust Company from the Registrant (incorporated herein by reference from Exhibit 4.11 to Registrant's Registration Statement on Form S-1 (File No. 333-124855), as amended) |
|
4.12 |
|
Indenture, dated June 30, 2003, between Wells Fargo Bank, National Association, and Guaranty Corporation (incorporated herein by reference from Exhibit 4.12 to Registrant's Registration Statement on Form S-1 (File No. 333-124855), as amended) |
|
4.13 |
|
First Supplemental Indenture, dated December 31, 2004, by and between Wells Fargo Bank, National Association, and the Registrant (incorporated herein by reference from Exhibit 4.13 to Registrant's Registration Statement on Form S-1 (File No. 333-124855), as amended) |
|
4.14 |
|
Amended and Restated Declaration of Trust, dated June 30, 2003, by the Trustees, the Administrators and Guaranty Corporation (incorporated herein by reference from Exhibit 4.14 to Registrant's Registration Statement on Form S-1 (File No. 333-124855), as amended) |
|
4.15 |
|
Guarantee Agreement, dated June 30, 2003, by Wells Fargo Bank, National Association, and Guaranty Corporation (incorporated herein by reference from Exhibit 4.15 to Registrant's Registration Statement on Form S-1 (File No. 333-124855), as amended) |
|
10.1 |
† |
Form of Indemnification Agreement for Executive Officers and Directors of the Registrant (incorporated herein by reference from Exhibit 10.2 to Registrant's Registration Statement on Form S-1 (File No. 333-124855), as amended) |
|
10.2 |
† |
Guaranty Bancorp Change in Control Severance Plan, amended and restated as of January 1, 2009 (incorporated herein by reference from Exhibit 10.5 to Registrant's Form 10-Q filed on November 7, 2008) |
|
10.3 |
† |
Amended and Restated 2005 Stock Incentive Plan (incorporated herein by reference from Exhibit 10.1 to Registrant's Form 10-Q filed on May 9, 2007) |
|
10.4 |
† |
Amendment to Guaranty Bancorp 2005 Stock Incentive Plan, effective as of January 1, 2009 (incorporated herein by reference from Exhibit 10.4 to Registrant's Form 10-Q filed on November 7, 2008) |
|
10.5 |
† |
Form of Option Award Agreement (incorporated herein by reference from Exhibit 10.16 to Registrant's Registration Statement on Form S-1 (File No. 333-124855), as amended) |
126
Table of Contents
| | | |
Exhibit
Number | | Description of Exhibit |
|---|
| | 10.6 | † | Amended Form of Restricted Stock Award Agreement (incorporated herein by reference from Exhibit 10.16 to Registrant's Registration Statement on Form S-4 (File No. 333-126643), as amended) |
|
10.7 |
† |
Form of Restricted Stock Award Agreement for Directors (incorporated herein by reference from Exhibit 10.16.1 to Registrant's Registration Statement on Form S-4 (File No. 333-126643), as amended) |
|
10.8 |
† |
Amended and Restated Guaranty Bancorp Deferred Compensation Plan, effective January 1, 2009 (incorporated herein by reference from Exhibit 10.2 to Registrant's Form 10-Q filed on August 7, 2008) |
|
10.9 |
† |
Form of Executive Cash Incentive Plan (incorporated herein by reference from Exhibit 10.9 to Registrant's Form 10-K filed on March 3, 2008) |
|
10.10 |
† |
Amendment to Guaranty Bancorp Executive Cash Incentive Plan, effective as of January 1, 2009 (incorporated herein by reference from Exhibit 10.4 to Registrant's Form 10-Q filed on November 7, 2008) |
|
10.11 |
|
Services Agreement, dated as of November 8, 2006, by and between Castle Creek Financial LLC and the Registrant (incorporated herein by reference from Exhibit 10.2 to Registrant's Form 10-Q filed on November 13, 2006) |
|
10.12 |
|
Lease Agreement, dated December 17, 1996, between Stagecoach Stop, LLC and Centennial Bank of the West (incorporated herein by reference from Exhibit 10.22 to Registrant's Registration Statement on Form S-4 (File No. 333-126643), as amended) |
|
10.13 |
|
Revolving Credit Agreement, dated November 8, 2005, between U.S. Bank National Association and the Registrant (incorporated herein by reference from Exhibit 10.1 to Registrant's Form 10-Q filed on November 14, 2004) |
|
10.14 |
|
Amendment No. 1 to Revolving Credit Agreement, dated as of March 28, 2006, between U.S. Bank National Association and the Registrant (incorporated herein by reference from Exhibit 10.20 to Registrant's Form 10-K filed on March 31, 2006) |
|
10.15 |
|
Amendment No. 2 to Revolving Credit Agreement, dated May 11, 2006, between U.S. Bank National Association and the Registrant (incorporated herein by reference from Exhibit 10.2 to Registrant's Form 10-Q filed on May 15, 2006) |
|
10.16 |
|
Amendment No. 3 to Revolving Credit Agreement, dated November 7, 2006, between U.S. Bank National Association and the Registrant (incorporated herein by reference from Exhibit 10.1 to Registrant's Form 10-Q filed on November 13, 2006) |
|
10.17 |
|
Amendment No. 4 to Revolving Credit Agreement, dated July 31, 2007, between U.S. Bank National Association and the Registrant (incorporated herein by reference from Exhibit 10.2 to Registrant's Form 10-Q filed on August 8, 2007) |
|
10.18 |
|
Amendment No. 5 to Revolving Credit Agreement, dated August 8, 2007, between U.S. Bank National Association and the Registrant (incorporated herein by reference from Exhibit 10.3 to Registrant's Form 10-Q filed on August 8, 2007) |
|
10.19 |
|
Amendment No. 6 to Revolving Credit Agreement, dated November 6, 2007, between U.S. Bank National Association and the Registrant (incorporated herein by reference from Exhibit 10.1 to Registrant's Form 10-Q filed on November 9, 2007) |
127
Table of Contents
| | | |
Exhibit
Number | | Description of Exhibit |
|---|
| | 10.20 | | Amendment No. 7 to Revolving Credit Agreement, dated March 31, 2008, between U.S. Bank National Association and the Registrant (incorporated herein by reference from Exhibit 99.1 to Registrant's Form 8-K filed on April 2, 2007) |
|
10.21 |
|
Amendment No. 8 to Revolving Credit Agreement, dated August 6, 2008, between U.S. Bank National Association and the Registrant (incorporated herein by reference from Exhibit 10.1 to Registrant's Form 10-Q filed on August 7, 2008) |
|
10.22 |
|
Amendment No. 9 to Revolving Credit Agreement, dated November 6, 2008, between U.S. Bank National Association and the Registrant (incorporated herein by reference from Exhibit 10.1 to Registrant's Form 10-Q filed on November 7, 2008) |
|
10.23 |
|
Pledge Agreement, dated as of November 8, 2005, between U.S. Bank National Association and the Registrant (incorporated herein by reference from Exhibit 10.2 to Registrant's Form 10-Q filed on November 14, 2005) |
|
11.1 |
|
Statement re: Computation of Per Share Earnings (See "Item 6. Selected Financial Data" and Note 2(s) of the Notes to Consolidated Financial Statements contained in "Item 8. Financial Statements and Supplementary Data" of this Annual Report on Form 10-K) |
|
12.1 |
|
Statement re: Computation of Ratios (See "Item 6. Selected Financial Data" of this Annual Report on Form 10-K) |
|
21.1 |
|
Subsidiaries of the Registrant (filed herewith) |
|
23.1 |
|
Consent of Crowe Horwath LLP (filed herewith) |
|
23.2 |
|
Consent of KPMG LLP (filed herewith) |
|
24.1 |
|
Power of Attorney (included on signature page) |
|
31.1 |
|
Section 302 Certifications (filed herewith) |
|
32.1 |
|
Section 906 Certifications (filed herewith) |
- †
- Indicates a management contract or compensatory plan or arrangement
128
Table of Contents
SIGNATURES
Pursuant to the requirements of Section 13 or 15(d) of the Securities Exchange Act of 1934, the registrant has duly caused this report to be signed on its behalf by the undersigned, thereunto duly authorized.
Date: February 12, 2009
| | | | |
|
|
GUARANTY BANCORP |
|
|
By: |
|
/s/ PAUL W. TAYLOR
|
| | | Name: | | Paul W. Taylor |
| | | Title: | | Executive Vice President and
Chief Financial Officer |
KNOW ALL PERSONS BY THESE PRESENTS, that each person whose signature appears below constitutes and appoints Daniel M. Quinn, Paul W. Taylor and Zsolt K. Besskó, and each of them severally, his or her true and lawful attorney-in-fact with power of substitution and resubstitution to sign in his or her name, place and stead, in any and all capacities, to do any and all things and execute any and all instruments that such attorney-in-fact may deem necessary or advisable under the Securities Exchange Act of 1934 and any rules, regulations and requirements of the U.S. Securities and Exchange Commission in connection with this Annual Report on Form 10-K and any and all amendments hereto, as fully for all intents and purposes as he or she might or could do in person, and hereby ratifies and confirms all said attorneys-in-fact and agents, each acting alone, and his or her substitute or substitutes, may lawfully do or cause to be done by virtue hereof.
Pursuant to the requirements of the Securities Exchange Act of 1934, as amended, this report has been signed by the following persons on behalf of the registrant and in the capacities and on the dates indicated.
| | | | |
Signature | | Title | | Date |
|---|
|
|
|
|
|
/s/ DANIEL M. QUINN
Daniel M. Quinn | | President and Chief Executive Officer
(Principal Executive Officer) and Director | | February 11, 2009 |
/s/ PAUL W. TAYLOR
Paul W. Taylor |
|
Executive Vice President and Chief Financial Officer
(Principal Financial and Accounting Officer) |
|
February 11, 2009 |
/s/ JOHN M. EGGEMEYER
John M. Eggemeyer |
|
Chairman of the Board and Director |
|
February 11, 2009 |
129
Table of Contents
| | | | |
Signature | | Title | | Date |
|---|
|
|
|
|
|
/s/ G. HANK BROWN
G. Hank Brown | | Director | | February 11, 2009 |
/s/ EDWARD B. CORDES
Edward B. Cordes |
|
Director |
|
February 11, 2009 |
/s/ STEPHEN D. JOYCE
Stephen D. Joyce |
|
Director |
|
February 11, 2009 |
/s/ GAIL H. KLAPPER
Gail H. Klapper |
|
Director |
|
February 11, 2009 |
/s/ KATHLEEN SMYTHE
Kathleen Smythe |
|
Director |
|
February 11, 2009 |
/s/ MATTHEW P. WAGNER
Matthew P. Wagner |
|
Director |
|
February 11, 2009 |
/s/ ALBERT C. YATES
Albert C. Yates |
|
Director |
|
February 11, 2009 |
130