[LOGO]
presentation to
Friedman Billings Ramsey 2005 Investor Conference
November 30, 2005
Forward-Looking Statements
This presentation contains forward-looking statements within the meaning of Section 27A of the Securities Act of 1933 and Section 21E of the Securities Exchange Act of 1934 that involve known and unknown risks, uncertainties and other factors that may cause Centennial Bank Holdings, Inc.’s actual results, performance or achievements to be materially different from any future results, performance or achievements expressed or implied by such forward-looking statements. Such factors include, but are not limited to, the following: general economic and business conditions in those areas in which Centennial operates; demographic changes; competition; fluctuations in interest rates; the completion of planned acquisitions and the integration of such acquired businesses costs more, takes longer, is less successful than expected, or cannot be realized within the expected time frame; continued ability to attract and employ qualified personnel; costs and uncertainties related to the outcome of pending litigation; changes in business strategy or development plans; changes in governmental legislation or regulation; changes that may occur in the securities markets; credit quality; the availability of capital to fund the expansion of the Centennial’s business; economic, political and global changes arising from natural disasters, the war on terrorism, the conflict with Iraq and its aftermath; and other “Risk Factors” referenced in Centennial’s Form S-1 registration statement filed with the Securities and Exchange Commission, as supplemented from time to time. When relying on forward-looking statements to make decisions with respect to Centennial, readers are cautioned to consider these and other risks and uncertainties. Centennial can give no assurance that any goal or plan set forth in forward-looking statements can be achieved and readers are cautioned not to place undue reliance on such statements, which speak only as of the date made. The forward-looking statements are made as of the date of this presentation, and Centennial does not intend, and assumes no obligation, to update the forward-looking statements or to update the reasons why actual results could differ from those projected in the forward-looking statements. and other risks that are described in Centennial’s SEC filings.
Investors and security holders are urged to read Centennial’s quarterly reports on Form 10-Q and other documents filed by Centennial with the SEC. The documents filed by Centennial with the SEC may be obtained at Centennial’s website at www.cbhi.com or at the SEC’s website at www.sec.gov. These documents may also be obtained free of charge from Centennial by directing a request to: Centennial Bank Holdings, Inc., 1331 Seventeenth St., Suite 300, Denver, CO 80202. Attention: Investor Relations. Telephone 303-296-9600.
[LOGO]
2
Stock Summary
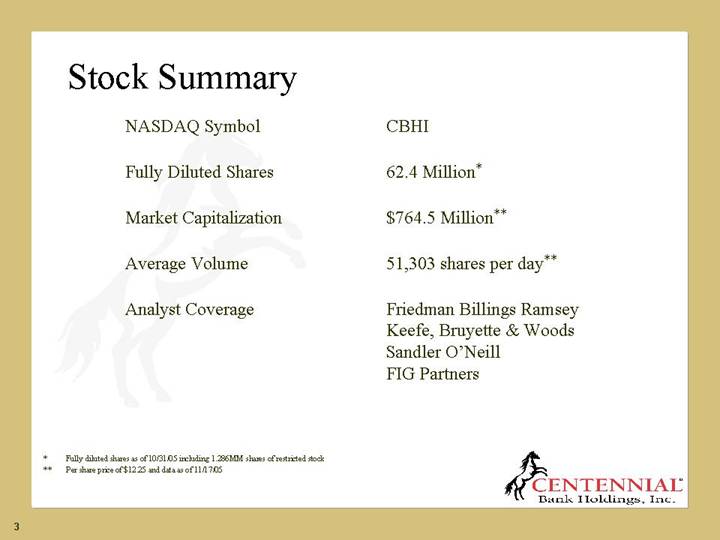
NASDAQ Symbol | | CBHI |
| | |
Fully Diluted Shares | | 62.4 Million* |
| | |
Market Capitalization | | $764.5 Million** |
| | |
Average Volume | | 51,303 shares per day** |
| | |
Analyst Coverage | | Friedman Billings Ramsey
Keefe, Bruyette & Woods
Sandler O’Neill
FIG Partners |
* Fully diluted shares as of 10/31/05 including 1.286MM shares of restricted stock
** Per share price of $12.25 and data as of 11/17/05
3
Investment Hypothesis
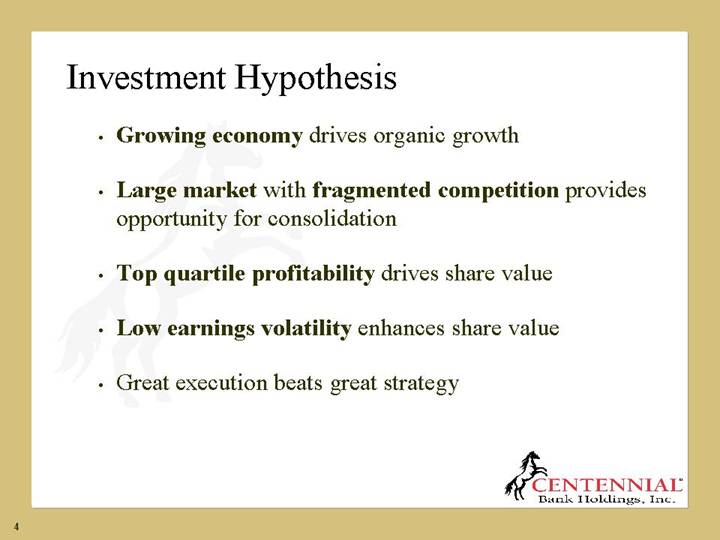
• Growing economy drives organic growth
• Large market with fragmented competition provides opportunity for consolidation
• Top quartile profitability drives share value
• Low earnings volatility enhances share value
• Great execution beats great strategy
4
Growing Economy
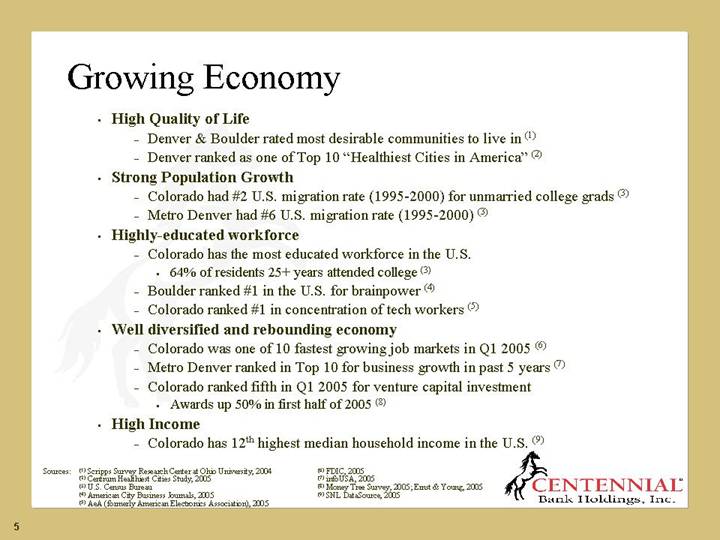
• High Quality of Life
• Denver & Boulder rated most desirable communities to live in (1)
• Denver ranked as one of Top 10 “Healthiest Cities in America” (2)
• Strong Population Growth
• Colorado had #2 U.S. migration rate (1995-2000) for unmarried college grads (3)
• Metro Denver had #6 U.S. migration rate (1995-2000) (3)
• Highly-educated workforce
• Colorado has the most educated workforce in the U.S.
• 64% of residents 25+ years attended college (3)
• Boulder ranked #1 in the U.S. for brainpower (4)
• Colorado ranked #1 in concentration of tech workers (5)
• Well diversified and rebounding economy
• Colorado was one of 10 fastest growing job markets in Q1 2005 (6)
• Metro Denver ranked in Top 10 for business growth in past 5 years (7)
• Colorado ranked fifth in Q1 2005 for venture capital investment
• Awards up 50% in first half of 2005 (8)
• High Income
• Colorado has 12th highest median household income in the U.S. (9)
Sources: | | (1) Scripps Survey Research Center at Ohio University, 2004 |
| | (2) Centrum Healthiest Cities Study, 2005 |
| | (3) U.S. Census Bureau |
| | (4) American City Business Journals, 2005 |
| | (5) AeA (formerly American Electronics Association), 2005 |
| | (6) FDIC, 2005 |
| | (7) infoUSA, 2005 |
| | (8) Money Tree Survey, 2005; Ernst & Young, 2005 |
| | (9) SNL DataSource, 2005 |
5
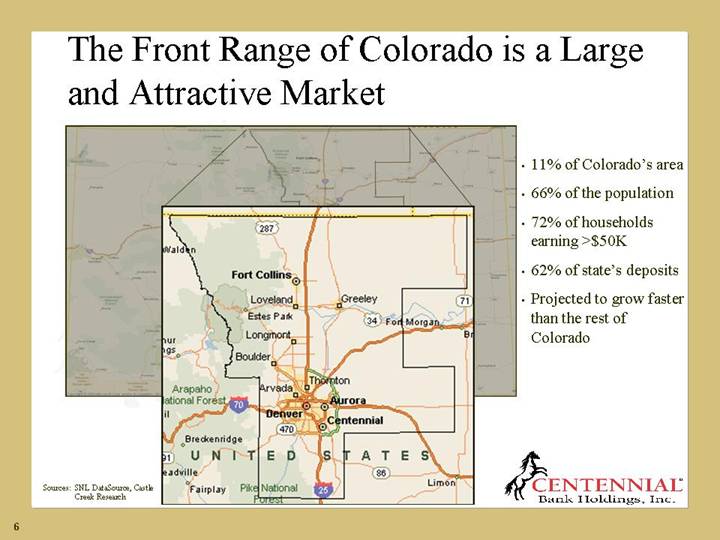
The Front Range of Colorado is a Large and Attractive Market
[GRAPHIC]
• 11% of Colorado’s area
• 66% of the population
• 72% of households earning >$50K
• 62% of state’s deposits
• Projected to grow faster than the rest of Colorado
Sources: SNL DataSource, Castle Creek Research
6
Fragmented Competition
• Strong community bank culture
• Despite an increase in interstate banks, Colorado-based banks maintained market share from 1994-2004
• Top 5 Colorado depositories have 51% of deposits
• Second-lowest among Western States
• Top 5 depositories in Front Range have 56% of deposits
• Only 3 of the 7 largest banks in the U.S. have a significant presence along the Front Range
Sources: SNL DataSource, Castle Creek Research, KBW Research Report, October 3, 2005
7
Centennial’s Goal is to Create the Dominant Community Bank Along Colorado’s Front Range
March 2004
Announcement of original investment in Centennial Bank Holdings | | | | August 2004
Announcement of Guaranty Corporation acquisition | | December 2004
Announcement of First MainStreet Financial acquisition | | | | June 2005
Announcement of Foothills Bank acquisition | | August 2005
Announcement of Collegiate Peaks divestiture | | Q4 2005
Sale of Collegiate Peaks Bank completed (Projected) |
| | | | | | | | | | | | | | |
Q1 2004 | | Q2 2004 | | Q3 2004 | | Q4 2004 | | Q1 2005 | | Q2 2005 | | Q3 2005 | | Q4 2005 |
| | | | | | | | | | | | | | |
| | | | July 2004
Original investment closes | | December 2004
Guaranty Corporation acquisition closes | | | | | | October 2005
First MainStreet Financial acquisition closes | | November 2005 Foothills Bank acquisition closes |
Sources: SEC Filings, Castle Creek Research
8
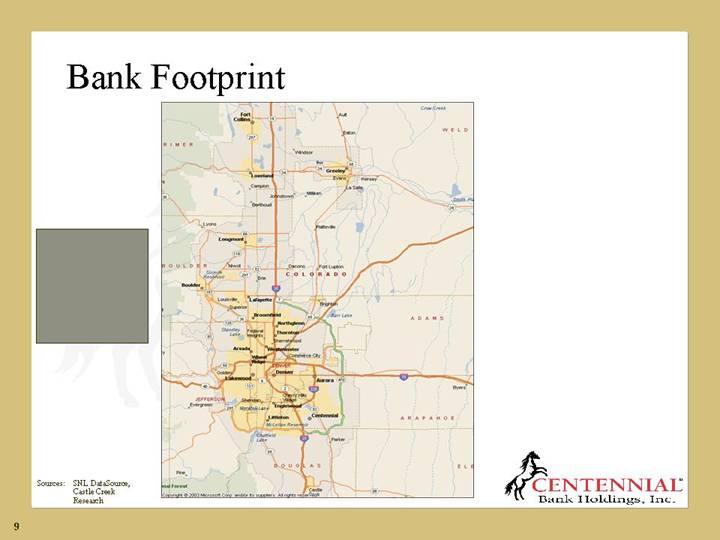
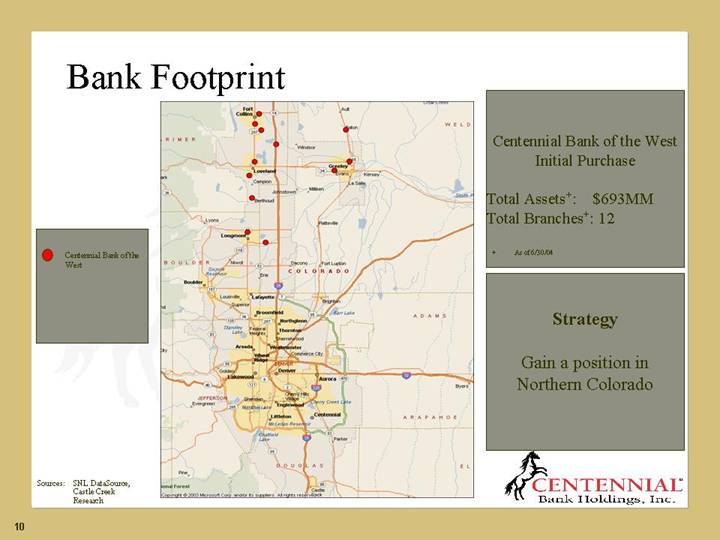
Bank Footprint
[GRAPHIC]
Sources: SNL DataSource, Castle Creek Research
9
[GRAPHIC]
• Centennial Bank of the West
Centennial Bank of the West Initial Purchase
Total Assets+: | | $ | 693 | MM |
Total Branches+: | | 12 | |
+ As of 6/30/04
Strategy
Gain a position in Northern Colorado
Sources: SNL DataSource, Castle Creek Research
10
[GRAPHIC]
• Centennial Bank of the West
• Guaranty Bank & Trust
Guaranty Bank & Trust Acquisition+
Assets++: | | $ | 1,334 | MM |
Branches++: | | 16 | |
Total Assets: | | $ | 2,027 | MM |
Total Branches: | | 28 | |
+ Excludes two Collegiate Peaks Bank branches whose sale is expected to close in Q4 2005
++ As of 12/31/04
Strategy
Add Denver market to existing Northern Colorado footprint
Sources: SNL DataSource, Castle Creek Research
11
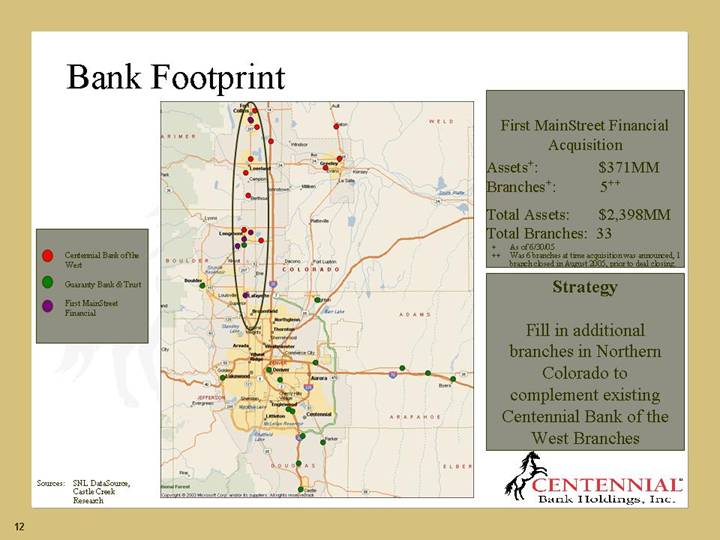
[GRAPHIC]
• Centennial Bank of the West
• Guaranty Bank & Trust
• First MainStreet Financial
First MainStreet Financial Acquisition
Assets+: | | $ | 371 | MM |
Branches+: | | 5 | ++ |
| | | |
Total Assets: | | $ | 2,398 | MM |
Total Branches: | | 33 | |
+ As of 6/30/05
++ Was 6 branches at time acquisition was announced, 1 branch closed in August 2005, prior to deal closing.
Strategy
Fill in additional branches in Northern Colorado to complement existing Centennial Bank of the West Branches
Sources: SNL DataSource, Castle Creek Research
12
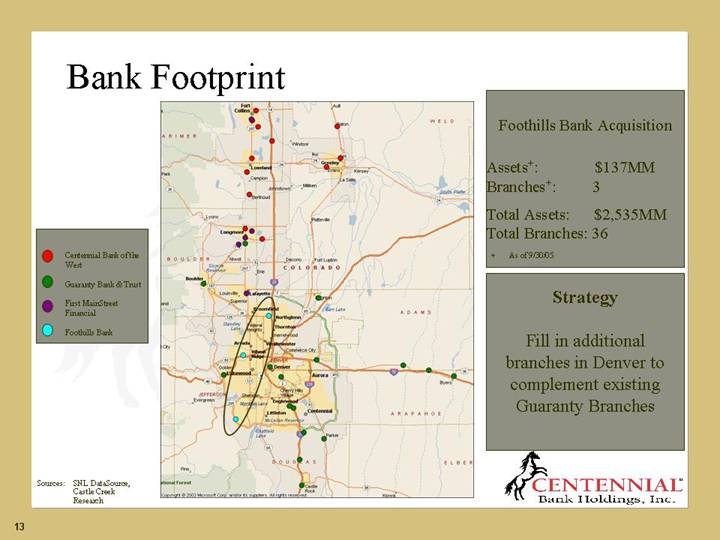
[GRAPHIC]
• Centennial Bank of the West
• Guaranty Bank & Trust
• First MainStreet Financial
• Foothills Bank
Foothills Bank Acquisition
Assets+: | | $ | 137 | MM |
Branches+: | | 3 | |
Total Assets: | | $ | 2,535 | MM |
Total Branches: | | 36 | |
| | | | | |
+ As of 9/30/05
Strategy
Fill in additional branches in Denver to complement existing Guaranty Branches
Sources: SNL DataSource, Castle Creek Research
13
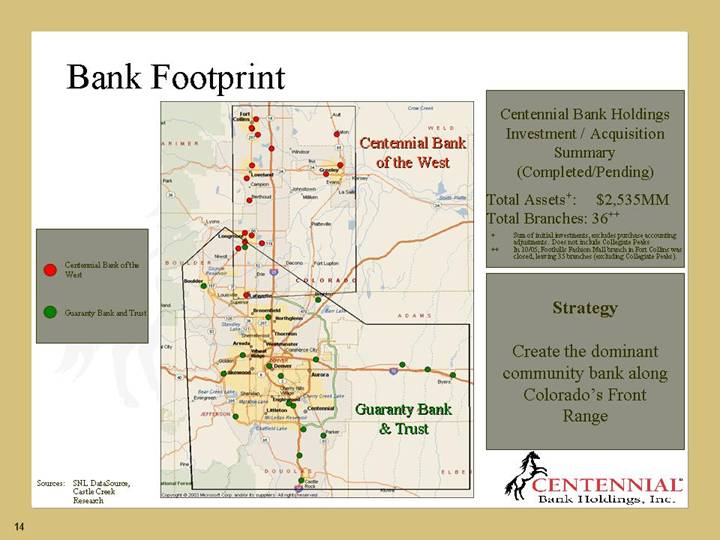
[GRAPHIC]
• Centennial Bank of the West
• Guaranty Bank and Trust
Centennial Bank Holdings Investment / Acquisition Summary (Completed/Pending)
Total Assets+: | | $ | 2,535 | MM |
Total Branches: | | 36 | ++ |
+ Sum of initial investments, excludes purchase accounting adjustments. Does not include Collegiate Peaks
++ In 10/05, Foothills Fashion Mall branch in Fort Collins was closed, leaving 35 branches (excluding Collegiate Peaks).
Strategy
Create the dominant community bank along Colorado’s Front Range
Sources: SNL DataSource, Castle Creek Research
14
Centennial’s goal is to rank among the top quartile of its peers in terms of financial performance
15
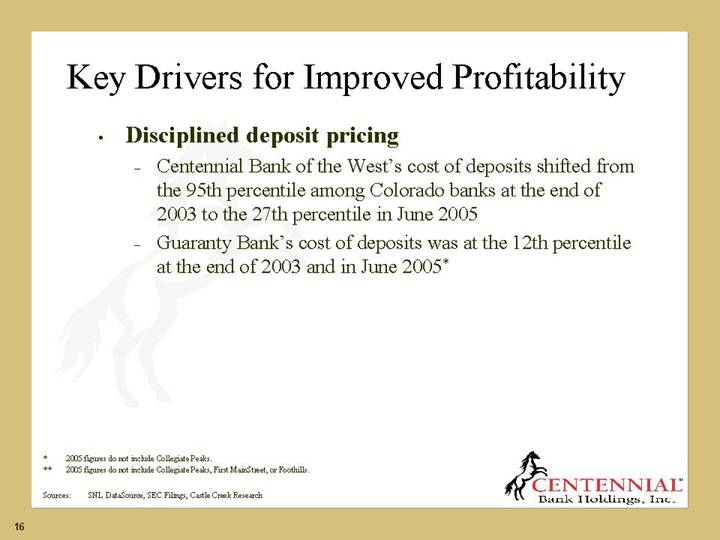
Key Drivers for Improved Profitability
• Disciplined deposit pricing
• Centennial Bank of the West’s cost of deposits shifted from the 95th percentile among Colorado banks at the end of 2003 to the 27th percentile in June 2005
• Guaranty Bank’s cost of deposits was at the 12th percentile at the end of 2003 and in June 2005*
* 2005 figures do not include Collegiate Peaks.
** 2005 figures do not include Collegiate Peaks, First MainStreet, or Foothills.
Sources: SNL DataSource, SEC Filings, Castle Creek Research
16
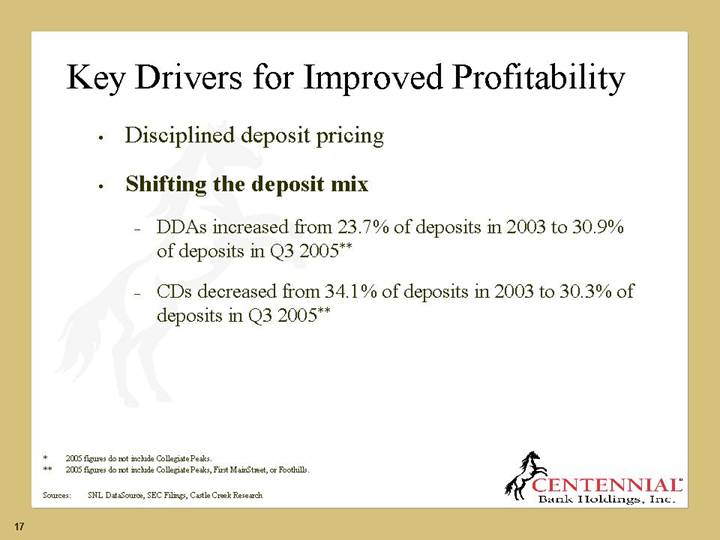
• Disciplined deposit pricing
• Shifting the deposit mix
• DDAs increased from 23.7% of deposits in 2003 to 30.9% of deposits in Q3 2005**
• CDs decreased from 34.1% of deposits in 2003 to 30.3% of deposits in Q3 2005**
* 2005 figures do not include Collegiate Peaks.
** 2005 figures do not include Collegiate Peaks, First MainStreet, or Foothills.
Sources: SNL DataSource, SEC Filings, Castle Creek Research
17
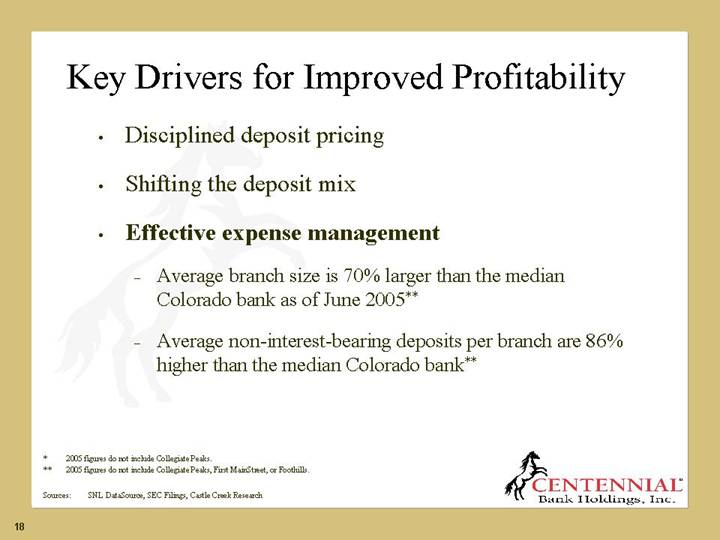
• Disciplined deposit pricing
• Shifting the deposit mix
• Effective expense management
• Average branch size is 70% larger than the median Colorado bank as of June 2005**
• Average non-interest-bearing deposits per branch are 86% higher than the median Colorado bank**
* 2005 figures do not include Collegiate Peaks.
** 2005 figures do not include Collegiate Peaks, First MainStreet, or Foothills.
Sources: SNL DataSource, SEC Filings, Castle Creek Research
18
Expense Management Requires the Rapid Assimilation of Acquisitions
• First three acquisitions have been fully integrated
• Elimination of redundant expenses is substantially complete
• Policies and procedures are being standardized
• Priority will be given to acquisitions that improve operational efficiency
19
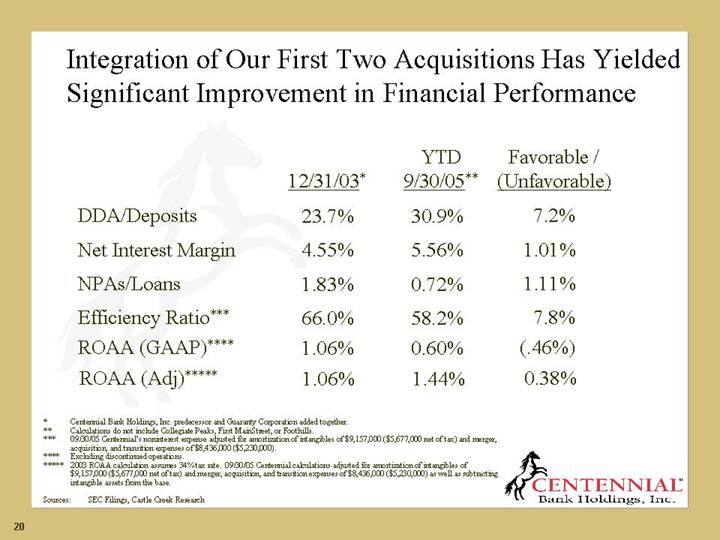
Integration of Our First Two Acquisitions Has Yielded Significant Improvement in Financial Performance
| | | | YTD | | Favorable / | |
| | 12/31/03* | | 9/30/05** | | (Unfavorable) | |
| | | | | | | |
DDA/Deposits | | 23.7 | % | 30.9 | % | 7.2 | % |
| | | | | | | |
Net Interest Margin | | 4.55 | % | 5.56 | % | 1.01 | % |
| | | | | | | |
NPAs/Loans | | 1.83 | % | 0.72 | % | 1.11 | % |
| | | | | | | |
Efficiency Ratio*** | | 66.0 | % | 58.2 | % | 7.8 | % |
| | | | | | | |
ROAA (GAAP)**** | | 1.06 | % | 0.60 | % | (.46 | )% |
| | | | | | | |
ROAA (Adj)***** | | 1.06 | % | 1.44 | % | 0.38 | % |
* Centennial Bank Holdings, Inc. predecessor and Guaranty Corporation added together.
** Calculations do not include Collegiate Peaks, First MainStreet, or Foothills.
*** 09/30/05 Centennial’s noninterest expense adjusted for amortization of intangibles of $9,157,000 ($5,677,000 net of tax) and merger, acquisition, and transition expenses of $8,436,000 ($5,230,000).
**** Excluding discontinued operations.
***** 2003 ROAA calculation assumes 34% tax rate. 09/30/05 Centennial calculations adjusted for amortization of intangibles of $9,157,000 ($5,677,000 net of tax) and merger, acquisition, and transition expenses of $8,436,000 ($5,230,000) as well as subtracting intangible assets from the base.
Sources: SEC Filings, Castle Creek Research
20
Improved Financial Performance Has Narrowed the Gap with the Top Quartile
| | Median Top | | Centennial | | Favorable / | |
| | Quartile Peers | | YTD | | (Unfavorable) | |
| | YTD 6/30/05* | | 9/30/05 | | Peer Variance | |
| | | | | | | |
DDA/Deposits | | 22.7 | % | 30.9 | % | 8.2 | % |
Net Interest Margin | | 4.39 | % | 5.56 | % | 1.17 | % |
NPAs/Loans | | 0.12 | % | 0.72 | % | (0.6 | )% |
Efficiency Ratio** | | 48.6 | % | 58.2 | % | (9.6 | )% |
ROAA (GAAP)*** | | 1.82 | % | 0.60 | % | (1.22 | )% |
ROAA (Adj)** | | 1.83 | % | 1.44 | % | (.39 | )% |
* Median of 38 banks headquartered in Colorado with the highest tax-adjusted return on average assets.
** 09/30/05 Centennial calculations adjusted for amortization of intangibles of $9,157,000 ($5,677,000 net of tax) and merger, acquisition, and transition expenses of $8,436,000 ($5,230,000). Peer Efficiency calculations are adjusted for goodwill amortization. Peer ROAA calculations are adjusted for goodwill amortization and tangible assets and assume a 34% tax rate.
*** Peer ROAA calculation assumes a tax rate of 34%.
Sources: SNL DataSource, SEC Filings, Castle Creek Research
21
Low Earnings Volatility
• Greater reliance on demand deposits
• Lower reliance on time deposits
• Expense-driven approach to income allows bank to have more control over net income
• Strong credit culture breeds more predictable and consistent charge offs and loan loss provision
22
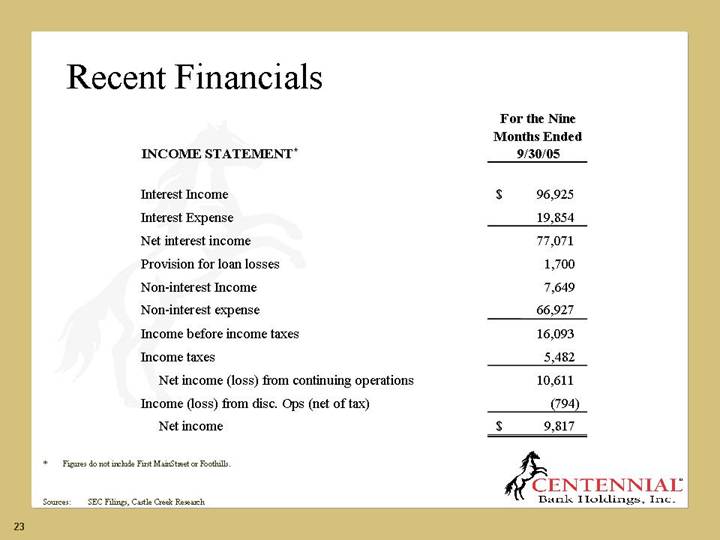
Recent Financials
INCOME STATEMENT* | | For the Nine
Months Ended
9/30/05 | |
| | | |
Interest Income | | $ | 96,925 | |
Interest Expense | | 19,854 | |
Net interest income | | 77,071 | |
Provision for loan losses | | 1,700 | |
Non-interest Income | | 7,649 | |
Non-interest expense | | 66,927 | |
Income before income taxes | | 16,093 | |
Income taxes | | 5,482 | |
Net income (loss) from continuing operations | | 10,611 | |
Income (loss) from disc. Ops (net of tax) | | (794 | ) |
Net income | | $ | 9,817 | |
* Figures do not include First MainStreet or Foothills.
Sources: SEC Filings, Castle Creek Research
23
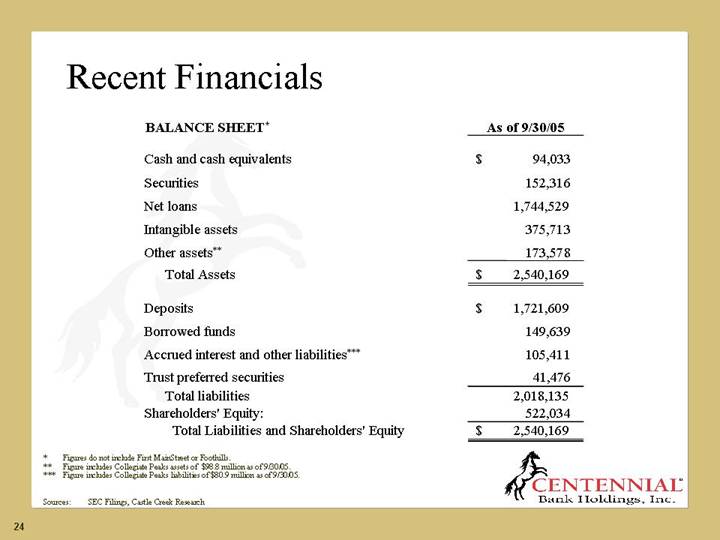
BALANCE SHEET* | | As of 9/30/05 | |
| | | |
Cash and cash equivalents | | $ | 94,033 | |
Securities | | 152,316 | |
Net loans | | 1,744,529 | |
Intangible assets | | 375,713 | |
Other assets** | | 173,578 | |
Total Assets | | $ | 2,540,169 | |
| | | |
Deposits | | $ | 1,721,609 | |
Borrowed funds | | 149,639 | |
Accrued interest and other liabilities*** | | 105,411 | |
Trust preferred securities | | 41,476 | |
Total liabilities | | 2,018,135 | |
Shareholders’ Equity: | | 522,034 | |
Total Liabilities and Shareholders’ Equity | | $ | 2,540,169 | |
* Figures do not include First MainStreet or Foothills.
** Figure includes Collegiate Peaks assets of $98.8 million as of 9/30/05.
*** Figure includes Collegiate Peaks liabilities of $80.9 million as of 9/30/05.
Sources: SEC Filings, Castle Creek Research
24
Stock Repurchase Program
• Announced in November 2005
• 2 million shares authorized for repurchase (approximately 3.2% of outstanding shares)
• Driven by Centennial’s goal of aggressively managing excess capital
• While we do not anticipate making acquisitions in the next year, if an attractive opportunity were presented, it would be considered
25
Centennial is Well Positioned
• Experienced management team
• Favorable market characteristics
• Large market share
• Disciplined management process
• Simple business model
• Shareholder focused
26
Non-GAAP Financial Measures
This presentation includes financial information determined by methods other than in accordance with U.S. GAAP. Centennial provides these non-GAAP financial measures to provide meaningful supplemental information regarding Centennial’s operational performance and to enhance investors’ overall understanding of Centennial’s core financial performance. Management believes that these non-GAAP financial measures allow for additional transparency and are used by some investors, analysts and other users of the company’s financial information as performance measures. These non-GAAP financial measures are presented for supplemental informational purposes only for understanding Centennial’s operating results and should not be considered a substitute for financial information presented in accordance with GAAP. These non-GAAP financial measures presented by Centennial may be different from non-GAAP financial measures used by other companies.
27
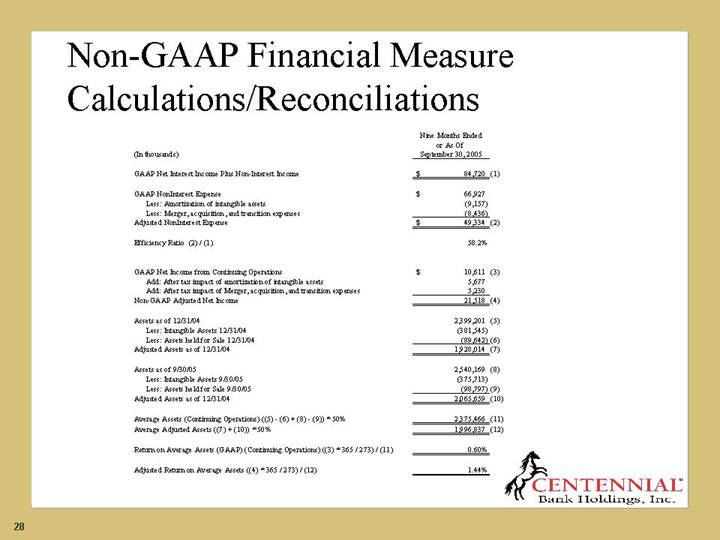
Non-GAAP Financial Measure Calculations/Reconciliations
| | Nine Months Ended | |
| | or As Of | |
(In thousands) | | September 30, 2005 | |
| | | |
GAAP Net Interest Income Plus Non-Interest Income | | $ | 84,720 | (1) |
| | | |
GAAP NonInterest Expense | | $ | 66,927 | |
Less: Amortization of intangible assets | | (9,157 | ) |
Less: Merger, acquisition, and transition expenses | | (8,436 | ) |
Adjusted NonInterest Expense | | $ | 49,334 | (2) |
| | | |
Efficiency Ratio (2) / (1) | | 58.2 | % |
| | | |
GAAP Net Income from Continuing Operations | | $ | 10,611 | (3) |
Add: After tax impact of amortization of intangible assets | | 5,677 | |
Add: After tax impact of Merger, acquisition, and transition expenses | | 5,230 | |
Non-GAAP Adjusted Net Income | | 21,518 | (4) |
| | | |
Assets as of 12/31/04 | | 2,399,201 | (5) |
Less: Intangible Assets 12/31/04 | | (381,545 | ) |
Less: Assets held for Sale 12/31/04 | | (89,642 | )(6) |
Adjusted Assets as of 12/31/04 | | 1,928,014 | (7) |
| | | |
Assets as of 9/30/05 | | 2,540,169 | (8) |
Less: Intangible Assets 9/30/05 | | (375,713 | ) |
Less: Assets held for Sale 9/30/05 | | (98,797 | )(9) |
Adjusted Assets as of 12/31/04 | | 2,065,659 | (10) |
| | | |
Average Assets (Continuing Operations) ((5) - (6) + (8) - (9)) * 50% | | 2,375,466 | (11) |
Average Adjusted Assets ((7) + (10)) * 50% | | 1,996,837 | (12) |
| | | |
Return on Average Assets (GAAP) (Continuing Operations) ((3) * 365 / 273) / (11) | | 0.60 | % |
| | | |
Adjusted Return on Average Assets ((4) * 365 / 273) / (12) | | 1.44 | % |
28
[GRAPHIC]
Centennial Bank Holdings, Inc.
Denver, CO
29