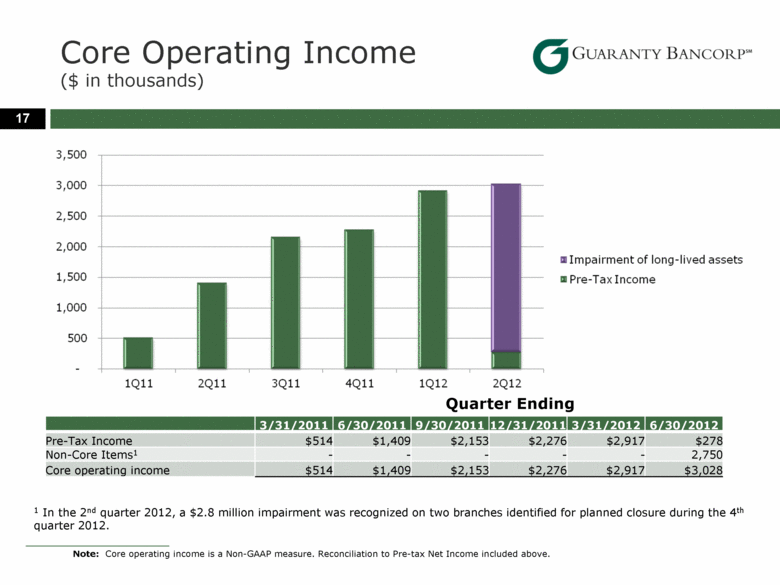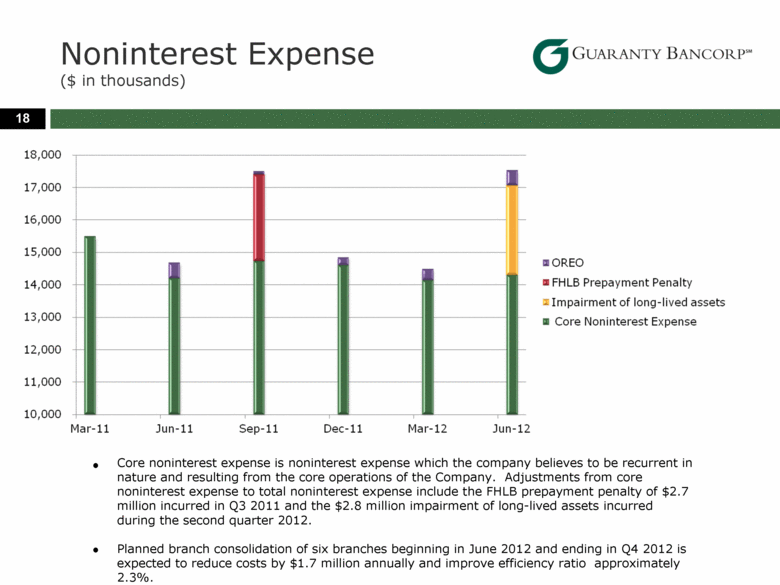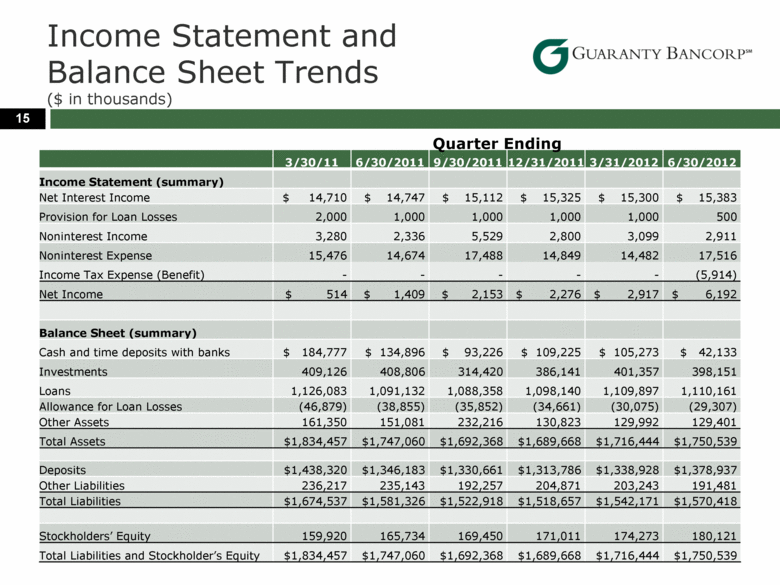
| Income Statement and Balance Sheet Trends ($ in thousands) 15 3/30/11 6/30/2011 9/30/2011 12/31/2011 3/31/2012 6/30/2012 Income Statement (summary) Net Interest Income $ 14,710 $ 14,747 $ 15,112 $ 15,325 $ 15,300 $ 15,383 Provision for Loan Losses 2,000 1,000 1,000 1,000 1,000 500 Noninterest Income 3,280 2,336 5,529 2,800 3,099 2,911 Noninterest Expense 15,476 14,674 17,488 14,849 14,482 17,516 Income Tax Expense (Benefit) - - - - - (5,914) Net Income $ 514 $ 1,409 $ 2,153 $ 2,276 $ 2,917 $ 6,192 Balance Sheet (summary) Cash and time deposits with banks $ 184,777 $ 134,896 $ 93,226 $ 109,225 $ 105,273 $ 42,133 Investments 409,126 408,806 314,420 386,141 401,357 398,151 Loans 1,126,083 1,091,132 1,088,358 1,098,140 1,109,897 1,110,161 Allowance for Loan Losses (46,879) (38,855) (35,852) (34,661) (30,075) (29,307) Other Assets 161,350 151,081 232,216 130,823 129,992 129,401 Total Assets $1,834,457 $1,747,060 $1,692,368 $1,689,668 $1,716,444 $1,750,539 Deposits $1,438,320 $1,346,183 $1,330,661 $1,313,786 $1,338,928 $1,378,937 Other Liabilities 236,217 235,143 192,257 204,871 203,243 191,481 Total Liabilities $1,674,537 $1,581,326 $1,522,918 $1,518,657 $1,542,171 $1,570,418 Stockholders’ Equity 159,920 165,734 169,450 171,011 174,273 180,121 Total Liabilities and Stockholder’s Equity $1,834,457 $1,747,060 $1,692,368 $1,689,668 $1,716,444 $1,750,539 Quarter Ending |
