Allen & Company 2006 Arizona Conference Dara Khosrowshahi Expedia, Inc. CEO & President March 6, 2006 |
Forward-Looking Statements This presentation contains "forward-looking statements" within the meaning of the Private Securities Litigation Reform Act of 1995. These statements are not guarantees of future performance. These forward-looking statements are based on assumptions which are inherently subject to uncertainties, risks and changes in circumstances that are difficult to predict. The use of words such as "anticipates," "estimates," "expects," "intends," "plans" and "believes," among others, generally identify forward-looking statements. However, these words are not the exclusive means of identifying such statements. In addition, any statements that refer to expectations, projections or other characterizations of future events or circumstances are forward-looking statements and may include statements relating to future revenues, expenses, margins, profitability, net income, earnings per share and other measures of results of operation and the prospects for future growth of Expedia, Inc.'s business. Actual results and the timing and outcome of events may differ materially from those expressed or implied in the forward-looking statements for a variety of reasons, including, among others: Expedia, Inc.'s ability to effectively update, automate and integrate disparate financial and accounting systems and approaches among its brands and businesses; the accuracy, integrity, security and redundancy of systems, including financial and accounting systems, and networks of Expedia, Inc.; reliance on newly implemented systems supporting our financial planning and projections; adverse changes in senior management; the rate of growth of the Internet and online travel; changes in global economic conditions; consumer spending, the competitive environment; the e-commerce industry and broadband access; world events (including adverse weather, health risks and terrorism); the rate of online migration in the various geographies and markets in which Expedia, Inc. operates, including Asia; fluctuations in foreign exchange rates; the health of the travel industry, including consumer and business spending on travel; Expedia, Inc.'s ability to expand successfully in international markets; possible one-time charges resulting from, among other events, integration and process review activities, platform migration and shared services efforts; failure to realize cost efficiencies; the successful completion of pending corporate transactions and the integration of current and acquired businesses; and other risks detailed in Expedia, Inc.'s public filings with the SEC, including Expedia, Inc.'s Quarterly Report on Form 10-Q for the quarter ended September 30, 2005. Except as required by law, Expedia, Inc. undertakes no obligation to update any forward-looking or other statements in this press release, whether as a result of new information, future events or otherwise. |
Travel Industry - Global Opportunity Online Total World Travel 90 785 Worldwide $875 Billion Total Online Total Europe & Asia 24 267 Online Total World Travel 52 157 10% ($90B) online United States $209 Billion Total 25% ($52B) online Europe $265 Billion Total 9% ($24B) online Source : 2004 estimates; Company estimates; IAC/Interactive S4/A filed June 17, 2005; PhoCusWright 2004 market estimates for leisure & unmanaged business travel. Asia Pacific 5% ($12B) online Online Total Europe & Asia 12 252 $264 Billion Total Sizeable opportunity with long-term penetration upside |
Gross Bookings Growth Q4 03 9.569 Q1 04 10.743 Q2 04 11.558 Q3 04 12.241 Q4 04 12.774 Q1 05 13.526 Q2 05 14.38 Q3 05 15.052 Q4 05 15.552 Source: Company financial reports Expedia, Inc. worldwide gross bookings, trailing 12 months ($B) 33% Growth 2003 - 2004 22% Growth 2004 - 2005 |
International Mix Q4 03 1.1406 8.429 Q1 04 1.486 9.256996 Q2 04 1.751 9.808 Q3 04 2.059 10.182 Q4 04 2.319 10.455 Q1 05 2.658 10.868 Q2 05 3.041 11.339 Q3 05 3.292 11.76 Q4 05 3.479 12.073 Expedia, Inc. U.S. & International gross bookings, trailing 12 months ($B) International now 22% of mix, up from 12% in 2003 INTL '03 to '05 77% avg growth U.S. '03 to '05 20% avg. growth Source: Company financial reports |
Brand Portfolio Packages Complex itineraries Business travel Air tickets Hotel rooms Rental cars $$$$ $ Simple Complex Portfolio approach appeals to broadest range of traveler needs |
Brand Portfolio - Sources : Company estimates; Company financial reports; Hotels.com website. Hotels.com Gross Bookings - Y/Y Growth Percent Q1 04 38 Q2 04 13 Q3 04 6 Q4 04 -4 Q1 05 -2 Q2 05 6 Q3 05 9 Q4 05 16 ~$1.9B 2005 Gross Bookings #5 WW Online Travel Agency WW presence in 29 countries Complimentary to core Expedia traveler |
Brand Portfolio - Brand Portfolio - Sources : Company estimates; comscore media metrix; TripAdvisor website. 1MM 2MM 3MM 4MM 19MM Jan '06 unique visitors (41% Y/Y) #3 worldwide travel website 4MM reviews & opinions Expanded reach to U.K., Germany, France, Italy & Spain |
Brand Portfolio - Sources : Company financial reports; Company estimates; Company website. $700MM+ Gross Booking - 90% Y/Y growth Top 10 Corporate Travel Agency Launched TripController - leading technology solution Operating in U.S., U.K., France, Canada, Belgium, Netherlands & Lux. |
Benefits of Brand Breadth & Scale EXPE Travelocity Cendant (A) Gross bookings $15,551 Gross booking $7,446 $8,776 Revenue 2,119 Revenue 830 587 Revenue % gross bookings 13.6% Revenue % GB 11.1% 6.7% OIBA * 627 EBITDA 48 74 OIBA % revenue 29.6% EBITDA % Rev 5.8% 12.6% Figures in $MM Note A: Cendant revenue and EBITDA for Orbitz, Gullivers & eBookers. * "Operating income before amortization" is a non-GAAP measure as defined by the SEC. Please see "Definitions of non- GAAP Measures" and "Tabular Reconciliations for Non-GAAP Measures" elsewhere in this presentation for an explanation of Non-GAAP measures used throughout this presentation. Expedia's vision = become largest & most profitable retailer of travel products & services. Sources : Company financial reports; Sabre Holdings & Cendant Corp. financial reports and earnings call transcripts. |
Strong Free Cash Flow, Flow Through FY 2005 Results OIBA $627 MM + Depreciation 50 MM + Changes in working capital & other 173 MM - - Capital expenditures (52 MM) = Free cash flow $798 MM Flow Through: 2005 FCF as % of : EXPE Travel Average (A) Internet Average (B) Revenue 38% Revenue 8% Revenue 32% OIBA 127% EBITDA 79% EBITDA 84% Note A: Travel Average consists of Cendant (NYSE : CD), Sabre Holdings (NYSE : TSG) and Priceline (NASDAQ : PCLN). Note B: Internet Average consists of Yahoo (NASDAQ : YHOO), eBay (NASDAQ : EBAY) and Google (NASDAQ : GOOG). Sources : Company financial reports; Cendant, Sabre Holdings, Priceline, Yahoo, eBay & Google financial reports and earnings call transcripts.. |
2005 Results Source: Company Financial Reports. Figures in $MM |
Q4 2005 Results Figures in $MM Source: Company Financial Reports. |
Leverage Points G&A - Public Company Costs/Apollo Revenue Margin Supply Relationships Business Analytics Volume Long-Term Selling & Marketing Efficiency Product Improve end-to-end traveler experience Short & medium-term investments for long-term results |
Value to Suppliers - Lodging We bring our partners business when they need it Solid weekday business, while also improving weekend utilization Higher ADRs than industry average Our ADRs are nearly 50% higher than the industry Our customers stay longer than industry customers Average length of stay is nearly 40% longer ADR (index) Industry Expedia % Industry bookings Expedia bookings Length of stay (index) Industry Expedia Source: Proprietary consumer research; Smith Travel Research LTM August 2005; internal data 13 49 38 10 63 28 0 20 40 60 80 Sunday Weekday Fri/Sat 1 1.48 0 0.2 0.4 0.6 0.8 1 1.2 1.4 1.6 1 1.38 0 0.2 0.4 0.6 0.8 1 1.2 1.4 1.6 |
Value to Suppliers - Air Dot Filled Box Filled Box Unfilled Triangle Filled Triangle Unfilled Diamond Filled Diamond Unfilled X Unfilled X Filled Cross Unfilled Cross Filled Xcross Unfilled Xcross Filled 2001 1 2002 1.8 2003 3.2 2004 3.7 2005 4 Index Carrier Expedia Box Unfilled Triangle Filled Triangle Unfilled Diamond Filled Diamond Unfilled X Unfilled X Filled Cross Unfilled Cross Filled Xcross Unfilled Xcross Filled 2002 1 1 2004 0.93 1.08 Index Carrier A Avg system fare Carrier A Avg fare on Expedia % Of EI bookings Hub Non-hub Average of U.S. carriers 0 20 40 60 80 We bring our partners customers in contested markets Improved yields Our packages help move distressed inventory Most of the customers we deliver to airlines are outside their hub markets Our airfares are rising faster than overall fares Package sales have quadrupled as a portion of our total sales in the last 5 years |
Value to Suppliers - Beyond Bookings Based on industry benchmarks of other media/search companies, impressions on our sites are worth $200M in free annual advertising for our suppliers. This is in addition to the value derived from completed transactions In the course of a year, millions of consumers go directly from EI sites to supplier sites to book after deciding what they want while on our sites Our research shows our supplier partners get a "free" booking on their sites for every 1.5- 2 Expedia bookings Hotels - 1 "free" for every 2 Airlines - 1 "free" for every 1.5 Free Advertising Unpaid Search Almost 3MM consumers visit our sites every day Each customer search on-site drives impressions for our suppliers |
Why Retail? TODAY Industry-leading OLTA Technology leadership Strong brand awareness Broad selection Competitive prices Most travelers are one-time buyers Vast majority buy a single item <5% U.S. Leisure spend at Expedia.com YET... |
Fragmented Traveler Behavior Traveler behavior Upside to Expedia Source: Company estimates; Forrester; Jupiter; Merrill Lynch; comScore; Yankelovich % Total 2005 travel spend by U.S. households with online access Opportunity to convince our shoppers to buy with us Opportunity to convince our shoppers to buy online with us The next frontier! Purchase on Expedia Shop online but purchase from online competitor Shop online but purchase from offline competitor Shop and purchase with offline competitor |
Creating Personal Travel Company Requires Expansion of Offering Our Value to Customers = (Our Brand + Our Benefits) - Our Price Brand Leader Familiar/Trusted Low differentiation Add elements to existing brand personality consistent with our strengths Benefits Easy to use Convenient Choice Control Add benefits most important in driving purchase decisions and loyalty Price Less expensive vs. offline Good prices vs. other online Might save more elsewhere? Increase confidence, likelihood to buy Brand Re-launch Best Price Guarantee Personal Trip Guide Current Challenge |
Move from Selling Inventory...to Selling an Experience At the core of all travel is a story...... Segmentation Wishlist Recommender Booking TSF and itinerary planner Travel experience Memories and storytelling Expedia's current view of the story and its climax The customer's view of the story and its climax |
Transformation: From ATM ... to Merchant ... |
....From "One Site Fits All" ... to Personal & Relevant |
Personal & Relevant - Air Shopper E-mail Campaign Site behavior drives promotion |
Experience - Hotels.com Comparison Feature |
Experience - Personal Trip Guides |
Experience - Expedia Best Price Guarantee Experience - Expedia Best Price Guarantee |
X Y Size of bubble 0.31 0.13 0.37 aaa 0.23 0.11 0.26 hilton 0.2 0.3 0.33 southwest 0 0.24 0.16 cheap 0 0.18 0.21 orbitz 0 0.22 0.27 travelocity 0 0.24 0.29 expedia AAA Hilton Southwest OTA2 Expedia OTA1 OTA3 Customer View of Travel Market Brand perception and loyalty Size of circle = Percent who would recommend to friends Source: Expedia Brand Health Tracker |
In Summary.... ATTRACTIVE INDUSTRY Sizeable global target market - $875B Low global online penetration of 10% with significant upside EXPEDIA STRENGTHS #1 in most WW points of sale Industry-leading brand recognition, traffic, travelers Brand portfolio offers broadest customer & supplier appeal WW, centralized supply relationships - drive increased value for suppliers given traveler & geography breadth Large fixed investment can be levered across existing & future businesses Significant base & leadership position as we transition to world-class retailer of travel experiences Efficient flow through: ~$800MM in free cash flow on $2.1B in revenue |
Q & A |
Appendix |
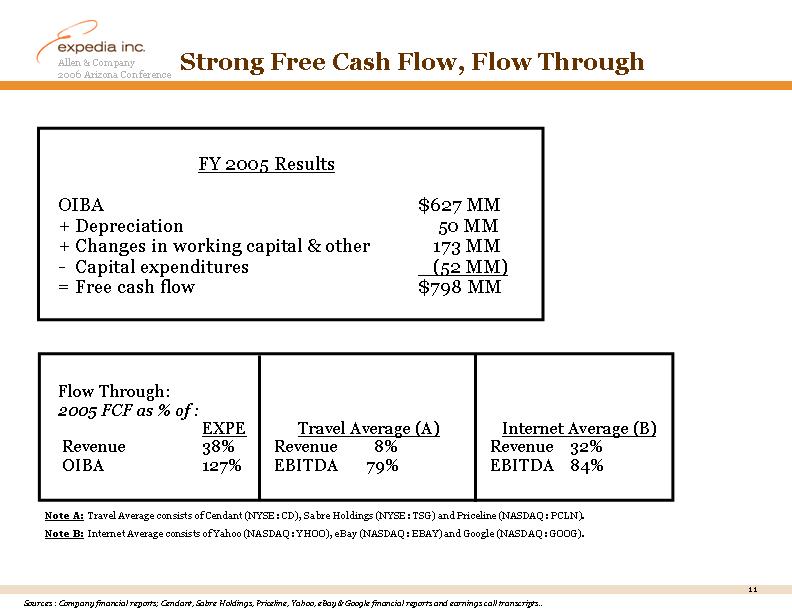
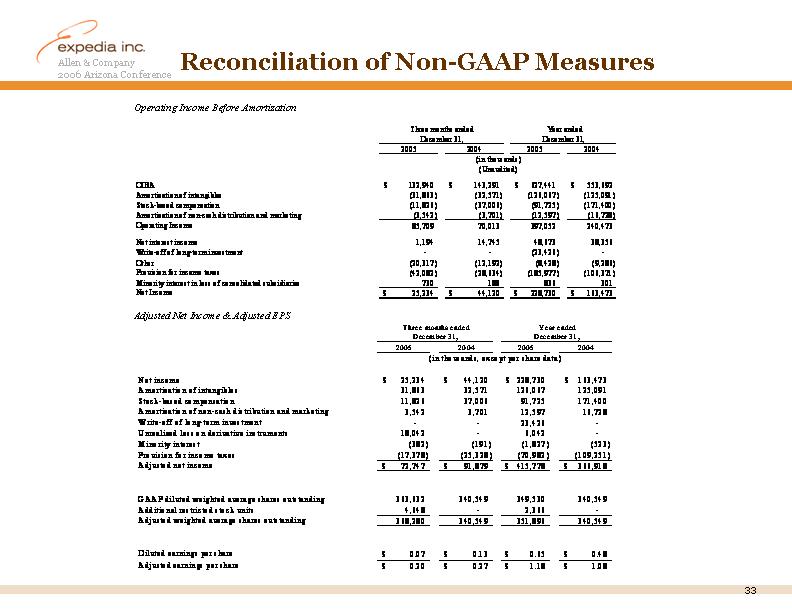
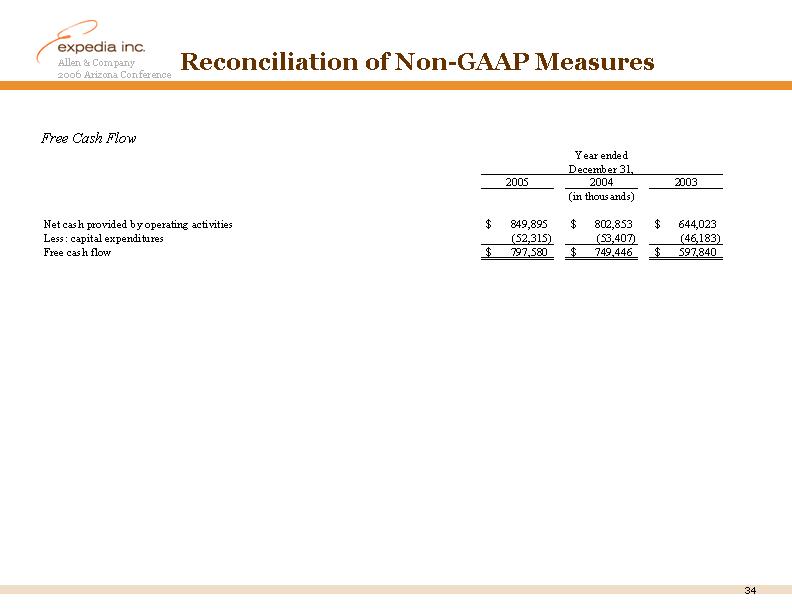
Definitions of Non-GAAP Measures The following are defined as non-GAAP measures by the SEC: Operating Income Before Amortization is defined as operating income plus: (1) amortization of non-cash distribution and marketing expense, (2) stock-based compensation expense, (3) amortization of intangible assets and goodwill impairment, if applicable and (4) certain one-time items, if applicable. Management believes this measure is useful to investors because it represents the combined operating results of Expedia, Inc.'s businesses, taking into account depreciation, which we believe is an ongoing cost of doing business, but excluding the effects of other non-cash expenses that may not be indicative of our core business operations. Operating Income Before Amortization has certain limitations in that it does not take into account the impact to Expedia, Inc.'s statements of income of certain expenses, including non-cash compensation, non-cash payments to partners, and acquisition-related accounting. Due to the high variability and difficulty in predicting certain items that affect net income, such as interest rates and tax rates, Expedia, Inc. is unable to provide reconciliation to net income on a forward-looking basis without unreasonable efforts. Adjusted Net Income generally captures all items on the statements of income that have been, or ultimately will be, settled in cash and is defined as net income available to stockholders plus (1) amortization of non-cash distribution and marketing expense, (2) stock-based compensation expense, (3) amortization of intangible assets and goodwill impairment, if applicable, (4) one-time items, net of related tax, and minority interest, (5) mark to market gains and losses on derivative liabilities and (6) discontinued operations, net of tax. We believe Adjusted Net Income is useful to investors because it represents Expedia, Inc.'s combined results, taking into account depreciation, which management believes is an ongoing cost of doing business, but excluding the impact of other non-cash expenses and items not directly tied to the recurring core operations of our businesses. Adjusted EPS is defined as Adjusted Net Income divided by weighted fully diluted shares outstanding for Adjusted EPS purposes. We include dilution from options and warrants per the treasury stock method and include all shares relating to restricted stock units ("RSU") in shares outstanding for Adjusted EPS. This differs from the GAAP method for including RSUs, which treats them on a treasury method basis. Shares outstanding for Adjusted EPS purposes are therefore higher than shares outstanding for GAAP EPS purposes. We believe Adjusted EPS is useful to investors because it represents, on a per share basis, Expedia's consolidated results, taking into account depreciation, which we believe is an ongoing cost of doing business, as well as other charges which are not allocated to the operating businesses such as interest expense, taxes and minority interest, but excluding the effects of other non-cash expenses not directly tied to the core operations of our businesses. Adjusted Net Income and Adjusted EPS have the same limitations as Operating Income Before Amortization. In addition, Adjusted Net Income does not include all items that affect our net income and net income per share for the period. Therefore, we think it is important to evaluate these measures along with our consolidated statements of income. Free Cash Flow is defined as net cash flow provided by operating activities less capital expenditures. Management believes Free Cash Flow is useful to investors because it represents the operating cash flow that our operating businesses generate, less capital expenditures but before taking into account other cash movements that are not directly tied to the core operations of our businesses, such as financing activities or certain investing activities. Free Cash Flow has certain limitations in that it does not represent the total increase or decrease in the cash balance for the period, nor does it represent the residual cash flow for discretionary expenditures. Therefore, it is important to evaluate Free Cash Flow along with the consolidated statements of cash flows. |
Reconciliation of Non-GAAP Measures |
Reconciliation of Non-GAAP Measures Reconciliation of Non-GAAP Measures |
Business Model - Operating Income FY 2005 Results ($MM) Gross bookings $15,552 Revenue 2,119 Cost of revenue 470 Gross profit 1,649 Gross margin 78% Selling and marketing 698 General and administrative 212 Technology and content 112 OIBA 627 OIBA margin 30% Non-cash marketing & dist. 13 Stock-based compensation 92 Amortization of intangibles 126 Operating income (GAAP) 397 Operating margin 19% Credit Card & Bad Debt "Fulfillment" Costs, incl. paper tickets Call Centers (Traveler Service) Data Center Costs to destination services suppliers $1 of every $3 in revenue, consisting of advertising and distribution expense, as well as personnel-related costs, including PSG market manager staffing. Our distribution channels include portals, search engines and our affiliate programs. 30% of Revenue flows to operating profit (4% of Gross Bookings) Significant acquisition activity being amortized Annual equity awards in February. Shifted to RSUs w/ '03 grant cycle, reducing expense & dilution (1) Personnel costs for support functions that include our executive leadership, finance, legal, tax and human resources functions. (2) Fees for professional services that include legal, tax and accounting. Customer books a travel product or service; total retail value (incl taxes and fees) constitutes "Gross Bookings" Expedia's portion of the gross booking gets recorded as revenue (fees, commissions, etc.) Revenue = 13.6% of bookings in 2005. Includes product development expenses such as payroll and related expenses, and depreciation of website development costs. Source: Company financial reports |
Business Model - Free Cash Flow Build Free Cash Flow $ Millions Depre- ciation Intangibles Non-Cash Marketing Non-Cash Charges 50 126 13 Stock-Based Comp. Accounts Payable, Merchant Deferred Merchant Bookings Working Capital Changes 86 45 Inc. Tax Payable (A) Cap Ex 2005 Free Cash Flow 798 2005 Net Income 229 92 (52) Decr. in Taxes Payable (A) 43 114 Other W.C. 8 44 Other Note A: Cash taxes paid in 2005 were $11 million. $114 million reduction in taxes payable was due primarily to stock-based compensation deductions and transfer of Payables to IAC. |