|
Exhibit 99.1 
|
Investor presentation
March 16, 2016
Safe harbor
Forward-looking statements. This presentation contains “forward-looking statements” within the meaning of the Private Securities Litigation Reform Act of 1995. These statements are not guarantees of future performance. These forward-looking statements are based on management’s expectations as of March 16, 2016 and assumptions which are inherently subject to uncertainties, risks and changes in circumstances that are difficult to predict. The use of words such as “intends” and “expects,” among others, generally identifies forward-looking statements. However, these words are not the exclusive means of identifying such statements. In addition, any statements that refer to expectations, projections or other characterizations of future events or circumstances are forward-looking statements and may include statements relating to future revenues, expenses, margins, profitability, net income / (loss), earnings per share and other measures of results of operations and the prospects for future growth of Expedia, Inc.’s business. Actual results and the timing and outcome of events may differ materially from those expressed or implied in the forward-looking statements for a variety of reasons, including, among others: an increasingly competitive global environment; modifications to our current business models and practices or our adoption of new business models or practices in order to compete; changes in search engine algorithms and dynamics or other traffic-generating arrangements; our failure to maintain and expand our relationships and contractual agreements with travel suppliers or travel distribution partners; our failure to maintain and expand our brand awareness or increased costs to do so; our failure to adapt to technological developments or industry trends; risks related to our acquisitions, investments or significant commercial arrangements; risks relating to our operations in international markets; our failure to comply with current laws, rules and regulations, or changes to such laws, rules and regulations; adverse application of existing tax or unclaimed property laws, rules or regulations are subject to interpretation by taxing authorities; unfavorable amendment to existing tax laws, rules or regulations or enactment of new unfavorable laws, rules or regulations; adverse outcomes in legal proceedings to which we are a party; declines or disruptions in the travel industry; risks related to payments and fraud; fluctuations in foreign exchange rates; volatility in our stock price; liquidity constraints or our inability to access the capital markets when necessary or desirable; interruption, security breaches and lack of redundancy in our information systems; our failure to comply with governmental regulation and other legal obligations related to our processing, storage, use, disclosure and protection of personal information, payment card information and other consumer data; our failure to retain or motivate key personnel or hire, retain and motivate qualified personnel, including senior management; changes in control of the Company; management and director conflicts of interest; risks related to actions taken by our business partners and third party service providers, including failure to comply with our requirements or standards or the requirements or standards of governmental authorities, or any cessation of their operations; risks related to the failure of counterparties to perform on financial obligations; risks related to our long-term indebtedness, including our failure to effectively operate our businesses due to restrictive covenants in the agreements governing our indebtedness; our failure to protect our intellectual property and proprietary information from copying or use by others, including potential competitors; and other risks detailed in Expedia, Inc.’s public filings with the SEC, including those described in our annual report on Form 10-K for year ended December 31, 2015 and any updates to those factors set forth in Expedia, Inc.’s subsequent quarterly reports on Form 10-Q or current reports on Form 8-K. Except as required by law, we undertake no obligation to update any forward-looking or other statements in this presentation, whether as a result of new information, future events or otherwise.
Non-GAAP measures. Reconciliations to GAAP measures of non-GAAP measures included in this presentation are included in the Appendix. These measures are intended to supplement, not substitute for, GAAP comparable measures. Investors are urged to consider carefully the comparable GAAP measures and reconciliations.
Industry / market data. Industry and market data usedinthispresentationhavebeen obtainedfromindustry publications and sources as well as from research reports prepared for other purposes. We have not independently verified the data obtained from these sources and cannot assure you of the data’s accuracy or completeness.
Trademarks & logos. Trademarks and logos are the property of their respective owners.
© 2016 Expedia, Inc. All rights reserved. CST: 2029030-50
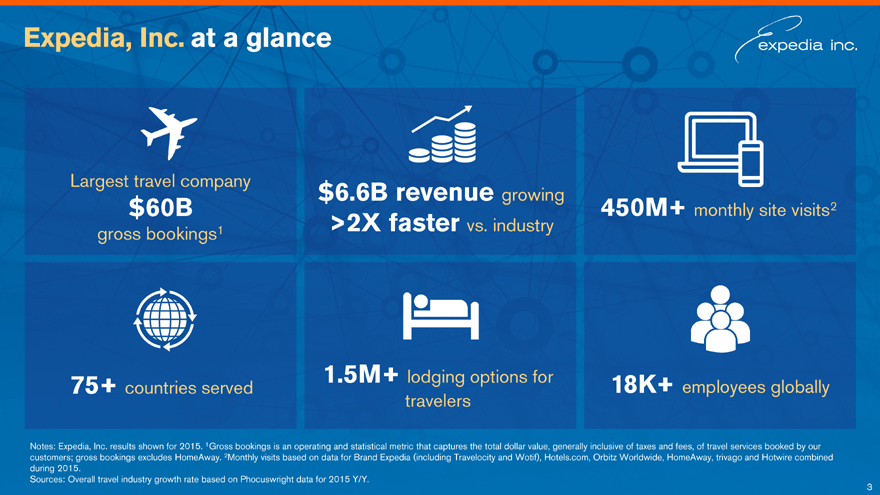
Expedia, Inc. at a glance
Largest travel company
$60B
gross bookings1
$6.6B revenue growing
>2X faster vs. industry
450M+ monthly site visits2
75+ countries served
1.5M+ lodging options for travelers
18K+ employees globally
Notes: Expedia, Inc. results shown for 2015. 1Gross bookings is an operating and statistical metric that captures the total dollar value, generally inclusive of taxes and fees, of travel services booked by our customers; gross bookings excludes HomeAway. 2Monthly visits based on data for Brand Expedia (including Travelocity and Wotif), Hotels.com, Orbitz Worldwide, HomeAway, trivago and Hotwire combined during 2015.
Sources: Overall travel industry growth rate based on Phocuswright data for 2015 Y/Y.
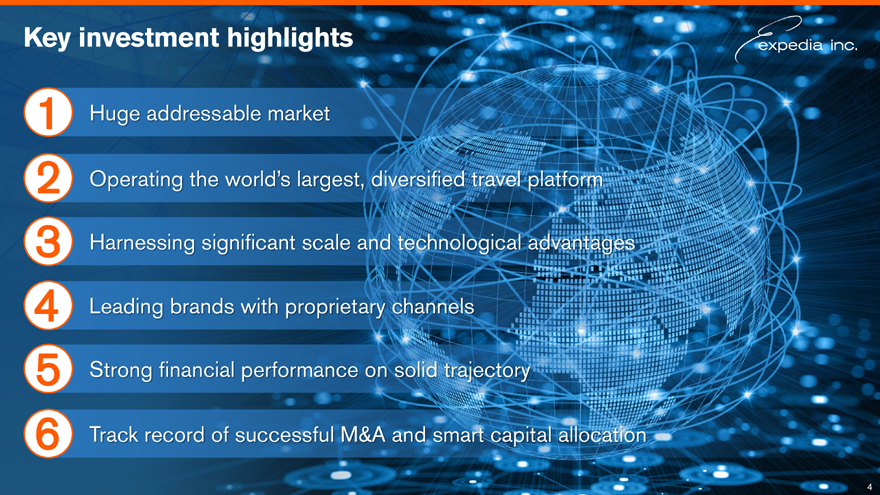
Key investment highlights
1 | | Huge addressable market |
2 | | Operating the world’s largest, diversified travel platform |
3 | | Harnessing significant scale and technological advantages |
4 | | Leading brands with proprietary channels |
5 | | Strong financial performance on solid trajectory |
6 | | Track record of successful M&A and smart capital allocation |
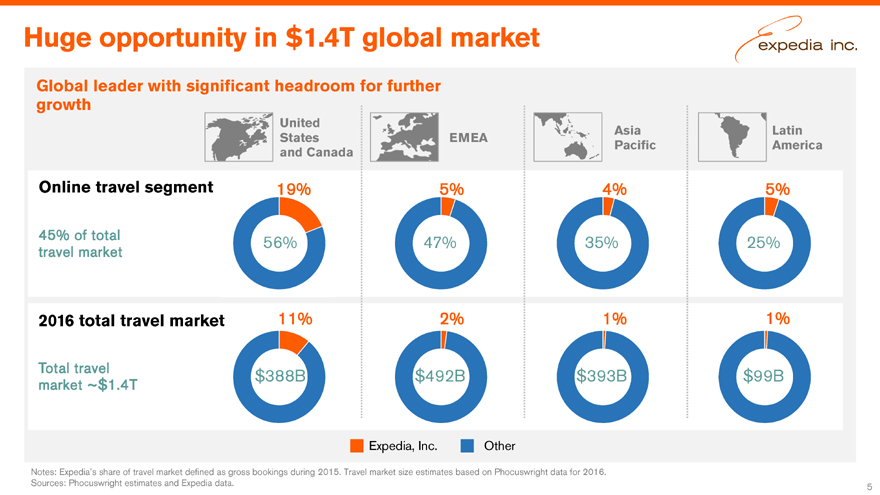
Huge opportunity in $1.4T global market
Global leader with significant headroom for further
growth
United States and Canada
Asia Pacific Latin America
EMEA
Online travel segment
19% 5% 4% 5%
45% of total travel market
56% 47% 35% 25%
2016 total travel market
11% 2% 1% 1%
Total travel market ~$1.4T
$388B $492B $393B $99B
Expedia, Inc. Other
Notes: Expedia’s share of travel market defined as gross bookings during 2015. Travel market size estimates based on Phocuswright data for 2016. Sources: Phocuswright estimates and Expedia data.
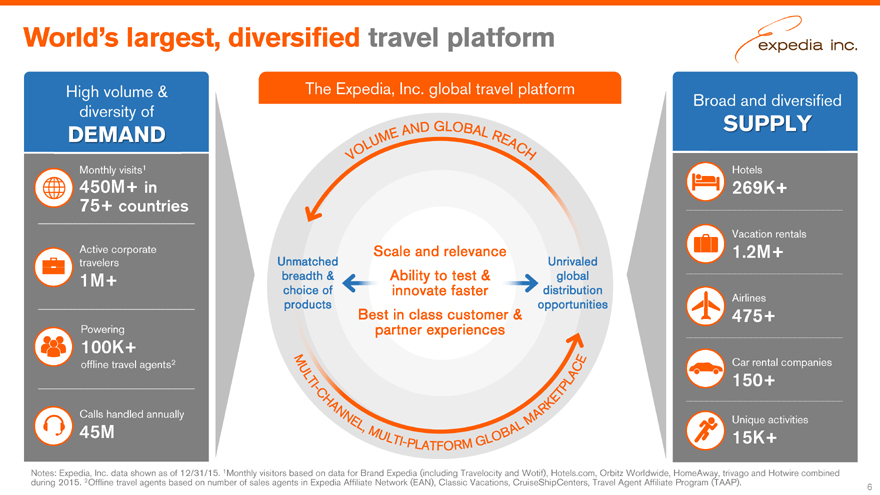
World’s largest, diversified travel platform
High volume & diversity of
DEMAND
The Expedia, Inc. global travel platform
Broad and diversified
SUPPLY
Monthly visits1
450M+ in
75+ countries
Active corporate travelers
1M+
Powering
100K+
offline travel agents2
Calls handled annually
45M
Hotels
269K+
Vacation rentals
1.2M+
Airlines
475+
Car rental companies
150+
Unique activities
15K+
Notes: Expedia, Inc. data shown as of 12/31/15. 1Monthly visitors based on data for Brand Expedia (including Travelocity and Wotif), Hotels.com, Orbitz Worldwide, HomeAway, trivago and Hotwire combined during 2015. 2Offline travel agents based on number of sales agents in Expedia Affiliate Network (EAN), Classic Vacations, CruiseShipCenters, Travel Agent Affiliate Program (TAAP).
Scale and relevance
Unmatched Unrivaled
breadth & Ability to test & global
choice of innovate faster distribution products opportunities
Best in class customer & partner experiences
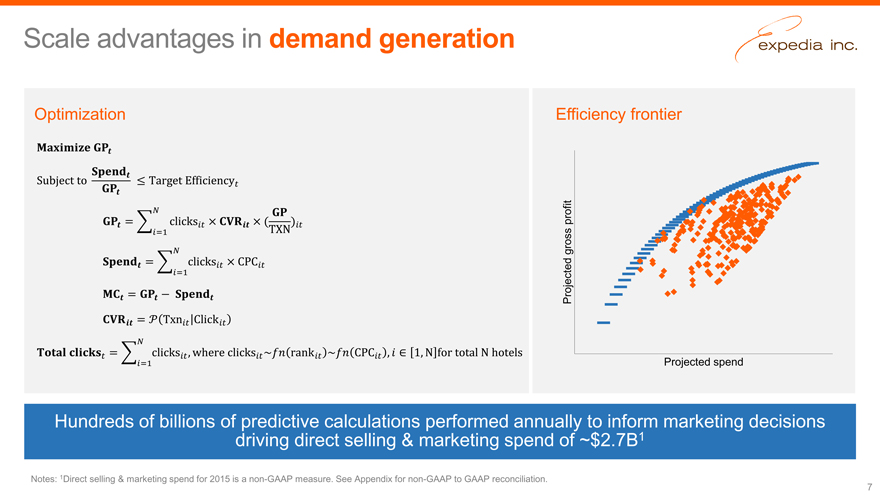
Scale advantages in demand generation
Optimization
Efficiency frontier
Projected gross profit
Projected spend
Hundreds of billions of predictive calculations performed annually to inform marketing decisions driving direct selling & marketing spend of
~$2.7B1
Notes: 1Direct selling & marketing spend for 2015 is a non-GAAP measure. See Appendix for non-GAAP to GAAP reconciliation.
7
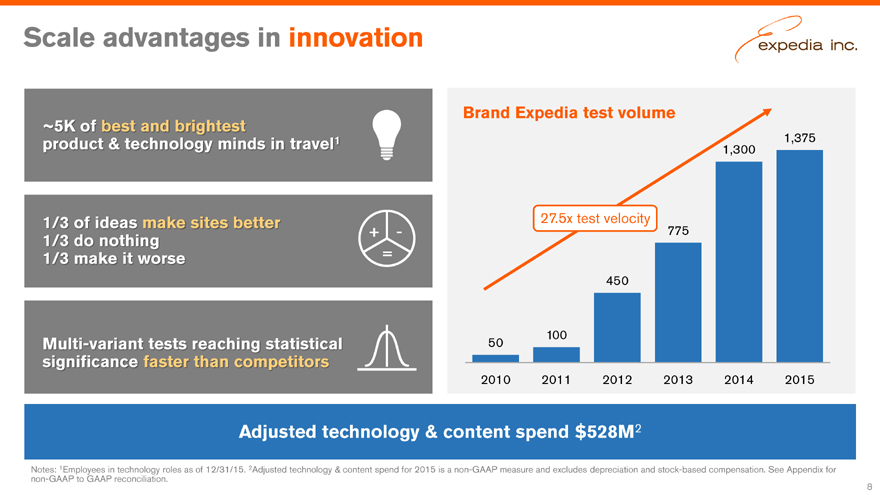
Scale advantages in innovation
~5K of best and brightest product & technology minds in travel1
1/3 of ideas make sites better
+-
1/3 do nothing
1/3 make it worse =
Multi-variant tests reaching statistical significance faster than competitors
Adjusted technology & content spend $528M2
Notes: 1Employees in technology roles as of 12/31/15. 2Adjusted technology & content spend for 2015 is a non-GAAP measure and excludes depreciation and stock-based compensation. See Appendix for non-GAAP to GAAP reconciliation.
Brand Expedia test volume
1,375
1,300
27.5x test velocity
775
450
100
50
2010 2011 2012 2013 2014 2015
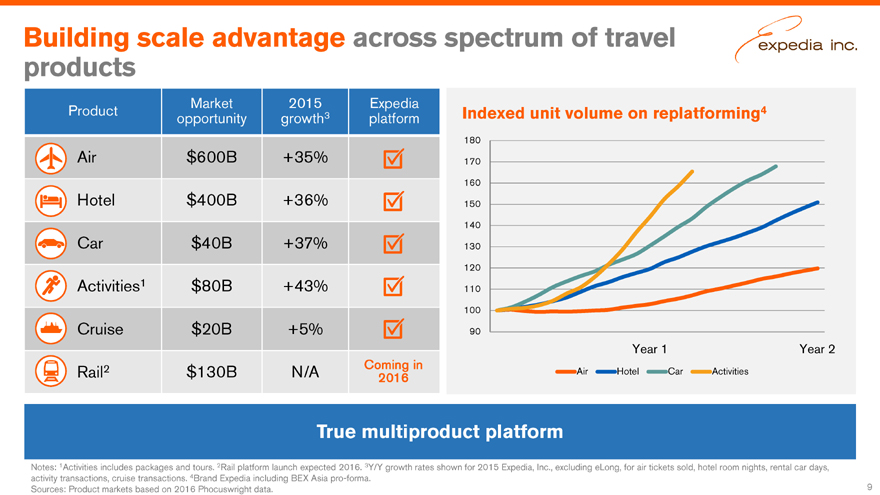
Building scale advantage across spectrum of travel products
Market 2015 Expedia
Product opportunity growth3 platform
Air $600B +35%
Hotel $400B +36%
Car $40B +37%
Activities1 $80B +43%
Cruise $20B +5%
Coming in
Rail2 $130B N/A 2016
Indexed unit volume on replatforming4
180
170
160
150
140
130
120
110
100
90
Year 1 Year 2
Air Hotel Car Activities
True multiproduct platform
Notes: 1Activities includes packages and tours. 2Rail platform launch expected 2016. 3Y/Y growth rates shown for 2015 Expedia, Inc., excluding eLong, for air tickets sold, hotel room nights, rental car days, activity transactions, cruise transactions. 4Brand Expedia including BEX Asia pro-forma.
Sources: Product markets based on 2016 Phocuswright data.
9
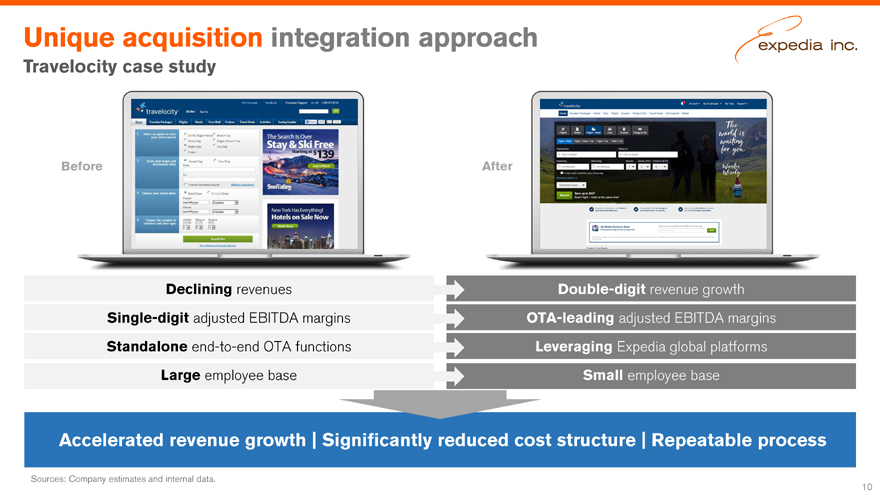
Unique acquisition integration approach
Travelocity case study
Accelerated revenue growth | Significantly reduced cost structure | Repeatable process
Unique acquisition integration approach
Travelocity case study
Double-digit revenue growth
OTA-leading adjusted EBITDA margins
Leveraging Expedia global platforms
Small employee base
Declining revenues
Single-digit adjusted EBITDA margins
Standalone end-to-end OTA functions
Large employee base
Before After
Sources: Company estimates and internal data.
10
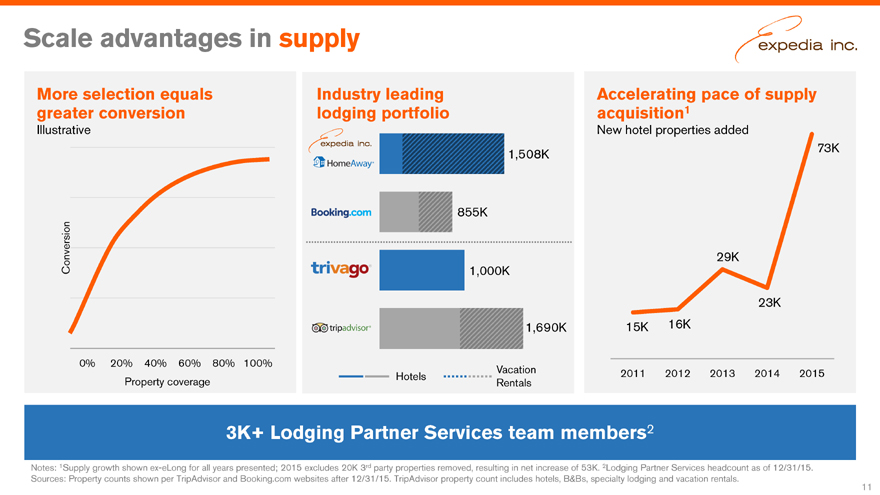
Scale advantages in supply
More selection equals
greater conversion
Illustrative
Conversion
0% 20% 40% 60% 80% 100%
Property coverage
Industry leading
lodging portfolio
1,508K
855K
1,000K
1,690K
Vacation
Hotels
Rentals
Accelerating pace of supply
acquisition1
New hotel properties added
73K
29K
23K
15K 16K
2011 2012 2013 2014 2015
3K+ Lodging Partner Services team members2
Notes: 1Supply growth shown ex-eLong for all years presented; 2015 excludes 20K 3rd party properties removed, resulting in net increase of 53K. 2Lodging Partner Services headcount as of 12/31/15.
Sources: Property counts shown per TripAdvisor and Booking.com websites after 12/31/15. TripAdvisor property count includes hotels, B&Bs, specialty lodging and vacation rentals.
3K+ Lodging Partner Services team members2
More selection equals
greater conversion
Illustrative
Industry leading
lodging portfolio
Accelerating pace of supply
acquisition1
New hotel properties added
0% 20% 40% 60% 80% 100%
Conversion
Property coverage
2011 2012 2013 2014 2015
15K 16K
29K
23K
1,508K 73K
855K
1,000K
1,690K
Hotels Vacation
Rentals
11
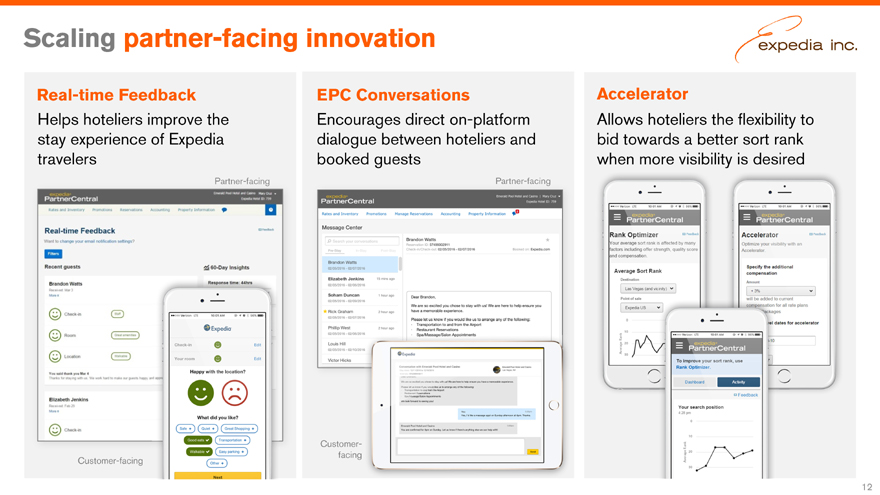
Scaling partner-facing innovation
Real-time Feedback EPC Conversations Accelerator
Encourages direct on-platform
dialogue between hoteliers and
booked guests
Helps hoteliers improve the
stay experience of Expedia
travelers
Allows hoteliers the flexibility to
bid towards a better sort rank
when more visibility is desired
Partner-facing Partner-facing
Customer-facing
Customerfacing
12
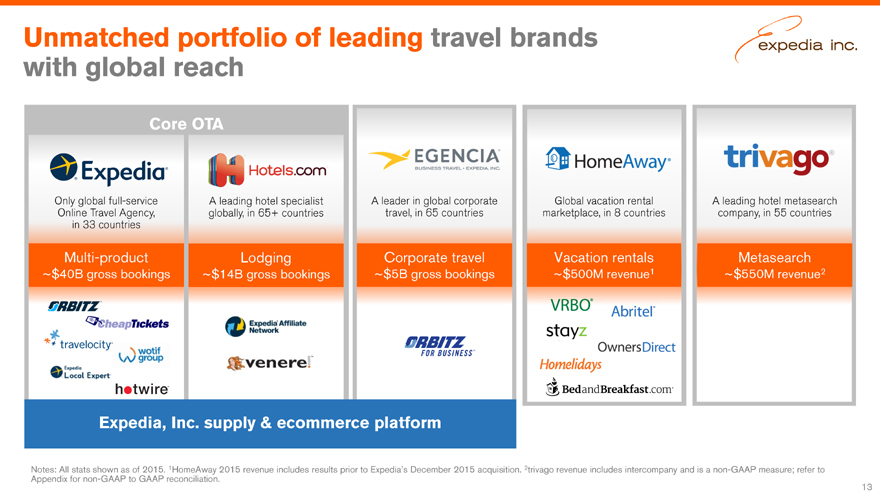
Unmatched portfolio of leading travel brands
with global reach
Notes: All stats shown as of 2015. 1HomeAway 2015 revenue includes results prior to Expedia’s December 2015 acquisition. 2trivago revenue includes intercompany and is a non-GAAP measure; refer to
Appendix for non-GAAP to GAAP reconciliation.
Core OTA
Lodging
~$14B gross bookings
A leading hotel specialist
globally, in 65+ countries
A leading hotel metasearch
company, in 55 countries
Metasearch
~$550M revenue2
A leader in global corporate
travel, in 65 countries
Corporate travel
~$5B gross bookings
Global vacation rental
marketplace, in 8 countries
Vacation rentals
~$500M revenue1
Multi-product
~$40B gross bookings
Only global full-service
Online Travel Agency,
in 33 countries
Expedia, Inc. supply & ecommerce platform
13
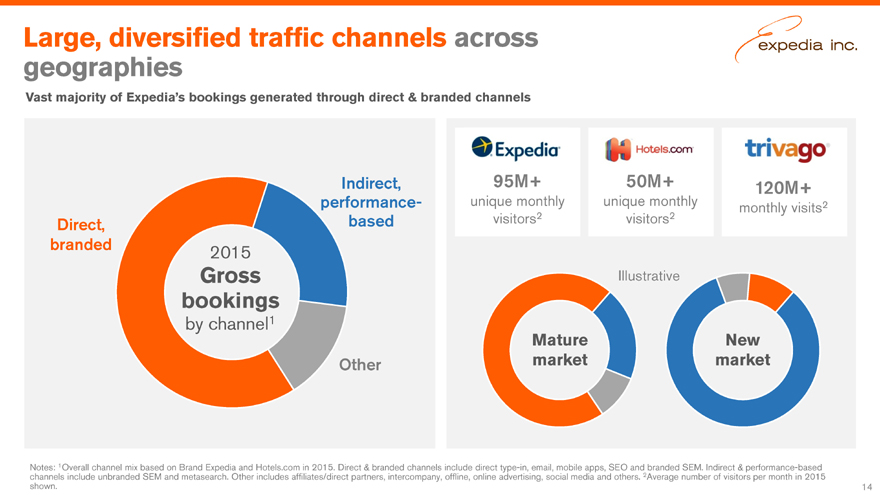
Large, diversified traffic channels across geographies
Vast majority of Expedia’s bookings generated through direct & branded channels
Direct, branded
2015
Gross bookings
by channel1
Indirect, performance-based
Other
95M+ 50M+
120M+
unique monthly unique monthly 2 monthly visits visitors2 visitors2
Illustrative
Mature New market market
Notes: 1Overall channel mix based on Brand Expedia and Hotels.com in 2015. Direct & branded channels include direct type-in, email, mobile apps, SEO and branded SEM. Indirect & performance-based channels include unbranded SEM and metasearch. Other includes affiliates/direct partners, intercompany, offline, online advertising, social media and others. 2Average number of visitors per month in 2015 shown. 14
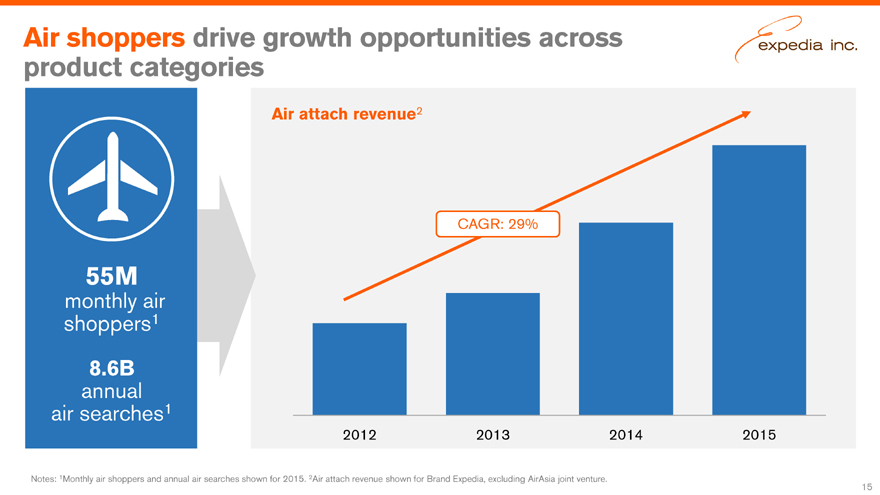
Air shoppers drive growth opportunities across product categories
55M
monthly air shoppers1
8.6B annual air searches1
Air attach revenue2
CAGR: 29%
2012 2013 2014 2015
Notes: 1Monthly air shoppers and annual air searches shown for 2015. 2Air attach revenue shown for Brand Expedia, excluding AirAsia joint venture.
15
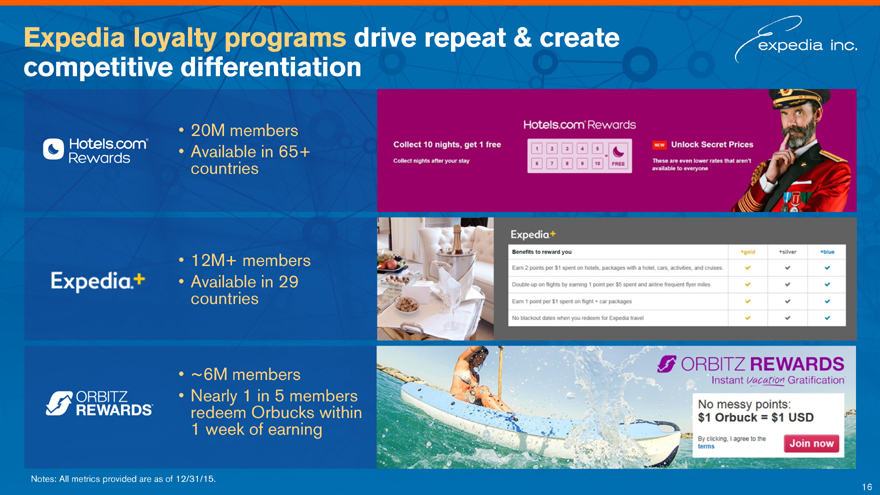
Expedia loyalty programs drive repeat & create competitive differentiation
20M members
Available in 65+ countries
12M+ members
Available in 29 countries
~6M members
Nearly 1 in 5 members redeem Orbucks within 1 week of earning
Notes: All metrics provided are as of 12/31/15.
16
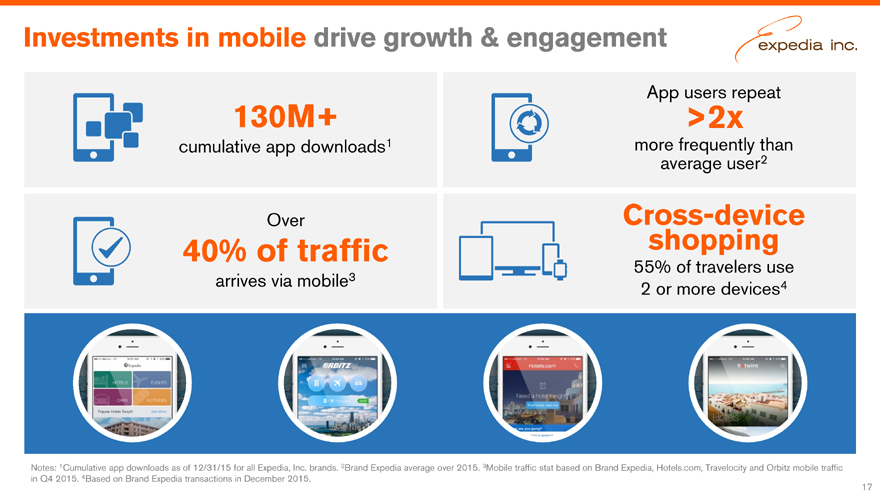
Investments in mobile drive growth & engagement
130M+
cumulative app downloads1
Over
40% of traffic
arrives via mobile3
Cross-device
shopping
55% of travelers use
App users repeat
>2x
more frequently than
average user2
Notes: 1Cumulative app downloads as of 12/31/15 for all Expedia, Inc. brands. 2Brand Expedia average over 2015. 3Mobile traffic stat based on Brand Expedia, Hotels.com, Travelocity and Orbitz mobile traffic
in Q4 2015. 4Based on Brand Expedia transactions in December 2015.
17
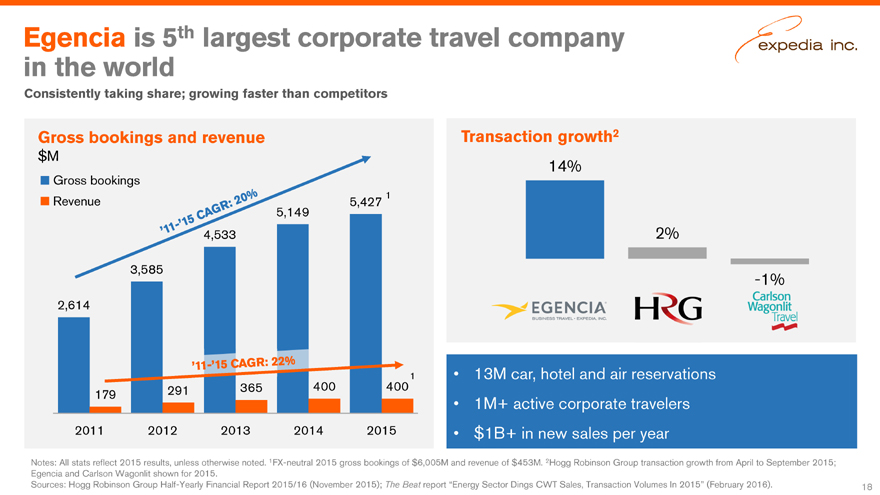
2,614
3,585
4,533
5,149
5,427
179 291 365 400 400
2011 2012 2013 2014 2015
Gross bookings
Revenue
Gross bookings and revenue
$M
Egencia is 5th largest corporate travel company
in the world
Notes: All stats reflect 2015 results, unless otherwise noted. 1FX-neutral 2015 gross bookings of $6,005M and revenue of $453M. 2Hogg Robinson Group transaction growth from April to September 2015;
Egencia and Carlson Wagonlit shown for 2015.
Sources: Hogg Robinson Group Half-Yearly Financial Report 2015/16 (November 2015); The Beat report “Energy Sector Dings CWT Sales, Transaction Volumes In 2015” (February 2016).
Consistently taking share; growing faster than competitors
Transaction growth2
14%
2%
-1%
13M car, hotel and air reservations
1M+ active corporate travelers
$1B+ in new sales per year
18
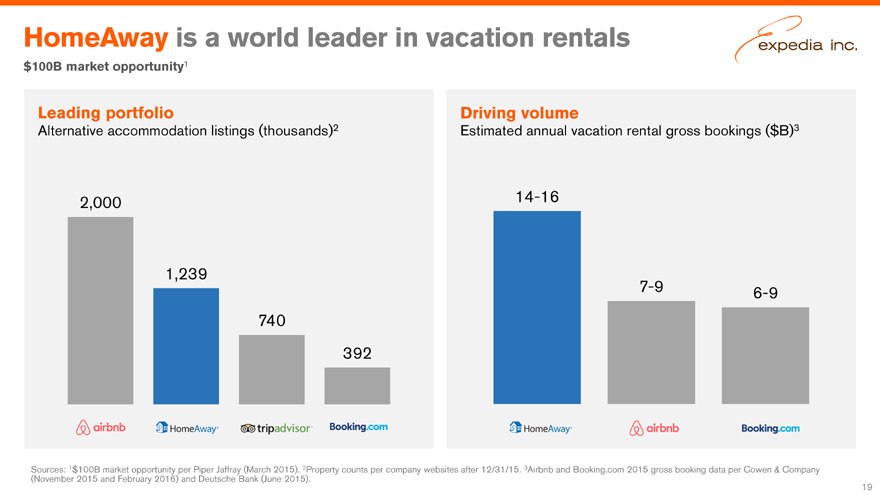
HomeAway is a world leader in vacation rentals
Sources: 1$100B market opportunity per Piper Jaffray (March 2015). 2Property counts per company websites after 12/31/15. 3Airbnb and Booking.com 2015 gross booking data per Cowen & Company
(November 2015 and February 2016) and Deutsche Bank (June 2015).
$100B market opportunity1
Leading portfolio
Alternative accommodation listings (thousands)2
2,000
1,239
740
392
Driving volume
Estimated annual vacation rental gross bookings ($B)3
14-16
7-9 6-9
19
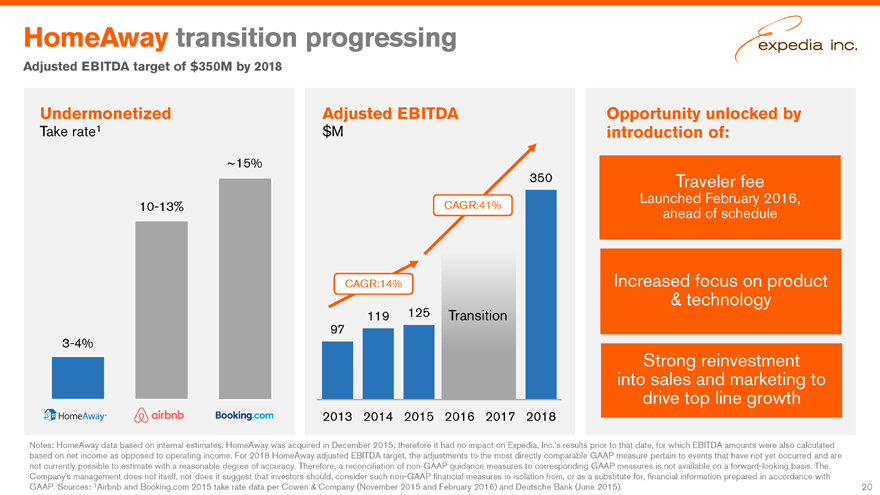
HomeAway transition progressing
Notes: HomeAway data based on internal estimates. HomeAway was acquired in December 2015; therefore it had no impact on Expedia, Inc.’s results prior to that date, for which EBITDA amounts were also calculated
based on net income as opposed to operating income. For 2018 HomeAway adjusted EBITDA target, the adjustments to the most directly comparable GAAP measure pertain to events that have not yet occurred and are
not currently possible to estimate with a reasonable degree of accuracy. Therefore, a reconciliation of non-GAAP guidance measures to corresponding GAAP measures is not available on a forward-looking basis. The
Company’s management does not itself, nor does it suggest that investors should, consider such non-GAAP financial measures in isolation from, or as a substitute for, financial information prepared in accordance with
GAAP. Sources: 1Airbnb and Booking.com 2015 take rate data per Cowen & Company (November 2015 and February 2016) and Deutsche Bank (June 2015).
Adjusted EBITDA
$M
97
119 125
350
2013 2014 2015 2016 2017 2018
Adjusted EBITDA target of $350M by 2018
Traveler fee
Launched February 2016,
ahead of schedule
Increased focus on product
& technology
Strong reinvestment
into sales and marketing to
drive top line growth
Opportunity unlocked by
introduction of:
10-13%
3-4%
~15%
Undermonetized
Take rate1
CAGR:14%
CAGR:41%
Transition
20
trivago: brand led innovative hotel search leader
Proprietary innovative 100% focused on the best approach to TV advertising lodging search experience
1M+ hotels
Prices compared across 250+ booking sites and 100+ hotel chains
Presence in 55+ countries
Notes: Stats as of 12/31/15.
21
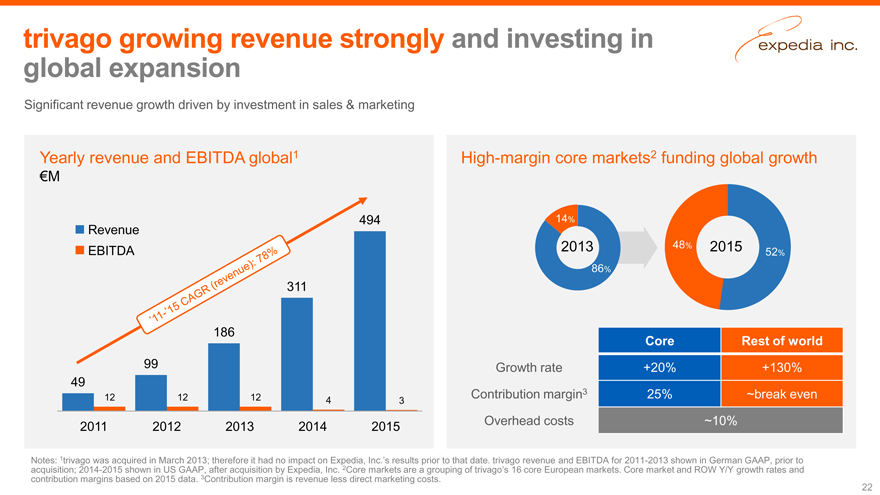
trivago growing revenue strongly and investing in global expansion
Significant revenue growth driven by investment in sales & marketing
Yearly revenue and EBITDA global1
€M
494 Revenue EBITDA
311
186
99 49
12 12 12 4 3
2011 2012 2013 2014 2015
High-margin core markets2 funding global growth
14%
2013 48% 2015
52% 86%
Core Rest of world
Growth rate +20% +130% Contribution margin3 25% ~break even Overhead costs ~10%
Notes: 1trivago was acquired in March 2013; therefore it had no impact on Expedia, Inc.’s results prior to that date. trivago revenue and EBITDA for 2011-2013 shown in German GAAP, prior to acquisition; 2014-2015 shown in US GAAP, after acquisition by Expedia, Inc. 2Core markets are a grouping of trivago’s 16 core European markets. Core market and ROW Y/Y growth rates and contribution margins based on 2015 data. 3Contribution margin is revenue less direct marketing costs.
22
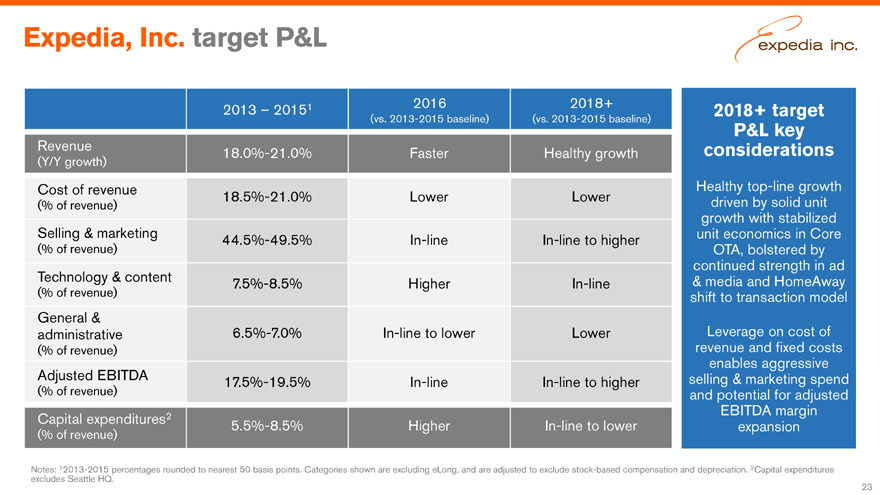
Expedia, Inc. target P&L
2013 – 20151 2016 2018+
(vs. 2013-2015 baseline) (vs. 2013-2015 baseline)
Revenue 18.0%-21.0% Faster Healthy growth
(Y/Y growth)
Cost of revenue 18.5%-21.0% Lower Lower
(% of revenue)
Selling & marketing 44.5%-49.5% In-line In-line to higher
(% of revenue)
Technology & content 7.5%-8.5% Higher In-line
(% of revenue)
General &
administrative 6.5%-7.0% In-line to lower Lower
(% of revenue)
Adjusted EBITDA 17.5%-19.5% In-line In-line to higher
(% of revenue)
Capital expenditures2 5.5%-8.5% Higher In-line to lower
(% of revenue)
B 2018+ target P&L key considerations
Healthy top-line growth driven by solid unit growth with stabilized unit economics in Core OTA, bolstered by continued strength in ad & media and HomeAway shift to transaction model
Leverage on cost of revenue and fixed costs enables aggressive selling & marketing spend and potential for adjusted EBITDA margin expansion
Notes: 12013-2015 percentages rounded to nearest 50 basis points. Categories shown are excluding eLong, and are adjusted to exclude stock-based compensation and depreciation. 2Capital expenditures excludes Seattle HQ.
23
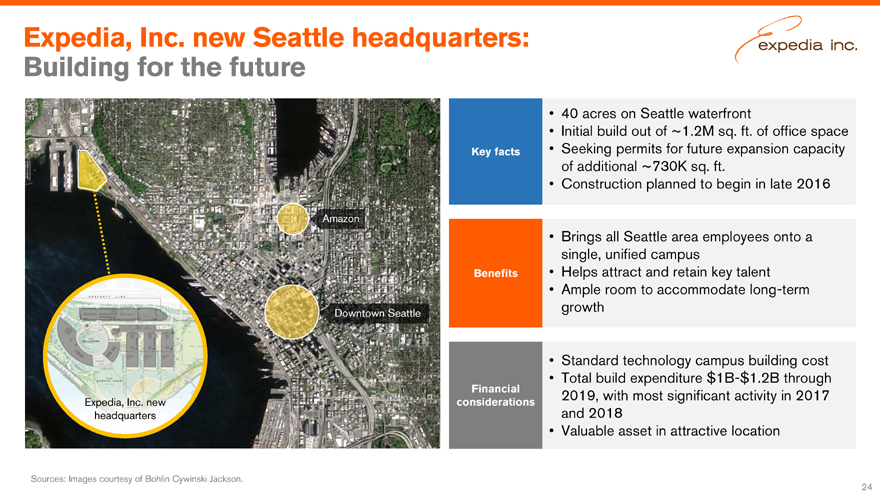
Expedia, Inc. new Seattle headquarters: Building for the future
Key facts
Benefits
Financial considerations
40 acres on Seattle waterfront
Initial build out of ~1.2M sq. ft. of office space Seeking permits for future expansion capacity of additional ~730K sq. ft.
Construction planned to begin in late 2016
Brings all Seattle area employees onto a single, unified campus Helps attract and retain key talent Ample room to accommodate long-term growth
Standard technology campus building cost Total build expenditure $1B-$1.2B through 2019, with most significant activity in 2017 and 2018 Valuable asset in attractive location
Sources: Images courtesy of Bohlin Cywinski Jackson.
24
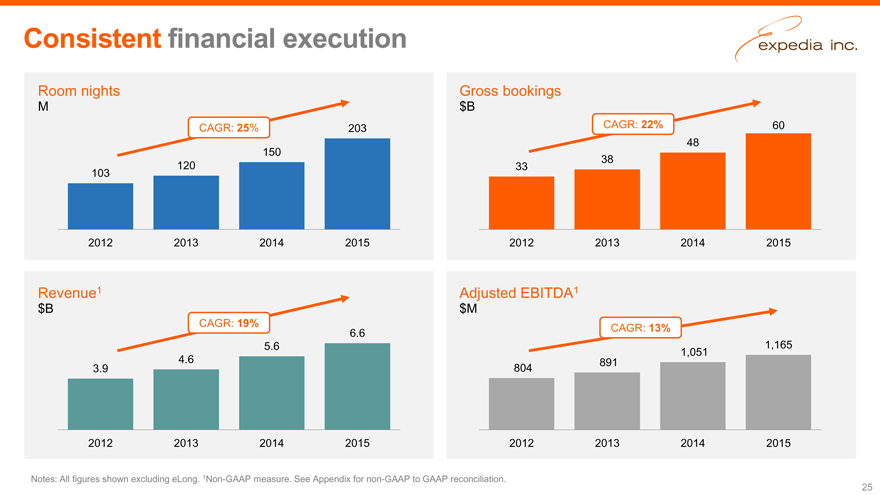
Consistent financial execution
Room nights
M
CAGR: 25% 203
150 120 103
2012 2013 2014 2015
Gross bookings $B
CAGR: 22% 60 48 38 33
2012 2013 2014 2015
Revenue1 $B
CAGR: 19% 6.6
5.6
3.9 4.6
2012 2013 2014 2015
Adjusted EBITDA1 $M
CAGR: 13%
1,165 1,051 891 804
2012 2013 2014 2015
Notes: All figures shown excluding eLong. 1Non-GAAP measure. See Appendix for non-GAAP to GAAP reconciliation.
25
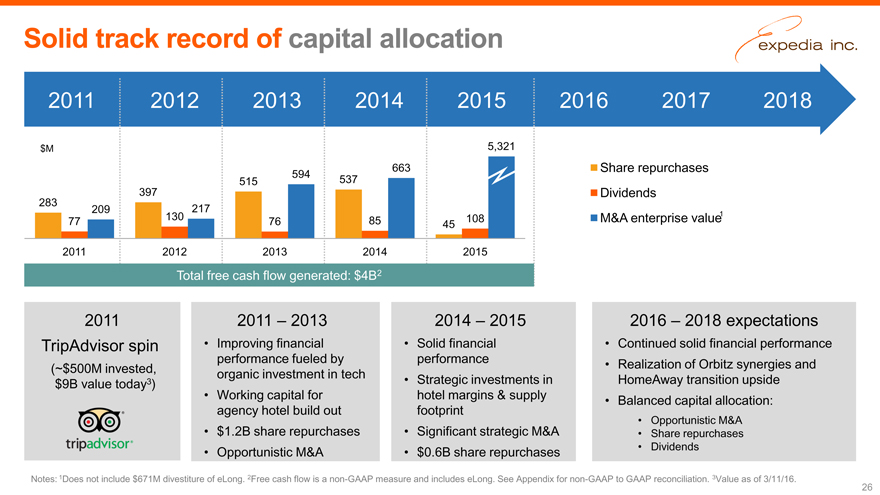
Solid track record of capital allocation
2011 2012 2013 2014 2015 2016 2017 2018
$M 5,321
663 Share repurchases
594
515 537
397 Dividends
283
209 217
130 108 M&A enterprise value1
77 76 85 45 2011 2012 2013 2014 2015
Total free cash flow generated: $4B2
2011
TripAdvisor spin
(~$500M invested, $9B value today3)
2011 – 2013
Improving financial performance fueled by organic investment in tech
Working capital for agency hotel build out
$1.2B share repurchases
Opportunistic M&A
2014 – 2015
Solid financial performance
Strategic investments in hotel margins & supply footprint
Significant strategic M&A
$0.6B share repurchases
2016 – 2018 expectations
Continued solid financial performance
Realization of Orbitz synergies and HomeAway transition upside
Balanced capital allocation:
Opportunistic M&A
Share repurchases
Dividends
Notes: 1Does not include $671M divestiture of eLong. 2Free cash flow is a non-GAAP measure and includes eLong. See Appendix for non-GAAP to GAAP reconciliation. 3Value as of 3/11/16.
26
Key investment highlights
1 | | Huge addressable market |
2 | | Operating the world’s largest, diversified travel platform |
3 | | Harnessing significant scale and technological advantages |
4 | | Leading brands with proprietary channels |
5 | | Strong financial performance on solid trajectory |
6 | | Track record of successful M&A and smart capital allocation |
27
28
Appendix
29
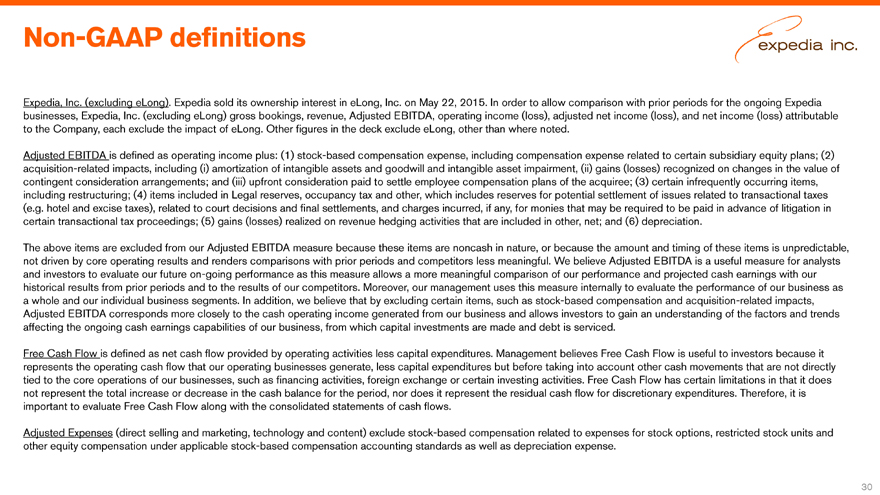
Non-GAAP definitions
Expedia, Inc. (excluding eLong). Expedia sold its ownership interest in eLong, Inc. on May 22, 2015. In order to allow comparison with prior periods for the ongoing Expedia businesses, Expedia, Inc. (excluding eLong) gross bookings, revenue, Adjusted EBITDA, operating income (loss), adjusted net income (loss), and net income (loss) attributable to the Company, each exclude the impact of eLong. Other figures in the deck exclude eLong, other than where noted.
Adjusted EBITDA is defined as operating income plus: (1) stock-based compensation expense, including compensation expense related to certain subsidiary equity plans; (2) acquisition-related impacts, including (i) amortization of intangible assets and goodwill and intangible asset impairment, (ii) gains (losses) recognized on changes in the value of contingent consideration arrangements; and (iii) upfront consideration paid to settle employee compensation plans of the acquiree; (3) certain infrequently occurring items, including restructuring; (4) items included in Legal reserves, occupancy tax and other, which includes reserves for potential settlement of issues related to transactional taxes (e.g. hotel and excise taxes), related to court decisions and final settlements, and charges incurred, if any, for monies that may be required to be paid in advance of litigation in certain transactional tax proceedings; (5) gains (losses) realized on revenue hedging activities that are included in other, net; and (6) depreciation.
The above items are excluded from our Adjusted EBITDA measure because these items are noncash in nature, or because the amount and timing of these items is unpredictable, not driven by core operating results and renders comparisons with prior periods and competitors less meaningful. We believe Adjusted EBITDA is a useful measure for analysts and investors to evaluate our future on-going performance as this measure allows a more meaningful comparison of our performance and projected cash earnings with our historical results from prior periods and to the results of our competitors. Moreover, our management uses this measure internally to evaluate the performance of our business as a whole and our individual business segments. In addition, we believe that by excluding certain items, such as stock-based compensation and acquisition-related impacts, Adjusted EBITDA corresponds more closely to the cash operating income generated from our business and allows investors to gain an understanding of the factors and trends affecting the ongoing cash earnings capabilities of our business, from which capital investments are made and debt is serviced.
Free Cash Flow is defined as net cash flow provided by operating activities less capital expenditures. Management believes Free Cash Flow is useful to investors because it represents the operating cash flow that our operating businesses generate, less capital expenditures but before taking into account other cash movements that are not directly tied to the core operations of our businesses, such as financing activities, foreign exchange or certain investing activities. Free Cash Flow has certain limitations in that it does not represent the total increase or decrease in the cash balance for the period, nor does it represent the residual cash flow for discretionary expenditures. Therefore, it is important to evaluate Free Cash Flow along with the consolidated statements of cash flows.
Adjusted Expenses (direct selling and marketing, technology and content) exclude stock-based compensation related to expenses for stock options, restricted stock units and other equity compensation under applicable stock-based compensation accounting standards as well as depreciation expense.
30
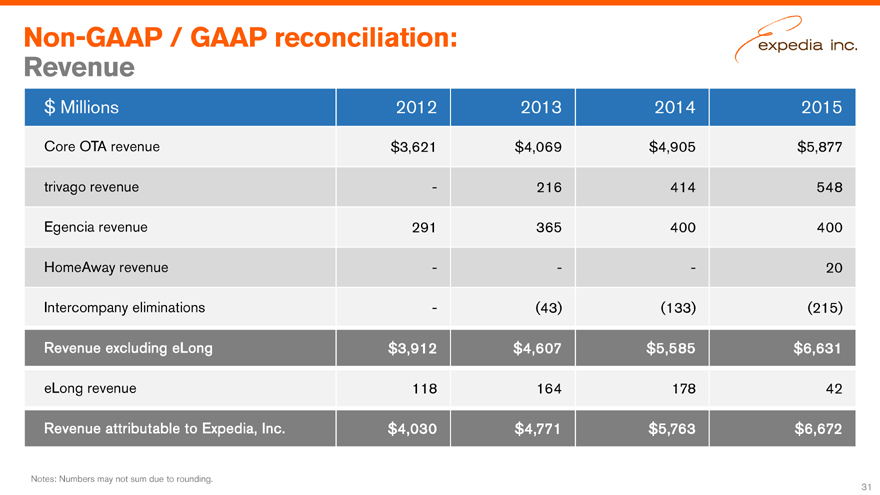
Non-GAAP / GAAP reconciliation:
Revenue
$ Millions 2012 2013 2014 2015
Core OTA revenue $3,621 $4,069 $4,905 $5,877
trivago revenue — 216 414 548
Egencia revenue 291 365 400 400
HomeAway revenue ——— 20
Intercompany eliminations — (43) (133) (215)
Revenue excluding eLong $3,912 $4,607 $5,585 $6,631
eLong revenue 118 164 178 42
Revenue attributable to Expedia, Inc. $4,030 $4,771 $5,763 $6,672
Notes: Numbers may not sum due to rounding.
31
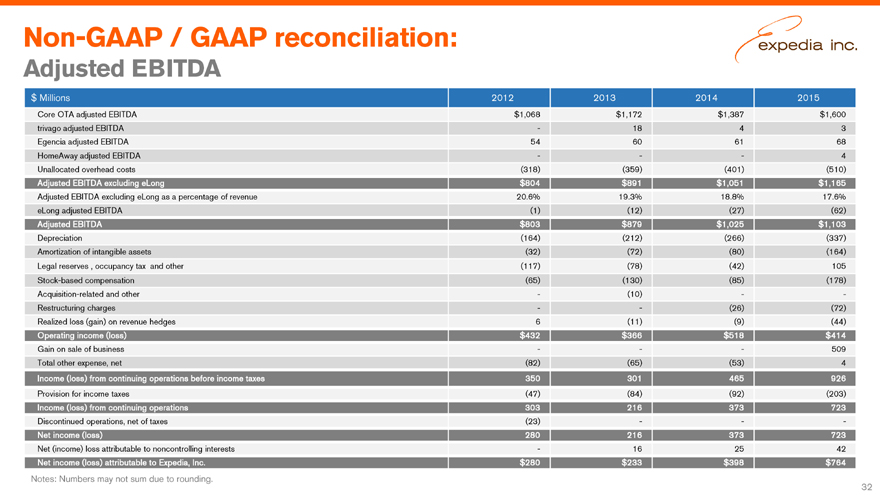
Non-GAAP / GAAP reconciliation:
Adjusted EBITDA
$ Millions 2012 2013 2014 2015
Core OTA adjusted EBITDA $1,068 $1,172 $1,387 $1,600
trivago adjusted EBITDA — 18 4 3
Egencia adjusted EBITDA 54 60 61 68
HomeAway adjusted EBITDA — —— 4
Unallocated overhead costs (318) (359) (401) (510)
Adjusted EBITDA excluding eLong $804 $891 $1,051 $1,165
Adjusted EBITDA excluding eLong as a percentage of revenue 20.6% 19.3% 18.8% 17.6%
eLong adjusted EBITDA (1) (12) (27) (62)
Adjusted EBITDA $803 $879 $1,025 $1,103
Depreciation (164) (212) (266) (337)
Amortization of intangible assets (32) (72) (80) (164)
Legal reserves , occupancy tax and other (117) (78) (42) 105
Stock-based compensation (65) (130) (85) (178)
Acquisition-related and other — (10) ——
Restructuring charges — — (26) (72)
Realized loss (gain) on revenue hedges 6 (11) (9) (44)
Operating income (loss) $432 $366 $518 $414
Gain on sale of business — —— 509
Total other expense, net (82) (65) (53) 4
Income (loss) from continuing operations before income taxes 350 301 465 926
Provision for income taxes (47) (84) (92) (203)
Income (loss) from continuing operations 303 216 373 723
Discontinued operations, net of taxes (23) ———
Net income (loss) 280 216 373 723
Net (income) loss attributable to noncontrolling interests — 16 25 42
Net income (loss) attributable to Expedia, Inc. $280 $233 $398 $764
Notes: Numbers may not sum due to rounding.
32
Non-GAAP / GAAP reconciliation:
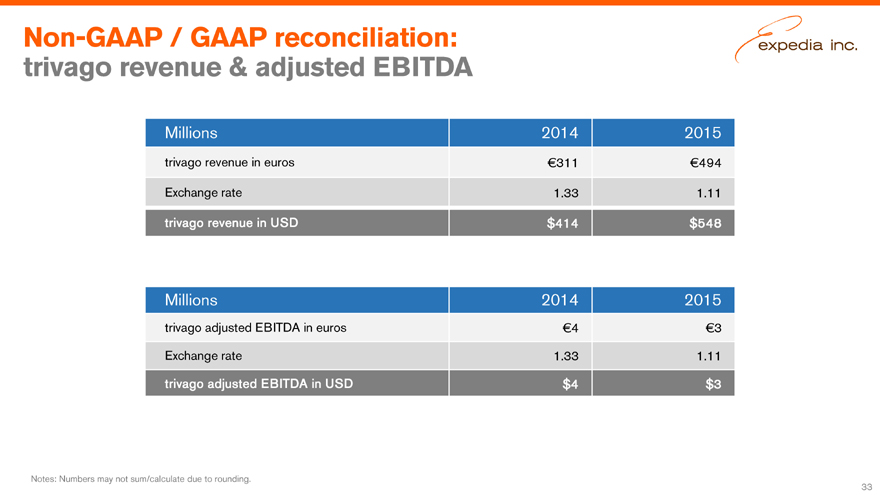
trivago revenue & adjusted EBITDA
Millions 2014 2015
trivago revenue in euros €311 €494
Exchange rate 1.33 1.11
trivago revenue in USD $414 $548
Millions 2014 2015
trivago adjusted EBITDA in euros €4 €3
Exchange rate 1.33 1.11
trivago adjusted EBITDA in USD $4 $3
Notes: Numbers may not sum/calculate due to rounding.
33
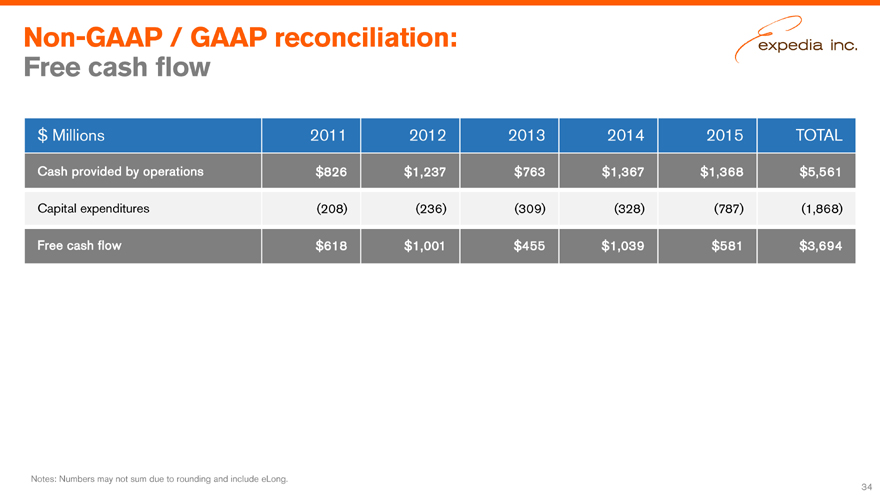
Non-GAAP / GAAP reconciliation:
Free cash flow
$ Millions 2011 2012 2013 2014 2015 TOTAL
Cash provided by operations $826 $ 1,237 $763 $1,367 $1,368 $5,561
Capital expenditures (208) (236) (309) (328) (787) (1,868)
Free cash flow $618 $1,001 $455 $ 1,039 $581 $3,694
Notes: Numbers may not sum due to rounding and include eLong.
34
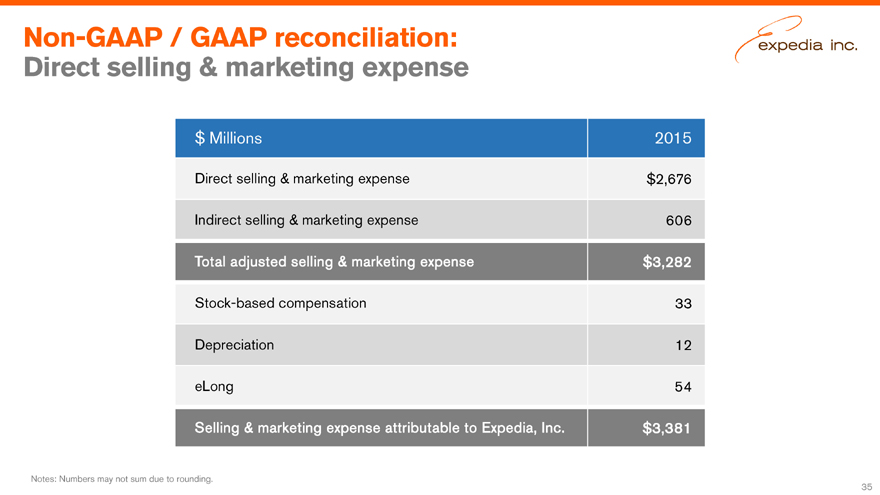
Non-GAAP / GAAP reconciliation:
Direct selling & marketing expense
$ Millions 2015
Direct selling & marketing expense $2,676
Indirect selling & marketing expense 606
Total adjusted selling & marketing expense $3,282
Stock-based compensation 33
Depreciation 12
eLong 54
Selling & marketing expense attributable to Expedia, Inc. $3,381
Notes: Numbers may not sum due to rounding.
35
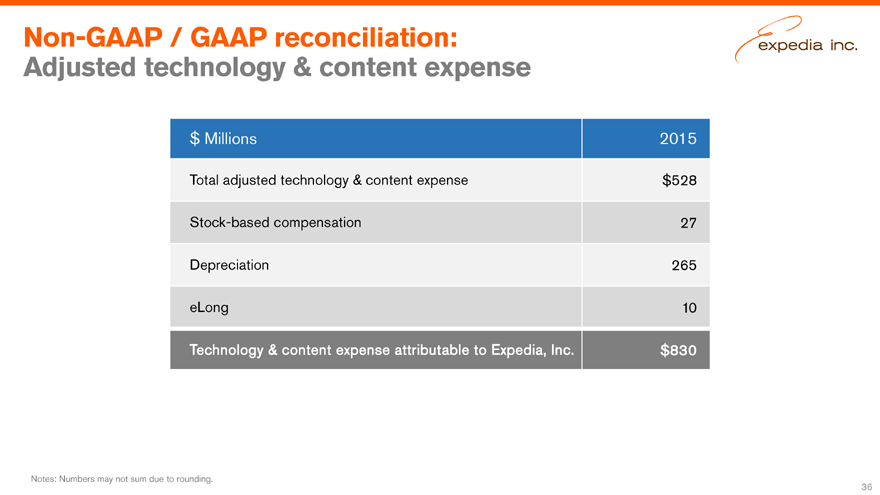
Non-GAAP / GAAP reconciliation:
Adjusted technology & content expense
$ Millions 2015
Total adjusted technology & content expense $528
Stock-based compensation 27
Depreciation 265
eLong 10
Technology & content expense attributable to Expedia, Inc. $830
Notes: Numbers may not sum due to rounding.
36