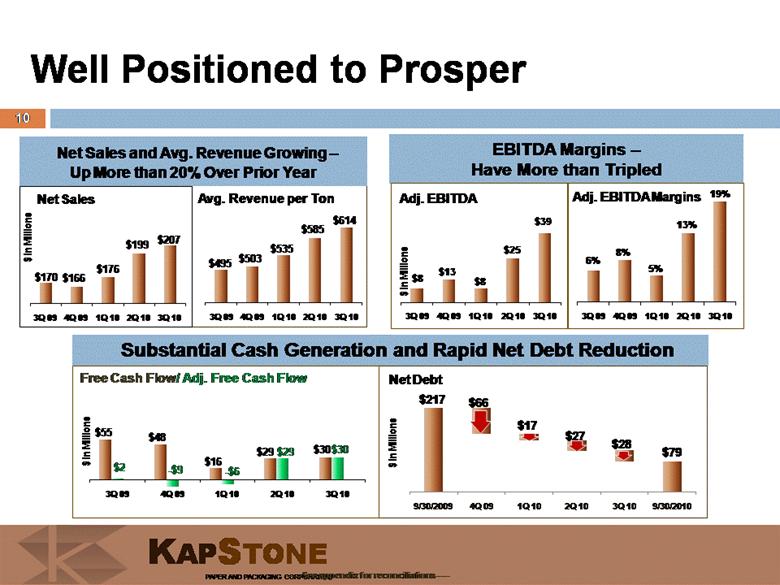
| 23 Supplemental Information $ 000s September 30, 2010 June 30, 2010 March 31, 2010 December 31, 2009 September 30, 2009 Net Income (GAAP) to EBITDA (Non-GAAP) Net income (GAAP) 38,366 $ 7,093 $ 6,391 $ 25,384 $ 25,672 $ Interest income (9) (9) (9) (11) - Interest expense 781 818 861 1,309 2,821 Amortization of debt issuance costs 538 483 776 1,770 2,532 Provision for income taxes (12,765) 3,606 3,581 16,977 15,649 Depreciation and amortization 11,129 11,149 11,346 13,906 13,664 EBITDA (Non-GAAP) 38,040 $ 23,140 $ 22,946 $ 59,335 $ 60,338 $ Plus non cash stock compensation expense 676 1,520 637 691 652 Less capital expenditures (8,325) (8,256) (7,248) (10,509) (5,746) Plus / (less ) cash income taxes received / (paid) 40 13,098 126 (289) 3,448 Less cash interest paid (811) (942) (837) (1,254) (3,751) Free cash flow 29,620 28,560 15,624 47,974 54,941 Less Alternative fuel mixture tax credit - (40) (22,155) (56,534) (53,458) Adjusted free cash flow (non GAAP) 29,620 $ 28,520 $ (6,531) $ (8,560) $ 1,483 $ EBITDA (Non-GAAP) 38,040 $ 23,140 $ 22,946 $ 59,335 $ 60,338 $ Alternative fuel mixture tax credits - (40) (22,155) (56,534) (53,458) Planned maintenance outage - 300 6,510 - - Dunnage bag business - - - - 278 Stock based compensation expense 676 1,520 637 691 652 Resoration of benefits - - - 1,805 - Adjusted EBITDA (Non-GAAP) 38,716 $ 24,920 $ 7,938 $ 5,297 $ 7,810 $ Quarter ended GAAP to Non GAAP Reconciliations (unaudited) |