Exhibit 99.2

Third Quarter 2024 NASDAQ: FRST

This presentation and certain of our other filings with the Securities and Exchange Commission contain statements that consti tut e “forward - looking statements” within the meaning of, and subject to the protections of, Section 27A of the Securities Act of 1933, as amended, and Section 21E of the Securities E xch ange Act of 1934, as amended. All statements other than statements of historical fact are forward - looking statements. Such statements can generally be identified by such words as "may," "plan," "contemplate," "anticipate," "believe," "intend," "continue," "expect," "project," "predict," "estimate," "could," "should," "would," "will," and other similar words or expressions of the future or otherwise regarding the outlook for the Company’s future business and financial performance and/or the performance of the banking industry and economy in general . T hese forward - looking statements include, but are not limited to, our expectations regarding our future operating and financial performance, including the preliminary estimate d f inancial and operating information presented herein, which is subject to adjustment; our outlook and long - term goals for future growth and new offerings and services; our expectatio ns regarding net interest margin; expectations on our growth strategy, expense management, capital management and future profitability; expectations on credit quality and performa nce ; and the assumptions underlying our expectations. Prospective investors are cautioned that any such forward - looking statements are not guarantees of future performance and involv e known and unknown risks and uncertainties which may cause the actual results, performance or achievements of the Company to be materially different from the future results, per formance or achievements expressed or implied by such forward - looking statements. Forward - looking statements are based on the information known to, and current beliefs and expec tations of, the Company’s management and are subject to significant risks and uncertainties. Actual results may differ materially from those contemplated by such forward - loo king statements. Factors that might cause such differences include, but are not limited to: the result of the “pre - clearance” process with the Office of the Chief Accountant o f the SEC and the impact on the Company’s financial statements; the possibility that the Company is unable to regain compliance with, or thereafter continue to comply with, appl ica ble Nasdaq Listing Rules, or experience violations of additional Nasdaq Listing Rules; the possibility that Nasdaq may deny the Company’s appeal and delist the Company’s securitie s; the Company’s ability to implement its various strategic and growth initiatives, including [the sale of the Life Premium Finance Division and the impact on our operating re sul ts] and its recently established Panacea Financial Division and digital banking platform, V1BE fulfillment service and Primis Mortgage Company; competitive pressures among fina nci al institutions increasing significantly; changes in applicable laws, rules, or regulations, including changes to statutes, regulations or regulatory policies or practices; chang es in management’s plans for the future; credit risk associated with our lending activities; the impact of current and future economic and market conditions generally (including seasonality ) a nd in the financial services industry, nationally and within our primary market areas; changes in interest rates, inflation, loan demand, real estate values, or competition, as well as l abo r shortages and supply chain disruptions; changes in accounting principles, policies, or guidelines; adverse results from current or future litigation, regulatory examinations or ot her legal and/or regulatory actions; potential impacts of adverse developments in the banking industry highlighted by high - profile bank failures, including impacts on customer confidence , deposit outflows, liquidity and the regulatory response thereto; potential increases in the provision for credit losses; our ability to identify and address increased cyber sec urity risks, including those impacting vendors and other third parties; fraud or misconduct by internal or external actors, which we may not be able to prevent, detect or mitigate; a cts of God or of war or other conflicts, including the current Ukraine/Russia conflict and Israel/Hamas conflict, acts of terrorism, pandemics or other catastrophic events that may affect gen eral economic conditions; and other general competitive, economic, political, and market factors, including those affecting our business, operations, pricing, products, or services. Forward - looking statements speak only as of the date on which such statements are made. These forward - looking statements are bas ed upon information presently known to the Company’s management and are inherently subjective, uncertain and subject to change due to any number of risks and uncertaint ies , including, without limitation, the risks and other factors set forth in the Company’s filings with the Securities and Exchange Commission, the Company’s Annual Report on Form 1 0 - K for the year ended December 31, 2023, under the captions “Cautionary Note Regarding Forward - Looking Statements” and “Risk Factors,” and in the Company’s Quarterly Reports o n Form 10 - Q and Current Reports on Form 8 - K. The Company undertakes no obligation to update any forward - looking statement to reflect events or circumstances after the date o n which such statement is made, or to reflect the occurrence of unanticipated events. Readers are cautioned not to place undue reliance on these forward - looking statements. 2
Statements included in this presentation include non - GAAP financial measures and should be read along with the accompanying tabl es. Primis uses non - GAAP financial measures to analyze its performance. The measures entitled net income adjusted for nonrecurring income a nd expenses; pre - tax pre - provision operating earnings; operating return on average assets; pre - tax pre - provision operating return o n average assets; operating return on average equity; operating return on average tangible equity; operating efficiency ratio; operating earnin gs per share – basic; operating earnings per share – diluted; tangible book value per share; tangible common equity; tangible common equity to tangibl e assets; and core net interest margin are not measures recognized under GAAP and therefore are considered non - GAAP financial measures. We use the term “operating” to describe a financial measure that excludes income or expense considered to be non - recurring in nature. Items ide ntified as non - operating are those that, when excluded from a reported financial measure, provide management or the reader with a measure th at may be more indicative of forward - looking trends in our business. A reconciliation of these non - GAAP financial measures to the most compara ble GAAP measures is provided in the Reconciliation of Non - GAAP Items table. Management believes that these non - GAAP financial measures provide additional useful information about Primis that allows manage ment and investors to evaluate the ongoing operating results, financial strength and performance of Primis and provide meaningful comp ari son to its peers. Non - GAAP financial measures should not be considered as an alternative to any measure of performance or financial condition as p romulgated under GAAP, and investors should consider Primis’ performance and financial condition as reported under GAAP and all other re lev ant information when assessing the performance or financial condition of Primis. Non - GAAP financial measures are not standardized a nd, therefore, it may not be possible to compare these measures with other companies that present measures having the same or similar names. Non - GAAP financial measures have limitations as analytical tools, and investors should not consider them in isolation or as a su bstitute for analysis of the results or financial condition as reported under GAAP. 3

Corp. Headquarters: McLean, VA Bank Headquarters: Glen Allen, VA Branches: 24 Ticker (NASDAQ): FRST Valuation Market Capitalization: $297 million Price / Book Value per Share 0.78x Price / Tangible Book Value (1) : 1.03x Price / 2024 Estimated EPS (2) : 7.28x Price / 2025 Estimated EPS (2) : 6.67x Dividend Yield (3) : 3.33% 4 Pricing as of October 22, 2024. Financial data as of or for the three months ended September 30, 2024. (1) See reconciliation of Non - GAAP financial measures on slide 21. (2) Mean analyst estimates per Bloomberg. (3) Assumes $0.40 annualized dividend.

5 • Attractive community bank deposit base with core bank cost of deposits of only 2.29% in Q3 • V1BE adoption/utilization continues to build with users up 5% in Q3, primarily due to addition of small - business customers Deposits per Branch (2) Dollars in Millions. (1) V1BE is a proprietary bank delivery app for on - demand ordering of branch services (2) Deposits per branch includes balances that were swept off balance sheet in the respective period. 2,497 Users with 131 added in Q3’24 ~$189 million Deposit balance of V1BE users 82% % of active V1BE Users are SMBs V1BE Update (1) 11,268 Q3 Transactions Branch V1BE Customer $137.8 $139.0 $138.1 $136.3 $102.9 Q3'24 Q2'24 Q1'24 Q4'23 Q3'23

6 • On October 24, 2024, the Bank entered into a purchase and assumption agreement with EverBank, N.A. to acquire Primis’ Life Premium Finance Division • EverBank will acquire the substantial majority of the associated loans along with the operations and employees of the divisio n for a premium of $6 million • Estimating $4.5 million pre - tax gain in Q4’24 after transaction expenses • Approximately $370 million of loans will be purchased on October 31, 2024 • Primis Bank will provide interim servicing until the final closing on January 31, 2025 • Loans originated between closings will be acquired on a regular basis at par • Primis to retain approximately $142 million of loans

• Hired a seasoned team of professionals in October 2024 to lead an expanded Mortgage Warehouse Lending effort • Long track record in the space and most recently at a large bank that is exiting the business due to its pending sale • Four key leadership individuals covering sales, operations, credit and portfolio management • Anticipate another 4 to 5 hires as the business ramps • Attractive asset class with low losses and attractive yields • Potentially 125 bps to 150 bps higher effective yields than premium finance loans • Primis already had mortgage warehouse lending capabilities and systems in place but with limited production • Limited incremental expense burden anticipated for systems and infrastructure • Receptivity has been strong due to multiple parties existing the space in recent months • 27 customers already in the pipeline with initial fundings anticipated by the end of October 2024 • By the end of Q2 2025, anticipate outstandings of $250 - 350 million 7

• Life - to - date loan originations of ~ $550 mil. (committed bal.) , +33% y/y • Q3’24 originations of $ 28.3 mil. • Total deposits of $ 90 mil., + 69 % y/y • 9 /30/24 deposit cost of 2.00% • YTD Pre - Tax 1.90% ROA and $4.8 million pre - tax earnings contribution • #1 Ranked “Bank For Doctors” on Google • >5,500 doctors and practices nationwide • Preferred partner for 38 national and state medical, dental and veterinary associations and organizations representing >415,000 active doctors in the U.S. Q3’24 Summary Q3’24 Loan Composition ($392 million) 8 71.2% 17.6% 11.1% Commercial PRN Student Refi
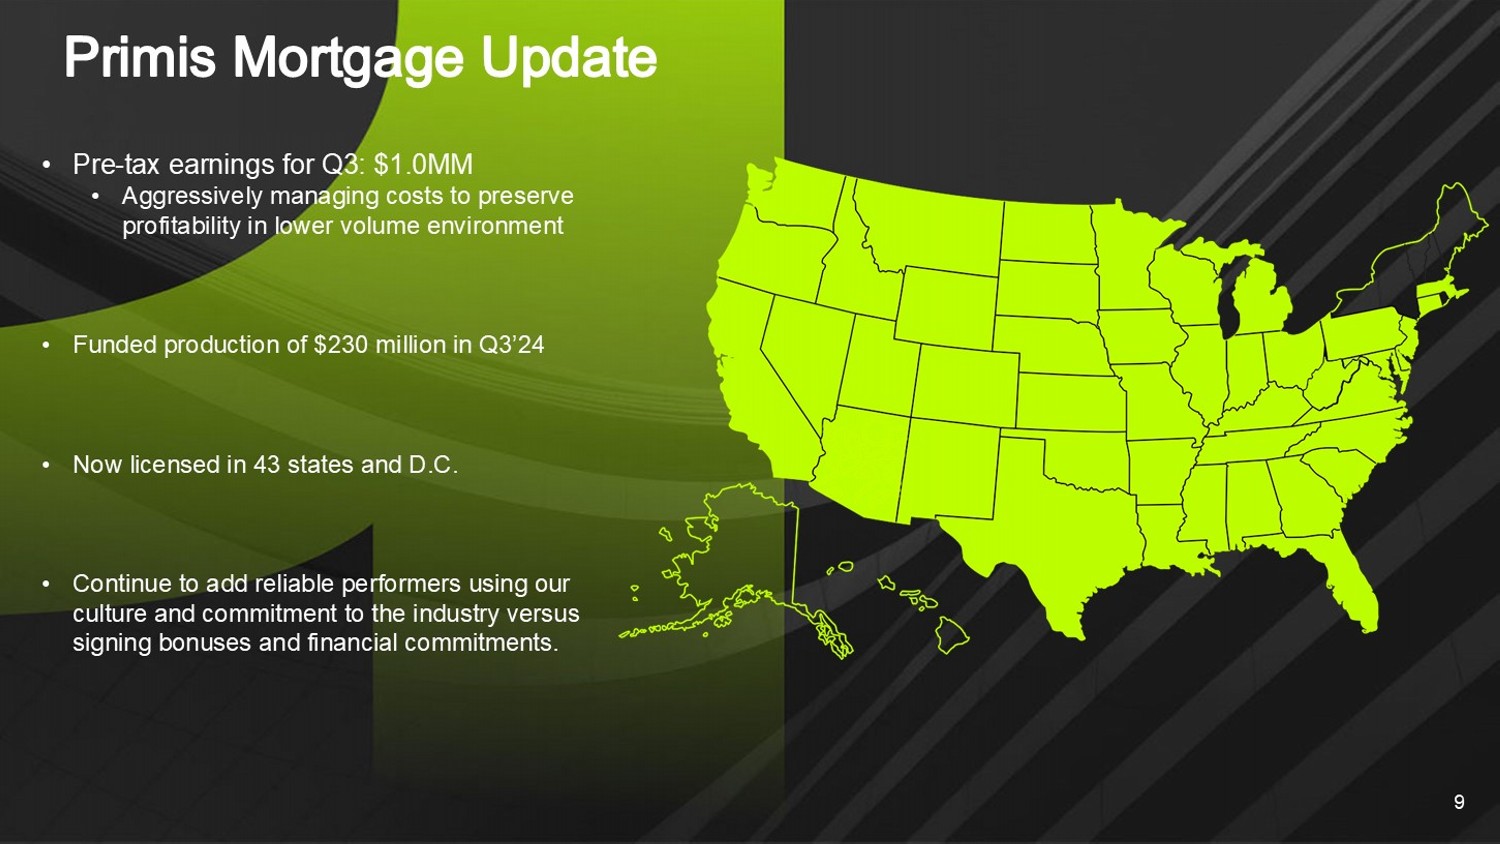
9 • Pre - tax earnings for Q3: $1.0MM • Aggressively managing costs to preserve profitability in lower volume environment • Funded production of $230 million in Q3’24 • Now licensed in 43 states and D.C. • Continue to add reliable performers using our culture and commitment to the industry versus signing bonuses and financial commitments.

Third Quarter Results

Dollars in millions. (1) See reconciliation of Non - GAAP financial measures on slide 21. (2) Gross Loans does not include Life Premium Finance loans that are held for sale 11 (1) (2) $4,025 $3,966 $3,890 $3,857 $3,839 $2,965 $3,301 $3,228 $3,219 $3,174 $3,306 $3,335 $3,315 $3,270 $3,293 7.30% 7.27% 7.36% 7.46% 7.53% Q3'24 Q2'24 Q1'24 Q4'23 Q3'23 Total Assets Gross Loans Deposits TCE/TA
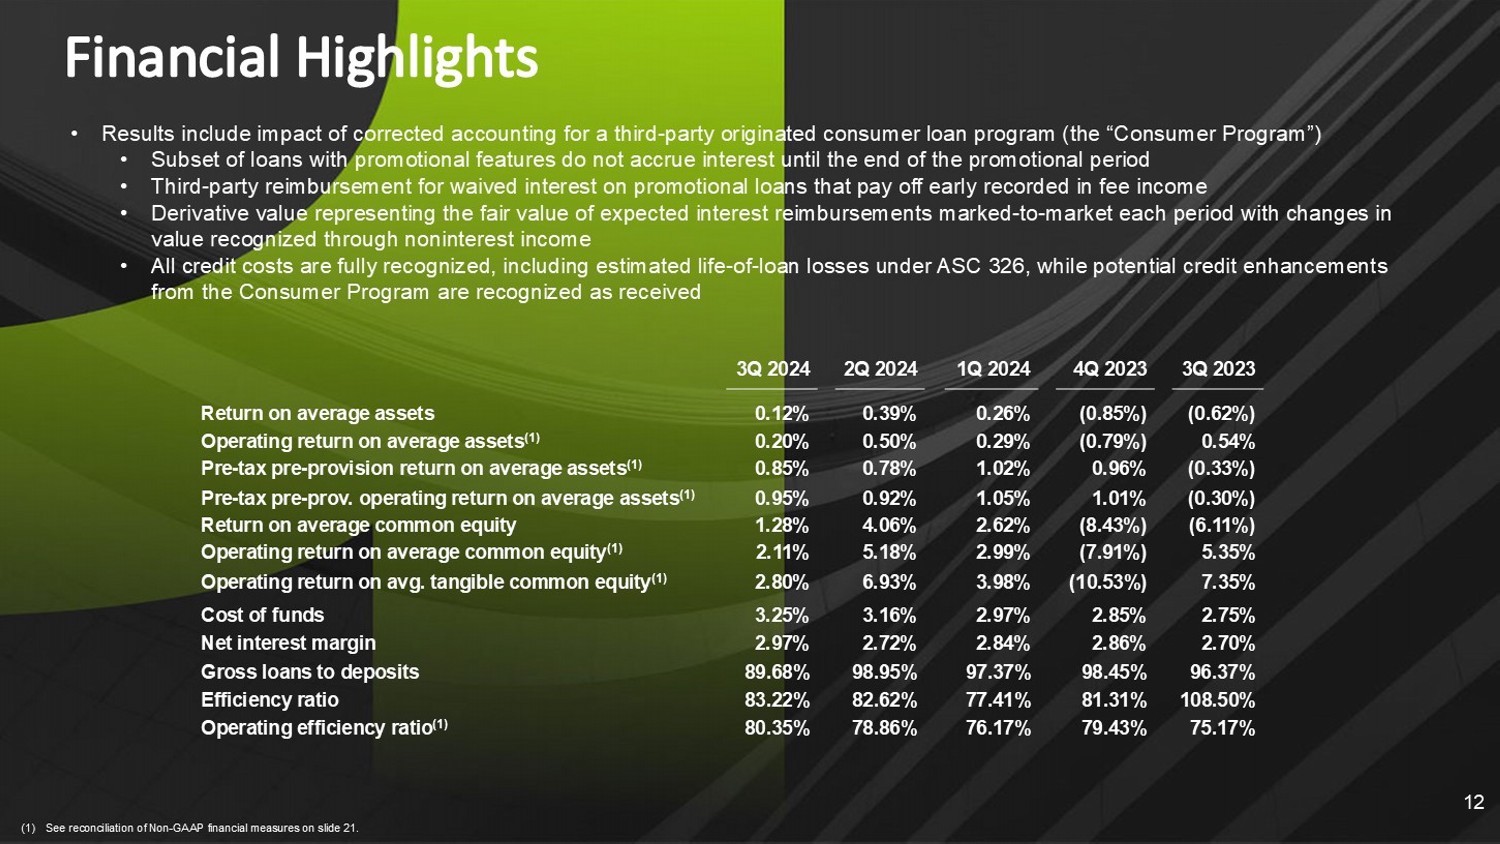
(1) See reconciliation of Non - GAAP financial measures on slide 21. • Results include impact of corrected accounting for a third - party originated consumer loan program (the “Consumer Program”) • Subset of loans with promotional features do not accrue interest until the end of the promotional period • Third - party reimbursement for waived interest on promotional loans that pay off early recorded in fee income • Derivative value representing the fair value of expected interest reimbursements marked - to - market each period with changes in value recognized through noninterest income • All credit costs are fully recognized, including estimated life - of - loan losses under ASC 326, while potential credit enhancement s from the Consumer Program are recognized as received 12 3Q 2023 4Q 2023 1Q 2024 2Q 2024 3Q 2024 (0.62%) (0.85%) 0.26% 0.39% 0.12% Return on average assets 0.54% (0.79%) 0.29% 0.50% 0.20% Operating return on average assets ( 1 ) (0.33%) 0.96% 1.02% 0.78% 0.85% Pre - tax pre - provision return on average assets ( 1 ) (0.30%) 1.01% 1.05% 0.92% 0.95% Pre - tax pre - prov . operating return on average assets ( 1 ) (6.11%) (8.43%) 2.62% 4.06% 1.28% Return on average common equity 5.35% (7.91%) 2.99% 5.18% 2.11% Operating return on average common equity ( 1 ) 7.35% (10.53%) 3.98% 6.93% 2.80% Operating return on avg . tangible common equity ( 1 ) 2.75% 2.85% 2.97% 3.16% 3.25% Cost of funds 2.70% 2.86% 2.84% 2.72% 2.97% Net interest margin 96.37% 98.45% 97.37% 98.95% 89.68% Gross loans to deposits 108.50% 81.31% 77.41% 82.62% 83.22% Efficiency ratio 75.17% 79.43% 76.17% 78.86% 80.35% Operating efficiency ratio ( 1 )
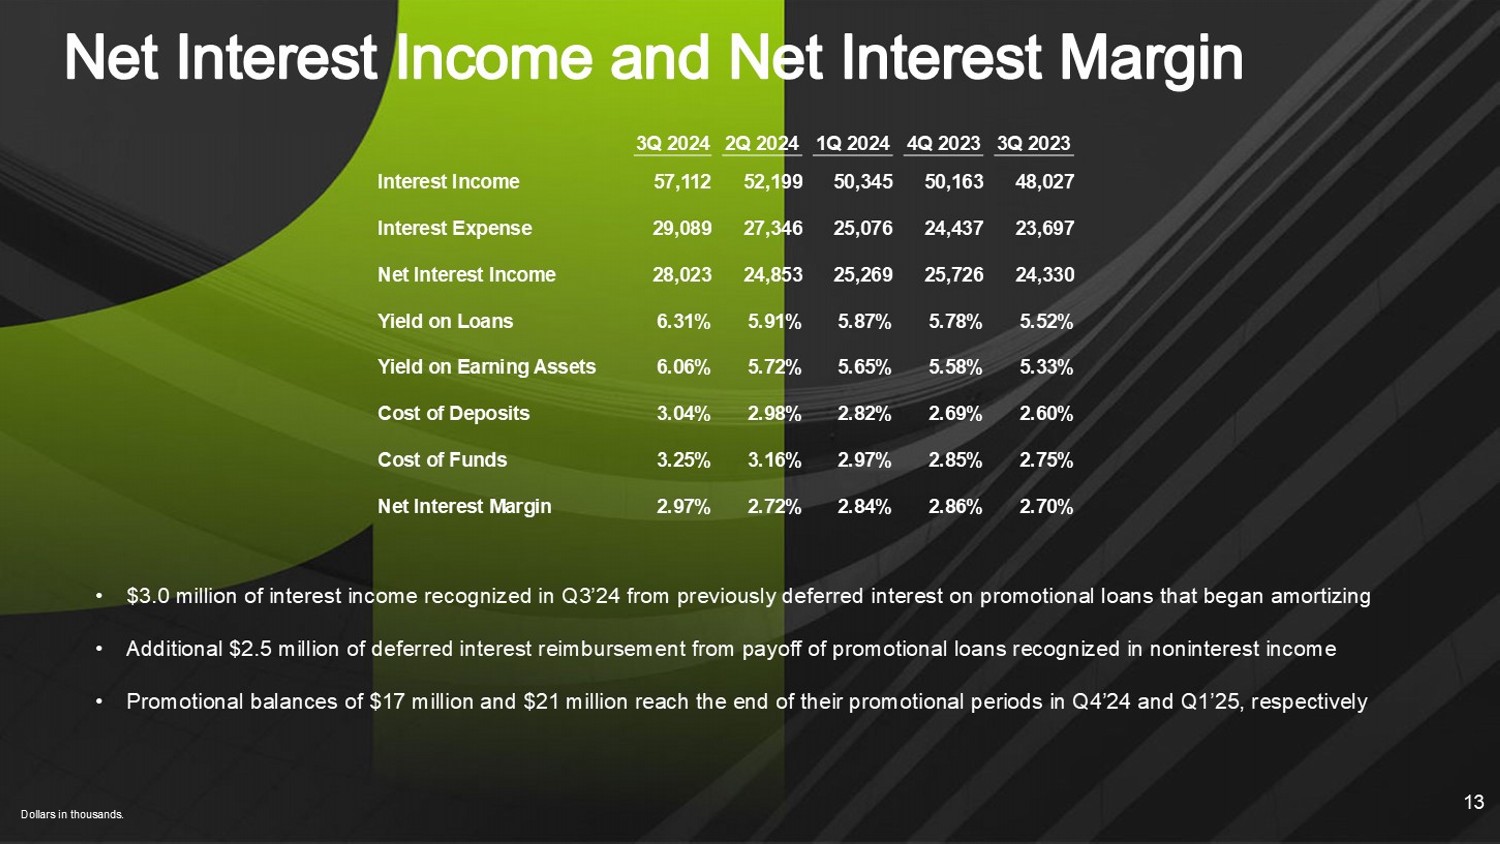
Dollars in thousands. 13 • $3.0 million of interest income recognized in Q3’24 from previously deferred interest on promotional loans that began amortiz ing • Additional $2.5 million of deferred interest reimbursement from payoff of promotional loans recognized in noninterest income • Promotional balances of $17 million and $21 million reach the end of their promotional periods in Q4’24 and Q1’25, respective ly 3Q 2023 4Q 2023 1Q 2024 2Q 2024 3Q 2024 48,027 50,163 50,345 52,199 57,112 Interest Income 23,697 24,437 25,076 27,346 29,089 Interest Expense 24,330 25,726 25,269 24,853 28,023 Net Interest Income 5.52% 5.78% 5.87% 5.91% 6.31% Yield on Loans 5.33% 5.58% 5.65% 5.72% 6.06% Yield on Earning Assets 2.60% 2.69% 2.82% 2.98% 3.04% Cost of Deposits 2.75% 2.85% 2.97% 3.16% 3.25% Cost of Funds 2.70% 2.86% 2.84% 2.72% 2.97% Net Interest Margin
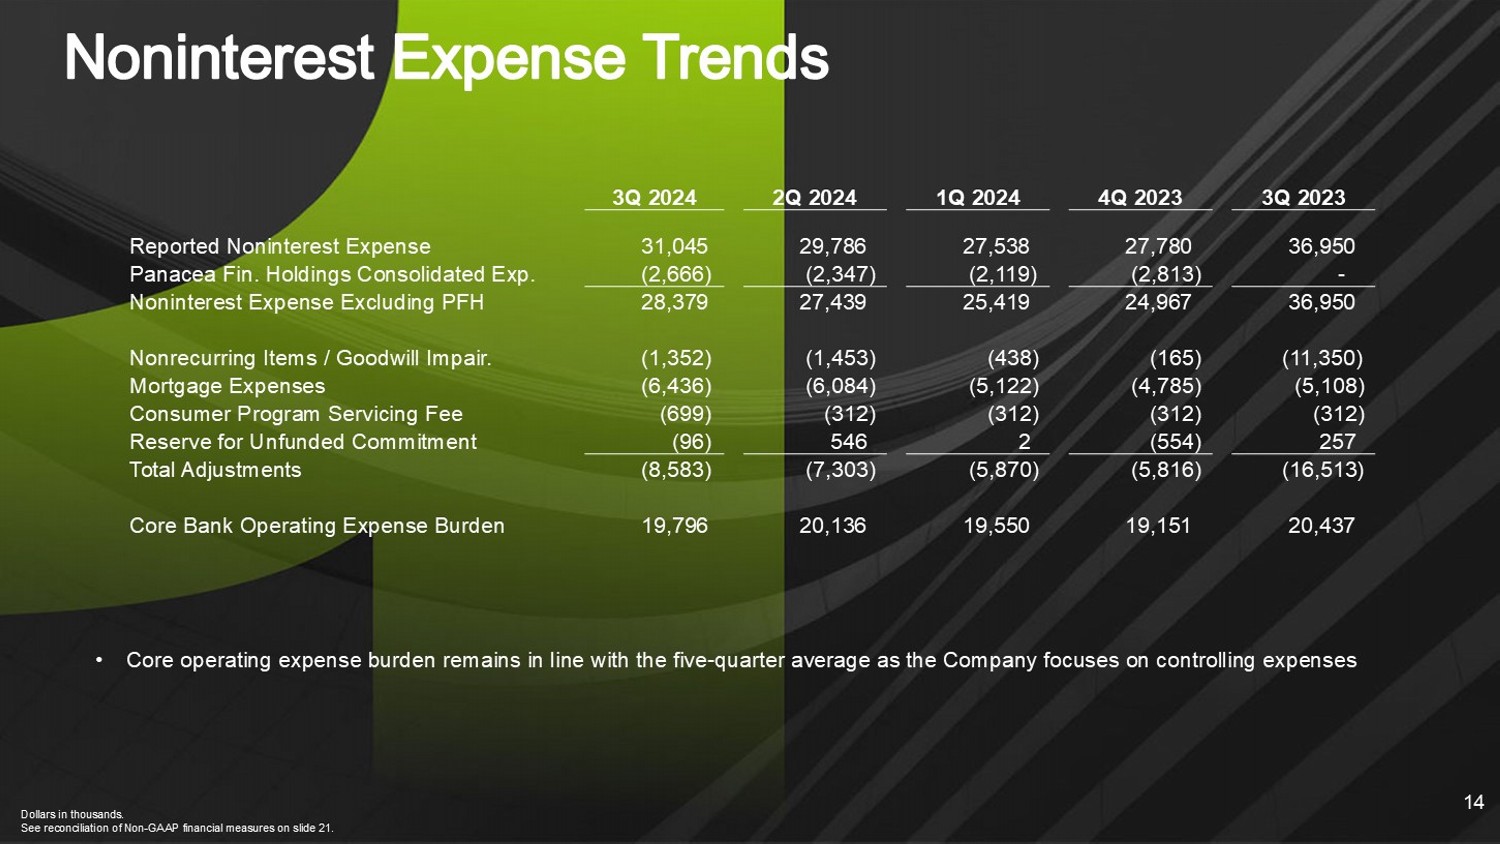
Dollars in thousands. See reconciliation of Non - GAAP financial measures on slide 21. 14 3Q 2023 4Q 2023 1Q 2024 2Q 2024 3Q 2024 36,950 27,780 27,538 29,786 31,045 Reported Noninterest Expense - (2,813) (2,119) (2,347) (2,666) Panacea Fin. Holdings Consolidated Exp. 36,950 24,967 25,419 27,439 28,379 Noninterest Expense Excluding PFH (11,350) (165) (438) (1,453) (1,352) Nonrecurring Items / Goodwill Impair. (5,108) (4,785) (5,122) (6,084) (6,436) Mortgage Expenses (312) (312) (312) (312) (699) Consumer Program Servicing Fee 257 (554) 2 546 (96) Reserve for Unfunded Commitment (16,513) (5,816) (5,870) (7,303) (8,583) Total Adjustments 20,437 19,151 19,550 20,136 19,796 Core Bank Operating Expense Burden • Core operating expense burden remains in line with the five - quarter average as the Company focuses on controlling expenses

Dollars in millions. (1) Core deposits exclude time deposits 15 Deposit Composition – Q3’24 Core Deposit Growth (1) • Total deposits were down slightly compared to Q2 • $75 million brokered deposits, maturing late - 2024, and $165 million of short - term FHLB advances at September 30, 2024 Cost of Deposits: 304 bps Demand Deposits 12.7% NOW Accounts 22.6% Money Market Accounts 25.3% Savings Accounts 26.4% Time Deposits 12.9% $2,458 $2,492 $2,429 $2,351 $2,351 $421 $420 $463 $473 $491 $2,879 $2,912 $2,892 $2,824 $2,842 3.04% 2.98% 2.82% 2.69% 2.60% Q3'24 Q2'24 Q1'24 Q4'23 Q3'23 Demand Interest Bearing Deposits Cost of Deposits

NOO CRE By Collateral Type (1) • Hotel portfolio down to $193 million from almost $300 million in early 2020 • Occupancy, RevPAR, and ADR exceeding 2019 performance • Debt coverage over 1.50x • Office non owner - occupied CRE was $136 million at September 30 • LTV across all office is 63% • All guaranteed by very high net worth guarantors • Significant maturities/rate resets don’t begin until 2026 • Retail exposure of $93 million at September 30 • Low weighted - average LTV of 58% • Low average loan size of less than $2 million 16 Dollars in millions. (1) Loan balances using Book Balances and total loans include loans held for sale for Life Premium Finance transaction Non - Owner Occupied Office CRE $136 4% Non - Owner Occupied Non - Office CRE $468 14% All Other Loans Excl PPP $2,729 82% % of Portfolio Excl PPP Total Outstanding Non - Owner - Occupied CRE by Type 5.8% $193 Hotel 4.1% $136 Office 2.8% $93 Retail 1.8% $61 Assisted Living 1.0% $34 All other 0.7% $22 Warehouse/Industrial 1.5% $50 Mixed Use 18.1% $604 Total Non - Owner Occupied CRE

0.27% 0.24% 0.11% 0.07% 0.15% 0.26% 0.37% 0.53% 0.53% 0.78% 0.53% 0.61% 0.64% 0.60% 0.93% Q3'23 Q4'23 Q1'24 Q2'24 Q3'24 Core C/O's Consumer Program C/O's Classified loans and NPAs exclude guaranteed portion of SBA loans. Core net charge - offs exclude consumer program charge - offs Loans include Life Premium Finance loans that are held for sale 17 NPAs / Loans (Ex. PPP) + OREO Core NCOs / Average Loans Criticized & Classified Loans / Total Loans (Ex. PPP) • Nonperforming assets, excluding portions guaranteed by the SBA, were $10.2 million at September 30, 2024, compared to $9.9 million at June 30, 2024 • Loans rated substandard or doubtful increased to $47.6 million in the third quarter of 2024 from $15.5 million in the second quarter of 2024 largely due to one credit that was downgraded in the quarter • Net charge - offs were $8.0 million for the third quarter of 2024, up from $5.0 million for the second quarter of 2024 • Includes $6.7 million from Consumer Program • Core net charge - offs of $1.3 million • No OREO as of September 30, 2024 1.88% 0.90% 0.96% 3.02% 2.85% Q3'23 Q4'23 Q1'24 Q2'24 Q3'24 0.62% 0.24% 0.27% 0.30% 0.31% Q3'23 Q4'23 Q1'24 Q2'24 Q3'24

18 ACL Walk Forward ACL / Gross Loans (Ex. PPP) (1) • Provision for credit losses of $7.5 million in Q3 versus provision of $3.1 million in Q2 • Provision includes $4.0 million related to Consumer Program • ACL coverage of gross loans, including Life Premium Finance loans classified as HFS, was 1.53% at the end of Q3 Dollars in millions (1) Gross Loans include Life Premium Finance loans that are held for sale 4 &RQV3UJP/RDQV3URY &RQV3UJP&2 V &RUH3URY &RUH& 2 V 4 1.06% 0.99% 1.01% 0.94% 1.00% 2.24% 11.38% 11.37% 11.61% 10.87% 1.13% 1.62% 1.66% 1.56% 1.53% Q3'23 Q4'23 Q1'24 Q2'24 Q3'24 Core Consumer Program

• Talented management team and board committed to building long - term shareholder value • Attractive core - funded community bank with a complementary digital funding platform • Aggressive and early use of technology positioning the Bank for superior performance as the industry evolves • Significant valuation upside 19

Appendix 20
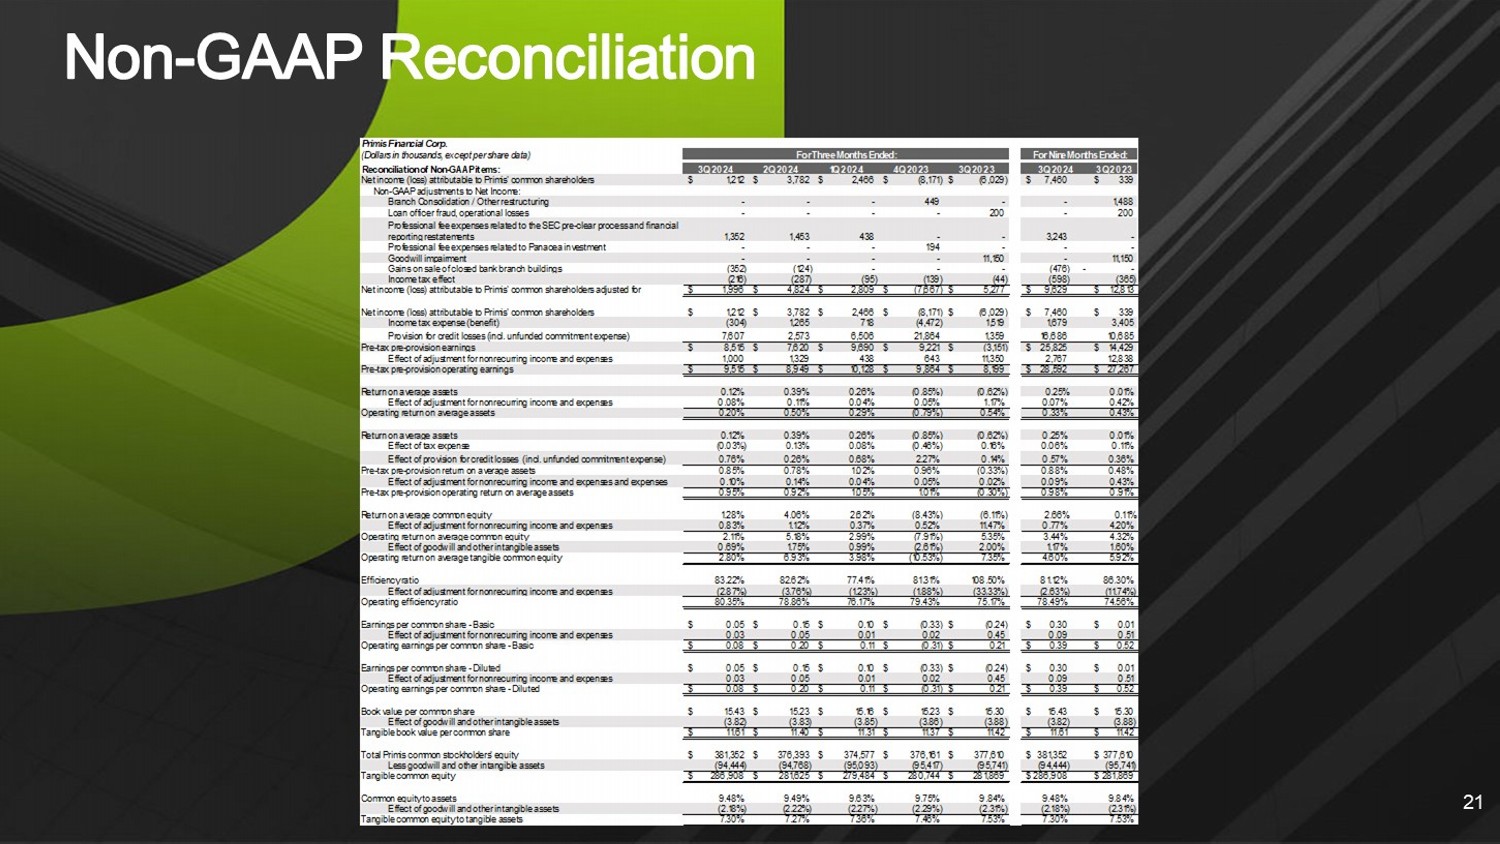
21 Primis Financial Corp. (Dollars in thousands, except per share data) For Three Months Ended: Reconciliation of Non-GAAP items: 3Q 2024 2Q 2024 1Q 2024 4Q 2023 3Q 2023 3Q 2024 3Q 2023 Net income (loss) attributable to Primis' common shareholders 1,212$ 3,782$ 2,466$ (8,171)$ (6,029)$ 7,460$ 339$ Non-GAAP adjustments to Net Income: Branch Consolidation / Other restructuring - - - 449 - - 1,488 Loan officer fraud, operational losses - - - - 200 - 200 1,352 1,453 438 - - 3,243 - Professional fee expenses related to Panacea investment - - - 194 - - - Goodwill impairment - - - - 11,150 - 11,150 Gains on sale of closed bank branch buildings (352) (124) - - - (476) - - Income tax effect (216) (287) (95) (139) (44) (598) (365) 1,996$ 4,824$ 2,809$ (7,667)$ 5,277$ 9,629$ 12,813$ Net income (loss) attributable to Primis' common shareholders 1,212$ 3,782$ 2,466$ (8,171)$ (6,029)$ 7,460$ 339$ Income tax expense (benefit) (304) 1,265 718 (4,472) 1,519 1,679 3,405 7,607 2,573 6,506 21,864 1,359 16,686 10,685 Pre-tax pre-provision earnings 8,515$ 7,620$ 9,690$ 9,221$ (3,151)$ 25,825$ 14,429$ 1,000 1,329 438 643 11,350 2,767 12,838 Pre-tax pre-provision operating earnings 9,515$ 8,949$ 10,128$ 9,864$ 8,199$ 28,592$ 27,267$ Return on average assets 0.12% 0.39% 0.26% (0.85%) (0.62%) 0.25% 0.01% Effect of adjustment for nonrecurring income and expenses 0.08% 0.11% 0.04% 0.05% 1.17% 0.07% 0.42% Operating return on average assets 0.20% 0.50% 0.29% (0.79%) 0.54% 0.33% 0.43% Return on average assets 0.12% 0.39% 0.26% (0.85%) (0.62%) 0.25% 0.01% Effect of tax expense (0.03%) 0.13% 0.08% (0.46%) 0.16% 0.06% 0.11% 0.76% 0.26% 0.68% 2.27% 0.14% 0.57% 0.36% Pre-tax pre-provision return on average assets 0.85% 0.78% 1.02% 0.96% (0.33%) 0.88% 0.48% 0.10% 0.14% 0.04% 0.05% 0.02% 0.09% 0.43% Pre-tax pre-provision operating return on average assets 0.95% 0.92% 1.05% 1.01% (0.30%) 0.98% 0.91% Return on average common equity 1.28% 4.06% 2.62% (8.43%) (6.11%) 2.66% 0.11% Effect of adjustment for nonrecurring income and expenses 0.83% 1.12% 0.37% 0.52% 11.47% 0.77% 4.20% Operating return on average common equity 2.11% 5.18% 2.99% (7.91%) 5.35% 3.44% 4.32% Effect of goodwill and other intangible assets 0.69% 1.75% 0.99% (2.61%) 2.00% 1.17% 1.60% Operating return on average tangible common equity 2.80% 6.93% 3.98% (10.53%) 7.35% 4.60% 5.92% Efficiency ratio 83.22% 82.62% 77.41% 81.31% 108.50% 81.12% 86.30% (2.87%) (3.76%) (1.23%) (1.88%) (33.33%) (2.63%) (11.74%) Operating efficiency ratio 80.35% 78.86% 76.17% 79.43% 75.17% 78.49% 74.56% Earnings per common share - Basic 0.05$ 0.15$ 0.10$ (0.33)$ (0.24)$ 0.30$ 0.01$ Effect of adjustment for nonrecurring income and expenses 0.03 0.05 0.01 0.02 0.45 0.09 0.51 Operating earnings per common share - Basic 0.08$ 0.20$ 0.11$ (0.31)$ 0.21$ 0.39$ 0.52$ Earnings per common share - Diluted 0.05$ 0.15$ 0.10$ (0.33)$ (0.24)$ 0.30$ 0.01$ Effect of adjustment for nonrecurring income and expenses 0.03 0.05 0.01 0.02 0.45 0.09 0.51 Operating earnings per common share - Diluted 0.08$ 0.20$ 0.11$ (0.31)$ 0.21$ 0.39$ 0.52$ Book value per common share 15.43$ 15.23$ 15.16$ 15.23$ 15.30$ 15.43$ 15.30$ Effect of goodwill and other intangible assets (3.82) (3.83) (3.85) (3.86) (3.88) (3.82) (3.88) Tangible book value per common share 11.61$ 11.40$ 11.31$ 11.37$ 11.42$ 11.61$ 11.42$ Total Primis common stockholders' equity 381,352$ 376,393$ 374,577$ 376,161$ 377,610$ 381,352$ 377,610$ Less goodwill and other intangible assets (94,444) (94,768) (95,093) (95,417) (95,741) (94,444) (95,741) Tangible common equity 286,908$ 281,625$ 279,484$ 280,744$ 281,869$ 286,908$ 281,869$ Common equity to assets 9.48% 9.49% 9.63% 9.75% 9.84% 9.48% 9.84% Effect of goodwill and other intangible assets (2.18%) (2.22%) (2.27%) (2.29%) (2.31%) (2.18%) (2.31%) Tangible common equity to tangible assets 7.30% 7.27% 7.36% 7.46% 7.53% 7.30% 7.53% For Nine Months Ended: Professional fee expenses related to the SEC pre-clear process and financial reporting restatements Net income (loss) attributable to Primis' common shareholders adjusted for Effect of provision for credit losses (incl. unfunded commitment expense) Provision for credit losses (incl. unfunded commitment expense) Effect of adjustment for nonrecurring income and expenses Effect of adjustment for nonrecurring income and expenses Effect of adjustment for nonrecurring income and expenses and expenses