UNITED STATES
SECURITIES AND EXCHANGE COMMISSION
WASHINGTON, D.C. 20549
FORM 20-F
(Mark One)
o | REGISTRATION STATEMENT PURSUANT TO SECTION 12(b) OR (g) OF THE SECURITIES EXCHANGE ACT OF 1934 |
|
|
OR | |
|
|
x | ANNUAL REPORT PURSUANT TO SECTION 13 OR 15(d) OF THE SECURITIES EXCHANGE ACT OF 1934 |
|
|
OR | |
|
|
o | TRANSITION REPORT PURSUANT TO SECTION 13 OR 15(d) OF THE SECURITIES EXCHANGE ACT OF 1934 |
|
|
OR | |
|
|
o | SHELL COMPANY REPORT PURSUANT TO SECTION 13 OR 15(d) OF THE SECURITIES EXCHANGE ACT OF 1934 |
Commission file number: 000-55246
Sundance Energy Australia Limited |
(Exact name of Registrant as specified in its charter) |
|
Australia |
(Jurisdiction of incorporation or organization) |
|
633 17th Street, Suite 1950 Denver, CO 80202 Tel: (303) 543-5700 |
(Address of principal executive offices) |
|
Eric P. McCrady Sundance Energy, Inc. Chief Executive Officer 633 17th Street, Suite 1950 Denver, CO 80202 Tel: (303) 543-5700 Fax: (303) 543-5701 |
(Name, Telephone, E-mail and/or Facsimile number and Address of Company Contact Person) |
Securities registered or to be registered pursuant to Section 12(b) of the Act: None
Securities registered or to be registered pursuant to Section 12(g) of the Act:
Ordinary Shares |
(Title of Class) |
Securities for which there is a reporting obligation pursuant to Section 15(d) of the Act: None
Indicate the number of outstanding shares of each of the issuer's classes of capital or common stock as of the close of the period covered by the annual report.
| 549,295,839 Ordinary Shares at December 31, 2014 |
Indicate by check mark if the registrant is a well-known seasoned issuer, as defined in Rule 405 of the Securities Act.
o Yes x No
If this report is an annual or transition report, indicate by check mark if the registrant is not required to file reports pursuant to Section 13 or 15(d) of the Securities Exchange Act of 1934.
o Yes x No
Indicate by check mark whether the registrant (1) has filed all reports required to be filed by Section 13 or 15(d) of the Securities Exchange Act of 1934 during the preceding 12 months (or for such shorter period that the registrant was required to file such reports), and (2) has been subject to such filing requirements for the past 90 days.
x Yes o No
Indicate by check mark whether the registrant has submitted electronically and posted on its corporate Web site, if any, every Interactive Data File required to be submitted and posted pursuant to Rule 405 of Regulation S-T during the preceding 12 months (or for such shorter period that the registrant was required to submit and post such files).
o Yes o No
Indicate by check mark whether the registrant is a large accelerated filer, an accelerated filer, or a non-accelerated filer. See definition of “accelerated filer and large accelerated filer” in Rule 12b-2 of the Exchange Act. (Check one):
Large accelerated filer o |
| Accelerated filer o |
| Non-accelerated filer x |
Indicate by check mark which basis of accounting the registrant has used to prepare the financial statements included in this filing:
U.S. GAAP o |
| International Financial Reporting Standards as issued |
| Other o |
If “Other” has been checked in response to the previous question, indicate by check mark which financial statement item the registrant has elected to follow.
o Item 17 o Item 18
If this is an annual report, indicate by check mark whether the registrant is a shell company (as defined in Rule 12b-2 of the Exchange Act).
o Yes x No
EXPLANATORY NOTES
Unless otherwise indicated or the context implies otherwise:
· “we,” “us,” “our” or “Sundance” refers to Sundance Energy Australia Limited, an Australian corporation, and its subsidiaries;
· “SEC” refers to the Securities and Exchange Commission;
· “shares” or “ordinary shares” refers to our ordinary shares; and
· “Netherland Sewell” refers to Netherland, Sewell & Associates, Inc., our independent engineering firm, that provided the estimates of proved oil and natural gas reserves as of December 31, 2014 and December 31, 2013.
We have also provided definitions for certain oil and natural gas terms used in this prospectus in the “Glossary of Oil and Natural Gas Terms” beginning on page A-1 of this annual report.
All references herein to “$” and “U.S. dollar” are to United States dollars. Except as otherwise stated, all monetary amounts in this annual report are presented in United States dollars.
Effective July 1, 2012, we changed our fiscal year end from June 30 to December 31. This change resulted in a six-month reporting period for our fiscal period ended December 31, 2012.
The disclosures in this annual report are based on the statutory financial information filed with the Australian Securities Exchange (the “ASX”) and the Australian Securities & Investments Commission. These annual report disclosures can be reconciled to those Australian filings with information contained in this annual report, however certain differences may exist as a result of the disclosure requirements under applicable U.S. and Australian rules. We do not believe that any of these differences are material.
FORWARD-LOOKING STATEMENTS
Certain statements in this annual report may constitute “forward-looking statements.” Such forward-looking statements are based on the beliefs of our management as well as assumptions based on information available to us. When used in this annual report, the words “anticipate,” “believe,” “estimate,” “project,” “intend” and “expect” and similar expressions, as they relate to us or our management, are intended to identify forward-looking statements. Such forward-looking statements reflect our current views with respect to future events and are subject to certain known and unknown risks, uncertainties and assumptions. Many factors could cause our actual results, performance or achievements to be materially different from any future results, performance or achievements that may be expressed or implied by such forward-looking statements. These include, but are not limited to, risks or uncertainties associated with our the discovery and development of oil and natural gas reserves, cash flows and liquidity, business and financial strategy, budget, projections and operating results, oil and natural gas prices, amount, nature and timing of capital expenditures, including future development costs, availability and terms of capital, general economic and business conditions, environmental and other liability and other factors identified under Item 3.D. “Key Information—Risk Factors” of this annual report. Should one or more of these risks or uncertainties materialize, or should underlying assumptions prove incorrect, actual results may vary materially from those described in this annual report as anticipated, believed, estimated or expected. Accordingly, you should not place undue reliance on these forward-looking statements. These statements speak only as of the date of this annual report and will not be revised or updated to reflect events after the date of annual report.
IMPLICATIONS OF BEING AN EMERGING GROWTH COMPANY
As a company with less than $1.0 billion in revenue during our last fiscal year, we qualify as an “emerging growth company” as defined in the Jumpstart Our Business Startups Act of 2012 (the “JOBS Act”). An emerging growth company may avail itself of certain exemptions from various reporting requirements that are applicable to other public companies that are not emerging growth companies. For example, we have elected to rely on an exemption from the auditor attestation requirements of Section 404 of the Sarbanes Oxley Act of 2002 (the “Sarbanes Oxley Act”) relating to internal control over financial reporting, and we will not provide such an attestation from our auditors.
We will remain an emerging growth company until the earliest of the following:
· the end of the first fiscal year in which the market value of our ordinary shares that are held by non affiliates is at least $700 million as of the end of the second quarter of such fiscal year;
· the end of the first fiscal year in which we have total annual gross revenues of at least $1 billion; or
· the date on which we have issued more than $1 billion in non convertible debt securities in any rolling three year period.
Once we cease to be an emerging growth company, we will not be entitled to the exemptions provided for by the JOBS Act.
Item 1. Identity of Directors, Senior Management and Advisers
Not applicable.
Item 2. Offer Statistics and Expected Timetable
Not applicable.
A. Selected Financial Data
The consolidated financial statements and operational information provided throughout for the year ended December 31, 2014 includes amounts related to the Denver-Julesberg divestiture. See page F-2 of our Unaudited Pro Forma Condensed Consolidated Financial Statements included in this annual report for further information on the divestiture and the impact thereof.
The following tables set forth summary historical and pro forma financial data for the periods indicated.
Our financial statements have been prepared in U.S. dollars and in accordance with Australian Accounting Standards. Our financial statements comply with International Financial Reporting Standards (“IFRS”), as issued by the International Accounting Standards Board (“IASB”).
The summary unaudited pro forma statement of operations for the year ended December 31, 2014 is derived from the unaudited pro forma condensed consolidated financial statements included in this annual report and gives effect to our disposition of our remaining Denver-Julesburg assets on July 27, 2014 as if such transaction had occurred on January 1, 2014. As the Denver-Julesburg disposition has been reflected in our statement of financial position as of December 31, 2014, there is no impact to the summary pro forma unaudited balance sheet data as a result of that transaction. The disposition of our remaining Bakken assets in July 2014 were excluded from these unaudited pro forma financial statements due to the insignificance of the disposition. The summary unaudited pro forma financial information, while helpful in illustrating our financial characteristics using certain assumptions, does not reflect the impact of possible revenue enhancements, expense efficiencies and asset dispositions, among other factors that may result as a consequence of these pro forma transactions and, accordingly, does not attempt to predict or suggest future results. It also does not necessarily reflect what our historical results would have been had the pro forma transactions occurred during these periods.
You should read the selected consolidated financial data in conjunction with our consolidated financial statements and related notes beginning on page F-1 of this annual report and Item 5 “Operating and Financial Review and Prospects” included elsewhere in this annual report. Our historical results do not necessarily indicate our expected results for any future periods.
|
| Pro forma |
| Year ended December 31, |
| Six-month |
| Year ended |
| ||||||||||
(In $ ‘000s) |
| 2014 |
| 2014 |
| 2013 |
| 2012 |
| 2012 |
| 2011 |
| ||||||
|
| (unaudited) |
| (audited) |
| (audited) |
| (audited) |
| (audited) |
| (audited) |
| ||||||
Statement of Operations Data: |
|
|
|
|
|
|
|
|
|
|
|
|
| ||||||
Revenues: |
|
|
|
|
|
|
|
|
|
|
|
|
| ||||||
Oil revenue |
| $ | 135,580 |
| $ | 144,994 |
| $ | 79,365 |
| $ | 16,790 |
| $ | 27,965 |
| $ | 16,706 |
|
Natural gas revenue |
| 4,922 |
| 6,161 |
| 2,774 |
| 934 |
| 1,822 |
| 1,470 |
| ||||||
Natural gas liquids (NGL) (1) |
| 7,763 |
| 8,638 |
| 3,206 |
| — |
| — |
| — |
| ||||||
Total oil and natural gas revenues |
| 148,265 |
| 159,793 |
| 85,345 |
| 17,724 |
| 29,787 |
| 18,176 |
| ||||||
Lease operating and production tax expenses |
| 18,892 |
| 20,489 |
| 18,383 |
| 4,082 |
| 6,355 |
| 2,858 |
| ||||||
Depreciation and amortization expense |
| 84,201 |
| 85,584 |
| 36,225 |
| 6,116 |
| 11,111 |
| 6,509 |
| ||||||
General and administrative expense |
| 15,527 |
| 15,527 |
| 15,297 |
| 5,810 |
| 6,863 |
| 5,338 |
| ||||||
Finance costs, net of interest income |
| 494 |
| 494 |
| (351 | ) | 578 |
| (111 | ) | (312 | ) | ||||||
Impairment of non-current assets |
| 71,212 |
| 71,212 |
| — |
| — |
| 357 |
| 1,273 |
| ||||||
Exploration and evaluation expenditure |
| 10,934 |
| 10,934 |
| — |
| — |
| — |
| — |
| ||||||
Gain on sale of non-current assets |
| (925 | ) | (48,604 | ) | (7,335 | ) | (122,327 | ) | (3,004 | ) | (10,940 | ) | ||||||
(Gain) / loss on commodity hedging |
| (11,009 | ) | (11,009 | ) | 554 |
| 639 |
| (1,945 | ) | 1,107 |
| ||||||
Realized currency loss |
| — |
| — |
| — |
| — |
| 4 |
| 559 |
| ||||||
Other expense (income) |
| 686 |
| 686 |
| 1,063 |
| — |
| — |
| — |
| ||||||
Income tax (benefit) expense |
| (22,321 | ) | (841 | ) | 5,567 |
| 46,616 |
| 4,145 |
| 4,755 |
| ||||||
Profit (loss) attributable to owners of Sundance |
| $ | (19,426 | ) | $ | 15,321 |
| $ | 15,942 |
| $ | 76,210 |
| $ | 6,012 |
| $ | 7,029 |
|
Other comprehensive income (expense) |
|
|
|
|
|
|
|
|
|
|
|
|
| ||||||
Exchange differences arising on translation of foreign operations |
| 684 |
| 684 |
| (421 | ) | (154 | ) | (247 | ) | 384 |
| ||||||
Total comprehensive income (loss) attributable to owners of Sundance |
| $ | (18,742 | ) | $ | 16,005 |
| $ | 15,521 |
| $ | 76,056 |
| $ | 5,765 |
| $ | 7,413 |
|
Basic and diluted earnings per share |
| $ | (0.04 | ) | $ | 0.03 |
| $ | 0.04 |
| $ | 0.27 |
| $ | 0.02 |
| $ | 0.03 |
|
Basic weighted average number of ordinary shares outstanding |
| 531,391,405 |
| 531,391,405 |
| 413,872,184 |
| 277,244,883 |
| 277,049,463 |
| 260,935,572 |
| ||||||
Other Supplementary Data: |
|
|
|
|
|
|
|
|
|
|
|
|
| ||||||
Adjusted EBITDAX(2) |
| $ | 116,442 |
| $ | 126,373 |
| $ | 52,594 |
| $ | 9,223 |
| $ | 17,093 |
| $ | 9,993 |
|
(1) Prior to the year ended December 31, 2013, our NGL sales were insignificant as compared to our overall gas sales and as such, were included in our natural gas sales.
(2) Adjusted EBITDAX is a supplemental non-IFRS financial measure. For a definition of Adjusted EBITDAX and a reconciliation of Adjusted EBITDAX to our profit (loss) attributable to owners of Sundance, see “—Adjusted EBITDAX” below.
|
| December 31, |
| June 30, |
| |||||||||||
(In $ ‘000s) |
| 2014 |
| 2013 |
| 2012 |
| 2012 |
| 2011 |
| |||||
|
| (audited) |
| (audited) |
| (audited) |
| (audited) |
| (audited) |
| |||||
Balance Sheet Data: |
|
|
|
|
|
|
|
|
|
|
| |||||
Cash and cash equivalents |
| $ | 69,217 |
| $ | 96,871 |
| $ | 154,110 |
| $ | 15,328 |
| $ | 25,244 |
|
Assets held for sale |
| — |
| 11,484 |
| — |
| — |
| — |
| |||||
Total current assets |
| 114,045 |
| 141,141 |
| 175,424 |
| 30,691 |
| 31,173 |
| |||||
Oil and natural gas properties: |
|
|
|
|
|
|
|
|
|
|
| |||||
Development and production assets |
| 519,013 |
| 312,230 |
| 79,729 |
| 87,274 |
| 45,873 |
| |||||
Exploration and evaluation expenditure |
| 155,130 |
| 166,144 |
| 33,439 |
| 11,436 |
| 6,626 |
| |||||
Total assets |
| 796,520 |
| 625,060 |
| 291,435 |
| 130,316 |
| 84,080 |
| |||||
Current liabilities |
| 119,324 |
| 140,862 |
| 51,842 |
| 30,393 |
| 10,160 |
| |||||
Credit facilities, net of deferred financing fees |
| 128,805 |
| 29,141 |
| 29,570 |
| 14,655 |
| — |
| |||||
Restoration provision |
| 8,866 |
| 5,074 |
| 1,228 |
| 588 |
| 349 |
| |||||
Deferred tax liabilities |
| 102,668 |
| 102,711 |
| 56,979 |
| 10,476 |
| 6,104 |
| |||||
Total non-current liabilities |
| 242,190 |
| 136,957 |
| 87,777 |
| 25,719 |
| 6,453 |
| |||||
Total liabilities |
| 361,514 |
| 277,819 |
| 139,619 |
| 56,112 |
| 16,613 |
| |||||
Net assets |
| 435,006 |
| 347,241 |
| 151,816 |
| 74,204 |
| 67,467 |
| |||||
Issued capital |
| 306,853 |
| 237,008 |
| 58,694 |
| 57,978 |
| 57,831 |
| |||||
|
| Year ended |
| Six month |
| Year ended |
| |||||||||
(In $ ‘000s) |
| 2014 |
| 2013 |
| 2012 |
| 2012 |
| 2011 |
| |||||
|
| (audited) |
| (audited) |
| (audited) |
| (audited) |
| (audited) |
| |||||
Net Cash Flow Data: |
|
|
|
|
|
|
|
|
|
|
| |||||
Net cash provided by operating activities |
| $ | 128,087 |
| $ | 62,646 |
| $ | 9,386 |
| $ | 11,832 |
| $ | 8,908 |
|
Net cash (used in) provided by investing activities |
| (323,235 | ) | (164,355 | ) | 114,571 |
| (36,149 | ) | (13,465 | ) | |||||
Net cash provided by financing activities |
| 167,595 |
| 44,455 |
| 14,846 |
| 14,734 |
| 18,869 |
| |||||
Adjusted EBITDAX
Adjusted EBITDAX is a supplemental non-IFRS financial measure that is used by our management and external users of our consolidated financial statements, such as investors, industry analysts and lenders.
We define “Adjusted EBITDAX” as earnings before interest expense, income taxes, depreciation, depletion and amortization, property impairments, gain/(loss) on sale of non-current assets, exploration expense, share-based compensation and income and gains and losses on commodity hedging, net of settlements of commodity hedging.
Our management believes Adjusted EBITDAX is useful because it allows us to more effectively evaluate our operating performance and compare the results of our operations from period to period without regard to our financing methods or capital structure. We exclude the items listed above from profit attributable to owners of Sundance in arriving at Adjusted EBITDAX, because these amounts can vary substantially from company to company within our industry, depending upon accounting methods and book values of assets, capital structures and the method by which the assets were acquired. Adjusted EBITDAX should not be considered as an alternative to, or more meaningful than, net income or cash flows from operating activities as determined in accordance with IFRS, as issued by the IASB, or as an indicator of our operating performance or liquidity.
Certain items excluded from Adjusted EBITDAX are significant components in understanding and assessing a company’s financial performance, such as cost of capital and tax structure, as well as the historic costs of depreciable assets. Our computations of Adjusted EBITDAX may not be comparable to other similarly titled measures of other companies. We believe that Adjusted EBITDAX is a widely followed measure of operating performance and may also be used by investors to measure our ability to meet debt service requirements.
The following table presents a reconciliation of the profit (loss) attributable to owners of Sundance to Adjusted EBITDAX:
|
| Pro forma |
| Year ended December 31, |
| Six-month |
| Year ended |
| ||||||||||
(In $ ‘000s) |
| 2014 |
| 2014 |
| 2013 |
| 2012 |
| 2012 |
| 2011 |
| ||||||
|
| (unaudited) |
| (audited) |
| (audited) |
| (audited) |
| (audited) |
| (audited) |
| ||||||
IFRS Profit Reconciliation to Adjusted EBITDAX: |
|
|
|
|
|
|
|
|
|
|
|
|
| ||||||
Profit (loss) attributable to owners of Sundance |
| $ | (19,426 | ) | $ | 15,321 |
| $ | 15,942 |
| $ | 76,210 |
| $ | 6,012 |
| $ | 7,029 |
|
Income tax (benefit) expense |
| (22,321 | ) | (841 | ) | 5,567 |
| 46,616 |
| 4,145 |
| 4,755 |
| ||||||
Finance costs, net of (interest received) |
| 494 |
| 494 |
| (232 | ) | 578 |
| (111 | ) | (312 | ) | ||||||
(Gain) loss on commodity hedging |
| (10,792 | ) | (10,792 | ) | 554 |
| 639 |
| (1,945 | ) | 1,107 |
| ||||||
Settlement of commodity hedging |
| 1,150 |
| 1,150 |
| 283 |
| 551 |
| (297 | ) | (643 | ) | ||||||
Depreciation and amortization expense |
| 84,201 |
| 85,584 |
| 36,225 |
| 6,116 |
| 11,111 |
| 6,509 |
| ||||||
Impairment of non-current assets |
| 71,212 |
| 71,212 |
| — |
| — |
| 357 |
| 1,273 |
| ||||||
Exploration expense |
| 10,934 |
| 10,934 |
| — |
| — |
| — |
| — |
| ||||||
Stock compensation, value of services |
| 1,915 |
| 1,915 |
| 1,590 |
| 840 |
| 825 |
| 1,215 |
| ||||||
Gain on sale of non-current assets |
| (925 | ) | (48,604 | ) | (7,335 | ) | (122,327 | ) | (3,004 | ) | (10,940 | ) | ||||||
Adjusted EBITDAX |
| $ | 116,442 |
| $ | 126,373 |
| $ | 52,594 |
| $ | 9,223 |
| $ | 17,093 |
| $ | 9,993 |
|
B. Capitalization and Indebtedness
Not applicable.
C. Reasons for Offer and Use of Proceeds
Not applicable.
D. Risk Factors
Risks Related to the Oil and Natural Gas Industry and Our Business
Our future revenues are dependent on our ability to successfully replace our proved producing reserves.
Our business strategy is to generate profit through the acquisition, exploration, development and production of oil and natural gas reserves. Future success therefore depends on our ability to find, develop or acquire additional oil and natural gas reserves that are economically recoverable. Further to this, our proved reserves generally decline when produced, unless we conduct successful exploration or development activities or acquire properties containing proved reserves or both. We may not be able to find, develop or acquire additional reserves on an economically viable basis. Furthermore, if oil and natural gas prices increase, the cost of finding, developing or acquiring additional reserves could also increase.
Exploration and development activities involve numerous risks, including the risk that no commercially productive oil or natural gas reservoirs will be discovered. In addition, the future cost and timing of drilling, completing and operating wells is often uncertain. Furthermore, drilling operations may be curtailed, delayed or canceled as a result of a variety of factors, including:
· lack of prospective acreage available on acceptable terms;
· unexpected or adverse drilling conditions;
· elevated pressure or irregularities in geologic formations;
· equipment failures or accidents;
· adverse weather conditions;
· title problems;
· limited availability of financing upon acceptable terms;
· reductions in oil and natural gas prices;
· compliance with governmental requirements; and
· shortages or delays in the availability of drilling rigs, equipment and personnel.
Even if our drilling efforts are successful, our wells, once completed, may not produce reserves of oil or natural gas that are economically viable or that meet our prior estimates of economically recoverable reserves. Unsuccessful drilling activities could result in a significant decline in our production and revenues and materially harm our operations and financial position by reducing our available cash and liquidity. In addition, the potential for production decline rates for our wells could be greater than we expect. Because of the risks and uncertainties inherent to our businesses, our future drilling results may not be comparable to our historical results described elsewhere in this annual report.
Oil, natural gas and NGL prices are volatile. A substantial or extended decline in the price of these commodities may adversely affect our business, financial condition or results of operations and our ability to meet our capital expenditure obligations and financial commitments.
Our revenues, profitability, liquidity, ability to access capital and future growth prospects are highly dependent on the prices we receive for our oil, natural gas and NGLs. The prices of these commodities are subject to wide fluctuations in response to relatively minor changes in supply and demand. Historically, the markets for oil, natural gas and NGLs have been volatile, and this volatility may continue in the future. The prices we receive for our production and the levels of our production depend on numerous factors beyond our control. These factors include:
· general worldwide and regional economic and political conditions;
· the domestic and global supply of, and demand for, oil, natural gas and NGLs;
· the cost of exploring for, developing, producing and marketing oil, natural gas and NGLs;
· the proximity, capacity, cost and availability of oil, natural gas and NGL pipelines and other transportation facilities;
· the price and quantity of imports of foreign oil, natural gas and NGLs;
· the level of global oil, natural gas and NGL exploration and production;
· the level of global oil, natural gas and NGL inventories;
· weather conditions and natural disasters;
· domestic and foreign governmental laws, regulations and taxes;
· volatile trading patterns in commodities futures markets;
· price and availability of competitors’ supplies of oil, natural gas and NGLs;
· the actions of the Organization of Petroleum Exporting Countries (“OPEC”) and the ability of OPEC and other producing nations to agree to and maintain production levels;
· technological advances affecting energy consumption; and
· the price and availability of alternative fuels.
Further, oil, natural gas and NGL prices do not necessarily fluctuate in direct relationship to each other. Because approximately 66% of our estimated proved reserves as of December 31, 2014 was attributed to oil, our financial results are more sensitive to movements in oil prices. The price of oil has been extremely volatile, and we expect this volatility to continue for the foreseeable future. Substantially all of our oil production is sold to purchasers under short-term (less than 12 months) contracts at market-based prices.
Prolonged or substantial declines in oil, natural gas and NGL prices may have the following effects on our business:
· reducing our revenues, operating income and cash flows;
· adversely affecting our financial condition, liquidity, results of operations and our ability to meet our capital expenditure obligations and financial commitments;
· limiting our access to, or increasing the cost of, sources of capital, such as equity and long-term debt (including our borrowing capacity under our existing credit facilities);
· reducing the amount of oil, natural gas and NGLs that we can produce economically;
· reducing the amounts of our estimated proved oil, natural gas and NGLs reserves;
· reducing the standardized measure of discounted future net cash flows relating to oil, natural gas and NGL reserves;
· causing us to delay or postpone certain of our capital projects; and
· reducing the carrying value of our oil and natural gas properties.
As of December 31, 2014, we have commodity price hedging agreements on approximately 13% of our expected Boe production for 2015. To the extent we are unhedged, we have significant exposure to adverse changes in the prices of oil and natural gas that could materially and adversely affect our business and results of operations.
Our exploration, development and exploitation projects require substantial capital expenditures. We may be unable to obtain needed capital or financing on satisfactory terms, which could lead to a decline in our oil and natural gas reserves with resulting adverse effects on our cash flow and liquidity.
The oil and natural gas industry is capital intensive. We make and expect to continue to make substantial capital expenditures in our business for the development, exploitation, production and acquisition of oil and natural gas reserves. The actual amount and timing of our future capital expenditures may differ materially from our estimates as a result of, among other things, commodity prices, actual drilling results, the availability of drilling rigs and other services and equipment, and regulatory, technological and competitive developments. We intend to finance our future capital expenditures through a variety of sources, including through our cash flows from operations and borrowings under our credit facilities and asset sales. However, our financing needs may require us to alter or increase our capitalization substantially through the issuance of debt or equity securities or the sale of assets.
Our cash flows from operations and access to capital are subject to a number of variables, including:
· our proved reserves;
· the volume of oil and natural gas we are able to produce and sell from existing productive wells;
· the prices at which our oil and natural gas are sold;
· our ability to acquire, locate and produce new reserves; and
· the ability of our banks to provide us with credit or additional borrowing capacity.
If our revenues or the amounts we can borrow under our credit facilities decrease as a result of lower oil or natural gas prices, operating difficulties, declines in reserves or for any other reason, we may have limited ability to obtain the capital necessary to sustain our operations at current levels. If additional capital is needed, we may not be able to obtain debt or equity financing on favorable terms or at all. If cash generated by operations or cash available under our credit facilities is not sufficient to meet our capital requirements, the failure to obtain additional financing could result in a curtailment of our operations relating to development of our prospects, which in turn could lead to a decline in our oil and natural gas reserves and production levels, and could adversely affect our business, financial condition and results of operations.
Operating hazards, natural disasters or other interruptions of our operations could result in potential liabilities, which may not be fully covered by our insurance.
The oil and natural gas business involves operating hazards such as:
· well blowouts;
· mechanical failures;
· explosions;
· pipe or cement failures and casing collapses, which could release natural gas, oil, drilling fluids or hydraulic fracturing fluids;
· uncontrollable flows of oil, natural gas or well fluids;
· fires;
· geologic formations with abnormal pressures;
· handling and disposal of materials, including drilling fluids and hydraulic fracturing fluids;
· pipeline ruptures or spills;
· releases of toxic gases; and
· other environmental hazards and risks.
Any of these hazards and risks can result in the loss of hydrocarbons, environmental pollution, personal injury claims and other damage to our properties and the property of others.
We maintain insurance against losses and liabilities in accordance with customary industry practices and in amounts that our management believes to be prudent. However, insurance against all operational risks is not available to us. We do not carry business interruption insurance. We may elect not to carry insurance if our management believes that the cost of available insurance is excessive relative to the risks presented.
In addition, losses could occur for uninsured risks or in amounts in excess of existing insurance coverage. We cannot insure fully against pollution and environmental risks. We cannot assure investors that we will be able to maintain adequate insurance in the future at rates we consider reasonable or that any particular types of coverage will be available. The occurrence of an event not fully covered by insurance could have a material adverse effect on our financial position and results of operations.
Our planned exploratory drilling involves drilling in existing or emerging shale plays using the latest available horizontal drilling and completion techniques, which are subject to risks. As a result, drilling results may not meet our expectations for reserves or production.
Our operations involve utilizing the latest drilling and completion techniques as developed by us and our service providers in order to maximize cumulative recoveries and therefore generate the highest possible returns. Risks that we face while drilling include, but are not limited to:
· landing our well bore in the desired formation;
· staying in the desired formation while drilling horizontally through the formation;
· running our casing the entire length of the well bore; and
· being able to run tools and other equipment consistently through the well bore.
Risks that we face while completing our wells include, but are not limited to:
· being able to fracture stimulate the planned number of stages;
· being able to run tools the entire length of the well bore during completion operations; and
· successfully cleaning out the well bore after completion of the final fracture stimulation stage.
The results of our drilling in new or emerging formations, such as the Mississippian/Woodford, are more uncertain initially than drilling results in areas that are more developed and have a longer history of established production. Newer or emerging formations and areas have limited or no production history and, consequently, we are less able to predict future drilling results in these areas.
Ultimately, the success of these drilling and completion techniques can only be evaluated as more wells are drilled and production profiles are established over a sufficiently long time period. If our drilling results are less than anticipated or we are unable to execute our drilling program because of capital constraints, lease expirations, access to gathering systems and limited takeaway capacity or otherwise and/or oil and natural gas prices decline, the return on our investment in these areas may not be
as attractive as we anticipate. Further, as a result of any of these developments we could incur material write-downs of our oil and natural gas properties and the value of our undeveloped acreage could decline in the future.
Our identified drilling locations are scheduled to be developed over several years, making them susceptible to uncertainties that could materially alter the occurrence or timing of their drilling.
Our final determination of whether to drill any scheduled or budgeted wells will be dependent on a number of factors, including:
· the results of our exploration efforts;
· review and analysis of geologic and engineering data;
· the availability of sufficient capital resources to us and the other participants for drilling and completing of the prospects;
· the approval of the prospects by other participants once additional data has been compiled;
· economic and industry conditions at the time of drilling, including prevailing and anticipated prices for oil and natural gas and the availability and prices of drilling rigs and personnel; and
· the ability to maintain, extend or renew leases and permits on reasonable terms for the prospects.
Although we have identified or budgeted for numerous drilling prospects, we may not be able to lease or drill those prospects within our expected time frame or at all. Wells that are currently part of our capital plan may be based on results of drilling activities in other areas that we believe are geologically similar to a prospect rather than on analysis of seismic or other data in the prospect area, in which case actual drilling and results are likely to vary, possibly materially, from results in other areas. In addition, our drilling schedule may vary from our expectations because of future uncertainties. In addition, our ability to produce oil and natural gas may be significantly affected by the availability and prices of hydraulic fracturing equipment and personnel.
Certain of our undeveloped leasehold acreage is subject to leases expiring over the next several years unless production is established on units containing the acreage.
Certain of our undeveloped leasehold acreage is subject to leases that will expire unless production is established. For these properties, if production in commercial quantities has not been established on the leased property or units that include the leased property containing these leases, our leases will expire and we will lose our right to develop the related properties. As of December 31, 2014, 50,062 net acres of our total acreage position was not held by production. For the acreage underlying such properties, if production in paying quantities is not established on units containing these leases, approximately 18,760 net acres will expire in 2015, approximately 3,951 net acres will expire in 2016 and approximately 27,351 net acres will expire thereafter.
Our drilling plans for these areas are subject to change based upon various factors, many of which are beyond our control, including:
· drilling results;
· oil and natural gas prices;
· the availability and cost of capital;
· drilling and production costs;
· the availability of drilling services and equipment;
· gathering system and pipeline transportation constraints; and
· regulatory approvals.
As a non-operating leaseholder in certain of our properties, we have less control over the timing of drilling and there is a higher risk of lease expirations occurring where we are not the operator. For certain properties in which we are a non-operating leaseholder, we have the right to propose the drilling of wells pursuant to a joint operating agreement. Those properties that are not subject to a joint operating agreement are located in states where state law grants us the right to force pooling.
We have limited control over activities in properties we do not operate, which could reduce our production and revenues.
We utilize joint operating agreements in some of our properties where we have less than 100% working interest. Other companies may be operators under these joint operating agreements and, as a minority working interest owner, we will be dependent to a degree on the efficient and effective management of the operators. The objectives and strategy of those operators may not always be consistent with our objectives and strategy. As a result, we have limited ability to exercise influence over, and control the risks associated with, operations of these properties. The failure of an operator of our wells to adequately perform operations, an operator’s breach of the applicable agreements or an operator’s failure to act in ways that are in our best interests could reduce our production and revenues or could create liability for the operator’s failure to properly maintain the well and facilities and to adhere to applicable safety and environmental standards. With respect to properties that we do not operate:
· the operator could refuse to initiate exploration or development projects;
· if we proceed with any of those projects the operator has refused to initiate, we may not receive any funding from the operator with respect to that project;
· the operator may initiate exploration or development projects on a different schedule than we would prefer;
· the operator may propose greater capital expenditures than we wish, including expenditures to drill more wells or build more facilities on a project than we have funds available, which may cause us to not fully participate in those projects or participate in a substantial amount of the revenues from those projects; and
· the operator may not have sufficient expertise or financial resources to develop such projects.
Any of these events could significantly and adversely affect our anticipated exploration and development activities. Under our joint operating agreements, we will be required to pay our percentage interest share of all costs and liabilities incurred by the operator on behalf of the working interest owners in connection with joint venture activities. In common with other working interest owners, if we fail to pay our share of any costs and liabilities, we may be deemed to have elected non-participation with respect to operations affected and we may be subject to loss of interest through foreclosure of operator liens invoked by participating working interest owners which may subject us to non-consent penalties.
We operated 88.5% of our total production for the year ended December 31, 2014.
Our estimated proved reserves are based on many assumptions that may turn out to be inaccurate and any significant inaccuracies in these reserve estimates or underlying assumptions could materially affect the quantities and present value of our reserves.
There are uncertainties inherent in estimating oil and natural gas reserves and their estimated value, including many factors beyond our control. The reserve data in this annual report represent only estimates. Reservoir engineering is a subjective and inexact process of estimating underground accumulations of oil and natural gas that cannot be measured in an exact manner and is based on assumptions that may vary considerably from actual results. Reservoir engineering also requires economic assumptions about matters such as oil and natural gas prices, drilling and operating expenses, capital expenditures, taxes and availability of funds. Accordingly, actual production, oil and natural gas prices, revenue, taxes, operating expenses, expenditures and quantities of recoverable oil and natural gas reserves will likely vary, possibly materially, from estimates. Any significant variance in our estimates or the accuracy of our assumptions could materially affect the estimated quantities and present value of reserves shown in this annual report. As of December 31, 2014, approximately 62% of our total proved reserves were proved undeveloped.
SEC rules could limit our ability to book additional PUDs in the future.
SEC rules require that, subject to limited exceptions, our PUDs may only be booked if they relate to wells scheduled to be drilled within five years after the date of booking. This requirement limits our ability to book additional PUDs as we pursue our drilling program. Moreover, we may be required to write-down our PUDs if we do not drill those wells within the required five-year time frame.
The present value of future net revenues from our proved reserves will not necessarily be the same as the current market value of our estimated oil and natural gas reserves.
The discounted future net cash flows in this annual report are not necessarily the same as the current market value of our estimated oil and natural gas reserves. As required by the current requirements for oil and natural gas reserve estimation and disclosures, the estimated discounted future net cash flows from proved reserves are based on the average of the sales price on the first day of each month in the applicable year, with costs determined as of the date of the estimate. Actual future net cash flows also will be affected by various factors, including:
· the actual prices we receive for oil and natural gas;
· our actual operating costs in producing oil and natural gas;
· the amount and timing of actual production;
· supply and demand for oil and natural gas;
· increases or decreases in consumption of oil and natural gas; and
· changes in governmental regulations or taxation.
In addition, the 10% discount factor we use when calculating discounted future net cash flows for reporting requirements may not be the most appropriate discount factor based on interest rates in effect from time to time and risks associated with us or the oil and gas industry in general.
Our derivative activities could result in financial losses or could reduce our income.
Because oil and natural gas prices are subject to volatility, we may periodically enter into price-risk-management transactions such as fixed-rate swaps, costless collars, puts, calls and basis differential swaps to reduce our exposure to price declines associated with a portion of our oil and natural gas production and thereby achieve a more predictable cash flow. The use of these arrangements limits our ability to benefit from increases in the prices of oil and natural gas. Our derivative arrangements may apply to only a portion of our production, thereby providing only partial protection against declines in oil and natural gas prices.
These arrangements may expose us to the risk of financial loss in certain circumstances, including instances in which production is less than expected, our customers fail to purchase contracted quantities of oil and natural gas or a sudden, unexpected event that materially impacts oil or natural gas prices. In addition, the counterparties under our derivatives contracts may fail to fulfill their contractual obligations to us.
If oil and natural gas prices continue to be depressed or decline further, we may be required to write-down the carrying values of our oil and natural gas properties.
We review our proved oil and natural gas properties for impairment whenever events and circumstances indicate that a decline in the recoverability of their carrying value may have occurred. Based on specific market factors and circumstances at the time of prospective impairment reviews and the continuing evaluation of development plans, production data, economics and other factors, we may be required to write-down the carrying value of our oil and natural gas properties. A write-down constitutes a non-cash charge to earnings. We may incur impairment charges in the future, which could have a material adverse effect on our ability to borrow under our credit facilities and which could adversely impact our results of operations for the periods in which such charges are taken.
Our inability to market our oil and natural gas could adversely affect our business.
Market conditions or the unavailability of satisfactory oil and natural gas transportation arrangements may hinder our access to oil and natural gas markets or delay production. The availability of a ready market for our oil and natural gas production depends on a number of factors, including the demand for and supply of oil and natural gas and the proximity of reserves to pipelines and gathering facilities. Our ability to market our production depends in substantial part on the availability and capacity of gathering systems, pipelines and processing facilities owned and operated by third parties. Our failure to obtain such services on favorable terms could adversely impact our business and results of operations.
Our productive properties may be located in areas with limited or no access to pipelines, thereby requiring compression facilities or delivery by other means, such as trucking and train. Such restrictions on our ability to sell our oil or natural gas may have several adverse effects, including higher transportation costs, fewer potential purchasers (thereby potentially resulting in a lower selling price) or, in the event we are unable to market and sustain production from a particular lease for an extended period of time, possibly resulting in the loss of a lease due to the lack of commercially established production.
We generally deliver our oil and natural gas production through gathering systems and pipelines that we do not own under interruptible or short-term transportation agreements. Under the interruptible transportation agreements, the transportation of our oil and natural gas production may be interrupted due to capacity constraints on the applicable system, for maintenance or repair of the system or for other reasons as dictated by the particular agreements. Due to the lack of available pipeline capacity in certain regions in which we operate, we have entered into firm transportation agreements for a portion of our production in order to secure guaranteed capacity on major pipelines. We may also enter into firm transportation arrangements for additional production in the future. Because we are obligated to pay fees on minimum volumes to our service providers under these agreements regardless of actual volume throughput, these firm transportation agreements may be significantly more costly than interruptible or short-term transportation agreements, which could adversely affect our business and results of operations.
A portion of our oil and natural gas production in any region may be interrupted, or shut in, from time to time for numerous reasons, including as a result of weather conditions, accidents, loss of pipeline or gathering system access, or field personnel issues or strikes. We may also voluntarily curtail production in response to market conditions. If a substantial amount of our production is interrupted or curtailed, it could adversely affect our business and results of operations.
Borrowings under our Revolving Facility are limited by our borrowing base, which is subject to periodic redetermination.
We are parties to a credit agreement with Morgan Stanley Energy Capital Inc. as administrative agent (the “Credit Agreement”), providing for a $300 million senior secured revolving credit facility (the “Revolving Facility”) and term loans of $125 million, with an accordion feature for up to $50 million in additional term loans subject to certain conditions (the “Term Loans”). Our Revolving Facility had a borrowing base of $75 million as of May 14, 2015.
The borrowing base under our Revolving Facility is redetermined at least semi-annually. Redeterminations are based upon a number of factors, including commodity prices and reserve levels. In addition, our lenders have substantial flexibility to reduce our borrowing base due to subjective factors. Upon a redetermination, we could be required to repay a portion of the debt owed under our Revolving Facility to the extent our outstanding borrowings at such time exceeds the redetermined borrowing base. We may not have sufficient funds to make such repayments, which could result in a default under the terms of our Revolving Facility and an acceleration of the loans outstanding under our Credit Agreement. Failure to timely pay these debt obligations when due could cause us to lose our assets through mortgage foreclosure, which would materially and adversely affect our business, results of operations and financial condition.
Our credit facilities have substantial restrictions and financial covenants that restrict our business and financing activities.
The operating and financial restrictions and covenants in our credit facilities restrict our ability to finance future operations or capital needs and to engage, expand or pursue our business activities. Our ability to comply with these restrictions and covenants in the future is uncertain and will be affected by our results of operations and financial condition and events or circumstances beyond our control. If we violate any of the restrictions, covenants, ratios or tests in our credit agreements, our indebtedness may become immediately due and payable, the interest rates under our credit agreements may increase and the lenders’ commitment, if any, to make further loans to us may terminate. In the event that some or all of the amounts outstanding under our credit facilities are accelerated and become immediately due and payable, we may not have the funds to repay, or the ability to refinance, such outstanding amounts under our credit facilities, and our lenders could foreclose upon critical assets, which could materially and adversely affect our business, results of operations and financial condition. For a description of our credit facilities, please see Item 5.B. “Operating and Financial Review and Prospects—Liquidity and Capital Resources—Credit Facilities.”
Our level of indebtedness may increase, reducing our financial flexibility.
We intend to fund our capital expenditures through a combination of cash flow from operations, borrowings under our credit facilities and, if necessary, debt or equity financings. Our ability to make the necessary capital investment to maintain or expand our asset base and develop oil and natural gas reserves will be impaired if cash flow from operations is reduced and external sources of capital become limited or unavailable. If we incur additional debt for these or other purposes, the related risks that we now face could intensify. Our level of debt could adversely affect our business and results of operations in several important ways, including the following:
· a portion of our cash flow from operations would be used to pay interest on borrowings;
· the covenants contained in our credit facilities limit our ability to borrow additional funds, pay dividends, dispose of assets or issue shares of preferred stock and otherwise may affect our flexibility in planning for, and reacting to, changes in general business and economic conditions;
· a high level of debt may impair our ability to obtain additional financing in the future for working capital, capital expenditures, acquisitions, general corporate or other purposes;
· a leveraged financial position would make us more vulnerable to economic downturns and decreases in commodity prices and could limit our ability to withstand competitive pressures; and
· a debt that we incur under our credit facilities will be at variable rates, which could make us vulnerable to an increase in interest rates.
Increased costs of capital could adversely affect our business.
Our business and operating results can be adversely affected by factors such as the availability, terms and cost of capital and increases in interest rates. Changes in any one or more of these factors could cause our cost of doing business to increase, limit our access to capital, limit our ability to pursue acquisition opportunities, reduce our cash flows available for drilling and place us at a competitive disadvantage. Disruptions in the global financial markets may lead to an increase in interest rates or a contraction in credit availability, which would impact our ability to finance our operations. We will require continued access to capital for the foreseeable future. A significant reduction in the availability of credit could materially and adversely affect our business, results of operations and financial condition.
Competition in the oil and natural gas industry is intense and many of our competitors have resources that are greater than ours.
The oil and natural gas industry is highly competitive. Public integrated and independent oil and gas companies, private equity backed and private operators are all active bidders for desirable oil and natural gas properties as well as the equipment and personnel required to operate those properties. Many of these companies have substantially greater financial resources, staff and facilities than we do. There is a risk that increased industry competition will adversely impact our ability to purchase assets or secure services at prices that will allow us to generate sufficient returns on investment in the future.
The loss of any of our key personnel could adversely affect our business, financial condition, the results of operations and future growth.
We are reliant on a number of key members of our executive management team. Loss of such personnel may have an adverse effect on our performance. We currently have an employment agreement with our chief executive officer and managing director, however we have not entered into agreements with any of the other members of our executive management team. Certain areas in which we operate are highly competitive regions and competition for qualified personnel is intense. We may be unable to hire suitable field personnel for our technical team or there may be periods of time where a particular position remains vacant while a suitable replacement is identified and appointed. Our ability to manage our growth will require us to continue to train, motivate and manage our employees and to attract, motivate and retain additional qualified personnel. We may not be successful in attracting and retaining the personnel required to grow and operate our business profitably.
Our ability to manage growth will have an impact on our business, financial condition and results of operations.
Our growth historically has been achieved through the acquisition of leaseholds and the expansion of our drilling programs. Future growth may place strains on our financial, technical, operational and administrative resources and cause us to rely more on project partners and independent contractors, potentially adversely affecting our financial position and results of operations. Our ability to grow will depend on a number of factors, including:
· our ability to obtain leases or options on properties;
· our ability to identify and acquire new exploratory prospects;
· our ability to develop existing prospects;
· our ability to continue to retain and attract skilled personnel;
· our ability to maintain or enter into new relationships with project partners and independent contractors;
· the results of our drilling programs;
· commodity prices; and
· our access to capital.
We may not be successful in upgrading our technical, operational and administrative resources or increasing our internal resources sufficiently to provide certain of the services currently provided by third parties, and we may not be able to maintain or enter into new relationships with project partners and independent contractors on financially attractive terms, if at all. Our inability to achieve or manage growth may materially and adversely affect our business, results of operations and financial condition.
We may incur losses as a result of title deficiencies.
We may lose title to, or interests in, our leases and other properties if the conditions to which those interests are subject are not satisfied or if insufficient funds are available to meet the commitments.
The existence of title differences with respect to our oil and natural gas properties could reduce their value or render such properties worthless, which would have a material adverse effect on our business and financial results. We do not obtain title insurance and have not necessarily obtained drilling title opinions on all of our oil and natural gas properties. As is customary in the industry in which we operate, we generally rely upon the judgment of oil and natural gas lease brokers or independent landmen who perform the field work in examining records in the appropriate governmental offices and abstract facilities before attempting to acquire or place under lease a specific mineral interest and before drilling a well on a leased tract, and we generally make title investigations and receive title opinions of local counsel before we commence drilling operations. In some cases, we perform curative work to correct deficiencies in the marketability or adequacy of the title assigned to us. In cases involving more serious title problems, the amount paid for affected oil and natural gas leases can be lost, and the target area can become undrillable. While we undertake to cure all title deficiencies prior to drilling, the failure of title may not be discovered until after a well is drilled, in which case we may lose the lease, our investment in the well and the right to produce
all or a portion of the minerals under the property. A significant portion of our acreage is undeveloped leasehold, which has a greater risk of title defects than developed acreage.
Our operations are subject to health, safety and environmental laws and regulations that may expose us to significant costs and liabilities.
The conduct of exploration for, and production of, hydrocarbons may expose our staff to potentially dangerous working environments. Occupational health and safety legislation and regulations differ in each jurisdiction. If any of our employees suffer injury or death, compensation payments or fines may have to be paid, and such circumstances could result in the loss of a license or permit required to carry on the business, or other legislative sanction, all of which have the potential to materially and adversely affect our business, results of operations and financial condition.
There is an inherent risk of incurring significant environmental costs and liabilities in the performance of our operations, some of which may be material, due to our handling of petroleum hydrocarbons and wastes, our emissions to air and water, the underground injection or other disposal of our wastes and historical industry operations and waste disposal practices. Under certain environmental laws and regulations, we may be liable, regardless of whether we were at fault, for the full cost of removing or remediating contamination, even when multiple parties contributed to the release and the contaminants were released in compliance with all applicable laws. In addition, accidental spills or releases on our properties may expose us to significant liabilities that could have a material adverse effect on our financial condition and results of operations. Aside from government agencies, the owners of properties where our wells are located, the operators of facilities where our petroleum hydrocarbons or wastes are taken for reclamation or disposal and other private parties may be able to sue us to enforce compliance with environmental laws and regulations, as well as collect penalties for violations or obtain damages for any related personal injury or property damage. Some sites we operate are located near current or former third-party oil and natural gas operations or facilities, and there is a risk that contamination has migrated from those sites to ours. Changes in environmental laws and regulations occur frequently, and any changes that result in more stringent or costly material handling, emission, waste management or cleanup requirements could require us to make significant expenditures to attain and maintain compliance or may otherwise materially and adversely affect our business, results of operations and financial condition. We may not be able to recover some or any of these costs from insurance. Federal and state regulators are increasingly targeting greenhouse gas emissions from oil and gas operations. While these regulatory efforts are evolving, they may require the installation of emission controls or mandate other action that may result in increased costs of operation, delay, uncertainty or exposure to liability.
In addition, our operations and financial performance may be adversely affected by governmental action, including delay, inaction, policy change or the introduction of new, or amendment of or changes in interpretation of existing legislation or regulations, particularly in relation to foreign ownership, access to infrastructure, environmental regulation (including in respect of carbon emissions and management), royalties and production and exploration licensing.
Hydraulic fracturing, which is the process used for releasing hydrocarbons from shale rock, has recently come under increased scrutiny and could be the subject of further regulation that could impact the timing and cost of development.
Hydraulic fracturing is an important and commonly used process in the completion of unconventional oil and natural gas wells. Hydraulic fracturing involves the injection of water, sand and chemicals under pressure into deep rock formations to stimulate oil or natural gas production. Currently, hydraulic fracturing is primarily regulated in the United States at the state level, which generally focuses on regulation of well design, pressure testing and other operating practices. However, some states and local jurisdictions across the United States, including states in which we operate, have begun adopting more restrictive regulations, including measures such as:
· required disclosure of chemicals used during the hydraulic fracturing process;
· restrictions on wastewater disposal activities;
· required baseline and post-drilling sampling of water supplies in close proximity to hydraulic fracturing operations;
· new municipal or state land use regulations, such as changes in setback requirements, which may restrict drilling locations or related activities;
· financial assurance requirements, such as the posting of bonds, to secure site restoration obligations; and
· local moratoria or even bans on oil and natural gas development utilizing hydraulic fracturing in some communities.
At the U.S. federal level, hydraulic fracturing that does not involve the use of diesel fuels is exempt from regulation under the Safe Drinking Water Act (“SDWA”). However, the United States Congress (“Congress”) has considered and likely will continue to consider eliminating this regulatory exemption, which could subject hydraulic fracturing activities to regulation and permitting by the Environmental Protection Agency (“EPA”) under the SDWA. Congressional action will be informed by a study commenced in 2011 by the EPA on the impacts of hydraulic fracturing on drinking water resources, with final results anticipated in 2016. Despite the existing exemption, the EPA has begun utilizing other legal authorities in various ways to regulate portions of the hydraulic fracturing process, exemplified by its issuance of regulations under the Clean Air Act limiting emission of pollutants during the hydraulic fracturing process, as well as its recent initiation of a proposed rulemaking under the Toxic Substances Control Act to obtain data on chemical substances and mixtures used in hydraulic fracturing. In addition, the United States Department of the Interior has proposed comprehensive regulations governing the use of hydraulic fracturing on federally managed lands.
These efforts by Congress, federal regulators, states and local governments could result in additional costs, delay and operational uncertainty that could limit, preclude or add costs to use of hydraulic fracturing in our drilling operations.
Our ability to produce oil and natural gas economically and in commercial quantities could be impaired if we are unable to acquire adequate supplies of water for our drilling operations or are unable to dispose of or recycle the water we use economically and in an environmentally safe manner.
Drilling activities require the use of water. For example, the hydraulic fracturing process that we employ to produce commercial quantities of oil and natural gas from many reservoirs, including the Eagle Ford, requires the use and disposal of significant quantities of water. In certain areas, there may be insufficient local aquifer capacity to provide a source of water for drilling activities. Water must be obtained from other sources and transported to the drilling site. The effects of climate change may further exacerbate water scarcity in certain regions.
Our inability to secure sufficient amounts of water, or to dispose of or recycle the water used in our operations, could adversely impact our operations in certain areas. Moreover, the imposition of new environmental initiatives and regulations could include restrictions on our ability to conduct certain operations such as hydraulic fracturing or disposal of waste, including, but not limited to, produced water, drilling fluids and other materials associated with the exploration, development or production of oil and natural gas. In particular, regulatory focus on disposal of produced water and drilling waste through underground injection has increased because of alleged links between such injection and regional seismic impacts in disposal areas.
Compliance with environmental regulations and permit requirements governing the withdrawal, storage and use of surface water or groundwater necessary for hydraulic fracturing of wells may increase our operating costs and cause delays, interruptions or termination of our operations, the extent of which cannot be predicted, all of which could materially and adversely affect our business, results of operations and financial condition.
Climate change laws and regulations restricting emissions of “greenhouse gases” could result in increased operating costs and reduced demand for the oil and natural gas that we produce while the physical effects of climate change could disrupt our production and cause us to incur significant costs in preparing for or responding to those effects.
On December 15, 2009, the EPA published its findings that emissions of carbon dioxide, methane and other “greenhouse gases” present an endangerment to human health and the environment because emissions of such gases are, according to the EPA, contributing to the warming of the Earth’s atmosphere and other climatic changes. These findings by the EPA have allowed the agency to proceed with the adoption and implementation of regulations restricting emissions of greenhouse gases under existing provisions of the federal Clean Air Act. Among other things, EPA regulations now require specified large greenhouse gas emitters in the United States, including companies in the energy industry, to annually report those emissions. New major sources or significant modifications of existing sources of traditional air pollutants are required to obtain permits and to use best available control technology to control those emissions pursuant to the Clean Air Act as a prerequisite to the development of that emissions source. In addition, sources subject to best available control technology for traditional air pollutants are now also required to use best available control technology to control significant greenhouse gas emissions. While these regulations have not to date materially affected us, such regulations may over time require us to incur costs to reduce emissions of greenhouse gases associated with our operations or could adversely affect demand for the oil and natural gas we produce.
In addition, as discussed in more detail below, the EPA published its proposed New Source Performance Standard (“NSPS”) rule regulating carbon dioxide from new, modified and existing fossil fuel-fired power plants. The EPA is expected to finalize the standards in late summer 2015. While these rules will more negatively impact coal-fired power plants, natural gas-fired power plants may also face liability under the rules and increased costs of operation.
On January 14, 2015, the Obama Administration announced plans to reduce methane emissions from the oil and gas industry, including throughout the natural gas supply chain. The methane developments could affect us indirectly by affecting our customer base or by directly regulating our operations. In either case, these new developments could result in increased costs of operation and exposure to liability.
In addition, Congress has considered legislation to restrict or regulate emissions of greenhouse gases, such as carbon dioxide and methane, that are understood to contribute to global warming. While comprehensive climate legislation will likely not be passed by either house of Congress in the near future, energy legislation and other initiatives continue to be proposed that may be relevant to greenhouse gas emissions issues. In addition, almost half of the states, either individually or through multi-state regional initiatives, have begun to address greenhouse gas emissions, primarily through the planned development of emission inventories or regional greenhouse gas cap and trade programs. Although most of the state-level initiatives have to date been focused on large sources of greenhouse gas emissions such as electric power plants, smaller sources could become subject to greenhouse gas-related regulation. Depending on the particular program, we could be required to control emissions or to purchase and surrender allowances for greenhouse gas emissions resulting from our operations. Any future federal laws or implementing regulations that may be adopted to address greenhouse gas emissions could require us to incur increased operating costs and could adversely affect demand for the oil and natural gas we produce.
Finally, some scientists have concluded that increasing concentrations of greenhouse gases in the Earth’s atmosphere may produce climate changes that have significant physical effects, such as increased frequency and severity of storms, floods, droughts and other climatic events. If any such effects were to occur, they could have an adverse effect on our exploration and production operations. Significant physical effects of climate change could also have an indirect effect on our financing and operations by disrupting the transportation or process-related services provided by midstream companies, service companies or suppliers with whom we have a business relationship. We may not be able to recover through insurance some or any of the damages, losses, or costs that may result from potential physical effects of climate change.
Certain federal income tax deductions currently available with respect to oil and natural gas exploration and development may be eliminated as a result of future legislation.
We are also subject to changing and extensive tax laws, the effects of which cannot be predicted. Certain legislation introduced in Congress, if enacted into law, would make significant changes to U.S. tax laws, including, but not limited to, the elimination of certain key federal income tax incentives currently available to oil and natural gas exploration and production companies. These or any other similar changes in federal tax laws could defer or eliminate certain tax deductions that are currently available with respect to oil and natural gas exploration and development, and any such change could materially and adversely affect our business, results of operations and financial condition.
General economic conditions could adversely affect our business and future growth.
Instability in the global financial markets may have a material impact on our liquidity and financial condition, and we may ultimately face major challenges if conditions in the financial markets were to materially change or worsen. Our ability to access the capital markets or to borrow money may be restricted or may be more expensive at a time when we would need to raise capital, which could have an adverse effect on our flexibility to react to changing economic and business conditions and on our ability to fund our operations and capital expenditures in the future. Such economic conditions could have an impact on our customers, causing them to fail to meet their obligations to us. In addition, it could have an impact on the liquidity of our operating partners, resulting in delays in operations or their failure to make required payments.
Also, market conditions could have an impact on our oil and natural gas derivative instruments if our counterparties are unable to perform their obligations or seek bankruptcy protection, which could lead to reductions in the demand for oil and natural gas, or reductions in the prices of oil and natural gas or both, which could have an adverse impact on our financial position, results of operations and cash flows. While the ultimate outcome and impact of changing economic conditions cannot be predicted, they may materially and adversely affect our business, results of operations and financial condition.
Changes in the differential between benchmark prices of oil and natural gas and the reference or regional index price used to price our actual oil and natural gas sales could have a material adverse effect on our results of operations and financial condition.
The reference or regional index prices that we will use to price our oil and natural gas sales sometimes will reflect a discount to the relevant benchmark prices. The difference between the benchmark price and the price we reference in our sales contracts is called a differential. We cannot accurately predict oil and natural gas differentials. Changes in differentials between the benchmark price for oil and natural gas and the reference or regional index price we reference in our sales contracts could materially and adversely affect our business, results of operations and financial condition.
Recent federal legislation could have an adverse impact on our ability to use derivative instruments to reduce the effects of commodity prices, interest rates and other risks associated with our business.
Historically, we have entered into a number of commodity derivative contracts in order to hedge a portion of our oil and natural gas production. On July 21, 2010, President Obama signed into law the Dodd-Frank Wall Street Reform and Consumer Protection Act (“Dodd-Frank Act”), which requires the SEC and the Commodity Futures Trading Commission (“CFTC”) to promulgate rules and regulations implementing the new legislation. The CFTC issued regulations setting position limits for certain futures and option contracts in the major energy markets and for swaps that are their economic equivalents. Certain bona fide hedging transactions are exempt from these limits. The position limits regulation was vacated by the United States District Court for the District of Columbia in September 2012. The CFTC has appealed the District Court’s decision and its Chairman has stated that the agency is working on developing a new proposed rulemaking to address position limits. The CFTC has finalized other regulations, including critical rulemakings on the “swap” and “swap dealer” definitions, swap dealer registration, swap data reporting and mandatory clearing, among others. The Dodd-Frank Act and CFTC rules also will require us in connection with certain derivatives activities to comply with clearing and trade-execution requirements (or take steps to qualify for an exemption to such requirements). In addition, new regulations may require us to comply with margin requirements although these regulations are not finalized and their application to us is uncertain at this time. The legislation may also require the counterparties to our derivative contracts to spin off some of their derivatives activities to a separate entity, which may not be as creditworthy as the current counterparty.
The new legislation and any new regulations could:
· significantly increase the cost of some derivative contracts (including through requirements to post collateral that could adversely affect our available liquidity);
· materially alter the terms of some derivative contracts;
· reduce the availability of some derivatives to protect against risks we encounter;
· reduce our ability to monetize or restructure our existing derivative contracts; and
· potentially increase our exposure to less creditworthy counterparties.
If we reduce our use of derivatives as a result of the new legislation and regulations, our results of operations may become more volatile and our cash flows may be less predictable, which could adversely affect our ability to plan for and fund capital expenditures. Increased volatility may make us less attractive to certain types of investors. Finally, the Dodd-Frank Act was intended, in part, to reduce the volatility of oil and natural gas prices, which some legislators attributed to speculative trading in derivatives and commodity instruments related to oil and natural gas. If the new legislation and regulations result in lower commodity prices, our revenues could be adversely affected. Any of these consequences could adversely affect our financial condition and results of operations.
We may be subject to risks in connection with acquisitions, and the integration of significant acquisitions may be difficult.
In accordance with our business strategies, we periodically evaluate acquisitions of reserves, properties, prospects and leaseholds and other strategic transactions that appear to fit within our overall business strategy. The successful acquisition of producing properties requires an assessment of several factors, including:
· recoverable reserves;
· future oil and natural gas prices and their appropriate differentials;
· development and operating costs; and
· potential environmental and other liabilities.
The accuracy of these assessments is inherently uncertain. In connection with these assessments, we perform a review of the subject properties that we believe to be generally consistent with industry practices. Our review will not reveal all existing or potential problems nor will it permit us to become sufficiently familiar with the properties to fully assess their deficiencies and potential recoverable reserves. Inspections may not always be performed on every well, and environmental problems are not necessarily observable even when an inspection is undertaken. Even when problems are identified, the seller may be unwilling or unable to provide effective contractual protection against all or part of the problems. We often are not entitled to contractual indemnification for environmental liabilities and acquire properties on an “as is” basis.
Significant acquisitions and other strategic transactions may involve other risks, including:
· diversion of our management’s attention to evaluating, negotiating and integrating significant acquisitions and strategic transactions;
· the challenge and cost of integrating acquired operations, information management and other technology systems and business cultures with those of our operations while carrying on our ongoing business;
· difficulty associated with coordinating geographically separate organizations; and
· the challenge of attracting and retaining personnel associated with acquired operations.
The process of integrating operations could cause an interruption of, or loss of momentum in, the activities of our business. Our senior management may be required to devote considerable amounts of time to this integration process, which will decrease the time they will have to manage our business. If our senior management is not able to effectively manage the integration process, or if any significant business activities are interrupted as a result of the integration process, our business could suffer.
In addition, even if we successfully integrate an acquisition, it may not be possible to realize the full benefits we may expect, including with respect to estimated proved reserves, production volume or cost savings from operating synergies, within our expected time frame. Anticipated benefits of an acquisition may also be offset by operating losses relating to changes in commodity prices in oil and natural gas industry conditions, risks and uncertainties relating to the exploratory prospects of the combined assets or operations, or an increase in operating or other costs or other difficulties. Failure to realize the benefits we anticipate from an acquisition may materially and adversely affect our business, results of operations and financial condition.
Risks Related to our Shares
The market price and trading volume of our shares may be volatile and may be affected by economic conditions beyond our control.
Our shares are listed on the ASX under the symbol “SEA.” The market price of our shares on the ASX may be highly volatile and subject to wide fluctuations. In addition, the trading volume of our shares may fluctuate and cause significant price variations to occur. If the market price of our shares declines significantly, you may be unable to resell your shares at or above the purchase price, if at all. We cannot assure you that the market price of our shares will not fluctuate or significantly decline in the future.
Some specific factors that could negatively affect the price of our shares or result in fluctuations in their price and trading volume include:
· actual or expected fluctuations in our operating results;
· actual or expected changes in our growth rates or our competitors’ growth rates;
· changes in commodity prices for hydrocarbons we produce;
· changes in market valuations of similar companies;
· changes in our key personnel;
· potential acquisitions and divestitures;
· changes in financial estimates or recommendations by securities analysts;
· changes or proposed changes in laws and regulations affecting the oil and natural gas industry;
· sales of ordinary shares by us, our executive officers or our shareholders in the future;
· conditions in the oil and natural gas industry in general; and
· conditions in the financial markets or changes in general economic conditions.
There is no established public market for our securities in the United States and we cannot assure you that our ordinary shares will be listed on any securities exchange or that an active trading market will ever develop for any of our securities in the United States.
There is currently no established public market in the United States for our ordinary shares. While our ordinary shares are listed for quotation on the OTC Pink marketplace operated by the OTC Markets Group, trading is limited, sporadic and volatile. There is no assurance that an active trading market in our ordinary shares will develop in the United States, or if such a market develops, that it will be sustained. As a result, an investor may find it more difficult to dispose of, or to obtain accurate quotations as to the market value of, our ordinary shares in the United States.
As a foreign private issuer, we are permitted to file less information with the SEC than a company that is not a foreign private issuer or that files as a domestic issuer.
As a foreign private issuer, we are exempt from certain rules under the Securities Exchange Act of 1934, as amended (the “Exchange Act”), that impose disclosure requirements as well as procedural requirements for proxy solicitations under Section 14 of the Exchange Act. In addition, our officers, directors and principal shareholders are exempt from the reporting and “short-swing” profit recovery provisions of Section 16 of the Exchange Act. Moreover, we are not required to file periodic reports and financial statements with the SEC as frequently or as promptly as a company that files as a domestic issuer whose securities are registered under the Exchange Act, nor are we generally required to comply with the SEC’s Regulation FD, which restricts the selective disclosure of material non-public information.
If we fail to establish and maintain proper internal controls, our ability to produce accurate financial statements or comply with applicable regulations could be impaired.
Section 404(a) of the Sarbanes-Oxley Act requires that, beginning with our annual report for the year ending December 31, 2016, our management assess and report annually on the effectiveness of our internal controls over financial reporting and identify any material weaknesses in our internal controls over financial reporting. Although Section 404(b) of the Sarbanes-Oxley Act requires our independent registered public accounting firm to issue an annual report that addresses the effectiveness of our internal controls over financial reporting, we have opted to rely on the exemptions provided in the JOBS Act, and consequently will not be required to comply with SEC rules that implement Section 404(b) of the Sarbanes-Oxley Act until such time as we are no longer an emerging growth company.
Our first Section 404(a) assessment will take place beginning with our annual report for the year ending December 31, 2016. The presence of material weaknesses could result in financial statement errors which, in turn, could lead to errors in our financial reports and/or delays in our financial reporting, which could require us to restate our operating results or our auditors may be required to issue a qualified audit report. We might not identify one or more material weaknesses in our internal controls in connection with evaluating our compliance with Section 404(a) of the Sarbanes-Oxley Act. In order to maintain and improve the effectiveness of our disclosure controls and procedures and internal controls over financial reporting, we will need to expend significant resources and provide significant management oversight. Implementing any appropriate changes to our internal controls may require specific compliance training of our directors and employees, entail substantial costs in order to
modify our existing accounting systems, take a significant period of time to complete and divert management’s attention from other business concerns. These changes may not, however, be effective in maintaining the adequacy of our internal control.
If either we are unable to conclude that we have effective internal controls over financial reporting or, at the appropriate time, our independent auditors are unwilling or unable to provide us with an unqualified report on the effectiveness of our internal controls over financial reporting as required by Section 404(b) of the Sarbanes-Oxley Act, investors may lose confidence in our operating results, the price of our shares could decline and we may be subject to litigation or regulatory enforcement actions.
We could be classified as a “passive foreign investment company,” which could result in adverse U.S. federal income tax consequences to U.S. holders of our shares.
Based on our business results for the last fiscal year and composition of our assets, we do not believe that we were a passive foreign investment company (“PFIC”) for U.S. federal income tax purposes for the taxable year ended December 31, 2014. Similarly, based on our business projections and the anticipated composition of our assets for the current and future years, we do not expect that we will be a PFIC for the taxable year ending December 31, 2015. However, a separate determination is required after the close of each taxable year as to whether we are a PFIC. If our actual business results do not match our projections, it is possible that we may become a PFIC in the current or any future taxable year. A non-U.S. corporation will be considered a PFIC for a taxable year if either (i) at least 75% of its gross income is passive income or (ii) at least 50% of the value of its assets (based on an average of the quarterly values of the assets during the fiscal year) is attributable to assets that produce or are held for the production of passive income. Because the determination of our PFIC status is based on an annual determination that cannot be made until the close of a taxable year, and involves extensive factual investigation, including ascertaining the fair market value of all of our assets on a quarterly basis and the character of each item of income we earn, our U.S. counsel expresses no opinion with respect to our PFIC status. If we are a PFIC for any taxable year during which a U.S. holder (as defined in Item 10.E. “Additional Information—Taxation—U.S. Federal Income Tax Considerations”) holds an ordinary share, certain adverse U.S. federal income tax consequences could apply to such U.S. holder. See Item 10.E. “Additional Information—Taxation—U.S. Federal Income Tax Considerations—Passive Foreign Investment Company.”
We have never declared or paid dividends on our ordinary shares and we do not anticipate paying dividends in the foreseeable future.
We have never declared or paid cash dividends on our ordinary shares. For the foreseeable future, we currently intend to retain all available funds and any future earnings to support our operations and to finance the growth and development of our business. Any future determination to declare cash dividends will be made at the discretion of our board of directors, subject to compliance with applicable laws and covenants under current or future credit facilities, which may restrict or limit our ability to pay dividends, and will depend on our financial condition, operating results, capital requirements, general business conditions and other factors that our board of directors may deem relevant. We do not anticipate paying any cash dividends on our ordinary shares in the foreseeable future. As a result, a return on your investment will only occur if our ordinary share price appreciates.
Australian takeover laws may discourage takeover offers being made for us or may discourage the acquisition of a significant position in our ordinary shares.
We are incorporated in Australia and are subject to the takeover laws of Australia. Among other things, we are subject to the Corporations Act 2001 (“Corporations Act”). Subject to a range of exceptions, the Corporations Act prohibits the acquisition of a direct or indirect interest in our issued voting shares if the acquisition of that interest will lead to a person’s voting power in us increasing to more than 20%, or increasing from a starting point that is above 20%, though below 90%. Australian takeover laws may discourage takeover offers being made for us or may discourage the acquisition of a significant position in our ordinary shares. This may have the ancillary effect of entrenching our board of directors and may deprive or limit our shareholders’ opportunity to sell their ordinary shares and may further restrict the ability of our shareholders to obtain a premium from such transactions.
Our Constitution and Australian laws and regulations applicable to us may adversely affect our ability to take actions that could be beneficial to our shareholders.
As an Australian company, we are subject to different corporate requirements than a corporation organized under the laws of the United States. Our Constitution, as well as the Australian Corporations Act, set forth various rights and obligations that are unique to us as an Australian company. These requirements may operate differently than those of many U.S. companies.
Item 4. Information on Sundance
A. History and Development
Sundance Energy Australia Limited, a public onshore oil and natural gas company, was incorporated under the laws of Australia in December 2004. In April 2005, we completed an initial public offering of our ordinary shares and listing of these shares on the ASX.
Our principal office is located at 633 17th Street, Suite 1950, Denver, Colorado 80202. Our telephone number is (303) 543-5700. Our website address is www.sundanceenergy.net. Information on our website and the websites linked to it do not constitute part of this annual report. Our agent for service of process in the United States is Sundance Energy, Inc., which has its principal place of business at 633 17th Street, Suite 1950, Denver, Colorado 80202.
We are an onshore oil and natural gas company focused on the exploration, development and production of large, repeatable resource plays, primarily in south Texas targeting the Eagle Ford basin (“Eagle Ford”) and north central Oklahoma targeting the Mississippian and Woodford formations (“Mississippian/Woodford”).
Acquisitions
In January 2015, we acquired three leases totaling approximately 14,180 net acres in the Eagle Ford for approximately $13.4 million.
In July 2014, we acquired the working interests in approximately 9,200 gross (5,700 net) and 18,000 gross (5,400 net) mineral acres in Dimmit and Maverick Counties, Texas, respectively. The purchase price included an initial cash payment of $36 million and a commitment to drill four Eagle Ford wells. In addition, we have the option, at our sole discretion, to acquire the seller’s remaining working interests in Dimmit and Maverick Counties, Texas (including the seller’s interest in producing wells) for an additional $45 million (comprised of the seller’s choice of all cash or cash and ordinary shares, with certain restrictions).
In April 2014, we acquired approximately 4,800 net acres in the Eagle Ford for an initial purchase price of approximately $10.5 million and two separate earn out payments due upon commencement of drilling ($7.7 million) and payout of the first six wells drilled on the acreage ($7.7 million). The term of the agreement is two years and provides a one-year extension for $500 per acre extended. This acreage is adjacent to our current acreage in McMullen County, Texas.
In March 2013, we completed our merger with Texon Petroleum Ltd. (“Texon”) through which we acquired our initial assets in the Eagle Ford, consisting of approximately 7,735 gross (7,336 net) acres at the time of acquisition. Shortly after the acquisition, we changed the name of Texon to Armadillo Petroleum Limited, and we similarly renamed Texon’s subsidiaries. The purchase price for the Texon acquisition was approximately $158.4 million, which involved the issuance of approximately 122,669,678 of our ordinary shares to Texon’s shareholders.
Divestitures
In July 2014, we divested our remaining assets located in the Denver-Julesburg basin. The sale price of approximately $108.8 million in cash included the reimbursement of capital expenditures incurred on 8 gross (3.1 net) non-operated horizontal wells.
In July 2014, we divested our remaining assets located in the northwest North Dakota targeting the Bakken and Three-Forks formations (“Bakken”). The sale price of $14 million included $10 million in cash and relief from a net liability owed to the buyer of $4 million.
In November 2013, we sold our entire interest in an individual operated well and 622 net developed acres, located in the Phoenix prospect of the Bakken, for gross proceeds of approximately $4.3 million. In December 2013, we sold our interests in properties also located in the Phoenix prospect for $35.5 million. The assets sold included 77 gross (3.7 net) non-operated producing wells in McKenzie, Dunn and Mountrail Counties, North Dakota.
B. Business Overview
We are an onshore oil and natural gas company focused on the exploration, development and production of large, repeatable resource plays in North America. Our oil and natural gas properties are located in premier U.S. oil and natural gas basins, and through the year ended December 31, 2014 our operational activities were conducted in the Eagle Ford and Mississippian/Woodford.
We intend to utilize our U.S.-based management and technical team to appraise, develop, produce and grow our portfolio of assets. Our strategy is to develop assets where we are the operator and have high working interests, which positions us to control the pace of our development and the allocation of our capital resources. As of December 31, 2014, we operated approximately 83% of our developed acreage with an average working interest of approximately 81% with respect to such operated developed acreage.
Our Operations
Estimated Proved Reserves
The following table presents summary information regarding our estimated net proved oil and natural gas reserves as of the dates indicated. The estimates of our net proved reserves as of December 31, 2014 and 2013 are based on the reserve reports prepared by Netherland Sewell in accordance with the rules and regulations of the SEC regarding oil and natural gas reserve reporting. For more information about our proved reserves as of December 31, 2014 and 2013, please see Netherland Sewell’s reserve reports, which have been filed, or incorporated by reference, as exhibits to this annual report.
|
| As of December 31, |
| ||||
|
| 2014 |
| 2013 |
| ||
Estimated proved reserves: |
|
|
|
|
| ||
Oil (MBbls) |
| 17,026 |
| 12,956 |
| ||
Natural gas (MMcf) |
| 28,733 |
| 30,655 |
| ||
NGL (MBbls) |
| 4,166 |
| 2,683 |
| ||
Total estimated proved reserves (MBoe)(1) |
| 25,981 |
| 20,747 |
| ||
Estimated proved developed reserves: |
|
|
|
|
| ||
Oil (MBbls) |
| 6,124 |
| 4,140 |
| ||
Natural gas (MMcf) |
| 12,364 |
| 10,765 |
| ||
NGL (MBbls) |
| 1,801 |
| 1,087 |
| ||
Total estimated proved developed reserves (MBoe)(1) |
| 9,985 |
| 7,021 |
| ||
Estimated proved undeveloped reserves: |
|
|
|
|
| ||
Oil (MBbls) |
| 10,903 |
| 8,815 |
| ||
Natural gas (MMcf) |
| 16,369 |
| 19,890 |
| ||
NGL (MBbls) |
| 2,365 |
| 1,596 |
| ||
Total estimated proved undeveloped reserves (MBoe)(1)(2) |
| 15,996 |
| 13,726 |
| ||
PV-10 (in thousands)(3) |
| $ | 531,735 |
| $ | 336,984 |
|
Standardized Measure (in thousands) |
| $ | 435,506 |
| $ | 268,163 |
|
(1) Certain totals may not add due to rounding.
(2) Reserves disclosed here are not the same reserves that are used to calculate depletion, depreciation and amortization. See Note 37 — Unaudited Supplemental Oil and Gas Disclosures within the Notes to the Consolidated Financial Statements for additional information.
(3) PV-10 is considered a non-IFRS financial measure under SEC regulations. For a reconciliation of PV-10 to the Standardized Measure, see the following section.
PV-10
Certain of our oil and natural gas reserve disclosures included in this annual report are presented on a PV-10 basis. PV-10 is the estimated present value of the future cash flows less future development and production costs from our proved reserves before income taxes discounted using a 10% discount rate. PV-10 is considered a non-IFRS financial measure under SEC regulations because it does not include the effects of future income taxes, as is required in computing the standardized measure of discounted future net cash flows (the “Standardized Measure”). We believe that PV-10 is an important measure that can be used to evaluate the relative significance of our oil and natural gas properties and that PV-10 is widely used by securities analysts and investors when evaluating oil and gas companies. Because many factors that are unique to each individual company impact the amount of future income taxes to be paid, we believe that the use of a pre-tax measure provides greater comparability of assets when evaluating companies, and that most other companies in the oil and gas industry calculate PV-10
on the same basis. Investors should be cautioned that neither PV-10 nor Standardized Measure represents an estimate of the fair market value of our proved reserves.
The following table provides a reconciliation of PV-10 to the Standardized Measure (in thousands):
|
| As of December 31, |
| ||||
|
| 2014 |
| 2013 |
| ||
PV-10 of proved reserves |
| $ | 531,735 |
| $ | 336,984 |
|
Present value of future income tax discounted at 10% |
| (96,229 | ) | (68,821 | ) | ||
Standardized Measure |
| $ | 435,506 |
| $ | 268,163 |
|
Proved Undeveloped Reserves
At December 31, 2014, our proved undeveloped reserves were approximately 15,996 MBoe, an increase of approximately 2,270 MBoe over our December 31, 2013 proved undeveloped reserves estimate of approximately 13,726 MBoe. The change primarily consisted of a decrease of approximately 4,088 MBoe due to the conversion of proved undeveloped reserves to proved developed reserves during 2014, a decrease of approximately 3,996 MBoe due to the sale of our interests in the Denver-Julesburg assets and Bakken prospects and an increase of approximately 10,904 MBoe due to the addition of proved undeveloped locations offset by downward revisions to previous estimates of 550 MBoe. The addition of proved undeveloped locations was attributable to Eagle Ford and Mississippian/Woodford, which were 7,335 MBoe and 3,569 MBoe respectively. The revisions to previous estimates were primarily attributable to the Mississippian/Woodford, which was a decrease of 942 Mboe, offset by an increase to Eagle Ford of 392 MBoe. During the year ended December 31, 2014, we incurred capital expenditures of approximately $103.3 million to convert proved undeveloped reserves to proved developed reserves. The majority of capital expenditures for our development and production assets for the period were related to unproved undeveloped reserves or resources. All proved undeveloped locations are scheduled to be spud within the next five years.
Independent Reserve Engineers
Our proved reserves estimates as of December 31, 2014 and 2013, have been independently prepared by Netherland Sewell, which was founded in 1961 and performs consulting petroleum engineering services under Texas Board of Professional Engineers Registration No. F-2699. Within Netherland Sewell, the technical person primarily responsible for the estimates set forth in the reserves reports included or incorporated herein is Mr. Neil H. Little. Mr. Little is a Licensed Professional Engineer in the State of Texas (No. 117966) with over 12 years of practical experience in petroleum engineering studies and over 5 years of practical experience in evaluation of reserves. Mr. Little has been practicing consulting petroleum engineering at NSAI since 2011. He graduated from Rice University in 2002 with a Bachelor of Science Degree in Chemical Engineering. Mr. Little meets or exceeds the education, training and experience requirements set forth in the Standards Pertaining to the Estimating and Auditing of Oil and Gas Reserves Information promulgated by the Society of Petroleum Engineers. We believe that he is proficient in judiciously applying industry standard practices to engineering and geoscience evaluations as well as applying SEC and other industry reserves definitions and guidelines.
Internal Controls Over Reserves Estimation Process
Our technical team consists of an internal staff of petroleum engineers and geoscience professionals who work closely with our independent reserve engineers to ensure the integrity, accuracy and timeliness of data furnished to our independent reserve engineers in their reserves estimation process. Throughout each fiscal year, our technical team meets with representatives of our independent reserve engineers to review properties and discuss methods and assumptions used in preparation of the proved reserves estimates. During July 2014, the Reserves Committee was established to assist the Board of directors with monitoring i) the integrity of our oil, natural gas, and natural gas liquids reserves, ii) the independence, qualifications and performance of our independent reservoir engineers, and iii) our compliance with legal and regulatory requirements. Prior to release of the reserve report prepared by our independent reserve engineers, the draft of the report is reviewed by the Reserves Committee, our internal petroleum engineers and by management.
Within our technical team, the person primarily responsible for overseeing the preparation of the reserve estimates is Mr. David Ramsden-Wood, Vice President of Reservoir Engineering and Business Development. Mr. Ramsden-Wood is a Licensed Professional Engineer in Alberta, Canada (No. 71507) with over 15 years of practical experience focused on reservoir engineering. He graduated from the University of Calgary with a Bachelor of Science degree in Engineering (Chemical) and Cornell University and Queen’s University with a Masters of Business Administration degree.
Acreage
We had the following developed, undeveloped and total acres for each of our operating areas as of December 31, 2014:
|
| Developed |
| Undeveloped |
| Total |
| ||||||
|
| Gross |
| Net |
| Gross |
| Net |
| Gross |
| Net |
|
Eagle Ford (1) |
| 6,727 |
| 5,659 |
| 31,968 |
| 20,501 |
| 38,695 |
| 26,160 |
|
Mississippian/Woodford |
| 17,965 |
| 11,374 |
| 55,452 |
| 29,563 |
| 73,417 |
| 40,937 |
|
All properties |
| 24,692 |
| 17,033 |
| 87,420 |
| 50,064 |
| 112,112 |
| 67,097 |
|
(1) Includes 5,418 net acres located in the Georgetown formation.
Production and Pricing
|
| Year ended |
| Six-month |
| Year ended |
| ||||||
|
| 2014(1) |
| 2013 |
| 2012 |
| 2012 |
| ||||
Net Sales Volumes: |
|
|
|
|
|
|
|
|
| ||||
Oil (MBbls) |
| 1,675.1 |
| 827.4 |
| 195.5 |
| 337.7 |
| ||||
Natural gas (MMcf) |
| 1,803.0 |
| 934.2 |
| 260.4 |
| 370.3 |
| ||||
NGL (MBbls)(2) |
| 268.0 |
| 95.8 |
| — |
| — |
| ||||
Oil equivalent (MBoe) |
| 2,244.0 |
| 1,079.0 |
| 238.9 |
| 399.4 |
| ||||
Average daily volumes (Boe/d) |
| 6,147 |
| 2,956 |
| 1,298 |
| 1,091 |
| ||||
Average Sales Price, before derivative settlements: |
|
|
|
|
|
|
|
|
| ||||
Oil (per Bbl) |
| $ | 86.56 |
| $ | 95.92 |
| $ | 85.88 |
| $ | 82.82 |
|
Natural gas (per Mcf) |
| 3.42 |
| 2.97 |
| 3.59 |
| 4.92 |
| ||||
NGL (per MBbls)(2) |
| 32.24 |
| 33.45 |
| — |
| — |
| ||||
Average equivalent price (per Boe) |
| 71.22 |
| 79.10 |
| 74.19 |
| 74.59 |
| ||||
Expenses (per Boe): |
|
|
|
|
|
|
|
|
| ||||
Lease operating expenses |
| $ | 6.03 |
| $ | 11.23 |
| $ | 9.19 |
| $ | 7.76 |
|
Production tax expense |
| 3.10 |
| 5.80 |
| 7.90 |
| 8.15 |
| ||||
Lease operating and production tax expenses |
| 9.13 |
| 17.03 |
| 17.09 |
| 15.91 |
| ||||
General and administrative expense, including employee benefits |
| 6.92 |
| 14.18 |
| 24.32 |
| 17.18 |
| ||||
Depreciation and amortization expense |
| 38.15 |
| 33.57 |
| 25.60 |
| 27.82 |
| ||||
(1) Production volumes for the year ended December 31, 2014 include 104.4 MBbls of oil, 247.7 MMcf of natural gas, and 20.2 MBbls of NGL production, for a total of 165.9 MBoe (average daily volumes of 454 Boe/d), from the Denver-Julesburg. We sold our entire interest in Denver-Julesburg in July 2014.
(2) Prior to the year ended December 31, 2013, our NGL sales were insignificant as compared to our overall gas sales and as such, were included in our natural gas sales.
The following tables set forth information regarding our total production and average daily production for the periods indicated from our operating areas:
|
| Year ended |
| Year ended |
| ||||||||||||||||
|
| December 31, 2014 |
| December 31, 2013 |
| ||||||||||||||||
|
| Oil |
| Natural |
| NGL |
| Oil |
| Average |
| Oil |
| Natural |
| NGL |
| Oil |
| Average |
|
|
| (MBbls) |
| (MMcf) |
| (MBbls) |
| (MBoe) |
| (Boe/d) |
| (MBbls) |
| (MMcf) |
| (MBbls) |
| (MBoe) |
| (Boe/d) |
|
Eagle Ford |
| 1,280 |
| 866 |
| 104 |
| 1,528 |
| 4,187 |
| 409 |
| 320 |
| 38 |
| 500 |
| 1,371 |
|
Mississippian/Woodford |
| 268 |
| 678 |
| 142 |
| 523 |
| 1,434 |
| 108 |
| 247 |
| 35 |
| 184 |
| 503 |
|
Denver-Julesburg(1) |
| 104 |
| 248 |
| 20 |
| 166 |
| 454 |
| 121 |
| 296 |
| 14 |
| 185 |
| 506 |
|
Bakken(2) |
| 23 |
| 11 |
| 2 |
| 27 |
| 72 |
| 189 |
| 71 |
| 9 |
| 210 |
| 576 |
|
Total |
| 1,675 |
| 1,803 |
| 268 |
| 2,244 |
| 6,147 |
| 827 |
| 934 |
| 96 |
| 1,079 |
| 2,956 |
|
|
| Six-month period ended |
| Year ended |
| ||||||||||||
|
| December 31, 2012 |
| June 30, 2012 |
| ||||||||||||
|
| Oil |
| Natural |
| Oil |
| Average |
| Oil |
| Natural |
| Oil |
| Average |
|
|
| (MBbls) |
| (MMcf) |
| (MBoe) |
| (Boe/d) |
| (MBbls) |
| (MMcf) |
| (MBoe) |
| (Boe/d) |
|
Eagle Ford |
| — |
| — |
| — |
| — |
| — |
| — |
| — |
| — |
|
Mississippian/Woodford |
| 10 |
| 28 |
| 15 |
| 82 |
| 4 |
| — |
| 4 |
| 10 |
|
Denver-Julesburg |
| 29 |
| 137 |
| 52 |
| 281 |
| 33 |
| 202 |
| 66 |
| 181 |
|
Bakken |
| 156 |
| 95 |
| 172 |
| 935 |
| 301 |
| 168 |
| 329 |
| 900 |
|
Total |
| 195 |
| 260 |
| 239 |
| 1,298 |
| 338 |
| 370 |
| 399 |
| 1,091 |
|
(1) In July 2014, we divested our remaining Denver-Julesburg assets. See Item 4.A. “Information on Sundance - History and Development—Divestitures.”
(2) In July 2014, we divested our remaining Bakken assets. See Item 4.A. “Information on Sundance - History and Development—Divestitures.”
Producing Wells
We had the following producing wells for each of our operating areas as of December 31, 2014:
|
| Oil Wells |
| Natural Gas |
| Total Wells |
| ||||||
|
| Gross |
| Net |
| Gross |
| Net |
| Gross |
| Net |
|
Eagle Ford |
| 77 |
| 53.8 |
| — |
| — |
| 77 |
| 53.8 |
|
Mississippian/Woodford |
| 66 |
| 28.5 |
| — |
| — |
| 66 |
| 28.5 |
|
Total |
| 143 |
| 82.3 |
|
|
|
|
| 143 |
| 82.3 |
|
Drilling Activity
The following table summarizes our drilling activity for the fiscal years ended December 31, 2014 and 2013, the six-month period ended December 31, 2012 and the fiscal year ended June 30, 2012.
|
| Year ended |
| Six-month |
| Year ended |
| ||||||||||
|
| December 31, |
| December 31, |
| December 31, |
| June 30, |
| ||||||||
|
| Gross |
| Net |
| Gross |
| Net |
| Gross |
| Net |
| Gross |
| Net |
|
Development wells |
|
|
|
|
|
|
|
|
|
|
|
|
|
|
|
|
|
Oil |
| 113 |
| 64.8 |
| 102 |
| 58.6 |
| 37 |
| 12.3 |
| 77 |
| 11.3 |
|
Natural Gas |
| — |
| — |
| — |
| — |
| — |
| — |
| — |
| — |
|
Dry |
| 2 |
| 2.0 |
| — |
| — |
| — |
| — |
|
|
|
|
|
Exploratory Wells |
|
|
|
|
|
|
|
|
|
|
|
|
|
|
|
|
|
Oil |
| — |
| — |
| — |
| — |
| — |
| — |
| — |
| — |
|
Natural Gas |
| — |
| — |
| — |
| — |
| — |
| — |
| — |
| — |
|
Dry |
| 3 |
| 3.0 |
| — |
| — |
| — |
| — |
| — |
| — |
|
Total Wells |
|
|
|
|
|
|
|
|
|
|
|
|
|
|
|
|
|
Oil |
| 113 |
| 64.8 |
| 102 |
| 58.6 |
| 37 |
| 12.3 |
| 77 |
| 11.3 |
|
Natural Gas |
| — |
| — |
| — |
| — |
| — |
| — |
| — |
| — |
|
Dry |
| 5 |
| 5.0 |
| — |
| — |
| — |
| — |
| — |
| — |
|
|
| 118 |
| 69.8 |
| 102 |
| 58.6 |
| 37 |
| 12.3 |
| 77 |
| 11.3 |
|
Present Activities
The following table describes wells being drilled or awaiting completion or production testing as of December 31, 2014.
|
| Development |
| Exploratory |
| Total Wells |
| ||||||
|
| Gross |
| Net |
| Gross |
| Net |
| Gross |
| Net |
|
Eagle Ford |
| 19 |
| 10.6 |
| — |
| — |
| 19 |
| 10.6 |
|
Mississippian/Woodford |
| 5 |
| 3.1 |
| — |
| — |
| 5 |
| 3.1 |
|
Total |
| 24 |
| 13.7 |
| — |
| — |
| 24 |
| 13.7 |
|
Principal Customers and Marketing
For the year ended December 31, 2014, purchases by one of our customers accounted for 65% of our total sales revenues. These customers purchase the oil production from us pursuant to existing marketing agreements with terms that are currently on “evergreen” status and renew on a month-to-month basis until either party gives 30-day advance written notice of non-renewal. The oil and natural gas that we sell are commodities for which there are a large number of potential buyers. Because of the adequacy of the infrastructure to transport oil and natural gas in the areas in which we operate, if we were to lose one or more customers, we believe that we could readily procure substitute or additional customers such that our production volumes would not be materially affected for any significant period of time.
The prices we receive for our oil and natural gas production fluctuate widely. Factors that cause price fluctuations include the level of demand for oil and natural gas, the price and quantity of imports of foreign oil and natural gas, the level of global oil and natural gas exploration and production, global oil and gas inventories, weather conditions and natural disasters, governmental regulations, oil and natural gas speculation, actions of OPEC, technological advances and the price and availability of alternative fuels. Decreases in these commodity prices adversely affect the carrying value of our proved reserves and our revenues, profitability and cash flows. Short-term disruptions of our oil and natural gas production occur from time to time due to downstream pipeline system failure, capacity issues and scheduled maintenance, as well as maintenance and repairs involving our own well operations. These situations, if they occur, curtail our production capabilities and ability to maintain a steady source of revenue. In addition, demand for natural gas has historically been seasonal in nature, with peak demand and typically higher prices during the colder winter months. See Item 3.D. “Key Information—Risk Factors.”
Competition
The oil and natural gas industry is highly competitive, and we compete with a substantial number of other companies that have greater resources. Many of these companies explore for, produce and market oil and natural gas, carry on refining operations and market the resultant products on a worldwide basis. The primary areas in which we encounter substantial competition are in locating and acquiring desirable leasehold acreage for our drilling and development operations, locating and acquiring attractive producing oil and natural gas properties and obtaining drilling rigs, completion crews and other services. There is also competition between producers of oil and natural gas and other industries producing alternative energy and fuel. Furthermore, competitive conditions may be substantially affected by various forms of energy legislation and/or regulation considered from time to time by the government of the United States. However, it is not possible to predict the nature of any such legislation or regulation that may ultimately be adopted or its effects upon our future operations. Such laws and regulations may substantially increase the costs of exploring for, developing or producing gas and oil and may prevent or delay the commencement or continuation of a given operation. The effect of these risks cannot be accurately predicted.
Regulation of the Oil and Natural Gas Industry
Our operations are substantially affected by federal, state and local laws and regulations. In particular, oil and natural gas production and related operations are, or have been, subject to price controls, taxes and numerous other laws and regulations. All of the jurisdictions in which we own or operate properties for oil and natural gas production have statutory provisions regulating the exploration for and production of oil and natural gas, including provisions related to permits for the drilling of wells, bonding requirements to drill or operate wells, the location of wells, the method of drilling and casing wells, the surface use and restoration of properties upon which wells are drilled, sourcing and disposal of water used in the drilling and completion process, and the abandonment of wells. Our operations are also subject to various conservation laws and regulations. These include regulation of the size of drilling and spacing units or proration units, the number of wells that may be drilled in an area, and the unitization or pooling of oil and natural gas wells, as well as regulations that generally prohibit the venting or flaring of natural gas and that impose certain requirements regarding the ratability or fair apportionment of production from fields and individual wells.
The regulatory burden on the industry increases the cost of doing business and affects profitability. Failure to comply with applicable laws and regulations can result in substantial penalties. Furthermore, such laws and regulations are frequently amended or reinterpreted, and new proposals that affect the oil and natural gas industry are regularly considered by Congress, the states, the Federal Energy Regulatory Commission (“FERC”) and the courts. We believe that we are in substantial compliance with all applicable laws and regulations and that our continued substantial compliance with existing requirements will not have a material adverse effect on our financial position, cash flows or results of operations. Nor are we currently aware of any specific pending legislation or regulation that is reasonably likely to be enacted, or for which we cannot predict the likelihood of enactment, and that is reasonably likely to have a material effect on our financial position, cash flows or results of operations.
Regulation of Transportation of Oil
Our sales of oil are affected by the availability, terms and cost of transportation. Interstate transportation of oil by pipeline is regulated by FERC pursuant to the Interstate Commerce Act of 1887 (“ICA”), the Energy Policy Act of 1992 (“EPAct 1992”), and the rules and regulations promulgated under those laws. The ICA and its implementing regulations require that tariff rates for interstate service on oil pipelines, including interstate pipelines that transport oil and refined products (collectively referred to as “petroleum pipelines”), be just and reasonable and non-discriminatory and that such rates and terms and conditions of service be filed with FERC. EPAct 1992 deemed certain interstate petroleum pipeline rates then in effect to be just and reasonable under the ICA, which are commonly referred to as “grandfathered rates.” Pursuant to EPAct 1992, FERC also adopted a generally applicable rate-making methodology, which, as currently in effect, allows petroleum pipelines to change their rates provided they do not exceed prescribed ceiling levels that are tied to changes in the Producer Price Index for Finished Goods (“PPI”), plus 1.3%. For the five-year period beginning July 1, 2011, the index will be PPI plus 2.65%.
FERC has also established cost-of-service rate-making, market-based rates and settlement rates as alternatives to the indexing approach. A pipeline may file rates based on its cost of service if there is a substantial divergence between its actual costs of providing service and the rate resulting from application of the index. A pipeline may charge market-based rates if it establishes that it lacks significant market power in the affected markets. Further, a pipeline may establish rates through settlement with all current non-affiliated shippers.
Intrastate oil pipeline transportation rates are subject to regulation by state regulatory commissions. The basis for intrastate oil pipeline regulation and the degree of regulatory oversight and scrutiny given to intrastate oil pipeline rates vary from state to state. Insofar as effective interstate and intrastate rates are equally applicable to all comparable shippers, we believe that the regulation of oil transportation rates will not affect our operations in any way that is of material difference from those of our competitors that are similarly situated.
Further, interstate and intrastate common carrier oil pipelines must provide service on a non-discriminatory basis. Under this open access standard, common carriers must offer service to all similarly situated shippers requesting service on the same terms and under the same rates. When oil pipelines operate at full capacity, access is governed by prorationing provisions set forth in the pipelines’ published tariffs. Accordingly, we believe that access to oil pipeline transportation services generally will be available to us to the same extent as to our similarly situated competitors.
Regulation of Transportation and Sales of Natural Gas
Historically, the transportation and sale for resale of natural gas in interstate commerce has been regulated by FERC under the Natural Gas Act of 1938 (“NGA”), the Natural Gas Policy Act of 1978 (“NGPA”) and regulations issued under those statutes. In the past, the federal government has regulated the prices at which natural gas could be sold. While sales by producers of natural gas can currently be made at market prices, Congress could reenact price controls in the future. Deregulation of wellhead natural gas sales began with the enactment of the NGPA and culminated in the adoption of the Natural Gas Wellhead Decontrol Act, which removed all price controls affecting wellhead sales of natural gas effective January 1, 1993.
FERC regulates interstate natural gas, transportation rates and terms and conditions of service, which affect the marketing of natural gas that we produce as well as the revenues we receive for sales of our natural gas. Since 1985, FERC has endeavored to make natural gas transportation more accessible to natural gas buyers and sellers on an open and non-discriminatory basis. FERC has stated that open access policies are necessary to improve the competitive structure of the interstate natural gas pipeline industry and to create a regulatory framework that will put natural gas sellers into more direct contractual relations with natural gas buyers by, among other things, unbundling the sale of natural gas from the sale of transportation and storage services. Beginning in 1992, FERC issued a series of orders, beginning with Order No. 636, to implement its open access policies. As a result, the interstate pipelines’ traditional role of providing the sale and transportation of natural gas as a single service has been eliminated and replaced by a structure under which pipelines provide transportation and storage service on an open access basis to others that buy and sell natural gas. Although FERC’s orders do not directly regulate natural gas producers, they are intended to foster increased competition within all phases of the natural gas industry.
In 2000, FERC issued Order No. 637 and subsequent orders, which imposed a number of additional reforms designed to enhance competition in natural gas markets. Among other things, Order No. 637 revised FERC’s pricing policy by waiving price ceilings for short-term released capacity for a two-year experimental period and effected changes in FERC regulations relating to scheduling procedures, capacity segmentation, penalties, rights of first refusal and information reporting.
Gathering services, which occur upstream of jurisdictional transmission services, are regulated by the states onshore and in state waters. Although FERC has set forth a general test for determining whether facilities perform a non-jurisdictional gathering function or a jurisdictional transmission function, FERC’s determinations as to the classification of facilities is done on a case-by-case basis. To the extent that FERC issues an order that reclassifies transmission facilities as gathering facilities and, depending on the scope of that decision, our costs of getting gas to point of sale locations may increase. State regulation of natural gas gathering facilities generally includes various safety, environmental and, in some circumstances, non-discriminatory take requirements. Although such regulation has not generally been affirmatively applied by state agencies, natural gas gathering may receive greater regulatory scrutiny in the future.
Intrastate natural gas transportation and facilities are also subject to regulation by state regulatory agencies, and certain transportation services provided by intrastate pipelines are also regulated by FERC. The basis for intrastate regulation of natural gas transportation and the degree of regulatory oversight and scrutiny given to intrastate natural gas pipeline rates and services vary from state to state. Insofar as such regulation within a particular state will generally affect all intrastate natural gas shippers within the state on a comparable basis, we believe that the regulation of similarly situated intrastate natural gas transportation in any states in which we operate and ship natural gas on an intrastate basis will not affect our operations in any way that is of material difference from those of our competitors. Like the regulation of interstate transportation rates, the regulation of intrastate transportation rates affects the marketing of natural gas that we produce, as well as the revenues we receive for sales of our natural gas.
Regulation of Production
The production of oil and natural gas is subject to regulation under a wide range of local, state and federal statutes, rules, orders and regulations. Federal, state and local statutes and regulations require permits for drilling operations, drilling bonds and reports concerning operations. All of the states in which we own and operate properties have regulations governing conservation matters, including provisions for the unitization or pooling of oil and natural gas properties, the establishment of maximum allowable rates of production from oil and natural gas wells, the regulation of well spacing, and plugging and abandonment of wells. The effect of these regulations is to limit the amount of oil and natural gas that we can produce from our wells and to limit the number of wells or the locations at which we can drill, although we can apply for exceptions to such regulations or to have reductions in well spacing. Moreover, each state generally imposes a production or severance tax with respect to the production and sale of oil, natural gas and natural gas liquids within its jurisdiction. The failure to comply with these rules and regulations can result in substantial penalties. Our competitors in the oil and natural gas industry are subject to the same regulatory requirements and restrictions that affect our operations.
Environmental, Health and Safety Regulation
Our exploration, development, production and processing operations are subject to various federal, state and local laws and regulations relating to health and safety, the discharge of materials and environmental protection. These laws and regulations may, among other things: require the acquisition of permits to conduct exploration, drilling and production operations; govern the amounts and types of substances that may be released into the environment in connection with oil and natural gas drilling and production; restrict the way we handle or dispose of our wastes; limit or prohibit construction or drilling activities in sensitive areas, such as wetlands, wilderness areas, or areas inhabited by endangered or threatened species; require investigatory and remedial actions to mitigate pollution conditions caused by our operations or attributable to former operations; and impose obligations to reclaim and abandon well sites and pits. Failure to comply with these laws and regulations may result in the assessment of administrative, civil and criminal penalties, the imposition of remedial obligations and the issuance of orders enjoining some or all of our operations in affected areas.
These laws and regulations may also restrict the rate of oil and natural gas production below the rate that would otherwise be possible. The regulatory burden on the oil and gas industry increases the cost of doing business in the industry and consequently affects profitability. In addition, Congress and federal and state agencies frequently revise environmental, health and safety laws and regulations, and any changes that result in more stringent and costly emissions control, waste handling, disposal, cleanup and remediation requirements for the oil and gas industry could have a significant impact on our operating costs.
The clear trend in environmental regulation is to place more restrictions and limitations on activities that may affect the environment, and thus, any changes in environmental laws and regulations or re-interpretations of enforcement policies that result in more stringent and costly waste handling, storage, transport, disposal, or remediation requirements could have a material adverse effect on our operations and financial position in the future. We may be unable to pass on such increased compliance costs to our customers. Moreover, accidental releases or spills may occur in the course of our operations, and we cannot assure you that we will not incur significant costs and liabilities as a result of such releases or spills, including any third party claims for damage to property, natural resources or persons. We maintain insurance against costs of cleanup operations, but we are not fully insured against all such risks. While we believe that we are in substantial compliance with existing environmental laws and regulations and that current requirements would not have a material adverse effect on our financial condition or results of operations, there is no assurance that this will continue in the future.
The following is a summary of the more significant existing environmental, health and safety laws and regulations to which our business operations are subject and for which compliance in the future may have a material adverse effect on our capital expenditures, results of operations or financial position.
Hazardous Substances and Waste
The Comprehensive Environmental Response, Compensation, and Liability Act (“CERCLA”), also known as the Superfund law, and comparable state laws impose liability without regard to fault or the legality of the original conduct on certain classes of persons who are considered to be responsible for the release of a “hazardous substance” into the environment. CERCLA exempts “petroleum, including oil or any fraction thereof” from the definition of “hazardous substance” unless specifically listed or designated under CERCLA. While the EPA interprets CERCLA to exclude oil and fractions of oil, hazardous substances that are added to petroleum or that increase in concentration as a result of contamination of the petroleum during use are not considered part of the petroleum and are regulated under CERCLA as a hazardous substance.
Responsible persons under CERCLA include current and prior owners or operators of the site where the release occurred and entities that disposed or arranged for the disposal of the hazardous substances found at the site. Under CERCLA, these “responsible persons” may be subject to strict, joint and several liability for the costs of cleaning up the hazardous substances that have been released into the environment, for damages to natural resources, and for the costs of certain health studies. CERCLA also authorizes the EPA and, in some instances, third parties to act in response to threats to the public health or the environment and to seek to recover from the responsible classes of persons the costs they incur. It is not uncommon for neighboring landowners and other third parties to file claims for personal injury and property damage allegedly caused by the release of hazardous substances or other pollutants into the environment. We generate materials in the course of our operations that may be regulated as hazardous substances.
We also generate solid and hazardous wastes that are subject to the requirements of the Resource Conservation and Recovery Act, as amended (“RCRA”), and comparable state statutes. The RCRA imposes requirements on the generation, storage, treatment, transportation and disposal of hazardous wastes. In the course of our operations we generate petroleum hydrocarbon wastes and ordinary industrial wastes that may be regulated as hazardous wastes. The RCRA regulations specifically exclude from the definition of hazardous waste “drilling fluids, produced waters and other wastes associated with the exploration, development or production of oil, natural gas or geothermal energy.” However, legislation has been proposed in Congress from time to time that would reclassify certain natural gas and oil exploration and production wastes as “hazardous wastes,” which would make the reclassified wastes subject to much more stringent handling, disposal and cleanup requirements. No such effort has been successful to date.
We currently own or lease, and have in the past owned or leased, properties that have been used for numerous years to explore and produce oil and natural gas. Although we have utilized operating and disposal practices that were standard in the industry at the time, hydrocarbons and wastes may have been disposed of or released on or under the properties owned or leased by us or on or under the other locations where these hydrocarbons and wastes have been taken for treatment or disposal. In addition, certain of these properties have been operated by third parties whose treatment and disposal or release of hydrocarbons and wastes was not under our control. These properties and wastes disposed thereon may be subject to CERCLA, RCRA and analogous state laws. Under these laws, we could be required to remove or remediate previously disposed wastes (including wastes disposed of or released by prior owners or operators), to clean up contaminated property (including groundwater contaminated by prior owners or operators) and to perform remedial operations to prevent future contamination.
Pipeline Safety and Maintenance
Pipelines, gathering systems and terminal operations are subject to increasingly strict safety laws and regulations. Both the transportation and storage of refined products and oil involve a risk that hazardous liquids may be released into the environment, potentially causing harm to the public or the environment. In turn, such incidents may result in substantial expenditures for response actions, significant government penalties, liability to government agencies for natural resources damages and significant business interruption. The U.S. Department of Transportation (“DOT”) has adopted safety regulations with respect to the design, construction, operation, maintenance, inspection and management of our pipeline and storage facilities. These regulations contain requirements for the development and implementation of pipeline integrity management programs, which include the inspection and testing of pipelines and the correction of anomalies. These regulations also require that pipeline operation and maintenance personnel meet certain qualifications and that pipeline operators develop comprehensive spill response plans.
There have been recent initiatives to strengthen and expand pipeline safety regulations and to increase penalties for violations. In 2012, the Pipeline Safety, Regulatory Certainty, and Job Creation Act of 2011 was signed into law. This Act provides additional requirements related to spill and accident reporting, as well as more stringent oversight of pipelines and increased penalties for violations of safety rules. Since enactment, DOT has initiated a series of rulemakings to implement the new law. DOT has also recently promulgated new regulations extending safety rules to certain low-pressure, small-diameter pipelines in rural areas. Improving pipeline safety, which has the effect of reducing methane leaks, has been proposed as part of the Obama Administration’s methane strategy.
Air Emissions
The Clean Air Act, as amended (“CAA”), and comparable state laws and regulations restrict the emission of air pollutants from many sources, including oil and natural gas operations, and impose various monitoring and reporting requirements. These laws and regulations may require us to obtain preapproval for the construction or modification of certain projects or facilities expected to produce or significantly increase air emissions, obtain and comply with stringent air permit
requirements, or utilize specific equipment or technologies to control emissions. Obtaining permits has the potential to delay the development of oil and natural gas projects.
In August 2010, the EPA published new regulations under the CAA to control emissions of hazardous air pollutants from existing stationary reciprocating internal combustion engines (“RICE NESHAP”). The rule may require us to undertake certain expenditures and activities, likely including purchasing and installing emissions control equipment, such as oxidation catalysts or non-selective catalytic reduction equipment, on a portion of our engines located at major sources of hazardous air pollutants and all our engines over a certain size regardless of location, following prescribed maintenance practices for engines (which are consistent with our existing practices), and implementing additional emissions testing and monitoring. On January 14, 2013, the EPA signed final revisions to the 2010 RICE NESHAP to reflect new technical information submitted by stakeholders and in response to lawsuits and administrative petitions. On January 30, 2013 the final RICE NESHAP rule was published in the Federal Register with an effective date of April 1, 2013. Several petitions requesting administrative reconsideration of the 2013 RICE NESHAP were received by the EPA. On August 15, 2014, EPA published its final decision on reconsideration and determined that it would not propose any changes to the regulation based on the petitions.
In June 2010, the EPA formally proposed modifications to existing regulations under the CAA that established new source performance standards for manufacturers, owners and operators of new, modified and reconstructed stationary internal combustion engines. The EPA finalized the modifications on June 28, 2011 with an effective date of August 2011. The rule modifications may require us to undertake significant expenditures, including expenditures for purchasing, installing, monitoring and maintaining emissions control equipment on a potentially significant percentage of our natural gas compression engine fleet.
The EPA also issued new CAA regulations relevant to hydraulic fracturing in 2012, including a new source performance standard for volatile organic chemicals (“VOCs”) and sulfur dioxide (“SO2”) emissions with expanded applicability to natural gas operations, as well as a new air toxics standard. These rules create significant new technology requirements for controlling wellhead emissions from our operations. The EPA has made several changes to these rules in response to industry and environmental group legal challenges and administrative petitions, including, most recently, a decision to include a specific performance standard for methane in the rules (discussed further below). In general, there is increasing interest in and focus on regulation of methane emissions from oil and natural gas operations, and hydraulic fracturing operations in particular, under the CAA. We cannot predict future regulatory requirements in this area or the cost to comply with such requirements. The adoption and implementation of any regulations imposing reporting obligations on, or limiting emissions of greenhouse gases from, our equipment and operations could require us to incur costs to reduce emissions of greenhouse gases associated with our operations or could adversely affect demand for the oil and natural gas we produce.
Climate Change
The United States is a party to the United Nations Framework Convention on Climate Change (“UNFCCC”), an international treaty focused on stabilizing greenhouse gases (“GHGs”) concentrations in the atmosphere at a level that would prevent serious damage to the climate system. The UNFCCC did not establish any substantive obligations for parties to reduce GHGs. The subsequent treaty, the Kyoto Protocol, did establish binding GHG targets for developed countries, but the United States did not ratify it. The current focus is on a new international agreement to replace the Kyoto Protocol. This new agreement, which would be effective beginning in 2020, remains under negotiation, but it is expected to be signed in Paris in December 2015. The new agreement is expected to incorporate actions taken by individual countries to reduce GHGs on the national level. The United States’ involvement in developing the new agreement creates significant political pressure for the United States to take responsive action to reduce GHGs. In the absence of comprehensive climate change legislation, significant regulatory action to regulate GHGs under the CAA has occurred over the past several years, which would likely represent a significant portion of the United States’ reductions proposed under the Paris agreement. Any future federal laws, agreements or implementing regulations that may be adopted to address GHG emissions could require us to incur increased operating costs and could adversely affect demand for the oil and natural gas we produce.
In addition, as stated previously, the EPA has begun to regulate GHG emissions. In December 2009, the EPA published its finding that certain emissions of GHGs presented an endangerment to human health and the environment. These findings by the EPA allow the agency to proceed with the adoption and implementation of regulations that would restrict emissions of GHGs under existing provisions of the CAA. Consequently, the EPA is requiring a reduction in emissions of GHGs from new motor vehicles beginning with the 2012 model year. Furthermore, the EPA published a final rule on June 3, 2010 to address the permitting of GHG emissions from stationary sources under the Prevention of Significant Deterioration (“PSD”) and Title V permitting programs. This rule “tailors” these permitting programs to apply to certain stationary sources of GHG emissions, such as power plants and oil refineries. This rule was subject to legal challenge that went to the Supreme Court. On June 23, 2014, the Supreme Court issued its decision in Utility Air Regulatory Group v. EPA (No. 12-1146). The Court held that the EPA may not require a major source to obtain a PSD or title V permit on the basis of greenhouse gas
emissions alone. The Court further held that PSD permits that are otherwise required (based on emissions of other pollutants) may continue to require limitations on GHGs based on the application of Best Available Control Technology (“BACT”). The EPA is currently evaluating the implications of the decision and awaiting further action by the U.S. Courts in terms of whether additional rulemaking is necessary.
In addition, the EPA requires the reporting of GHGs from specified large GHG emission sources, including GHGs from petroleum and natural gas systems that emit more than 25,000 tons of GHGs per year. Reporting is required from onshore and offshore petroleum and natural gas production, natural gas processing, transmission and distribution, underground natural gas storage and liquefied natural gas import, export and storage. Pursuant to a settlement agreement, the EPA has also committed to regulate GHGs from new petroleum refineries, though no draft rule has yet been released.
On January 8, 2014, the EPA published its proposed NSPS rule regulating greenhouse emissions from new fossil fuel-fired power plants. In the proposed NSPS, the EPA establishes emission standards for coal plants and for natural gas-fired stationary combustion turbines. The EPA determined that partial carbon capture and sequestration constituted the “best system of emission reduction” (“BSER”) for coal plants. For natural gas plants, the EPA determined that modern, efficient natural gas combined cycle technology constituted the BSER. The NSPS applies to new fossil-fuel fired electric utility generating units over 25 MW and that generate electricity for sale. The NSPS for new sources triggers the need to set standards for existing fossil fuel-fired power plants. On June 2, 2014, the EPA released a proposed rule related to existing source performance standards for power plants and setting forth state-specific emission targets. States have significant flexibility in determining how they would meet the standards. Limits set by the state to meet the state-specific goals can either apply directly to the power plant or be met through reductions in power plant emissions through implementation of energy efficiency or renewable energy measures in the state. Each state can choose to include measures that the EPA determines constitute BSER or may choose additional measures, as long as such measures achieve the emission reduction necessary to meet that state’s goal set by the EPA. Throughout the proposed rule, the EPA emphasizes the flexibility of the states to decide how to reduce emissions to meet the state goals, including the use of cap-and-trade programs. The EPA is expected to finalize the standards for new, modified and existing power plants in late summer 2015. While these rules will more negatively impact coal-fired power plants, natural gas-fired power plants may also face liability under the rules and increased costs of operation.
On January 14, 2015, the Obama Administration announced plans to reduce methane emissions from the oil and gas industry, which could affect us indirectly by affecting our customer base or by directly regulating our operations. In either case, increased costs of operation and exposure to liability could result.
Several of the EPA’s GHG rules are being challenged in court proceedings and depending on the outcome of such proceedings, such rules may be modified or rescinded or the EPA could develop new rules. The adoption and implementation of any regulations imposing reporting obligations on, or limiting emissions of GHGs from, our equipment and operations could require us to incur costs to reduce emissions of GHGs associated with our operations or could adversely affect demand for the oil and natural gas we produce.
While new legislation requiring GHG controls is not expected at the national level in the near term, almost one-half of the states have taken actions to monitor and/or reduce emissions of GHGs, including obligations on utilities to purchase renewable energy and GHG cap and trade programs. Although most of the state level initiatives have to date focused on large sources of GHG emissions, such as coal-fired electric plants, it is possible that smaller sources of emissions could become subject to GHG emission limitations or allowance purchase requirements in the future.
Any one of these climate change regulatory and legislative initiatives could have a material adverse effect on our business, financial condition and results of operations. Legislation or regulations that may be adopted to address climate change could also affect the markets for our products by making our products more or less desirable than competing sources of energy. To the extent that our products are competing with higher GHG emitting energy sources, such as coal, our products would become more desirable in the market with more stringent limitations on GHG emissions. To the extent that our products are competing with lower GHG emitting energy sources, such as solar and wind, our products would become less desirable in the market with more stringent limitations on GHG emissions. We cannot predict with any certainty at this time how these possibilities may affect our operations.
Finally, it should be noted that some scientists have concluded that increasing concentrations of GHGs in the Earth’s atmosphere may produce climate changes that have significant physical effects, such as increased frequency and severity of storms, droughts, floods and other climatic events. If any such effects were to occur, they could adversely affect or delay demand for the oil or natural gas we produce or otherwise cause us to incur significant costs in preparing for or responding to those effects.
Water Discharges
The Federal Water Pollution Control Act, as amended, or the Clean Water Act (“CWA”), and analogous state laws impose restrictions and controls regarding the discharge of pollutants into waters of the United States. Pursuant to the CWA and analogous state laws, permits must be obtained to discharge pollutants into state waters or waters of the United States. Any such discharge of pollutants into regulated waters must be performed in accordance with the terms of the permits issued by the EPA or analogous state agencies. The CWA and regulations implemented thereunder also prohibit the discharge of dredge and fill material into regulated waters, including jurisdictional wetlands, unless authorized by an appropriately issued permit. Spill prevention, control and countermeasure requirements under federal law require appropriate containment berms and similar structures to help prevent the contamination of navigable waters in the event of a petroleum hydrocarbon tank spill, rupture or leak. In addition, the CWA and analogous state laws require individual permits or coverage under general permits for discharges of stormwater runoff from certain types of facilities. Currently, storm water discharges from oil and natural gas exploration, production, processing or treatment operations, or transmission facilities are exempt from regulation under the CWA. Federal and state regulatory agencies can impose administrative, civil and criminal penalties, as well as other enforcement mechanisms for noncompliance with discharge permits or other requirements of the CWA and analogous state laws and regulations.
Endangered Species Act
The federal Endangered Species Act, as amended (“ESA”), restricts activities that may affect endangered and threatened species or their habitats. While some of our facilities may be located in areas that are designated as habitats for endangered or threatened species, we believe that we are in substantial compliance with the ESA. However, the designation of previously unidentified endangered or threatened species could cause us to incur additional costs or become subject to operating restrictions or bans in the affected areas.
Employee Health and Safety
We are subject to a number of federal and state laws and regulations, including the federal Occupational Safety and Health Act, as amended (the “OSH Act”), and comparable state statutes, whose purpose is to protect the health and safety of workers. In addition, the OSH Act’s hazard communication standard, the EPA community right-to-know regulations under Title III of the federal Superfund Amendment and Reauthorization Act, and comparable state statutes require that information be maintained concerning hazardous materials used, produced or released in our operations and that this information be provided to employees, state and local government authorities and citizens. In 2012, the Occupational Safety and Health Administration (“OSHA”) issued a hazard alert related to worker exposure to respirable dust from silica sand, a common additive to hydraulic fracturing fluids. The alert stated that workers at drill sites can be exposed to excessive levels of respirable silica sand, which can cause lung disease and cancer. Increasing concerns about worker safety at drill sites may lead to increased regulation and enforcement or related tort claims by our employees. We believe that we are in substantial compliance with all applicable laws and regulations relating to worker health and safety.
Hydraulic Fracturing
The federal Safe Drinking Water Act (“SDWA”) and comparable state statutes may restrict the disposal, treatment or release of water produced or used during oil and natural gas development. Subsurface emplacement of fluids (including disposal wells) is governed by federal or state regulatory authorities that, in some cases, include the state oil and gas regulatory authority or the state’s environmental authority. We utilize hydraulic fracturing in our operations as a means of maximizing the productivity of our wells and operate saltwater disposal wells to dispose of produced water. The federal Energy Policy Act of 2005 amended the Underground Injection Control (“UIC”) provisions of the SDWA to expressly exclude hydraulic fracturing without diesel additives from the definition of “underground injection.” However, the U.S. Senate and House of Representatives have considered several bills in recent years to end this exemption, as well as other exemptions for oil and gas activities under U.S. environmental laws. The Fracturing Responsibility and Awareness of Chemicals Act (“FRAC Act”), first introduced in 2011, would amend the SDWA to repeal the exemption from regulation under the UIC program for hydraulic fracturing. This bill has been reintroduced in each congressional session since it was initially proposed but has not yet garnered enough support to be put to a vote. If enacted, the FRAC Act would amend the definition of “underground injection” in the SDWA to encompass hydraulic fracturing activities. Such a provision could require hydraulic fracturing operations to meet permitting and financial assurance requirements, to adhere to certain construction specifications, to fulfill monitoring, reporting and recordkeeping obligations, and to meet plugging and abandonment requirements. The FRAC Act also proposes to require the reporting and public disclosure of chemicals used in the fracturing process. Note that each of the above components of the FRAC Act have become increasingly common in state laws since the FRAC Act was first introduced. Other recent bills in the U.S. House of Representatives would end certain exemptions for oil and natural gas operations related to permitting requirements for multiple commonly owned and adjacent sources of hazardous air pollutants under the CAA and permitting requirements for stormwater discharges under the CWA. If
the exemptions for hydraulic fracturing are removed from U.S. environmental laws, or if the FRAC Act or other legislation is enacted at the federal, state or local level, any restrictions on the use of hydraulic fracturing contained in any such legislation could have a significant impact on our financial condition and results of operations.
Federal agencies have also begun to directly regulate hydraulic fracturing. The EPA has recently asserted federal regulatory authority over, and issued permitting guidance for, hydraulic fracturing involving diesel additives under the SDWA’s UIC Program. As a result, service providers or companies that use diesel products in the hydraulic fracturing process are expected to be subject to additional permitting requirements or enforcement actions under the SDWA. The EPA has also issued new CAA regulations relevant to hydraulic fracturing in 2012, including the NSPS for VOC and SO2 emissions with expanded applicability to natural gas operations and new national emission standards for hazardous air pollutants standards for air toxics, which are discussed in more detail above. These regulatory developments are indicative of increasing federal regulatory activity related to hydraulic fracturing, which has the potential to create additional permitting, technology, recordkeeping and site study requirements, among others, for our business. The EPA is also collecting information as part of a multi-year study into the effects of hydraulic fracturing on drinking water. A draft report was expected to be available for public comment and peer review in 2014, but has not yet been released. The results of this study could result in additional regulations, which could lead to operational burdens similar to those described above. The U.S. Department of the Interior has likewise developed comprehensive regulations for hydraulic fracturing on federal land, which remain under review by the White House’s Office of Management and Budget.
Several state governments in the areas where we operate have adopted or are considering adopting additional requirements relating to hydraulic fracturing that could restrict its use in certain circumstances or make it more costly to utilize. Such measures may address any risk to drinking water, the potential for hydrocarbon migration and disclosure of the chemicals used in fracturing. For example, several states, including Colorado, have implemented rules requiring hydraulic fracturing operators to sample ground-and surface waters near proposed well sites before operations can begin, and to sample the same sites again after fracturing operations are complete. A majority of states around the country, including both Colorado and Texas, have also adopted some form of fracturing fluid disclosure law to compel disclosure of fracturing fluid ingredients and additives that are not subject to trade secret protection. Other states, such as Ohio and Texas, have begun to study potential seismic risks related to underground injection of fracturing fluids. Any enforcement actions or requirements of additional studies or investigations by governmental authorities where we operate could increase our operating costs and cause delays or interruptions of our operations.
At this time, it is not possible to estimate the potential impact on our business of these state and local actions or the enactment of additional federal or state legislation or regulations affecting hydraulic fracturing.
Other Laws
The Oil Pollution Act of 1990, as amended (“OPA”), establishes strict liability for owners and operators of facilities that are the site of a release of oil into waters of the United States. The OPA and its associated regulations impose a variety of requirements on responsible parties related to the prevention of oil spills and liability for damages resulting from such spills. A “responsible party” under the OPA includes owners and operators of certain onshore facilities from which a release may affect waters of the United States. The OPA assigns liability to each responsible party for oil cleanup costs and a variety of public and private damages. While liability limits apply in some circumstances, a party cannot take advantage of liability limits if the spill was caused by gross negligence or willful misconduct or resulted from violation of a federal safety, construction or operating regulation. If the party fails to report a spill or to cooperate fully in the cleanup, liability limits likewise do not apply. Few defenses exist to the liability imposed by the OPA. The OPA imposes ongoing requirements on a responsible party, including the preparation of oil spill response plans and proof of financial responsibility to cover environmental cleanup and restoration costs that could be incurred in connection with an oil spill.
The National Environmental Policy Act of 1969, as amended (“NEPA”), requires federal agencies to evaluate major agency actions having the potential to significantly impact the environment before their commencement. Generally, federal agencies must prepare either an environmental assessment or an environmental impact statement, depending on whether the specific circumstances surrounding the proposed federal action will have a significant impact on the environment. The NEPA process involves significant public input through comments on alternatives to the proposed project or resource-specific mitigation options for the project. NEPA decisions can be and often are appealed through the administrative and federal court systems by process participants. Environmental groups in the United States have increasingly focused on the required public consultation process under NEPA as a forum for voicing concerns over continued development of fossil fuel energy sources in the United States and for seeking expansive environmental reviews of projects that relate to the production, transportation, or combustion of these fuels, including evaluating the impacts of projects on climate change. Although we believe that our actions do not typically trigger NEPA analysis, should we ever be subject to NEPA, the process could result in delaying the
permitting and development of projects, increase the costs of permitting and developing some facilities and result in certain instances in litigation and/or the cancellation of certain leases.
Insurance Matters
As is common in the oil and gas industry, we do not insure fully against all risks associated with our business, either because such insurance is not available or because premium costs are considered prohibitive. A loss not fully covered by insurance could have a materially adverse effect on our financial position, results of operations or cash flows.
C. Organizational Structure
The following is the organizational structure of Sundance Energy Australia Limited:
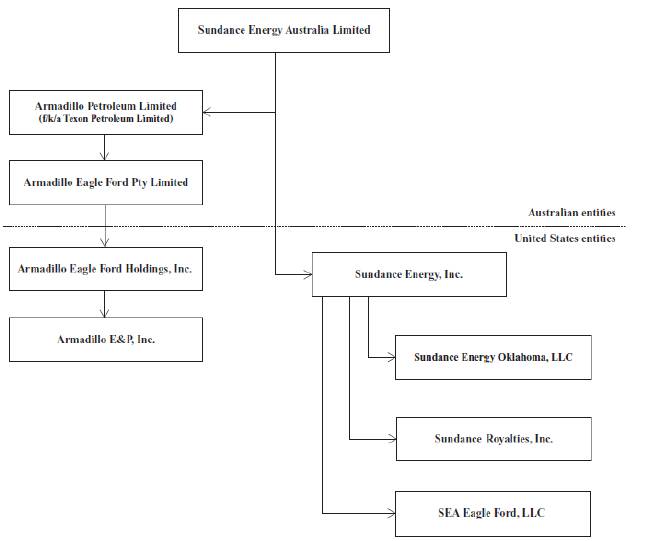
All Sundance Energy Australia Limited subsidiaries are wholly owned. Substantially all of our oil and natural gas operations are conducted by our subsidiaries Sundance Energy, Inc. and Armadillo Petroleum Limited and their subsidiaries, Armadillo E&P, Inc., SEA Eagle Ford, LLC and Sundance Energy Oklahoma, LLC. The majority of our corporate general and administrative expenditures are incurred within Sundance Energy, Inc. We completed the divestiture of all of our real property interests located in Australia in 2011.
D. Property, Plant and Equipment
Our Properties
Eagle Ford
As of December 31, 2014, our Eagle Ford properties consisted of approximately 38,695 gross (26,160 net) acres that are primarily located in McMullen and Dimmit County, Texas, in the volatile oil window of the Eagle Ford trend.
During 2014, we were running a two-rig horizontal development program, with one rig being released in December 2014. As of December 31, 2014, we were running a one-rig horizontal development program and, during the month of December 2014, we had average net daily production of approximately 8,177 Boe/d from our Eagle Ford properties. For the year ended December 31, 2014, we had average net daily production of approximately 4,187 Boe/d from these properties. During 2014, we spent $248.8 million drilling a total of 54 gross (36.7 net) Eagle Ford horizontal wells, of which 26.1 net wells are producing and 10.6 net wells are awaiting completion. In 2015, we expect to spend approximately $65 million to $80 million on development and production assets.
Mississippian/Woodford
The Mississippian/Woodford formation spans six counties located throughout northeastern Oklahoma and southwestern Kansas. As of December 31, 2014, our properties in the Mississippian/Woodford consisted of approximately 73,417 gross (40,937 net) acres that are primarily located in Logan County, Oklahoma along the eastern flank of the Nemaha Ridge. We acquired the majority of these properties through direct mineral leases with the mineral owners.
During 2014, we were running a two-rig horizontal development program with those rigs being released in June and December 2014, respectively. As of December 31, 2014, we did not have any drilling rigs running. During 2014, we spent $81.8 million drilling a total of 45 gross (19.7 net) Mississippian/Woodford wells, of which 16.6 net wells are producing and 3.1 net wells are drilling or awaiting completion as of December 31, 2014. During the month of December 2014, we had average net daily production of approximately 1,257 Boe/d from our Mississippian/Woodford properties. For the year ended December 31, 2014, we had average net daily production of approximately 1,434 Boe/d from these properties. In 2015, we expect to spend approximately $5 million on development and production assets.
Denver-Julesburg
In July 2014, we divested our remaining Denver-Julesburg assets to focus on the development of our operated assets in our other major operating areas. See Item 4.A. “Information on Sundance - History and Development—Divestitures.”
Bakken
In July 2014, we divested our remaining Bakken assets. See Item 4.A. “Information on Sundance - History and Development—Divestitures.”
Title to Properties
Our properties are subject to what we believe to be customary royalty interests, liens incident to operating agreements, liens for current taxes and other burdens, including other mineral encumbrances and restrictions. We believe that we have generally satisfactory title to or rights in all of our producing properties. As is customary in the oil and gas industry, we conduct what we believe to be sufficient investigation of title at the time we acquire undeveloped properties and generally make title investigations and receive title opinions of local counsel before we commence drilling operations. We believe that we have satisfactory title to all of our other assets. Although title to our properties is subject to encumbrances in certain cases, we believe that none of these burdens will materially detract from the value of our properties or from our interest therein or will materially interfere with the operation of our business.
Facilities
We lease approximately 27,600 square feet of office space at 633 17th Street, Denver, Colorado, where our principal offices are located. We do not have any material field office facilities.
Item 4A. Unresolved Staff Comments
Not applicable.
Item 5. Operating and Financial Review and Prospects
A. Operating Results
You should read the following discussion and analysis in conjunction with Item 3.A. “Key Information—Selected Financial Data” and our consolidated financial statements and the notes to those consolidated financial statements appearing elsewhere in this annual report.
In addition to historical information, the following discussion contains forward-looking statements that reflect our plans, estimates, intentions, expectations and beliefs. Our actual results could differ materially from those discussed in the forward-looking statements. See Item 3.D. “Key Information—Risk Factors” for a discussion of factors that could cause or contribute to such differences.
Overview
We are an onshore oil and natural gas company focused on the exploration, development and production of large, repeatable resource plays in North America. Our oil and natural gas properties are located in premier U.S. oil and natural gas basins, and through the year ended December 31, 2014, our operational activities are focused in the Eagle Ford and Mississippian/Woodford.
We intend to utilize our U.S.-based management and technical team to appraise, develop, produce and grow our portfolio of assets. Our strategy is to develop assets where we are the operator and have high working interests, which positions us to control the pace of our development and the allocation of our capital resources. As of December 31, 2014, we operated approximately 83% of our developed acreage with an average working interest of approximately 81% with respect to such operated developed acreage.
Our properties and operations have changed significantly over the past two years, with the divestiture of our interest in properties located in the South Antelope field of the Williston Basin, North Dakota and our dispositions of Denver-Julesburg assets and the remaining Bakken assets in September 2012 and July 2014, respectively, and the acquisition of Texon in March 2013, through which we acquired the majority of our Eagle Ford assets. See Item 4.A. “Information on Sundance - History and Development—Acquisitions” and “—Divestitures.”
Over the past few years, we have shifted our focus from being a primarily low working-interest, non-operating participant to a high working-interest operator. By divesting our low working-interest prospects and realizing significant returns on investments, we have been able to fund a substantial portion of our investments in higher-interest wells while maintaining what we view as a conservative balance sheet.
Netherland Sewell estimated our proved reserves to be approximately 26.0 MMBoe as of December 31, 2014, of which approximately 66% are oil, approximately 18% are natural gas and approximately 16% NGLs, with a PV-10 of approximately $531.7 million.
How We Conduct Our Business and Evaluate Our Operations
We employ our capital resources for exploration, acquisitions and development in what we believe to be the most attractive opportunities available to us as market conditions evolve. We have historically acquired properties that we believe have significant appreciation potential through exploration, development, production optimization or cost reduction. We intend to continue to focus our efforts on the acquisition of operated properties to the extent we believe they meet our return objectives.
We use a variety of financial and operational metrics to assess the performance of our oil and natural gas operations, including:
· production volumes;
· realized prices on the sale of oil and natural gas, including the effect of our commodity derivative contracts;
· lease operating and production expenses;
· general and administrative expenses; and
· Adjusted EBITDAX.
Production Volumes
Production volumes directly impact our results of operations. Based on the expected timing of our drilling schedule and decline curves, we determine our oil and natural gas production budgets and forecasts. We assess our actual production performance by comparing oil and natural gas production at a prospect level to budgets, forecasts and prior periods. In addition, we compare our initial production rates compared to our peers in each of our operated prospects. For more information about our production volumes, see Item 4.B. “Information on Sundance—Business Overview—Operating Data—Production and Pricing.”
Realized Prices on the Sale of Oil and Natural Gas
Factors Affecting the Sales Price of Oil and Natural Gas. We expect to market our oil and natural gas production to a variety of purchasers based on regional pricing. The relative prices of oil and natural gas are determined by the factors impacting global and regional supply and demand dynamics, such as geopolitical events, economic conditions, production levels, weather cycles and other events. In addition, relative prices are heavily influenced by product quality and location relative to consuming and refining markets.
Oil. The New York Mercantile Exchange—West Texas Intermediate (NYMEX-WTI) futures price is a widely used benchmark in the pricing of domestic crude oil in the United States. The actual prices realized from the sale of oil differ from the quoted NYMEX-WTI price as a result of quality and location differentials. Quality differentials to NYMEX-WTI prices result from the fact that oil differs in its molecular makeup, which plays an important part in refining and subsequent sale as petroleum products. Among other things, there are two characteristics that commonly drive quality differentials: (i) the American Petroleum Institute (“API”) gravity of the oil; and (ii) the percentage of sulfur content by weight of the oil. In general, lighter oil (with higher API gravity) produces a larger number of lighter products, such as gasoline, which have higher resale value and, therefore, depending on supply and demand fundamentals, normally sell at a higher price than heavier oil. Oil with low sulfur content (“sweet” oil) is less expensive to refine and, as a result, normally sells at a higher price than high sulfur content oil (“sour” oil).
Location differentials to NYMEX-WTI prices result from variances in transportation costs based on the proximity to the major consuming and refining markets. Oil that is produced close to major consuming and refining markets, such as near Cushing, Oklahoma, is in higher demand as compared to oil that is produced farther from such markets. Consequently, oil that is produced close to major consuming and refining markets normally realizes a higher price (i.e., a lower location differential to NYMEX-WTI).
Oil prices have historically been extremely volatile, and we expect this volatility to continue. For example, the NYMEX-WTI oil price ranged from a high of $107.95 per Bbl to a low of $43.39 per Bbl during 2014 and through the first quarter of 2015. Our realized price per Bbl varies by basin and is based upon transportation costs, mainly trucking costs and pipeline tariffs, and regional basis differentials.
Natural Gas. The NYMEX-Henry Hub price of natural gas is a widely used benchmark for the pricing of natural gas in the United States. Similar to oil, the actual prices realized from the sale of natural gas differ from the quoted NYMEX-Henry Hub price as a result of quality and location differentials. Quality differentials to NYMEX-Henry Hub prices result from: (i) the Btu content of natural gas, which measures its heating value; and (ii) the percentage of sulfur, CO2 and other inert content by volume. Wet natural gas with a high Btu content sells at a premium to low Btu content dry natural gas because it yields a greater quantity of NGLs. Natural gas with low sulfur and CO2 content sells at a premium to natural gas with high sulfur and CO2 content because of the added cost to separate the sulfur and CO2 from the natural gas to render it marketable. Wet natural gas is processed in third-party natural gas plants, and residue natural gas as well as NGLs are recovered and sold. Dry natural gas residue from our properties is generally sold based on index prices in the region from which it is produced.
Location differentials to NYMEX-Henry Hub prices result from variances in transportation costs based on the proximity to the major consuming markets. The processing fee deduction retained by the natural gas processing plant generally in the form of percentage of proceeds also affects the differential. Generally, these index prices have historically been at a discount to NYMEX-Henry Hub natural gas prices.
Natural gas prices have historically been extremely volatile, and we expect this volatility to continue. For example, the NYMEX-Henry Hub natural gas price ranged from a high of $6.00 per MMBtu to a low of $2.83 per MMBtu during 2014 and through the first quarter of 2015. Our realized gas price per MMBtu varies by basin based upon transportation costs, mainly pipeline tariffs, as well as liquids premiums and regional basis differentials.
Commodity Derivative Contracts. We have adopted a commodity derivative policy designed to minimize volatility in our cash flows from changes in commodity prices. Our current policy is to hedge up to 80% of forecasted proved developed producing production, but not more than 25% of total estimated production for the next five years. Should we reduce our estimates of future production to amounts that are lower than our commodity derivative volumes, we will reduce our positions as soon as practical. Our credit facilities prohibit us from entering into hedging arrangements for more than 85% of our projected production of oil and natural gas. For more information on our commodity derivative policy, see Item 11 “Quantitative and Qualitative Disclosure About Risk.”
Lease Operating Expenses
We strive to increase our production levels to maximize our revenue. We evaluate operating costs to determine reserves, rates of return, and current and long-term profitability of our wells. We expect expenses for utilities, direct labor, water injection and disposal, and materials and supplies to comprise the most significant portion of our oil and natural gas production expenses. Oil and natural gas production expenses do not include general and administrative costs or production and other taxes. Certain items, such as direct labor and materials and supplies, generally remain relatively fixed across broad production volume ranges but can fluctuate depending on activities performed during a specific period. For instance, repairs to our pumping equipment or surface facilities may result in increased oil and natural gas production expenses during periods the repairs are performed.
A majority of our operating cost components are variable and may increase or decrease as the level of produced hydrocarbons and water increases or decreases. For example, we incur power costs in connection with various production-related activities, such as pumping to recover oil and natural gas and separation and treatment of water produced in connection with our oil and natural gas production. Over the life of hydrocarbon fields, the amount of water produced may increase and, as pressure declines in natural gas wells that also produce water, more power will be needed for artificial lift systems that help to remove water produced from the wells. Thus, production of a given volume of hydrocarbons may become more expensive each year as the cumulative oil and natural gas produced from a field increases until additional production becomes uneconomic. Our lease operating and production expense are both included in lease operating expenses.
Production and Ad Valorem Taxes. Texas regulates the development, production, gathering and sale of oil and natural gas, including imposing production taxes. The state currently imposes a production tax equal to 4.6% of the market value of oil sold, and a regulatory fee and tax of 0.8125% per barrel of oil sold. The State of Texas also imposes a production tax equal to 7.5% of the market value of the natural gas sold, and a regulatory fee of 0.0667% per Mcf of gas sold. In addition to the state taxes, McMullen County, Texas assesses an annual ad valorem tax which currently is approximately 1.87% of the gross annual oil and gas sales value.
Oklahoma currently has a production tax rate of 7.0% of the market value of the oil and gas sold. However, we have qualified for a horizontal well incentive tax rate of 1.0% which is imposed during the earlier of the first 48 months of sales or until the well has achieved payout. There is an additional excise tax of 0.095% on the value of oil and gas sold. Oklahoma ad valorem taxes are imposed on personal property, specifically well equipment, at a rate of approximately 12.0% of the value of the equipment.
Generally, production taxes include taxes calculated on production volumes and sales values. Lease operating expenses including taxes which are calculated on asset values.
General and Administrative Expenses
General and administrative expenses are comprised of employee benefits expense (including salaries and wages) and administrative expenses. Employee benefits expense includes salaries, wages and related benefits for our corporate personnel. Stock compensation, including stock options and restricted share units, are expensed in the statement of comprehensive income over their vesting period. The total amount expensed over the vesting period is determined by reference to the fair value of the options and restricted share units at the grant date. Administrative expenses include overhead costs, such as maintaining our headquarters, costs of managing our production and development operations, audit and other fees for professional services, and legal compliance.
Adjusted EBITDAX
Adjusted EBITDAX is a supplemental, non-IFRS financial measure and is defined as our earnings before interest expense, income taxes, depreciation, depletion and amortization, property impairments, gain/(loss) on sale of non-current assets, exploration expense, share-based compensation and income and gains and losses on commodity hedging, net of settlements of commodity hedging. We use this non-IFRS measure primarily to compare our results with other companies in the industry that make a similar disclosure. We believe that this measure may also be useful to investors for the same purpose. Investors should not consider this measure in isolation or as a substitute for operating income, or any other measure for determining our operating performance that is calculated in accordance with IFRS. In addition, because Adjusted EBITDAX is not an IFRS measure, it may not necessarily be comparable to similarly titled measures employed by other companies. See Item 3.A. “Key Information—Selected Financial Data—Adjusted EBITDAX” for a reconciliation between Adjusted EBITDAX and net income before income tax expense.
Critical Accounting Policies and Estimates
The preparation of our financial statements requires us to make estimates and judgments that can affect the reported amounts of assets, liabilities, revenues and expenses, as well as the disclosure of contingent assets and liabilities at the date of our financial statements. Significant estimates include volumes of proved and probably oil, natural gas and NGL reserves, which are used in calculating depreciation, depletion and amortization of development and production assets’ costs, estimates of future taxable income used in assessing the realizability of deferred tax assets, and the estimated costs and timing of cash outflows underlying restoration provisions. Oil, natural gas and NGL reserve estimates, and therefore calculations based on such reserve estimates, are subject to numerous inherent uncertainties, the accuracy of which, is a function of the quality and quantity of available data, the application of engineering and geological interpretation and judgment to available data and the interpretation of mineral leaseholds and other contractual arrangements, including adequacy of title, drilling requirements and royalty obligations. These estimates also depend on assumptions regarding quantities and production rates of recoverable oil, natural gas and NGL reserves, commodity prices, timing and amounts of development costs and operating expenses, all of which will vary from those assumed in our estimates. Other significant estimates are involved in determining impairments of exploration and evaluation expenditures, fair values of derivative assets and liabilities, stock-based compensation expense, collectability of receivables, and in evaluating disputed claims, interpreting contractual arrangements and contingencies. Estimates are based on current assumptions that may be materially affected by the results of subsequent drilling and completion, testing and production as well as subsequent changes in oil, natural gas and NGL prices, counterparty creditworthiness, interest rates and the market value and volatility of the Company’s common shares. Actual results may vary maerially from our estimates. We have outlined below policies of particular importance to the portrayal of our financial position and results of operations and that require the application of significant judgment or estimates by our management.
In addition, we note that our significant accounting policies are detailed in Note 1 to our consolidated financial statements for the fiscal year ended December 31, 2014.
Development and Production Assets and Plant and Equipment
Development and production assets, and property and equipment are carried at cost less, where applicable, any accumulated depreciation, amortization and impairment losses. The costs of assets constructed within Sundance includes the cost of materials, direct labor, borrowing costs and an appropriate proportion of fixed and variable overheads directly attributable to the acquisition or development of oil and gas properties and facilities necessary for the extraction of resources.
The carrying amount of development and production assets and property and equipment are reviewed at each reporting date to ensure that they are not in excess of the recoverable amount from these assets. Development and production assets are assessed for impairment on a cash-generating unit basis. A cash-generating unit (“CGU”) is the smallest grouping of assets that generates independent cash inflows. Management has assessed its CGUs as being an individual basin, which is the lowest level for which cash inflows are largely independent of those of other assets. Impairment losses recognized in respect of cash-generating units are allocated to reduce the carrying amount of the assets in the unit on a pro-rata basis.
An impairment loss is recognized in the income statement whenever the carrying amount of an asset or its cash-generating unit exceeds its recoverable amount.
The recoverable amount of an asset is the greater of its fair value less costs to sell and its value-in-use. In assessing value-in-use, an asset’s estimated future cash flows are discounted to their present value using a pre-tax discount rate that reflects current market assessments of the time value of money and the risks specific to the assets/CGUs. In addition, we consider market data related to recent transactions for similar assets.
Subsequent costs are included in the asset’s carrying amount or recognized as a separate asset, as appropriate, only when it is probable that future economic benefits associated with the item will flow to us and the cost of the item can be measured reliably. All other repairs and maintenance are charged to the consolidated statement of profit or loss and comprehensive income during the financial period in which are they are incurred.
An impairment loss is reversed if there has been an increase in the estimated recoverable amount of a previously impaired assets. An impairment loss is reversed only to the extent that the asset’s carrying amount does not exceed the carrying amount that would have been determined, net of depreciation or depletion if no impairment loss had been recognized. The Company has not reversed an impairment loss during the years ended December 31, 2014 or 2013.
Exploration and Evaluation Expenditure
Exploration and evaluation expenditures incurred are accumulated in respect of each identifiable area of interest. These costs are capitalized to the extent that they are expected to be recouped through the successful development of the area or where activities in the area have not yet reached a stage that permits reasonable assessment of the existence of economically recoverable reserves. Any such estimates and assumptions may change as new information becomes available. If, after the expenditure is capitalized, information becomes available suggesting that the recovery of the expenditure is unlikely, for example a dry hole, the relevant capitalized amount is written off in the consolidated statement of profit or loss and other comprehensive income in the period in which new information becomes available. The costs of assets constructed within Sundance includes the leasehold cost, geological and geophysical costs, and an appropriate proportion of fixed and variable overheads directly attributable to the exploration and acquisition of undeveloped oil and gas properties.
When approval of commercial development of a discovered oil or gas field occurs, the accumulated costs for the relevant area of interest are transferred to development and production assets. The costs of developed and producing assets are amortized over the life of the area according to the rate of depletion of the proved and probable developed reserves. The costs associated with the undeveloped acreage are not subject to depletion.
The carrying amounts of our exploration and evaluation assets are reviewed at each reporting date, in conjunction with the impairment review process referred to in Note 1(f) to our consolidated financial statements for the year ended December 31, 2014 to determine whether any of impairment indicators exists. Impairment indicators could include i) tenure over the license area has expired during the period or will expire in the near future, and is not expected to be renewed, ii) substantive expenditure on further exploration for and evaluation of mineral resources in the specific area is not budgeted or planned, iii) exploration for and evaluation of resources in the specific area have not led to the discovery of commercially viable quantities of resources, and management has decided to discontinue activities in the specific area, or iv) sufficient data exist to indicate that although a development is likely to proceed, the carrying amount of the exploration and evaluation asset is unlikely to be recovered in full from successful development or from sale. Where an indicator of impairment exists, a formal estimate of the recoverable amount is made and any resulting impairment loss is recognized in the income statement.
Derivative Financial Instruments
We use derivative financial instruments to hedge our exposure to changes in commodity prices arising in the normal course of business. The principal derivatives that may be used are commodity price swap, option and costless collar contracts. The use of these instruments is subject to policies and procedures as approved by our board directors. We do not trade in derivative financial instruments for speculative purposes. None of our derivative contracts have been designated as cash flow hedges for accounting purposes. Derivative financial instruments are initially recognized at cost, if any, which approximates fair value. Subsequent to initial recognition, derivative financial instruments are recognized at fair value. The derivatives are valued on a mark-to-market valuation, and the gain or loss on re-measurement to fair value is recognized through the statement of profit or loss and other comprehensive income. The estimated fair value of our derivative instruments requires substantial judgment. These values are based upon, among other things, option pricing models, futures prices, volatility, time to maturity and credit risk. The values we report in our financial statements change as these estimates are revised to reflect actual results, changes in market conditions or other factors, many of which are beyond our control. The effect on profit and equity as a result of changes in oil prices is included in “Quantitative and Qualitative Disclosures About Risk, Oil Prices Risk Sensitivity Analysis.”
Estimates of Reserve Quantities
The estimated quantities of hydrocarbon reserves reported by the consolidated entity are integral to the calculation of amortization (depletion), and depreciation expense and to assessments of possible impairment of assets. Estimated reserve quantities are based upon interpretations of geological and geophysical models and assessments of the technical feasibility and
commercial viability of producing the reserves. For purposes of the calculation of amortization (depletion), and depreciation expense and the assessment of possible impairment of assets, other than pricing assumptions discussed in Note 17 to the Consolidated Financial Statements, management prepares reserve estimates that conform to the definitions contained in Rule 4-10(a) of Regulation S-X. These assessments require assumptions to be made regarding future development and production costs, commodity prices, exchange rates and fiscal regimes. The estimates of reserves may change from period to period as the economic assumptions used to estimate the reserves can change from period to period and as additional geological data is generated during the course of operations. These reserve estimates may differ from estimates prepared in accordance with the rules and regulations of the SEC regarding oil and natural gas reserve reporting.
Impairment of Non-Financial Assets
We assess impairment at each reporting date by evaluating conditions specific to Sundance that may lead to impairment of assets. Where an indicator of impairment exists, the recoverable amount of the cash-generating unit to which the assets belong is then estimated based on the present value of future discounted cash flows using management’s view of estimates reserve quantities as opposed to estimated reserve quantities prepared to conform to definitions contained in Rule 4-10(a) of Regulations S-X. For development and production assets, the expected future cash flow estimation is always based on a number of factors, variables and assumptions, the most important of which are estimates of reserves, future production profiles, commodity prices and costs. In most cases, the present value of future cash flows is most sensitive to estimates of future oil price and discount rates. A change in the modeled assumptions in isolation could materially change the recoverable amount. However, due to the interrelated nature of the assumptions, movements in any one variable can have an indirect impact on others and individual variables rarely change in isolation. Additional, management can be expected to respond to some movements, to mitigate downsides and take advantage of upsides, as circumstances allow. Consequently, it is impracticable to estimate the indirect impact that a change in one assumption has on other variables and therefore, on the extent of impairments under different sets of assumptions in subsequent reporting periods. In the event that future circumstances vary from these assumptions, the recoverable amount of our development and production assets could change materially and result in impairment losses or the reversal of previous impairment losses.
At December 31, 2014, future NYMEX strip prices, adjusted for basis differentials, were applied in 2015 and gradually increased through 2016 to $75/bbl in 2017 and thereafter. The discount rates applied to the future forecast cash flows are based on a third party participant’s post-tax weighted average cost of capital, adjusted for the risk profile of the asset.
At December 31, 2014, we reassessed the carrying amount of its non-current assets for indicators of impairment in accordance with our accounting policy. Due to the change in the oil pricing environment at year-end, the Company performed an impairment analysis for development and production assets which resulted in an impairment charge of $71.2 million. See Note 17 to the consolidated financial statements for additional information.
Income taxes
We provide for deferred income taxes on the difference between the tax basis of an asset or liability and its carrying amount in our financial statements. This difference will result in taxable income or deductions in future years when the reported amount of the asset or liability is recovered or settled, respectively. Considerable judgment is required in predicting when these events may occur and whether recovery of an asset is more likely than not. Additionally, our federal and state income tax returns are generally not filed before the consolidated financial statements are prepared. Therefore, we estimate the tax basis of our assets and liabilities at the end of each period as well as the effects of tax rate changes, tax credits, and net operating and capital loss carryforwards and carrybacks. Adjustments related to differences between the estimates we use and actual amounts we report are recorded in the periods in which we file our income tax returns. These adjustments and changes in our estimates of asset recovery and liability settlement could have an impact on our results of operations. Revisions to our estimated effective tax rate could increase or decrease our reported income tax expense or benefit.
Because our Australian operations are not significant to the consolidated profit or loss, foreign income taxes are not significant to consolidated income tax expense. Our effective and statutory income tax rates could be impacted by the state income tax rates in which we operate, and the effective and statutory income tax rates are not significantly different as the amount of permanent differences resulting from treatment that differs for assets and liabilities for financial and tax reporting purposes is not significant. The tax impact of temporary differences, primarily development and production assets and exploration and evaluation expenditures, is reflected in deferred income taxes. At December 31, 2014 and 2013, we had no unrecognized tax benefits that would impact our effective tax rate and we have not provided for interest or penalties related to uncertain tax positions. See Note 7 to the consolidated financial statements.
Recently Issued Accounting Standards
IFRS 15—Revenue from Contracts with Customers
In May 2014, IFRS 15 was issued which establishes a single comprehensive model for entities to use in accounting for revenue arising from contracts with customers. Specifically, the standard introduces a 5-step approach to revenue recognition:
Step 1: Identify the contract(s) with a customer
Step 2: Identify the performance obligations in the contracts.
Step 3: Determine the transaction price.
Step 4: Allocate the transaction price to the performance obligations in the contract.
Step 5: Recognize revenue when (or as) the entity satisfies a performance obligation.
Under IFRS 15, an entity recognizes revenue when (or as) a performance obligation is satisfied, i.e. when “control” of the goods or services underlying the particular performance obligation is transferred to the customer. The effective date of this standard is for fiscal years beginning on or after January 1, 2017. Management is currently assessing the impact of the new standard and plans to adopt the new standard on the required effective date.
IFRS 9 – Financial Instruments
IFRS 9 introduces new requirements for the classification, measurement, and derecognition of financial assets and financial liabilities. The final version of IFRS 9 supersedes all previous versions of the standard. However, for annual periods beginning before January 1, 2018, an entity may elect to apply those earlier versions of IFRS 9 if the entity’s relevant date of initial application is before February 1, 2015. The effective date of this standard is for fiscal years beginning on or after January 1, 2018. Management is currently assessing the impact of the new standard but it is not expected to have a material impact on the group’s consolidated financial statements.
Certain Differences Between IFRS and US GAAP
IFRS differs from US GAAP in certain respects. Management has not assessed the materiality of differences between IFRS and US GAAP. Our significant accounting policies are described in Note 1 of our consolidated financial statements for the year ended December 31, 2014.
Comparison of Results of Operations
The following discussion relates to our consolidated results of operations, financial condition and capital resources. You should read this discussion in conjunction with our consolidated financial statements and the notes thereto contained elsewhere in this annual report. Comparative results of operations for the period indicated are discussed below.
Year Ended December 31, 2014 Compared to the Year Ended December 31, 2013
Revenues and Sales Volume. The following table provides the components of our revenues for the years ended December 31, 2014 and 2013, as well as each period’s respective sales volumes:
|
| Year ended |
|
|
|
|
| |||||
|
| 2014 |
| 2013 |
| Change in $ |
| Change as % |
| |||
|
| (audited) |
| (audited) |
|
|
|
|
| |||
Revenue (In $ ‘000s) |
|
|
|
|
|
|
|
|
| |||
Oil sales |
| $ | 144,994 |
| $ | 79,365 |
| $ | 65,629 |
| 82.7 |
|
Natural gas sales |
| 6,161 |
| 2,774 |
| 3,387 |
| 122.1 |
| |||
NGL sales |
| 8,638 |
| 3,206 |
| 5,432 |
| 169.5 |
| |||
Product revenue |
| $ | 159,793 |
| $ | 85,345 |
| $ | 74,448 |
| 87.2 |
|
|
| Year ended December 31, |
| Change in |
|
|
| ||
|
| 2014 |
| 2013 |
| Volume |
| Change as % |
|
|
| (audited) |
| (audited) |
|
|
|
|
|
Net sales volumes: |
|
|
|
|
|
|
|
|
|
Oil (Bbls) |
| 1,675,078 |
| 827,432 |
| 847,646 |
| 102.4 |
|
Natural gas (Mcf) |
| 1,803,000 |
| 934,200 |
| 868,800 |
| 93.0 |
|
NGL (Bbls) |
| 267,952 |
| 95,821 |
| 172,131 |
| 179.6 |
|
Oil equivalent (Boe) |
| 2,243,529 |
| 1,078,953 |
| 1,164,576 |
| 107.9 |
|
Average daily production (Boe/d) |
| 6,147 |
| 2,956 |
| 3,191 |
| 107.9 |
|
Barrel of oil equivalent (Boe) and average net daily production (Boe/d). Sales volume increased by 1,164,576 Boe (107.9%) to 2,243,529 Boe (6,147 Boe/d) for the year ended December 31, 2014 compared to 1,078,953 Boe (2,956 Boe/d) for the prior year due to successfully bringing online 88 gross (50.1 net) producing wells primarily in the Eagle Ford and Mississippian/Woodford Formations.
The Eagle Ford contributed 4,187 Boe/d (68.1%) of total sales volume during the year ended December 31, 2014 compared to 1,371 Boe/d (46.4%) during the prior year. Mississippian/Woodford contributed 1,433 Boe/d (23.2%) of total sales volume during the year ended December 31, 2014 compared to 503 Boe/d (17.0%) during the prior year. Our sales volume is oil-weighted, with oil representing 75% and 77% of total sales volume for the year ended December 31, 2014 and 2013, respectively.
Oil sales. Oil sales increased by $65.6 million (82.7%) to $145.0 million for the year ended December 31, 2014 from $79.4 million for the prior year. The increase in oil revenues was the result of increased oil production volumes ($81.3 million) offset by a decrease in product pricing ($15.7 million). Oil production volumes increased 102.4% to 1,675,078 Bbls for the year ended December 31, 2014 compared to 827,432 Bbls for the prior year. The average price we realized on the sale of our oil decreased by 9.8% to $86.56 per Bbl for the year ended December 31, 2014 from $95.92 per Bbl for the prior year.
Natural gas sales. Natural gas sales increased by $3.4 million (122.1%) to $6.2 million for the year ended December 31, 2014 from $2.8 million for the prior year. The increase in natural gas revenues was primarily the result of increased production volumes ($2.6 million) and improved product pricing ($0.8 million). Natural gas production volumes increased 868,800 Mcf (93.0%) to 1,803,000 Mcf for the year ended December 31, 2014 compared to 934,200 Mcf for the prior year. The average price we realized on the sale of our natural gas increased by 15.1% to $3.42 per Mcf for the year ended December 31, 2014 from $2.97 per Mcf for the prior year.
NGL sales. NGL sales increased by $5.4 million (169.5%) to $8.6 million for the year ended December 31, 2014 from $3.2 million for the same period in prior year. The increase in NGL revenues was primarily the result of increased production volumes in the Eagle Ford and the Mississippian/Williston. NGL production volumes increased 172,131 Bbls (179.6%) to 267,952 Bbls for the year ended December 31, 2014 compared to 95,821 Bbls for the prior year. The average price we realized on the sale of our natural gas liquids decreased by 3.6% to $32.24 per Bbl for the year ended December 31, 2014 from $33.45 per Bbl for the prior year.
|
| Year ended |
|
|
|
|
| |||||
Selected per Boe metrics |
| 2014 |
| 2013 |
| Change |
| Percent |
| |||
|
| (audited) |
| (audited) |
|
|
|
|
| |||
Total oil and natural gas revenues, before derivative settlements |
| $ | 71.22 |
| $ | 79.10 |
| $ | (7.88 | ) | (10.0 | ) |
Lease operating expenses |
| (6.03 | ) | (11.23 | ) | (5.21 | ) | (46.4 | ) | |||
Production taxes |
| (3.10 | ) | (5.80 | ) | (2.70 | ) | (46.5 | ) | |||
Lease operating and production tax expenses |
| (9.13 | ) | (17.03 | ) | (7.90 | ) | (46.4 | ) | |||
Depreciation and amortization |
| (38.15 | ) | (33.57 | ) | 4.58 |
| 13.6 |
| |||
General and administrative expense |
| (6.92 | ) | (14.18 | ) | (7.26 | ) | (51.2 | ) | |||
Total profit margin |
| 17.02 |
| 14.32 |
| 2.70 |
| 18.9 |
| |||
Lease operating expenses. Our lease operating expenses (LOE) increased by $1.4 million (11.6%) to $13.5 million for the year ended December 31, 2014 from $12.1 million for the same period in the prior year but decreased $5.21 per Boe to $6.03 per Boe from $11.23 per Boe. The decrease in LOE per Boe is primarily due to economies of scale and the implementation of several cost saving initiatives in our field operations such as replacing contract lease operators with Company employees and reducing total field head count per well.
Production taxes. Our production taxes increased by $0.7 million (11.2%) to $7.0 million for the year ended December 31, 2014 from $6.3 million for the prior year but as a percent of revenue decreased 290 basis points to 4.4% from 7.3%. The decrease in production taxes as a percent of revenue is the result of the sale of our North Dakota and Colorado assets, which are higher production tax rate jurisdictions, and increasing our investment in Texas and Oklahoma, which are lower production tax rate jurisdictions, as well as an adjustment for lower than anticipated ad valorem taxes.
Depreciation and amortization expense, including depletion. Our depreciation and amortization expense increased by $49.4 million (136.3%) to $85.6 million for the year ended December 31, 2014 from $36.2 million for the prior year and increased $4.58 per Boe to $38.15 per Boe from $33.57 per Boe. The increase reflects our increase in production (107.9%), an increase in our asset base subject to amortization as a result of our acquisition and development activity, and increased completion costs caused by high-demand for completion services and a shortage of trucks able to transport frac sand and resultant higher trucking rates.
General and administrative expenses. General and administrative expenses are comprised of employee benefits expense, including salaries and wages, and administrative expenses. Employee benefits expense decreased by $1.1 million (19.0%) to $5.0 million for the year ended December 31, 2014 from $6.1 million for the year ended December 31, 2013. This decrease is primarily a result of the capitalization of $4.5 million, an increase of amounts capitalized in 2013 by $1.6 million, in overhead costs, including salaries and wages, directly attributable to the exploration, acquisition and development of oil and gas properties. Included in the employee benefits expense for the fiscal year ended December 31, 2014 is stock-based compensation expense of $1.9 million for options issued to officers, management and employees, an increase of $0.3 million (20.4%) compared to $1.6 million for the twelve-month period ended December 31, 2013.
Administrative expense increased by $1.3 million (15.2%) to $10.5 million for the year ended December 31, 2014 from $9.2 million for the year ended December 31, 2013. This increase was primarily due to an increase in general legal and professional fees.
General and administrative expenses per Boe decreased by 51.2% to $6.92 for the year ended December 31, 2014 as compared to $14.18 per Boe for the prior year. The decrease in general and administrative expenses per Boe is driven by increased production levels diluting fixed general and administrative costs.
Impairment expense. We recorded impairment expense of $71.2 million for the year ended December 31, 2014 on the Company’s development and production assets that are located in the Mississippian/Williston and the Eagle Ford as the recoverable amount was less than the carrying value primarily as a result of lower commodity pricing. No impairment was necessary on the Company’s exploration and evaluation assets. See Note 17 of the Notes to the Consolidated Financial Statements for further discussion.
Exploration expense. We incurred exploration expense of $10.9 million for the year ended December 31, 2014 on three gross (and net) unsuccessful exploratory wells in the Mississippian/Williston. The Company did not drill any unsuccessful exploratory wells in the prior year.
Finance costs, net of interest income and amounts capitalized. Finance costs, net of amounts capitalized to exploration and development, increased by $0.7 million to $0.5 million for the year ended December 31, 2014 as compared to net interest income of $0.2 million in the prior year. The increase primarily relates to an increase in amortization of deferred financing fees and additional interest incurred on undrawn funds.
Gain/(loss) on commodity hedging. The net gain (loss) on derivative financial instruments changed by $11.6 million to an $11.0 million gain for the year ended December 31, 2014 as compared to the prior year. The gain on commodity hedging consisted of $9.7 million of unrealized gains on commodity derivative contracts and $1.3 million of realized gains on commodity derivative contracts.
The Company had the following open contracts at December 31, 2014:
Contract Type |
| Counterparty |
| Basis |
| Quantity/mo |
| Strike Price |
| Term |
Collar |
| Wells Fargo |
| WTI |
| 2,000 BBL |
| $75.00/$98.65 |
| 1/1/15 –12/31/15 |
Collar |
| Shell Trading US |
| LLS |
| 3,000 BBL |
| $85.00/$101.05 |
| 1/1/15 –12/31/15 |
Collar |
| Wells Fargo |
| WTI |
| 2,000 BBL |
| $80.00/$97.00 |
| 1/1/15 –12/31/15 |
Collar |
| Wells Fargo |
| WTI |
| 1,000 BBL |
| $80.00/$94.94 |
| 1/1/15 –12/31/15 |
Swap |
| Wells Fargo |
| LLS |
| 2,000 BBL |
| $91.65 |
| 1/1/15 –12/31/15 |
Swap |
| Shell Trading US |
| LLS |
| 5,000 BBL |
| $98.05 |
| 1/1/15 –6/30/15 |
Swap |
| Shell Trading US |
| LLS |
| 3,000 BBL |
| $94.10 |
| 7/1/15 –12/31/15 |
Swap |
| Wells Fargo |
| WTI |
| 2,000 BBL |
| $95.08 |
| 1/1/15 –12/31/15 |
Swap |
| Wells Fargo |
| LLS |
| 2,000 BBL |
| $97.74 |
| 1/1/15 –12/31/15 |
Swap |
| Shell Trading US |
| LLS |
| 5,000 BBL |
| $100.70 |
| 1/1/15 –6/30/15 |
Swap |
| Shell Trading US |
| LLS |
| 5,000 BBL |
| $94.10 |
| 1/1/16 –12/31/16 |
Swap |
| Shell Trading US |
| HH |
| 20,000 MCF |
| $4.14 |
| 1/1/15 –12/31/15 |
Income taxes. The components of our provision for income taxes are as follows:
|
| Year ended |
| ||||
(in US$000s) |
| 2014 |
| 2013 |
| ||
|
| (audited) |
| (audited) |
| ||
Current tax (expense)/benefit |
| $ | (17 | ) | $ | 21,398 |
|
Deferred tax benefit/(expense) |
| 858 |
| (26,965 | ) | ||
Total income tax benefit/(expense) |
| $ | 841 |
| $ | (5,567 | ) |
Combined federal and state effective tax rate |
| (5.8 | )% | 25.9 | % | ||
Our combined federal and state effective tax rates differ from our statutory tax rate of 30% primarily due to U.S. federal and state tax rates, non-deductible expenses and the recognition of previously unrecognized tax losses. See Note 7 in the Notes to the Consolidated Financial Statements of this report for further information regarding our income taxes.
Profit attributable to owners of Sundance (or net income). Profit attributable to our owners (or net income after tax) decreased slightly by $0.6 million (3.9%) to net income of $15.3 million for the year ended December 31, 2014 from net income of $15.9 million for the year ended December 31, 2013, for the reason discussed above.
Adjusted EBITDAX. Adjusted EBITDAX increased by $73.8 million (140.3%) to $126.4 million for the year ended December 31, 2014 from $52.6 million for the year ended December 31, 2013. The overall increase in Adjusted EBITDAX was primarily driven by our production and revenue growth, while decreasing our per Boe amounts for LOE and production taxes.
Year Ended December 31, 2013 Compared to the Year Ended December 31, 2012
Revenues and Production. The following table provides the components of our revenues for the years ended December 31, 2013 and 2012, as well as each period’s respective sales volumes:
|
| Year ended |
|
|
|
|
| |||||
|
| 2013 |
| 2012 |
| Change in $ |
| Change as % |
| |||
|
| (audited) |
| (unaudited) |
|
|
|
|
| |||
Revenue (In $ ‘000s) |
|
|
|
|
|
|
|
|
| |||
Oil sales |
| $ | 79,365 |
| $ | 33,743 |
| $ | 45,622 |
| 135.2 | % |
Natural gas sales |
| 2,774 |
| 2,029 |
| 745 |
| 36.7 | % | |||
NGL(1) |
| 3,206 |
| — |
| 3,206 |
| 100.0 | % | |||
Product revenue |
| $ | 85,345 |
| $ | 35,772 |
| $ | 49,573 |
| 138.9 | % |
|
| Year ended December 31, |
| Change in |
|
|
| ||
|
| 2013 |
| 2012 |
| Volume |
| Change as % |
|
|
| (audited) |
| (unaudited) |
|
|
|
|
|
Net sales volumes: |
|
|
|
|
|
|
|
|
|
Oil (Bbls) |
| 827,432 |
| 397,913 |
| 429,519 |
| 107.9 | % |
Natural gas (Mcf) |
| 934,200 |
| 505,543 |
| 428,657 |
| 84.8 | % |
NGL (Bbls) (1) |
| 95,821 |
| — |
| 95,821 |
| 100.0 | % |
Oil equivalent (Boe) |
| 1,078,953 |
| 482,170 |
| 596,783 |
| 123.8 | % |
(1) Prior to the year ended December 31, 2013, our NGL sales were insignificant as compared to our overall gas sales and as such, were included in our natural gas sales.
Barrel of oil equivalent (Boe) and average net daily production (Boe/d). Production increased by 596,783 Boe (123.8%) to 1,078,953 Boe (2,956 Boe/d) for the year ended December 31, 2013 compared to 482,170 Boe (1,321 Boe/d) for the year ended December 31, 2012. The increase in production volumes was primarily due to a net increase from 186 gross (49.4 net) producing wells to 213 gross (99.9 net) wells. This higher net producing well count was achieved through execution of our strategy to divest lower working interest wells and increase operated drilling activity and production through the Texon merger. Our production is oil-weighted, with oil representing 77% and 83% of total production for the years ended December 31, 2013 and 2012, respectively.
Oil sales. Oil sales increased by $45.6 million (135.2%) to $79.4 million for the fiscal year ended December 31, 2013 from $33.7 million for the year ended December 31, 2012. Increase in oil revenues was the result of both increased oil production volumes and improved product pricing. Oil production volumes increased 107.9% to 827,432 Bbls for the year ended December 31, 2013 compared to 397,913 Bbls for the year ended December 31, 2012. The average price we realized on the sale of our oil increased by 13.1% to $95.92 per Bbl for the year ended December 31, 2013 from $84.80 per Bbl for the year ended December 31, 2012.
Natural gas sales. Natural gas sales increased by $0.7 million (36.7%) to $2.8 million for the year ended December 31, 2013 from $2.0 million for the ended December 31, 2012. Increase in natural gas revenues was primarily the result of increased production volumes. Natural gas production volumes increased 428,657 Mcf (84.8%) to 934,200 Mcf for the year ended December 31, 2013 compared to 505,543 Mcf for the ended December 31, 2012. The average price we realized on the sale of our natural gas decreased by 26.0% to $2.97 per Mcf for the year ended December 31, 2013 from $4.01 per Mcf for the year ended December 31, 2012.
NGL sales. Prior to the year ended December 31, 2013, our NGL sales were insignificant as compared to our overall gas sales and as such, were included in our natural gas sales.
|
| Year ended |
|
|
|
|
| |||||
Selected per Boe metrics |
| 2013 |
| 2012 |
| Change |
| Percent |
| |||
|
| (audited) |
| (unaudited) |
|
|
|
|
| |||
Total oil and natural gas revenues |
| $ | 79.10 |
| $ | 74.19 |
| $ | 4.91 |
| 6.6 | % |
Lease operating expenses |
| 11.23 |
| 7.89 |
| 3.34 |
| 42.3 | % | |||
Production taxes |
| 5.80 |
| 7.98 |
| (2.18 | ) | (27.3 | )% | |||
Lease operating and production tax expenses |
| 17.03 |
| 15.87 |
| 1.16 |
| 7.3 | % | |||
Depreciation and amortization |
| 33.57 |
| 26.69 |
| 6.88 |
| 25.8 | % | |||
General and administrative expense |
| 14.18 |
| 19.41 |
| (5.23 | ) | (26.9 | )% | |||
Lease operating expenses. Our lease operating expenses (“LOE”) increased by $8.3 million (218.4%) to $12.1 million for the year ended December 31, 2013 from $3.8 million for the year ended December 31, 2012. The increase in LOE was primarily due to additional production (increased 123.8% over the comparable period in 2012).
Production taxes. Our production taxes increased by $2.5 million (62.8%) to $6.3 million for the year ended December 31, 2013 from $3.8 million for the year ended December 31, 2012. The increase was less than the 138.9% increase in oil, natural gas and NGL revenue, and production taxes per Boe declined by $2.18 (27.3%), due to divesting the majority of our production in North Dakota, which has a 10.6% effective production tax rate compared to Texas, Oklahoma and Colorado, which have effective production tax rates of 6.8%, 1.3%, and 10.2%, respectively.
Depreciation and amortization expense, including depletion. Our depreciation and amortization expense increased by $23.4 million (181.5%) to $36.2 million for the year ended December 31, 2013 from $12.9 million for the year ended December 31, 2012. The increase reflects our increase in production (123.8%) and an increase in our asset base, subject to amortization as a result of our drilling acquisition and activity, and our Texon acquisition during 2013. Depreciation and amortization per Boe increased by approximately 25.8% to $33.57.
General and administrative expenses. General and administrative expenses are comprised of employee benefits expense, including salaries and wages, and administrative expenses. Employee benefits expense increased by $1.1 million (22.0%) to $6.1 million for the year ended December 31, 2013 from $5.0 million for the year ended December 31, 2012. Included in the employee benefits expense for the fiscal year ended December 31, 2013 in accordance with IFRS 2 Share-based Payment is a stock-based compensation charge of $1.6 million for options issued to officers, management and employees, an increase of $0.4 million (30.6%) compared to $1.2 million for the twelve-month period ended December 31, 2012. Excluding share-based stock compensation, employee benefits increased $0.7 million for year ended December 31, 2013, compared to the
year ended December 31, 2012. This increase was primarily driven by an increased number of employees that was necessary to support the execution of our change in strategy. As of December 31, 2013, we had 47 employees, an increase of 20 employees (74.1%) from December 31, 2012.
Administrative expense increased by $4.8 million (111.8%) to $9.1 million for the year ended December 31, 2013 from $4.3 million for the year ended December 31, 2012. Included in administrative expenses were $0.5 million of costs related to the Texon acquisition and $2.1 million of costs related to our proposed initial public offering, which was subsequently abandoned, incurred in the year ended December 31, 2013. Excluding acquisition and offering-related expense, administrative expenses increased $2.2 million for the year ended December 31, 2013. This increase was primarily due to an increase in the level of our activity and number of employees.
General and administrative expenses per Boe decreased by 26.9% as compared to the prior year, primarily related to a change in policy, effective January 1, 2013, whereby the overhead costs, including salaries, wages, benefits and consultant fees, directly attributable to the exploration, acquisition and development of oil and gas properties are capitalized. Total amount capitalized for the year ended December 31, 2013 was $2.3 million. Prior to 2013, overhead amounts allowable for capitalization were insignificant and therefore, we did not capitalize overhead costs in the comparable period in 2012.
Finance costs, net of interest income. Finance costs, net of interest income and amounts capitalized, decreased by $1.1 million (147.1%), resulting in net interest income of $0.4 million for the fiscal year ended December 31, 2013 from a net cost of $0.7 million for the twelve-month period ended December 31, 2012. The change relates to the capitalization of $1.3 million of interest to our oil and natural gas properties related to interest charges incurred. Prior to 2013, these interest amounts subject to capitalization were insignificant and therefore, we did not capitalize interest in the comparable period in 2012.
Gain/(loss) on commodity hedging. The gain/(loss) on commodity hedging changed by $1.7 million to a $0.6 million loss for the year ended December 31, 2013 compared to a $1.1 million gain for the year ended December 31, 2012.
Profit attributable to owners of Sundance (or net income). Our profit attributable to owners of Sundance (or net income after tax) decreased by $65.1 million (80.3%) to net income of $15.9 million for the year ended December 31, 2013 from net income of $81.1 million for the year ended December 31, 2012, which included a pre-tax gain on the sale of our South Antelope prospect of $122.5 million. Excluding the gain on sale, our profit attributable to owners increased $57.4 million.
Adjusted EBITDAX. Adjusted EBITDAX increased by $31.9 million (154.1%) to $52.6 million for the year ended December 31, 2013 from $20.7 million for the year ended December 31, 2012. The overall increase in Adjusted EBITDAX was primarily driven by our production and revenue growth.
Six-Month Period Ended December 31, 2012 Compared to Six-Month Period Ended December 31, 2011
Revenues and Production. The following table provides the components of our revenues for the six-month periods ended December 31, 2012 and 2011, as well as each period’s respective sales volumes:
| Six-month period |
|
|
|
|
| ||||||
|
| 2012 |
| 2011 |
| Change in $ |
| Change as % |
| |||
|
| (audited) |
| (unaudited) |
|
|
|
|
| |||
Revenues (In $ ‘000s) |
|
|
|
|
|
|
|
|
| |||
Oil sales |
| $ | 16,790 |
| $ | 11,012 |
| $ | 5,778 |
| 52.5 | % |
Natural gas sales |
| 934 |
| 727 |
| 207 |
| 28.5 | % | |||
Total revenues |
| $ | 17,724 |
| $ | 11,739 |
| $ | 5,985 |
| 51.0 | % |
|
| Six-month period |
| Change in |
|
|
| ||
|
| 2012 |
| 2011 |
| Volume |
| Change as % |
|
|
| (audited) |
| (unaudited) |
|
|
|
|
|
Net sales volumes: |
|
|
|
|
|
|
|
|
|
Oil (Bbl) |
| 195,498 |
| 135,234 |
| 60,264 |
| 44.6 | % |
Natural gas (Mcf) |
| 260,435 |
| 124,305 |
| 136,130 |
| 109.5 | % |
Oil equivalent (Boe) |
| 238,904 |
| 155,952 |
| 82,952 |
| 53.2 | % |
Barrel of oil equivalent (Boe) and average net daily production (Boe/d). Production increased by 82,952 Boe (53.2%) to 238,904 Boe (1,298 Boe/d) for the six-month period ended December 31, 2012 compared to 155,952 Boe (848 Boe/d) for the same period in 2011. The producing well count increased by 44 gross (35.4 net) to 186 gross (49.4 net) from 142 gross (14.0 net). The increase in production was primarily due to these new producing wells. In September 2012, we disposed of 42 gross (4.5 net) low working interest South Antelope field wells. We also disposed of 4 gross (0.6 net) low working interest Pawnee wells. This higher net producing well count was achieved through execution of our strategy to divest lower working interest wells and increase operated drilling activity and production. Production was not impacted by the December 2012 acquisition of 22 gross (22.0 net) producing wells in the Denver-Julesburg as these were acquired at the end of the period. Our production is oil-concentrated, with oil comprising 82% and 87% of total production for the six months ended December 31, 2012 and 2011, respectively.
Oil sales. Oil sales increased by $5.8 million (52.5%) to $16.8 million for the six-month period ended December 31, 2012 from $11.0 million for the same period of 2011. Favorable revenues were the result of both increased oil production volumes and improved product pricing. Oil production volumes increased 44.6% to 195,498 Bbls for the six-month period ended December 31, 2012 compared to 135,234 Bbls for the same period in 2011. The average price realized on the sale of our oil increased by 5.5% to $85.88 per Bbl for the six-month period ended December 31, 2012 from $81.43 per Bbl for the same six-month period in 2011.
Natural gas sales. Natural gas sales increased by $0.2 million (28.5%) to $0.9 million for the six-month period ended December 31, 2012 from $0.7 million for the same period of 2011. Increased natural gas production volumes more than offset price declines between the periods. Natural gas production volumes increased 136,130 Mcf (109.5%) to 260,435 Mcf for the six-month period ended December 31, 2012 compared to 124,305 Mcf for the same period in 2011. The average price we realized on the sale of our natural gas declined by 38.5% to $3.59 per Mcf for the six-month period ended December 31, 2012 from $5.84 per Mcf for the same period of 2011.
|
| Six-month period |
|
|
|
|
| |||||
Selected Per Boe Metrics |
| 2012 |
| 2011 |
| Change |
| Percent |
| |||
|
| (audited) |
| (unaudited) |
|
|
|
|
| |||
Total oil and natural gas revenues |
| $ | 74.19 |
| $ | 75.27 |
| $ | (1.08 | ) | (1.4 | )% |
Lease operating expenses |
| 9.19 |
| 9.56 |
| (0.37 | ) | (3.9 | )% | |||
Production taxes |
| 7.90 |
| 8.29 |
| (0.39 | ) | (4.7 | )% | |||
Lease operating and production tax expenses |
| 17.09 |
| 17.85 |
| (0.76 | ) | (4.3 | )% | |||
Depreciation and amortization expense |
| 25.60 |
| 27.94 |
| (2.34 | ) | (8.4 | )% | |||
General and administrative expense |
| 24.32 |
| 21.26 |
| 3.06 |
| 14.4 | % | |||
Lease operating expenses. Our LOE increased by $0.7 million (47.2%) to $2.2 million for the six-month period ended December 31, 2012 from $1.5 million for the same period in 2011. This increase was primarily due to additional production, which increased 53.2% over the same periods. LOE per Boe slightly decreased.
Production taxes. The increase in the production tax expense of $0.6 million (45.8%) was consistent with that of the increase in oil and natural gas revenue (51.0%) for the six-month period ended December 31, 2012 compared to same period in 2011. Production tax per Boe slightly decreased.
Depreciation and amortization expense, including depletion. Our depreciation and amortization expense increased by $1.8 million (40.3%) to $6.1 million for the six-month period ended December 31, 2012 from $4.4 million for the same period in 2011. The increase reflects our increase in production (53.2%) and an increase in our asset base subject to amortization as a result of our drilling activity during 2012. Depreciation and amortization per Boe decreased by approximately 8.4% to $25.60.
General and administrative expenses. General and administrative expenses are comprised of employee benefits expense (including salaries and wages) and administrative expenses. Employee benefits expense increased by $0.7 million (34.4%) to $2.8 million for the six-month period ended December 31, 2012 from $2.1 million for the same period in 2011. Included in the employee benefits expense for the six-month period ended December 31, 2012 in accordance with IFRS 2 Share-Based Payment is a stock-based compensation charge of $0.8 million for options issued to officers and employees, an increase of $0.4 million (87.5%) compared to $0.4 million for the same period in 2011. Excluding stock-based compensation, employee benefits expense increased by $0.3 million (19.9%) to $2.0 million for the six-month period ended December 31, 2012 from $1.6 million for the same period in 2011. This increase was primarily driven by higher head count that was necessary
to support the execution of our change in strategy. As of December 31, 2012, we had 25 employees, an increase of 9 employees (56%) from December 31, 2011.
Administrative expense increased by $1.8 million (150.0%) to $3.0 million for the six-month period ended December 31, 2012 from $1.2 million for the same period in 2011. Included in administrative expenses were $0.7 million of costs related to the Texon acquisition incurred in the six-month period ended December 31, 2012. Excluding acquisition related expenses, administrative expenses increased $1.1 million (86.4%) for the six-month period ended December 31, 2012. This increase was primarily due to an increase in the level of our activity and number of employees.
General and administrative expense per Boe increased by 14.4% as we increased our staffing levels to support the growth of our drilling program and operated production that we expected and have realized through December 31, 2012.
Gain on sale of non-current assets. Gain on sale of non-current assets was $122.3 million for the six-month period ended December 31, 2012 compared to $0.5 million for the same period in 2011. Substantially all of the gain on sale for the six-month period ended December 31, 2012 was the result of the sale of non-operated wells and acreage in properties located in the South Antelope field for $172 million.
Finance costs, net of interest income. Finance costs, net of interest income, increased by $0.8 million to $0.6 million for the six-month period ended December 31, 2012 from $0.2 million of interest income for the same period in 2011. The increase related to $0.3 million of interest expense on our outstanding debt under our former Bank of Oklahoma credit facility, and the $0.3 million write-off of capitalized deferred loan costs related to the extinguishment of the Bank of Oklahoma credit facility in December 2012. The write-off was the result of our refinancing such debt with Wells Fargo Bank, N.A.
Gain/(loss) on commodity hedging. The gain/(loss) on commodity hedging changed by $0.8 million to a $0.6 million loss for the six-month period ended December 31, 2012 compared to a $0.2 million gain for the same period in 2011.
Income tax expense. Income tax expense for the six-month period ended December 31, 2012 was $46.6 million compared to $0.7 million for the same period in 2011. Substantially all of the income tax expense in the six-month period ended December 31, 2012 was related to the gain on the sale of our interest in properties located in the South Antelope field. The income tax expense related to the gain on the South Antelope field sale has been deferred through qualifying Section 1031 like-kind exchanges and the use of income tax credits generated by our intangible drilling costs. Our current portion of our deferred income tax liability is insignificant relative to its total deferred income tax liability.
Profit attributable to owners of Sundance (or net income). Our net income increased by $75.0 million to $76.2 million for the six-month period ended December 31, 2012 from $1.2 million for the same period in 2011. As more fully described above, the increase was primarily related to the gain on sale of certain oil and natural gas properties, net of income tax expense.
Adjusted EBITDAX. Adjusted EBITDAX increased by $3.7 million (64.1%) to $9.2 million for the six-month period ended December 31, 2012 from $5.6 million for the same period in 2011. This increase in profitability was primarily driven by our increased production and improved product pricing.
B. Liquidity and Capital Resources
Our primary sources of liquidity to date have been proceeds from strategic dispositions of low-interest non-operated oil and natural gas properties, private placements of ordinary shares, borrowings under our credit facilities and cash flows from operations. Our primary use of capital has been for the acquisition and development of oil and natural gas properties. Our future ability to grow our reserves and production will be highly dependent on the capital resources available to us. On May 14, 2015, we and our wholly-owned subsidiary Sundance Energy, Inc. entered into the Credit Agreement with Morgan Stanley Energy Capital, Inc., as administrative agent and the lenders from time to time party thereto, which provides for our $300 million Revolving Facility and $125 million Term Loans, with an accordion feature providing for additional term loans of up to $50 million, subject to certain conditions The Revolving Facility is subject to a borrowing base, which has been set initially at $75 million. At closing on May 14, 2015, $25 million was drawn on the Revolving Facility and $125 million of Term Loans were funded. The Revolving Facility has a five year term and the Term Loans have a 5 ½ year term.
The Revolving Facility and Term Loans refinanced the Company’s credit facilities with Wells Fargo Bank, N.A. and Wells Fargo Energy Capital, Inc., respectively. At closing, the Company used $145.0 million of the proceeds to pay off its previous credit facilities, which were fully paid-off. Approximately $1.1 million of deferred financing fees related to the previous credit facilities were written off due to the refinance.
Our 2015 capital budget is approximately $70 million to $90 million, which we intend to use toward the development of our oil and natural gas projects, with approximately $5 million towards exploration and evaluation. We believe that our internally generated cash flows and expected future availability under our Revolving Facility and Term Loans will be sufficient to fund our operations and planned capital expenditures for at least the next 12 months. We may also use other sources of capital, including the issuance of debt or equity securities, to fund acquisitions or maintain our financial flexibility.
The amount, timing and allocation of these and other future expenditures is largely discretionary. As a result, the amount of funds devoted to any particular activity may increase or decrease significantly, depending on available opportunities, timing of projects and market conditions. We expect that in the future our commodity derivative positions will help us stabilize a portion of our expected cash flows from operations despite potential declines in the price of oil and natural gas. However, should commodity prices decline for an extended period of time or the capital/credit markets become constrained, the borrowing capacity under our credit agreements could be adversely affected. In the event of a reduction in the borrowing base under our credit agreements, we may be required to prepay some or all of our indebtedness, which would adversely affect our capital expenditure program.
Cash Flows
Our cash flows for the years ended December 31, 2014 and 2013, for the six-month period ended December 31, 2012, and for the fiscal year ended June 30, 2012 are as follows:
|
| Year ended December 31, |
| Six-month |
| Year ended |
| ||||||
(In $ ‘000s) |
| 2014 |
| 2013 |
| 2012 |
| 2012 |
| ||||
|
| (audited) |
| (audited) |
| (audited) |
| (audited) |
| ||||
Financial Measures: |
|
|
|
|
|
|
|
|
| ||||
Net cash provided by operating activities |
| $ | 128,087 |
| $ | 62,646 |
| $ | 9,386 |
| $ | 11,832 |
|
Net cash (used in) provided by investing activities |
| (323,235 | ) | (164,355 | ) | 114,571 |
| (36,149 | ) | ||||
Net cash provided by financing activities |
| 167,595 |
| 44,455 |
| 14,846 |
| 14,734 |
| ||||
Cash and cash equivalents |
| 69,217 |
| 96,871 |
| 154,110 |
| 15,328 |
| ||||
Payments for development expenditure |
| (361,950 | ) | (154,700 | ) | (32,551 | ) | (34,833 | ) | ||||
Payments for exploration expenditure |
| (39,616 | ) | (20,006 | ) | (8,031 | ) | (5,685 | ) | ||||
Acquisitions, net of acquired cash |
| (35,606 | ) | (27,273 | ) | (11,470 | ) | — |
| ||||
Proceeds from the sale of non-current assets |
| 115,284 |
| 37,848 |
| 173,822 |
| 4,679 |
| ||||
Cash flows provided by operating activities
Net cash provided by operating activities for the year ended December 31, 2014 increased 104.5% to $128.1 million compared to the prior year. This increase was primarily due to receipts from sales increasing $85.7 million, or 101.2%, to $170.4 million, while keeping payments to suppliers and employees relatively stable with an increase of $8.2 million, or 37.7%, to $30.0 million.
Net cash provided by operating activities for the fiscal year ended December 31, 2013 was $62.6 million compared to $19.1 million provided by operating activities for the twelve-month period ended December 31, 2012, an increase of $43.5 million (228%). The increase in cash flows provided by operating activities resulted primarily from an increase in receipts from oil, natural gas and natural gas liquid sales of $60.3 million, offset by an increase in payments to suppliers and employees of $15.8 million.
Net cash provided by operating activities was $9.4 million for the six-month period ended December 31, 2012, compared to $2.1 million provided by operating activities for the six-month period ended December 31, 2011, an increase of $7.3 million (348.0%). The increase in cash flows provided by operating activities resulted primarily from an increase receipts from oil, natural gas, and natural gas liquid sales of $3.4 million and decreased payments to suppliers and employees of $2.9 million.
Cash flows provided by (used in) investing activities
Net cash used in investing activities for the year ended December 31, 2014 increased $158.9 million, or 96.7%, to $323.2 million. This increase is due to successful implementation of the Company’s strategy to develop and grow the reserves from our high working interest, repeatable resource plays, primarily in the Eagle Ford. Due to funding available to the Company through asset sales, capital raises and credit facilities, the Company was able to accelerate a portion of its 2015
drilling program into 2014. However, due to the reduction in crude oil prices in the fourth quarter of 2014 and continuing into 2015, we plan to scale back our drilling program to concentrate on our limited drilling obligations to hold Eagle Ford acreage during 2015.
Net cash used in investing activities for the fiscal year ended December 31, 2013 was $164.4 million compared to $93.4 million provided by investing activities for the twelve-month period ended December 31, 2012, a change of $257.7 million (276%). Our payments for development and exploration expenditures increased by $102.0 million and $6.9 million, respectively, for the fiscal year ended December 31, 2013 compared to the same period in 2012. Net cash consideration paid for the Texon merger was $26.3 million during the fiscal year ended December 31, 2013; there were no comparable transactions during the twelve-month period ended December 31, 2012. Proceeds received from the sales of non-current assets for the fiscal year ended December 31, 2013 decreased by $140.2 million to $37.8 million as compared to $178.0 million for the twelve-month period ended December 31, 2012.
Expenditures for development of oil and natural gas properties are the primary use of our capital resources. Net cash provided by investing activities for the six-month period ended December 31, 2012 was $114.6 million compared to $14.9 million cash used in investing activities for the same period in 2011. Sales of non-current assets for the six-month period ended December 31, 2012 were $173.8 million compared to $0.5 million for the same period in 2011. Excluding sales of non-current assets, net cash used in investing activities for the six-month period ended December 31, 2012 was $59.3 million compared to $15.4 million for the for the same period in 2011, an increase of $43.9 million. Our payments for development and exploration expenditures increased by $17.9 million and $7.4 million, respectively, for the six-month period ended December 31, 2012 compared to the same period in 2011. In addition, we had $11.5 million of payments for the acquisition of oil and natural gas properties in the Denver-Julesburg and $6.3 million of related payments to establish escrows for drilling commitments.
Cash flows provided by (used in) financing activities
Net cash provided by financing activities for the year ended December 31, 2014 increased $123.1 million, or 277.0%, to $167.6 million. This increase is a result of the increased availability and draws under the Company’s credit facilities and proceeds received in a private placement of shares. In February 2014, the Company completed a private placement in which we sold 84.2 million ordinary shares at A$0.95 per share, resulting in net proceeds of approximately $68.4 million. The first tranche of 63.7 million shares was issued in March 2014 and the second tranche of 20.5 million shares was issued in April 2014.
Net cash provided by financing activities for the fiscal year ended December 31, 2013 was $44.5 million compared to $29.7 million provided by financing activities for the twelve-month period ended December 31, 2012, an increase of $14.8 million (50%). Our primary source of cash provided by financing activities for the fiscal year ended December 31, 2013 was proceeds from the issuance of shares of $48.2 million, reduced by associated capital raising costs of $2.6 million, and by acquisition costs from the Texon merger of $0.5 million; there were no comparable transactions during the twelve-month period ended December 31, 2012. Our primary source of cash provided by financing activities for the twelve-month period ended December 31, 2012 was net borrowings on our credit facility with Wells Fargo Bank, N.A. in the amount of $30.0 million; there were no comparable transactions during the fiscal year ended December 31, 2013.
Net cash flow provided by financing activities for the six-month period ended December 31, 2012 was $14.8 million compared to net cash flow used in financing activities of $0.1 million for the same period in 2011. Our primary source of the cash provided by financing activities for the six- month period ended December 31, 2012 related to net borrowings on our credit facility with the Bank of Oklahoma in the amount of $15.0 million.
Credit Facilities
Wells Fargo Senior Credit Facility. On December 31, 2012, we entered into our senior credit facility with Wells Fargo Bank, N.A. (“Senior Credit Facility”). Our Wells Fargo Senior Credit Facility provided us with a $300 million facility with a borrowing base of $110 million as of December 31, 2014. As of December 31, 2014, there was $95 million outstanding under our Senior Credit Facility.
Junior Credit Facility. In August 2013, we entered into our junior credit facility with Wells Fargo Energy Capital, Inc., as the administrative agent, which provides for term loans to be made to us in a series of draws up to $100 million (“Junior Credit Facility”). As at December 31, 2014, the borrowing capacity under the Wells Fargo Junior Credit Facility was $35 million and the Company had $35 million outstanding on the Wells Fargo Junior Credit Facility.
Both our Senior Credit Facility and Junior Credit Facility were refinanced with our new Revolving Facility and Term Loans as discussed below.
New Credit Facilities. On May 14, 2015, we and our wholly-owned subsidiary Sundance Energy, Inc. entered into the Credit Agreement with Morgan Stanley Energy Capital, Inc., as administrative agent and the lenders from time to time party thereto, which provides for our $300 million Revolving Facility and $125 million Term Loans, with an accordion feature providing for additional term loans of up to $50 million, subject to certain conditions The Revolving Facility is subject to a borrowing base, which has been set initially at $75 million. At closing on May 14, 2015, $25 million was drawn on the Revolving Facility and $125 million of Term Loans were funded. The Revolving Facility has a five year term and the Term Loans have a 5 ½ year term.
Interest on the Revolving Facility accrues at LIBOR plus a margin that ranges from 2.0% to 3.0%.
· The applicable margin varies depending on the amount drawn. We also pay a commitment fee of 0.50% on the undrawn balance of the borrowing base. Interest on the Term Loans accrues at LIBOR (with a LIBOR floor of 1.0%) plus 7.0%.
The key financial covenants of our Credit Agreement require us to (i) maintain a minimum current ratio, which is defined as consolidated current assets inclusive of undrawn borrowing capacity divided by consolidated current liabilities, of 1.00 or greater, (ii) a revolving debt to EBITDAX ratio (as defined in our Credit Agreement), determined on a rolling four quarter basis, of 4.00 to 1.00 or less, (iii) maintain a minimum EBITDAX to consolidated interest expense ratio of 2.00 to 1.00 or greater, and (iv) maintain a minimum Total Proved PV-9 (as defined in our Credit Agreement) to Total Debt (as defined in our Credit Agreement) ratio of less than 1.25 to 1.00 for the 18 month period commencing on May 14, 2015 and 1.50 to 1.00 at any time thereafter, in each case beginning on June 30, 2015. The Credit Agreement requires the Company to hedge 50% of its proved developed producing forecasted volumes. In addition, our Credit Agreement contains various covenants that limit our ability to take certain actions, including, but not limited to, the following:
· incur indebtedness or grant liens on any of our assets;
· enter into certain commodity hedging agreements;
· sell, transfer, assign or convey assets, including a sale of all or substantially all of our assets, or engage in certain mergers or acquisitions;
· make certain distributions;
· make certain loans, advances and investments; and
· engage in transactions with affiliates.
If an event of default exists under our Credit Agreement, the Agent will be able to terminate the commitments under the Credit agreement and accelerate the maturity of all loans made pursuant to the Credit Agreement and exercise other rights and remedies. Events of default include, but are not limited to, the following events:
· failure to pay any principal when due under the credit agreement;
· failure to pay any other obligation when due and payable within three business days after same becomes due;
· failure to observe or perform any covenant, condition or agreement in the Credit Agreement or other loan documents, subject, in certain instances, to certain cure periods;
· failure of any representation and warranty made in connection with the loan documents to be true and correct in all material respects;
· bankruptcy or insolvency events involving us or our subsidiaries;
· cross-default to other indebtedness in excess of $2 million;
· certain ERISA events involving us or our subsidiaries;
· bankruptcy or insolvency; and
· a change of control (as defined in our Credit Agreement).
We and Sundance Energy, Inc. and their respective subsidiaries have also executed and delivered certain other related agreements and documents pursuant to the Credit Agreement, including a guarantee and collateral agreement and mortgages. The obligations of the Company, Sundance Energy, Inc. and their respective subsidiaries under the Credit Agreement are secured by a first priority security interest in favor of the Agent for the benefit of the lenders, in the Company, Sundance Energy, Inc. and their respective subsidiaries’ tangible and intangible assets, and proved reserves, among other things.
The Revolving Facility and Term Loans refinanced the Company’s Credit Facilities with Wells Fargo Bank, N.A. and Wells Fargo Energy Capital, Inc., respectively. At closing, the Company used $145.0 million of the proceeds to pay off its previous credit facilities, which are now fully paid-off. Approximately $1.1 million of deferred financing fees related to the previous credit facilities were written off due to the refinance.
Capital Expenditures
The following table summarizes our capital expenditures for the years ending December 31, 2014, 2013 and the six-month period ended December 31, 2012.
|
| Year ending December 31, |
| Six-month |
| |||||
(In $ ‘000s) |
| 2014 |
| 2013 |
| 2012 |
| |||
|
| (audited) |
| (audited) |
| (audited) |
| |||
Development and production assets |
| $ | 350,196 |
| $ | 219,121 |
| $ | 47,949 |
|
Exploration and evaluation expenditure |
| 39,670 |
| 14,770 |
| 23,348 |
| |||
Total |
| $ | 389,866 |
| $ | 233,891 |
| $ | 71,297 |
|
C. Research and Development
Not applicable.
D. Trend Information
We believe that oil and natural gas prices may remain volatile for the foreseeable future. While oil and/or natural gas prices are low, our future drilling and completion activity will decrease as operating cashflows decrease relative to recent historical levels. While we anticipate reductions in field service costs, material prices and all costs associated with drilling, completing and operating wells, maintaining an effective cost structure to maintain positive cashflow could be challenging. This could have a material adverse effect upon our net sales or revenues, profitability, liquidity or capital resources or cause less predicatable future operating results or financial condition as compared to reported financial information. While we have identified prospects we intend to drill, our ability to grow could be adversely affected by these commodity price declines.
E. Off-Balance Sheet Arrangements
We do not have any off-balance sheet arrangements that have, or are reasonably likely to have, a significant effect on our financial condition, revenues or expenses, liquidity, capital expenditures, capital resources material to investors or results of operations.
F. Tabular disclosure of contractual obligations
The following table summarizes our contractual obligations as of December 31, 2014:
|
| Payments due by period |
| |||||||||||||
Contractual Obligations (In $ ‘000s) |
| Total |
| Less than |
| 1 - 3 years |
| 3 - 5 years |
| More than |
| |||||
Credit Facilities(1) |
| $ | 147,994 |
| $ | 5,502 |
| $ | 107,492 |
| $ | 35,000 |
| $ | — |
|
Drilling rig commitments(2) |
| 1,460 |
| 1,460 |
| — |
| — |
| — |
| |||||
Drilling commitments(3) |
| 2,000 |
| 1,000 |
| 1,000 |
| — |
| — |
| |||||
Operating lease obligations |
| 2,364 |
| 430 |
| 984 |
| 950 |
| — |
| |||||
Employment commitments |
| 742 |
| 370 |
| 372 |
| — |
| — |
| |||||
Asset retirement obligation(4) |
| 8,866 |
| 150 |
| — |
| — |
| 8,716 |
| |||||
Total |
| $ | 163,426 |
| $ | 8,912 |
| $ | 109,848 |
| $ | 35,950 |
| $ | 8,716 |
|
(1) Includes principal and projected interest payments due under our Senior Credit Facility and Junior Credit Facility. Projected interest payments are based on a 2.660% and 8.50% interest rate for the Senior Credit Facility and the Junior Credit Facility, respectively, in effect as of December 31, 2014. As of December 31, 2014, there was $130 million outstanding under these credit facilities. Please read the description of our Senior Credit Facility and our Junior Credit Facility above.
(2) As December 31, 2014 we had one outstanding drilling rig contract to explore and develop our properties. The contracts generally have terms of 6 months and expired in March 2015. Amounts represent minimum expenditure commitments should we elect to terminate these contracts prior to term.
(3) As a part of our acquisition agreement for certain Wattenberg assets, we are committed to drilling 15 vertical or four horizontal development wells per year for the years ending December 31, 2013, 2014 and 2015 (collectively 45 vertical or 15 horizontal development wells). We have established an escrow account that will release the funds to us at a rate of $67,000 per vertical or $267,000 per horizontal well drilled, with any shortfall wells (less than 45 cumulative vertical or 15 horizontal wells drilled as of December 31, 2015) to be paid to the seller of the assets from the escrow account. If we complete drilling any of the shortfall wells after the deadline, we are able to recoup up to $67,000 per vertical or $267,000 per horizontal well by obtaining an assignment of a 5% overriding royalty interest from the seller until the shortfall well fee is recouped. We sold the properties in July 2014 and should the buyer drill any qualifying wells, the obligation would be satisfied. As of December 31, 2014, nor we or the buyer had drilled any wells and we do not expect any wells to be drilled under this provision in 2015. As such, the remaining commitment of $2.0 million was accrued in our consolidated statement of financial position and recognized against the gain on sale of assets in the consolidated statement of profit or loss and comprehensive income. Total contractual obligation represents amounts accrued.
(4) We have established a restoration provision liability for the reclamation of oil and natural gas properties at the end of their economic lives. Based on our current projections, we believe the majority of our reclamation obligations will be incurred beyond five years from December 31, 2014.
Item 6. Directors, Senior Management and Employees
A. Directors and Senior Management
The following table lists the names of our directors and executive officers. The directors have served since their respective election or appointment and will serve until the next annual general meeting of shareholders or until a successor is duly appointed.
Name |
| Position |
Eric P. McCrady |
| Chief Executive Officer and Managing Director |
Cathy L. Anderson |
| Chief Financial Officer |
Grace Ford* |
| Vice President of Exploration and Development |
Mike Wolfe* |
| Vice President of Land |
David Ramsden-Wood* |
| Vice President of Reservoir Engineering and Business Development |
John Whittington* |
| Vice President of Operations |
Michael D. Hannell |
| Chairman of the Board |
Damien A. Hannes |
| Director |
Neville W. Martin |
| Director |
H. Weldon Holcombe |
| Director |
* Officers only of Sundance Energy, Inc.
Eric P. McCrady has been our Chief Executive Officer since April 2011 and Managing Director of our board of directors since November 2011. He also served as our Chief Financial Officer from June 2010 until becoming Chief Executive Officer in 2011. Mr. McCrady has served in numerous positions in the energy, private investment and retail industries. From 2004 to 2010, Mr. McCrady was employed by The Broe Group, a private investment firm, in various financial and executive management positions across a variety of industry investment platforms, including energy, transportation and real estate. From 1997 to 2003, Mr. McCrady was employed by American Coin Merchandising, Inc. in various corporate finance roles. Mr. McCrady holds a degree in Business Administration from the University of Colorado, Boulder.
Cathy L. Anderson has been our Chief Financial Officer since December 2011. Ms. Anderson has over 25 years of experience, primarily in the oil and gas industry, and has extensive experience in budgeting and forecasting, regulatory reporting, corporate controls, and financial analysis and reporting. Prior to joining us in 2011, Ms. Anderson had been a consultant to companies in the oil and gas industry since 2006. Ms. Anderson held various positions, including Chief Financial Officer of Optigas, Inc., a natural gas gathering, processing and marketing company, from 2005 to 2006 and Vice President of Internal Audit and Consulting for TeleTech Holdings, Inc., a NASDAQ-listed global service firm providing outsourced customer management, from 2002 to 2004. From 1993 to 1999, Ms. Anderson was the Controller and Chief Accounting Officer of NYSE-listed Key Production Company, Inc. (predecessor to Cimarex Energy). She began her career in 1985 with Arthur Andersen, LLP. Ms. Anderson holds a Bachelor of Science in Business Administration with High Honors, emphasis in Accounting, from the University of Montana. She is a certified public accountant.
Grace L. Ford has been Vice President of Exploration and Development of our subsidiary, Sundance Energy, Inc., since March 2013 and had previously served as Vice President of Geology of Sundance Energy, Inc. since September 2011. Prior to joining us in 2011, Ms. Ford served in numerous positions in the oil and gas industry, working throughout the United States and in West Africa. Ms. Ford’s experience spans both conventional and unconventional resource exploration, development, reservoir characterization and enhanced recovery projects. Ms. Ford has extensive operational experience in multi-rig horizontal development programs. From 2010 to 2011, Ms. Ford was employed as a geologist by Rock Oil, a private equity-backed company with operations in the Eagle Ford in south Texas. From 2007 to 2010, Ms. Ford was employed as a geoscience manager by Baytex Energy, USA, and from 2001 to 2007, Ms. Ford was employed as a geologist by EOG Resources, Inc. Prior to her tenure with EOG Resources, Inc., Ms. Ford served in various geologic or engineering capacities for Marathon Oil Company, Schlumberger and the U.S. Geological Survey. Ms. Ford received her PhD in Geology from the Colorado School of Mines, a Master of Science degree in Geology from the University of Arkansas and a Bachelors of Science degree in geology from the University of Wyoming. Ms. Ford is a registered professional geologist in the states of Texas, Wyoming and Utah.
Mike Wolfe has been Vice President of Land of our subsidiary, Sundance Energy, Inc., since March 2013 and was previously Senior Land Manager from December 2010. He has more than 30 years of senior land experience in the oil and gas industry. His experience encompasses all areas of land management, including field leasing, title, lease records, joint venture contracts and management of multi-rig drilling programs in numerous basins throughout the United States. From 1997 to 2010,
Mr. Wolfe was a regional land manager for Cimarex Energy Company, a public oil and gas exploration and production company. From 1996 to 1997, he was a site acquisition agent for PacBell Mobile, a cellular phone service provider. From 1990 to 1996, he was a project landman for Capitol Oil Corporation, an oil and gas exploration and production company. From 1981 to 1990, he was an assistant land manager for TXO Production Corporation, an oil and gas exploration and production company. Prior to his tenure with TXO Production Corporation, he was a land representative for Texaco. Mr. Wolfe holds a Bachelor of Science degree in Business Administration, with a concentration in finance and real estate from Colorado State University.
David Ramsden-Wood has been Vice President of Reservoir Engineering and Business Development of our subsidiary, Sundance Energy, Inc., since May 2014 and previously served as a consultant for us in a similar role since January 2013. He has more than 15 years of engineering experience in the oil and gas industry. His experience has been focused on reservoir engineering, strategic and financial planning and production engineering. From 2009 to 2012, Mr. Ramsden-Wood was a regional senior manager for Enerplus Resources (USA) Corporation, a public oil and gas exploration and production company. From 2001 to 2009, he served as a manager in various engineering and business planning capacities for Anadarko Petroleum Corporation, a public oil and gas exploration and production company. Prior to his tenure with Anadarko Petroleum Corporation, Mr. Ramsden-Wood worked on mergers and acquisitions and oil and gas marketing for Canadian Hunter Exploration Ltd and Barrington Petroleum. Mr. Ramsden-Wood holds a Masters of Business Administration degree from Cornell University (with Distinction) and Queen’s University and a Bachelor of Science degree in Engineering (Chemical) from the University of Calgary. He is a professional engineer, licensed in Alberta, Canada.
John Whittington has been Vice President of Operations of our subsidiary, Sundance Energy, Inc., since May 2014. He has more than 20 years of experience in the oil and gas industry. His experience has focused on the development and optimization of onshore US resource plays with a particular emphasis on completion optimization and production operations. From 2011 to 2014, Mr. Whittington served as the Operations Manager, Vice President of Operations, and Shared Services Manager for Triangle Petroleum Corporation, a vertically integrated, public oil and gas exploration and production company. From 2005 to 2010, Mr. Whittington was a lead completions and operations engineer and completions advisor for EOG Resources, Inc., a public oil and gas exploration and production company. From 2002 to 2005, he was an engineer for Encana Oil and Gas USA, Inc, a public oil and gas exploration and production company; a portion of which he was an alliance engineer with Schlumberger Oilfield Services, a public oilfield service company. From 1999 to 2002, he was a petroleum consultant for Apex Petroleum Engineering, an oil and gas technical consulting service company. Prior to his tenure with Apex Petroleum Engineering, Mr. Whittington served as field, acquisitions, production and senior petroleum engineer for a variety of oil and gas companies and consulting firms, including Dowell Schlumberger Inc, the predecessor to Schlumberger Oilfield Services, Lomak Petroleum, Inc., and Integrated Petroleum Technologies, Inc. Mr. Whittington holds a Bachelor of Science degree in Petroleum Engineering from the New Mexico Institute of Mining and Technology. He is a member of the Society of Petroleum Engineers.
Michael D. Hannell has been a Director of Sundance since March 2006 and chairman of our board of directors since December 2008. Mr. Hannell has over 45 years of experience in the oil and gas industry, initially in the downstream sector and subsequently in the upstream sector. His extensive experience has been in a wide range of design and construction, engineering, operations, exploration and development, marketing and commercial, financial and corporate areas in the United States, United Kingdom, continental Europe and Australia at the senior executive level with Mobil Oil (now Exxon) and Santos Ltd. Mr. Hannell recently finished his term as the chairman of Rees Operations Pty Ltd (doing business as Milford Industries Pty Ltd), an Australian automotive components and transportation container manufacturer and supplier. He has also held a number of other board appointments including the chairman of Sydac Pty Ltd, a designer and producer of simulation training products for industry. Mr. Hannell has also served on a number of not-for-profit boards, with appointments as president of the Adelaide-based Chamber of Mines and Energy, president of Business SA (formerly the South Australian Chamber of Commerce and Industry), chairman of the Investigator Science and Technology Centre, chairman of the Adelaide Graduate School of Business, and a member of the South Australian Legal Practitioners Conduct Board. Mr. Hannell holds a Bachelor of Science degree in Engineering (with Honors) from the University of London and is a Fellow of the Institution of Engineers Australia.
Damien A. Hannes has been a Director since August 2009. Mr. Hannes has over 25 years of finance experience. He has served over 15 years as a managing director and a member of the operating committee, among other senior management positions, for Credit Suisse’s listed derivatives business in equities, commodities and fixed income in its Asia and Pacific region. From 1986 to 1993, Mr. Hannes was a director for Fay Richwhite Australia, a New Zealand merchant bank. Prior to his tenure with Fay Richwhite, Mr. Hannes was the director of operations and chief financial officer of Donaldson, Lufkin and Jenrette Futures Ltd, a U.S. investment bank. He has successfully raised capital and developed and managed mining, commodities trading and manufacturing businesses in the global market. Mr. Hannes also serves as the chairman of the board of directors of Goldsmith Resources SAC, a gold mining company with operations in Peru, and as a director of Quill Stationery
Manufacturers Limited, a paper products business with operations in China. He holds a Bachelor of Business degree from the NSW University of Technology in Australia.
Neville W. Martin has been a Director since January 2012. Prior to his election, he was an alternate director on our board of directors. Mr. Martin has over 40 years of experience as a lawyer specializing in corporate law and mining, oil and gas law. He is currently a consultant to the Australian law firm, Minter Ellison. Mr. Martin has served as a director on the boards of several Australian companies listed on the ASX, including Stuart Petroleum Ltd from 1999 to 2002, Austin Exploration Ltd. from 2005 to 2008 and Adelaide Energy Ltd from 2005 to 2011. Mr. Martin is the former state president of the Australian Resource and Energy Law Association. Mr. Martin holds a Bachelor of Laws degree from Adelaide University.
H. Weldon Holcombe has been a Director since December 2012. Mr. Holcombe has over 30 years of onshore and offshore U.S. oil and gas industry experience, including technology, reservoir engineering, drilling and completions, production operations, construction, field development and optimization, Health, Safety and Environmental (“HSE”), and management of office, field and contract personnel. Most recently, Mr. Holcombe served as the Executive Vice President, Mid Continental Region, for Petrohawk Energy Corporation from 2006 until its acquisition by BHP Billiton in 2011, after which Mr. Holcombe served as Vice President of New Technology Development for BHP Billiton. In his capacity as Executive Vice President for Petrohawk Energy Corporation, Mr. Holcombe managed development of leading unconventional resource plays, including the Haynesville, Fayetteville and Permian areas. In addition, Mr. Holcombe served as President of Big Hawk LLC, a subsidiary of Petrohawk Energy Corporation, a provider of basic oil and gas construction, logistics and rental services. Mr. Holcombe also served as corporate HSE officer for Petrohawk and joint chairperson of the steering committee that managed construction and operation of a gathering system in Petrohawk’s Haynesville field with one billion cubic feet of natural gas of production per day. Prior to Petrohawk, Mr. Holcombe served in a variety of senior level management, operations and engineering roles for KCS Energy and Exxon. Mr. Holcombe holds a Bachelor of Science degree in civil engineering from the University of Auburn.
There are no family relationships among any of our directors or executive officers. The business addresses for each of our directors and executive officers is Sundance Energy, Inc., 633 17th Street, Denver, Colorado 80202.
Employment Agreements with Executive Officers
Our Chief Executive Officer, Eric P. McCrady, has an employment agreement with a three-year term commencing January 2014 and base remuneration of $370,000 per year, which is reviewed annually by the Remuneration and Nomination Committee. In the event of a not-for-cause termination or change in control (as described in the employment agreement) in which Mr. McCrady does not remain employed by the acquirer, the employment agreement provides payment of Mr. McCrady’s base remuneration through the end of the term of the employment agreement. He is eligible to participate in our incentive compensation program.
Other than Mr. McCrady, at the date of this report, none of our executive officers has an employment agreement. In August 2013, Damien Connor was appointed our Company Secretary. Mr. Connor provides services to Sundance through a contractual arrangement. None of our directors has any service contracts with Sundance or any of its subsidiaries providing for benefits upon termination of employment.
B. Compensation
Our board of directors recognizes that the attraction and retention of high-caliber directors and executives with appropriate incentives is critical to generating shareholder value. We have designed our compensation program to provide rewards for individual performance and corporate results and to encourage an ownership mentality among our executives and other key employees.
The Australian non-executive directors receive a basic annual fee for board membership and annual fees for committee service and chairmanships, all of which includes the superannuation guarantee contribution required by the Australian government, which was 9.50% as of July 1, 2014. In accordance with ASX corporate governance principles, they do not receive any other retirement benefits or any performance-related incentive payments by means of cash or equity. Some individuals, however, have chosen to forego part of their salary to increase payments toward superannuation. To align directors’ interests with shareholder interests, the directors are required to hold our ordinary shares equal to three times their base board fees. Our U.S.-based executives receive statutory retirement benefit payments as required under applicable U.S. law and receive contributions into their retirement account at a level commensurate with all other employees. All remuneration paid to directors and executives is valued in accordance with applicable IFRS accounting rules.
The Remuneration and Nominations Committee makes recommendations to our board of directors in relation to total compensation of directors and executives and reviews their remuneration annually. Independent external advice is sought when required. The Remuneration and Nominations Committee retained Meridian Compensation Partners, LLC (“Meridian”), as its independent remuneration consultant for the 2014 fiscal year. Meridian was retained to provide executive and director remuneration consulting services to the Committee, including advice regarding the design and implementation of remuneration programs that are competitive and common among the U.S. oil and gas exploration and production industry, competitive market information, comparison advice with Australian companies and practice, regulatory updates and analyses and trends on executive base salary, short-term incentives, long-term incentives, benefits and perquisites
In assessing total compensation, our objective is to be competitive with industry compensation while considering individual and company performance. Base salaries for executives recognize their qualifications, experience and responsibilities as well as their unique value and historical contributions to Sundance. In addition to being important to attracting and retaining executives, setting base salaries at appropriate levels motivates employees to aspire to and accept enlarged opportunities. We do not consider base salaries to be part of performance-based compensation, in setting the amount, the individuals’ performance is considered. The majority of each executive’s compensation is performance based and “at risk.” We believe that equity ownership is an important element of compensation and that, over time, more of the executives’ compensation should be equity-based rather than cash-based so as to better align executive compensation with shareholder return. For the year ended December 31, 2014, the targeted “at risk” remuneration relating to performance variability with STI bonuses and LTI represents approximately 81% for the Managing Director and approximately 81% for all other executives.
In support of this, we recently adopted stock ownership guidelines for certain key executive officers. Our Chief Executive Officer is required to hold ordinary shares with a value equal to five times the amount of his annual base salary. The remaining executive officers are required to hold ordinary shares with a value equal to 2.5 times their respective annual base salaries. The applicable level of ownership is required to be achieved within five years of the later of the date these guidelines were adopted or the date the person first became an executive officer and is based on the executive’s salary at the time these guidelines were adopted or the date the executive first became subject to the guidelines. Unexercised and/or unvested equity awards do not count toward satisfaction of the guidelines.
We have an incentive compensation program, comprised of short and long-term components, to incentivize key executives and employees of Sundance and its subsidiaries. The goal of the incentive compensation program is to motivate management and senior employees to achieve short and long-term goals to improve shareholder value. This plan represents the performance-based, at risk component of each executive’s total compensation. The incentive compensation program is designed to:
· Attract and retain highly trained, experienced, and committed executives who have the skills, education, business acumen, and background to lead a mid-tier oil and gas business;
· Motivate and reward executives to drive and achieve our goal of increasing shareholder value;
· Provide balanced incentives for the achievement of near-term and long-term objectives, without motivating executives to take excessive risk; and
· Track and respond to developments such as the tightening in the labor market or changes in competitive pay practices.
The incentive compensation program has provisions for an annual cash and equity bonus in addition to the base salary levels. The annual cash bonus Short-Term Incentive (“STI”) is established to reward short-term performance towards our goal of increasing shareholder value. The equity component Long-Term Incentive (“LTI”) is intended to reward progress towards our long-term goals and to motivate and retain management to make decisions benefiting long-term value creation.
We have two active equity incentive plans under the LTI component of the incentive compensation program. These are the Sundance Employee Option Plan (“ESOP”) and the Sundance Energy Australia Limited Restricted Share Units available only to our U.S. employees under the Incentive Compensation Plan (the “RSU Plan”). Any grants made to employees that also serve as a director are subject to shareholder approval prior to issuance.
The ESOP provides for the issuance of stock options at an exercise price determined at the time of the issue by a committee designated by the board (the “Plan Committee”). Options under the ESOP may be granted to eligible employees, as determined by the Plan Committee, and typically include our executive officers, directors and key employees. Historically, the Plan Committee has granted options in connection with attracting new employees, which grant is made once employment has
commenced. It is within the discretion of the Plan Committee, however, to authorize additional option grants during the term of employment. Generally, an option vests 20% on the 90th day following the grant date, with an additional 20% vesting on the first, second, third and fourth anniversaries thereof. Options are valued using the Black-Scholes methodology and recognized as remuneration in accordance with their vesting conditions. In the event of a voluntary winding up of Sundance, unvested stock options vest immediately. We may amend the ESOP or any portion thereof, or waive or modify the application of the ESOP rules in relation to a participant, at any time. Certain amendments to the ESOP may require the approval of the holders of the options granted under the ESOP. No stock options were granted to any officers or directors during fiscal years 2013 or 2014.
The RSU Plan provides for the issuance of restricted stock units (“RSUs”) to our U.S. employees. The purpose of issuing RSUs is to reward senior executives and employees for achievement of financial and operational performance targets established by our board. The RSU Plan is administered by our board. RSUs under the RSU Plan may be granted to eligible employees (as determined by our board, which typically include our executive officers, directors and key employees) from a bonus pool established at the sole discretion of our board. The bonus pool is subject to board and management review of performance metrics with respect to both our and the individual employee’s performance over a measured period determined by the Remuneration and Nominations Committee and the board as discussed below. The RSUs may be settled in cash or stock at the discretion of our board. Under the RSU Plan, 25% of the RSUs vest on the grant date, and 25% vest on each of the first, second and third anniversaries of the grant date. The RSUs are based on performance targets established and approved by our board. In the event of a corporate take-over or change in control (as defined in the RSU Plan), our board in its discretion may cause all unvested RSUs to vest and be satisfied by the issue of one share each or provide for the cancellation of outstanding RSUs and a cash payment equal to the then-fair market value of the RSUs. We may amend, suspend or terminate the RSU Plan or any portion thereof at any time. Certain amendments to the RSU Plan may require approval of the holders of the RSUs who will be affected by the amendment.
Starting with the 2015 fiscal year, the RSU Plan has been amended for executives to reflect 50% time based vesting and 50% vesting based on total shareholder return (“TSR”) relative to our peer group over a three-year period. The time-based vesting will vest 1/3 on each of the three anniversaries following the grant date subject to continued employment with Sundance. TSR is calculated as the change in stock price plus dividends over the three year period. The stock price used to calculate the starting stock price value will be the average price of Sundance’s stock for the 20 trading days before the first day of the measurement period. The ending-period stock price will be the average price of Sundance’s stock for the last 20 trading days of the measurement period.
The number of shares that can be earned under TSR performance ranges from 0% to 200% of the target share grant based on Sundance’s percentile rank among the peer set. If Sundance’s TSR is negative for the three-year period, but the percentile rank is above median, the payout will be capped at the target payout. If Sundance’s TSR is between any of the percentile ranks listed in the table below, the payout as a percent of target will be on a pro-rata basis.
TSR Percentile Rank |
| Payout % of Target |
|
90th and above |
| 200 | % |
50th |
| 100 | % |
30th |
| 50 | % |
Below 30th |
| 0 | % |
TSR will be compared to a set of 22 oil and gas exploration and production companies headquartered in the United States and Australia. The Australian-headquartered companies are highlighted. The chart on the right depicts the TSR over a three year period ending December 31, 2014. Diamondback Energy Inc., Matador Resources Co. and Midstates Petroleum Co Inc. were excluded from the chart as there was not enough historical data to measure the defined TSR.
Company
Abraxas Petroleum Corp/NV
Approach Resources Inc
Austex Oil Ltd
Beach Energy Ltd
Bonanza Creek Energy Inc.
Callon Petroleum CO/DE
Carrizo Oil & Gas Inc
Contango Oil & Gas Co
Diamondback Energy Inc
Drillsearch Energy Ltd
Emerald Oil Inc
Goodrich Petroleum Corp
Lonestar Resources Ltd
Matador Resources Co
Midstates Petroleum Co Inc
Panhandle Oil & Gas Inc
Red Fork Energy Ltd
Rex Energy Corp
Sanchez Energy Corp
Senex Energy Ltd
Synergy Resources Corp
Triangle Petroleum Corp
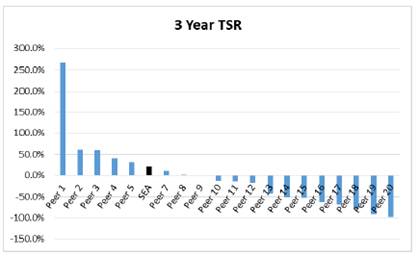
The available bonus pool for both STI and LTI is based on a percentage of each employee’s annual base salary. On an annual basis, targets are established and agreed by the Remuneration and Nominations Committee, subject to endorsement by our board of directors. The targets are used to determine the bonus pool, but both the STI and LTI bonuses require approval by the Remuneration and Nominations Committee and are fully discretionary. Bonuses earned under the STI are typically paid in cash, however, to reflect the current low commodity price environment and preserve liquidity, the STI earned for the 2014 fiscal year will be paid out in RSUs during 2015. Bonuses earned under the LTI are paid by means of awarding RSUs under the RSU Plan.
For the year ended December 31, 2014 (to be paid in 2015), the following metrics were adopted as targets:
Financial Performance Metric |
| Performance |
| Target |
|
Production of oil and natural gas per 1,000 debt adjusted share |
| 4.06 Boe |
| 17.5 | % |
Cash margin |
| 72.6% |
| 17.5 | % |
Net asset value per debt-adjusted share |
| 1.02 |
| 17.5 | % |
PV/I (1) |
| 1.25 |
| 17.5 | % |
Health, safety and environmental |
| Qualitative |
| 10.0 | % |
Assessment of the performance of senior executives and managers |
| Qualitative |
| 20.0 | % |
(1) Net change in the proved PV10 of the constant case reserve report divided by development capital expenditures during the period under consideration less proceeds from divestitures.
In addition, certain ceiling and claw-back provisions have been set by our board of directors to ensure that the performance metrics are aligned with the best interests of the shareholders. It is the intention of the Remuneration and Nominations Committee to carefully monitor the incentive compensation program to ensure its ongoing effectiveness.
The following discussion is based upon a remuneration report that we prepared in compliance with listing rules of the ASX. Mr. Wolfe, Mr. Ramsden-Wood and Mr. Whittington are not considered key management personnel as defined under listing rules of the ASX. As a result, their remuneration is not discussed below.
Details of the cash remuneration, as prescribed by our home country jurisdiction, of our directors and executive officers for the year ended December 31, 2014 are as follows:
|
| Fixed Based Remuneration |
| Share |
| Performance Based |
|
|
| ||||||||||||||||
|
|
|
| Non- |
| Post- |
|
|
| Based |
|
|
| LTI- |
|
|
| ||||||||
Director |
| Cash salary |
| monetary |
| employment |
| Superannuation |
| Payments- |
| STI-Cash |
| Share |
| Total |
| ||||||||
E. McCrady |
| $ | 365,615 |
| $ | 18,816 |
| $ | 7,800 |
| $ | — |
| $ | — |
| $ | 240,000 |
| $ | 542,310 |
| $ | 1,174,540 |
|
M. Hannell |
| 141,958 |
| — |
| — |
| 13,334 |
| — |
| — |
| — |
| 155,293 |
| ||||||||
D. Hannes |
| 115,956 |
| — |
| — |
| 10,896 |
| — |
| — |
| — |
| 126,852 |
| ||||||||
N. Martin |
| 98,414 |
| — |
| — |
| 9,252 |
| — |
| — |
| — |
| 107,666 |
| ||||||||
W. Holcombe |
| 117,792 |
| — |
| — |
| — |
| — |
| — |
| — |
| 117,792 |
| ||||||||
|
| $ | 839,735 |
| $ | 18,816 |
| $ | 7,800 |
| $ | 33,482 |
| $ | — |
| $ | 240,000 |
| $ | 542,310 |
| $ | 1,682,143 |
|
Executive officers |
|
|
|
|
|
|
|
|
|
|
|
|
|
|
|
|
| ||||||||
C. Anderson |
| $ | 291,770 |
| 14,144 |
| $ | 7,800 |
| $ | — |
| $ | 26,399 |
| $ | 147,000 |
| $ | 292,885 |
| $ | 779,998 |
| |
G. Ford |
| 292,000 |
| 8,428 |
| 7,800 |
| — |
| 48,385 |
| 150,000 |
| 298,010 |
| 804,623 |
| ||||||||
|
| $ | 583,769 |
| $ | 22,572 |
| $ | 15,600 |
| $ | — |
| $ | 74,784 |
| $ | 297,000 |
| $ | 590,895 |
| $ | 1,584,621 |
|
Total |
| $ | 1,423,505 |
| $ | 41,388 |
| $ | 23,400 |
| $ | 33,482 |
| $ | 74,784 |
| $ | 537,000 |
| $ | 1,133,205 |
| $ | 3,266,764 |
|
(1) Non-monetary benefits includes car parking fringe benefits and payment of health premiums.
(2) Fair value of services received in return for the options granted is measured using the Black-Scholes Option Pricing Model, as further discussed in Note 31 to our financial statements, and represents the portion of the grant date fair value expense of the option during the year. Options were granted to Anderson and Ford in December 2011 and September 2011, respectively.
(3) Fair value of services received in return for the LTI share based awards are based on the allocable portion of aggregate fair value expense recognized under AASB 2 for the year. The aggregate fair value is based on the number of RSUs awarded valued at the Company’s stock price at the date of grant, translated at the foreign exchange rate in effect on the date of grant. Vesting is 25% at the time of grant (following the performance period), with 25% cliff vesting each subsequent year on the date of grant. The amount included as remuneration is not related to or indicative of the benefit (if any) that individuals may ultimately realize when the RSUs vest.
At risk remuneration
Remuneration is structured to recognize both an individual’s responsibilities, qualifications and experience, as well as to drive performance over the short and long-term. Fixed remuneration is established relative to the market and aligned with responsibilities, qualifications and experience, while variable remuneration is used to reward and motivate outcomes beyond the standard expected. The relative weightings of “at risk” variable remuneration compared to fixed remuneration is as follows:
|
| Year ended December 31, 2014 |
| Year ended December 31, 2013 |
| ||||||||||||
|
| Fixed |
| STI |
| LTI |
| Target |
| Fixed |
| STI |
| LTI |
| Target |
|
E. McCrady |
| 19 | % | 19 | % | 62 | % | 81 | % | 22 | % | 22 | % | 56 | % | 78 | % |
C. Anderson |
| 25 | % | 19 | % | 56 | % | 75 | % | 29 | % | 21 | % | 50 | % | 71 | % |
G. Ford |
| 25 | % | 19 | % | 56 | % | 75 | % | 29 | % | 21 | % | 50 | % | 71 | % |
Non-executive directors |
| 100 | % | — |
| — |
| — |
| 100 | % | — |
| — |
| — |
|
C. Board Practices
Our board of directors currently consists of five members, including our Chief Executive Officer. We believe that each of our directors has relevant industry experience. The membership of our board of directors is directed by the following requirements:
· our Constitution specifies that there must be a minimum of three directors and a maximum of 10, and our board of directors may determine the number of directors within those limits;
· it is the intention of our board of directors that its membership consists of a majority of independent directors who satisfy the criteria recommended by the ASX Principles and Recommendations;
· the chairperson of our board of directors should be an independent director who satisfies the criteria for independence recommended by the ASX Principles and Recommendations; and
· our board of directors should, collectively, have the appropriate level of personal qualities, skills, experience, and time commitment to properly fulfill its responsibilities or have ready access to such skills where they are not available.
Our board of directors has delegated responsibility for the conduct of our businesses to the Managing Director, but remains responsible for overseeing the performance of management. Our board of directors has established delegated limits of authority, which define the matters that are delegated to management and those that require board of directors approval. None of our directors have any service contracts with Sundance or any of its subsidiaries providing for benefits upon termination of employment.
Committees
To assist our board of directors with the effective discharge of its duties, it has established a Remuneration and Nominations Committee and an Audit and Risk Management Committee. Each committee operates under a specific charter approved by our board of directors.
Remuneration and Nominations Committee. The members of our Remuneration and Nominations Committee are Messrs. Hannell (Chairman), Hannes and Holcombe, all of whom are independent, non-executive directors. This committee will identify, evaluate and recommend qualified nominees to serve on our board of directors, and maintain a management succession plan. In addition, the committee will oversee, review, act on and report on various remuneration matters to our board of directors.
Audit and Risk Management Committee. The members of our Audit and Risk Management Committee are Messrs. Hannes (Chairman), Hannell and Martin, all of whom are independent, non-executive directors. Mr. McCrady and Ms. Anderson are non-voting management representatives who advise the committee as appropriate. This committee will oversee, review, act on and report on various auditing and accounting matters to our board of directors, including the selection of our independent accountants, the scope of our annual audits, fees to be paid to the independent accountants, the performance of our independent accountants and our accounting practices. In addition, the committee will oversee, review, act on and report on various risk management matters to our board of directors.
The effective management of risk is central to our ongoing success. We have adopted a risk management policy to ensure that:
· appropriate systems are in place to identify, to the extent that is reasonably practical, all material risks that we face in conducting our business;
· the financial impact of those risks is understood and appropriate controls are in place to limit exposures to them;
· appropriate responsibilities are delegated to control the risks; and
· any material changes to our risk profile are disclosed in accordance with the our continuous disclosure policy.
It is our objective to appropriately balance, protect and enhance the interests of all of our shareholders. Proper behavior by our directors, officers, employees and those organizations that we contract to carry out work is essential in achieving this objective.
We have established a code of conduct, which sets out the standards of behavior that apply to every aspect of our dealings and relationships, both within and outside Sundance. The following standards of behavior apply:
· comply with all laws that govern us and our operations;
· act honestly and with integrity and fairness in all dealings with others and each other;
· avoid or manage conflicts of interest;
· use our assets properly and efficiently for the benefit of all of our shareholders; and
· seek to be an exemplary corporate citizen.
Reserves Committee. The members of our Reserves Committee are Messrs. Holcombe (Chairman), Hannell and Martin, all of whom are independent, non-executive directors. This committee will assist the board of directors in monitoring:
· the integrity of the Company’s oil, natural gas, and natural gas liquid reserves (Reserves);
· the independence, qualifications and performance of the Company’s independent reservoir engineers; and
· the compliance by the Company with legal and regulatory requirements.
D. Employees
As of December 31, 2014, we had 60 full-time employees, including 19 in executive, finance and accounting and administration, 4 in geology, 22 in production and engineering and 15 in land. All of our employees are located in the United States. None of our employees are represented by a labor union or covered by any collective bargaining agreement. We believe that our relations with our employees are satisfactory.
E. Share Ownership
Number of Options Held by Executive Officers
Executive Officers |
| Balance |
| Granted as |
| Options |
| Options |
| Balance |
| Total |
| Total |
| Total |
|
E. McCrady |
| — |
| — |
| — |
| — |
| — |
| — |
| — |
| — |
|
C. Anderson |
| 1,000,000 |
| — |
| — |
| — |
| 1,000,000 |
| 600,000 | (1) | 600,000 |
| 400,000 |
|
G. Ford |
| 1,200,000 |
| — |
| — |
| — |
| 1,200,000 |
| 800,000 | (2) | 800,000 |
| 400,000 |
|
Total |
| 2,200,000 |
| — |
| — |
| — |
| 2,200,000 |
| 1,400,000 |
| 1,400,000 |
| 800,000 |
|
(1) Consists of options to purchase up to 600,000 ordinary shares exercisable at $0.95 per share, which expire in March 2019. Options vest 20% on grant date and 20% each anniversary of the grant date over next 4 years.
(2) Consists of options to purchase up to 800,000 ordinary shares exercisable at $0.95 per share, which expire in December 2018. Options vest 17% on grant date and 17% each anniversary of the grant date over next 5 years.
No options were issued as part of remuneration to directors or executive officers for the year ended December 31, 2014.
Number of Restricted Shares Units Held by Executive Officers
Executive |
| Balance |
| Issued as |
| Forfeited |
| RSUs |
| Balance |
| Total |
| Total |
|
E. McCrady |
| 555,078 |
| 671,988 |
| — |
| (435,505 | ) | 791,561 |
| — |
| 791,561 |
|
C. Anderson |
| 320,680 |
| 385,456 |
| — |
| (225,579 | ) | 480,557 |
| — |
| 480,557 |
|
G. Ford |
| 322,410 |
| 394,473 |
| — |
| (228,410 | ) | 488,473 |
| — |
| 488,473 |
|
Total |
| 1,198,168 |
| 1,451,917 |
| — |
| (889,494 | ) | 1,760,591 |
| — |
| 1,760,591 |
|
All RSUs outstanding as of December 31, 2014, vest 25% on date of grant and 25% vest equally on each of the first three anniversaries of the grant date.
Item 7. Major Shareholders and Related Party Transactions
A. Major Shareholders
The following table presents certain information regarding the beneficial ownership of our ordinary shares based on 549,351,227 ordinary shares outstanding as of April 30, 2015 by:
· each person known by us (through substantial shareholder notices filed with the ASX) to be the beneficial owner of 5% or more of our ordinary shares;
· each of our directors and executive officers individually; and
· each of our directors and executive officers as a group.
Beneficial ownership is determined according to the rules of the SEC and generally means that a person has beneficial ownership of a security if he or she possesses sole or shared voting or investment power of that security and includes options that are exercisable within 60 days. Information with respect to beneficial ownership has been furnished to us by each director, executive officer, or 5% or more shareholder, as the case may be.
As of April 30, 2015, we had 53 shareholders of record in the United States. These shareholders held an aggregate of 5,447,712 of our outstanding ordinary shares, or approximately 1.0% of our outstanding ordinary shares.
Unless otherwise indicated, to our knowledge each shareholder possesses sole voting and investment power over the ordinary shares listed subject to community property laws, where applicable. None of our shareholders has different voting rights from other shareholders. Unless otherwise indicated, the address for each of the persons listed in the table below is Sundance Energy, Inc., 633 17th Street, Suite 1950, Denver, Colorado 80202.
|
| Ordinary Shares |
| ||
Shareholder |
| Number |
| Percent |
|
5% Shareholders |
|
|
|
|
|
IOOF Holdings Limited(1) |
| 42,791,826 |
| 7.79 | % |
Officers and Directors |
|
|
|
|
|
Eric P. McCrady |
| 1,908,581 |
| * |
|
Michael D. Hannell |
| 1,059,000 |
| * |
|
Damien A. Hannes |
| 5,801,561 | (2) | 1.06 | % |
Neville W. Martin |
| 422,800 | (3) | * |
|
H. Weldon Holcombe |
| 596,700 |
| * |
|
Cathy L. Anderson |
| 1,075,370 | (4) | * |
|
Grace Ford |
| 1,176,403 | (5) | * |
|
Officers and directors as a group (seven persons) |
| 12,040,345 |
| 2.19 | % |
* Represents beneficial ownership of less than 1% of the outstanding ordinary shares of Sundance.
(1) The address for IOOF Holdings Limited is Level 6, 161 Collins Street, Melbourne Victoria 3000.
(2) Includes (i) 377,858 ordinary shares held by Mr. Hannes individually and (ii) 5,423,703 ordinary shares held in a trust of which Mr. Hannes serves as a director and shares voting and investment power with respect to such shares.
(3) Includes (i) 20,000 ordinary shares held by Mr. Martin individually, and (ii) 379,942 ordinary shares held in trust of which Mr. Martin serves as trustee and is a beneficiary and (iii) 22,858 ordinary shares jointly held with Mr. Martin’s spouse.
(4) Includes (i) 275,370 ordinary shares and (ii) options to purchase up to 800,000 ordinary shares, exercisable until March 2019 at an exercise price of A$0.95 per share.
(5) Includes (i) 376,403 ordinary shares and (ii) options to purchase up to 800,000 ordinary shares, exercisable until December 2018 at an exercise price of A$0.95 per share.
To our knowledge, there have not been any significant changes in the ownership of our ordinary shares by major shareholders over the past three years, except as follows (which is based upon substantial shareholder notices filed with the ASX):
· IOOF Holdings Limited (“IOOF”) became a substantial shareholder on August 15, 2012, when it reported that it held 13,970,252 ordinary shares, or 5.042%, of the total voting power as of that date. Between August 2012 and March 27, 2015, IOOF acquired an aggregate of 69,370,881 ordinary shares for A$55,792,006 and sold an aggregate of 40,549,307 ordinary shares for A$37,780,387. On March 27, 2015, IOOF reported that it held 42,791,826 ordinary shares, or 7.790%, of the total voting power as of that date.
We note that, with the exception of Mr. Hannes, each of our directors and executive officers owns less than 1% of our outstanding ordinary shares.
B. Related Party Transactions
Other than as disclosed below, from January 1, 2014 to March 31, 2015 we did not enter into any transactions or loans with any: (i) enterprises that directly or indirectly, through one or more intermediaries, control, are controlled by or are under common control with us; (ii) associates; (iii) individuals owning, directly or indirectly, an interest in our voting power that gives them significant influence over us, and close members of any such individual’s family; (iv) key management personnel and close members of such individuals’ families; or (v) enterprises in which a substantial interest in our voting power is owned, directly or indirectly, by any person described in (iii) or (iv) or over which such person is able to exercise significant influence.
Neville Martin has been a director of Sundance since March 2012 and was a partner and is now a consultant of Minter Ellison, an Australian law firm. Minter Ellison was paid a non-material amount for legal services for the fiscal year ended December 31, 2014 and through April 17, 2015.
On June 6, 2013, IOOF acquired 6,700,000 of our ordinary shares in a private placement for A$5,762,000.
C. Interest of Experts and Counsel
Not applicable.
A. Consolidated Financial Statements and Other Financial Information
Our financial statements are included in Item 18 “Financial Statements.”
Legal Proceedings
From time to time, we are subject to legal proceedings and claims that arise in the ordinary course of business. Like other gas and oil producers and marketers, our operations are subject to extensive and rapidly changing federal and state environmental, health and safety, and other laws and regulations governing air emissions, wastewater discharges, and solid and
hazardous waste management activities. We are not aware of any material pending or overtly threatened legal action against Sundance or its directors of senior management.
Dividends
Subject to the Corporations Act and the ASX Listing Rules, the rights attaching to our ordinary shares are detailed in our Constitution. Our Constitution provides that any of our ordinary shares may be issued with preferred, deferred or other special rights, whether in relation to dividends, voting, return of share capital, payment of calls or otherwise as our board of directors may determine from time to time. Subject to the Corporations Act and the ASX Listing Rules, any rights and restrictions attached to a class of shares, we may issue further shares on such terms and conditions as our board of directors resolve. Currently, our outstanding share capital consists of only one class of ordinary shares.
Our board of directors may from time to time determine to pay dividends to shareholders. All unclaimed dividends may be invested or otherwise made use of by our board of directors for our benefit until claimed or otherwise disposed of in accordance with our Constitution.
B. Significant Changes
In January 2015, the company acquired three leases totaling approximately 14,180 net acres in the Eagle Ford for approximately $13.4 million.
Subsequent to December 31, 2014, an additional $15.0 million was drawn-down on our Senior Credit Facility, bringing total outstanding debt to $145.0 million, with no undrawn funds available under our Senior Credit Facility. Both our Senior Credit Facility and Junior Credit Facility were refinanced as discussed below.
On May 14, 2015, we and our wholly-owned subsidiary Sundance Energy, Inc. entered into the Credit Agreement with Morgan Stanley Energy Capital, Inc., as administrative agent and the lenders from time to time party thereto, which provides for our $300 million Revolving Facility and $125 million Term Loans, with an accordion feature providing for additional term loans of up to $50 million, subject to certain conditions The Revolving Facility is subject to a borrowing base, which has been set initially at $75 million. At closing on May 14, 2015, $25 million was drawn on the Revolving Facility and $125 million of Term Loans were funded. The Revolving Facility has a five year term and the Term Loans have a 5 ½ year term.
The Revolving Facility and Term Loans refinanced the Company’s credit facilities with Wells Fargo Bank, N.A. and Wells Fargo Energy Capital, Inc., respectively. At closing, the Company used $145.0 million of the proceeds to pay off its previous credit facilities, which are fully paid-off. Approximately $1.1 million of deferred financing fees related to the previous credit facilities were written off due to the refinance.
Subsequent to year end and in anticipation of closing the aforementioned credit facilities, the Company entered into the following hedge contracts.
|
|
|
|
|
| Units per month |
| Floor |
| Ceiling |
|
|
| ||||||||||
Description |
| Commodity |
| Basis |
| 2015 |
| 2016 |
| 2017 |
| 2018 |
| 2019 |
| Price |
| Price |
| Term |
| ||
Collar |
| Oil (Bbls) |
| LLS |
| 10,000 |
| — |
| — |
| — |
| — |
| $ | 50.00 |
| $ | 98.65 |
| Jun ‘15 – Dec ‘15 |
|
Collar |
| Oil (Bbls) |
| LLS |
| 10,000 |
| — |
| — |
| — |
| — |
| 50.00 |
| 101.05 |
| Jun ‘15 – Dec ‘15 |
| ||
Swap |
| Oil (Bbls) |
| LLS |
| 6,000 |
| — |
| — |
| — |
| — |
| 64.70 |
| 64.70 |
| Jun ‘15 – Dec ‘15 |
| ||
Swap |
| Oil (Bbls) |
| LLS |
| 6,000 |
| — |
| — |
| — |
| — |
| 65.90 |
| 65.90 |
| Jun ‘15 – Sep ‘15 |
| ||
Swap |
| Oil (Bbls) |
| LLS |
| 3,333 | * | — |
| — |
| — |
| — |
| 66.75 |
| 66.75 |
| Jun ‘15 – Nov ‘15 |
| ||
Collar |
| Oil (Bbls) |
| LLS |
| — |
| 10,000 |
| — |
| — |
| — |
| 50.00 |
| 69.30 |
| Jan ‘16 – May ‘16 |
| ||
Collar |
| Oil (Bbls) |
| LLS |
| — |
| 10,000 |
| — |
| — |
| — |
| 50.00 |
| 72.25 |
| Jan ‘16 – May ‘16 |
| ||
Collar |
| Oil (Bbls) |
| LLS |
| — |
| 10,000 |
| — |
| — |
| — |
| 50.00 |
| 77.00 |
| Jun ‘16 |
| ||
Collar |
| Oil (Bbls) |
| LLS |
| — |
| 10,000 |
| — |
| — |
| — |
| 50.00 |
| 85.00 |
| Jul ‘16 – Dec ‘16 |
| ||
Collar |
| Oil (Bbls) |
| LLS |
| — |
| 4,000 |
| — |
| — |
| — |
| 50.00 |
| 77.80 |
| Jan ‘16 – Dec ‘16 |
| ||
Collar |
| Oil (Bbls) |
| LLS |
| — |
| — |
| 8,000 |
| — |
| — |
| 50.00 |
| 81.75 |
| Jan ‘17 – Dec ‘17 |
| ||
Collar |
| Oil (Bbls) |
| LLS |
| — |
| — |
| 4,000 |
| — |
| — |
| 50.00 |
| 80.25 |
| Jan ‘17 – Dec ‘17 |
| ||
Collar |
| Oil (Bbls) |
| LLS |
| — |
| — |
| — |
| 4,000 |
| — |
| 55.00 |
| 80.25 |
| Jan ‘18 – Dec ‘18 |
| ||
Collar |
| Oil (Bbls) |
| LLS |
| — |
| — |
| — |
| — |
| 4,000 |
| 55.00 |
| 82.00 |
| Jan ‘19 – Dec ‘19 |
| ||
Total Oil/Weighted Average Price |
|
|
|
|
| 35,333 |
| 44,000 |
| 12,000 |
| 4,000 |
| 4,000 |
| $ | 52.65 |
| $ | 75.60 |
| Jun ‘15 - Dec ‘19 |
|
Collar |
| Gas (Mmbtu) |
| HH |
| 40,000 |
| — |
| — |
| — |
| — |
| $ | 2.70 |
| $ | 3.20 |
| Jun ‘15 - Dec ‘15 |
|
Swap |
| Gas (Mmbtu) |
| HSC |
| 30,000 |
| — |
| — |
| — |
| — |
| $ | 3.06 |
| $ | 3.06 |
| Jun ‘15 - Dec ‘15 |
|
Collar |
| Gas (Mmbtu) |
| HSC |
| — |
| 20,000 |
| — |
| — |
| — |
| $ | 2.90 |
| $ | 3.50 |
| Jan ‘16 - Dec ‘16 |
|
Collar |
| Gas (Mmbtu) |
| HSC |
| — |
| 20,000 |
| — |
| — |
| — |
| $ | 2.90 |
| $ | 3.75 |
| Jan ‘16 - Dec ‘16 |
|
Collar |
| Gas (Mmbtu) |
| HH |
| — |
| 20,000 |
| — |
| — |
| — |
| $ | 2.90 |
| $ | 3.50 |
| Jan ‘16 - Dec ‘16 |
|
Collar |
| Gas (Mmbtu) |
| HH |
| — |
| — |
| 20,000 |
| — |
| — |
| $ | 3.05 |
| $ | 3.60 |
| Jan ‘17 - Dec ‘17 |
|
Total Gas/Weighted Average Price |
|
|
|
|
| 70,000 |
| 60,000 |
| 20,000 |
| — |
| — |
| $ | 2.91 |
| $ | 3.44 |
| Jun ‘15 - Dec ‘17 |
|
* Units per month range from 0 — 7,000 Bbls
In the above table, “LLS” refers to Light Louisiana Sweet, “HH” refers to Henry Hub and “HSC” refers to Houston Ship Channel.
A. Offer and Listing Details
Pricing History—Australian Securities Exchange
Our ordinary shares were initially quoted and admitted to trading on the ASX (symbol: “SEA”) in April 2005. The following table presents, for the periods indicated, the reported low and high market prices for our ordinary shares as quoted on the ASX. All prices are in Australian dollars.
|
| High |
| Low |
|
|
| A$ |
| A$ |
|
Annual: |
|
|
|
|
|
Fiscal year ended December 31 |
|
|
|
|
|
2014 |
| 1.42 |
| 0.38 |
|
2013 |
| 1.18 |
| 0.76 |
|
Six-month period ended December 31 |
|
|
|
|
|
2012 |
| 0.85 |
| 0.38 |
|
Fiscal year ended June 30 |
|
|
|
|
|
2012 |
| 0.88 |
| 0.36 |
|
2011 |
| 1.10 |
| 0.17 |
|
2010 |
| 0.20 |
| 0.08 |
|
Quarterly: |
|
|
|
|
|
Fiscal year ending December 31, 2015 |
|
|
|
|
|
Second Quarter (through April 30, 2015) |
| 0.70 |
| 0.44 |
|
First Quarter |
| 0.63 |
| 0.44 |
|
Fiscal year ending December 31, 2014 |
|
|
|
|
|
Fourth Quarter |
| 1.25 |
| 0.38 |
|
Third Quarter |
| 1.42 |
| 1.16 |
|
Second Quarter |
| 1.20 |
| 0.92 |
|
First Quarter |
| 1.12 |
| 0.94 |
|
Fiscal year ended December 31, 2013 |
|
|
|
|
|
Fourth Quarter |
| 1.18 |
| 0.88 |
|
Third Quarter |
| 1.14 |
| 0.84 |
|
Second Quarter |
| 1.13 |
| 0.77 |
|
First Quarter |
| 1.11 |
| 0.76 |
|
Most Recent Six Months: |
|
|
|
|
|
March 2015 |
| 1.20 |
| 1.04 |
|
February 2015 |
| 1.11 |
| 0.94 |
|
January 2015 |
| 1.04 |
| 0.92 |
|
December 2014 |
| 1.02 |
| 0.94 |
|
November 2014 |
| 1.12 |
| 0.94 |
|
October 2014 |
| 1.05 |
| 0.94 |
|
On April 30, 2015 the closing price of our ordinary shares as traded on the ASX was A$0.61 per ordinary share (U.S.$0.48 per share based on the foreign exchange rate of A$1.00 to $0.7981 as published by the Reserve Bank of Australia as of April 30, 2015.
As of April 30, 2015, we had 549,351,227 ordinary shares outstanding, with 5,447,712 of our ordinary shares being held in the United States by 53 holders of record and 520,522,920 of our ordinary shares being held in Australia by 3,985 holders of record. A large number of our ordinary shares are held in nominee companies so we cannot be certain of the origin of those beneficial owners.
B. Plan of Distribution
Not applicable.
C. Markets
Our ordinary shares trade on the ASX under the symbol “SEA.”
D. Selling Shareholders
Not applicable.
E. Dilution
Not applicable.
F. Expenses of the Issue
Not applicable.
Item 10. Additional Information
A. Share Capital
Not applicable.
B. Our Constitution
The information called for by this Item 10.B. has been reported previously in our registration statement on form 20-F (File No. 000-55246) filed with the SEC on July 11, 2014 as amended on Form 20-F/A on August 26, 2014, under the heading “Additional Information - Our Constitution” and is incorporated by reference into this annual report.
C. Material Contracts
Credit Facilities
In August 2013, we entered into our Junior Credit Facility with Wells Fargo Energy Capital, Inc., as the administrative agent, which provides for term loans to be made to us in a series of draws up to $100 million. The Junior Credit Facility has a stated maturity of five years and is secured by a second priority lien on substantially all of our assets. As of December 31, 2014, there was $35 million outstanding under the Junior Credit Facility.
By December 31, 2014, our borrowing capacity under our credit facilities increased from an aggregate of $63 million to $145 million. In conjunction with the increase in our borrowing base, we have expanded the syndicate of banks under our Senior Credit Facility. Led by Wells Fargo, as administrative agent, Bank of America Merrill Lynch and the Bank of Nova Scotia have now joined the banking group.
On May 14, 2015, Sundance Energy Australia Limited and Sundance Energy, Inc. entered into a Credit Agreement (the “Credit Agreement”) with Morgan Stanley Energy Capital, Inc., as administrative agent (“Agent”) and the lenders from time to time party thereto, which provides for a $300 million senior secured revolving credit facility (the “Revolving Facility”) and term loans of $125 million (the “Term Loans), with an accordion feature providing for additional term loans of up to $50 million, subject to certain conditions The Revolving Facility is subject to a borrowing base, which has been set initially at $75 million. At closing on May 14, 2015, $25 million was drawn on the Revolving Facility and $125 million of Term Loans were funded. The Revolving Facility has a five year term and the Term Loans have a 5 ½ year term.
The Revolving Facility and Term Loans refinanced the Company’s credit facilities with Wells Fargo Bank, N.A. and Wells Fargo Energy Capital, Inc., respectively. At closing, the Company used $145.0 million of the proceeds to pay off its previous credit facilities, which were fully paid-off. Approximately $1.1 million of deferred financing fees related to the previous credit facilities were written off due to the refinance.
For a description of the material terms of our credit facilities, see Item 5.B. “Operating and Financial Review and Prospects-Liquidity and Capital Resources—Credit Facilities.”
D. Exchange Controls
The Australian dollar is convertible into U.S. dollars at freely floating rates. There are no legal restrictions on the flow of Australian dollars between Australia and the United States. Any remittances of dividends or other payments by Sundance to persons in the United States are not and will not be subject to any exchange controls.
E. Taxation
The following is a summary of material U.S. federal and Australian income tax considerations to U.S. holders, as defined below, of the acquisition, ownership and disposition of ordinary shares. This discussion is based on the tax laws in force as of the date of this annual report, and is subject to changes in the relevant tax law, including changes that could have retroactive effect. The following summary does not take into account or discuss the tax laws of any country or other taxing jurisdiction other than the United States and Australia. Holders are advised to consult their tax advisors concerning the overall tax consequences of the acquisition, ownership and disposition of ordinary shares in their particular circumstances. This discussion is not intended, and should not be construed, as legal or professional tax advice.
This summary does not describe U.S. federal estate and gift tax considerations or any state and local tax considerations within the United States, and is not a comprehensive description of all U.S. federal or Australian income tax considerations that may be relevant to a decision to acquire, hold or dispose of ordinary shares. Furthermore, this summary does not address U.S. federal or Australian income tax considerations relevant to holders subject to taxing jurisdictions other than, or in addition to, the United States and Australia, and does not address all possible categories of holders, some of which may be subject to special tax rules.
U.S. Federal Income Tax Considerations
The following summary describes the material U.S. federal income tax consequences to U.S. holders of the acquisition, ownership and disposition of our ordinary shares as of the date hereof. Except where noted, this summary deals only with ordinary shares held as capital assets within the meaning of Section 1221 of the Internal Revenue Code of 1986, as amended (the “Code”). This section does not discuss the tax consequences to any particular holder, nor any tax considerations that may apply to holders subject to special tax rules, such as:
· insurance companies;
· financial institutions;
· individual retirement and other tax-deferred accounts;
· regulated investment companies;
· real estate investment trusts;
· individuals who are former U.S. citizens or former long-term U.S. residents;
· brokers or dealers in securities or currencies;
· traders that elect to use a mark-to-market method of accounting;
· investors in pass-through entities for U.S. federal income tax purposes;
· tax-exempt entities;
· persons subject to the alternative minimum tax;
· persons that hold ordinary shares as a position in a straddle or as part of a hedging, wash sale, constructive sale or conversion transaction for U.S. federal income tax purposes;
· persons that have a functional currency other than the U.S. dollar;
· persons that own (directly, indirectly or constructively) 10% or more of our equity; or
· persons that are not U.S. holders (as defined below).
In this section, a “U.S. holder” means a beneficial owner of ordinary shares that is, for U.S. federal income tax purposes:
· an individual who is a citizen or resident of the United States;
· a corporation, or other entity treated as a corporation for U.S. federal income tax purposes, created or organized in or under the laws of the United States or any state thereof or the District of Columbia;
· an estate the income of which is subject to U.S. federal income taxation regardless of its source; or
· a trust (i) the administration of which is subject to the primary supervision of a court in the United States and for which one or more U.S. persons have the authority to control all substantial decisions or (ii) that has an election in effect under applicable income tax regulations to be treated as a U.S. person.
The discussion below is based upon the provisions of the Code, and the U.S. Treasury regulations, rulings and judicial decisions thereunder as of the date hereof, and such authorities may be replaced, revoked or modified, possibly with retroactive effect, so as to result in U.S. federal income tax consequences different from those discussed below.
If an entity or arrangement treated as a partnership for U.S. federal income tax purposes acquires, owns or disposes of ordinary shares, the U.S. federal income tax treatment of a partner generally will depend on the status of the partner and the activities of the partnership. Partners of partnerships that acquire, own or dispose of ordinary shares should consult their tax advisors.
You are urged to consult your own tax advisor with respect to the U.S. federal, as well as state, local and non-U.S., tax consequences to you of acquiring, owning and disposing of ordinary shares in light of your particular circumstances, including the possible effects of changes in U.S. federal and other tax laws.
Distributions
Subject to the passive foreign investment company rules discussed below, U.S. holders generally will include as dividend income the U.S. dollar value of the gross amount of any distributions of cash or property (without deduction for any withholding tax), other than certain pro rata distributions of ordinary shares, with respect to ordinary shares to the extent the distributions are made from our current or accumulated earnings and profits, as determined for U.S. federal income tax purposes. A U.S. holder of ordinary shares will include the dividend income on the day actually or constructively received by the holder. To the extent, if any, that the amount of any distribution by us exceeds our current and accumulated earnings and profits, as so determined, the excess will be treated first as a tax-free return of the U.S. holder’s tax basis in the ordinary shares and thereafter as capital gain. Notwithstanding the foregoing, we do not intend to maintain calculations of earnings and profits, as determined for U.S. federal income tax purposes. Consequently, any distributions generally will be reported as dividend income for U.S. information reporting purposes. See “Backup Withholding Tax and Information Reporting Requirements” below. Dividends paid by us will not be eligible for the dividends-received deduction generally allowed to U.S. corporate shareholders.
Subject to certain exceptions for short-term and hedged positions, the U.S. dollar amount of dividends received by an individual, trust or estate with respect to the ordinary shares will be subject to taxation at a maximum rate of 20% if the dividends are “qualified dividends.” Dividends paid on ordinary shares will be treated as qualified dividends if (i) either (a) we are eligible for the benefits of a comprehensive income tax treaty with the United States that the Internal Revenue Service (the “IRS”) has approved for the purposes of the qualified dividend rules, or (b) the dividends are with respect to ordinary shares readily tradable on a U.S. securities market, provided that we are not, in the year prior to the year in which the dividend was paid, and are not, in the year which the dividend is paid, a PFIC and (ii) certain holding period requirements are met. The Agreement between the Government of the United States of America and the Government of Australia for the Avoidance of Double Taxation and the Prevention of Fiscal Evasion with Respect to Taxes on Income (the “Treaty”) has been approved for the purposes of the qualified dividend rules, and we expect to qualify for benefits under the Treaty. However, the determination of whether a dividend qualifies for the preferential tax rates must be made at the time the dividend is paid. U.S. holders should consult their own tax advisors.
Includible distributions paid in Australian dollars, including any Australian withholding taxes, will be included in the gross income of a U.S. holder in a U.S. dollar amount calculated by reference to the spot exchange rate in effect on the date of actual or constructive receipt, regardless of whether the Australian dollars are converted into U.S. dollars at that time. If Australian dollars are converted into U.S. dollars on the date of actual or constructive receipt, the tax basis of the U.S. holder in those Australian dollars will be equal to their U.S. dollar value on that date and, as a result, a U.S. holder generally should not be required to recognize any foreign exchange gain or loss.
If Australian dollars so received are not converted into U.S. dollars on the date of receipt, the U.S. holder will have a basis in the Australian dollars equal to their U.S. dollar value on the date of receipt. Any gain or loss on a subsequent conversion or other disposition of the Australian dollars generally will be treated as ordinary income or loss to such U.S. holder and generally will be income or loss from sources within the United States for foreign tax credit limitation purposes.
Dividends received by a U.S. holder with respect to ordinary shares will be treated as foreign source income, which may be relevant in calculating the holder’s foreign tax credit limitation. The limitation on foreign taxes eligible for credit is
calculated separately with respect to specific classes of income. For these purposes, dividends generally will be categorized as “passive” or “general” income depending on a U.S. holder’s circumstance.
Subject to certain complex limitations, a U.S. holder generally will be entitled, at its option, to claim either a credit against its U.S. federal income tax liability or a deduction in computing its U.S. federal taxable income in respect of any Australian taxes withheld. If a U.S. holder elects to claim a deduction, rather than a foreign tax credit, for Australian taxes withheld for a particular taxable year, the election will apply to all foreign taxes paid or accrued by or on behalf of the U.S. holder in the particular taxable year.
You may not be able to claim a foreign tax credit (and instead may claim a deduction) for non-U.S. taxes imposed on dividends paid on the ordinary shares if you (i) have held the ordinary shares for less than a specified minimum period during which you are not protected from risk of loss with respect to such shares, or (ii) are obligated to make payments related to the dividends (for example, pursuant to a short sale).
The availability of the foreign tax credit and the application of the limitations on its availability are fact specific and are subject to complex rules. You are urged to consult your own tax advisor as to the consequences of Australian withholding taxes and the availability of a foreign tax credit or deduction. See “—Australian Tax Considerations—Taxation of Dividends.”
Sale, Exchange or other Disposition of Ordinary Shares
Subject to the passive foreign investment company rules discussed below, a U.S. holder generally will, for U.S. federal income tax purposes, recognize capital gain or loss on a sale, exchange or other disposition of ordinary shares equal to the difference between the amount realized on the disposition and the U.S. holder’s tax basis (in U.S. dollars) in the ordinary shares. This recognized gain or loss will generally be long-term capital gain or loss if the U.S. holder has held the ordinary shares for more than one year. Generally, for U.S. holders who are individuals (as well as certain trusts and estates), long-term capital gains are subject to U.S. federal income tax at preferential rates. For foreign tax credit limitation purposes, gain or loss recognized upon a disposition generally will be treated as from sources within the United States. The deductibility of capital losses is subject to limitations for U.S. federal income tax purposes.
You should consult your own tax advisor regarding the availability of a foreign tax credit or deduction in respect of any Australian tax imposed on a sale or other disposition of ordinary shares. See “—Australian Tax Considerations—Tax on Sales or other Dispositions of Shares.”
Passive Foreign Investment Company
The Code provides special, generally adverse, rules regarding certain distributions received by U.S. holders with respect to, and sales, exchanges and other dispositions, including pledges, of, shares of stock of a PFIC. A foreign corporation will be treated as a PFIC for any taxable year if at least 75% of its gross income for the taxable year is passive income or at least 50% of its gross assets during the taxable year, based on a quarterly average and generally by value, produce or are held for the production of passive income. Passive income for this purpose generally includes, among other things, dividends, interest, rents, royalties, gains from commodities and securities transactions and gains from assets that produce passive income. In determining whether a foreign corporation is a PFIC, a pro-rata portion of the income and assets of each corporation in which it owns, directly or indirectly, at least a 25% interest (by value) is taken into account.
Based on our business results for the last fiscal year and composition of our assets, we do not believe that we were a PFIC for U.S. federal income tax purposes for the taxable year ended December 31, 2014. Similarly, based on our business projections and the anticipated composition of our assets for the current and future years, we do not expect that we will be a PFIC for the taxable year ending December 31, 2015. However, a separate determination is required after the close of each taxable year as to whether we are a PFIC. If our actual business results do not match our projections, it is possible that we may become a PFIC in the current or any future taxable year. Because the determination of our PFIC status is based on an annual determination that cannot be made until the close of a taxable year, and involves extensive factual investigation, including ascertaining the fair market value of all of our assets on a quarterly basis and the character of each item of income we earn, our U.S. counsel expresses no opinion with respect to our PFIC status.
If we are a PFIC for any taxable year during which a U.S. holder holds ordinary shares, any “excess distribution” that the holder receives and any gain realized from a sale or other disposition (including a pledge) of such ordinary shares will be subject to special tax rules, unless the holder makes a mark-to-market election or qualified electing fund election, as discussed below. Any distribution in a taxable year that is greater than 125% of the average annual distribution received by a U.S. holder during the shorter of the three preceding taxable years or such holder’s holding period for the ordinary shares will be treated as an excess distribution. Under these special tax rules:
· the excess distribution or gain will be allocated ratably over the U.S. holder’s holding period for the ordinary shares;
· the amount allocated to the current taxable year, and any taxable year prior to the first taxable year in which we are a PFIC, will be treated as ordinary income; and
· the amount allocated to each other year will be subject to income tax at the highest rate in effect for that year and the interest charge generally applicable to underpayments of tax will be imposed on the resulting tax attributable to each such year.
The tax liability for amounts allocated to years prior to the year of disposition or excess distribution cannot be offset by any net operating loss, and gains (but not losses) realized on the transfer of the ordinary shares cannot be treated as capital gains, even if the ordinary shares are held as capital assets. In addition, non-corporate U.S. holders will not be eligible for reduced rates of taxation on any dividends that we pay if we are a PFIC for either the taxable year in which the dividend is paid or the preceding year. Furthermore, unless otherwise provided by the U.S. Treasury Department, each U.S. holder of a PFIC is required to file an annual report containing such information as the U.S. Treasury Department may require.
If we are a PFIC for any taxable year during which any of our non-U.S. subsidiaries is also a PFIC, a U.S. holder of ordinary shares during such year would be treated as owning a proportionate amount (by value) of the shares of the lower-tier PFIC for purposes of the application of these rules to such subsidiary. You should consult your tax advisor regarding the tax consequences if the PFIC rules apply to any of our subsidiaries.
In certain circumstances, in lieu of being subject to the excess distribution rules discussed above, you may make an election to include gain on the stock of a PFIC as ordinary income under a mark-to-market method, provided that such stock is regularly traded on a qualified exchange. Generally, a “qualified exchange” includes a foreign securities exchange that is regulated or supervised by a governmental authority of the country in which the market is located and that has certain characteristics. A class of stock is “regularly traded” on an exchange or market for any calendar year during which that class of stock is traded, other than in de minimis quantities, on at least 15 days during each calendar quarter. Our ordinary shares are listed on the ASX. So long as our ordinary shares are regularly traded on that exchange, we expect that the mark-to-market election would be available to you were we to be or become a PFIC.
If you make an effective mark-to-market election, you will include in each year that we are a PFIC as ordinary income the excess of the fair market value of your ordinary shares at the end of your taxable year over your adjusted tax basis in the ordinary shares. You will be entitled to deduct as an ordinary loss in each such year the excess of your adjusted tax basis in the ordinary shares over their fair market value at the end of the year, but only to the extent of the net amount previously included in income as a result of the mark-to-market election. If you make an effective mark-to-market election, any gain you recognize upon the sale or other disposition of your ordinary shares will be treated as ordinary income and any loss will be treated as ordinary loss, but only to the extent of the net amount previously included in income as a result of the mark-to-market election.
Your adjusted tax basis in the ordinary shares will be increased by the amount of any income inclusion and decreased by the amount of any deductions under the mark-to-market rules. If you make a mark-to-market election, it will be effective for the taxable year for which the election is made and all subsequent taxable years unless the ordinary shares are no longer regularly traded on a qualified exchange or the IRS consents to the revocation of the election. You are urged to consult your tax advisor about the availability of the mark-to-market election, and whether making the election would be advisable in your particular circumstances. Any distributions we make would generally be subject to the rules discussed above under “—Taxation of Dividends,” except the reduced rates of taxation on any dividends received from us would not apply.
Alternatively, you can sometimes avoid the PFIC rules described above by electing to treat us as a “qualified electing fund” under Section 1295 of the Code. However, this option likely will not be available to you because we do not intend to comply with the requirements necessary to permit you to make this election.
U.S. holders are urged to contact their own tax advisor regarding the determination of whether we are a PFIC and the tax consequences of such status.
Medicare Tax
A U.S. holder, which is an individual, an estate or a trust that does not fall into a special class of trusts that is exempt from such tax, will be subject to a 3.8% tax (the “Medicare Tax”) on the lesser of (i) the U.S. holder’s “net investment income” for the relevant taxable year and (ii) the excess of the U.S. holder’s modified adjusted gross income for the taxable year over a certain threshold (which in the case of individuals will be between US$125,000 and US$250,000, depending on the individual’s circumstances). A U.S. holder’s net investment income will generally include dividends received on the ordinary shares and net gains from the disposition of ordinary shares, unless such dividend income or net gains are derived in the ordinary course of the conduct of a trade or business (other than a trade or business that consists of certain passive or trading activities). A U.S. holder that is an individual, estate or trust should consult the holder’s tax advisor regarding the applicability of the Medicare Tax to the holder’s dividend income and gains in respect of the holder’s investment in the ordinary shares.
Backup Withholding Tax and Information Reporting Requirements
U.S. backup withholding tax and information reporting requirements may apply to payments to non-corporate holders of ordinary shares. Information reporting will apply to payments of dividends on, and to proceeds from the disposition of, ordinary shares by a paying agent within the United States to a U.S. holder, other than an “exempt recipient,” including a corporation and certain other persons that, when required, demonstrate their exempt status. A paying agent within the United States will be required to withhold at the applicable statutory rate, currently 28%, in respect of any payments of dividends on, and the proceeds from the disposition of, ordinary shares within the United States to a U.S. holder, other than an “exempt recipient,” if the holder fails to furnish its correct taxpayer identification number or otherwise fails to comply with applicable backup withholding requirements. U.S. holders who are required to establish their exempt status generally must provide IRS Form W-9 (Request for Taxpayer Identification Number and Certification).
Backup withholding is not an additional tax. Amounts withheld as a result of backup withholding may be credited against a U.S. holder’s U.S. federal income tax liability. A U.S. holder generally may obtain a refund of any amounts withheld under the backup withholding rules by filing the appropriate claim for refund with the IRS in a timely manner and furnishing any required information.
Under the Hiring Incentives to Restore Employment Act of 2010 and associated Treasury Regulations, certain U.S. holders may be required to report information with respect to such holder’s interest in “specified foreign financial assets” (as defined in Section 6038D of the Code), including stock of a non-U.S. corporation that is not held in an account maintained by a U.S. “financial institution,” if the aggregate value of all such assets exceeds US$50,000 on the last day of the taxable year or US$75,000 at any time during such year. Persons who are required to report specified foreign financial assets and fail to do so may be subject to substantial penalties. U.S. holders are urged to consult their own tax advisors regarding foreign financial asset reporting obligations and their possible application to the holding of ordinary shares.
The discussion above is not intended to constitute a complete analysis of all tax considerations applicable to an investment in ordinary shares. You should consult with your own tax advisor concerning the tax consequences to you in your particular situation.
Australian Tax Considerations
In this section, we discuss the material Australian income tax, stamp duty and goods and services tax considerations related to the acquisition, ownership and disposal by the absolute beneficial owners of the ordinary shares. It is based upon existing Australian tax law as of the date of this annual report, which is subject to change, possibly retrospectively. This discussion does not address all aspects of Australian tax law which may be important to particular investors in light of their individual investment circumstances, such as shares held by investors subject to special tax rules (for example, financial institutions, insurance companies or tax exempt organizations). In addition, this summary does not discuss any foreign or state tax considerations, other than stamp duty and goods and services tax. Prospective investors are urged to consult their tax advisors regarding the Australian and foreign income and other tax considerations of the acquisition, ownership and disposition of the shares. This summary is based upon the premise that the holder is not an Australian tax resident and is not carrying on business in Australia through a permanent establishment.
Taxation of Dividends
Australia operates a dividend imputation system under which dividends may be declared to be “franked” to the extent of tax paid on company profits. Fully franked dividends are not subject to dividend withholding tax. Dividends
payable to non-Australian resident shareholders that are not operating from an Australian permanent establishment (“Foreign Shareholders”) will be subject to dividend withholding tax, to the extent the dividends are not foreign sourced and declared to be conduit foreign income (“CFI”) and are unfranked. Dividend withholding tax will be imposed at 30%, unless a shareholder is a resident of a country with which Australia has a double taxation agreement and qualifies for the benefits of the treaty. Under the provisions of the current Double Taxation Convention between Australia and the United States, the Australian tax withheld on unfranked dividends that are not CFI paid by us to which a resident of the United States is beneficially entitled is limited to 15%.
If a company that is a non-Australian resident shareholder owns a 10% or more interest, the Australian tax withheld on dividends paid by us to which a resident of the United States is beneficially entitled is limited to 5%. In limited circumstances the rate of withholding can be reduced to zero.
Tax on Sales or other Dispositions of Shares—Capital gains tax
Foreign Shareholders will not be subject to Australian capital gains tax on the gain made on a sale or other disposal of our ordinary shares, unless they, together with associates, hold 10% or more of our issued capital, at the time of disposal or for 12 months of the last 2 years prior to disposal.
Foreign Shareholders who own a 10% or more interest would be subject to Australian capital gains tax if more than 50% of our direct or indirect assets, determined by reference to market value, consists of Australian land, leasehold interests or Australian mining, quarrying or prospecting rights. The Double Taxation Convention between the United States and Australia is unlikely to limit the amount of this taxable gain. Australian capital gains tax applies to net capital gains at a taxpayer’s marginal tax rate but for certain shareholders a discount of the capital gain may apply if the shares have been held for 12 months or more prior to disposal. We note that legislation was introduced in June 2013 to remove the 50% discount for foreign resident individuals on gains accrued after May 8, 2012. Companies are not entitled to a discount on capital gains tax. Net capital gains are calculated after reduction for capital losses, which may only be offset against capital gains.
Tax on Sales or other Dispositions of Shares—Shareholders Holding Shares on Revenue Account
Some Foreign Shareholders may hold shares on revenue rather than on capital account for example, share traders. These shareholders may have the gains made on the sale or other disposal of the shares included in their assessable income under the ordinary income provisions of the income tax law, if the gains are sourced in Australia.
Non-Australian resident shareholders assessable under these ordinary income provisions in respect of gains made on shares held on revenue account would be assessed for such gains at the Australian tax rates for non-Australian residents, which start at a marginal rate of 32.5%. Some relief from Australian income tax may be available to such non-Australian resident shareholders under the Double Taxation Convention between the United States and Australia.
To the extent an amount would be included in a non-Australian resident shareholder’s assessable income under both the capital gains tax provisions and the ordinary income provisions, the capital gain amount would generally be reduced, so that the shareholder would not be subject to double tax on any part of the income gain or capital gain.
Dual Residency
If a shareholder were a resident of both Australia and the United States under those countries’ domestic taxation laws, that shareholder may be subject to tax as an Australian resident. If, however, the shareholder is determined to be a U.S. resident for the purposes of the Double Taxation Convention between the United States and Australia, the Australian tax would be subject to limitation by the Double Taxation Convention. Shareholders should obtain specialist taxation advice in these circumstances.
Stamp Duty
No stamp duty is payable by Australian residents or foreign residents on the issue and trading of shares that are quoted on the ASX at all relevant times and the shares do not represent 90% or more of all issued shares in Sundance.
Australian Death Duty
Australia does not have estate or death duties. As a general rule, no capital gains tax liability is realized upon the inheritance
of a deceased person’s shares. The disposal of inherited shares by beneficiaries may, however, give rise to a capital gains tax liability if the gain falls within the scope of Australia’s jurisdiction to tax (as discussed above).
F. Dividends and Paying Agents
Not applicable.
G. Statement by Experts
Not applicable.
H. Documents on Display
Inspection of our records is governed by the Corporations Act. Any member of the public has the right to inspect or obtain copies of our registers on the payment of a prescribed fee. Shareholders are not required to pay a fee for inspection of our registers or minute books of the meetings of shareholders. Other corporate records, including minutes of directors’ meetings, financial records and other documents, are not open for inspection by shareholders. Where a shareholder is acting in good faith and an inspection is deemed to be made for a proper purpose, a shareholder may apply to the court to make an order for inspection of our books.
I. Subsidiary Information
Not applicable.
Item 11. Quantitative and Qualitative Disclosures about Market Risk
We are exposed to a variety of financial market risks including interest rate, commodity prices, foreign exchange and liquidity risk. Our risk management focuses on the volatility of commodity markets and protecting cash flow in the event of declines in commodity pricing. We utilize derivative financial instruments to hedge certain risk exposures. Our financial instruments consist mainly of deposits with banks, short-term investments, accounts receivable, derivative financial instruments, finance facility and payables. The main purpose of non-derivative financial instruments is to raise finance for our operations.
See to Note 33 of our December 31, 2014 financial statements included in this annual report for detailed information on our financial risk management.
Treasury Risk Management
Financial risk management is carried out by our management. Our board of directors sets financial risk management policies and procedures to which our management is required to adhere. Our management identifies and evaluates financial risks and enters into financial risk instruments to mitigate these risk exposures in accordance with the policies and procedures outlined by our board of directors.
Financial Risk Exposure and Management
The main risk to which we are exposed through our financial instruments is interest rate risk. We manage interest rate risk with a mixture of fixed and floating rate cash deposits. As of December 31, 2014, none of our deposits were fixed. It is our policy to keep surplus cash in interest-yielding deposits.
Interest Rate Sensitivity Analysis
We perform a sensitivity analysis relating to our exposure to interest rate risk. The sensitivity analysis demonstrates the effect on results and equity that could result from a change in these risks. The impact on equity is the same as the impact on income. The effect on income as a result of changes in the interest rate, based on net debt position as of December 31, 2014 and taking into consideration interest rate swaps, with all other variables remaining constant for the year ended December 31, 2014, would be as follows (in $ ‘000s):
Effect on profit before tax Increase/(decrease) |
|
|
| ||
—increase in interest rates + 2% |
| $ |
| (906 | ) |
—decrease in interest rates - 2% |
| 184 |
| ||
Commodity Price Risk Exposure and Management
Our board of directors actively reviews oil and natural gas hedging on a monthly basis. Reports providing detailed analysis of our hedging activity are continually monitored against our policy. We sell our oil and natural gas on market using NYMEX market spot rates reduced for basis differentials in the basins from which we produce. We use forward contracts to manage our commodity price risk exposure. Our current policy is to hedge up to 80% of forecasted proved developed producing production, but not more than 25% of total estimated production for the next five years.
The following table provides a summary of derivative contracts as of December 31, 2014:
|
|
|
|
|
| Units per month |
| Floor |
| Ceiling |
|
|
| ||||||
Description |
| Commodity |
| Basis |
| 2015 |
| 2016 |
| 2017 |
| Price |
| Price |
| Term |
| ||
Collar |
| Oil (Bbls) |
| NYMEX-WTI |
| 2,000 |
| — |
| — |
| $ | 75.00 |
| $ | 98.65 |
| Jan ‘15 – Dec ‘15 |
|
Collar |
| Oil (Bbls) |
| LLS |
| 3,000 |
| — |
| — |
| 85.00 |
| 101.05 |
| Jan ‘15 – Dec ‘15 |
| ||
Collar |
| Oil (Bbls) |
| NYMEX-WTI |
| 2,000 |
| — |
| — |
| 80.00 |
| 97.00 |
| Jan ‘15 – Dec ‘15 |
| ||
Collar |
| Oil (Bbls) |
| NYMEX-WTI |
| 1,000 |
| — |
| — |
| 80.00 |
| 94.94 |
| Jan ‘15 – Dec ‘15 |
| ||
Swap |
| Oil (Bbls) |
| LLS |
| 2,000 |
|
|
| — |
| 91.65 |
| 91.65 |
| Jan ‘15 – Dec ‘15 |
| ||
Swap |
| Oil (Bbls) |
| LLS |
| 5,000 |
| — |
| — |
| 98.05 |
| 98.05 |
| Jan ‘15 – Jun ‘15 |
| ||
Swap |
| Oil (Bbls) |
| LLS |
| 3,000 |
|
|
| — |
| 94.10 |
| 94.10 |
| Jul ‘15 – Dec ‘15 |
| ||
Swap |
| Oil (Bbls) |
| NYMEX-WTI |
| 2,000 |
| — |
| — |
| 95.08 |
| 95.08 |
| Jan ‘15 – Dec ‘15 |
| ||
Swap |
| Oil (Bbls) |
| LLS |
| 2,000 |
| — |
| — |
| 97.74 |
| 97.74 |
| Jan ‘15 – Dec ‘15 |
| ||
Swap |
| Oil (Bbls) |
| LLS |
| 5,000 |
| — |
| — |
| 100.70 |
| 100.70 |
| Jan ‘15 – Jun ‘15 |
| ||
Swap |
| Oil (Bbls) |
| LLS |
| — |
| 5,000 |
| — |
| 94.10 |
| 94.10 |
| Jan ‘16 – Dec ‘16 |
| ||
Total Oil/Weighted Average Price |
|
|
|
|
| 27,000 |
| 5,000 |
| — |
| $ | 91.08 |
| $ | 96.74 |
| Jan ‘14 - Dec ‘16 |
|
Swap |
| Gas (MCF) |
| HH |
| 20,000 |
| — |
| — |
| $ | 4.14 |
| $ | 4.14 |
| Jan ‘15 - Dec ‘15 |
|
Total Gas/Weighted Average Price |
|
|
|
|
| 20,000 |
| — |
| — |
| $ | 4.14 |
| $ | 4.14 |
| Jan ‘15 - Dec ‘15 |
|
In the above tables, “NYMEX-WTI” refers to NYMEX-West Texas Intermediate, “NYMEX-HH” refers to NYMEX-Henry Hub, “LLS” refers to Light Louisiana Sweet and “HSC” refers to Houston Ship Channel.
Oil Prices Risk Sensitivity Analysis
The table below summarizes the impact on income and equity for changes in commodity prices on the fair value of derivative financial instruments. The impact on equity is the same as the impact on income as these derivative financial instruments have not been designated as hedges and are, and therefore, fair valued through the statement of operations. The effect on income as a result of changes in crude oil and natural gas prices, with all variables remaining constant, for the ear ended December 31, 2014 would be as follows (in $ ‘000s):
Effect on profit before tax Increase/(decrease) |
|
|
| |
Oil |
|
|
| |
—improvement in oil price of $10 per Bbl |
| $ | (2,400 | ) |
—decline in oil price of $10 per Bbl |
| 3,041 |
| |
Gas |
|
|
| |
—improvement in gas price of $0.50 per Mcf |
| $ | (120 | ) |
—decline in gas price of $0.50 per Mcf |
| 120 |
| |
Counterparty and Customer Credit Risk
In connection with our hedging activity, we have exposure to financial institutions in the form of derivative transactions. The counterparties on our derivative instruments currently in place have investment-grade credit ratings. We expect that any future derivative transactions we enter into will be with these counterparties or our lenders under our credit facilities that will carry an investment-grade credit rating.
We are also subject to credit risk due to concentration of our oil and natural gas receivables with certain significant customers. The inability or failure of our significant customers to meet their obligations to us or their insolvency or liquidation may adversely affect our financial results. We review the credit rating, payment history and financial resources of our customers, but we do not require our customers to post collateral. At December 31, 2014, we had three customers that owed more than $1.0 million each and accounted for approximately 75% of total accrued revenue receivables. There was one customer with balances greater than $5.0 million accounting for approximately 56% of total accrued revenue receivables. For joint interest billing receivables, if payment is not made, we can withhold future payments of revenue, as such, there is minimal to no credit risk associated with these receivables.
Item 12. Description of Securities Other than Equity Securities
Not applicable.
Item 13. Defaults, Dividend Arrearages and Delinquencies
Not applicable.
Item 14. Material Modifications to the Rights of Security Holders and Use of Proceeds
Not applicable.
Item 15. Controls and Procedures
(a) Disclosure Controls and Procedures
As of December 31, 2014, under the supervision and with the participation of our management, including our Chief Executive Officer and Chief Financial Officer, we performed an evaluation of the effectiveness of the design and operation of our disclosure controls and procedures (as defined in Rule 13a-15(e) under the Exchange Act). There are inherent limitations to the effectiveness of any disclosure controls and procedures system, including the possibility of human error and circumventing or overriding them. Even if effective, disclosure controls and procedures can provide only reasonable assurance of achieving their control objectives.
Based on such evaluation, our Chief Executive Officer and Chief Financial Officer concluded that our disclosure controls and procedures are effective to provide reasonable assurance that the information we are required to disclose in the reports we file or submit under the Exchange Act is (i) recorded, processed, summarized and reported within the time periods specified in the SEC’s rules and forms and (ii) accumulated and communicated to our management, including our Chief Executive Officer and Chief Financial Officer, to allow timely decisions regarding required disclosure.
(b) Management’s Annual Report on Internal Control over Financial Reporting
This annual report does not include a report of management’s assessment regarding internal control over financial reporting or an attestation report of the company’s registered public accounting firm due to a transition period established by rules of the Securities and Exchange Commission for newly public companies.
(c) Attestation Report of the Registered Public Accounting Firm
Not applicable.
(d) Changes in Internal Control over Financial Reporting
There was no change in our internal control over financial reporting that occurred during the period covered by this annual report that has materially affected, or is reasonably likely to materially affect, our internal control over financial reporting.
Item 16A. Audit Committee Financial Expert
The Board of Directors has determined that Damien Hannes qualifies as an “audit committee financial expert,” as that term is defined in Item 16A of Form 20-F and is independent. See “Item 6.A. - Directors and Senior Management” for Mr. Hannes’s experience and qualifications.
The Company has a Code of Conduct and Ethics which establishes the practices that directors, management and staff must follow in order to comply with the law, meet shareholder expectations, maintain public confidence in the Sundance’s integrity, and provide a process for reporting and investigating unethical practices. The Code of Conduct is available in the corporate governance section of Sundance’s website.
Item 16C. Principal Accountant Fees and Services
The following table sets forth the aggregate fees paid by categories specified below in connection with certain professional services rendered by Ernst and Young, our principal external auditors, for the periods indicated.
|
| Year Ended |
| ||||
|
| 2014 |
| 2013 |
| ||
Audit fees (a) |
| $ | 673,642 |
| $ | 520,996 |
|
Audit - related fees |
| — |
| — |
| ||
Tax fees (b) |
| 68,815 |
| 76,708 |
| ||
Other services (c) |
| — |
| 47,783 |
| ||
Total |
| $ | 742,457 |
| $ | 645,487 |
|
(a) Fees for audit services billed in 2013 and 2014 consisted of:
· Audit of the Company’s annual financial statements;
· Review of the Company’s half-year financial statements; and
· Services related to SEC matters.
(b) Fees for tax services billed in 2013 and 2014 consisted of tax compliance and tax planning advice. Tax compliance services are services rendered based upon facts already in existence or transactions that have already occurred to document, compute and obtain government approval for amounts to be included in tax filings.
(c) Fees for other services billed in 2013 consisted of non-audit services related to the acquisition of Texon.
Pre-approval policies and procedures
The policy of our Audit Committee is to pre-approve all audit and non-audit services performed by our auditors in order to assure that the provision of such services does not impair the audit firm’s independence. Pre-approved services include audit services, audit-related services, tax services and other services as described above, other than those for de minimus services which are approved by our Audit Committee prior to the completion of the audit. Additional services may be pre-approved by the Audit Committee on an individual basis.
All of the audit fees, audit-related fees and tax fees described in this item have been approved by the Audit Committee.
Item 16D. Exemptions from the Listing Standards for Audit Committees.
Not applicable.
Item 16E. Purchases of Equity Securities by the Issuer and Affiliated Purchasers
Not applicable.
Item 16F. Change in Registrant’s Certifying Accountant
Not applicable.
Item 16G. Corporate Governance
Not applicable.
Item 16H. Mine Safety Disclosure
Not applicable.
Refer to “Item 18 – Financial Statements” below
The financial statements are included as the “F” pages to this annual report.
See Exhibit Index.
Appendix A
GLOSSARY OF SELECTED OIL AND NATURAL GAS TERMS
We are in the business of exploring for and producing oil and natural gas. Oil and natural gas exploration is a specialized industry. Many of the terms used to describe our business are unique to the oil and natural gas industry. The following is a description of the meanings of some of the oil and natural gas industry terms used in this document.
3-D seismic data. Geophysical data that depicts the subsurface strata in three dimensions.
Analogous reservoir. Analogous reservoirs, as used in resource assessments, have similar rock and fluid properties, reservoir conditions (depth, temperature, and pressure) and drive mechanisms, but are typically at a more advanced stage of development than the reservoir of interest and thus may provide concepts to assist in the interpretation of more limited data and estimation of recovery. When used to support proved reserves, analogous reservoir refers to a reservoir that shares all of the following characteristics with the reservoir of interest: (i) the same geological formation (but not necessarily in pressure communication with the reservoir of interest; (ii) the same environment of deposition; (iii) similar geologic structure; and (iv) the same drive mechanism.
Basin. A large natural depression on the earth’s surface in which sediments accumulate.
Bbl. One stock tank barrel, or 42 U.S. gallons liquid volume, of oil or other liquid hydrocarbons.
Boe. Barrels of oil equivalent, with 6,000 cubic feet of natural gas being equivalent to one barrel of oil.
Boe/d. Barrels of oil equivalent per day.
Btu or British thermal unit. The quantity of heat required to raise the temperature of one pound of water by one degree Fahrenheit.
Constant case. The reserve report case using the first of the month average pricing for the trailing 12 months held constant throughout the life of the reserves as prescribed by the U.S. Securities and Exchange Commission (SEC).
Completion. The installation of permanent equipment for the production of oil or natural gas.
Deterministic method. The method of estimating reserves or resources is called deterministic when a single value for each parameter (from the geoscience, engineering or economic data) in the reserves calculation is used in the reserves estimation procedure.
Developed acreage. The number of acres that are allocated or assignable to productive wells or wells capable of production.
Development costs. Costs incurred to obtain access to proved reserves and to provide facilities for extracting, treating, gathering and storing oil and natural gas.
Development well. A well drilled within the proved boundaries of an oil or natural gas reservoir with the intention of completing the stratigraphic horizon known to be productive.
Dry well. A well found to be incapable of producing hydrocarbons in sufficient quantities such that proceeds from the sale of such production exceeds production expenses and taxes.
Economically producible or viable. The term economically producible or economically viable, as it relates to a resource, means a resource that generates revenue that exceeds, or is reasonably expected to exceed, the costs of the operation. The value of the products that generate revenue shall be determined at the terminal point of oil and natural gas producing activities.
Estimated ultimate recovery or EUR. Estimated ultimate recovery is the sum of reserves remaining as of a given date and cumulative production as of that date.
Exploitation. Optimizing oil and natural gas production from producing properties or establishing additional reserves in producing areas through additional drilling or the application of new technology.
Exploratory well. A well drilled to find and produce oil or natural gas reserves not classified as proved, to find a new reservoir in a field previously found to be productive of oil or natural gas in another reservoir or to extend a known reservoir.
Field. An area consisting of either a single reservoir or multiple reservoirs all grouped on or related to the same individual geological structural feature and/or stratigraphic condition.
Gross acres or gross wells. The total acres or wells, as the case may be, in which a working interest is owned.
Held-by-production acreage. Acreage covered by a mineral lease that perpetuates a company’s right to operate a property as long as the property produces a minimum paying quantity of oil or gas.
Horizontal well. A well in which a portion of the well has been drilled horizontally within a productive or potentially productive formation. This operation usually results in the ability of the well to produce higher volumes than a vertical well drilled in the same formation.
Hydraulic fracturing or fracking. The technique of improving a well’s production or injection rates by pumping a mixture of fluids into the formation and rupturing the rock, creating an artificial channel. As part of this technique, sand or other material may also be injected into the formation to keep the channel open, so that fluids or natural gases may more easily flow through the formation.
Injection. A well which is used to place liquids or natural gases into the producing zone during secondary/tertiary recovery operations to assist in maintaining reservoir pressure and enhancing recoveries from the field.
MBoe. Thousand barrels of oil equivalent with 6,000 cubic feet of natural gas being equivalent to one barrel of oil.
MMBoe. Million barrels of oil equivalent with 6,000 cubic feet of natural gas being equivalent to one barrel of oil.
Mcf. Thousand cubic feet of natural gas.
MMBtu. Million British Thermal Units.
Natural gas liquids or NGLs. Hydrocarbons found in natural gas which may be extracted as liquefied petroleum gas and natural gasoline.
Net acres or net wells. The sum of the fractional working interests owned in gross acres or wells, as the case may be. An owner who has 50% interest in 100 acres owns 50 net acres.
NYMEX. New York Mercantile Exchange.
Overriding royalty interest. A fractional, undivided interest or right of participation in the oil or natural gas, or in the proceeds from the sale of the oil or natural gas, produced from a specified tract or tracts, which is limited in duration to the terms of an existing lease and which is not subject to any portion of the expense of development, operation or maintenance.
Possible Reserves. Possible reserves are those additional reserves that are less certain to be recovered than probable reserves. When deterministic methods are used, the total quantities ultimately recovered from a project have a low probability of exceeding proved plus probable plus possible reserves. When probabilistic methods are used, there should be at least a 10% probability that the total quantities ultimately recovered will equal or exceed proved plus probable plus possible reserves estimates.
Probable Reserves. Probable reserves are those additional reserves that are less certain to be recovered than proved reserves but which, together with proved reserves, are as likely as not to be recovered. When deterministic methods are used, it is as likely as not that actual remaining quantities recovered will exceed the sum of estimated proved plus probable reserves. When probabilistic methods are used, there should be at least a 50% probability that the actual quantities recovered will equal or exceed the proved plus probable reserves estimates.
Probabilistic method. The method of estimation of reserves or resources is called probabilistic when the full range of values that could reasonably occur for each unknown parameter (from the geoscience and engineering data) is used to generate a full range of possible outcomes and their associated probabilities of occurrence.
Productive well. A well that is producing or is capable of production, including natural gas wells awaiting pipeline connections to commence deliveries and oil wells awaiting connection to production facilities.
Prospect. A specific geographic area which, based on supporting geological, geophysical or other data and also preliminary economic analysis using reasonably anticipated prices and costs, is deemed to have potential for the discovery of commercial hydrocarbons.
Proved oil and natural gas reserves or Proved reserves. Proved oil and natural gas reserves are those quantities of oil and natural gas, which, by analysis of geoscience and engineering data, can be estimated with reasonable certainty to be economically producible from a given date forward, from known reservoirs, and under existing economic conditions, operating methods, and government regulation prior to the time at which contracts providing the right to operate expire, unless evidence indicates that renewal is reasonably certain, regardless of whether deterministic or probabilistic methods are used for estimation. The project to extract the hydrocarbons must have commenced, or the operator must be reasonably certain that it will commence the project, within a reasonable time.
The area of the reservoir considered as proved includes all of the following: (i) the area identified by drilling and limited by fluid contacts, if any; and (ii) adjacent undrilled portions of the reservoir that can, with reasonable certainty, be judged to be continuous with it and to contain economically producible oil and natural gas on the basis of available geoscience and engineering data.
In the absence of data on fluid contacts, proved quantities in a reservoir are limited by the lowest known hydrocarbons as seen in a well penetration unless geoscience, engineering or performance data and reliable technology establish a lower contact with reasonable certainty. Where direct observation from well penetrations has defined a highest known oil elevation and the potential exists for an associated gas cap, proved oil reserves may be assigned in the structurally higher portions of the reservoir only if geoscience, engineering or performance data and reliable technology establish the higher contact with reasonable certainty.
Reserves that can be produced economically through application of improved recovery techniques (including, but not limited to, fluid injection) are included in the proved classification when: (i) successful testing by a pilot project in an area of the reservoir with properties no more favorable than in the reservoir as a whole, the operation of an installed program in the reservoir or an analogous reservoir or other evidence using reliable technology establishes the reasonable certainty of the engineering analysis on which the project or program was based; and (ii) the project has been approved for development by all necessary parties and entities, including governmental entities.
Existing economic conditions include prices and costs at which economic producibility from a reservoir is to be determined. The price shall be the 12-month first day of the month historical average price during the twelve- month period prior to the ending date of the period covered by the report, determined as an unweighted arithmetic average of the first-day-of- the-month price for each month within such period, unless prices are defined by contractual arrangements, excluding escalations based upon future conditions.
Proved undeveloped reserves or PUD. Proved reserves that are expected to be recovered from new wells on undrilled acreage, or from existing wells where a relatively major expenditure is required for recompletion. Reserves on undrilled acreage shall be limited to those directly offsetting development spacing areas that are reasonably certain of production when drilled, unless evidence using reliable technology exists that establishes reasonable certainty of economic producibility at greater distances. Undrilled locations can be classified as having undeveloped reserves only if a development plan has been adopted indicating that they are scheduled to be drilled within five years, unless the specific circumstances justify a longer time. Under no circumstances shall estimates for proved undeveloped reserves be attributable to any acreage for which an application of fluid injection or other improved recovery technique is contemplated, unless such techniques have been proved effective by actual projects in the same reservoir or an analogous reservoir, or by other evidence using reliable technology establishing reasonable certainty.
Reasonable certainty. If deterministic methods are used, reasonable certainty means a high degree of confidence that the quantities will be recovered. If probabilistic methods are used, there should be at least a 90% probability that the quantities actually recovered will equal or exceed the estimate. A high degree of confidence exists if the quantity is much more likely to be achieved than not, and, as changes due to increased availability of geoscience (geological, geophysical and geochemical), engineering and economic data are made to estimated ultimate recovery with time, reasonably certain estimated ultimate recovery is much more likely to increase or remain constant than to decrease.
Reliable technology. Reliable technology is a grouping of one or more technologies (including computational methods) that has been field tested and has been demonstrated to provide reasonably certain results with consistency and repeatability in the formation being evaluated or in an analogous formation.
Reserves. Reserves are estimated remaining quantities of oil and natural gas and related substances anticipated to be economically producible, as of a given date, by application of development projects to known accumulations. In addition, there must exist, or there must be a reasonable expectation that there will exist, the legal right to produce or a revenue interest in the production, installed means of delivering oil and natural gas or related substances to market and all permits and financing required to implement the project.
Reservoir. A porous and permeable underground formation containing a natural accumulation of producible oil and/or natural gas that is confined by impermeable rock or water barriers and is individual and separate from other reservoirs.
Resource play. These plays develop over long periods of time, well- by-well, in large-scale operations. They typically have lower than average long-term decline rates and lower geological and commercial development risk than conventional plays. Unlike most conventional exploration and development, resource plays are relatively predictable in timing, costs, production rates and reserve additions which can provide steady long-term reserves and production growth.
Resources. Resources are quantities of oil and natural gas estimated to exist in naturally occurring accumulations. A portion of the resources may be estimated to be recoverable and another portion may be considered unrecoverable. Resources include both discovered and undiscovered accumulations.
Stratigraphic horizon. A sealed geologic container capable of retaining hydrocarbons that was formed by changes in rock type or pinch-outs, unconformities, or sedimentary features such as reefs.
Undeveloped acreage. Lease acreage on which wells have not been drilled or completed to a point that would permit the production of commercial quantities of oil or natural gas regardless of whether or not such acreage contains proved reserves.
Undeveloped oil and natural gas reserves or Undeveloped reserves. Undeveloped oil and natural gas reserves are reserves of any category that are expected to be recovered from new wells on undrilled acreage, or from existing wells where a relatively major expenditure is required for recompletion. Reserves on undrilled acreage shall be limited to those directly offsetting development spacing areas that are reasonably certain of production when drilled, unless evidence using reliable technology exists that establishes reasonable certainty of economic producibility at greater distances. Undrilled locations can be classified as having undeveloped reserves only if a development plan has been adopted indicating that they are scheduled to be drilled within five years, unless the specific circumstances justify a longer time. Under no circumstances shall estimates for undeveloped reserves be attributable to any acreage for which an application of fluid injection or other improved recovery technique is contemplated, unless such techniques have been proved effective by actual projects in the same reservoir or an analogous reservoir, or by other evidence using reliable technology establishing reasonable certainty.
Working interest. The operating interest that gives the owner the right to drill, produce and conduct operating activities on the property and receive a share of production.
Workover. The repair or stimulation of an existing production well for the purpose of restoring, prolonging or enhancing the production of hydrocarbons.
INDEX TO FINANCIAL STATEMENTS
Sundance Energy Australia Limited |
|
Unaudited Pro Forma Condensed Consolidated Financial Statements: | F-2 |
Introduction | F-2 |
F-3 | |
Consolidated Financial Statements for December 31, 2014 and 2013 and the Years Then Ended: |
|
F-4 | |
Consolidated Statement of Profit or Loss and Other Comprehensive Income | F-5 |
F-6 | |
F-7 | |
F-8 | |
F-9 | |
Consolidated Financial Statements for December 31, 2013 and the Year Then Ended: |
|
F-60 | |
Consolidated Statement of Profit or Loss and Other Comprehensive Income | F-61 |
F-62 | |
F-63 | |
F-64 | |
F-65 | |
Consolidated Financial Statements for December 31, 2012 and the Six- Month Period Then Ended: |
|
F-102 | |
Consolidated Statement of Profit or Loss and Other Comprehensive Income | F-103 |
F-104 | |
F-105 | |
F-106 | |
F-107 |
SUNDANCE ENERGY AUSTRALIA LIMITED
UNAUDITED PRO FORMA CONDENSED CONSOLIDATED FINANCIAL STATEMENTS
Denver-Julesburg Assets Divestiture
On July 27, 2014, the Company sold its entire interest in the Denver-Julesburg assets for net proceeds of $108.8 million, of which includes the reimbursement of capital expenditures on 8 gross (3.1 net) non-operated horizontal wells in the Denver-Julesburg. The Company’s Denver-Julesburg assets included approximately 5,100 net acres in the Wattenberg field, and the remaining northern Niobrara projects including the Twister, Bull Canyon and Silo prospects. In connection with the sale of the Denver-Julesburg assets, the Company elected “like-kind exchange” treatment under U.S. Internal Revenue Code Section 1031, which provides for deferral of the gain if the proceeds are used to acquire “like-kind property” within six months of the closing of the transaction. The Company deferred a majority of the taxable on the sale of the Denver-Julesburg by acquiring qualified replacement properties.
Pro Forma Condensed Consolidated Financial Statements
The following unaudited pro forma condensed consolidated financial statements are presented to give effect to the disposition of the Denver-Julesburg assets as if these transactions had occurred on January 1, 2014 for the unaudited pro forma condensed consolidated statement of profit or loss. The disposition of the Company’s remaining Bakken assets in July 2014 were excluded from these unaudited pro forma financial statements due to the insignificance of the disposition.
The unaudited pro forma condensed consolidated financial statements are provided for illustrative purposes only, and are not intended to represent or be indicative of the profit or loss of the Company that would have been recorded had the disposition of the Denver-Julesburg assets been completed as of the dates presented and should not be taken as representative of the future profit or loss of the Company. The unaudited condensed consolidated financial statements do not reflect the impact of any potential operational efficiencies, cost savings or economies of scale that the Company may achieve with respect to the consolidated operations. Additionally, the pro forma statement of profit or loss does not include non-recurring charges or credits and the related tax effects which result directly from the transactions.
The unaudited pro forma condensed statement of the profit or loss for the year ended December 31, 2014, which presents our operations as if the disposition of the Denver-Julesburg assets had occurred on January 1, 2014, has been derived from the following:
· Our statement of profit or loss for the year ended December 31, 2014; and
· Denver-Julesburg statement of profit or loss for the period from January 1, 2014 through July 27, 2014, the date the assets were sold.
As the Denver-Julesburg divestiture has been reflected in the Company’s statement of financial position as at December 31, 2014, there is no impact to the pro forma condensed statement of financial position as a result of those transactions.
The unaudited pro forma condensed consolidated financial statements should be read in conjunction with the historical consolidated financial statements and accompanying notes contained in the referenced financial statements.
SUNDANCE ENERGY AUSTRALIA LIMITED
UNAUDITED PRO FORMA CONDENSED CONSOLIDATED STATEMENT OF PROFIT OR LOSS
FOR THE YEAR ENDED DECEMBER 31, 2014
|
| Sundance |
| Denver-Julesburg |
| Sundance |
| |||
|
|
|
|
|
|
|
| |||
Oil and natural gas revenue (net of transportation) |
| $ | 159,793 |
| $ | (11,528 | ) | $ | 148,265 |
|
Lease operating and production expenses |
| (20,489 | ) | 1,597 |
| (18,892 | ) | |||
|
|
|
|
|
|
|
| |||
Depreciation and amortization expense |
| (85,584 | ) | 1,383 |
| (84,201 | ) | |||
Employee benefits expense |
| (4,979 | ) | — |
| (4,979 | ) | |||
Administrative expense |
| (10,548 | ) | — |
| (10,548 | ) | |||
Finance cost |
| (699 | ) | — |
| (699 | ) | |||
Net gain (loss) on sale of non-current assets |
| 48,604 |
| (47,679 | ) | 925 |
| |||
Gain on commodity hedging |
| 11,009 |
| — |
| 11,009 |
| |||
Exploration expense |
| (10,934 | ) | — |
| (10,934 | ) | |||
Impairment expense |
| (71,212 | ) | — |
| (71,212 | ) | |||
Other income loss |
| (481 | ) | — |
| (481 | ) | |||
Profit (loss) before income tax |
| 14,480 |
| (56,227 | ) | (41,747 | ) | |||
|
|
|
|
|
|
|
| |||
Income tax benefit (expense) |
| 841 |
| 21,480 | ) | 22,321 |
| |||
Profit (loss) attributable to owners of the Company |
| $ | 15,321 |
| $ | (34,747 | ) | $ | (19,426 | ) |
Earnings per share |
|
|
|
|
|
|
| |||
Basic earning |
| $ | 0.03 |
|
|
| $ | (0.04 | ) | |
Diluted earnings |
| $ | 0.03 |
|
|
| $ | (0.04 | ) | |
Report of Independent Registered Public Accounting Firm
The Board of Directors and Shareholders of Sundance Energy Australia Limited
We have audited the accompanying statements of financial position of Sundance Energy Australia Limited as of December 31, 2014 and 2013, and the related consolidated statements of profit or loss and other comprehensive income, changes in equity and cash flows for each of the two years in the period ended December 31, 2014. These financial statements are the responsibility of the Company’s management. Our responsibility is to express an opinion on these financial statements based on our audits.
We conducted our audits in accordance with the standards of the Public Company Accounting Oversight Board (United States). Those standards require that we plan and perform the audit to obtain reasonable assurance about whether the financial statements are free of material misstatement. We were not engaged to perform an audit of the Company’s internal control over financial reporting. Our audits included consideration of internal control over financial reporting as a basis for designing audit procedures that are appropriate in the circumstances, but not for the purpose of expressing an opinion on the effectiveness of the Company’s internal control over financial reporting. Accordingly, we express no such opinion. An audit also includes examining, on a test basis, evidence supporting the amounts and disclosures in the financial statements, assessing the accounting principles used and significant estimates made by management, and evaluating the overall financial statement presentation. We believe that our audits provide a reasonable basis for our opinion.
In our opinion, the financial statements referred to above present fairly, in all material respects, the consolidated financial position of Sundance Energy Australia Limited at December 31, 2014 and 2013, and the consolidated results of its operations and its cash flows for each of the two years in the period ended December 31, 2014, in conformity with International Financial Reporting Standards as issued by the International Accounting Standards Board.
/s/ Ernst & Young |
|
|
|
Sydney, Australia |
|
680 George Street |
|
Sydney NSW 2000 |
|
Australia |
|
|
|
May 15, 2015 |
|
CONSOLIDATED STATEMENTS OF PROFIT OR LOSS AND OTHER COMPREHENSIVE INCOME
For the year ended 31 December |
| Note |
| 2014 |
| 2013 |
|
|
|
|
|
|
|
|
|
Oil and natural gas revenue |
| 3 |
| 159,793 |
| 85,345 |
|
Lease operating and production tax expense |
| 4 |
| (20,489 | ) | (18,383 | ) |
General and administrative expense |
| 5 |
| (15,527 | ) | (15,297 | ) |
Depreciation and amortisation expense |
| 16, 19 |
| (85,584 | ) | (36,225 | ) |
Impairment expense |
| 17 |
| (71,212 | ) | — |
|
Exploration expense |
| 18 |
| (10,934 | ) | — |
|
Finance costs |
|
|
| (699 | ) | 232 |
|
Gain on sale of non-current assets |
| 6 |
| 48,604 |
| 7,335 |
|
Gain (loss) on derivative financial instruments |
|
|
| 11,009 |
| (554 | ) |
Other income |
|
|
| (481 | ) | (944 | ) |
|
|
|
|
|
|
|
|
Profit before income tax |
|
|
| 14,480 |
| 21,509 |
|
|
|
|
|
|
|
|
|
Income tax benefit/(expense) |
| 7 |
| 841 |
| (5,567 | ) |
|
|
|
|
|
|
|
|
Profit attributable to owners of the Company |
|
|
| 15,321 |
| 15,942 |
|
|
|
|
|
|
|
|
|
Other comprehensive income |
|
|
|
|
|
|
|
Items that may be reclassified subsequently to profit or loss: |
|
|
|
|
|
|
|
Exchange differences arising on translation |
|
|
|
|
|
|
|
of foreign operations (no income tax effect) |
|
|
| 684 |
| (421 | ) |
Other comprehensive income (loss) |
|
|
| 684 |
| (421 | ) |
|
|
|
|
|
|
|
|
Total comprehensive income |
|
|
|
|
|
|
|
attributable to owners of the Company |
|
|
| 16,005 |
| 15,521 |
|
|
|
|
|
|
|
|
|
Earnings per share (cents) |
|
|
|
|
|
|
|
Basic earnings |
| 10 |
| 2.9 |
| 3.9 |
|
Diluted earnings |
| 10 |
| 2.9 |
| 3.8 |
|
The accompanying notes are an integral part of these consolidated financial statements
CONSOLIDATED STATEMENT OF FINANCIAL POSITION
For the year ended 31 December |
| Note |
| 2014 |
| 2013 |
|
CURRENT ASSETS |
|
|
|
|
|
|
|
Cash and cash equivalents |
| 11 |
| 69,217 |
| 96,871 |
|
Trade and other receivables |
| 12 |
| 25,994 |
| 28,748 |
|
Derivative financial instruments |
| 13 |
| 7,801 |
| — |
|
Income tax receivable |
|
|
| 2,697 |
| — |
|
Other current assets |
| 15 |
| 8,336 |
| 4,038 |
|
CURRENT ASSETS |
|
|
| 114,045 |
| 129,657 |
|
Assets held for sale |
| 6 |
| — |
| 11,593 |
|
TOTAL CURRENT ASSETS |
|
|
| 114,045 |
| 141,250 |
|
|
|
|
|
|
|
|
|
NON-CURRENT ASSETS |
|
|
|
|
|
|
|
Development and production assets |
| 16 |
| 519,013 |
| 312,230 |
|
Exploration and evaluation expenditure |
| 18 |
| 155,130 |
| 166,144 |
|
Property and equipment |
| 19 |
| 1,554 |
| 1,047 |
|
Derivative financial instruments |
| 13 |
| 1,782 |
| 176 |
|
Deferred tax assets |
| 24 |
| 3,998 |
| 2,303 |
|
Other non-current assets |
| 20 |
| 998 |
| 2,019 |
|
TOTAL NON-CURRENT ASSETS |
|
|
| 682,475 |
| 483,919 |
|
|
|
|
|
|
|
|
|
TOTAL ASSETS |
|
|
| 796,520 |
| 625,169 |
|
|
|
|
|
|
|
|
|
CURRENT LIABILITIES |
|
|
|
|
|
|
|
Trade and other payables |
| 21 |
| 46,861 |
| 62,811 |
|
Accrued expenses |
| 21 |
| 72,333 |
| 66,273 |
|
Income tax payable |
|
|
| — |
| 11,443 |
|
Derivative financial instruments |
| 13 |
| 130 |
| 335 |
|
CURRENT LIABILITIES |
|
|
| 119,324 |
| 140,862 |
|
Liabilities held for sale |
| 6 |
| — |
| 109 |
|
TOTAL CURRENT LIABILITIES |
|
|
| 119,324 |
| 140,971 |
|
|
|
|
|
|
|
|
|
NON-CURRENT LIABILITIES |
|
|
|
|
|
|
|
Derivative financial instruments |
| 13 |
| — |
| 31 |
|
Credit facilities, net of deferred financing fees |
| 22 |
| 128,805 |
| 29,141 |
|
Restoration provision |
| 23 |
| 8,866 |
| 5,074 |
|
Deferred tax liabilities |
| 24 |
| 102,668 |
| 102,711 |
|
Other non-current liabilities |
|
|
| 1,851 |
| — |
|
TOTAL NON-CURRENT LIABILITIES |
|
|
| 242,190 |
| 136,957 |
|
|
|
|
|
|
|
|
|
TOTAL LIABILITIES |
|
|
| 361,514 |
| 277,928 |
|
|
|
|
|
|
|
|
|
NET ASSETS |
|
|
| 435,006 |
| 347,241 |
|
|
|
|
|
|
|
|
|
EQUITY |
|
|
|
|
|
|
|
Issued capital |
| 25 |
| 306,853 |
| 237,008 |
|
Share option reserve |
| 26 |
| 7,550 |
| 5,635 |
|
Foreign currency translation |
| 26 |
| (832 | ) | (1,516 | ) |
Retained earnings |
|
|
| 121,435 |
| 106,114 |
|
TOTAL EQUITY |
|
|
| 435,006 |
| 347,241 |
|
The accompanying notes are an integral part of these consolidated financial statements
CONSOLIDATED STATEMENTS OF CHANGES IN EQUITY
|
| Issued |
| Share |
| Foreign |
| Retained |
| Total |
|
|
|
|
|
|
|
|
|
|
|
|
|
Balance at 31 December 2012 |
| 58,694 |
| 4,045 |
| (1,095 | ) | 90,172 |
| 151,816 |
|
Profit attributable to owners of the Company |
| — |
| — |
| — |
| 15,942 |
| 15,942 |
|
Other comprehensive loss for the year |
| — |
| — |
| (421 | ) | — |
| (421 | ) |
Total comprehensive loss |
| — |
| — |
| (421 | ) | 15,942 |
| 15,521 |
|
Shares issued in connection with: |
|
|
|
|
|
|
|
|
|
|
|
a) Merger with Texon |
| 132,092 |
| — |
| — |
| — |
| 132,092 |
|
b) Private placement |
| 47,398 |
| — |
| — |
| — |
| 47,398 |
|
c) Exercise of stock options |
| 813 |
| — |
| — |
| — |
| 813 |
|
Cost of capital raising, net of tax |
| (1,989 | ) | — |
| — |
| — |
| (1,989 | ) |
Stock compensation value of services |
| — |
| 1,590 |
| — |
| — |
| 1,590 |
|
Balance at 31 December 2013 |
| 237,008 |
| 5,635 |
| (1,516 | ) | 106,114 |
| 347,241 |
|
|
|
|
|
|
|
|
|
|
|
|
|
Profit attributable to owners of the Company |
| — |
| — |
| — |
| 15,321 |
| 15,321 |
|
Other comprehensive income for the year |
| — |
| — |
| 684 |
| — |
| 684 |
|
Total comprehensive income |
| — |
| — |
| 684 |
| 15,321 |
| 16,005 |
|
Shares issued in connection with: |
|
|
|
|
|
|
|
|
|
|
|
a) Private placement |
| 72,178 |
| — |
| — |
| — |
| 72,178 |
|
b) Exercise of stock options |
| 260 |
| — |
| — |
| — |
| 260 |
|
Cost of capital raising, net of tax |
| (2,593 | ) | — |
| — |
| — |
| (2,593 | ) |
Stock compensation value of services |
| — |
| 1,915 |
| — |
| — |
| 1,915 |
|
Balance at 31 December 2014 |
| 306,853 |
| 7,550 |
| (832 | ) | 121,435 |
| 435,006 |
|
The accompanying notes are an integral part of these consolidated financial statements
CONSOLIDATED STATEMENT OF CASH FLOWS
For the year ended 31 December |
| Note |
| 2014 |
| 2013 |
|
|
|
|
|
|
|
|
|
CASH FLOWS FROM OPERATING ACTIVITIES |
|
|
|
|
|
|
|
Receipts from sales |
|
|
| 170,442 |
| 84,703 |
|
Payments to suppliers and employees |
|
|
| (29,967 | ) | (21,765 | ) |
Interest received |
|
|
| 201 |
| 126 |
|
Derivative proceeds, net |
|
|
| (3 | ) | 253 |
|
Income taxes paid, net |
|
|
| (12,586 | ) | (671 | ) |
NET CASH PROVIDED BY OPERATING ACTIVITIES |
| 30 |
| 128,087 |
| 62,646 |
|
|
|
|
|
|
|
|
|
CASH FLOWS FROM INVESTING ACTIVITIES |
|
|
|
|
|
|
|
Payments for development expenditure |
|
|
| (361,950 | ) | (154,700 | ) |
Payments for exploration expenditure |
|
|
| (39,616 | ) | (20,006 | ) |
Payments for acquisition of oil and gas properties |
|
|
| (35,606 | ) | (141,963 | ) |
Sale of non-current assets |
|
|
| 115,284 |
| 37,848 |
|
Transaction costs related to sale of non-current assets |
|
|
| (278 | ) | (161 | ) |
Cash acquired from merger |
|
|
| — |
| 114,690 |
|
Cash (paid) received from escrow and deposit accounts, net |
|
|
| (102 | ) | 837 |
|
Payments for plant and equipment |
|
|
| (967 | ) | (900 | ) |
NET CASH USED IN INVESTING ACTIVITIES |
|
|
| (323,235 | ) | (164,355 | ) |
|
|
|
|
|
|
|
|
CASH FLOWS FROM FINANCING ACTIVITIES |
|
|
|
|
|
|
|
Proceeds from the issuance of shares |
|
|
| 72,438 |
| 48,211 |
|
Payments for costs of capital raisings |
|
|
| (3,778 | ) | (2,654 | ) |
Payments for acquisition related costs |
|
|
| — |
| (533 | ) |
Borrowing costs paid |
|
|
| (1,065 | ) | (569 | ) |
Proceeds from borrowings |
|
|
| 165,000 |
| 15,000 |
|
Repayments from borrowings |
|
|
| (65,000 | ) | (15,000 | ) |
NET CASH PROVIDED BY FINANCING ACTIVITIES |
|
|
| 167,595 |
| 44,455 |
|
|
|
|
|
|
|
|
|
Net decrease in cash held |
|
|
| (27,553 | ) | (57,254 | ) |
|
|
|
|
|
|
|
|
Cash at beginning of period |
|
|
| 96,871 |
| 154,110 |
|
Effect of exchange rates on cash |
|
|
| (101 | ) | 15 |
|
CASH AT END OF PERIOD |
| 11 |
| 69,217 |
| 96,871 |
|
The accompanying notes are an integral part of these consolidated financial statements
NOTES TO THE CONSOLIDATED FINANCIAL STATEMENTS
NOTE 1 - STATEMENT OF SIGNIFICANT ACCOUNTING POLICIES
The consolidated financial report of Sundance Energy Australia Limited (“SEAL”) and its wholly owned subsidiaries, (collectively, the “Company”, “Consolidated Group” or “Group”), for the year ended 31 December 2014 was authorised for issuance in accordance with a resolution of the Board of Directors on 31 March 2015. The Group has the power to amend and reissue the financial report.
The Group is a for-profit entity for the purpose of preparing the financial report. The principal activities of the Group during the financial year are the exploration for, development and production of oil and natural gas in the United States of America, and the continued expansion of its mineral acreage portfolio in the United States of America.
Basis of Preparation
The consolidated financial report is a general purpose financial report that has been prepared in accordance with Australian Accounting Standards, Australian Accounting Interpretations, other authoritative pronouncements of the Australian Accounting Standards Board (“AASB”) and the Corporations Act 2001.
These consolidated financial statements comply with International Financial Reporting Standards (“IFRS”) as issued by the International Accounting Standards Board (“IASB”). Material accounting policies adopted in the preparation of this financial report are presented below. They have been consistently applied unless otherwise stated.
The consolidated financial statements are prepared on a historical basis, except for derivative financial instruments which are measured at fair value. The consolidated financial statements are presented in US dollars and all values are rounded to the nearest thousand (US$’000), except where stated otherwise.
Principles of Consolidation
A controlled entity is any entity over which SEAL is exposed, or has rights to variable returns from its involvement with the entity and has the ability to affect those returns through its power over the entity. The consolidated financial statements incorporate the assets and liabilities of all entities controlled by SEAL as at 31 December 2014 and the results of all controlled entities for the year then ended.
All inter-group balances and transactions between entities in the Group, including any recognised profits or losses, are eliminated on consolidation.
a) Income Tax
The income tax expense for the period comprises current income tax expense/(income) and deferred income tax expense/(income).
Current income tax expense charged to the statement of profit or loss is the tax payable on taxable income calculated using applicable income tax rates enacted, or substantially enacted, as at the reporting date. Current tax liabilities/(assets) are therefore measured at the amounts expected to be paid to/(recovered from) the relevant taxation authority.
Deferred income tax expense reflects movements in deferred tax asset and deferred tax liability balances during the period. Current and deferred income tax expense/(income) is charged or credited directly to equity instead of the statement of profit or loss when the tax relates to items that are credited or charged directly to equity.
NOTES TO THE CONSOLIDATED FINANCIAL STATEMENTS
NOTE 1 - STATEMENT OF SIGNIFICANT ACCOUNTING POLICIES continued
Deferred tax assets and liabilities are ascertained based on temporary differences arising between the tax bases of assets and liabilities and their carrying amounts in the financial statements. Deferred tax assets also result where amounts have been fully expensed but future tax deductions are available. No deferred income tax will be recognised from the initial recognition of an asset or liability, excluding a business combination, where there is no effect on accounting or taxable profit or loss.
Deferred tax assets and liabilities are calculated at the tax rates that are expected to apply to the period when the asset recognised or the liability is settled, based on tax rates enacted or substantively enacted at the reporting date. Their measurement also reflects the manner in which management expects to recover or settle the carrying amount of the related asset or liability.
Deferred tax assets relating to temporary differences and unused tax losses are recognised only to the extent that it is probable that future taxable profit will be available against which the benefits of the deferred tax asset can be utilized. Where temporary differences exist in relation to investments in subsidiaries, branches, associates, and joint ventures, deferred tax assets and liabilities are not recognised where the timing of the reversal of the temporary difference can be controlled and it is not probable that the reversal will occur in the foreseeable future.
Current tax assets and liabilities are offset where a legally enforceable right of set-off exists and it is intended that net settlement or simultaneous realisation and settlement of the respective asset and liability will occur. Deferred tax assets and liabilities are offset where a legally enforceable right of set-off exists, the deferred tax assets and liabilities relate to income taxes levied by the same taxation authority on either the same taxable entity or different taxable entities where it is intended that net settlement or simultaneous realisation and settlement of the respective asset and liability will occur in future periods in which significant amounts of deferred tax assets or liabilities are expected to be recovered or settled.
Tax Consolidation
Sundance Energy Australia Limited and its wholly-owned Australian controlled entities have agreed to implement the income tax consolidation regime, with Sundance Energy Australia Limited being the head company of the newly consolidated group. Under this regime the group entities will be taxed as a single taxpayer. Whilst this choice is yet to be communicated to the Australian Taxation Office, it is intended to be communicated prior to lodgement of the 31 December 2014 income tax return and will be effective from 1 January 2014. Sundance Energy Australia Limited and its wholly-owned Australian controlled entities intend to enter into a Tax Sharing Agreement and Tax Funding Agreement in due course.
The head entity of the income tax consolidated group and the controlled entities in the tax consolidated group account for their own current and deferred tax amounts. These tax amounts are measured as if each entity in the tax consolidated group continues to be a standalone taxpayer in its own right.
In addition to its own current and deferred tax amounts, Sundance Energy Australia Limited, as head company, also recognises the current tax liabilities (or assets) and the deferred tax assets arising from unused tax losses and unused tax credits assumed from controlled entities in the tax consolidated group.
NOTES TO THE CONSOLIDATED FINANCIAL STATEMENTS
NOTE 1 - STATEMENT OF SIGNIFICANT ACCOUNTING POLICIES continued
b) Exploration and Evaluation Expenditure
Exploration and evaluation expenditures incurred are accumulated in respect of each identifiable area of interest. These costs are capitalised to the extent that they are expected to be recouped through the successful development of the area or where activities in the area have not yet reached a stage that permits reasonable assessment of the existence of economically recoverable reserves. Any such estimates and assumptions may change as new information becomes available. If, after the expenditure is capitalized, information becomes available suggesting that the recovery of the expenditure is unlikely, for example a dry hole, the relevant capitalized amount is written off in the consolidated statement of profit or loss and other comprehensive income in the period in which new information becomes available. The costs of assets constructed within the Group includes the leasehold cost, geological and geophysical costs, and an appropriate proportion of fixed and variable overheads directly attributable to the exploration and acquisition of undeveloped oil and gas properties.
When approval of commercial development of a discovered oil or gas field occurs, the accumulated costs for the relevant area of interest are transferred to development and production assets. The costs of developed and producing assets are amortised over the life of the area according to the rate of depletion of the proved and probable developed reserves. The costs associated with the undeveloped acreage are not subject to depletion.
The carrying amounts of the Group’s exploration and evaluation assets are reviewed at each reporting date, in conjunction with the impairment review process referred to in Note 1(f), to determine whether any of impairment indicators exists. Impairment indicators could include i) tenure over the licence area has expired during the period or will expire in the near future, and is not expected to be renewed, ii) substantive expenditure on further exploration for and evaluation of mineral resources in the specific area is not budgeted or planned, iii) exploration for and evaluation of resources in the specific area have not led to the discovery of commercially viable quantities of resources, and the Group has decided to discontinue activities in the specific area, or iv) sufficient data exist to indicate that although a development is likely to proceed, the carrying amount of the exploration and evaluation asset is unlikely to be recovered in full from successful development or from sale. Where an indicator of impairment exists, a formal estimate of the recoverable amount is made and any resulting impairment loss is recognized in the income statement.
c) Development and Production Assets and Property and Equipment
Development and production assets, and property and equipment are carried at cost less, where applicable, any accumulated depreciation, amortisation and impairment losses. The costs of assets constructed within the Group includes the cost of materials, direct labor, borrowing costs and an appropriate proportion of fixed and variable overheads directly attributable to the acquisition or development of oil and gas properties and facilities necessary for the extraction of resources.
The carrying amount of development and production assets and property and equipment are reviewed at each reporting date to ensure that they are not in excess of the recoverable amount from these assets. Development and production assets are assessed for impairment on a cash-generating unit basis. A cash-generating unit is the smallest grouping of assets that generates independent cash inflows. Management has assessed its CGUs as being an individual basin, which is the lowest level for which cash inflows are largely independent of those of other assets. Impairment losses recongised in respect of cash-generating units are allocated to reduce the carrying amount of the assets in the unit on a pro-rata basis.
NOTES TO THE CONSOLIDATED FINANCIAL STATEMENTS
NOTE 1 - STATEMENT OF SIGNIFICANT ACCOUNTING POLICIES continued
An impairment loss is recognized in the income statement whenever the carrying amount of an asset or its cash-generating unit exceeds its recoverable amount.
The recoverable amount of an asset is the greater of its fair value less costs to sell and its value-in-use. In assessing value-in-use, an asset’s estimated future cash flows are discounted to their present value using a pre-tax discount rate that reflects current market assessments of the time value of money and the risks specific to the assets/CGUs. In addition, the Group considers market data related to recent transactions for similar assets.
Subsequent costs are included in the asset’s carrying amount or recognised as a separate asset, as appropriate, only when it is probable that future economic benefits associated with the item will flow to the group and the cost of the item can be measured reliably. All other repairs and maintenance are charged to the consolidated statement of profit or loss and comprehensive income during the financial period in which are they are incurred.
Depreciation and Amortisation Expense
Property and equipment are depreciated on a straight-line basis over their useful lives from the time the asset is held and ready for use. Leasehold improvements are depreciated over the shorter of either the unexpired period of the lease or the estimated useful life of the improvement.
The depreciation rates used for each class of depreciable assets are:
Class of Non-Current |
| Asset Depreciation |
| Rate Basis of Depreciation |
Plant and Equipment |
| 10 – 33% |
| Straight Line |
The Group uses the units-of-production method to amortise costs carried forward in relation to its development and production assets. For this approach, the calculation is based upon economically recoverable reserves, being proved developed reserves and probable developed reserves, over the life of an asset or group of assets.
The assets’ residual values and useful lives are reviewed, and adjusted if appropriate, at the end of each reporting period. An asset’s carrying amount is written down immediately to its recoverable amount if the asset’s carrying amount is greater than its estimated recoverable amount, and recorded as impairment expense within the consolidated statement of profit or loss and other comprehensive income.
Gains and losses on disposals are determined by comparing proceeds with the carrying amount. These gains and losses are included in the statement of profit or loss.
d) Leases
The determination of whether an arrangement is, or contains, a lease is based on the substance of the arrangement at date of inception. The arrangement is assessed to determine whether its fulfillment is dependent on the use of a specific asset or assets and whether the arrangement conveys a right to use the asset, even if that right is not explicitly specified in an arrangement.
Leases are classified as finance leases when the terms of the lease transfer substantially all the risks and benefits incidental to the ownership of the asset, but not the legal ownership to the entities in the Group. All other leases are classified as operating leases.
NOTES TO THE CONSOLIDATED FINANCIAL STATEMENTS
NOTE 1 - STATEMENT OF SIGNIFICANT ACCOUNTING POLICIES continued
Finance leases are capitalised by recording an asset and a liability at the lower of the amounts equal to the fair value of the leased property or the present value of the minimum lease payments, including any guaranteed residual values. Lease payments are allocated between the reduction of the lease liability and the lease interest expense for the period.
Assets under financing leases are depreciated on a straight-line basis over the shorter of their estimated useful lives or the lease term. Lease payments for operating leases, where substantially all the risks and benefits remain with the lessor, are charged as expenses in the periods in which they are incurred.
Lease incentives under operating leases are recognised as a liability and amortised on a straight-line basis over the life of the lease term.
e) Financial Instruments
Recognition and Initial Measurement
Financial instruments, incorporating financial assets and financial liabilities, are recognised when the entity becomes a party to the contractual provisions of the instrument. Trade date accounting is adopted for financial assets that are delivered within timeframes established by marketplace convention.
Financial instruments are initially measured at fair value plus transactions costs where the instrument is not classified at fair value through profit or loss. Transaction costs related to instruments classified at fair value through profit or loss are expensed to profit or loss immediately. Financial instruments are classified and measured as set out below.
Derivative Financial Instruments
The Group uses derivative financial instruments to economically hedge its exposure to changes in commodity prices arising in the normal course of business. The principal derivatives that may be used are commodity crude oil price swap, option and costless collar contracts and interest rate swaps. Their use is subject to policies and procedures as approved by the Board of Directors. The Group does not trade in derivative financial instruments for speculative purposes.
Derivative financial instruments are recognised at fair value. Subsequent to initial recognition, derivative financial instruments are recognised at fair value. The fair value of these derivative financial instruments is the estimated amount that the Group would receive or pay to terminate the contracts at the reporting date, taking into account current market prices and the current creditworthiness of the contract counterparties. The derivatives are valued on a mark to market valuation and the gain or loss on re-measurement to fair value is recognised through the statement of profit or loss and other comprehensive income.
i) Financial assets at fair value through profit or loss
Financial assets are classified at fair value through profit or loss when they are held for trading for the purpose of short term profit taking, when they are derivatives not held for hedging purposes, or designated as such to avoid an accounting mismatch or to enable performance evaluation where a group of financial assets is managed by key management personnel on a fair value basis in accordance with a documented risk management or investment strategy. Realised and unrealised gains and losses arising from changes in fair value are included in profit or loss in the period in which they arise.
NOTES TO THE CONSOLIDATED FINANCIAL STATEMENTS
NOTE 1 - STATEMENT OF SIGNIFICANT ACCOUNTING POLICIES continued
ii) Loans and receivables
Loans and receivables are non-derivative financial assets with fixed or determinable payments that are not quoted in an active market and are subsequently measured at amortised cost using the effective interest rate method.
iii) Held-to-maturity investments
Held-to-maturity investments are non-derivative financial assets that have fixed maturities and fixed or determinable payments, and it is the Group’s intention to hold these investments to maturity. They are subsequently measured at amortised cost using the effective interest rate method.
iv) Available-for-sale financial assets
Available-for-sale financial assets are non-derivative financial assets that are either designated as such or that are not classified in any of the other categories. They comprise investments in the equity of other entities where there is neither a fixed maturity nor fixed determinable payments.
v) Financial liabilities
Non-derivative financial liabilities (excluding financial guarantees) are subsequently measured at amortised cost using the effective interest rate method.
Derecognition
Financial assets are derecognised when the contractual right to receipt of cash flows expires or the asset is transferred to another party whereby the entity no longer has any significant continuing involvement in the risks and benefits associated with the asset. Financial liabilities are derecognised when the related obligations are either discharged, cancelled or expire. The difference between the carrying value of the financial liability extinguished or transferred to another party and the fair value of consideration paid, including the transfer of non-cash assets or liabilities assumed, is recognised in profit or loss.
f) Impairment of Non-Financial Assets
The carrying amounts of the Group’s assets are reviewed at each reporting date to determine whether there is any indication of impairment. Where an indicator of impairment exists, a formal estimate of the recoverable amount is made.
Exploration and evaluation assets are assessed for impairment in accordance with Note 1(b).
Development and production assets are assessed for impairment on a cash-generating unit basis. A cash-generating unit is the smallest grouping of assets that generates independent cash inflows. Management has assessed its CGUs as being an individual basin, which is the lowest level for which cash inflows are largely independent of those of other assets. Impairment losses recognised in respect of cash-generating units are allocated to reduce the carrying amount of the assets in the unit on a pro-rata basis.
An impairment loss is recognized in the income statement whenever the carrying amount of an asset or its cash-generating unit exceeds its recoverable amount.
NOTES TO THE CONSOLIDATED FINANCIAL STATEMENTS
NOTE 1 - STATEMENT OF SIGNIFICANT ACCOUNTING POLICIES continued
The recoverable amount of an asset is the greater of its fair value less costs to sell (FVLCS) and its value-in-use (VIU). In assessing VIU, an asset’s estimated future cash flows are discounted to their present value using an appropriate discount rate that reflects current market assessments of the time value of money and the risks specific to the assets/CGUs. In addition, the Group considers market data related to recent transactions for similar assets. In determining the fair value of the Group’s investment in shale properties, the Group considers a variety of valuation metrics from recent comparable transactions in the market. These metrics include price per flowing barrel of oil equivalent and undeveloped land values per acre held. Where an asset does not generate cash flows that are largely independent from other assets or groups of assets, the recoverable amount is determined for the cash-generating unit to which the asset belongs.
For development and production assets, the estimated future cash flows for the VIU calculation are based on estimates, the most significant of which are hydrocarbon reserves, future production profiles, commodity prices, operating costs and any future development costs necessary to produce the reserves. Under a FVLCS calculation, future cash flows are based on estimates of hydrocarbon reserves in addition to other relevant factors such as value attributable to additional reserves based on production plans.
Estimates of future commodity prices are based on the Group’s best estimates of future market prices with reference to external market analysts’ forecasts, current spot prices and forward curves. At 31 December 2014, future NYMEX strip prices, adjusted for basis differentials, were applied in 2015 and gradually increased through 2016 to $75/bbl in 2017 and thereafter.
The discount rates applied to the future forecast cash flows are based on a third party participant’s post-tax weighted average cost of capital, adjusted for the risk profile of the asset.
An impairment loss is reversed if there has been an increase in the estimated recoverable amount of a previously impaired assets. An impairment loss is reversed only to the extent that the asset’s carrying amount does not exceed the carrying amount that would have been determined, net of depreciation or depletion if no impairment loss had been recognized. The Company has not reversed an impairment loss during the years ended 31 December 2014 or 2013.
g) Foreign Currency Transactions and Balances
Functional and presentation currency
Both the functional currency and the presentation currency of the Group is US dollars. Some subsidiaries have Australian dollar functional currencies which are translated to the presentation currency. All operations of the Group are incurred at subsidiaries where the functional currency is the US dollar as all oil and gas properties are located in North America.
Transactions and Balances
Foreign currency transactions are translated into the functional currency using the exchange rates prevailing at the date of the transaction. Foreign currency monetary items are translated at the year-end exchange rate. Non-monetary items measured at historical cost continue to be carried at the exchange rate at the date of the transaction. Non-monetary items measured at fair value are reported at the exchange rate at the date when fair values were determined.
NOTES TO THE CONSOLIDATED FINANCIAL STATEMENTS
NOTE 1 - STATEMENT OF SIGNIFICANT ACCOUNTING POLICIES continued
Exchange differences arising on the translation of non-monetary items are recognised directly in equity to the extent that the gain or loss is directly recognised in equity, otherwise the exchange difference is recognised in the consolidated statement of profit or loss and other comprehensive income.
Group Companies
The financial results and position of foreign subsidiaries whose functional currency is different from the Group’s presentation currency are translated as follows:
· assets and liabilities are translated at year-end exchange rates prevailing at that reporting date;
· income and expenses are translated at average exchange rates for the period; and
· retained profits, issued capital and paid-in-capital are translated at the exchange rates prevailing at the date of the transaction.
Exchange differences arising on translation of foreign operations are transferred directly to the Group’s foreign currency translation reserve. These differences are recognised in the statement of profit or loss and other comprehensive income upon disposal of the foreign operation.
h) Employee Benefits
A provision is made for the Group’s liability for employee benefits arising from services rendered by employees to the balance sheet date. Employee benefits that are expected to be settled within one year have been measured at the amounts expected to be paid when the liability is settled, plus related on-costs. Employee benefits payable later than one year have been measured at the present value of the estimated future cash outflows to be made for these benefits. Those cash flows are discounted using market yields on national government bonds with terms to maturity that match the expected timing of cash flows.
Equity - Settled Compensation
The Group has an incentive compensation plan where employees may be issued shares and/or options. The fair value of the equity to which employees become entitled is measured at grant date and recognized as an expense over the vesting period with a corresponding increase in equity. The fair value of shares issued is determined with reference to the latest ASX share price. Options are fair valued using an appropriate valuation technique which takes into account the vesting conditions.
Restricted Share Unit Plan
The group has a restricted share unit (“RSU”) plan to motivate management and employees to make decisions benefiting long-term value creation, retain management and employees and reward the achievement of the Group’s long-term goals. The target RSUs are based on goals established by the Remuneration and Nominations Committee and approved by the Board. The actual RSUs, awarded annually, are modified according to actual results and generally vest in four equal tranches beginning on the grant date and each of the first three subsequent anniversaries.
i) Provisions
Provisions are recognised when the group has a legal or constructive obligation, as a result of past events, for which it is probable that an outflow of economic benefits will result and that outflow can be reliably measured.
NOTES TO THE CONSOLIDATED FINANCIAL STATEMENTS
NOTE 1 - STATEMENT OF SIGNIFICANT ACCOUNTING POLICIES continued
j) Cash and Cash Equivalents
Cash and cash equivalents include cash on hand, deposits held at call with banks, other short-term highly liquid investments with original maturities of three months or less, unrestricted escrow accounts that management expects to be used to settle current liabilities, capital or operating expenditures, or complete acquisitions and bank overdrafts.
k) Revenue
Revenue from the sale of goods is recognised upon the delivery of goods to the customer. Revenue from the rendering of a service is recognised upon the delivery of the service to the customers. All revenue is stated net of the amount of goods and services tax (“GST”).
l) Borrowing Costs
Borrowing costs, including interest, directly attributable to the acquisition, construction or production of assets that necessarily take a substantial period of time to prepare for their intended use or sale are added to the cost of those assets until such time as the assets are substantially ready for their intended use or sale. Borrowings are recognised initially at fair value, net of transaction costs incurred. Subsequent to initial recognition, borrowings are stated as amortised cost with any difference between cost and redemption being recognised in the consolidated statement of profit or loss and other comprehensive income over the period of the borrowings on an effective interest basis. The Company capitalised eligible borrowing costs at 100 percent equal to $3.4 million and $1.3 million for the years ended 31 December 2014 and 2013, respectively. All other borrowing costs are recognised in income in the period in which they are incurred.
m) Goods and Services Tax
Revenues, expenses and assets are recognised net of the amount of GST, except where the amount of GST incurred is not recoverable from the Australian Tax Office. In these circumstances the GST is recognised as part of the cost of acquisition of the asset or as part of an item of the expense. Receivables and payables in the statement of financial position are shown inclusive of GST.
Cash flows are presented in the consolidated statement of cash flows on a gross basis except for the GST component of investing and financing activities, which are disclosed as operating cash flows.
n) Business Combinations
A business combination is a transaction in which an acquirer obtains control of one or more businesses. The acquisition method of accounting is used to account for all business combinations regardless of whether equity instruments or other assets are acquired. The acquisition method is only applied to a business combination when control over the business is obtained. Subsequent changes in interests in a business where control already exists are accounted for as transactions between owners. The cost of the business combination is measured at fair value of the assets given, shares issued and liabilities incurred or assumed at the date of acquisition. Costs directly attributable to the business combination are expensed as incurred, except those directly and incrementally attributable to equity issuance.
NOTES TO THE CONSOLIDATED FINANCIAL STATEMENTS
NOTE 1 - STATEMENT OF SIGNIFICANT ACCOUNTING POLICIES continued
The excess of the consideration transferred, the amount of any non-controlling interest in the acquiree and the acquisition-date fair value of any previous equity interest in the acquiree over the fair value of the net identifiable asset acquired, if any, is recorded as goodwill. If those amounts are less than the fair value of the net identifiable assets of the subsidiary acquired and the measurement of all amounts has been reviewed, the difference is recognised directly in the consolidated statement of profit or loss and other comprehensive income as a bargain purchase. Adjustments to the purchase price and excess on consideration transferred may be made up to one year from the acquisition date.
o) Assets Held for Sale
The Company classifies property as held for sale when management commits to a plan to sell the property, the plan has appropriate approvals, the sale of the property is probable within the next twelve months, and certain other criteria are met. At such time, the respective assets and liabilities are presented separately on the Company’s consolidated statement of financial position and amortisation is no longer recognized. Assets held for sale are reported at the lower of their carrying amount or their estimated fair value, less the costs to sell the assets. The Company recognizes an impairment loss if the current net book value of the property exceeds its fair value, less selling costs. The company did not have any assets classified as held for sale as at 31 December 2014. As at 31 December 2013, all of the Company’s Williston properties were classified as held for sale.
p) Critical Accounting Estimates and Judgements
The Directors evaluate estimates and judgements incorporated into the financial report based on historical knowledge and best available current information. Estimates assume a reasonable expectation of future events and are based on current trends and economic data obtained both externally and within the Group. Revisions to accounting estimates are recognised in the period in which the estimate is revised if the revision affects only that period, or in the period of the revision and future periods if the revision affects both current and future periods.
Management has made the following judgements, which have the most significant effect on the amounts recognised in the consolidated financial statements.
Estimates of reserve quantities
The estimated quantities of hydrocarbon reserves reported by the Group are integral to the calculation of amortisation (depletion) and to assessments of possible impairment of assets. Estimated reserve quantities are based upon interpretations of geological and geophysical models and assessment of the technical feasibility and commercial viability of producing the reserves. Management prepares reserve estimates which conform to guidelines prepared by the Society of Petroleum Engineers. Management also prepares reserve estimates under SEC guidelines. Reserve estimates conforming to the guidelines prepared by the Society of Petroleum Engineers are utilized for accounting purposes. These assessments require assumptions to be made regarding future development and production costs, commodity prices, exchange rates and fiscal regimes. The estimates of reserves may change from period to period as the economic assumptions used to estimate the reserves can change from period to period, and as additional geological data is generated during the course of operations.
NOTES TO THE CONSOLIDATED FINANCIAL STATEMENTS
NOTE 1 - STATEMENT OF SIGNIFICANT ACCOUNTING POLICIES continued
Impairment of Non-Financial Assets
The Group assesses impairment at each reporting date by evaluating conditions specific to the Group that may lead to impairment of assets. Where an indicator of impairment exists, the recoverable amount of the cash-generating unit to which the assets belong is then estimated based on the present value of future discounted cash flows. For development and production assets, the expected future cash flow estimation is always based on a number of factors, variables and assumptions, the most important of which are estimates of reserves, future production profiles, commodity prices and costs. In most cases, the present value of future cash flows is most sensitive to estimates of future oil price and discount rates. A change in the modeled assumptions in isolation could materially change the recoverable amount. However, due to the interrelated nature of the assumptions, movements in any one variable can have an indirect impact on others and individual variables rarely change in isolation. Additional, management can be expected to respond to some movements, to mitigate downsides and take advantage of upsides, as circumstances allow. Consequently, it is impracticable to estimate the indirect impact that a change in one assumption has on other variables and therefore, on the extent of impairments under different sets of assumptions in subsequent reporting periods. In the event that future circumstances vary from these assumptions, the recoverable amount of the Group’s development and production assets could change materially and result in impairment losses or the reversal of previous impairment losses.
Exploration and Evaluation
The Company’s policy for exploration and evaluation is discussed in Note 1 (b). The application of this policy requires the Company to make certain estimates and assumptions as to future events and circumstances, particularly in relation to the assessment of whether economic quantities of reserves have been found. Any such estimates and assumptions may change as new information becomes available. If, after having capitalised exploration and evaluation expenditure, management concludes that the capitalised expenditure is unlikely to be recovered by future sale or exploitation, then the relevant capitalised amount will be written off through the consolidated statement of profit or loss and other comprehensive income.
Restoration Provision
A provision for rehabilitation and restoration is provided by the Group to meet all future obligations for the restoration and rehabilitation of oil and gas producing areas when oil and gas reserves are exhausted and the oil and gas fields are abandoned. Restoration liabilities are discounted to present value and capitalised as a component part of capitalised development expenditure. The capitalised costs are amortised over the units of production and the provision is revised at each balance sheet date through the consolidated statement of profit or loss and other comprehensive income as the discounting of the liability unwinds.
In most instances, the removal of the assets associated with these oil and gas producing areas will occur many years in the future. The estimate of future removal costs therefore requires management to make significant judgements regarding removal date or well lives, the extent of restoration activities required, discount and inflation rates.
Units of Production Depreciation
Development and production assets are depreciated using the units of production method over economically recoverable reserves representing total proved and probable developed reserves. This results in a depreciation or amortisation charge proportional to the depletion of the anticipated remaining production from the area of interest.
NOTES TO THE CONSOLIDATED FINANCIAL STATEMENTS
NOTE 1 - STATEMENT OF SIGNIFICANT ACCOUNTING POLICIES continued
The life of each item has regard to both its physical life limitations and present assessments of economically recoverable reserves of the field at which the asset is located. Economically recoverable reserves are defined as proved developed and probable developed reserves. These calculations require the use of estimates and assumptions, including the amount of recoverable reserves and estimates of future capital expenditure. The calculation of the units of production rate of depreciation or amortisation could be impacted to the extent that actual production in the future is different from current forecast production based on total economically recoverable reserves, or future capital expenditure estimates change. Changes to economically recoverable reserves could arise due to change in the factors or assumptions used in estimating reserves, including the effect on economically recoverable reserves of differences between actual commodity prices and commodity price assumptions and unforeseen operational issues. Changes in estimates are accounted for prospectively.
Stock Based Compensation
The Group’s policy for stock based compensation is discussed in Note 1 (h). The application of this policy requires management to make certain estimates and assumptions as to future events and circumstances. Stock based compensation related to stock options use estimates for expected volatility of the Company’s share price and expected term, including a forfeiture rate, if appropriate.
q) Change in Accounting Estimate
Effective 1 July 2013, the Company had a change in accounting estimate related to the economically recoverable reserves in its Eagle Ford formation used in the units-of-production depletion calculation. Subsequent to the change, the Company began to include management’s best estimate of economically recoverable reserves associated with developed properties, which include both proved developed and probable developed reserves. Prior to the change, the Company used economically recoverable reserves associated only with proved developed reserves as probable developed reserves were not significant.
r) Rounding of Amounts
The Company is of a kind referred to in Class Order 98/100 issued by the Australian Securities and Investment Commission, relating to rounding of amounts in the financial statements. Amounts have been rounded to the nearest thousand.
s) Parent Entity Financial Information
The financial information for the parent entity, SEAL (“Parent Company”), also the ultimate parent, discussed in Note 34, has been prepared on the same basis, using the same accounting policies as the consolidated financial statements, except for its investments in subsidiaries which are accounted for at cost in the individual financial statements of the parent entity less any impairment.
t) Earnings Per Share
The group presents basic and diluted earnings per share for its ordinary shares. Basic earnings per share is calculated by dividing the profit or loss attributable to ordinary shareholders of the Company by the weighted average number of ordinary shares outstanding during the year. Diluted earnings per share is determined by adjusting the profit or loss attributable to ordinary shareholders and the weighted average number of ordinary shares for the dilutive effect, if any, of outstanding share rights and share options which have been issued to employees.
NOTES TO THE CONSOLIDATED FINANCIAL STATEMENTS
NOTE 1 - STATEMENT OF SIGNIFICANT ACCOUNTING POLICIES continued
u) Adoption of New and Revised Accounting Standards
During the current reporting period the Group adopted all of the new and revised Australian Accounting Standards and Interpretations applicable to its operations which became mandatory. The nature and effect of selected new standards and amendments on the Group’s consolidated financial report are described below. Adoption of the other new mandatorily applicable standards did not have a material impact on the financial statement, financial position or performance of the Group.
AASB 2011-4 - Amendments to Australian Accounting Standards to Remove Individual Key Management Personnel Disclosure
This standard removes the requirements to include individual key management personnel disclosures in the notes to and forming part of the Financial Report. This standard also removes the individual KMP disclosure requirements for all disclosing entities in relation to equity holdings, loans and other related party transactions.
Amendments to IAS 32 - Offsetting Financial Assets and Financial Liabilities
The amendments to IAS 32 clarify the requirements relating to the offset of financial assets and financial liabilities. Specifically, the amendments clarify the meaning of ‘currently has a legally enforceable right of set-off’ and ‘simultaneous realization and settlement’. As the Group does not have any financial assets and financial liabilities that qualify for offset, the application of the amendments has had no impact on the disclosure or the Group’s consolidated financial statements.
Recently issued accounting standards to be applied in future reporting periods:
The following Standards and Interpretations have been issued but are not yet effective. These are the standards that the Group reasonably expects will have an impact on its disclosures, financial position or performance with applied at a future date. The Group’s assessment of the impact of these new standards, amendments to standards, and interpretations is set out below.
AASB 9/IFRS 9 — Financial Instruments
AASB 9/IFRS 9 introduces new requirements for the classification, measurement, and derecognition of financial assets and financial liabilities. The final version of IFRS 9 supersedes all previous versions of the standard. However, for annual periods beginning before 1 January 2018, an entity may elect to apply those earlier versions of IFRS 9 if the entity’s relevant date of initial application is before 1 February 2015. The effective date of this standard is for fiscal years beginning on or after 1 January 2018. Management is currently assessing the impact of the new standard but it is not expected to have a material impact on the Group’s consolidated financial statements.
NOTES TO THE CONSOLIDATED FINANCIAL STATEMENTS
NOTE 1 - STATEMENT OF SIGNIFICANT ACCOUNTING POLICIES continued
AASB 15/IFRS 15 — Revenue from Contracts with Customers
In May 2014, AASB 15/IFRS 15 was issued which establishes a single comprehensive model for entities to use in accounting for revenue arising from contracts with customers. Specifically, the standard introduces a 5-step approach to revenue recognition:
· Step 1: Identify the contract(s) with a customer
· Step 2: Identify the performance obligations in the contracts.
· Step 3: Determine the transaction price.
· Step 4: Allocate the transaction price to the performance obligations in the contract.
· Step 5: Recognise revenue when (or as) the entity satisfies a performance obligation.
Under AASB 15/IFRS 15, an entity recognizes revenue when (or as) a performance obligation is satisfied, i.e. when ‘control’ of the goods or services underlying the particular performance obligation is transferred to the customer. The effective date of this standard is for fiscal years beginning on or after 1 January 2017. Management is currently assessing the impact of the new standard and plans to adopt the new standard on the required effective date.
NOTES TO THE CONSOLIDATED FINANCIAL STATEMENTS
NOTE 2 — BUSINESS COMBINATIONS
Acquisitions in 2014
There were no business acquisitions for the year ended 31 December 2014.
Acquisition in 2013
On 8 March 2013, the Company acquired 100% of the outstanding shares of Texon Petroleum Ltd (“Texon”, whose name was changed to Armadillo Petroleum Ltd), an Australian corporation with oil and gas assets in the Eagle Ford formation in the United States. The Company acquired Texon to gain access to its existing production and drilling inventory in the Eagle Ford formation. As consideration for substantially all of the net assets of Texon, the Company issued 122.7 million ordinary shares (approximately 30.6% of the total outstanding shares immediately subsequent to the acquisition), which had a fair value of $132.1 million on the acquisition date and net cash consideration of $26.3 million for a total purchase price of $158.4 million. The net cash consideration includes a $141.0 million pre-merger purchase by the Company of certain Texon oil and gas properties, offset by $114.7 million of cash acquired at the time of the merger. The current income tax liability, included in accrued expenses, and deferred tax liability of $33.4 million and $16.9 million, respectively, are comprised of tax liabilities assumed as at the acquisition date and an increase in the tax liability related to the incremental acquisition date fair value of the acquired development and production and exploration and evaluation assets as compared to Texon’s historical basis.
The following table reflects the final adjusted assets acquired and the liabilities assumed at their fair value or otherwise where specified by AASB 3/IFRS 3 — Business Combinations (in thousands):
Fair value of assets acquired: |
|
|
|
Trade and other receivables |
| 5,604 |
|
Other current assets |
| 456 |
|
Development and production assets |
| 53,937 |
|
Exploration and evaluation assets |
| 150,474 |
|
Prepaid drilling and completion costs |
| 3,027 |
|
Amount attributable to assets acquired |
| 213,498 |
|
|
|
|
|
Fair value of liabilities assumed: |
|
|
|
Trade and other payables |
| 119 |
|
Accrued expenses |
| 37,816 |
|
Restoration provision |
| 277 |
|
Deferred tax liabilities |
| 16,884 |
|
Amount attributable to liabilities assumed |
| 55,096 |
|
Net assets acquired |
| 158,402 |
|
|
|
|
|
Purchase price: |
|
|
|
Cash and cash equivalents, net of cash acquired |
| 26,310 |
|
Issued capital |
| 132,092 |
|
Total consideration paid |
| 158,402 |
|
The net assets recognized in the 31 December 2013 financial statements were based on a provisional assessment of their fair value.
NOTES TO THE CONSOLIDATED FINANCIAL STATEMENTS
NOTE 2 — BUSINESS COMBINATIONS continued
Since the acquisition date of 8 March 2013 through 31 December 2013, the Company has earned revenue of $42.3 million and generated net income of $12.6 million. The following reflects the acquisition’s contribution to the Group as if the merger had occurred on 1 January 2013 instead of the closing date of 8 March 2013 (in thousands, except per share information):
|
| Year ended |
|
|
|
|
|
Oil and natural gas revenue |
| 5,163 |
|
Lease operating and production expenses |
| (1,150 | ) |
Depreciation and amortization expense |
| (1,882 | ) |
General and administrative expense |
| (667 | ) |
Finance costs |
| (35 | ) |
Profit before income tax |
| 1,429 |
|
Income tax expense |
| (542 | ) |
Proforma profit attributable to the period 1 January to 7 March 2013 |
| 887 |
|
Profit attributable to owners of the Company for the year |
| 15,942 |
|
Adjusted profit attributable to the owners of the Company for the year |
| 16,829 |
|
Adjusted basic earnings per ordinary share |
| 4.1 | ¢ |
Adjusted diluted earnings per ordinary share |
| 4.0 | ¢ |
The Company incurred $0.2 and $0.5 million for the years ended 31 December 2014 and 2013, respectively, for professional fees and services related to the Texon acquisition. These amounts are included in general and administrative expense in the consolidated statements of profit or loss, and other comprehensive income and financing activities in the consolidated statement of cash flows, respectively.
NOTE 3 — REVENUE
|
| 2014 |
| 2013 |
|
Year ended 31 December |
| US$’000 |
| US$’000 |
|
|
|
|
|
|
|
Oil revenue |
| 144,994 |
| 79,365 |
|
Natural gas revenue |
| 6,161 |
| 2,774 |
|
Natural gas liquid (NGL) revenue |
| 8,638 |
| 3,206 |
|
Total revenue (net of royalties and transportation costs) |
| 159,793 |
| 85,345 |
|
NOTE 4 — LEASE OPERATING AND PRODUCTION TAX EXPENSE
|
| 2014 |
| 2013 |
|
Year ended 31 December |
| US$’000 |
| US$’000 |
|
|
|
|
|
|
|
Lease operating expense |
| (12,466 | ) | (11,378 | ) |
Workover expense |
| (1,058 | ) | (743 | ) |
Production tax expense |
| (6,965 | ) | (6,262 | ) |
Total lease operating and production tax expense |
| (20,489 | ) | (18,383 | ) |
NOTES TO THE CONSOLIDATED FINANCIAL STATEMENTS
NOTE 5 — GENERAL AND ADMINISTRATIVE EXPENSES
|
| 2014 |
| 2013 |
|
Year ended 31 December |
| US$’000 |
| US$’000 |
|
|
|
|
|
|
|
Employee benefits expense, including salaries and wages, net of capitalised overhead |
| (3,064 | ) | (4,553 | ) |
General legal and professional fees |
| (4,661 | ) | (3,307 | ) |
Corporate fees |
| (2,676 | ) | (2,344 | ) |
Regulatory expenses |
| (1,374 | ) | (2,313 | ) |
Share based payments expense |
| (1,915 | ) | (1,590 | ) |
Rent |
| (631 | ) | (234 | ) |
Other expenses |
| (1,206 | ) | (956 | ) |
Total general and administrative expenses |
| (15,527 | ) | (15,297 | ) |
The company capitalised overhead costs, including salaries, wages benefits and consulting fees, directly attributable to the exploration, acquisition and development of oil and gas properties of $4.5 million and $2.9 million for the years ended 31 December 2014 and 2013, respectively.
NOTE 6 — GAIN ON SALE OF NON-CURRENT ASSETS
Disposals in 2014
In July 2014, the Company sold its remaining Denver-Julesburg Basin assets for net proceeds of $108.8 million in cash, which includes the reimbursement of capital expenditures incurred on 8 gross (3.1 net) non-operated horizontal wells. The sale resulted in a pre-tax gain of $48.7 million, which is included in the gain on sale of non-current assets in the consolidated statement of profit or loss and other comprehensive income for the year ended 31 December 2014.
In July 2014, the Company sold its remaining Bakken assets, located in the Williston Basin, for approximately $14.0 million, which included $10 million in cash and approximately $4.0 million in settlement of a net liability due to the buyer. The sale resulted in a pre-tax gain of $1.6 million, which is included in the gain on sale of non-current assets in the consolidated statement of profit or loss and other comprehensive income for the year ended 31 December 2014. As at 31 December 2013, the carrying costs of these assets were $11.6 million and were classified as held for sale.
For the Denver-Julesburg Basin sales proceeds, the Company elected to apply Section 1031 “like-kind exchange” treatment under the US tax rules, which allow deferral of the gain if the proceeds are used to acquire “like-kind property” within six months of the closing date of the transaction. In addition, the US tax rules allow the deduction of all intangible drilling costs (“IDCs”) in the period incurred. In January 2015, the Company deferred majority of the taxable gain on the sale of the Denver-Julesburg Basin by acquiring qualified replacement properties.
NOTES TO THE CONSOLIDATED FINANCIAL STATEMENTS
NOTE 6 — GAIN ON SALE OF NON-CURRENT ASSETS continued
Disposals in 2013
In the fourth quarter of 2013, the Company sold all of its interests in the Phoenix prospect, located in the Williston Basin, for gross proceeds of $39.8 million. It was determined that approximately $26.0 million of the Company’s carrying costs related to its Phoenix development and production properties at the time of the disposal. The sale resulted in a pre-tax gain of $8.2 million, which is included in the gain on sale of non-current assets in the consolidated statement of profit or loss and other comprehensive income for the year ended 31 December 2013. During 2014, the Company finalized adjustments to the purchase price for the Phoenix sale, which resulted in a net reduction of $0.9 million, which is included in the gain on sale of non-current assets in the consolidated statement of profit or loss and other comprehensive income for the year ended 31 December 2014.
The Company deferred majority of the taxable gain on the sale of the Phoenix development by acquiring qualified replacement properties or utilizing IDCs from its development program.
NOTE 7 — INCOME TAX EXPENSE
|
| 2014 |
| 2013 |
|
Year ended 31 December |
| US$’000 |
| US$’000 |
|
|
|
|
|
|
|
a) The components of income tax expense comprise: |
|
|
|
|
|
Current tax benefit/(expense) |
| (17 | ) | 21,398 |
|
Deferred tax benefit/(expense) |
| 858 |
| (26,965 | ) |
Total income tax benefit/(expense) |
| 841 |
| (5,567 | ) |
|
|
|
|
|
|
b) The prima facie tax on income from ordinary activities |
|
|
|
|
|
before income tax is reconciled to the income tax as follows: |
|
|
|
|
|
|
|
|
|
|
|
Profit before income tax |
| 14,480 |
| 21,509 |
|
|
|
|
|
|
|
Prima facie tax expense at the Group’s statutory income tax rate of 30% (2013:30%) |
| 4,344 |
| 6,453 |
|
|
|
|
|
|
|
Increase (decrease) in tax expense resulting from: |
|
|
|
|
|
|
|
|
|
|
|
- Difference of tax rate in US controlled entities |
| 220 |
| 1,607 |
|
- Impact of direct accounting from US controlled entities (1) |
| (3,044 | ) | 72 |
|
- Employee options |
| 428 |
| — |
|
- Excess depletion |
| (489 | ) | — |
|
- Other allowable items |
| 295 |
| 144 |
|
- Tax adjustments relating to prior years |
| (1,063 | ) | (984 | ) |
- Change in apportioned state tax rates in US controlled entities (2) |
| (992 | ) | (1,520 | ) |
- Tax consolidation election (3) |
| (3,058 | ) | — |
|
- Change in unrecognized tax losses |
| 2,518 |
| (205 | ) |
|
|
|
|
|
|
Total Income tax (benefit)/expense |
| (841 | ) | 5,567 |
|
NOTES TO THE CONSOLIDATED FINANCIAL STATEMENTS
NOTE 7 — INCOME TAX EXPENSE continued
|
| 2014 |
| 2013 |
|
Year ended 31 December |
| US$’000 |
| US$’000 |
|
|
|
|
|
|
|
c) Unused tax losses and temporary differences for which |
|
|
|
|
|
no deferred tax asset has been recognised at 30% |
| 2,685 |
| 170 |
|
|
|
|
|
|
|
d) Deferred tax charged directly to equity: |
|
|
|
|
|
- Equity raising costs |
| 1,147 |
| 665 |
|
- Currency translation adjustment |
| (268 | ) | — |
|
(1) The Oklahoma US state tax jurisdiction computes income taxes on a direct accounting basis. A significant portion of the 2014 impairment related to this jurisdiction resulting in a deferred tax benefit of $3,044 creating deferred tax assets, of which $2,064 were unrecognized.
(2) The change in apportioned state tax rates in US controlled entities is a result of the Company disposing of its property in Colorado (income tax rate of 4.63%) (2013: North Dakota with income tax rate of 4.53%) through a tax deferred sale and reinvesting the property in Texas (margin tax rate of 1%). As the Texas margin tax computation is similar in nature to an income tax computation, it is treated as an income tax for financial reporting purposes.
(3) This income tax benefit results from the election to consolidate certain Australian subsidiaries for income tax purposes effective 1 January 2014, making previously unrecognized deferred tax assets of one of these Australian subsidiaries available for utilization against future income of the consolidated Australian entities. These deferred tax assets were previously unrecognized due to the lack of evidence of future taxable income for these Australian subsidiaries on a stand-alone basis.
NOTE 8 — KEY MANAGEMENT PERSONNEL COMPENSATION
a) Names and positions held of Consolidated Group key management personnel in office at any time during the financial period are:
Mr M Hannell Chairman Non-executive
Mr E McCrady Managing Director and Chief Executive Officer
Mr D Hannes Director — Non-executive
Mr N Martin Director — Non-executive
Mr W Holcombe Director — Non-executive
Ms C Anderson Chief Financial Officer
Ms G Ford Vice President of Exploration and Development
Based on her increased responsibilities due to the Company’s growth, Ms. Ford was deemed to be a KMP during the 2014 fiscal year. Prior to that time, Ms. Ford was not considered to be KMP
Other than Directors and Officers of the Company listed above, there are no additional key management personnel.
NOTES TO THE CONSOLIDATED FINANCIAL STATEMENTS
NOTE 8 — KEY MANAGEMENT PERSONNEL COMPENSATION continued
b) Key Management Personnel Compensation
The total cash remuneration paid to Key Management Personnel (“KMP”) of the Group during the year is as follows:
Year ended 31 December |
| 2014 |
| 2013 |
|
|
|
|
|
|
|
Short term wages and benefits |
| 2,001,893 |
| 1,864,751 |
|
Equity settled-options based payments |
| 1,207,989 |
| 625,161 |
|
Post-employment benefit |
| 56,882 |
| 55,416 |
|
|
| 3,266,764 |
| 2,545,328 |
|
c) Options Granted as Compensation
No options were granted as compensation during each of the years ended 31 December 2014 and 2013 to KMP from the Sundance Energy Employee Stock Option Plan. Options generally vest in five equal tranches of 20% on the grant date and each of the four subsequent anniversaries of the grant date.
d) Restricted Share Units Granted as Compensation
RSUs awarded as compensation were 1,451,917 ($1.4 million fair value) and 623,251 ($0.6 million fair value) during the years ended 31 December 2014 and 2013, respectively, to KMP from the Sundance Energy Long Term Incentive Plan. RSUs generally vest in four equal tranches of 25% on the grant date and each of the three subsequent anniversaries of the grant date.
NOTE 9 — AUDITORS’ REMUNERATION
|
| 2014 |
| 2013 |
|
Year ended 31 December |
| US$ |
| US$ |
|
|
|
|
|
|
|
Cash remuneration of the auditor for: |
|
|
|
|
|
Auditing or review of the financial report |
| 428,888 |
| 90,941 |
|
Professional services related to filing of various Forms with the US Securities and Exchange Commission |
| 244,754 |
| 430,055 |
|
Non-audit services related to Texon acquisition |
| — |
| 76,708 |
|
Taxation services provided by the practice of auditor |
| 68,815 |
| 47,783 |
|
Total remuneration of the auditor |
| 742,457 |
| 645,487 |
|
NOTES TO THE CONSOLIDATED FINANCIAL STATEMENTS
NOTE 10 — EARNINGS PER SHARE (EPS)
|
| 2014 |
| 2013 |
|
Year ended 31 December |
| US$’000 |
| US$’000 |
|
|
|
|
|
|
|
Profit for periods used to calculate basic and diluted EPS |
| 15,321 |
| 15,942 |
|
|
| Number |
| Number |
|
- Weighted average number of ordinary shares outstanding during the period used in calculation of basic EPS |
| 531,391,405 |
| 413,872,184 |
|
- Incremental shares related to options and restricted share units |
| 3,208,214 |
| 2,685,150 |
|
- Weighted average number of ordinary shares outstanding during the period used in calculation of diluted EPS |
| 534,599,619 |
| 416,557,334 |
|
NOTE 11 — CASH AND CASH EQUIVALENTS
|
| 2014 |
| 2013 |
|
Year ended 31 December |
| US$’000 |
| US$’000 |
|
|
|
|
|
|
|
Cash at bank and on hand |
| 18,222 |
| 59,918 |
|
Cash equivalents in escrow accounts |
| 50,995 |
| 36,953 |
|
Total cash and cash equivalents |
| 69,217 |
| 96,871 |
|
As at 31 December 2014 and 2013, the Company had approximately $51.0 million and $37.0 million, respectively, in Section 1031 escrow accounts which are not limited in use, except that the timing of tax payments will be accelerated if not used on qualified “like-kind property.” As such, the balances have been included in the Company’s cash and cash equivalents in the consolidated statement of financial position and consolidated statement of cash flows as at 31 December 2014 and 2013, respectively.
NOTES TO THE CONSOLIDATED FINANCIAL STATEMENTS
NOTE 12 — TRADE AND OTHER RECEIVABLES
��
|
| 2014 |
| 2013 |
|
Year ended 31 December |
| US$’000 |
| US$’000 |
|
|
|
|
|
|
|
Oil, natural gas and NGL sales |
| 13,246 |
| 23,364 |
|
Joint interest billing receivables |
| 11,587 |
| 5,353 |
|
Commodity hedge contract receivables |
| 1,153 |
| — |
|
Other |
| 8 |
| 31 |
|
Total trade and other receivables |
| 25,994 |
| 28,748 |
|
As at 31 December 2013, the Group had a receivable balance of $11.7 million, which was outside normal trading terms (the receivable was past due but not impaired), offset by a payable balance of $16.7 million to the same debtor company (see Note 20 for additional information). The Company’s remaining Bakken assets were sold to the debtor company in July 2014, for approximately $14.0 million, including the settlement of the net liability due to the debtor company.
Due to the short-term nature of trade and other receivables, their carrying amounts are assumed to approximate fair value. No receivables were outside of normal trading terms as at 31 December 2014.
NOTE 13 — DERIVATIVE FINANCIAL INSTRUMENTS
|
| 2014 |
| 2013 |
|
Year ended 31 December |
| US$’000 |
| US$’000 |
|
|
|
|
|
|
|
FINANCIAL ASSETS: |
|
|
|
|
|
Current |
|
|
|
|
|
Derivative financial instruments — commodity contracts |
| 7,801 |
| — |
|
Non-current |
|
|
|
|
|
Derivative financial instruments — commodity contracts |
| 1,675 |
| — |
|
Derivative financial instruments — interest rate swaps |
| 107 |
| 176 |
|
Total financial assets |
| 9,583 |
| 176 |
|
|
|
|
|
|
|
FINANCIAL LIABILITIES: |
|
|
|
|
|
Current |
|
|
|
|
|
Derivative financial instruments — commodity contracts |
| — |
| (188 | ) |
Derivative financial instruments — interest rate swaps |
| (130 | ) | (147 | ) |
Non-current |
|
|
|
|
|
Derivative financial instruments — commodity contracts |
| — |
| (31 | ) |
Total financial liabilities |
| (130 | ) | (366 | ) |
NOTES TO THE CONSOLIDATED FINANCIAL STATEMENTS
NOTE 14 — FAIR VALUE MEASUREMENT
The following table presents financial assets and liabilities measured at fair value in the consolidated statement of financial position in accordance with the fair value hierarchy. This hierarchy groups financial assets and liabilities into three levels based on the significance of inputs used in measuring the fair value of the financial assets and liabilities. The fair value hierarchy has the following levels:
Level 1: quoted prices (unadjusted) in active markets for identical assets or liabilities;
Level 2: inputs other than quoted prices included within Level 1 that are observable for the asset or liability, either directly (i.e. as prices) or indirectly (i.e. derived from prices); and
Level 3: inputs for the asset or liability that are not based on observable market data (unobservable inputs).
The Level within which the financial asset or liability is classified is determined based on the lowest level of significant input to the fair value measurement. The financial assets and liabilities measured at fair value in the statement of financial position are grouped into the fair value hierarchy as follows:
Consolidated 31 December 2014 |
| Level 1 |
| Level 2 |
| Level 3 |
| Total |
|
|
|
|
|
|
|
|
|
|
|
Assets measured at fair value |
|
|
|
|
|
|
|
|
|
Derivative commodity contracts |
| — |
| 9,476 |
| — |
| 9,476 |
|
Interest rate swap contracts |
| — |
| 107 |
| — |
| 107 |
|
Development and production assets (1) |
| — |
| — |
| 455,084 |
| 455,084 |
|
|
|
|
|
|
|
|
|
|
|
Liabilities measured at fair value |
|
|
|
|
|
|
|
|
|
Interest rate swap contracts |
| — |
| (130 | ) | — |
| (130 | ) |
|
|
|
|
|
|
|
|
|
|
Net fair value |
| — |
| 9,453 |
| 455,084 |
| 464,537 |
|
(1) Excludes work-in-progress and restoration provision assets totaling $63.9 million.
Consolidated 31 December 2013 |
| Level 1 |
| Level 2 |
| Level 3 |
| Total |
|
|
|
|
|
|
|
|
|
|
|
Assets measured at fair value |
|
|
|
|
|
|
|
|
|
Interest rate swap contract |
| — |
| 176 |
| — |
| 176 |
|
|
|
|
|
|
|
|
|
|
|
Liabilities measured at fair value |
|
|
|
|
|
|
|
|
|
Derivative commodity contracts |
| — |
| (219 | ) | — |
| (219 | ) |
Interest rate swap contracts |
| — |
| (147 | ) | — |
| (147 | ) |
|
|
|
|
|
|
|
|
|
|
Net fair value |
| — |
| (190 | ) | — |
| (190 | ) |
During the years ended 31 December 2014 and 2013, respectively, there were no transfers between level 1 and level 2 fair value measurements, and no transfer into or out of level 3 fair value measurements.
NOTES TO THE CONSOLIDATED FINANCIAL STATEMENTS
NOTE 14 — FAIR VALUE MEASUREMENT continued
Measurement of Fair Value
a) Derivatives
Derivatives entered into by the Company consist of commodity contracts and interest rate swaps. The Company utilises present value techniques and option-pricing models for valuing its derivatives. Inputs to these valuation techniques include published forward prices, volatilities, and credit risk considerations, including the incorporation of published interest rates and credit spreads. All of the significant inputs are observable, either directly or indirectly; therefore, the Company’s derivative instruments are included within the Level 2 fair value hierarchy.
b) Credit Facilities
As at 31 December 2014, the Company had $95 million and $35 million of principal debt outstanding on the Senior Credit Facility and the Junior Credit Facility, respectively. The estimated fair value of the Senior Credit Facility approximated its carrying amount due to the floating interest rate paid on such debt to be set for a period of three months or less. The estimated fair value of the Junior Credit Facility was approximately $41.8 million, based on indirect, observable inputs (Level 2) regarding interest rates available to the Company. The fair value of the Junior Credit Facility was determined by using a discounted cash flow model using a discount rate that reflects the Company’s assumed borrowing rate at the end of the reporting period.
c) Other Financial Instruments
The carrying amounts of cash, accounts receivable, accounts payable and accrued liabilities approximate fair value due to their short-term nature.
NOTE 15 — OTHER CURRENT ASSETS
Year ended 31 December |
| 2014 |
| 2013 |
|
|
|
|
|
|
|
Cash advances to other operators |
| 3,270 |
| 685 |
|
Escrow accounts |
| 1,000 |
| 1,498 |
|
Oil inventory on hand, at cost |
| 1,331 |
| 1,088 |
|
Equipment inventory, at cost |
| 1,315 |
| — |
|
Prepaid expenses |
| 1,401 |
| 753 |
|
Other |
| 19 |
| 14 |
|
Total other current assets |
| 8,336 |
| 4,038 |
|
NOTES TO THE CONSOLIDATED FINANCIAL STATEMENTS
NOTE 16 — DEVELOPMENT AND PRODUCTION ASSETS
|
| 2014 |
| 2013 |
|
Year ended 31 December |
| US$’000 |
| US$’000 |
|
|
|
|
|
|
|
Costs carried forward in respect of areas of interest in: |
|
|
|
|
|
Development and production assets, at cost: |
|
|
|
|
|
Producing assets |
| 652,035 |
| 297,469 |
|
Wells-in-progress |
| 56,043 |
| 55,636 |
|
Development and production assets, at cost: |
| 708,078 |
| 353,105 |
|
Accumulated depletion |
| (117,613 | ) | (40,635 | ) |
Provision for impairment |
| (71,452 | ) | (240 | ) |
Total Development and Production Expenditure |
| 519,013 |
| 312,230 |
|
|
|
|
|
|
|
a) Movements in carrying amounts: |
|
|
|
|
|
Development expenditure |
|
|
|
|
|
Balance at the beginning of the period |
| 312,230 |
| 79,729 |
|
Amounts capitalised during the period |
| 350,196 |
| 219,121 |
|
Amounts transferred from exploration phase |
| 59,209 |
| 31,999 |
|
Fair value of assets acquired |
| — |
| 54,258 |
|
Allocation of working interest assets acquired |
| 2,244 |
| — |
|
Reclassifications to assets held for sale |
| — |
| (10,489 | ) |
Impairment expense |
| (71,212 | ) | — |
|
Depletion expense |
| (85,357 | ) | (36,294 | ) |
Development and production assets, net of accumulated amortization, sold during the period |
| (48,297 | ) | (26,094 | ) |
Balance at end of period |
| 519,013 |
| 312,230 |
|
Borrowing costs relating to drilling of development wells that have been capitalized as part of oil and gas properties during the year ended 31 December 2014 was $3.4 million (2013: $1.3 million). The interest capitalization rate for both years ended 31 December 2014 and 2013 was 100%.
NOTES TO THE CONSOLIDATED FINANCIAL STATEMENTS
NOTE 17 — IMPAIRMENT OF NON-CURRENT ASSETS
At 31 December 2014, the Group reassessed the carrying amount of its non-current assets for indicators of impairment in accordance with the Group’s accounting policy. Due to the change in the oil pricing environment at year-end, the Company determined that there was an indication of impairment for development and production assets.
Each of the Group’s development and production asset CGUs include all of its developed producing properties, shared infrastructure supporting its production and undeveloped acreage that the Group considers technically feasible and commercially viable.
Estimates of recoverable amounts are based on the higher of an asset’s value-in-use or fair value less costs to sell (level 3 fair value hierarchy), using a discounted cash flow method, and are most sensitive to the key assumptions such as pricing, discount rates, and reserve risk factors. The Group has used the FVLCS calculation whereby future cash flows are based on estimates of hydrocarbon reserves in addition to other relevant factors such as value attributable to additional reserves based on production plans.
Estimates of future commodity prices are based on the Group’s best estimates of future market prices with reference to external market analysts’ forecasts, current spot prices and forward curves. At 31 December 2014, future NYMEX strip prices, adjusted for basis differentials, were applied in 2015 and gradually increased through 2016 to $75/bbl in 2017 and thereafter.
The post-tax discount rate that has been applied to the above non-current assets was 8.0%. The Group also applied further risk-adjustments appropriate for risks associated with its developed and undeveloped reserves using a weighted average risk-adjustment rate of 6% and 17%, respectively, based on the risk associate with each reserve category.
Recoverable amounts and resulting impairment write-downs recognized in the Consolidated Statements of Profit or Loss and Other Comprehensive Income for the year ended 31 December 2014 are presented in the table below:
|
| Carrying costs (1) |
| Recoverable |
| Impairment |
|
Cash-generating unit |
| US$’000 |
| US$’000 |
| US$’000 |
|
|
|
|
|
|
|
|
|
Development and production assets: |
|
|
|
|
|
|
|
Eagle Ford |
| 400,761 |
| 389,764 |
| 10,997 |
|
Mississippian/Woodford |
| 125,535 |
| 65,320 |
| 60,215 |
|
Total development and production assets |
| 526,296 |
| 455,084 |
| 71,212 |
|
(1) Carrying costs exclude work-in-progress that is not subject to impairment analysis.
The impairment charge of $71.2 million noted above is primarily the result from the lower oil price environment.
NOTES TO THE CONSOLIDATED FINANCIAL STATEMENTS
NOTE 18 — EXPLORATION AND EVALUATION EXPENDITURE
|
| 2014 |
| 2013 |
|
Year ended 31 December |
| US$’000 |
| US$’000 |
|
|
|
|
|
|
|
Costs carried forward in respect of areas of interest in: |
|
|
|
|
|
Exploration and evaluation phase, at cost |
| 156,680 |
| 167,694 |
|
Provision for impairment |
| (1,550 | ) | (1,550 | ) |
Total Exploration and Evaluation Expenditure |
| 155,130 |
| 166,144 |
|
|
|
|
|
|
|
a) Movements in carrying amounts: |
|
|
|
|
|
Exploration and evaluation |
|
|
|
|
|
Balance at the beginning of the period |
| 166,144 |
| 33,439 |
|
Amounts capitalised during the period |
| 39,670 |
| 14,770 |
|
Fair value of assets acquired |
| — |
| 151,115 |
|
Allocation of working interest assets acquired |
| 34,184 |
| — |
|
Exploration costs expensed (1) |
| (10,934 | ) | — |
|
Reclassifications to assets held for sale |
| — |
| (1,104 | ) |
Amounts transferred to development phase |
| (59,209 | ) | (31,999 | ) |
Exploration tenements sold during the period |
| (14,725 | ) | (77 | ) |
Balance at end of period |
| 155,130 |
| 166,144 |
|
(1) The Company drilled three exploratory wells in the Anadarko Basin that did not have economically recoverable reserves (i.e. dry wells) and as such, all associated costs were written off.
In July 2014, the Company acquired the working interest in approximately 9,200 gross (5,700 net) in Dimmit County, Texas. The purchase price included an initial cash payment of $35.5 million and a commitment to drill four Eagle Ford wells. The purchase price was allocated between exploration and evaluation and development and production assets based on discounted cash flows of developed producing wells.
The ultimate recoupment of costs carried forward for exploration phase is dependent on the successful development and commercial exploitation or sale of respective areas.
NOTE 19 — PROPERTY AND EQUIPMENT
|
| 2014 |
| 2013 |
|
Year ended 31 December |
| US$’000 |
| US$’000 |
|
|
|
|
|
|
|
Property and equipment, at cost |
| 2,570 |
| 1,603 |
|
Accumulated depreciation |
| (1,016 | ) | (556 | ) |
Total Property and Equipment |
| 1,554 |
| 1,047 |
|
|
|
|
|
|
|
a) Movements in carrying amounts: |
|
|
|
|
|
|
|
|
|
|
|
Balance at the beginning of the period |
| 1,047 |
| 423 |
|
Amounts capitalised during the period |
| 967 |
| 886 |
|
Depreciation expense |
| (460 | ) | (262 | ) |
Balance at end of period |
| 1,554 |
| 1,047 |
|
NOTES TO THE CONSOLIDATED FINANCIAL STATEMENTS
NOTE 20 — OTHER NON-CURRENT ASSETS
|
| 2014 |
| 2013 |
|
Year ended 31 December |
| US$’000 |
| US$’000 |
|
|
|
|
|
|
|
Escrow accounts |
| 998 |
| 2,000 |
|
Other |
| — |
| 19 |
|
Total other non-current assets |
| 998 |
| 2,019 |
|
NOTE 21 — TRADE AND OTHER PAYABLES AND ACCRUED EXPENSES
|
| 2014 |
| 2013 |
|
Year ended 31 December |
| US$’000 |
| US$’000 |
|
|
|
|
|
|
|
Oil and natural gas property and operating related |
| 117,117 |
| 123,938 |
|
Administrative expenses, including salaries and wages |
| 2,077 |
| 5,146 |
|
Total trade, other payables and accrued expenses |
| 119,194 |
| 129,084 |
|
At 31 December 2013, the Group had payable balances of $16.7 million which was outside normal payment terms, offset by a receivable balance of $11.7 million to the same creditor company (see Note 12 for additional information). The Company’s remaining Bakken assets were sold to this company in July 2014, for approximately $14.0 million, including the settlement of the net liability.
NOTE 22 — CREDIT FACILITIES
|
| 2014 |
| 2013 |
|
Year ended 31 December |
| US$000 |
| US$000 |
|
|
|
|
|
|
|
Senior Credit Facility |
| 95,000 |
| 15,000 |
|
Junior Credit Facility |
| 35,000 |
| 15,000 |
|
Total credit facilities |
| 130,000 |
| 30,000 |
|
Deferred financing fees |
| (1,195 | ) | (859 | ) |
Total credit facilities, net of deferred financing fees |
| 128,805 |
| 29,141 |
|
Junior Credit Facility
In August 2013, Sundance Energy, Inc. (“Sundance Energy”), a wholly owned subsidiary of the Company, entered into a second lien credit agreement with Wells Fargo Energy Capital, Inc., as the administrative agent (the “Junior Credit Facility”), which provides for term loans to be made in a series of draws up to $100 million. The Junior Credit Facility matures in June 2018 and is secured by a second priority lien on substantially all of the Company’s assets. Upon entering into the Junior Credit Facility, the Company immediately borrowed $15 million pursuant to the terms of the Junior Credit Facility and paid down the outstanding principal of the Senior Credit Facility. In May 2014, the Company’s borrowing capacity increased to $35 million. As at 31 December 2014, the borrowing capacity under the Junior Credit Facility remains at $35 million.
NOTES TO THE CONSOLIDATED FINANCIAL STATEMENTS
NOTE 22 — CREDIT FACILITIES continued
The principal amount of the loans borrowed under our Junior Credit Facility is due in full on the maturity date. Interest on the Junior Credit Facility accrues at a rate equal to the greater of (i) 8.50% or (ii) a base rate (being, at our option, either (a) LIBOR for the applicable interest period (adjusted for Eurodollar Reserve Requirements) or (b) the greatest of (x) the prime rate announced by Wells Fargo Bank, N.A., (y) the federal funds rate plus 0.50% and (z) one-month adjusted LIBOR plus 1.00%), plus a margin of either 6.5% or 7.5%, based on the base rate selected.
The Company is also required under our Junior Credit Facility to maintain the following financial ratios:
· a current ratio, consisting of consolidated current assets including undrawn borrowing capacity to consolidated current liabilities, of not less than 1.0 to 1.0 as of the last day of any fiscal quarter;
· a maximum leverage ratio, consisting of consolidated debt to adjusted consolidated EBITDAX (as defined in the Junior Credit Facility), of not greater than 4.5 to 1.0 as of the last day of any fiscal quarter (beginning 30 September 2013); and
· an asset coverage ratio, consisting of PV10 to consolidated debt, of not less than 1.5 to 1.0, as of certain test dates.
For the years ended 31 December 2014 and 2013, the Company capitalised $0.7 million and $0.3 million, respectively, of financing costs related to the Junior Credit Facility, which offset the principal balance. As at 31 December 2014 there was $35.0 million outstanding under the Company’s Junior Credit Facility. As at 31 December 2014, the Company was in compliance with all restrictive financial and other covenants under the Junior Credit Facility.
Senior Credit Facility
On 31 December 2012, Sundance Energy entered into a credit agreement with Wells Fargo Bank, N.A. (the “Senior Credit Facility”), pursuant to which up to $300 million is available on a revolving basis. The borrowing base under the Senior Credit Facility is determined by reference to the value of the Company’s proved reserves. The agreement specifies a semi-annual borrowing base redetermination and the Company can request two additional redeterminations each year. The borrowing capacity was increased from prior year to $110 million as at 31 December 2014 based on Company reserves as at 31 December 2014. As at 31 December 2014, the Company had $15 million undrawn on the Senior Credit Facility. In conjunction with the increase in the borrowing base, the Company has expanded the syndicate of banks under the Senior Credit Facility. With Wells Fargo as administrative agent, Bank of America Merrill Lynch and the Bank of Nova Scotia have now joined the banking group.
Interest on borrowed funds accrue, at the Company’s option, of i) LIBOR plus a margin that ranges from 175 to 275 basis points or ii) the Base Rate, defined as a rate equal to the highest of (a) the Federal Funds Rate plus ½ of 1%, (b) the Prime Rate, or (c) LIBOR plus a margin that ranges from 75 to 175 basis points. The applicable margin varies depending on the amount drawn. The Company also pays a commitment that ranges from 37.5 to 50 basis points on the undrawn balance of the borrowing base. The agreement has a five-year term and contains both negative and affirmative covenants, including minimum current ratio and maximum leverage ratio requirements consistent with the Junior Credit Facility’s. Certain development and production assets are pledged as collateral and the facility is guaranteed by the Parent Company.
For the years ended 31 December 2014 and 2013, the Company capitalised nil and $0.2 million, respectively, of financing costs related to the Senior Credit Facility, which offset the principal balance. As at 31 December 2014 there was $95.0 million outstanding under the Company’s Senior Credit Facility. As at 31 December 2014, the Company was in compliance with all restrictive financial and other covenants under the Senior Credit Facility.
The Company capitalised $3.4 million and $1.3 million of interest expense during the years ended 31 December 2014 and 2013, respectively.
See Note 36 for discussion of credit facility refinance.
NOTES TO THE CONSOLIDATED FINANCIAL STATEMENTS
NOTE 23 — RESTORATION PROVISION
The restoration provision represents the best estimate of the present value of restoration costs relating to the Company’s oil and natural gas interests, which are expected to be incurred up to 2043. Assumptions, based on the current economic environment, have been made which management believes are a reasonable basis upon which to estimate the future liability. The estimate of future removal costs requires management to make significant judgments regarding removal date or well lives, the extent of restoration activities required, discount and inflation rates. These estimates are reviewed regularly to take into account any material changes to the assumptions. However, actual restoration costs will reflect market conditions at the relevant time. Furthermore, the timing of restoration is likely to depend on when the fields cease to produce at economically viable rates. This in turn will depend on future oil and natural gas prices, which are inherently uncertain.
|
| 2014 |
| 2013 |
|
Year ended 31 December |
| US$’000 |
| US$’000 |
|
|
|
|
|
|
|
Balance at the beginning of the period |
| 5,074 |
| 1,228 |
|
New provisions |
| 3,677 |
| 1,601 |
|
Changes in estimates |
| 1,541 |
| 2,021 |
|
Disposals |
| (2,314 | ) | (146 | ) |
New provisions assumed from acquisition |
| 822 |
| 397 |
|
Reclassified to assets held for sale |
| — |
| (109 | ) |
Unwinding of discount |
| 66 |
| 82 |
|
Balance at end of period |
| 8,866 |
| 5,074 |
|
NOTE 24 — DEFERRED TAX ASSETS AND LIABILITIES
Deferred tax assets and liabilities are attributable to the following:
|
| 2014 |
| 2013 |
|
Year ended 31 December |
| US$’000 |
| US$’000 |
|
|
|
|
|
|
|
Net deferred tax assets: |
|
|
|
|
|
Share issuance costs |
| 2,172 |
| 1,069 |
|
Net operating loss carried forward |
| 1,826 |
| 473 |
|
Unrecognized foreign currency gain (loss) |
| — |
| 761 |
|
Total net deferred tax assets |
| 3,998 |
| 2,303 |
|
|
|
|
|
|
|
Deferred tax liabilities: |
|
|
|
|
|
Development and production expenditure |
| (106,343 | ) | (114,042 | ) |
Derivatives |
| (3,351 | ) | — |
|
|
|
|
|
|
|
Offset by deferred tax assets with legally enforceable right of set-off: |
|
|
|
|
|
|
|
|
|
|
|
Net operating loss carried forward |
| 5,943 |
| 10,373 |
|
Other |
| 1,083 |
| 958 |
|
Total net deferred tax liabilities |
| (102,668 | ) | (102,711 | ) |
NOTES TO THE CONSOLIDATED FINANCIAL STATEMENTS
NOTE 25 — ISSUED CAPITAL
Total ordinary shares issued and outstanding at each period end are fully paid. All shares issued are authorized. Shares have no par value.
a) Ordinary Shares
|
| Number of Shares |
|
|
|
|
|
Total shares issued and outstanding at 31 December 2012 |
| 278,765,141 |
|
Shares issued during the year |
| 184,408,527 |
|
Total shares issued and outstanding at 31 December 2013 |
| 463,173,668 |
|
Shares issued during the year |
| 86,122,171 |
|
Total shares issued and outstanding at 31 December 2014 |
| 549,295,839 |
|
Ordinary shares participate in dividends and the proceeds on winding up of the Parent Company in proportion to the number of shares held. At shareholders’ meetings each ordinary share is entitled to one vote when a poll is called, otherwise each shareholder has one vote on a show of hands.
|
| 2014 |
| 2013 |
|
Year ended 31 December |
| US$’000 |
| US$’000 |
|
|
|
|
|
|
|
b) Issued Capital |
|
|
|
|
|
Beginning of the period |
| 237,008 |
| 58,694 |
|
Shares issued in connection with: |
|
|
|
|
|
Merger with Texon |
| — |
| 132,092 |
|
Private placement |
| 72,178 |
| 47,398 |
|
Exercise of stock options |
| 260 |
| 813 |
|
Total shares issued during the period |
| 72,438 |
| 180,303 |
|
Cost of capital raising during the period, net of tax benefit |
| (2,593 | ) | (1,989 | ) |
Closing balance at end of period |
| 306,853 |
| 237,008 |
|
c) Options on Issue
Details of the share options outstanding as at 31 December:
Grant Date |
| Expiry Date |
| Exercise Price |
| 2014 |
| 2013 |
|
02 Dec 2010 |
| 01 Dec 2015 |
| 0.37 |
| — |
| 291,666 |
|
02 Mar 2011 |
| 30 Jun 2014 |
| 0.95 |
| — |
| 30,000 |
|
03 Jun 2011 |
| 15 Jan 2016 |
| 0.65 |
| 500,000 |
| 500,000 |
|
06 Jun 2011 |
| 01 Sep 2015 |
| 0.95 |
| 30,000 |
| 30,000 |
|
06 Sep 2011 |
| 31 Dec 2018 |
| 0.95 |
| 1,200,000 |
| 1,200,000 |
|
05 Dec 2011 |
| 05 Mar 2019 |
| 0.95 |
| 1,000,000 |
| 1,000,000 |
|
01 Nov 2012 |
| 01 Feb 2020 |
| 1.15 |
| — |
| 350,000 |
|
03 Dec 2012 |
| 03 Mar 2020 |
| 1.15 |
| — |
| 350,000 |
|
01 Apr 2013 |
| 01 Jul 2020 |
| 1.25 |
| — |
| 350,000 |
|
24 Sept 2013 |
| 23 Dec 2020 |
| 1.40 |
| — |
| 950,000 |
|
Total share options outstanding |
|
|
|
|
| 2,730,000 |
| 5,051,666 |
|
NOTES TO THE CONSOLIDATED FINANCIAL STATEMENTS
NOTE 25 — ISSUED CAPITAL continued
d) Restricted Share Units on Issue
Details of the restricted share units outstanding as at 31 December:
Grant Date |
| 2014 |
| 2013 |
|
05 Dec 2011 |
| — |
| 88,500 |
|
15 Oct 2012 |
| 352,676 |
| 709,817 |
|
19 April 2013 |
| 411,769 |
| 625,304 |
|
28 May 2013 |
| 187,124 |
| 280,686 |
|
15 April 2014 |
| 126,666 |
| — |
|
24 April 2014 |
| 1,291,951 |
| — |
|
29 April 2014 |
| 90,000 |
| — |
|
30 May 2014 |
| 503,991 |
| — |
|
Total RSUs outstanding |
| 2,964,177 |
| 1,704,307 |
|
e) Capital Management
Management controls the capital of the Group in order to maintain an appropriate debt to equity ratio, provide the shareholders with adequate returns and ensure that the Group can fund its operations and continue as a going concern.
The Group’s debt and capital includes ordinary share capital and financial liabilities, supported by financial assets. Other than the covenants described in Note 21, the Group has no externally imposed capital requirements.
Management effectively manages the Group’s capital by assessing the Group’s financial risks and adjusting its capital structure in response to changes in these risks and in the market. These responses include the management of debt levels, distributions to shareholders and shareholder issues.
There have been no changes in the strategy adopted by management to control the capital of the Group since the prior period. The strategy is to ensure that the Group’s gearing ratio remains minimal. As at 31 December 2014 and 2013, the Company had $128.8 million and $29.1 million of outstanding debt, net of deferred financing fees, respectively.
NOTES TO THE CONSOLIDATED FINANCIAL STATEMENTS
NOTE 26 — RESERVES
a) Share Option Reserve
The share option reserve records items recognised as expenses on valuation of employee and supplier share options and restricted share units.
b) Foreign Currency Translation Reserve
The foreign currency translation reserve records exchange differences arising on translation of the Parent Company.
NOTE 27 — CAPITAL AND OTHER EXPENDITURE COMMITMENTS
Capital commitments relating to tenements
As at 31 December 2014, all of the Company’s exploration and evaluation and development and production assets are located in the United States of America (“US”).
The mineral leases in the exploration prospects in the US have primary terms ranging from 3 years to 5 years and generally have no specific capital expenditure requirements. However, mineral leases that are not successfully drilled and included within a spacing unit for a producing well within the primary term will expire at the end of the primary term unless re-leased.
NOTES TO THE CONSOLIDATED FINANCIAL STATEMENTS
NOTE 27 — CAPITAL AND OTHER EXPENDITURE COMMITMENTS continued
The following tables summarize the Group’s contractual commitments not provided for in the consolidated financial statements:
As at 31 December 2014 |
| Total |
| Less than |
| 1 — 5 years |
| More than 5 |
|
Drilling rig commitments (1) |
| 1,460 |
| 1,460 |
| — |
| — |
|
Operating lease commitments (3) |
| 2,363 |
| 430 |
| 1,933 |
| — |
|
Employment commitments (4) |
| 742 |
| 370 |
| 372 |
| — |
|
Total expenditure commitments |
| 4,565 |
| 2,260 |
| 2,305 |
| — |
|
As at 31 December 2013 |
| Total |
| Less than |
| 1 — 5 years |
| More than 5 |
|
Drilling rig commitments (1) |
| 5,159 |
| 5,159 |
| — |
| — |
|
Drilling commitments (2) |
| 2,000 |
| — |
| 2,000 |
| — |
|
Operating lease commitments (3) |
| 1,860 |
| 200 |
| 1,354 |
| 306 |
|
Employment commitments (4) |
| 104 |
| 104 |
| — |
| — |
|
Total expenditure commitments |
| 9,123 |
| 5,463 |
| 3,354 |
| 306 |
|
(1) As at 31 December 2014 the Company had one (2013: four) outstanding drilling rig contracts to explore and develop the Company’s properties. The contracts generally have terms of 6 months. Amounts represent minimum expenditure commitments should the Company elect to terminate these contracts prior to term.
(2) On 31 December 2012, the Company entered into an agreement to acquire certain oil and natural gas properties located in the Wattenberg Field and to drill 45 net wells by 31 December 2015 on the acquired properties (the “Drilling Commitment”). As each qualifying well is drilled, approximately $67 thousand is paid from the escrow account to the Company. However, for each required net commitment well not completed by the Company during that prorated commitment year, the Company is to pay the seller of the properties approximately $67 thousand from the escrow account. Certain clawback provisions allow the Company to recoup amounts paid to the sellers if the total 45 wells are drilled by 31 December 2015. The Company sold the properties in July 2014 and should the buyer drill any qualifying wells, the obligation would be satisfied. As at 31 December 2014, the Company and the buyer had not drilled any wells and the Company does not expect any wells to be drilled under this provision in 2015. As such, the remaining commitment of $2.0 million was accrued in our consolidated statement of financial position and recognised against the gain on sale of assets in the consolidated statement of profit or loss and comprehensive income.
(3) Represents commitments for minimum lease payments in relation to non-cancellable operating leases for office space not provided for in the consolidated financial statements.
(4) Represents commitments for the payment of salaries and other remuneration under long-term employment and consultant contracts not provided for in the consolidated financial statements. Details relating to the employment contracts are set out in the Company’s Remuneration Report.
NOTES TO THE CONSOLIDATED FINANCIAL STATEMENTS
NOTE 28 — CONTINGENT ASSETS AND LIABILITIES
At the date of signing this report, the Group is not aware of any contingent assets or liabilities that should be recognised or disclosed in accordance with AASB 137/IFRS 37 — Provisions, Contingent Liabilities and Contingent Assets.
NOTE 29 — OPERATING SEGMENTS
The Company’s strategic focus is the exploration, development and production of large, repeatable onshore resource plays in North America, which is the Company’s only major line of business and only major geographic area of operations. All of the basins and/or formations in which the Company operates have common operational characteristics, challenges and economic characteristics. As such, Management has determined, based upon the reports reviewed and used to make strategic decisions by the Chief Operating Decision Maker (“CODM”), whom is the Company’s Managing Director and Chief Executive Officer, that the Company has one reportable segment being oil and natural gas exploration and production in North America.
The CODM reviews internal management reports on a monthly basis that are consistent with the information provided in the statement of profit or loss and other comprehensive income, statement of financial position and statement of cash flows. As a result no reconciliation is required, because the information as presented is used by the CODM to make strategic decisions.
Geographic Information
The operations of the Group are located in only one geographic location, North America. All revenue is generated from sales to customers located in North America.
Revenue from one major customer exceeded 10 percent of Group consolidated revenue for the year ended 31 December 2014 and accounted for 65 percent (2013: four major customers accounted for 47 percent, 15 percent, 10 percent and 10 percent) of our consolidated oil, natural gas and NGL revenues.
NOTES TO THE CONSOLIDATED FINANCIAL STATEMENTS
NOTE 30 — CASH FLOW INFORMATION
|
| 2014 |
| 2013 |
|
Year ended 31 December |
| US$’000 |
| US$’000 |
|
|
|
|
|
|
|
a) Reconciliation of cash flows from operations with income from ordinary activities after income tax |
|
|
|
|
|
Profit from ordinary activities after income tax |
| 15,321 |
| 15,942 |
|
Adjustments to reconcile net profit to net operating cash flows: |
|
|
|
|
|
Depreciation and amortisation expense |
| 85,584 |
| 36,225 |
|
Share options expensed |
| 1,915 |
| 1,590 |
|
Unrealised (gains) losses on derivatives |
| (9,642 | ) | 837 |
|
Net gain on sale of properties |
| (48,604 | ) | (7,335 | ) |
Impairment of development and production assets |
| 71,212 |
| — |
|
Unsuccessful exploration and evaluation expense |
| 10,934 |
| — |
|
Amortisation of deferred financing fees |
| 316 |
| 140 |
|
Add: Interest expense (disclosed in investing and financing activities) |
| 383 |
| — |
|
Recognition of DTA on items directly within equity |
| 879 |
| 665 |
|
Other |
| 126 |
| (153 | ) |
Changes in assets and liabilities: |
|
|
|
|
|
- (Decrease) increase in current and deferred income tax |
| (14,606 | ) | 5,147 |
|
- Decrease in other assets |
| 28 |
| 2,155 |
|
- Decrease (increase) in trade and other receivables |
| 8,679 |
| (3,541 | ) |
- Increase in trade and other payables |
| 5,562 |
| 10,974 |
|
Net cash provided by operating activities |
| 128,087 |
| 62,646 |
|
b) Non Cash Financing and Investing Activities
· During the year ended 31 December 2014 the net gain on sale of properties for the disposition of the Company’s remaining Williston assets included the relief of a net payable due to the buyer of $4.0 million ($17.1 million payable and $13.1 million receivable).
· During the year ended 31 December 2013 $132.1 million in shares were issued in connection with the Texon acquisition.
NOTES TO THE CONSOLIDATED FINANCIAL STATEMENTS
NOTE 31 — SHARE BASED PAYMENTS
Options
During the years ended 31 December 2014 and 2013, a total of nil and 2,000,000 options were granted to employees pursuant to employment agreements and a total of 431,666 and 2,725,000 previously issued options were exercised, respectively. There were 700,000 awarded options that the Company issued in early 2013 for which Company employees rendered services during the six month period ended 31 December 2012.
Year ended 31 December
|
| 2014 |
| 2013 |
| ||||
|
| Number |
| Weighted Average |
| Number |
| Weighted Average |
|
Outstanding at start of period |
| 5,051,666 |
| 1.02 |
| 5,776,666 |
| 0.59 |
|
Formally issued |
| — |
| — |
| 2,000,000 |
| 1.29 |
|
Forfeited |
| (1,890,000 | ) | 1.29 |
| — |
| — |
|
Exercised |
| (431,666 | ) | 0.62 |
| (2,725,000 | ) | 0.31 |
|
Expired |
| — |
| — |
| — |
| — |
|
Outstanding at end of period |
| 2,730,000 |
| 0.90 |
| 5,051,666 |
| 1.02 |
|
Exercisable at end of period |
| 1,930,000 |
| 0.87 |
| 2,241,666 |
| 0.87 |
|
The following tables summarise the options issued and awarded and their related grant date, fair value and vesting conditions for the year ended 31 December 2013. No options were issued during the year ended 31 December 2014.
For options outstanding as at 31 December 2014, the exercise price ranged from A$0.65 to A$0.95 and the weighted average remaining contractual life was 3.5 years.
Options issued during the year ended 31 December 2013:
Grant Date |
| Number of |
| Estimated Fair |
| Vesting Conditions |
| |
1 April 2013 |
| 350,000 |
| $ | 217 |
| 20% issuance date, 20% first four anniversaries |
|
24 September 2013 |
| 950,000 |
| $ | 475 |
| 20% issuance date, 20% first four anniversaries |
|
Total |
| 1,300,000 |
| $ | 692 |
|
|
|
Share based payments expense related to options is determined pursuant to AASB 2 - Share Based Payments (“AASB 2”) / IFRS 2 — Share Based Payments (“IFRS 2”), and is recognised pursuant to the attached vesting conditions. The fair value of the options awarded ranged from A$0.53 to A$0.59 for the year ended 31 December 2013, which were calculated using a Black-Sholes options pricing model. Expected volatilities are based upon the historical volatility of the ordinary shares. Historical data is also used to estimate the probability of option exercise and potential forfeitures.
NOTES TO THE CONSOLIDATED FINANCIAL STATEMENTS
NOTE 31 — SHARE BASED PAYMENTS continued
The following table summarises the key assumptions used to calculate the estimated fair value awarded or granted during the year ended 31 December 2013:
|
| 2013 |
Share price: |
| A$ 1.06 – A$1.10 |
Exercise price: |
| A$1.25 – 1.40 |
Expected volatility: |
| 60% |
Option term: |
| 5.75 years |
Risk free interest rate: |
| 2.82 to 3.10% |
Restricted Share Units
During the years ended 31 December 2014 and 2013, the Board of Directors awarded 2,839,626 and 1,237,994 RSUs to certain employees. These awards were made in accordance with the long-term equity component of the Company’s incentive compensation plan, the details of which are described in more detail in the remuneration section of the Directors’ Report. Share based payment expense for RSUs awarded was calculated pursuant to AASB 2 / IFRS 2. The fair values of RSUs were estimated at the date they were approved by the Board of Directors (the measurement dates) based on the Company’s stock price at the date of grant. The value of the vested portion of these awards has been recognised within the financial statements. This information is summarised for the Group for the years ended 31 December 2014 and 2013, respectively, below:
|
| Number |
| Weighted Average |
|
|
|
|
|
|
|
Outstanding at 31 December 2012 |
| 2,090,893 |
| 0.59 |
|
Issued |
| 1,237,994 |
| 0.91 |
|
Converted to ordinary shares |
| (1,511,511 | ) | 0.76 |
|
Forfeited |
| (113,069 | ) | 0.76 |
|
Outstanding at 31 December 2013 |
| 1,704,307 |
| 0.83 |
|
Issued |
| 2,839,626 |
| 0.97 |
|
Converted to ordinary shares |
| (1,479,978 | ) | 0.89 |
|
Forfeited |
| (99,778 | ) | 0.92 |
|
Outstanding at 31 December 2014 |
| 2,964,177 |
| 0.93 |
|
The following tables summarise the RSUs issued and their related grant date, fair value and vesting conditions:
RSUs awarded during the year ended 31 December 2014:
Grant Date |
| Number of |
| Estimated Fair |
| Vesting Conditions |
| |
15 April 2014 |
| 1,842,638 |
| $ | 1,611 |
| 25% issuance date, 25% first three anniversaries |
|
5 May 2014 |
| 135,000 |
| 123 |
| 33% issuance date, 33% on 1 January 2015 and 2016 |
| |
12 May 2014 |
| 190,000 |
| 172 |
| 33% issuance date, 33% first two anniversaries |
| |
30 May 2014 |
| 671,988 |
| 680 |
| 25% issuance date, 25% first three anniversaries |
| |
|
| 2,839,626 |
| $ | 2,586 |
|
|
|
NOTES TO THE CONSOLIDATED FINANCIAL STATEMENTS
NOTE 31 — SHARE BASED PAYMENTS continued
RSUs awarded during the year ended 31 December 2013:
Grant Date |
| Number of |
| Estimated Fair |
| Vesting Conditions |
| |
19 April 2013 |
| 863,746 |
| $ | 789 |
| 25% issuance date, 25% first three anniversaries |
|
28 May 2013 |
| 374,248 |
| 354 |
| 25% issuance date, 25% first three anniversaries |
| |
|
| 1,237,994 |
| $ | 1,143 |
|
|
|
Upon vesting, and after a certain administrative period, the RSUs are converted to ordinary shares of the Company. Once converted to ordinary shares, the RSUs are no longer restricted. As the daily closing price of the Company’s ordinary shares approximates its estimated fair value at that time, the Company used the grant date closing price to estimate the fair value of the RSUs.
The total share based compensation expense for the years ended 31 December 2014 and 2013 was $1.9 million and $1.6 million, respectively.
NOTE 32 — RELATED PARTY TRANSACTIONS
N Martin was previously a partner of Minter Ellison Lawyers and is now a consultant for Minter Ellison Lawyers as well as a Director of the Company. Minter Ellison Lawyers were paid a non material amount for legal services for the year ended 31 December 2014 and $0.2 million for legal services for the years ended 31 December 2013.
NOTE 33 — FINANCIAL RISK MANAGEMENT
a) Financial Risk Management Policies
The Group is exposed to a variety of financial market risks including interest rate, commodity prices, foreign exchange and liquidity risk. The Group’s risk management strategy focuses on the volatility of commodity markets and protecting cash flow in the event of declines in commodity pricing. The Group utilises derivative financial instruments to hedge exposure to fluctuations in interest rates and commodity prices. The Group’s financial instruments consist mainly of deposits with banks, short term investments, accounts receivable, derivative financial instruments, finance facility, and payables. The main purpose of non-derivative financial instruments is to raise finance for the Group operations.
i) Treasury Risk Management
Financial risk management is carried out by Management. The Board sets financial risk management policies and procedures by which Management are to adhere. Management identifies and evaluates all financial risks and enters into financial risk instruments to mitigate these risk exposures in accordance with the policies and procedures outlined by the Board.
ii) Financial Risk Exposure and Management
Interest rate risk is managed with a mixture of fixed and floating rate cash deposits. As at 31 December 2014 and 2013 approximately nil of Group deposits are fixed. It is the policy of the Group to keep surplus cash in interest yielding deposits.
NOTES TO THE CONSOLIDATED FINANCIAL STATEMENTS
NOTE 33 — FINANCIAL RISK MANAGEMENT continued
The Group’s interest rate risk arises from its borrowings. Interest rate risk is the risk that the fair value of future cash flows of a financial instrument will fluctuate because of changes in market interest rates. The Group’s exposure to the risk of changes in market interest rates relates primarily to the Group’s long-term debt obligations with floating interest rates.
During the year ended 31 December 2013, the Group entered into US dollar denominated interest rate swaps which fix the interest rate associated with the credit facilities to protect against the floating LIBOR rates through 2017. As at 31 December 2014 the Group had interest rate swaps with a notional contract amount of $15.0 million (2013: $15.0 million).
The net fair value of interest rate swaps at 31 December 2014 was relatively immaterial, comprising long-term assets of $0.1 million (2013: $0.2 million) and current liabilities of $0.1 million (2013: 0.1 million). These amounts were recognised as Level 2 fair value derivatives. (See Note 14)
iii) Commodity Price Risk Exposure and Management
The Board actively reviews oil and natural gas hedging on a monthly basis. Reports providing detailed analysis of the Group’s hedging activity are continually monitored against Group policy. The Group sells its oil on market using Nymex and LLS market spot rates reduced for basis differentials in the basins from which the Company produces. Gas is sold using Henry Hub and Houston Ship Channel market spot prices. Forward contracts are used by the Group to manage its forward commodity price risk exposure. The Group’s policy is to hedge less than 50% of anticipated future oil and gas production for up to 24 months. The Group may hedge over 50% or beyond 24 months with approval of the Board. The Group has not elected to utilise hedge accounting treatment and changes in fair value are recognised in the statement of profit or loss and other comprehensive income.
Commodity Hedge Contracts outstanding as at 31 December 2014
Contract Type |
| Counterparty |
| Basis |
| Quantity/mo |
| Strike Price |
| Term |
Collar |
| Wells Fargo |
| WTI |
| 2,000 BBL |
| $75.00/$98.65 |
| 1 Jan 15 – 31 Dec 15 |
Collar |
| Shell Trading US |
| LLS |
| 3,000 BBL |
| $85.00/$101.05 |
| 1 Jan 15 – 31 Dec 15 |
Collar |
| Wells Fargo |
| WTI |
| 2,000 BBL |
| $80.00/$97.00 |
| 1 Jan 15 – 31 Dec 15 |
Collar |
| Wells Fargo |
| WTI |
| 1,000 BBL |
| $80.00/$94.94 |
| 1 Jan 15 – 31 Dec 15 |
Swap |
| Wells Fargo |
| LLS |
| 2,000 BBL |
| $91.65 |
| 1 Jan 15 – 31 Dec 15 |
Swap |
| Shell Trading US |
| LLS |
| 5,000 BBL |
| $98.05 |
| 1 Jan 15 – 30 Jun 15 |
Swap |
| Shell Trading US |
| LLS |
| 3,000 BBL |
| $94.10 |
| 1 Jul 15 – 31 Dec 15 |
Swap |
| Wells Fargo |
| WTI |
| 2,000 BBL |
| $95.08 |
| 1 Jan 15 – 31 Dec 15 |
Swap |
| Wells Fargo |
| LLS |
| 2,000 BBL |
| $97.74 |
| 1 Jan 15 – 31 Dec 15 |
Swap |
| Shell Trading US |
| LLS |
| 5,000 BBL |
| $100.70 |
| 1 Jan 15 – 30 Jun 15 |
Swap |
| Shell Trading US |
| LLS |
| 5,000 BBL |
| $94.10 |
| 1 Jan 16 – 31 Dec 16 |
Swap |
| Shell Trading US |
| HH |
| 20,000 MCF |
| $4.14 |
| 1 Jan 15 – 31 Dec 15 |
See Note 36 for discussion of new commodity hedge contracts entered into subsequent to 31 December 2014.
NOTES TO THE CONSOLIDATED FINANCIAL STATEMENTS
NOTE 33 — FINANCIAL RISK MANAGEMENT continued
b) Net Fair Value of Financial Assets and Liabilities
The net fair value of cash and cash equivalent and non-interest bearing monetary financial assets and financial liabilities of the consolidated entity approximate their carrying value.
The net fair value of other monetary financial assets and financial liabilities is based on discounting future cash flows by the current interest rates for assets and liabilities with similar risk profiles. Other than the Junior Credit Facility, the balances are not materially different from those disclosed in the consolidated statement of financial position of the Group.
c) Credit Risk
Credit risk for the Group arises from investments in cash and cash equivalents, derivative financial instruments and deposits with banks and financial institutions, as well as credit exposures to customers including outstanding receivables and committed transactions, and represents the potential financial loss if counterparties fail to perform as contracted. The Group trades only with recognised, creditworthy third parties.
The maximum exposure to credit risk, excluding the value of any collateral or other security, at balance date to recognise the financial assets, is the carrying amount, net of any impairment of those assets, as disclosed in the balance sheet and notes to the financial statements. Receivable balances are monitored on an ongoing basis at the individual customer level.
At 31 December 2014, the Group had three customers that owed the Group more than $1.0 million each and accounted for approximately 75% of total accrued revenue receivables. There was one customer with balances greater than $5.0 million accounting for approximately 56% of total accrued revenue receivables. For joint interest billing receivables, if payment is not made, the Group can withhold future payments of revenue, as such, there is minimal to no credit risk associated with these receivables.
d) Liquidity Risk
Liquidity risk is the risk that the Group will not be able to meet its financial obligations as they fall due. The Group’s approach to managing liquidity is to ensure that it will have sufficient liquidity to meet its liabilities as they become due, without incurring unacceptable losses or risking damage to the Group’s reputation. The Group manages liquidity risk by maintaining adequate reserves and banking facilities by continuously monitoring forecast and actual cash flows, and by matching the maturity profiles of financial assets and liabilities.
As at 31 December 2014, based on the current borrowing based, the Group had $15.0 million of undrawn borrowing facilities.
NOTES TO THE CONSOLIDATED FINANCIAL STATEMENTS
NOTE 33 — FINANCIAL RISK MANAGEMENT continued
The Company has the following commitments related to its financial liabilities (US$’000):
Year ended 31 December 2014 |
| Total |
| Less than 1 |
| 1 – 5 |
| More than |
|
|
|
|
|
|
|
|
|
|
|
Trade and other payable |
| 46,861 |
| 46,861 |
| — |
| — |
|
Accrued expenses |
| 72,333 |
| 72,333 |
| — |
| — |
|
Derivative financial liabilities |
| 130 |
| 130 |
|
|
|
|
|
Credit facilities payments, including interest |
| 147,994 |
| 5,502 |
| 142,492 |
| — |
|
Total |
| 267,318 |
| 124,826 |
| 142,492 |
| — |
|
Year ended 31 December 2013 |
| Total |
| Less than 1 |
| 1 – 5 |
| More than |
|
|
|
|
|
|
|
|
|
|
|
Trade and other payable |
| 62,811 |
| 62,811 |
| — |
| — |
|
Accrued expenses |
| 66,273 |
| 66,273 |
| — |
| — |
|
Derivative financial liabilities |
| 366 |
| 335 |
| 31 |
| — |
|
Credit facilities payments, including interest |
| 37,037 |
| 1,600 |
| 35,437 |
| — |
|
Total |
| 166,487 |
| 131,019 |
| 35,468 |
| — |
|
e) Market Risk
Market risk is the risk that the fair value of future cash flows of a financial instrument will fluctuate because of changes in market prices. Market risk comprises three types of risk: commodity price risk, interest rate risk and foreign currency risk. Financial instruments affected by market risk include loans and borrowings, deposits, trade receivables, trade payables, accrued liabilities and derivative financial instruments.
Commodity Price Risk
The Group is exposed to the risk of fluctuations in prevailing market commodity prices on the mix of oil and gas products it produce.
Commodity Price Risk Sensitivity Analysis
The table below summarises the impact on profit before tax for changes in commodity prices on the fair value of derivative financial instruments. The impact on equity is the same as the impact on profit before tax as these derivative financial instruments have not been designated as hedges and are and therefore adjusted to fair value through profit and loss. The analysis assumes that the crude oil and natural gas price moves $10 per barrel and $0.50 per mcf, with all other variables remaining constant, respectively.
NOTES TO THE CONSOLIDATED FINANCIAL STATEMENTS
NOTE 33 — FINANCIAL RISK MANAGEMENT continued
Year ended 31 December |
| 2014 |
| 2013 |
|
|
|
|
|
|
|
Effect on profit before tax |
|
|
|
|
|
Oil |
|
|
|
|
|
- improvement in US$ oil price of $10 per barrel |
| (2,400 | ) | (2,351 | ) |
- decline in US$ oil price of $10 per barrel |
| 3,041 |
| 1,477 |
|
Gas |
|
|
|
|
|
- improvement in US$ gas price of $0.50 per mcf |
| (120 | ) | (124 | ) |
- decline in US$ gas price of $0.50 per mcf |
| 120 |
| 180 |
|
Interest Rate Risk
Interest rate risk is the risk that the fair value of the future cash flows of a financial instrument will fluctuate because of changes in market interest rates. The Group’s exposure to the risk of changes in market interest rates relates primarily to the Group’s long-term debt obligations with floating interest rates.
Interest Rate Sensitivity Analysis
Based on the net debt position as at 31 December 2014 and 2013, taking into account interest rate swaps, with all other variables remaining constant, the following table represents the effect on income as a result of changes in the interest rate. The impact on equity is the same as the impact on profit before tax.
Year ended 31 December |
| 2014 |
| 2013 |
|
|
|
|
|
|
|
Effect on profit before tax |
|
|
|
|
|
- increase in interest rates + 2% |
| (906 | ) | (177 | ) |
- decrease in interest rates - 2% |
| 184 |
| — |
|
This assumes that the change in interest rates is effective from the beginning of the financial year and the net debt position and fixed/floating mix is constant over the year. However, interest rates and the debt profile of the Group are unlikely to remain constant and therefore the above sensitivity analysis will be subject to change.
NOTES TO THE CONSOLIDATED FINANCIAL STATEMENTS
NOTE 34—PARENT COMPANY INFORMATION
a) Cost Basis
Year ended 31 December |
| 2014 |
| 2013 |
| ||
Parent Entity |
|
|
|
|
| ||
Assets |
|
|
|
|
| ||
Current assets |
|
| 9,108 |
|
| 1,962 |
|
Investment in subsidiaries |
| 159,606 |
| 173,633 |
| ||
Deferred tax assets |
| 3,998 |
| 2,303 |
| ||
Related party note receivable |
| 112,481 |
| 40,537 |
| ||
Total assets |
|
| 285,193 |
|
| 218,435 |
|
Liabilities |
|
|
|
|
| ||
Current liabilities |
|
| 34 |
|
| 425 |
|
Total Liabilities |
|
| 34 |
|
| 425 |
|
Total net assets |
|
| 285,159 |
|
| 218,010 |
|
Equity |
|
|
|
|
| ||
Issued capital |
|
| 306,853 |
| 237,008 |
| |
Share options reserve |
| 386 |
| 386 |
| ||
Foreign currency translation |
| (30,539 | ) | (20,509 | ) | ||
Retained earnings (loss) |
| 8,459 |
| 1,125 |
| ||
Total equity |
|
| 285,159 |
|
| 218,010 |
|
Financial Performance |
|
|
|
|
| ||
Profit/(loss) for the period |
|
| 7,334 |
|
| 275 |
|
Other comprehensive income |
| (10,030 | ) | (31,307 | ) | ||
Total profit or loss and other comprehensive income |
|
| (2,696 | ) |
| (31,032 | ) |
b) Equity Basis
Year ended 31 December |
| 2014 |
| 2013 |
| ||
Parent Entity |
|
|
|
|
| ||
Assets |
|
|
|
|
| ||
Current assets |
|
| 9,108 |
|
| 1,962 |
|
Investment in subsidiaries |
| 309,453 |
| 302,864 |
| ||
Deferred tax assets |
| 3,998 |
| 2,303 |
| ||
Related party note receivable |
| 112,481 |
| 40,537 |
| ||
Total assets |
|
| 435,040 |
|
| 347,666 |
|
Liabilities |
|
|
|
|
| ||
Current liabilities |
|
| 34 |
|
| 425 |
|
Non-current liabilities |
| — |
| — |
| ||
Total Liabilities |
|
| 34 |
|
| 425 |
|
Total net assets |
|
| 435,006 |
|
| 347,241 |
|
Equity |
|
|
|
|
| ||
Issued capital |
|
| 306,853 |
|
| 237,008 |
|
Share options reserve |
| 7,550 |
| 5,635 |
| ||
Foreign currency translation |
| (832 | ) | (1,516 | ) | ||
Retained earnings (loss) |
| 121,435 |
| 106,114 |
| ||
Total equity |
|
| 435,006 |
|
| 347,241 |
|
NOTES TO THE CONSOLIDATED FINANCIAL STATEMENTS
NOTE 34—PARENT COMPANY INFORMATION continued
Year ended 31 December |
| 2014 |
| 2013 |
| ||
Financial Performance |
|
|
|
|
| ||
Profit/(loss) for the period before equity in income of subsidiaries |
|
| 7,334 |
|
| 275 |
|
Equity in income of subsidiaries |
| 7,987 |
| 15,667 |
| ||
Other comprehensive income |
| 684 |
| (421 | ) | ||
Total profit or loss and other comprehensive income |
|
| 16,005 |
|
| 15,521 |
|
c) Cash Flow
Year ended 31 December |
| 2014 |
| 2013 |
| ||
Cash flow from operating activities |
|
| (70,216 | ) |
| (42,934 | ) |
Cash flow from investing activities |
| 9,415 |
| (136,890 | ) | ||
Cash flow from financing activities |
| 71,761 |
| 179,904 |
| ||
NOTE 35 — DEED OF CROSS GUARANTEE
Pursuant to Class Order 98/1418, the wholly-owned subsidiary, Armadillo Petroleum Limited (“APL”), is relieved from the Corporations Act 2001 requirements for preparation, audit and lodgement of its financial reports.
As a condition of the Class Order, SEAL and APL (“the Closed Group”) have entered into a Deed of Cross Guarantee (“Deed”). The effect of the Deed is that SEAL has guaranteed to pay any deficiency in the event of the winding up of APL under certain provision of the Corporations Act 2001. APL has also given a similar guarantee in the event that SEAL is wound up.
Set out below is a consolidated statement of profit or loss and other comprehensive income and retained earnings of the Closed Group:
Year ended 31 December |
| 2014 |
| 2013 |
|
|
|
|
|
|
|
Profit / (loss) before income tax |
| 7,764 |
| (1,497 | ) |
|
|
|
|
|
|
Income tax (expense)/benefit |
| (324 | ) | 1,780 |
|
|
|
|
|
|
|
Profit attributable to members of SEAL |
| 7,440 |
| 283 |
|
|
|
|
|
|
|
Total comprehensive loss attributable to members of SEAL |
| (2,813 | ) | (18,924 | ) |
|
|
|
|
|
|
Retained earnings at 1 January |
| 1,132 |
| 849 |
|
Retained earnings at 31 December |
| 8,572 |
| 1,132 |
|
NOTES TO THE CONSOLIDATED FINANCIAL STATEMENTS
NOTE 35 — DEED OF CROSS GUARANTEE continued
Set out below is a condensed consolidated statement of financial position of the Closed Group:
Year ended 31 December |
| 2014 |
| 2013 |
|
| �� |
|
|
|
|
Current assets |
|
|
|
|
|
Cash and cash equivalents |
| 11,506 |
| 1,558 |
|
Other current assets |
| 185 |
| 2,200 |
|
Total current assets |
| 11,691 |
| 3,758 |
|
|
|
|
|
|
|
Non-current assets |
|
|
|
|
|
Exploration and evaluation expenditure |
| 45 |
| 170 |
|
Related party note receivable |
| 112,481 |
| 40,537 |
|
Deferred tax assets |
| 3,998 |
| 2,303 |
|
Investment in subsidiaries |
| 158,047 |
| 171,937 |
|
Total non-current assets |
| 274,571 |
| 214,947 |
|
|
|
|
|
|
|
Total assets |
| 286,262 |
| 218,705 |
|
|
|
|
|
|
|
Current liabilities |
|
|
|
|
|
Trade and other payables |
| 988 |
| 176 |
|
Accrued expenses |
| 13 |
| 302 |
|
Total current liabilities |
| 1,001 |
| 478 |
|
|
|
|
|
|
|
Non-current liabilities |
|
|
|
|
|
Deferred tax liabilities |
| 3 |
| 4 |
|
Total non-current liabilities |
| 3 |
| 4 |
|
|
|
|
|
|
|
Total liabilities |
| 1,004 |
| 482 |
|
|
|
|
|
|
|
Net assets |
| 285,258 |
| 218,223 |
|
|
|
|
|
|
|
Equity |
|
|
|
|
|
Issued capital |
| 306,853 |
| 237,008 |
|
Share option reserve |
| 386 |
| 386 |
|
Foreign currency translation |
| (30,553 | ) | (20,303 | ) |
Retained earnings |
| 8,572 |
| 1,132 |
|
Total equity |
| 285,258 |
| 218,223 |
|
NOTES TO THE CONSOLIDATED FINANCIAL STATEMENTS
NOTE 36 — EVENTS AFTER THE BALANCE SHEET DATE
In January 2015, the company acquired three leases totalling approximately 14,180 net acres in the Eagle Ford for approximately $13.4 million.
Subsequent to 31 December 2014, an additional $15.0 million was drawn-down under the Senior Credit Facility, bringing total outstanding debt to $145.0 million, with no undrawn funds available. Both the Senior Credit Facility and Junior Credit Facility were refinanced as discussed below.
On May 14, 2015, Sundance Energy Australia Limited and Sundance Energy, Inc. entered into a Credit Agreement (the “Credit Agreement”) with Morgan Stanley Energy Capital, Inc., as administrative agent (“Agent”) and the lenders from time to time party thereto, which provides for a $300 million senior secured revolving credit facility (the “Revolving Facility”) and term loans of $125 million (the “Term Loans), with an accordion feature providing for additional term loans of up to $50 million, subject to certain conditions The Revolving Facility is subject to a borrowing base, which has been set initially at $75 million. At closing on May 14, 2015, $25 million was drawn on the Revolving Facility and $125 million of Term Loans were funded. The Revolving Facility has a five year term and the Term Loans have a 5 ½ year term.
The Revolving Facility and Term Loans refinanced the Company’s credit facilities with Wells Fargo Bank, N.A. and Wells Fargo Energy Capital, Inc., respectively. At closing, the Company used $145.0 million of the proceeds to pay off its previous credit facilities, which are fully paid-off. Approximately $1.1 million of deferred financing fees related to the previous credit facilities were written off due to the refinance.
Subsequent to year end and in anticipation of closing the aforementioned credit facilities, the Company entered into the following hedge contracts.
|
|
|
|
|
| Units per month |
| Floor |
| Ceiling |
|
|
| ||||||||||
Description |
| Commodity |
| Basis |
| 2015 |
| 2016 |
| 2017 |
| 2018 |
| 2019 |
| Price |
| Price |
| Term |
| ||
Collar |
| Oil (Bbls) |
| LLS |
| 10,000 |
| — |
| — |
| — |
| — |
| $ | 50.00 |
| $ | 98.65 |
| Jun ‘15 – Dec ‘15 |
|
Collar |
| Oil (Bbls) |
| LLS |
| 10,000 |
| — |
| — |
| — |
| — |
| 50.00 |
| 101.05 |
| Jun ‘15 – Dec ‘15 |
| ||
Swap |
| Oil (Bbls) |
| LLS |
| 6,000 |
| — |
| — |
| — |
| — |
| 64.70 |
| 64.70 |
| Jun ‘15 – Dec ‘15 |
| ||
Swap |
| Oil (Bbls) |
| LLS |
| 6,000 |
| — |
| — |
| — |
| — |
| 65.90 |
| 65.90 |
| Jun ‘15 – Sep ‘15 |
| ||
Swap |
| Oil (Bbls) |
| LLS |
| 3,333 | * | — |
| — |
| — |
| — |
| 66.75 |
| 66.75 |
| Jun ‘15 – Nov ‘15 |
| ||
Collar |
| Oil (Bbls) |
| LLS |
| — |
| 10,000 |
| — |
| — |
| — |
| 50.00 |
| 69.30 |
| Jan ‘16 – May ‘16 |
| ||
Collar |
| Oil (Bbls) |
| LLS |
| — |
| 10,000 |
| — |
| — |
| — |
| 50.00 |
| 72.25 |
| Jan ‘16 – May ‘16 |
| ||
Collar |
| Oil (Bbls) |
| LLS |
| — |
| 10,000 |
| — |
| — |
| — |
| 50.00 |
| 77.00 |
| Jun ‘16 |
| ||
Collar |
| Oil (Bbls) |
| LLS |
| — |
| 10,000 |
| — |
| — |
| — |
| 50.00 |
| 85.00 |
| Jul ‘16 – Dec ‘16 |
| ||
Collar |
| Oil (Bbls) |
| LLS |
| — |
| 4,000 |
| — |
| — |
| — |
| 50.00 |
| 77.80 |
| Jan ‘16 – Dec ‘16 |
| ||
Collar |
| Oil (Bbls) |
| LLS |
| — |
| — |
| 8,000 |
| — |
| — |
| 50.00 |
| 81.75 |
| Jan ‘17 – Dec ‘17 |
| ||
Collar |
| Oil (Bbls) |
| LLS |
| — |
| — |
| 4,000 |
| — |
| — |
| 50.00 |
| 80.25 |
| Jan ‘17 – Dec ‘17 |
| ||
Collar |
| Oil (Bbls) |
| LLS |
| — |
| — |
| — |
| 4,000 |
| — |
| 55.00 |
| 80.25 |
| Jan ‘18 – Dec ‘18 |
| ||
Collar |
| Oil (Bbls) |
| LLS |
| — |
| — |
| — |
| — |
| 4,000 |
| 55.00 |
| 82.00 |
| Jan ‘19 – Dec ‘19 |
| ||
Total Oil/Weighted Average Price |
|
|
|
|
| 35,333 |
| 44,000 |
| 12,000 |
| 4,000 |
| 4,000 |
| $ | 52.65 |
| $ | 75.60 |
| Jun ‘15 - Dec ‘19 |
|
Collar |
| Gas (Mmbtu) |
| HH |
| 40,000 |
| — |
| — |
| — |
| — |
| $ | 2.70 |
| $ | 3.20 |
| Jun ‘15 - Dec ‘15 |
|
Swap |
| Gas (Mmbtu) |
| HSC |
| 30,000 |
| — |
| — |
| — |
| — |
| $ | 3.06 |
| $ | 3.06 |
| Jun ‘15 - Dec ‘15 |
|
Collar |
| Gas (Mmbtu) |
| HSC |
| — |
| 20,000 |
| — |
| — |
| — |
| $ | 2.90 |
| $ | 3.50 |
| Jan ‘16 - Dec ‘16 |
|
Collar |
| Gas (Mmbtu) |
| HSC |
| — |
| 20,000 |
| — |
| — |
| — |
| $ | 2.90 |
| $ | 3.75 |
| Jan ‘16 - Dec ‘16 |
|
Collar |
| Gas (Mmbtu) |
| HH |
| — |
| 20,000 |
| — |
| — |
| — |
| $ | 2.90 |
| $ | 3.50 |
| Jan ‘16 - Dec ‘16 |
|
Collar |
| Gas (Mmbtu) |
| HH |
| — |
| — |
| 20,000 |
| — |
| — |
| $ | 3.05 |
| $ | 3.60 |
| Jan ‘17 - Dec ‘17 |
|
Total Gas/Weighted Average Price |
|
|
|
|
| 70,000 |
| 60,000 |
| 20,000 |
| — |
| — |
| $ | 2.91 |
| $ | 3.44 |
| Jun ‘15 - Dec ‘17 |
|
* Units per month range from 0 — 7,000 Bbls
In the above table, “LLS” refers to Light Louisiana Sweet, “HH” refers to Henry Hub and “HSC” refers to Houston Ship Channel.
NOTES TO THE CONSOLIDATED FINANCIAL STATEMENTS
NOTE 37—UNAUDITED SUPPLEMENTAL OIL AND GAS DISCLOSURES
Costs Incurred
The following table sets forth the capitalised costs incurred in our oil and gas production, exploration, and development activities:
(in thousands) |
| Year ended |
| Year ended |
| ||
Property Acquisition Costs |
|
|
|
|
| ||
Proved(1) |
| $ | 2,244 |
| $ | 158,116 |
|
Unproved(1) |
| 34,184 |
| 60,690 |
| ||
Exploration costs |
| 2,929 |
| 1,338 |
| ||
Development costs(2) |
| 350,196 |
| 219,121 |
| ||
|
| $ | 389,554 |
| $ | 439,265 |
|
(1) 2013 property acquisition costs include acquisition date fair value of $157.2 million and $47.3 million for proved and unproved assets acquired related to the Texon merger, which was primarily a non-cash business combination.
(2) 2014 and 2013 development costs include $49.2 million and $55.6 million of costs associated with non-producing wells in progress as at 31 December 2014 and 2013, respectively. These wells in progress were either drilling, waiting on hydraulic fracturing or production testing at year-end.
Oil and Gas Reserve Information
Netherland, Sewell & Associates, Inc. (“NSAI”), an independent petroleum engineering consulting firm, prepared all of the total future net revenue discounted at 10% attributable to the total interest owned by the Company as at 31 December 2014 and 2013. The technical person primarily responsible for the estimates set forth in the reserves report is Mr. Neil H. Little. Mr. Little is a Licensed Professional Engineer in the State of Texas with over 12 years of practical experience in petroleum engineering studies and over 5 years of practical experience in evaluation of reserves.
Proved reserves are those quantities of oil and natural gas, which, by analysis of geosciences and engineering data, can be estimated with reasonable certainty to be economically producible—from a given date forward, from known reservoirs, and under existing economic conditions, operating methods, and government regulations—prior to the time at which contracts providing the right to operate expire, unless evidence indicates that renewal is reasonably certain, regardless of whether deterministic or probabilistic methods are used for the estimation. The project to extract the hydrocarbons must have commenced or the operator must be reasonably certain that it will commence the project within a reasonable time.
There are numerous uncertainties inherent in estimating quantities of proved reserves and projecting future rates of production and the timing of development expenditures. The estimation of our proved reserves employs one or more of the following: production trend extrapolation, analogy, volumetric assessment and material balance analysis. Techniques including review of production and pressure histories, analysis of electric logs and fluid tests, and interpretations of geologic and geophysical data are also involved in this estimation process.
The following reserve data represents estimates only and should not be construed as being exact.
|
| Oil |
| Natural |
| NGL(1) |
| Total Oil |
|
Total proved reserves: |
|
|
|
|
|
|
|
|
|
31 December 2012 |
| 5,758 |
| 16,888 |
| — |
| 8,572 |
|
Revisions of previous estimates |
| (1,160 | ) | (4,091 | ) | 74 |
| (1,767 | ) |
Extensions and discoveries |
| 7,081 |
| 16,270 |
| 1,946 |
| 11,739 |
|
Purchases of reserves in-place |
| 3,857 |
| 4,674 |
| 758 |
| 5,393 |
|
Production |
| (827 | ) | (934 | ) | (96 | ) | (1,079 | ) |
Sales of reserves in-place |
| (1,753 | ) | (2,152 | ) | — |
| (2,111 | ) |
31 December 2013 |
| 12,956 |
| 30,655 |
| 2,683 |
| 20,747 |
|
Revisions of previous estimates |
| (143 | ) | (1,395 | ) | (580 | ) | (955 | ) |
Extensions and discoveries |
| 9,275 |
| 16,003 |
| 2,330 |
| 14,272 |
|
Purchases of reserves in-place |
| 64 |
| 28 |
| 1 |
| 70 |
|
Production |
| (1,675 | ) | (1,803 | ) | (268 | ) | (2,244 | ) |
Sales of reserves in-place |
| (3,451 | ) | (14,754 | ) | — |
| (5,910 | ) |
31 December 2014 |
| 17,026 |
| 28,733 |
| 4,166 |
| 25,981 |
|
Proved developed reserves: |
|
|
|
|
|
|
|
|
|
31 December 2012 |
| 1,932 |
| 5,242 |
| — |
| 2,805 |
|
31 December 2013 |
| 4,140 |
| 10,765 |
| 1,087 |
| 7,021 |
|
31 December 2014 |
| 6,124 |
| 12,364 |
| 1,801 |
| 9,985 |
|
Proved undeveloped reserves |
|
|
|
|
|
|
|
|
|
31 December 2012 |
| 3,826 |
| 11,646 |
| — |
| 5,767 |
|
31 December 2013 |
| 8,816 |
| 19,890 |
| 1,596 |
| 13,726 |
|
31 December 2014 |
| 10,903 |
| 16,369 |
| 2,365 |
| 15,996 |
|
(1) Prior to the year ended 31 December 2013, the Company’s NGL Proved Reserves were insignificant; and as such, were included in Natural Gas Proved Reserves and not separately reported in the Company’s reserve report.
Depletable Reserve Base
In accordance with International Financial Reporting Standards, as issued by the International Accounting Standards Board, the Company includes economically recoverable reserves as its depletable Reserve base used for its depletion calculation. With the exception of its Eagle Ford formation, the Company uses only Proved Developed Reserves in its depletable Reserve base. In addition to Proved Developed Reserves, the Company included Probable Developed Reserves of 1,867.0 MBoe and 887.3 MBoe in its Eagle Ford depletable Reserve base used for its year ended 31 December 2013 and 2014 depletion calculations. The Proved and Probable Developed Reserves represent managements’ best estimate of economically recoverable reserves associated with developed properties located in the Eagle Ford formation.
Revisions of Previous Estimates
The Company’s previous estimates of Proved Reserves related to the Greater Anadarko Basin decreased by 821 MBoe in 2014 (86 percent of the Company’s total revisions of previous estimate). This decrease was due to adjusted forecasts for the Greater Anadarko Basin.
The Company’s previous estimates of Proved Reserves related to the Denver-Julesburg decreased by 1,431 MBoe in 2013 (81 percent of the Company’s total revisions of previous estimate). This decrease was due to adjusted forecasts for the Denver-Julesburg.
Extensions and Discoveries
As a result of the Company’s active 2014 drilling programs in its Eagle Ford and Mississippian/Woodford formations, the Proved Reserves had extensions and discoveries of 9,488 MBoe and 4,784 MBoe, which represent 66% and 34% of the Company’s total extensions and discoveries, respectively.
As a result of the Company’s active 2013 drilling programs in its Eagle Ford and Mississippian/Woodford formations, the Proved Reserves had extensions and discoveries of 5,378 MBoe and 4,252 MBoe, which represent 46% and 36% of the Company’s total extensions and discoveries, respectively.
Purchase of Reserves In-Place
During the year ended December 31, 2014, our purchase of reserves were located in the Eagle Ford.
During the year ended December 31, 2013, our purchase of reserves were located in the Eagle Ford.
Sales of Reserves In-Place
During the year ended December 31, 2014, our sales of reserves were located in the Denver-Julesburg Basin and Goliath prospect of the Bakken.
During the year ended December 31, 2013, our sales of reserves were located in the Phoenix prospect of the Bakken.
Standardized Measure of Future Net Cash Flow
The Standardized Measure of Discounted Future Net Cash Flows Relating to Proved Oil and Natural Gas Reserves (“Standardized Measure”) does not purport, nor should it be interpreted, to present the fair value of a company’s proved oil and natural gas reserves. Fair value would require, among other things, consideration of expected future economic and operating conditions, a discount factor more representative of the time value of money, and risks inherent in reserve estimates.
Under the Standardized Measure, future cash inflows are based upon the forecasted future production of year-end proved reserves which are based on SEC-defined pricing as discussed further below. Future cash inflows are then reduced by estimated future production and development costs to determine net pre-tax cash flow. Future income taxes are computed by applying the statutory tax rate to the excess of pre-tax cash flow over our tax basis in the associated oil and gas properties. Tax credits and permanent differences are also considered in the future income tax calculation. Future net cash flow after income taxes is discounted using a 10% annual discount rate to arrive at the Standardized Measure.
The following summary sets forth our Standardized Measure:
(in thousands) |
| Year ended |
| Year ended |
| ||
Cash inflows |
| $ | 1,822,997 |
| $ | 1,407,871 |
|
Production costs |
| (444,369 | ) | (393,300 | ) | ||
Development costs |
| (411,110 | ) | (382,259 | ) | ||
Income tax expense |
| (182,999 | ) | (137,994 | ) | ||
Net cash flow |
| 784,520 |
| 494,318 |
| ||
10% annual discount rate |
| (349,014 | ) | (226,155 | ) | ||
Standardized measure of discounted future net cash flow |
| $ | 435,506 |
| $ | 268,163 |
|
The following are the principal sources of change in the Standardized Measure:
(in thousands) |
| Year ended |
| Year ended |
| ||
Standardized Measure, beginning of period |
| $ | 268,163 |
| $ | 115,547 |
|
Sales, net of production costs |
| (139,304 | ) | (66,962 | ) | ||
Net change in sales prices, net of production costs |
| 37,325 |
| 6,450 |
| ||
Extensions and discoveries, net of future production and development costs |
| 252,527 |
| 182,267 |
| ||
Changes in future development costs |
| 21,115 |
| 16,222 |
| ||
Previously estimated development costs incurred during the period |
| 119,164 |
| 13,854 |
| ||
Revision of quantity estimates |
| (27,495 | ) | (33,809 | ) | ||
Accretion of discount |
| 33,698 |
| 13,558 |
| ||
Change in income taxes |
| (27,408 | ) | (48,786 | ) | ||
Purchases of reserves in-place |
| 2,863 |
| 131,043 |
| ||
Sales of reserves in-place |
| (67,754 | ) | (36,935 | ) | ||
Change in production rates and other |
| (37,388 | ) | (24,286 | ) | ||
Standardized Measure, end of period |
| $ | 435,506 |
| $ | 268,163 |
|
The following table provides a reconciliation of PV10 to the Standardized Measure:
(in thousands) |
| Year ended |
| Year ended |
| ||
PV10 of proved reserves |
| $ | 531,735 |
| $ | 336,984 |
|
Present value of future income tax discounted at 10% |
| (96,229 | ) | (68,821 | ) | ||
Standardized Measure |
| $ | 435,506 |
| $ | 268,163 |
|
Impact of Pricing
The estimates of cash flows and reserve quantities shown above are based upon the unweighted average first-day-of-the-month prices for the previous twelve months. If future gas sales are covered by contracts at specified prices, the contract prices would be used. Fluctuations in prices are due to supply and demand and are beyond our control.
The following average prices were used in determining the Standardized Measure as at:
|
| Year ended |
| Year ended |
| ||
Oil price per Bbl |
| $ | 92.26 |
| $ | 94.55 |
|
Gas price per Mcf |
| $ | 4.43 |
| $ | 3.45 |
|
NGL price per Bbl |
| $ | 29.96 |
| $ | 28.78 |
|
The Company calculates the projected income tax effect using the “year- by-year” method for purposes of the supplemental oil and gas disclosures.
|
| Ernst & Young Services Pty Limited 680 George Street Sydney NSW 2000 Australia GPO Box 2646 Sydney NSW 2001 |
| Tel: +61 2 9248 5555 Fax: +61 2 9248 5959 ey.com/au |

Report of Independent Registered Public Accounting Firm
The Board of Directors and Shareholders of Sundance Energy Australia Limited:
We have audited the accompanying consolidated statement of financial position of Sundance Energy Australia Limited as of December 31, 2013 and 2012, and the related consolidated statements of profit or loss and other comprehensive income, changes in equity, and cash flows for the year ended December 31, 2013 and the six-month period ended December 31, 2012. These financial statements are the responsibility of the Company’s management. Our responsibility is to express an opinion on these financial statements based on our audits.
We conducted our audits in accordance with the standards of the Public Company Accounting Oversight Board (United States). Those standards require that we plan and perform the audit to obtain reasonable assurance about whether the financial statements are free of material misstatement. We were not engaged to perform an audit of the Company’s internal control over financial reporting. Our audit included consideration of internal control over financial reporting as a basis for designing audit procedures that are appropriate in the circumstances, but not for the purpose of expressing an opinion on the effectiveness of the Company’s internal control over financial reporting. Accordingly, we express no such opinion. An audit also includes examining, on a test basis, evidence supporting the amounts and disclosures in the financial statements, assessing the accounting principles used and significant estimates made by management, and evaluating the overall financial statement presentation. We believe that our audits provide a reasonable basis for our opinion.
In our opinion, the financial statements referred to above present fairly, in all material respects, the consolidated financial position of Sundance Energy Australia Limited at December 31, 2013 and 2012, and the consolidated results of its operations and its cash flows for the year ended December 31, 2013 and for the six-month period ended December 31, 2012, in conformity with International Financial Reporting Standards as issued by the International Accounting Standards Board.
/s/ Ernst & Young
Sydney, Australia
680 George Street
Sydney NSW 2000
Australia
11 July 2014
SUNDANCE ENERGY AUSTRALIA LIMITED
CONSOLIDATED STATEMENT OF PROFIT OR LOSS AND OTHER COMPREHENSIVE INCOME
FOR THE YEAR ENDED 31 DECEMBER 2013
|
| Note |
| Year ended |
| Six months ended |
| ||
Oil and natural gas revenue |
| 3 |
| $ | 85,345 |
| $ | 17,724 |
|
Lease operating and production tax expense |
| 4 |
| (18,383 | ) | (4,082 | ) | ||
Depreciation and amortisation expense |
| 17, 19 |
| (36,225 | ) | (6,116 | ) | ||
General and administrative expense |
| 5 |
| (15,297 | ) | (5,810 | ) | ||
Finance costs |
|
|
| 232 |
| (593 | ) | ||
Gain on sale of non-current assets |
| 6 |
| 7,335 |
| 122,327 |
| ||
(Loss)/gain on commodity hedging |
|
|
| (554 | ) | (639 | ) | ||
Other (loss)/income |
|
|
| (944 | ) | 15 |
| ||
Profit before income tax |
|
|
| 21,509 |
| 122,826 |
| ||
Income tax expense |
| 7 |
| (5,567 | ) | (46,616 | ) | ||
Profit attributable to owners of the Company |
|
|
| 15,942 |
| 76,210 |
| ||
Other comprehensive income |
|
|
|
|
|
|
| ||
Items that may be reclassified subsequently to profit or loss: |
|
|
|
|
|
|
| ||
Exchange differences arising on translation of foreign operations (no income tax effect) |
|
|
| (421 | ) | (154 | ) | ||
Other comprehensive income |
|
|
| (421 | ) | (154 | ) | ||
Total comprehensive income attributable to owners of the Company |
|
|
| $ | 15,521 |
| $ | 76,056 |
|
Earnings per share (cents) |
|
|
|
|
|
|
| ||
Basic earnings |
| 10 |
| 3.9 | ¢ | 27.5 | ¢ | ||
Diluted earnings |
| 10 |
| 3.8 | ¢ | 27.2 | ¢ | ||
The accompanying notes are an integral part of these consolidated financial statements
SUNDANCE ENERGY AUSTRALIA LIMITED
CONSOLIDATED STATEMENT OF FINANCIAL POSITION
AS AT 31 DECEMBER 2013
|
| Note |
| 31 December 2013 |
| 31 December 2012 |
| ||
CURRENT ASSETS |
|
|
|
|
|
|
| ||
Cash and cash equivalents |
| 11 |
| $ | 96,871 |
| $ | 154,110 |
|
Trade and other receivables |
| 12 |
| 28,748 |
| 15,672 |
| ||
Derivative financial instruments |
| 13 |
| — |
| 617 |
| ||
Other current assets |
| 15 |
| 4,038 |
| 5,025 |
| ||
CURRENT ASSETS |
|
|
| 129,657 |
| 175,424 |
| ||
Assets held for sale |
| 16 |
| 11,484 |
| — |
| ||
TOTAL CURRENT ASSETS |
|
|
| 141,141 |
| 175,424 |
| ||
NON-CURRENT ASSETS |
|
|
|
|
|
|
| ||
Development and production assets |
| 17 |
| 312,230 |
| 79,729 |
| ||
Exploration and evaluation expenditure |
| 18 |
| 166,144 |
| 33,439 |
| ||
Property and equipment |
| 19 |
| 1,047 |
| 423 |
| ||
Derivative financial instruments |
| 13 |
| 176 |
| — |
| ||
Deferred tax assets |
| 24 |
| 2,303 |
| — |
| ||
Other non-current assets |
| 20 |
| 2,019 |
| 2,420 |
| ||
TOTAL NON-CURRENT ASSETS |
|
|
| 483,919 |
| 116,011 |
| ||
TOTAL ASSETS |
|
|
| $ | 625,060 |
| $ | 291,435 |
|
CURRENT LIABILITIES |
|
|
|
|
|
|
| ||
Trade and other payables |
| 21 |
| 62,811 |
| 38,770 |
| ||
Accrued expenses |
| 21 |
| 77,716 |
| 13,072 |
| ||
Derivative financial instruments |
| 13 |
| 335 |
| — |
| ||
TOTAL CURRENT LIABILITIES |
|
|
| 140,862 |
| 51,842 |
| ||
NON-CURRENT LIABILITIES |
|
|
|
|
|
|
| ||
Derivative financial instruments |
| 13 |
| 31 |
| — |
| ||
Credit facilities, net of deferred financing fees |
| 22 |
| 29,141 |
| 29,570 |
| ||
Restoration provision |
| 23 |
| 5,074 |
| 1,228 |
| ||
Deferred tax liabilities |
| 24 |
| 102,711 |
| 56,979 |
| ||
TOTAL NON-CURRENT LIABILITIES |
|
|
| 136,957 |
| 87,777 |
| ||
TOTAL LIABILITIES |
|
|
| $ | 277,819 |
| $ | 139,619 |
|
NET ASSETS |
|
|
| $ | 347,241 |
| $ | 151,816 |
|
EQUITY |
|
|
|
|
|
|
| ||
Issued capital |
| 25 |
| $ | 237,008 |
| $ | 58,694 |
|
Share option reserve |
| 26 |
| 5,635 |
| 4,045 |
| ||
Foreign currency translation |
| 26 |
| (1,516 | ) | (1,095 | ) | ||
Retained earnings |
|
|
| 106,114 |
| 90,172 |
| ||
TOTAL EQUITY |
|
|
| $ | 347,241 |
| $ | 151,816 |
|
The accompanying notes are an integral part of these consolidated financial statements
SUNDANCE ENERGY AUSTRALIA LIMITED
CONSOLIDATED STATEMENT OF CHANGES IN EQUITY
FOR THE YEAR ENDED 31 DECEMBER 2013
|
| Issued |
| Share |
| Foreign |
| Retained |
| Total |
| |||||
Balance at 30 June 2012 |
| $ | 57,978 |
| $ | 3,205 |
| $ | (941 | ) | $ | 13,962 |
| $ | 74,204 |
|
Profit attributable to owners of the Company |
| — |
| — |
| — |
| 76,210 |
| 76,210 |
| |||||
Other comprehensive loss for the period |
| — |
| — |
| (154 | ) | — |
| (154 | ) | |||||
Total comprehensive income |
| — |
| — |
| (154 | ) | 76,210 |
| 76,056 |
| |||||
Shares issued during the period |
| 716 |
| — |
| — |
| — |
| 716 |
| |||||
Share based payments |
| — |
| 840 |
| — |
| — |
| 840 |
| |||||
Balance at 31 December 2012 |
| 58,694 |
| 4,045 |
| (1,095 | ) | 90,172 |
| 151,816 |
| |||||
Profit attributable to owners of the Company |
| — |
| — |
| — |
| 15,942 |
| 15,942 |
| |||||
Other comprehensive loss for the year |
| — |
| — |
| (421 | ) | — |
| (421 | ) | |||||
Total comprehensive income |
| — |
| — |
| (421 | ) | 15,942 |
| 15,521 |
| |||||
Shares issued in connection with: |
|
|
|
|
|
|
|
|
|
|
| |||||
a) Merger with Texon |
| 132,092 |
| — |
| — |
| — |
| 132,092 |
| |||||
b) Private placement |
| 47,398 |
| — |
| — |
| — |
| 47,398 |
| |||||
c) Exercise of stock options |
| 813 |
| — |
| — |
| — |
| 813 |
| |||||
Cost of capital raising, net of tax |
| (1,989 | ) |
|
|
|
|
|
| (1,989 | ) | |||||
Share based payments |
| — |
| 1,590 |
| — |
| — |
| 1,590 |
| |||||
Balance at 31 December 2013 |
| $ | 237,008 |
| $ | 5,635 |
| $ | (1,516 | ) | $ | 106,114 |
| $ | 347,241 |
|
The accompanying notes are an integral part of these consolidated financial statements
SUNDANCE ENERGY AUSTRALIA LIMITED
CONSOLIDATED STATEMENT OF CASH FLOWS
FOR THE PERIOD ENDED 31 DECEMBER 2013
|
| Note |
| Year ended |
| Six months ended |
| ||
CASH FLOWS FROM OPERATING ACTIVITIES |
|
|
|
|
|
|
| ||
Receipts from sales |
|
|
| $ | 84,703 |
| $ | 11,648 |
|
Payments to suppliers and employees |
|
|
| (21,765 | ) | (2,886 | ) | ||
Interest received |
|
|
| 126 |
| 16 |
| ||
Derivative proceeds, net |
|
|
| 253 |
| 608 |
| ||
Income taxes paid |
|
|
| (671 | ) | — |
| ||
NET CASH PROVIDED BY OPERATING ACTIVITIES |
| 30 |
| 62,646 |
| 9,386 |
| ||
CASH FLOWS FROM INVESTING ACTIVITIES |
|
|
|
|
|
|
| ||
Payments for development expenditure |
|
|
| (154,700 | ) | (32,551 | ) | ||
Payments for exploration expenditure |
|
|
| (20,006 | ) | (8,031 | ) | ||
Payments for acquisition of oil and gas properties |
|
|
| (141,963 | ) | (11,470 | ) | ||
Sale of non-current assets |
|
|
| 37,848 |
| 173,822 |
| ||
Transaction costs related to sale of non-current assets |
|
|
| (161 | ) | (862 | ) | ||
Payments to establish escrow related to acquisition |
|
|
| — |
| (6,230 | ) | ||
Cash acquired from merger |
|
|
| 114,690 |
| — |
| ||
Cash received from escrow account |
|
|
| 837 |
| — |
| ||
Payments for plant and equipment |
|
|
| (900 | ) | (107 | ) | ||
NET CASH (USED IN) PROVIDED BY INVESTING ACTIVITIES |
|
|
| (164,355 | ) | 114,571 |
| ||
CASH FLOWS FROM FINANCING ACTIVITIES |
|
|
|
|
|
|
| ||
Proceeds from the issuance of shares |
|
|
| 48,211 |
| 716 |
| ||
Payments for costs of capital raisings |
|
|
| (2,654 | ) | — |
| ||
Payments for acquisition related costs |
|
|
| (533 | ) | (192 | ) | ||
Borrowing costs paid |
|
|
| (569 | ) | (678 | ) | ||
Proceeds from borrowings |
|
|
| 15,000 |
| 45,000 |
| ||
Repayments from borrowings |
|
|
| (15,000 | ) | (30,000 | ) | ||
NET CASH PROVIDED BY FINANCING ACTIVITIES |
|
|
| 44,455 |
| 14,846 |
| ||
Net (decrease)/increase in cash held |
|
|
| (57,254 | ) | 138,803 |
| ||
Cash at beginning of period |
|
|
| 154,110 |
| 15,328 |
| ||
Effect of exchange rates on cash |
|
|
| 15 |
| (21 | ) | ||
CASH AT END OF PERIOD |
| 11 |
| $ | 96,871 |
| $ | 154,110 |
|
The accompanying notes are an integral part of these consolidated financial statements
SUNDANCE ENERGY AUSTRALIA LIMITED
NOTES TO THE CONSOLIDATED FINANCIAL STATEMENTS
FOR THE YEAR ENDED 31 DECEMBER 2013
NOTE 1—STATEMENT OF SIGNIFICANT ACCOUNTING POLICIES
The consolidated financial report of Sundance Energy Australia Limited (“SEAL”) and its wholly owned subsidiaries, (collectively, the “Company”, “Consolidated Group” or “Group”), for the year ended 31 December 2013 was authorised for issuance in accordance with a resolution of the Board of Directors on 28 March 2014.
The nature of the operations and principal activities of the Group are described in the Directors’ Report.
Change in reporting period
Effective 1 July 2012, the Company changed its financial reporting year end from 30 June to 31 December in order to be more comparable to the Company’s peer group in the US market. This change resulted in the comparative reporting period being a six month period. The six month period ended 31 December 2012, which is the previous reporting period shown in these financial statements, is a shorter reporting period than that of the year ended 31 December 2013, therefore, the amounts presented in the financial statements are not entirely comparable.
Basis of Preparation
The consolidated financial report is a general purpose financial report that has been prepared in accordance with Australian Accounting Standards, Australian Accounting Interpretations, other authoritative pronouncements of the Australian Accounting Standards Board (“AASB”) and the Corporations Act 2001.
These consolidated financial statements comply with International Financial Reporting Standards (“IFRS”) as issued by the International Accounting Standards Board (“IASB”). Material accounting policies adopted in the preparation of this financial report are presented below. They have been consistently applied unless otherwise stated.
The consolidated financial statements have been prepared on a historical basis, except for derivative financial instruments that have been measured at fair value. The consolidated financial statements are presented in US dollars and all values are rounded to the nearest thousand (US$’000), except where stated otherwise.
Principles of Consolidation
A controlled entity is any entity over which SEAL is exposed, or has rights to variable returns from its involvement with the entity and has the ability to affect those returns through its power over the entity. The consolidated financial statements incorporate the assets and liabilities of all entities controlled by SEAL as at 31 December 2013 and the results of all controlled entities for the year then ended.
All inter-group balances and transactions between entities in the Group, including any recognised profits or losses, are eliminated on consolidation.
a) Income Tax
The income tax expense for the period comprises current income tax expense/(income) and deferred tax expense/(income).
Current income tax expense charged to the statement of profit or loss is the tax payable on taxable income calculated using applicable income tax rates enacted, or substantially enacted, as at the reporting date. Current tax liabilities/(assets) are therefore measured at the amounts expected to be paid to/(recovered from) the relevant taxation authority.
Deferred income tax expense reflects movements in deferred tax asset and deferred tax liability balances during the period as well as unused tax losses. Current and deferred income tax expense/(income) is charged or credited directly to equity instead of the statement of profit or loss when the tax relates to items that are credited or charged directly to equity.
Deferred tax assets and liabilities are ascertained based on temporary differences arising between the tax bases of assets and liabilities and their carrying amounts in the financial statements. Deferred tax assets also result where amounts have been fully expensed but future tax deductions are available. No deferred income tax will be recognised from the initial recognition of an asset or liability, excluding a business combination, where there is no effect on accounting or taxable profit or loss.
Deferred tax assets and liabilities are calculated at the tax rates that are expected to apply to the period when the asset recognised or the liability is settled, based on tax rates enacted or substantively enacted at the reporting date. Their measurement also reflects the manner in which management expects to recover or settle the carrying amount of the related asset or liability.
Deferred tax assets relating to temporary differences and unused tax losses are recognised only to the extent that it is probable that future taxable profit will be available against which the benefits of the deferred tax asset can be utilised.
Where temporary differences exist in relation to investments in subsidiaries, branches, associates, and joint ventures, deferred tax assets and liabilities are not recognised where the timing of the reversal of the temporary difference can be controlled and it is not probable that the reversal will occur in the foreseeable future.
Current tax assets and liabilities are offset where a legally enforceable right of set-off exists and it is intended that net settlement or simultaneous realisation and settlement of the respective asset and liability will occur. Deferred tax assets and liabilities are offset where a legally enforceable right of set-off exists, the deferred tax assets and liabilities relate to income taxes levied by the same taxation authority on either the same taxable entity or different taxable entities where it is intended that net settlement or simultaneous realisation and settlement of the respective asset and liability will occur in future periods in which significant amounts of deferred tax assets or liabilities are expected to be recovered or settled.
b) Exploration and Evaluation Expenditure
Exploration and evaluation expenditure incurred is accumulated in respect of each identifiable area of interest. These costs are capitalised to the extent that they are expected to be recouped through the successful development of the area or where activities in the area have not yet reached a stage that permits reasonable assessment of the existence of economically recoverable reserves. The costs of assets constructed within the Group includes the leasehold cost, geological and geophysical costs and an appropriate proportion of fixed and variable overheads directly attributable to the exploration and acquisition of undeveloped oil and gas properties.
Accumulated costs in relation to an abandoned area are written off in full against profit in the year in which the decision to abandon the area is made.
When production commences, the accumulated costs for the relevant area of interest are transferred to production assets and amortised over the life of the area according to the rate of depletion of the economically recoverable reserves.
A regular review is undertaken of each area of interest to determine the appropriateness of continuing to carry forward costs in relation to that area of interest.
c) Development and Production Assets and Property and Equipment
Development assets, property and equipment are carried at cost less, where applicable, any accumulated depreciation, amortisation and impairment losses. The costs of assets constructed within the Group includes the cost of materials, direct labor, borrowing costs and an appropriate proportion of fixed and variable overheads directly attributable to the acquisition or development of oil and gas properties and facilities necessary for the extraction of resources.
The carrying amount of development and production assets and property and equipment are reviewed semi-annually to ensure that they are not in excess of the recoverable amount from these assets. The recoverable amount is assessed on the basis of the expected net cash flows that will be received from the assets employment and subsequent disposal. The expected net cash flows have been discounted to their present values in determining recoverable amounts.
Subsequent costs are included in the asset’s carrying amount or recognised as a separate asset, as appropriate, only when it is probable that future economic benefits associated with the item will flow to the group and the cost of the item can be measured reliably. All other repairs and maintenance are charged to the statement of profit or loss during the financial period in which are they are incurred.
Depreciation / Amortisation
Property and equipment are depreciated on a straight-line basis over their useful lives from the time the asset is held and ready for use. Leasehold improvements are depreciated over the shorter of either the unexpired period of the lease or the estimated useful life of the improvement.
The depreciation rates used for each class of depreciable assets are:
Class of Non-Current |
| Asset Depreciation |
| Rate Basis of Depreciation |
|
Plant and Equipment |
| 10 - 33 | % | Straight Line |
|
The Group uses the units-of-production method to amortise costs carried forward in relation to its development assets. For this approach, the calculation is based upon economically recoverable reserves, being proved developed reserves and probable developed reserves, over the life of an asset or group of assets.
The assets’ residual values and useful lives are reviewed, and adjusted if appropriate, at the end of each reporting period. An asset’s carrying amount is written down immediately to its recoverable amount if the asset’s carrying amount is greater than its estimated recoverable amount.
Gains and losses on disposals are determined by comparing proceeds with the carrying amount. These gains and losses are included in the statement of profit or loss.
d) Leases
The determination of whether an arrangement is, or contains, a lease is based on the substance of the arrangement at date of inception. The arrangement is assessed to determine whether its fulfillment is dependent on the use of a specific asset or assets and whether the arrangement conveys a right to use the asset, even if that right is not explicitly specified in an arrangement.
Leases are classified as finance leases when the terms of the lease transfer substantially all the risks and benefits incidental to the ownership of the asset, but not the legal ownership to the entities in the Group. All other leases are classified as operating leases.
Finance leases are capitalised by recording an asset and a liability at the lower of the amounts equal to the fair value of the leased property or the present value of the minimum lease payments, including any guaranteed residual values. Lease payments are allocated between the reduction of the lease liability and the lease interest expense for the period.
Assets under financing leases are depreciated on a straight-line basis over the shorter of their estimated useful lives or the lease term. Lease payments for operating leases, where substantially all the risks and benefits remain with the lessor, are charged as expenses in the periods in which they are incurred.
Lease incentives under operating leases are recognised as a liability and amortised on a straight-line basis over the life of the lease term.
e) Financial Instruments
Recognition and Initial Measurement
Financial instruments, incorporating financial assets and financial liabilities, are recognised when the entity becomes a party to the contractual provisions of the instrument. Trade date accounting is adopted for financial assets that are delivered within timeframes established by marketplace convention.
Financial instruments are initially measured at fair value plus transactions costs where the instrument is not classified at fair value through profit or loss. Transaction costs related to instruments classified at fair value through profit or loss are expensed to profit or loss immediately. Financial instruments are classified and measured as set out below.
Derivative Financial Instruments
The Group uses derivative financial instruments to economically hedge its exposure to changes in commodity prices arising in the normal course of business. The principal derivatives that may be used are commodity crude oil price swap, option and costless collar contracts and interest rate swaps. Their use is subject to policies and procedures as approved by the Board of Directors. The Group does not trade in derivative financial instruments for speculative purposes.
Derivative financial instruments are initially recognised at cost, which approximates fair value. Subsequent to initial recognition, derivate financial instruments are recognised at fair value. The fair value of these derivative financial instruments is the estimated amount that the Group would receive or pay to terminate the contracts at the reporting date, taking into account current market prices and the current creditworthiness of the contract counterparties. The derivatives are valued on a mark to market valuation and the gain or loss on re-measurement to fair value is recognised through the statement of profit or loss and other comprehensive income.
Derecognition
Financial assets are derecognised when the contractual right to receipt of cash flows expires or the asset is transferred to another party whereby the entity no longer has any significant continuing involvement in the risks and benefits associated with the asset. Financial liabilities are derecognised when the related obligations are either discharged, cancelled or expire. The difference between the carrying value of the financial liability extinguished or transferred to another party and the fair value of consideration paid, including the transfer of non-cash assets or liabilities assumed, is recognised in profit or loss.
i) Financial assets at fair value through profit or loss
Financial assets are classified at fair value through profit or loss when they are held for trading for the purpose of short term profit taking, when they are derivatives not held for hedging purposes, or designated as such to avoid an accounting mismatch or to enable performance evaluation where a group of financial assets is managed by key management personnel on a fair value basis in accordance with a documented risk management or investment strategy. Realised and unrealised gains and losses arising from changes in fair value are included in profit or loss in the period in which they arise.
ii) Loans and receivables
Loans and receivables are non-derivative financial assets with fixed or determinable payments that are not quoted in an active market and are subsequently measured at amortised cost using the effective interest rate method.
iii) Held-to-maturity investments
Held-to-maturity investments are non-derivative financial assets that have fixed maturities and fixed or determinable payments, and it is the Group’s intention to hold these investments to maturity. They are subsequently measured at amortised cost using the effective interest rate method.
iv) Available-for-sale financial assets
Available-for-sale financial assets are non-derivative financial assets that are either designated as such or that are not classified in any of the other categories. They comprise investments in the equity of other entities where there is neither a fixed maturity nor fixed determinable payments.
v) Financial liabilities
Non-derivative financial liabilities (excluding financial guarantees) are subsequently measured at amortised cost using the effective interest rate method.
f) Impairment of Non-Financial Assets
At each reporting date, the group reviews the carrying values of its tangible and intangible assets to determine whether there is any indication that those assets have been impaired. If such an indication exists, the recoverable amount of the asset, being the higher of the asset’s fair value less costs to sell and value in use, is compared to the asset’s carrying value. Any excess of the asset’s carrying value over its recoverable amount is expensed to the statement of comprehensive income.
Impairment testing is performed annually for intangible assets with indefinite lives.
Where it is not possible to estimate the recoverable amount of an individual asset, the Group estimates the recoverable amount of the cash-generating unit to which the asset belongs.
g) Foreign Currency Transactions and Balances
Functional and presentation currency
The functional currency of each of the Group’s entities is measured using the currency of the primary economic environment in which that entity operates. The consolidated financial statements are presented in US dollars.
Transactions and Balances
Foreign currency transactions are translated into functional currency using the exchange rates prevailing at the date of the transaction. Foreign currency monetary items are translated at the year-end exchange rate. Non-monetary items measured at historical cost continue to be carried at the exchange rate at the date of the transaction. Non-monetary items measured at fair value are reported at the exchange rate at the date when fair values were determined.
Exchange differences arising on the translation of non-monetary items are recognised directly in equity to the extent that the gain or loss is directly recognised in equity, otherwise the exchange difference is recognised in the consolidated statement of profit or loss and other comprehensive income.
Group Companies
The financial results and position of foreign operations whose functional currency is different from the Group’s presentation currency are translated as follows:
· assets and liabilities are translated at year-end exchange rates prevailing at that reporting date;
· income and expenses are translated at average exchange rates for the period; and
· retained profits are translated at the exchange rates prevailing at the date of the transaction.
Exchange differences arising on translation of foreign operations are transferred directly to the Group’s foreign currency translation reserve. These differences are recognised in the statement of profit or loss and comprehensive income upon disposal of the foreign operation.
h) Employee Benefits
A provision is made for the Group’s liability for employee benefits arising from services rendered by employees to balance date. Employee benefits that are expected to be settled within one year have been measured at the amounts expected to be paid when the liability is settled, plus related on-costs. Employee benefits payable later than one year have been measured at the present value of the estimated future cash outflows to be made for these benefits. Those cash flows are discounted using market yields on national government bonds with terms to maturity that match the expected timing of cash flows.
Equity—Settled Compensation
The Group has an incentive compensation plan where employees may be issued shares and/or options. The fair value of the equity to which employees become entitled is measured at grant date and recognized as an expense over the vesting period with a corresponding increase in equity. The fair value of shares issued is determined with reference to the latest ASX share price. Options are valued using an appropriate valuation technique which takes into account the vesting conditions.
Restricted Share Unit Plan
The group has a restricted share unit (“RSU”) plan to motivate management and employees to make decisions benefiting long-term value creation, retain management and employees and reward the achievement of the Group’s long-term goals. The target RSUs are based on goals established and approved by the Board. The actual RSUs, awarded annually, are modified according to actual results and vest in four equal tranches beginning on the grant date and each of the first three subsequent anniversaries.
i) Provisions
Provisions are recognised when the group has a legal or constructive obligation, as a result of past events, for which it is probable that an outflow of economic benefits will result and that outflow can be reliably measured.
j) Cash and Cash Equivalents
Cash and cash equivalents include cash on hand, deposits held at call with banks, other short-term highly liquid investments with original maturities of three months or less, unrestricted escrow accounts that management expects to be used to settle current liabilities, capital or operating expenditures, or complete acquisitions and bank overdrafts.
k) Revenue
Revenue from the sale of goods is recognised upon the delivery of goods to the customer. Revenue from the rendering of a service is recognised upon the delivery of the service to the customers. All revenue is stated net of the amount of goods and services tax (“GST”).
l) Borrowing Costs
Borrowing costs, including interest, directly attributable to the acquisition, construction or production of assets that necessarily take a substantial period of time to prepare for their intended use or sale are added to the cost of those assets until such time as the assets are substantially ready for their intended use or sale. Borrowings are recognised initially at fair value, net of transaction costs incurred. Subsequent to initial recognition, borrowings are stated as amortised cost with any difference between cost and redemption being recognised in the consolidated statement of profit or loss and other comprehensive income over the period of the borrowings on an effective interest basis. The Company capitalised borrowing costs at 100 percent equal to $1.3 million and nil for the year and six month period ended 31 December 2013 and 2012, respectively.
All other borrowing costs are recognised in income in the period in which they are incurred.
m) Goods and Services Tax
Revenues, expenses and assets are recognised net of the amount of GST, except where the amount of GST incurred is not recoverable from the Australian Tax Office. In these circumstances the GST is recognised as part of the cost of acquisition of the asset or as part of an item of the expense. Receivables and payables in the statement of financial position are shown inclusive of GST.
Cash flows are presented in the consolidated statement of cash flows on a gross basis except for the GST component of investing and financing activities, which are disclosed as operating cash flows.
n) Business Combinations
A business combination is a transaction in which an acquirer obtains control of one or more businesses. The acquisition method of accounting is used to account for all business combinations regardless of whether equity instruments or
other assets are acquired. The acquisition method is only applied to a business combination when control over the business is obtained. Subsequent changes in interests in a business where control already exists are accounted for as transactions between owners. The cost of the business combination is measured at fair value of the assets given, shares issued and liabilities incurred or assumed at the date of acquisition. Costs directly attributable to the business combination are expensed as incurred, except those directly and incrementally attributable to equity issuance.
The excess of the consideration transferred, the amount of any non-controlling interest in the acquiree and the acquisition-date fair value of any previous equity interest in the acquire over the fair value of the Group’s share of the net identifiable asset acquired, if any, is recorded as goodwill. If those amounts are less than the fair value of the net identifiable assets of the subsidiary acquired and the measurement of all amounts has been reviewed, the difference is recognised directly in the income statement as a bargain purchase. Adjustments to the purchase price and excess on consideration transferred may be made up to one year from the acquisition date.
o) Assets Held for Sale
The Company classifies property as held for sale when management commits to a plan to sell the property, the plan has appropriate approvals, the sale of the property is probable within the next twelve months, and certain other criteria are met. At such time, the respective assets and liabilities are presented separately on the Company’s consolidated statement of financial position and amortisation is no longer recognized. Assets held for sale are reported at the lower of their carrying amount or their estimated fair value, less the costs to sell the assets. The Company recognizes an impairment loss if the current net book value of the property exceeds its fair value, less selling costs. As at 31 December 2013 and 2012, all of the Company’s Williston properties and nil properties were classified as held for sale, respectively.
p) Critical Accounting Estimates and Judgements
The Directors evaluate estimates and judgements incorporated into the financial report based on historical knowledge and best available current information. Estimates assume a reasonable expectation of future events and are based on current trends and economic data obtained both externally and within the Group. Revisions to accounting estimates are recognised in the period in which the estimate is revised if the revision affects only that period, or in the period of the of the revision and future periods if the revision affects both current and future periods.
Management has made the following judgements, which have the most significant effect on the amounts recognised in the consolidated financial statements.
Estimates of reserve quantities
The estimated quantities of hydrocarbon reserves reported by the Group are integral to the calculation of amortisation (depletion) and to assessments of possible impairment of assets. Estimated reserve quantities are based upon interpretations of geological and geophysical models and assessment of the technical feasibility and commercial viability of producing the reserves. Management prepares reserve estimates which conform to the definitions contained in Rule 4-10(a) of Regulation S-X. These assessments require assumptions to be made regarding future development and production costs, commodity prices, exchange rates and fiscal regimes. The estimates of reserves may change from period to period as the economic assumptions used to estimate the reserves can change from period to period, and as additional geological data is generated during the course of operations.
Impairment of Non-Financial Assets
The Group assesses impairment at each reporting date by evaluating conditions specific to the Group that may lead to impairment of assets. Where an indicator of impairment exists, the recoverable amount of the asset is determined. Value-in-use calculations performed in assessing recoverable amounts incorporate a number of key estimates including projections of cash flows, prices of products, production costs, reserve estimates and capitalised amounts.
Exploration and Evaluation
The Company’s policy for exploration and evaluation is discussed in Note 1 (b). The application of this policy requires the Company to make certain estimates and assumptions as to future events and circumstances. Any such estimates and assumptions may change as new information becomes available. If, after having capitalised exploration and evaluation expenditure, management concludes that the capitalised expenditure is unlikely to be recovered by future sale or exploitation,
then the relevant capitalised amount will be written off through the consolidated statement of profit or loss and other comprehensive income.
Restoration Provision
A provision for rehabilitation and restoration is provided by the Group to meet all future obligations for the restoration and rehabilitation of oil and gas producing areas when oil and gas reserves are exhausted and the oil and gas fields are abandoned. Restoration liabilities are discounted to present value and capitalised as a component part of capitalised development expenditure. The capitalised costs are amortised over the units of production and the provision is revised at each balance sheet date through the consolidated statement of profit or loss and other comprehensive income as the discounting of the liability unwinds.
In most instances, the removal of the assets associated with these oil and gas producing areas will occur many years in the future. The estimate of future removal costs therefore requires management to make significant judgements regarding removal date or well lives, the extent of restoration activities required, discount and inflation rates.
Units of Production Depreciation
Oil and gas properties are depreciated using the units of production method over economically recoverable reserves representing total proved developed and probable developed reserves. This results in a depreciation or amortisation charge proportional to the depletion of the anticipated remaining production from the area of interest.
The life of each item has regard to both its physical life limitations and present assessments of economically recoverable reserves of the field at which the asset is located. Economically recoverable reserves are defined as proved developed and probable developed reserves. These calculations require the use of estimates and assumptions, including the amount of recoverable reserves and estimates of future capital expenditure. The calculation of the units of production rate of depreciation or amortisation could be impacted to the extent that actual production in the future is different from current forecast production based on total economically recoverable reserves, or future capital expenditure estimates change. Changes to economically recoverable reserves could arise due to change in the factors or assumptions used in estimating reserves, including the effect on economically recoverable reserves of differences between actual commodity prices and commodity price assumptions and unforeseen operational issues. Changes in estimates are accounted for prospectively.
Stock Based Compensation
The Group’s policy for stock based compensation is discussed in Note 1 (h). The application of this policy requires management to make certain estimates and assumptions as to future events and circumstances. Stock based compensation related to stock options use estimates for expected volatility of the Company’s share price and expected term, including a forfeiture rate, if appropriate.
q) Change in Accounting Estimate
Effective 1 July 2013, the Company had a change in accounting estimate related to the economically recoverable reserves in its Eagle Ford formation used in the units-of-production depletion calculation. Subsequent to the change, the Company began to include management’s best estimate of economically recoverable reserves associated with developed properties, which include both proved developed and probable developed reserves. Prior to the change, the Company used economically recoverable reserves associated only with proved developed reserves as probable developed reserves were not significant. The amount of the effect of this change in accounting estimate in future periods is not practically estimable.
r) Reclassifications
Certain reclassifications have been made to the prior year consolidated financial statements and associated notes to the financial statements to conform to the current year presentation. Employee benefits expense has been reclassified to be presented with General and administrate expense and Interest received has been reclassified to be presented with Other (loss)/income on the consolidated statement of profit or loss and other comprehensive income. These reclassifications did not impact Profit attributable to owners of the Company.
s) Rounding of Amounts
The company is of a kind referred to in Class Order 98/100 issued by the Australian Securities and Investment Commission, relating to rounding of amounts in the financial statements. Amounts have been rounded to the nearest thousand.
t) Parent Entity Financial Information
The financial information for the parent entity, SEAL (“Parent Company”), also the ultimate parent, discussed in Note 34, has been prepared on the same basis, using the same accounting policies as the consolidated financial statements.
u) Earnings Per Share
The group presents basic and diluted earnings per share for its ordinary shares. Basic earnings per share is calculated by dividing the profit or loss attributable to ordinary shareholders of the Company by the weighted average number of ordinary shares outstanding during the year. Diluted earnings per share is determined by adjusting the profit or loss attributable to ordinary shareholders and the weighted average number of ordinary shares for the dilutive effect, if any, of outstanding share rights and share options which have been issued to employees.
v) Change in Accounting Policy
Effective 1 July 2013, the Group retrospectively changed its general and administrative overhead policy (“capitalised overhead policy”) from expensing overhead costs directly attributable to the exploration, acquisition and development of oil and gas properties such as salaries, wages, benefits and consultant fees, to capitalizing these costs using an appropriate allocation method in accordance with AASB 6—Exploration and Evaluation Assets and AASB 116—Property and Equipment. This new policy provides reliable and more relevant information as the Company has shifted its focus from non-operated properties to operated properties and this policy better aligns costs with revenues.
The Group adopted the capitalised overhead policy subsequent to the issuance of the Company’s report for the half year ended 30 June 2013 and retrospectively applied the policy for the year ended 31 December 2013. As a result, the half year ended 30 June 2013 is not entirely comparable to the Company’s year ended 31 December 2013. Included in the Company’s year ended 31 December 2013 capitalised overhead amounts are retrospectively applied for pre-effective 1 July 2012 capitalised overhead amounts, which would have increased the Company’s non-current assets and decreased general and administrative expense, of approximately $1.2 million as at 30 June 2013 and for the half year then ended. These overhead amounts capitalised to development and production assets would have been subject to the Company’s units-of-production depletion calculation, which would have been immaterial for the period. The related increase in the Company’s profit attributable to owners and retained earnings of the Company would have been approximately $0.7 million for the half year ended 30 June 2013. The Company determined the capitalized overhead amounts for periods ended on or before 31 December 2012 are immaterial.
w) Adoption of New and Revised Accounting Standards
During the current reporting period the Group adopted all of the new and revised Australian Accounting Standards and Interpretations applicable to its operations which became mandatory. The nature and effect of each new standard and amendment on the Group’s consolidated financial report are described below.
AASB 10—Consolidated Financial Statements/IFRS 10—Consolidated Financial Statements
The Group adopted AASB 10 Consolidated Financial Statements/IFRS 10 Consolidated Financial Statements, which replaces the guidance on control and consolidation in AASB 127—Consolidated and Separate Financial Statements/IAS 27 Consolidated and Separate Financial Statements and Interpretation 12—Consolidation—Special Purpose Entities. AASB 10/IFRS 10 includes a new definition of control that focuses on the need to have both power and rights or exposure to variable returns. As all of the Group’s subsidiaries are owned 100%, AASB 10/IFRS 10 did not have an impact on the Group’s consolidated financial statements.
AASB 11—Joint Arrangements/IFRS 11—Joint Arrangements
AASB 11/IFRS 11 replaces AASB 131 Interests in Joint Ventures and removes the option to account for jointly controlled entities using proportionate consolidation. Instead, jointly controlled entities that meet the definition of a joint venture under AASB 11/IFRS 11 must be accounted for using the equity method of accounting. The adoption of this standard did not have an impact on the Group’s consolidated financial statements.
AASB 13—Fair Value Measurement/IFRS 13—Fair Value Measurement and AASB 2011-8 Amendments to Australian Accounting Standards arising from AASB 13
AASB 13/IFRS 13 establishes a single source of guidance for fair value measurements and disclosures. The standard defines fair value, establishes a framework for measuring fair value, and requires more extensive disclosures than current standards. Additional disclosures, where required, are provided in the individual notes relating to the assets and liabilities whose fair values were determined.
Recently issued accounting standards to be applied in future reporting periods:
The following Standards and Interpretations are effective for annual periods beginning on or after 1 January 2014 and have not been applied in preparing these consolidated financial statements. The Group’s assessment of the impact of these new standards, amendments to standards, and interpretations is set out below.
AASB 9—Financial Instruments/IFRS 9—Financial Instruments and AASB 2010-7 Amendments to Australian Accounting Standards arriving from AASB 9
AASB 9/IFRS 9 introduces new requirements for the classification, measurement, and derecognition of financial assets and financial liabilities. In November 2013 the effective date was removed from AASB 9/IFRS 9. A new effective date will be provided when the entire standard is closer to completion. The Group will quantify the effect of the application of AASB 9/IFRS 9 when the final standard is issued, however, the impact from adopting this standard is not expected to have a material impact on the Group’s consolidated financial statements.
AASB 2011-4—Amendments to Australian Accounting Standards to Remove Individual Key Management Personnel Disclosure
This standard removes the requirements to include individual key management personnel disclosures in the notes to and forming part of the Financial Report. The Group will include detailed key management personnel disclosures in the Group’s Remuneration Report for the year beginning on 1 January 2014 incorporating changes from this standard.
IFRS 15—Revenue from Contracts with Customers
In May 2014, the IASB issued IFRS 15, which establishes a comprehensive new revenue recognition model designed to depict the transfer of goods or services to a customer in an amount that reflects the consideration the entity expects to receive in exchange for those goods or services. The Statement allows for the use of either the full or modified retrospective transition method, and the standard will be effective for us in the first quarter of our fiscal year 2017. We are currently evaluating the impact of this new standard on our consolidated financial statements, as well as which transition method we intend to use.
NOTE 2—BUSINESS COMBINATIONS
Texon Acquisition
On 8 March 2013, the Company acquired 100% of the outstanding shares of Texon Petroleum Ltd (“Texon”, whose name was changed to Armadillo Petroleum Ltd), an Australian corporation with oil and gas assets in the Eagle Ford formation in the United States. The Company acquired Texon to gain access to its existing production and drilling inventory in the Eagle Ford formation. As consideration for substantially all of the net assets of Texon, the Company issued 122.7 million ordinary shares (approximately 30.6% of the total outstanding shares immediately subsequent to the acquisition), which had a fair value of $132.1 million on the acquisition date and net cash consideration of $26.3 million for a total purchase price of $158.4 million. The net cash consideration includes a $141.0 million pre-merger purchase by the Company of certain Texon oil and gas properties, offset by $114.7 million of cash acquired at the time of the merger. The current income tax liability, included in accrued expenses, and deferred tax liability of $33.4 million and $16.9 million, respectively, are comprised of tax liabilities assumed as at the acquisition date and an increase in the tax liability related to the incremental acquisition date fair value of the acquired development and production and exploration and evaluation assets as compared to Texon’s historical basis.
The following table reflects the final adjusted assets acquired and the liabilities assumed at their fair value or otherwise where specified by AASB 3/IFRS 3—Business Combinations (in thousands):
Fair value of assets acquired: |
|
|
| |
Trade and other receivables |
| $ | 5,604 |
|
Other current assets |
| 456 |
| |
Development and production assets |
| 53,937 |
| |
Exploration and evaluation assets |
| 150,474 |
| |
Prepaid drilling and completion costs |
| 3,027 |
| |
Amount attributable to assets acquired |
| 213,498 |
| |
Fair value of liabilities assumed: |
|
|
| |
Trade and other payables |
| 119 |
| |
Accrued expenses |
| 37,816 |
| |
Restoration provision |
| 277 |
| |
Deferred tax liabilities |
| 16,884 |
| |
Amount attributable to liabilities assumed |
| 55,096 |
| |
Net assets acquired |
| $ | 158,402 |
|
Purchase price: |
|
|
| |
Cash and cash equivalents, net of cash acquired |
| $ | 26,310 |
|
Issued capital |
| 132,092 |
| |
Total consideration paid |
| $ | 158,402 |
|
Since the acquisition date of 8 March 2013 through 31 December 2013, the Company has earned revenue of $42.3 million and generated net income of $12.6 million. The following reflects the acquisition’s contribution to the Group as if the merger had occurred on 1 January 2013 instead of the closing date of 8 March 2013 (in thousands, except per share information):
|
| Year ended |
| |
Oil and natural gas revenue |
| $ | 5,163 |
|
Lease operating and production expenses |
| (1,150 | ) | |
Depreciation and amortization expense |
| (1,882 | ) | |
General and administrative expense |
| (667 | ) | |
Finance costs |
| (35 | ) | |
Profit before income tax |
| 1,429 |
| |
Income tax expense |
| (542 | ) | |
Proforma profit attributable to the period 1 January to 7 March 2013 |
| 887 |
| |
Profit attributable to owners of the Company for the year |
| 15,942 |
| |
Adjusted profit attributable to the owners of the Company for the year |
| $ | 16,829 |
|
Adjusted basic earnings per ordinary share |
| 4.1 | ¢ | |
Adjusted diluted earnings per ordinary share |
| 4.0 | ¢ | |
The Company incurred $0.5 million and $0.7 million for the year and six month period ended 31 December 2013 2012, respectively, in acquisition related costs primarily for professional fees and services. These amounts are included in general and administrative expense and financing activities in the consolidated statements of profit or loss and other comprehensive income and the consolidated statement of cash flows, respectively.
NOTE 3—REVENUE
|
| Year ended |
| Six months ended |
| ||
Oil revenue |
| $ | 79,365 |
| $ | 16,790 |
|
Natural gas revenue |
| 5,980 |
| 934 |
| ||
Total oil and natural gas revenue (net of transportation) |
| $ | 85,345 |
| $ | 17,724 |
|
NOTE 4—LEASE OPERATING AND PRODUCTION TAX EXPENSE
|
| Year ended |
| Six months ended |
| ||
Lease operating expense |
| $ | (11,378 | ) | $ | (1,908 | ) |
Workover expense |
| (743 | ) | (287 | ) | ||
Production tax expense |
| (6,262 | ) | (1,887 | ) | ||
Total lease operating and production tax expense |
| $ | (18,383 | ) | $ | (4,082 | ) |
NOTE 5—GENERAL AND ADMINISTRATIVE EXPENSES
|
| Year ended |
| Six months ended |
| ||
Employee benefits expense, including salaries and wages, net of capitalised overhead |
| $ | (6,143 | ) | $ | (2,801 | ) |
Professional fees |
| (2,892 | ) | (929 | ) | ||
Abandoned US IPO transaction costs(1) |
| (2,081 | ) | — |
| ||
Travel |
| (791 | ) | (280 | ) | ||
Director fees |
| (617 | ) | (132 | ) | ||
Acquisition and merger related fees |
| (533 | ) | (713 | ) | ||
Accounting and company secretarial |
| (415 | ) | (150 | ) | ||
Insurance |
| (264 | ) | (130 | ) | ||
Rent |
| (234 | ) | (181 | ) | ||
Share registry and listing fees |
| (232 | ) | (75 | ) | ||
Audit fees |
| (139 | ) | (145 | ) | ||
Other expenses |
| (956 | ) | (274 | ) | ||
Total general and administrative expenses |
| $ | (15,297 | ) | $ | (5,810 | ) |
(1) See Note 36—Events After the Balance Sheet Date for further discussion.
NOTE 6—GAIN ON SALE OF NON-CURRENT ASSETS
In the fourth quarter of 2013 and the third quarter of 2012, the Company sold all of its interests in the Phoenix prospect and South Antelope prospect, both located in the Williston Basin, for gross proceeds of $39.8 million and $172.4 million, respectively. Prior to the dispositions, the Phoenix and South Antelope development and production properties were part of the Williston Basin depletion base. To determine the carrying costs of the sold properties, the Company used the relative fair value of the prospect’s proved developed reserves as compared to the Company’s total proved developed reserves in the Williston Basin. As a result, it was determined that approximately $26.0 million and $49.4 million of the Company’s carrying costs related to its Phoenix and South Antelope development and production properties, respectively, at the time of the disposal. In addition to the South Antelope development and production properties, the Purchaser acquired approximately $3.9 million of assets and assumed approximately $3.8 million of liabilities, which were removed from the Company’s consolidated statement of financial position at the time of the sale. The Company incurred approximately $0.9 million and $0.9 million of legal and
other transaction related costs related to the Phoenix and South Antelope sale, respectively. The sales resulted in a pre-tax gain of $8.2 million and $122.5 million, respectively, which is included in the net gain (loss) on sale of non-current assets in the consolidated statement of profit or loss and other comprehensive income for the year and six month period ended 31 December 2013 and 2012, respectively. In early 2013, the Company finalised the adjustments to the purchase price for the South Antelope sale, resulting in a net reduction of $0.9 million, which is included in the net gain (loss) on sale of non-current assets in the consolidated statement of profit or loss and other comprehensive income for the year ended 31 December 2013. During the six months ended 31 December 2012, the Company also sold all of its properties in the Pawnee prospect for $0.9 million of proceeds, which resulted in a loss of $0.2 million.
For both the Phoenix and South Antelope prospect sales proceeds, the Company elected to apply Section 1031 “like-kind exchange” treatment under the US tax rules, which allow deferral of the gain if the proceeds are used to acquire “like-kind property” within six months of the closing date of the transaction. In addition, the US tax rules allow the deduction of all intangible drilling costs (“IDCs”) in the period incurred. As at 31 December 2013, the Company expects to defer the majority of the taxable gain on the sale of the Phoenix development by acquiring qualified replacement properties or utilizing IDCs from its development program. These proceeds are included in the Company’s cash balance. See Note 11—Cash and Cash Equivalents.
In January and February 2014, the Company entered into lease acquisition agreements to acquire oil and gas properties in the Mississippian/Woodford Basin and the Eagle Ford Basin—see Events After the Balance Sheet Date in Note 36 for further discussion. Management believes the properties that the Company plans to acquire will qualify as “like-kind property” under Section 1031.
In March 2013, the Company completed a transaction in which the majority of the funds remaining in its South Antelope Section 1031 escrow accounts were used to acquire oil and gas properties in connection with the Texon Scheme of Arrangement transaction—see Business Combinations in Note 2 for further discussion.
NOTE 7—INCOME TAX EXPENSE
|
|
|
| Year ended |
| Six months ended |
| ||
a) |
| The components of income tax expense comprise: |
|
|
|
|
| ||
|
| Current tax benefit/(expense) |
| $ | 21,398 |
| $ | (11 | ) |
|
| Deferred tax expense |
| (26,965 | ) | (46,605 | ) | ||
|
|
|
| $ | (5,567 | ) | $ | (46,616 | ) |
b) |
| The prima facie tax on income from ordinary activities before income tax is reconciled to the income tax as follows: |
|
|
|
|
| ||
|
| Profit before income tax |
| $ | 21,509 |
| $ | 122,826 |
|
|
| Prima facie tax expense at the Group’s statutory income tax rate of 30% (2012:30%) |
| $ | 6,453 |
| $ | 36,848 |
|
|
| Tax effect of amounts which are non-deductible/(non- taxable) in calculating taxable income: |
|
|
|
|
| ||
|
| – Difference of tax rate in US controlled entities |
| 1,607 |
| 9,417 |
| ||
|
| – Employee options |
| — |
| 44 |
| ||
|
| – Other allowable items |
| 144 |
| 93 |
| ||
|
| – Tax adjustments relating to prior years |
| (984 | ) | — |
| ||
|
| – Change in apportioned state tax rates in US controlled entities(1) |
| (1,448 | ) | — |
| ||
|
| – Acquisition related costs |
| — |
| 214 |
| ||
|
| – Recognition of previously unrecognized tax losses |
| (205 | ) | — |
| ||
|
| Income tax attributable to entity |
| $ | 5,567 |
| $ | 46,616 |
|
c) |
| Unused tax losses and temporary differences for which no deferred tax asset has been recognised at 30% |
| $ | 170 |
| $ | 375 |
|
d) |
| Deferred tax charged directly to equity: |
|
|
|
|
| ||
|
| – Equity raising costs |
| $ | 665 |
| $ | — |
|
(1) The change in apportioned state tax rates in US controlled entities is a result of the Company disposing of its property in North Dakota (income tax rate of 4.53%) through a tax deferred sale and reinvesting the property in Texas (margin tax rate of 1%). As the Texas margin tax computation is similar in nature to an income tax computation, it is treated as an income tax for financial reporting purposes.
NOTE 8—KEY MANAGEMENT PERSONNEL COMPENSATION
a) Names and positions held of Consolidated Group key management personnel in office at any time during the financial period are:
Mr M Hannell |
| Chairman Non-executive |
Mr E McCrady |
| Chief Executive Officer and Managing Director |
Mr D Hannes |
| Director—Non-executive |
Mr N Martin |
| Director—Non-executive |
Mr W Holcombe |
| Director—Non-executive |
Ms C Anderson |
| Chief Financial Officer |
Mr C Gooden |
| Company Secretary (resigned on 23 August 2013) |
Other than Directors and Officers of the Company listed above, there are no additional key management personnel.
b) Key Management Personnel Compensation
The total of remuneration paid to Key Management Personnel (“KMP”) of the Group during the year is as follows:
|
| Year ended |
| Six months ended |
| ||
Short term wages and benefits |
| $ | 1,923 |
| $ | 695 |
|
Equity settled-options based payments |
| 625 |
| 262 |
| ||
Post-employment benefit |
| 56 |
| 17 |
| ||
|
| $ | 2,604 |
| $ | 974 |
|
c) Options Granted as Compensation
Options granted as compensation were zero ($nil fair value) during each of the year and six month period ended 31 December 2013 and 2012 to KMP from the Sundance Energy Employee Stock Option Plan. Options generally vest in five equal tranches of 20% on the grant date and each of the four subsequent anniversaries of the grant date.
d) Restricted Share Units Granted as Compensation
RSUs awarded as compensation were 623,251 ($0.6 million fair value) and 669,642 ($0.5 million fair value) during the year and six month period ended 31 December 2013 and 2012, respectively, to KMP from the Sundance Energy Long Term Incentive Plan. RSUs generally vest in four equal tranches of 25% on the grant date and each of the three subsequent anniversaries of the grant date.
NOTE 9—AUDITORS’ REMUNERATION
|
| Year ended |
| Six months ended |
| ||
Remuneration of the auditor for: |
|
|
|
|
| ||
Auditing or review of the financial report |
| $ | 91 |
| $ | 131 |
|
Professional services related US IPO |
| 430 |
| — |
| ||
Non-audit services related to Texon acquisition |
| 77 |
| 148 |
| ||
Taxation services provided by the practice of auditor |
| 48 |
| 14 |
| ||
Total remuneration of the auditor |
| $ | 646 |
| $ | 293 |
|
NOTE 10—EARNINGS PER SHARE (EPS)
|
| Year ended |
| Six months ended |
| ||
Profit for periods used to calculate basic and diluted EPS |
| $ | 15,942 |
| $ | 76,210 |
|
|
| Number of |
| Number of |
|
—Weighted average number of ordinary shares outstanding during the period used in calculation of basic EPS |
| 413,872,184 |
| 277,244,883 |
|
—Incremental shares related to options and restricted share units |
| 2,685,150 |
| 2,896,496 |
|
—Weighted average number of ordinary shares outstanding during the period used in calculation of diluted EPS |
| 416,557,334 |
| 280,141,379 |
|
NOTE 11—CASH AND CASH EQUIVALENTS
|
| 31 December 2013 |
| 31 December 2012 |
| ||
Cash at bank and on hand |
| $ | 59,918 |
| $ | 12,747 |
|
Cash equivalents in escrow accounts |
| 36,953 |
| 141,363 |
| ||
Total cash and cash equivalents |
| $ | 96,871 |
| $ | 154,110 |
|
As at 31 December 2013 and 2012, the Company had approximately $37.0 million and $141.4 million, respectively, in Section 1031 escrow accounts which are not limited in use, except that the timing of tax payments will be accelerated if not used on qualified “like-kind property.” As such, the balances have been included in the Company’s cash and cash equivalents in the consolidated statement of financial position and consolidated statement of cash flows as at 31 December 2013 and 2012 and for the year and six month period then ended, respectively.
NOTE 12—TRADE AND OTHER RECEIVABLES
|
| 31 December 2013 |
| 31 December 2012 |
| ||
Oil and natural gas sales |
| $ | 23,364 |
| $ | 11,376 |
|
Trade receivables |
| 5,353 |
| 4,185 |
| ||
Other |
| 31 |
| 111 |
| ||
Total trade and other receivables |
| $ | 28,748 |
| $ | 15,672 |
|
As at 31 December 2013 and 2012, the Group had receivable balances of $11.7 million and $8.6 million, respectively, which were outside normal trading terms (the receivable was past due but not impaired). The receivable balance is more than fully offset by the amount due to the same operator, which is also outside normal payment terms. See Note 21 for payable balance information.
Due to the short-term nature of trade and other receivables, their carrying amounts are assumed to approximate fair value.
NOTE 13—DERIVATIVE FINANCIAL INSTRUMENTS
|
| 31 December 2013 |
| 31 December 2012 |
| ||
FINANCIAL ASSETS: |
|
|
|
|
| ||
Current |
|
|
|
|
| ||
Derivative financial instruments—commodity contracts |
| $ | — |
| $ | 617 |
|
Non-current |
|
|
|
|
| ||
Derivative financial instruments—interest rate swaps |
| 176 |
| — |
| ||
Total financial assets |
| $ | 176 |
| $ | 617 |
|
|
| 31 December 2013 |
| 31 December 2012 |
| ||
FINANCIAL LIABILITIES: |
|
|
|
|
| ||
Current |
|
|
|
|
| ||
Derivative financial instruments—commodity contracts |
| $ | (188 | ) | $ | — |
|
Derivative financial instruments—interest rate swaps |
| (147 | ) | — |
| ||
Non-current |
|
|
|
|
| ||
Derivative financial instruments—commodity contracts |
| (31 | ) | — |
| ||
Total financial liabilities |
| $ | (366 | ) | $ | — |
|
NOTE 14—FAIR VALUE MEASUREMENT
The following table presents financial assets and liabilities measured at fair value in the statement of financial position in accordance with the fair value hierarchy. This hierarchy groups financial assets and liabilities into three levels based on the significance of inputs used in measuring the fair value of the financial assets and liabilities. The fair value hierarchy has the following levels:
Level 1: |
| quoted prices (unadjusted) in active markets for identical assets or liabilities; |
Level 2: |
| inputs other than quoted prices included within Level 1 that are observable for the asset or liability, either directly (i.e. as prices) or indirectly (i.e. derived from prices); and |
Level 3: |
| inputs for the asset or liability that are not based on observable market data (unobservable inputs). |
The Level within which the financial asset or liability is classified is determined based on the lowest level of significant input to the fair value measurement. The financial assets and liabilities measured at fair value in the statement of financial position are grouped into the fair value hierarchy as follows:
Consolidated 31 December 2013 |
| Level 1 |
| Level 2 |
| Level 3 |
| Total |
| ||||
Assets measured at fair value |
|
|
|
|
|
|
|
|
| ||||
Interest rate swap contracts |
| $ | — |
| $ | 176 |
| $ | — |
| $ | 176 |
|
Liabilities measured at fair value |
|
|
|
|
|
|
|
|
| ||||
Derivative commodity contracts |
| — |
| (219 | ) | — |
| (219 | ) | ||||
Interest rate swap contracts |
| — |
| (147 | ) | — |
| (147 | ) | ||||
Net fair value |
| $ | — |
| $ | (190 | ) | $ | — |
| $ | (190 | ) |
Consolidated 31 December 2012 |
| Level 1 |
| Level 2 |
| Level 3 |
| Total |
| ||||
Assets |
|
|
|
|
|
|
|
|
| ||||
Derivative financial instruments |
| $ | — |
| $ | 617 |
| $ | — |
| $ | 617 |
|
Liabilities |
|
|
|
|
|
|
|
|
| ||||
Derivative financial instruments |
| — |
| — |
| — |
| — |
| ||||
Net fair value |
| $ | — |
| $ | 617 |
| $ | — |
| $ | 617 |
|
During the year and six month period ended 31 December 2013 and 2012, respectively, there were no transfers between level 1 and level 2 fair value measurements, and no transfer into or out of level 3 fair value measurements.
Measurement of Fair Value
a) Derivatives
Derivatives entered into by the Company consist of commodity contracts and interest rate swaps. The Company utilises present value techniques and option- pricing models for valuing its derivatives. Inputs to these valuation techniques include published forward prices, volatilities, and credit risk considerations, including the incorporation of published interest rates and credit spreads. All of the significant inputs are observable, either directly or indirectly; therefore, the Company’s derivative instruments are included within the level 2 fair value hierarchy.
NOTE 15—OTHER CURRENT ASSETS
|
| 31 December 2013 |
| 31 December 2012 |
| ||
Cash advances to other operators |
| $ | 685 |
| $ | 625 |
|
Escrow accounts |
| 1,498 |
| 3,830 |
| ||
Oil inventory on hand, at cost |
| 1,088 |
| 69 |
| ||
Prepayments |
| 753 |
| 501 |
| ||
Other |
| 14 |
| — |
| ||
Total other current assets |
| $ | 4,038 |
| $ | 5,025 |
|
On 31 December 2012, the Company completed a transaction to acquire certain oil and natural gas properties in the Wattenberg field of the Denver- Julesburg (“DJ”) Basin (the “Wattenberg Acquisition”). In connection with the transaction, the Company transferred $3.0 million, $2.7 million and $0.5 million to escrow accounts related to a drilling commitment, title defect and environmental remediation, respectively ($6.2 million collectively). The use of the Wattenberg Acquisition related escrow accounts are restricted or generally will not be used to settle short-term Company operating costs, as such they have been excluded from the Company’s cash and cash equivalents balance in the consolidated statement of financial position and the consolidated statement of cash flows as at 31 December 2013 and 2012 and for the year and six month period then ended, respectively. Of this $6.2 million escrow account balance, $1.5 million and $3.8 million are classified as other current asset in the consolidated statement of financial position as at 31 December 2013 and 2012, respectively, with $2.7 million being settled during the year ended 31 December 2013.
NOTE 16—ASSETS HELD FOR SALE
As at 31 December 2013, all of the Company’s Williston properties were held for sale. The expected proceeds, net of selling costs, exceed the carrying amount. The following Williston assets and liabilities were included in assets held for sale in the consolidated statement of financial position as at 31 December 2013 (in thousands):
Development and production assets |
| $ | 10,489 |
|
Exploration and evaluation expenditure |
| 1,104 |
| |
Restoration provision liability |
| (109 | ) | |
Total assets held for sale, net of restoration provision liability |
| $ | 11,484 |
|
NOTE 17—DEVELOPMENT AND PRODUCTION ASSETS
|
| Year ended |
| Six months ended |
| ||
Costs carried forward in respect of areas of interest in: |
|
|
|
|
| ||
Development and production assets, at cost: |
|
|
|
|
| ||
Producing assets |
| $ | 297,469 |
| $ | 70,470 |
|
Wells-in-progress |
| 55,636 |
| 26,193 |
| ||
Development and production assets, at cost: |
| 353,105 |
| 96,663 |
| ||
Accumulated amortisation |
| (40,635 | ) | (14,619 | ) | ||
Provision for impairment(1) |
| (240 | ) | (2,315 | ) | ||
Total Development and Production Expenditure |
| $ | 312,230 |
| $ | 79,729 |
|
a) Movements in carrying amounts: |
|
|
|
|
| ||
Development expenditure |
|
|
|
|
| ||
Balance at the beginning of the period |
| $ | 79,729 |
| $ | 87,274 |
|
Amounts capitalised during the period |
| 219,121 |
| 46,963 |
| ||
Amounts transferred from exploration phase |
| 31,999 |
| 527 |
| ||
Fair value of assets acquired |
| 54,258 |
| 986 |
| ||
Reclassifications to assets held for sale |
| (10,489 | ) | — |
| ||
Amortisation expense |
| (36,294 | ) | (6,013 | ) | ||
Development and production assets, net of accumulated amortization, sold during the period |
| (26,094 | ) | (50,008 | ) | ||
Balance at end of period |
| $ | 312,230 |
| $ | 79,729 |
|
(1) There was an impairment provision of $1.9 million associated with the Phoenix development and production properties that were sold in 2013. See Note 6—Gain on sale of non-current assets for further discussion.
NOTE 18—EXPLORATION AND EVALUATION EXPENDITURE
|
| Year ended |
| Six months ended |
| ||
Costs carried forward in respect of areas of interest in: |
|
|
|
|
| ||
Exploration and evaluation phase, at cost |
| $ | 167,694 |
| $ | 35,053 |
|
Provision for impairment |
| (1,550 | ) | (1,614 | ) | ||
Total Exploration and Evaluation Expenditure |
| $ | 166,144 |
| $ | 33,439 |
|
a) Movements in carrying amounts: |
|
|
|
|
| ||
Exploration and evaluation |
|
|
|
|
| ||
Balance at the beginning of the period |
| $ | 33,439 |
| $ | 11,436 |
|
Amounts capitalised during the period |
| 14,770 |
| 10,704 |
| ||
Fair value of assets acquired |
| 151,115 |
| 12,644 |
| ||
Reclassifications to assets held for sale |
| (1,104 | ) | — |
| ||
Amounts transferred to development phase |
| (31,999 | ) | (527 | ) | ||
Exploration tenements sold during the period |
| (77 | ) | (818 | ) | ||
Balance at end of period |
| $ | 166,144 |
| $ | 33,439 |
|
The ultimate recoupment of costs carried forward for exploration phase is dependent on the successful development and commercial exploitation or sale of respective areas.
NOTE 19—PROPERTY AND EQUIPMENT
|
| 31 December 2013 |
| 31 December 2012 |
| ||
Property and equipment, at cost |
| $ | 1,603 |
| $ | 737 |
|
Accumulated depreciation |
| (556 | ) | (314 | ) | ||
Total Property and Equipment |
| $ | 1,047 |
| $ | 423 |
|
a) Movements in carrying amounts: |
|
|
|
|
| ||
Balance at the beginning of the period |
| $ | 423 |
| $ | 418 |
|
Amounts capitalised during the period |
| 886 |
| 107 |
| ||
Depreciation expense |
| (262 | ) | (102 | ) | ||
Balance at end of period |
| $ | 1,047 |
| $ | 423 |
|
NOTE 20—OTHER NON-CURRENT ASSETS
|
| 31 December 2013 |
| 31 December 2012 |
| ||
Escrow accounts |
| $ | 2,000 |
| $ | 2,400 |
|
Casing and tubulars at net realisable value |
| 19 |
| 20 |
| ||
Total other non-current assets |
| $ | 2,019 |
| $ | 2,420 |
|
The $2.0 million and $2.4 million of escrow accounts as of 31 December 2013 and 2012, respectively, are the long-term portions related to the escrow accounts discussed in Note 15—Other Current Assets.
NOTE 21—TRADE AND OTHER PAYABLES AND ACCRUED EXPENSES
|
| 31 December 2013 |
| 31 December 2012 |
| ||
Oil and natural gas related |
| $ | 135,381 |
| $ | 49,407 |
|
Administrative expenses, including salaries and wages |
| 5,146 |
| 2,435 |
| ||
Total trade, other payables and accrued expenses |
| $ | 140,527 |
| $ | 51,842 |
|
At 31 December 2013 and 2012, the Group had payable balances of $16.7 million and $15.7 million, respectively, which were outside normal payment terms. These payable balances are partially offset by receivable balances due from the same operator and which are also outside normal paying terms. See Note 12—Trade and Other Receivables for receivable balance information.
NOTE 22—CREDIT FACILITIES
|
| 31 December 2013 |
| 31 December 2012 |
| ||
Senior Credit Facility |
| $ | 15,000 |
| $ | 30,000 |
|
Junior Credit Facility |
| 15,000 |
| — |
| ||
Total credit facilities |
| 30,000 |
| 30,000 |
| ||
Deferred financing fees |
| (859 | ) | (430 | ) | ||
Total credit facilities, net of deferred financing fees |
| $ | 29,141 |
| $ | 29,570 |
|
Junior Credit Facility
In August 2013, Sundance Energy, Inc. (“Sundance Energy”), a wholly owned subsidiary of the Company, entered into a second lien credit agreement with Wells Fargo Energy Capital, Inc., as the administrative agent (the “Junior Credit Facility”), which provides for term loans to be made in a series of draws up to $100 million. The Junior Credit Facility matures in June 2018 and is secured by a second priority lien on substantially all of the Company’s assets. Upon entering into the Junior Credit Facility, the Company immediately borrowed $15 million pursuant to the terms of the Junior Credit Facility and paid down the outstanding principal of the Senior Credit Facility.
The principal amount of the loans borrowed under our Junior Credit Facility is due in full on the maturity date. Interest on the Junior Credit Facility accrues at a rate equal to the greater of (i) 8.50% or (ii) a base rate (being, at our option, either (a) LIBOR for the applicable interest period (adjusted for Eurodollar Reserve Requirements) or (b) the greatest of (x) the prime rate announced by Wells Fargo Bank, N.A., (y) the federal funds rate plus 0.50% and (z) one-month adjusted LIBOR plus 1.00%), plus a margin of either 6.5% or 7.5%, based on the base rate selected.
The Company is also required under our Junior Credit Facility to maintain the following financial ratios:
· a current ratio, consisting of consolidated current assets including undrawn borrowing capacity to consolidated current liabilities, of not less than 1.0 to 1.0 as of the last day of any fiscal quarter;
· a maximum leverage ratio, consisting of consolidated debt to adjusted consolidated EBITDAX (as defined in the Junior Credit Facility), of not greater than 4.5 to 1.0 as of the last day of any fiscal quarter (beginning 30 September 2013); and
· an asset coverage ratio, consisting of PV10 to consolidated debt, of not less than 1.5 to 1.0, as of certain test dates.
For the year ended 31 December 2013, the Company capitalised $0.3 million of financing costs related to the Junior Credit Facility, which offset the principal balance. As at 31 December 2013 there was $15 million outstanding under the Company’s Junior Credit Facility. As at 31 December 2013, the Company was in compliance with all restrictive financial and other covenants under the Junior Credit Facility.
Senior Credit Facility
On 31 December 2012, Sundance Energy entered into a credit agreement with Wells Fargo Bank, N.A. (the “Senior Credit Facility”), pursuant to which up to $300 million is available on a revolving basis. The borrowing base under the Senior Credit Facility is determined by reference to the value of the Company’s proved reserves. The agreement specifies a semi-annual borrowing base redetermination and the Company can request two additional redeterminations each year. The initial borrowing base was set at $30 million and was subsequently increased to $48 million based on March 2013 reserves.
Interest on borrowed funds accrue, at the Company’s option, of i) LIBOR plus a margin that ranges from 175 to 275 basis points or ii) the Base Rate, defined as a rate equal to the highest of (a) the Federal Funds Rate plus 1/2 of 1%, (b) the Prime Rate, or (c) LIBOR plus a margin that ranges from 75 to 175 basis points. The applicable margin varies depending on the amount drawn. The Company also pays a commitment that ranges from 37.5 to 50 basis points on the undrawn balance of the borrowing base. The agreement has a five-year term and contains both negative and affirmative covenants, including minimum current ratio and maximum leverage ratio requirements consistent with the Junior Credit Facility’s. Certain development and production assets are pledged as collateral and the facility is guaranteed by the Parent Company. On 31 December 2012, the Company drew $30 million on the Senior Credit Facility’s borrowing base and used $15 million of the proceeds to repay and retire its outstanding loan with the Bank of Oklahoma. As a part of its Bank of Oklahoma debt extinguishment, the Company expensed approximately $0.3 million of unamortised deferred financing costs, which is included in financing costs in the consolidated statement of profit or loss and other comprehensive income for the six month period ended 31 December 2012.
For the year and six month period ended 31 December 2013 and 2012, the Company capitalised $0.2 million and $0.4 million, respectively, of financing costs related to the Senior Credit Facility, which offset the principal balance. As at 31 December 2013 there was $15 million outstanding under the Company’s Senior Credit Facility. As at 31 December 2013, the Company was in compliance with all restrictive financial and other covenants under the Senior Credit Facility.
The Company capitalised $1.3 million and nil of interest expense during the year and six month period ended 31 December 2013 and 2012, respectively.
NOTE 23—RESTORATION PROVISION
The restoration provision represents the best estimate of the present value of restoration costs relating to the Company’s oil and natural gas interests, which are expected to be incurred up to 2043. Assumptions, based on the current economic environment, have been made which management believes are a reasonable basis upon which to estimate the future liability. The estimate of future removal costs requires management to make significant judgments regarding removal date or well lives, the extent of restoration activities required, discount and inflation rates. These estimates are reviewed regularly to take into account any material changes to the assumptions. However, actual restoration costs will reflect market conditions at the relevant time. Furthermore, the timing of restoration is likely to depend on when the fields cease to produce at economically viable rates. This in turn will depend on future oil and natural gas prices, which are inherently uncertain.
|
| Year ended |
| Six months ended |
| ||
Balance at the beginning of the period |
| $ | 1,228 |
| $ | 588 |
|
New provisions and changes in estimates |
| 3,622 |
| 310 |
| ||
Dispositions |
| (146 | ) | (192 | ) | ||
New provisions assumed from acquisition |
| 397 |
| 506 |
| ||
Reclassified to assets held for sale |
| (109 | ) | — |
| ||
Unwinding of discount |
| 82 |
| 16 |
| ||
Balance at end of period |
| $ | 5,074 |
| $ | 1,228 |
|
NOTE 24—DEFERRED TAX ASSETS AND LIABILITIES
Deferred tax assets and liabilities are attributable to the following:
|
| 31 December 2013 |
| 31 December 2012 |
| ||
Net deferred tax assets: |
|
|
|
|
| ||
Share issuance costs |
| $ | 1,069 |
| $ | — |
|
Net operating loss carried forward |
| 473 |
| — |
| ||
Unrecognized foreign currency gain (loss) |
| 761 |
| — |
| ||
Total net deferred tax assets |
| $ | 2,303 |
| $ | — |
|
Deferred tax liabilities: |
|
|
|
|
| ||
Development and production expenditure |
| $ | (114,042 | ) | $ | (79,600 | ) |
Offset by deferred tax assets with legally enforceable right of set- off: |
|
|
|
|
| ||
Net operating loss carried forward |
| 10,373 |
| 22,647 |
| ||
Other |
| 958 |
| (26 | ) | ||
Total net deferred tax liabilities |
| $ | (102,711 | ) | $ | (56,979 | ) |
NOTE 25—ISSUED CAPITAL
Total ordinary shares issued and outstanding at each period end are fully paid. All shares issued are authorized. Shares have no par value.
a) Ordinary Shares
|
| Number of Shares |
|
Total shares issued and outstanding at 30 June 2012 |
| 277,098,474 |
|
Shares issued during the period |
| 1,666,667 |
|
Total shares issued and outstanding at 31 December 2012 |
| 278,765,141 |
|
Shares issued during the year |
| 184,408,527 |
|
Total shares issued and outstanding at 31 December 2013 |
| 463,173,668 |
|
Ordinary shares participate in dividends and the proceeds on winding of the Parent Company in proportion to the number of shares held. At shareholders’ meetings each ordinary share is entitled to one vote when a poll is called, otherwise each shareholder has one vote on a show of hands.
b) Issued Capital
|
| Year ended |
| Six months ended |
| ||
Beginning of the period |
| $ | 58,694 |
| $ | 57,978 |
|
Shares issued in connection with: |
|
|
|
|
| ||
Merger with Texon |
| 132,092 |
| — |
| ||
Private placement |
| 47,398 |
| — |
| ||
Exercise of stock options |
| 813 |
| 716 |
| ||
Total shares issued during the period |
| 180,303 |
| 716 |
| ||
Cost of capital raising during the period, net of tax |
| (1,989 | ) | — |
| ||
Closing balance at end of period |
| $ | 237,008 |
| $ | 58,694 |
|
c) Options on Issue
Details of the share options outstanding as at the end of the period:
Grant Date |
| Expiry Date |
| Exercise Price |
| 31 December 2013 |
| 31 December 2012 |
|
10 Sep 2010 |
| 31 May 2013 |
| A$0.20 |
| — |
| 1,000,000 |
|
10 Sep 2010 |
| 31 May 2013 |
| A$0.30 |
| — |
| 500,000 |
|
02 Dec 2010 |
| 01 Dec 2015 |
| A$0.37 |
| 291,666 |
| 1,166,666 |
|
02 Mar 2011 |
| 30 Jun 2014 |
| A$0.95 |
| 30,000 |
| 30,000 |
|
03 Jun 2011 |
| 31 May 2013 |
| A$0.35 |
| — |
| 100,000 |
|
03 Jun 2011 |
| 15 Jan 2016 |
| A$0.65 |
| 500,000 |
| 500,000 |
|
03 Jun 2011 |
| 28 Jan 2016 |
| A$0.50 |
| — |
| 250,000 |
|
06 Jun 2011 |
| 01 Sep 2015 |
| A$0.95 |
| 30,000 |
| 30,000 |
|
06 Sep 2011 |
| 31 Dec 2018 |
| A$0.95 |
| 1,200,000 |
| 1,200,000 |
|
05 Dec 2011 |
| 05 Mar 2019 |
| A$0.95 |
| 1,000,000 |
| 1,000,000 |
|
01 Nov 2012 |
| 01 Feb 2020 |
| A$1.15 |
| 350,000 |
| — |
|
03 Dec 2012 |
| 03 Mar 2020 |
| A$1.15 |
| 350,000 |
| — |
|
01 Apr 2013 |
| 01 Jul 2020 |
| A$1.25 |
| 350,000 |
| — |
|
24 Sept 2013 |
| 23 Dec 2020 |
| A$1.40 |
| 950,000 |
| — |
|
Total share options outstanding |
|
|
|
|
| 5,051,666 |
| 5,776,666 |
|
d) Restricted Share Units on Issue
Details of the restricted share units outstanding as at the end of the period:
Grant Date |
| 31 December 2013 |
| 31 December 2012 |
|
05 Dec 2011 |
| 88,500 |
| 608,750 |
|
15 Oct 2012 |
| 709,817 |
| 1,482,143 |
|
19 April 2013 |
| 905,990 |
| — |
|
Total RSUs outstanding |
| 1,704,307 |
| 2,090,893 |
|
e) Capital Management
Management controls the capital of the Group in order to maintain an appropriate debt to equity ratio, provide the shareholders with adequate returns and ensure that the Group can fund its operations and continue as a going concern.
The Group’s debt and capital includes ordinary share capital and financial liabilities, supported by financial assets. Other than the covenants described in Note 22, the Group has no externally imposed capital requirements.
Management effectively manages the Group’s capital by assessing the Group’s financial risks and adjusting its capital structure in response to changes in these risks and in the market. These responses include the management of debt levels, distributions to shareholders and shareholder issues.
There have been no changes in the strategy adopted by management to control the capital of the Group since the prior period. The strategy is to ensure that the Group’s gearing ratio remains minimal. As at 31 December 2013 and 2012, the Company had $29.1 million and $29.6 million of outstanding debt, net of deferred financing fees, respectively.
NOTE 26—RESERVES
a) Share Option Reserve
The share option reserve records items recognised as expenses on valuation of employee and supplier share options and restricted share units.
b) Foreign Currency Translation Reserve
The foreign currency translation reserve records exchange differences arising on translation of the Parent Company.
NOTE 27—CAPITAL AND OTHER EXPENDITURE COMMITMENTS
Capital commitments relating to tenements
As at 31 December 2013, all of the Company’s exploration and evaluation and development and production assets are located in the United States of America (“US”).
The mineral leases in the exploration prospects in the US have primary terms ranging from 3 years to 5 years and generally have no specific capital expenditure requirements. However, mineral leases that are not successfully drilled and included within a spacing unit for a producing well within the primary term will expire at the end of the primary term unless re-leased.
The following tables summarize the Group’s contractual commitments not provided for in the consolidated financial statements:
|
| As At 31 December 2013 |
| ||||||||||
|
| Total |
| Less than |
| 1 - 5 years |
| More than |
| ||||
Drilling rig commitments(1) |
| $ | 5,159 |
| $ | 5,159 |
| $ | — |
| $ | — |
|
Drilling commitments(2) |
| 2,000 |
| — |
| 2,000 |
| — |
| ||||
Operating lease commitments(3) |
| 1,860 |
| 200 |
| 1,354 |
| 306 |
| ||||
Employment commitments(4) |
| 104 |
| 104 |
| — |
| — |
| ||||
Total expenditure commitments |
| $ | 9,123 |
| $ | 5,463 |
| $ | 3,354 |
| $ | 306 |
|
|
| As at 31 December 2012 |
| ||||||||||
|
| Total |
| Less than |
| 1 - 5 years |
| More than |
| ||||
Drilling commitments(2) |
| $ | 3,000 |
| $ | — |
| $ | 3,000 |
| $ | — |
|
Operating lease commitments(3) |
| 243 |
| 162 |
| 81 |
| — |
| ||||
Employment commitments(4) |
| 379 |
| 275 |
| 104 |
| — |
| ||||
Total expenditure commitments |
| $ | 3,622 |
| $ | 437 |
| $ | 3,185 |
| $ | — |
|
(1) As at 31 December 2013, the Company had 4 outstanding drilling rig contracts to explore and develop the Company’s properties. The contracts generally have terms of 6 to 12 months. Amounts represent minimum expenditure commitments should the Company elect to terminate these contracts prior to term. Subsequent to year end, the Company entered into a drilling rig contract in which minimum commitments due to early termination would be $2.1 million.
(2) On 31 December 2012, the Company entered into an agreement to acquire certain oil and natural gas properties located in the Wattenberg Field and to drill 45 net wells by 31 December 2015 on the acquired properties (the “Drilling Commitment”). As each qualifying well is drilled, approximately $67 thousand is paid from the escrow account to the Company. However, for each required net commitment well not completed by the Company during that prorated commitment year, the Company is to pay the seller of the properties approximately $67 thousand from the escrow account. Certain clawback provisions allow the Company to recoup amounts paid to the sellers if the total 45 wells are drilled by 31 December 2015. As at 31 December 2013, the Company has not yet drilled any wells, as such, $1.0 million, equal to one third of the total commitment, was accrued and recognised in other (expense) income in the consolidated statement of profit or loss and comprehensive income and was released from the escrow account subsequent to the balance sheet date.
(3) Represents commitments for minimum lease payments in relation to non-cancellable operating leases for office space not provided for in the consolidated financial statements.
(4) Represents commitments for the payment of salaries and other remuneration under long-term employment and consultant contracts not provided for in the consolidated financial statements. Details relating to the employment contracts are set out in the Company’s Remuneration Report.
NOTE 28—CONTINGENT ASSETS AND LIABILITIES
At the date of signing this report, the Group is not aware of any contingent assets or liabilities that should be recognised or disclosed in accordance with AASB 137—Provisions, Contingent Liabilities and Contingent Assets / IFRS 37—Provisions, Contingent Liabilities and Contingent Assets.
NOTE 29—OPERATING SEGMENTS
The Company’s strategic focus is the exploration, development and production of large, repeatable onshore resource plays in North America, which is the Company’s only major line of business and only major geographic area of operations. All of the basins and/or formations in which the Company operates have common operational characteristics, challenges and economic characteristics. As such, Management has determined, based upon the reports reviewed by the Chief Operating Decision Maker (“CODM”) and used to make strategic decisions, that the Company has one reportable segment being oil and natural gas exploration and production in North America.
The CODM reviews internal management reports on a monthly basis that are consistent with the information provided in the statement of profit or loss and other comprehensive income, statement of financial position and statement of cash flows. As a result no reconciliation is required, because the information as presented is used by the CODM to make strategic decisions.
Geographic Information
The operations of the Group are located in only one geographic location, the United States of America. All revenue is generated from sales to customers located in the US.
Revenue from four major customers exceeded 10 percent of Group consolidated revenue for the year ended 31 December 2013 and accounted for 47 percent, 15 percent, 10 percent and 10 percent (six month period ended 31 December 2012: four major customers accounted for 29 percent, 22 percent, 21 percent and 10 percent) of our consolidated oil and natural gas revenues.
NOTE 30—CASH FLOW INFORMATION
a) Reconciliation of cash flows from operations with income from ordinary activities after income tax
|
| Year ended |
| Six months ended |
| ||
Profit from ordinary activities after income tax |
| $ | 15,942 |
| $ | 76,210 |
|
Non cash flow in operating income |
|
|
|
|
| ||
Depreciation and amortisation expense |
| 36,225 |
| 6,116 |
| ||
Share options expensed |
| 1,590 |
| 733 |
| ||
Unrealised losses on derivatives |
| 837 |
| 1,190 |
| ||
Net gain on sale of properties |
| (7,335 | ) | (122,327 | ) | ||
Write-off of Bank of Oklahoma deferred financing fees |
| — |
| 349 |
| ||
Other |
| (13 | ) | — |
| ||
Changes in assets and liabilities: |
|
|
|
|
| ||
—Increase in current and deferred tax |
| 5,812 |
| 46,616 |
| ||
—Decrease (increase) in other assets, excluding investing activities |
| 2,155 |
| (381 | ) | ||
—Increase in trade and other receivables |
| (3,541 | ) | (3,320 | ) | ||
—Increase in trade and other payables |
| 10,974 |
| 4,200 |
| ||
Net cash provided by operating activities |
| $ | 62,646 |
| $ | 9,386 |
|
b) Non Cash Financing and Investing Activities
· During the year ended 31 December 2013 $132.1 million in shares were issued in connection with the Texon acquisition.
NOTE 31—SHARE BASED PAYMENTS
During the year and six month period ended 31 December 2013 and 2012, a total of 2,000,000 and nil options were granted to employees pursuant to employment agreements and a total of 2,725,000 and 1,666,667 previously issued options were exercised, respectively. There were 700,000 awarded options that the Company expected to issue in early 2013 for which Company employees rendered services during the six month period ended 31 December 2012. Using the best estimate of fair value on the employees’ hire date, the Company began expensing these awards during the six month period ended 31 December 2012. The 700,000 options were issued in early 2013, but were excluded from the outstanding options summary below as at 31 December 2012:
|
| Year ended |
| Six months ended |
| ||||
|
| Number of |
| Weighted |
| Number of |
| Weighted |
|
Outstanding at start of period |
| 5,776,666 |
| 0.59 |
| 7,443,333 |
| 0.55 |
|
Formally issued |
| 2,000,000 |
| 1.29 |
| — |
| — |
|
Forfeited |
| — |
| — |
| — |
| — |
|
Exercised |
| (2,725,000 | ) | 0.31 |
| (1,666,667 | ) | 0.41 |
|
Expired |
| — |
| — |
| — |
| — |
|
Outstanding at end of period |
| 5,051,666 |
| 1.02 |
| 5,776,666 |
| 0.59 |
|
Exercisable at end of period |
| 2,241,666 |
| 0.87 |
| 3,729,999 |
| 0.44 |
|
The following tables summarise the options issued and awarded and their related grant date, fair value and vesting conditions for the year and six month period ended 31 December 2013 and 2012, respectively:
Options issued during the year ended 31 December 2013:
Grant Date |
| Number of |
| Estimated |
| Vesting Conditions |
| |
1 April 2013 |
| 350,000 |
| $ | 217 |
| 20% issuance date, 20% first four anniversaries |
|
24 September 2013 |
| 950,000 |
| $ | 475 |
| 20% issuance date, 20% first four anniversaries |
|
Total |
| 1,300,000 |
| $ | 692 |
|
|
|
Options awarded, but not yet issued during the six month period ended 31 December 2012:
Award Date (not issued) |
| Number of |
| Estimated |
| Vesting Conditions |
| |
1 November 2012 |
| 350,000 |
| $ | 145 |
| 20% issuance date, 20% first four anniversaries |
|
3 December 2012 |
| 350,000 |
| $ | 157 |
| 20% issuance date, 20% first four anniversaries |
|
|
| 700,000 |
| $ | 302 |
|
|
|
Share based payments expense related to options is determined pursuant to AASB 2—Share Based Payments (“AASB 2”) / IFRS 2—Share Based Payments (“IFRS 2”), and is recognised pursuant to the attached vesting conditions. The fair value of the options awarded ranged from A$0.53 to A$0.59 and A$0.42 to A$0.45 for the year and six month period ended 31 December 2013 and 2012, respectively, which were calculated using a Black-Sholes options pricing model. Expected volatilities are based upon the historical volatility of the ordinary shares. Historical data is also used to estimate the probability of option exercise and potential forfeitures. Included in the 2,000,000 options issued during the year ended 2013 were 700,000 options that were granted in the fourth quarter of 2012, which began being expensed during the six month period ended 31 December 2012 according to the relevant service periods.
The following table summarises the key assumptions used to calculate the estimated fair value awarded or granted during the periods:
|
| Issued during |
| Issued in |
|
Share price: |
| A$1.06 - 1.10 |
| A$0.78 - A$0.82 |
|
Exercise price: |
| A$1.25 - 1.40 |
| A$1.15 |
|
Expected volatility: |
| 60% |
| 65% |
|
Option term: |
| 5.75 years |
| 5.75 years |
|
Risk free interest rate: |
| 2.82% to 3.10% |
| 2.75% |
|
(1) As at 31 December 2012, options were subject to formal issuance, but had been awarded and expensed beginning on the employees’ hire date during the six month period ended 31 December 2012.
Restricted Share Units
During the year and six month period ended 31 December 2013 and 2012, the Board of Directors awarded 1,237,994 and 1,482,143 RSUs to certain employees. These awards were made in accordance with the long-term equity component of the Company’s incentive compensation plan, the details of which are described in more detail in the remuneration section of the Directors’ Report. Share based payment expense for RSUs awarded was calculated pursuant to AASB 2 / IFRS 2. The fair values of RSUs were estimated at the date they were approved by the Board of Directors, 19 April 2013 and 15 October 2012 (the measurement dates). As at 30 June 2012, the 5 December 2011 awards had been approved but not yet issued. All unforfeited awards were issued to employees upon finalisation of the plan documents, which occurred in December 2012. The value of the vested portion of these awards has been recognised within the financial statements. This information is summarised for the Group for the year and six month period ended 31 December 2013 and 2012, respectively, below:
|
| Year ended 31 December 2013 |
| ||
|
| Number |
| Weighted Average |
|
Outstanding at beginning of year |
| 2,090,893 |
| A$0.59 |
|
Issued |
| 1,237,994 |
| A$0.91 |
|
Converted to ordinary shares |
| (1,511,511 | ) | A$0.76 |
|
Forfeited |
| (113,069 | ) | A$0.76 |
|
Outstanding at end of year |
| 1,704,307 |
| A$0.83 |
|
|
| Six months ended |
| ||
|
| Number |
| Weighted Average |
|
Awarded, but not yet issued (beginning of period)* |
| 910,000 |
| A$0.38 |
|
Forfeited prior to finalisation of plan* |
| (301,250 | ) | A$0.38 |
|
Formally issued (in addition to unissued units at beginning of period) |
| 1,482,143 |
| A$0.68 |
|
Forfeited subsequent to finalisation of plan |
| — |
| — |
|
Converted to ordinary shares |
| — |
| — |
|
Outstanding at end of period |
| 2,090,893 |
| A$0.59 |
|
Vested at end of period |
| 765,286 |
| A$0.48 |
|
* RSUs awarded, but not yet issued at beginning of period were issued upon finalisation of the plan during the period ended 31 December 2012 and are included in the total outstanding at end of period (net of forfeited units).
The following tables summarise the RSUs issued and their related grant date, fair value and vesting conditions for the year and six month period ended 31 December 2013 and 2012, respectively:
RSUs awarded during the year ended 31 December 2013:
Grant Date |
| Number |
| Estimated |
| Vesting Conditions |
| |
19 April 2013 |
| 863,746 |
| $ | 789 |
| 25% issuance date, 25% first three anniversaries |
|
28 May 2013 |
| 374,248 |
| $ | 354 |
| 25% issuance date, 25% first three anniversaries |
|
|
| 1,237,994 |
| $ | 1,143 |
|
|
|
RSUs issued during the six month period ended 31 December 2012:
Grant Date |
| Number |
| Estimated |
| Vesting Conditions |
| |
15 October 2012 |
| 1,080,358 |
| $ | 809 |
| 25% issuance date, 25% first three anniversaries |
|
29 November 2012 |
| 401,785 |
| $ | 340 |
| 25% issuance date, 25% first three anniversaries |
|
|
| 1,482,143 |
| $ | 1,149 |
|
|
|
Upon vesting, and after a certain administrative period, the RSUs are converted to ordinary shares of the Company. Once converted to ordinary shares, the RSUs are no longer restricted. As the daily closing price of the Company’s ordinary shares approximates its estimated fair value at that time, the Company used the grant date closing price to estimate the fair value of the RSUs.
NOTE 32—RELATED PARTY TRANSACTIONS
N Martin was previously a partner of Minter Ellison Lawyers and is now a consultant for Minter Ellison Lawyers as well as a Director of the Company. Minter Ellison Lawyers were paid a total of $0.2 million and $0.1 million for legal services for the year and six month period ended 31 December 2013 and 2012, respectively.
NOTE 33—FINANCIAL RISK MANAGEMENT
a) Financial Risk Management Policies
The Group is exposed to a variety of financial market risks including interest rate, commodity prices, foreign exchange and liquidity risk. The Group’s risk management strategy focuses on the volatility of commodity markets and protecting cash flow in the event of declines in commodity pricing. The Group utilises derivative financial instruments to hedge exposure to
fluctuations in interest rates and commodity prices. The Group’s financial instruments consist mainly of deposits with banks, short term investments, accounts receivable, derivative financial instruments, finance facility, and payables. The main purpose of non-derivative financial instruments is to raise finance for the Group operations.
i) Treasury Risk Management
Financial risk management is carried out by Management. The Board sets financial risk management policies and procedures by which Management are to adhere. Management identifies and evaluates all financial risks and enters into financial risk instruments to mitigate these risk exposures in accordance with the policies and procedures outlined by the Board.
ii) Financial Risk Exposure and Management
Interest rate risk is managed with a mixture of fixed and floating rate cash deposits. As at 31 December 2013 and 2012 approximately nil of Group deposits are fixed. It is the policy of the Group to keep surplus cash in interest yielding deposits.
The Group’s interest rate risk arises from its borrowings. Interest rate risk is the risk that the fair value of future cash flows of a financial instrument will fluctuate because of changes in market interest rates. The Group’s exposure to the risk of changes in market interest rates relates primarily to the Group’s long-term debt obligations with floating interest rates.
During the year ended 31 December 2013, the Group entered into US dollar denominated interest rate swaps which fix the interest rate associated with the credit facilities to protect against the floating LIBOR rates through 2017.
As at 31 December 2013 the Group had interest rate swaps with a notional contract amount of $15.0 million (2012: nil).
The net fair value of interest rate swaps at 31 December 2013 was relatively immaterial, comprising long-term assets of $0.2 million and current liabilities of $0.1 million. These amounts were recognised as fair value derivatives.
iii) Commodity Price Risk Exposure and Management
The Board actively reviews oil and gas hedging on a monthly basis. Reports providing detailed analysis of the Group’s hedging activity are continually monitored against Group policy. The Group sells its oil on market using Nymex and LLS market spot rates reduced for basis differentials in the basins from which the Company produces. Gas is sold using Henry Hub and Houston Ship Channel market spot prices. Forward contracts are used by the Group to manage its forward commodity price risk exposure. The Group’s policy is to hedge less than 50% of anticipated future oil and gas production for up to 24 months. The Group may hedge over 50% or beyond 24 months with approval of the Board. The Group has not elected to utilise hedge accounting treatment and changes in fair value are recognised in the statement of profit or loss and other comprehensive income.
Commodity Hedge Contracts outstanding as at 31 December 2013
Contract Type |
| Counterparty |
| Basis |
| Quantity/mo |
| Strike Price |
| Term |
|
Collar |
| Shell Trading US |
| NYMEX |
| 2.500 BBL |
| $80.00/$98.25 |
| 1-Jul-14 - 31-Dec-14 |
|
Collar |
| Wells Fargo |
| NYMEX |
| 3,000 BBL |
| $90.00/$99.75 |
| 1-Jul-13 - 30-Jun-14 |
|
Collar |
| Wells Fargo |
| NYMEX |
| 3,000 BBL |
| $85.00/$94.75 |
| 1-Jan-14 - 31-Dec-14 |
|
Swap |
| Wells Fargo |
| NYMEX |
| 2,000 BBL |
| $97.40 |
| 1-Jan-14 - 31-Dec-14 |
|
Collar |
| Wells Fargo |
| NYMEX |
| 2,000 BBL |
| $75.00/$98.65 |
| 1-Jan-15 - 31-Dec-15 |
|
Collar |
| Wells Fargo |
| NYMEX |
| 2,000 BBL |
| $90.00/$102.85 |
| 1-Jan-14 - 31-Dec-14 |
|
Collar |
| Wells Fargo |
| NYMEX |
| 2,000 BBL |
| $80.00/$97.00 |
| 1-Jan-15 - 31-Dec-15 |
|
Collar |
| Shell Trading US |
| LLS |
| 2,000 BBL |
| $90.00/$102.00 |
| 1-Jan-14 - 31-Dec-14 |
|
Collar |
| Shell Trading US |
| LLS |
| 3,000 BBL |
| $90.00/$101.30 |
| 1-Jan-14 - 31-Dec-14 |
|
Collar |
| Shell Trading US |
| LLS |
| 2,000 BBL |
| $85.00/$102.00 |
| 1-Jul-14 - 31-Dec-14 |
|
Collar |
| Shell Trading US |
| LLS |
| 3,000 BBL |
| $85.00/$101.05 |
| 1-Jan-15 - 31-Dec-15 |
|
Swap |
| Wells Fargo |
| LLS |
| 3,000 BBL |
| $101.75 |
| 1-Jul-13 - 30-Jun-14 |
|
Swap |
| Wells Fargo |
| LLS |
| 3,000 BBL |
| $100.15 |
| 1-Jan-14 - 31-Dec-14 |
|
Swap |
| Wells Fargo |
| LLS |
| 3,000 BBL |
| $102.30 |
| 1-Jan-14 - 31-Dec-14 |
|
Swap |
| Shell Trading US |
| HH |
| 20,000 MCF |
| $4.23 |
| 1-Jan-14 - 31-Dec-14 |
|
Collar |
| Shell Trading US |
| HSC |
| 10,000 MCF |
| $3.75/$4.60 |
| 1-Jan-14 - 31-Dec-14 |
|
b) Net Fair Value of Financial Assets and Liabilities
The net fair value of cash and cash equivalent and non-interest bearing monetary financial assets and financial liabilities of the consolidated entity approximate their carrying value.
The net fair value of other monetary financial assets and financial liabilities is based on discounting future cash flows by the current interest rates for assets and liabilities with similar risk profiles. The balances are not materially different from those disclosed in the consolidated statement of financial position of the Group.
c) Credit Risk
Credit risk for the Group arises from investments in cash and cash equivalents, derivative financial instruments and deposits with banks and financial institutions, as well as credit exposures to customers including outstanding receivables and committed transactions, and represents the potential financial loss if counterparties fail to perform as contracted. The Group trades only with recognised, creditworthy third parties.
The maximum exposure to credit risk, excluding the value of any collateral or other security, at balance date to recognise the financial assets, is the carrying amount, net of any impairment of those assets, as disclosed in the balance sheet and notes to the financial statements.
The Group does not have any material credit risk exposure to any single debtor or group of debtors under financial instruments entered into by the consolidated entity.
d) Liquidity Risk
Prudent liquidity risk management implies maintaining sufficient cash and marketable securities and the availability of funding through an adequate committed credit facility. The Company aims to maintain flexibility in funding to meet ongoing operational requirements and exploration and development expenditures by keeping a committed credit facility available.
The Company has the following commitments related to its non-derivative financial liabilities as at 31 December 2013 (in 000s):
|
| Total |
| Less than |
| 1 - 5 years |
| More than |
| ||||
Trade and other payable |
| $ | 62,811 |
| $ | 62,811 |
| $ | — |
| $ | — |
|
Accrued expenses |
| 77,716 |
| 77,716 |
| — |
| — |
| ||||
Credit facilities payments |
| 37,037 |
| 1,600 |
| 35,437 |
| — |
| ||||
Total |
| $ | 177,564 |
| $ | 142,127 |
| $ | 35,437 |
| $ | — |
|
The Company has the following commitments related to its non-derivative financial liabilities as at 31 December 2012 (in 000s):
|
| Total |
| Less than |
| 1 - 5 years |
| More than |
| ||||
Trade and other payable |
| $ | 38,770 |
| $ | 38,770 |
| $ | — |
| $ | — |
|
Accrued expenses |
| 13,072 |
| 13,072 |
| — |
| — |
| ||||
Credit facilities payments |
| 30,000 |
| — |
| 30,000 |
| — |
| ||||
Total |
| $ | 81,842 |
| $ | 51,842 |
| $ | 30,000 |
| $ | — |
|
e) Market Risk
Market risk is the risk that the fair value of future cash flows of a financial instrument will fluctuate because of changes in market prices. Market risk comprises three types of risk: commodity price risk, interest rate risk and foreign currency risk. Financial instruments affected by market risk include loans and borrowings, deposits, trade receivables, trade payables, accrued liabilities and derivative financial instruments.
Commodity Price Risk
The Group is exposed to the risk of fluctuations in prevailing market commodity prices on the mix of oil and gas products it produce.
Commodity Price Risk Sensitivity Analysis
The table below summarises the impact on profit before tax for changes in commodity prices on the fair value of derivative financial instruments. The impact on equity is the same as the impact on profit before tax as these derivative financial instruments have not been designated as hedges and are and therefore fair valued through profit and loss. The analysis assumes that the crude oil and natural gas price moves $10 per barrel and $0.50 per mcf, with all other variables remaining constant, respectively.
|
| Year ended |
| Six months ended |
| ||
Change in profit/(loss) |
|
|
|
|
| ||
Oil |
|
|
|
|
| ||
—improvement in US$ oil price of $10 per barrel |
| $ | (2,351 | ) | $ | (702 | ) |
—decline in US$ oil price of $10 per barrel |
| 1,477 |
| 840 |
| ||
Gas |
|
|
|
|
| ||
—improvement in US$ gas price of $0.50 per mcf |
| $ | (124 | ) | $ | (60 | ) |
—decline in US$ gas price of $0.50 per mcf |
| 180 |
| 60 |
| ||
Interest Rate Risk
Interest rate risk is the risk that the fair value of the future cash flows of a financial instrument will fluctuate because of changes in market interest rates. The Group’s exposure to the risk of changes in market interest rates relates primarily to the Group’s long-term debt obligations with floating interest rates.
Interest Rate Sensitivity Analysis
Based on the net debt position as at 31 December 2013, taking into account interest rate swaps, with all other variables remaining constant, the following table represents the effect on income as a result of changes in the interest rate. The impact on equity is the same as the impact on profit before tax.
|
| Year ended |
| Six month ended |
| ||
Change in profit/(loss) |
|
|
|
|
| ||
—increase in interest rates + 2% |
| $ | (177 | ) | $ | (157 | ) |
—decrease in interest rates - 2% |
| — |
| 157 |
| ||
This assumes that the change in interest rates is effective from the beginning of the financial year and the net debt position and fixed/floating mix is constant over the year. However, interest rates and the debt profile of the Group are unlikely to remain constant and therefore the above sensitivity analysis will be subject to change.
Foreign Currency Risk
The Group is exposed to fluctuations in foreign currency arising from transactions in currencies other than the Group’s functional currency (US$).
NOTE 34—PARENT COMPANY INFORMATION
a) Cost Basis
|
| Year ended |
| Six months ended |
| ||
Parent Entity |
|
|
|
|
| ||
Assets |
|
|
|
|
| ||
Current assets |
| $ | 1,962 |
| $ | 1,490 |
|
Investment in subsidiaries |
| 173,633 |
| 134,094 |
| ||
Non-current assets |
| 42,840 |
| — |
| ||
Total assets |
| $ | 218,435 |
| $ | 135,584 |
|
Liabilities |
|
|
|
|
| ||
Current liabilities |
| $ | 425 |
| $ | 127 |
|
Non-current liabilities |
| — |
| — |
| ||
Total Liabilities |
| 425 |
| 127 |
| ||
Total net assets |
| $ | 218,010 |
| $ | 135,457 |
|
Equity |
|
|
|
|
| ||
Issued capital |
| 237,008 |
| 58,694 |
| ||
Share options reserve |
| 386 |
| 386 |
| ||
Foreign currency translation |
| (20,509 | ) | 925 |
| ||
Retained earnings (loss) |
| 1,125 |
| 75,452 |
| ||
Total equity |
| $ | 218,010 |
| $ | 135,457 |
|
Financial Performance |
|
|
|
|
| ||
Profit/(loss) for the period |
| $ | 275 |
| $ | (241 | ) |
Other comprehensive income |
| (31,307 | ) | — |
| ||
Total profit or loss and other comprehensive income |
| $ | (31,032 | ) | $ | (241 | ) |
b) Equity Basis
|
| Year ended |
| Six months ended |
| ||
Parent Entity |
|
|
|
|
| ||
Assets |
|
|
|
|
| ||
Current assets |
| $ | 1,962 |
| $ | 1,490 |
|
Investment in subsidiaries |
| 302,864 |
| 150,453 |
| ||
Non-current assets |
| 42,840 |
| — |
| ||
Total assets |
| $ | 347,666 |
| $ | 151,943 |
|
Liabilities |
|
|
|
|
| ||
Current liabilities |
| $ | 425 |
| $ | 127 |
|
Non-current liabilities |
| — |
| — |
| ||
Total Liabilities |
| 425 |
| 127 |
| ||
|
| Year ended |
| Six months ended |
| ||
Total net assets |
| $ | 347,241 |
| $ | 151,816 |
|
Equity |
|
|
|
|
| ||
Issued capital |
| 237,008 |
| 58,694 |
| ||
Share options reserve |
| 5,635 |
| 4,045 |
| ||
Foreign currency translation |
| (1,516 | ) | (1,095 | ) | ||
Retained earnings (loss) |
| 106,114 |
| 90,172 |
| ||
Total equity |
| $ | 347,241 |
| $ | 151,816 |
|
Financial Performance |
|
|
|
|
| ||
Profit/(loss) for the period before equity in income of subsidiaries |
| $ | 275 |
| $ | (241 | ) |
Equity in income of subsidiaries |
| 15,667 |
| 76,451 |
| ||
Other comprehensive income |
| (421 | ) | (154 | ) | ||
Total profit or loss and other comprehensive income |
| $ | 15,521 |
| $ | 76,056 |
|
c) Cash Flow
|
| Year ended |
| Six months ended |
| ||
Cash flow from operating activities |
| $ | (42,934 | ) | $ | (1,655 | ) |
Cash flow from investing activities |
| (136,890 | ) | 11 |
| ||
Cash flow from financing activities |
| 179,904 |
| 716 |
| ||
NOTE 35—DEED OF CROSS GUARANTEE
Pursuant to Class Order 98/1418, the wholly-owned subsidiary, Armadillo Petroleum Limited (“APL”), is relieved from the Corporations Act 2001 requirements for preparation, audit and lodgement of its financial reports.
As a condition of the Class Order, SEAL and APL (“the Closed Group”) have entered into a Deed of Cross Guarantee (“Deed”). The effect of the Deed is that SEAL has guaranteed to pay any deficiency in the event of the winding up of APL under certain provision of the Corporations Act 2001. APL has also given a similar guarantee in the event that SEAL is wound up.
The Closed Group was formed in 2013; therefore, there is no comparable information.
Set out below is a consolidated statement of profit or loss and other comprehensive income and retained earnings for the year ended 31 December 2013 of the Closed Group:
|
| Year ended |
| |
Profit / (loss) before income tax |
| $ | (1,497 | ) |
Income tax benefit |
| 1,780 |
| |
Profit attributable to members of SEAL |
| $ | 283 |
|
Total comprehensive loss attributable to members of SEAL |
| $ | (18,924 | ) |
Retained earnings at 1 January |
| $ | 849 |
|
Retained earnings at 31 December |
| $ | 1,132 |
|
Set out below is a condensed consolidated statement of financial position as at 31 December 2013 of the Closed Group:
|
| 31 December 2013 |
| |
Current assets |
|
|
| |
Cash and cash equivalents |
| $ | 1,558 |
|
Other current assets |
| 2,200 |
| |
Total current assets |
| 3,758 |
| |
Non-current assets |
|
|
| |
Exploration and evaluation expenditure |
| 170 |
| |
Related party note receivable |
| 40,537 |
| |
Other non-current assets |
| 174,240 |
| |
Total non-current assets |
| 214,947 |
| |
Total assets |
| $ | 218,705 |
|
Current liabilities |
|
|
| |
Trade and other payables |
| 176 |
| |
Accrued expenses |
| 302 |
| |
Total current liabilities |
| 478 |
| |
Non-current liabilities |
|
|
| |
Deferred tax liabilities |
| 4 |
| |
Total non-current liabilities |
| 4 |
| |
Total liabilities |
| $ | 482 |
|
Net assets |
| $ | 218,223 |
|
Equity |
|
|
| |
Issued capital |
| $ | 237,008 |
|
Share option reserve |
| 386 |
| |
Foreign currency translation |
| (20,303 | ) | |
Retained earnings |
| 1,132 |
| |
Total equity |
| $ | 218,223 |
|
NOTE 36—EVENTS AFTER THE BALANCE SHEET DATE
In May 2014, the Company entered into a Purchase and Sale Agreement to divest of its remaining Denver-Julesburg Basin assets. The sale price of $116 million in cash includes capital expenditure reimbursement on 8 gross (3.1 net) non- operated horizontal wells. The sale is expected to close in the third quarter of 2014.
In July 2014, the Company acquired the working interests in 9,200 gross (5,700 net) and 18,000 gross (5,400 net) mineral acres in Dimmit and Maverick Counties, Texas, respectively. The purchase price includes an initial cash payment of $33 million and a commitment to drill four Eagle Ford wells. In addition, the Company has the option, at its sole discretion, to acquire the Seller’s remaining working interests in Dimmit and Maverick Counties, Texas (including the Seller’s interest in producing wells) for an additional $45 million (comprised of the Seller’s choice of all cash or cash and ordinary shares, with certain restrictions).
In May 2014, the Company’s borrowing capacity under its Credit Facilities increased from $63 million to $135 million. Contemporaneously with and subsequent to the borrowing base redetermination, the Company drew an additional $50 million of net debt under its Credit Facilities, which increased the debt outstanding to $80 million as of June 30, 2014.
In April 2014, the Company acquired approximately 4,800 net acres in the Eagle Ford for an initial purchase price of approximately $10.5 million and two separate earn out payments due upon commencement of drilling ($7.7 million) and payout of the first six wells drilled on the acreage ($7.7 million). The term of the agreement is two years and provides a one year extension for $500 per acre extended. This acreage is adjacent to the Company’s current acreage in McMullen County, Texas.
In February 2014, the Company completed a placement of 84.2 million ordinary shares at A$0.95 per share, raising A$80.0 million. The first tranche of 63.7 million shares were issued in March 2014 and the second tranche of 20.5 million shares were issued in April 2014. The placement was undertaken after the Company chose not to proceed with its U.S. initial public offering as it did not meet the goals and objectives of the proposed issue. As a result, the Company expensed all transaction costs incurred on the initial public offering as at 31 December 2013 of $2.1 million.
After year-end, there was a well site accident in which two employees of a sub-contractor were injured. One of those employees subsequently passed away from their injuries. Due to various available indemnities and applicable insurance coverage, the Company believes the resolution of any potential claims that may ultimately name the Company as a defendant will not have a material adverse effect on its financial condition or results of operations
NOTE 37—UNAUDITED SUPPLEMENTAL OIL AND GAS DISCLOSURES
Costs Incurred
The following table sets forth the capitalised costs incurred in our oil and gas production, exploration, and development activities:
(in thousands) |
| Year ended |
| Six months ended |
| ||
Property Acquisition Costs |
|
|
|
|
| ||
Proved(1) |
| $ | 158,116 |
| $ | 986 |
|
Unproved(1) |
| 60,690 |
| 23,330 |
| ||
Exploration costs |
| 1,338 |
| — |
| ||
Development costs(2) |
| 219,121 |
| 46,981 |
| ||
|
| $ | 439,265 |
| $ | 71,297 |
|
(1) 2013 property acquisition costs include acquisition date fair value of $157.2 million and $47.3 million for proved and unproved assets acquired related to the Texon merger, which was primarily a non-cash business combination.
(2) 2013 development costs include $55.6 million of costs associated with non-producing wells in progress as at 31 December 2013. These wells in progress were either drilling, waiting on hydraulic fracturing or production testing at year-end.
Oil and Gas Reserve Information
Netherland, Sewell & Associates, Inc. (“NSAI”), an independent petroleum engineering consulting firm, prepared all of the total future net revenue discounted at 10% attributable to the total interest owned by the Company as at 31 December 2013 and 2012. The individual primarily responsible for overseeing the review is a Senior Vice President with NSAI and a Registered Professional Engineer in the State of Texas with over 30 years of experience in oil and gas reservoir studies and evaluations.
Proved reserves are those quantities of oil and natural gas, which, by analysis of geosciences and engineering data, can be estimated with reasonable certainty to be economically producible—from a given date forward, from known reservoirs, and under existing economic conditions, operating methods, and government regulations—prior to the time at which contracts providing the right to operate expire, unless evidence indicates that renewal is reasonably certain, regardless of whether deterministic or probabilistic methods are used for the estimation. The project to extract the hydrocarbons must have commenced or the operator must be reasonably certain that it will commence the project within a reasonable time.
There are numerous uncertainties inherent in estimating quantities of proved reserves and projecting future rates of production and the timing of development expenditures. The estimation of our proved reserves employs one or more of the following: production trend extrapolation, analogy, volumetric assessment and material balance analysis. Techniques including review of production and pressure histories, analysis of electric logs and fluid tests, and interpretations of geologic and geophysical data are also involved in this estimation process.
The following reserve data represents estimates only and should not be construed as being exact.
|
| Oil |
| Natural |
| NGL(1) |
| Total Oil |
|
Total proved reserves: |
|
|
|
|
|
|
|
|
|
30 June 2012 |
| 7,979 |
| 13,052 |
| — |
| 10,155 |
|
Revisions of previous estimates |
| (556 | ) | (1,205 | ) | — |
| (757 | ) |
Extensions and discoveries |
| 1,597 |
| 4,322 |
| — |
| 2,317 |
|
Purchases of reserves in-place |
| 827 |
| 5,797 |
| — |
| 1,793 |
|
Production |
| (195 | ) | (233 | ) | — |
| (234 | ) |
Sales of reserves in-place |
| (3,894 | ) | (4,845 | ) | — |
| (4,702 | ) |
31 December 2012 |
| 5,758 |
| 16,888 |
| — |
| 8,572 |
|
Revisions of previous estimates |
| (1,160 | ) | (4,091 | ) | 74 |
| (1,767 | ) |
Extensions and discoveries |
| 7,081 |
| 16,270 |
| 1,946 |
| 11,739 |
|
Purchases of reserves in-place |
| 3,857 |
| 4,674 |
| 758 |
| 5,393 |
|
Production |
| (827 | ) | (934 | ) | (96 | ) | (1,079 | ) |
Sales of reserves in-place |
| (1,753 | ) | (2,152 | ) | — |
| (2,111 | ) |
31 December 2013 |
| 12,956 |
| 30,655 |
| 2,683 |
| 20,747 |
|
Proved developed reserves: |
|
|
|
|
|
|
|
|
|
30 June 2012 |
| 2,564 |
| 4,905 |
| — |
| 3,382 |
|
31 December 2012 |
| 1,932 |
| 5,242 |
| — |
| 2,805 |
|
31 December 2013 |
| 4,140 |
| 10,765 |
| 1,087 |
| 7,021 |
|
Proved undeveloped reserves |
|
|
|
|
|
|
|
|
|
30 June 2012 |
| 5,415 |
| 8,147 |
| — |
| 6,773 |
|
31 December 2012 |
| 3,826 |
| 11,646 |
| — |
| 5,767 |
|
31 December 2013 |
| 8,816 |
| 19,890 |
| 1,596 |
| 13,726 |
|
(1) Prior to the year ended 31 December 2013, the Company’s NGL Proved Reserves were insignificant; and as such, were included in Natural Gas Proved Reserves and not separately reported in the Company’s reserve report.
Depletable Reserve Base
In accordance with International Financial Reporting Standards, as issued by the International Accounting Standards Board, the Company includes economically recoverable reserves as its depletable Reserve base used for its depletion calculation. With the exception of its Eagle Ford formation, the Company uses only Proved Developed Reserves in its depletable Reserve base. In addition to Proved Developed Reserves, the Company included Probable Developed Reserves of 887.3 MBoe in its Eagle Ford depletable Reserve base used for its six-month ended 31 December 2013 depletion calculation. The Proved and Probable Developed Reserves represent managements’ best estimate of economically recoverable reserves associated with developed properties located in the Eagle Ford formation.
Revisions of Previous Estimates
The Company’s previous estimates of Proved Reserves related to the Denver-Julesburg decreased by 1,431 MBoe in 2013 (81 percent of the Company’s total revisions of previous estimate). This decrease was due to adjusted forecasts for the Denver-Julesburg.
Extensions and Discoveries
During the six-month period ended December 31, 2012, we added 2,317 MBoe through extensions and discoveries. Of these additions, approximately 1,522, 306 and 489 MBoe were attributable to our Wattenberg, Bakken and Mississippian/Woodford assets, respectively.
As a result of the Company’s active 2013 drilling programs in its Eagle Ford and Mississippian/Woodford formations, the Proved Reserves had extensions and discoveries of 5,378 MBoe 4,252 MBoe, which represent 46 and 36 percent of the Company’s total extensions and discoveries, respectively.
Purchase of Reserves In-Place
During the six-months ended December 31, 2012, our purchase of reserves were located in the Machii Ross project of the Wattenberg.
During the year ended December 31, 2013, our purchase of reserves were located in the Eagle Ford.
Sales of Reserves In-Place
During the six-months ended December 31, 2012, our sales of reserves were located in the South Antelope prospect of the Bakken.
During the year ended December 31, 2013, our sales of reserves were located in the Phoenix prospect of the Bakken.
Standardized Measure of Future Net Cash Flow
The Standardized Measure of Discounted Future Net Cash Flows Relating to Proved Oil and Natural Gas Reserves (“Standardized Measure”) does not purport, nor should it be interpreted, to present the fair value of a company’s proved oil and natural gas reserves. Fair value would require, among other things, consideration of expected future economic and operating conditions, a discount factor more representative of the time value of money, and risks inherent in reserve estimates.
Under the Standardized Measure, future cash inflows are based upon the forecasted future production of year-end proved reserves. Future cash inflows are then reduced by estimated future production and development costs to determine net pre-tax cash flow. Future income taxes are computed by applying the statutory tax rate to the excess of pre-tax cash flow over our tax basis in the associated oil and gas properties. Tax credits and permanent differences are also considered in the future income tax calculation. Future net cash flow after income taxes is discounted using a 10% annual discount rate to arrive at the Standardized Measure.
The following summary sets forth our Standardized Measure:
(in thousands) |
| Year ended |
| Six months ended |
| ||
Cash inflows |
| $ | 1,407,871 |
| $ | 594,549 |
|
Production costs |
| (393,300 | ) | (198,304 | ) | ||
Development costs |
| (382,259 | ) | (113,531 | ) | ||
Income tax expense |
| (137,994 | ) | (51,408 | ) | ||
Net cash flow |
| 494,318 |
| 231,306 |
| ||
10% annual discount rate |
| (226,155 | ) | (115,759 | ) | ||
Standardized measure of discounted future net cash flow |
| $ | 268,163 |
| $ | 115,547 |
|
The following are the principal sources of change in the Standardized Measure:
(in thousands) |
| Year ended |
| Six months ended |
| ||
Standardized Measure, beginning of period |
| $ | 115,547 |
| $ | 137,285 |
|
Sales, net of production costs |
| (66,962 | ) | (13,642 | ) | ||
Net change in sales prices, net of production costs |
| 6,450 |
| (4,997 | ) | ||
Extensions and discoveries, net of future production and development costs |
| 182,267 |
| 41,481 |
| ||
Changes in future development costs |
| 16,222 |
| (3,565 | ) | ||
Previously estimated development costs incurred during the period |
| 13,854 |
| 33,714 |
| ||
Revision of quantity estimates |
| (33,809 | ) | (15,138 | ) | ||
Accretion of discount |
| 13,558 |
| 17,442 |
| ||
Change in income taxes |
| (48,786 | ) | 17,098 |
| ||
Purchases of reserves in-place |
| 131,043 |
| 7,626 |
| ||
Sales of reserves in-place |
| (36,935 | ) | (87,374 | ) | ||
Change in production rates and other |
| (24,286 | ) | (14,383 | ) | ||
Standardized Measure, end of period |
| $ | 268,163 |
| $ | 115,547 |
|
The following table provides a reconciliation of PV10 to the Standardized Measure:
(in thousands) |
| Year ended |
| Six months ended |
| ||
PV10 of proved reserves |
| $ | 336,984 |
| $ | 135,582 |
|
Present value of future income tax discounted at 10% |
| (68,821 | ) | (20,035 | ) | ||
Standardized Measure |
| $ | 268,163 |
| $ | 115,547 |
|
Impact of Pricing
The estimates of cash flows and reserve quantities shown above are based upon the unweighted average first-day-of-the-month prices. If future gas sales are covered by contracts at specified prices, the contract prices would be used. Fluctuations in prices are due to supply and demand and are beyond our control.
The following average prices were used in determining the Standardized Measure as at:
|
| Year ended |
| Six months ended |
| ||
Oil price per Bbl |
| $ | 94.55 |
| $ | 94.71 |
|
Gas price per Mcf |
| $ | 3.45 |
| $ | 2.75 |
|
NGL price per Bbl |
| $ | 28.78 |
| N/A |
| |
The Company calculates the projected income tax effect using the “year- by-year” method for purposes of the supplemental oil and gas disclosures.
Report of Independent Registered Public Accounting Firm
The Board of Directors and Shareholders of Sundance Energy Australia Limited
We have audited the accompanying consolidated statement of financial position of Sundance Energy Australia Limited as of December 31, 2012, and the related consolidated statements of profit or loss and other comprehensive income, changes in equity, and cash flows for the half year ended December 31, 2012. These financial statements are the responsibility of the Company’s management. Our responsibility is to express an opinion on these financial statements based on our audit.
We conducted our audit in accordance with the standards of the Public Company Accounting Oversight Board (United States). Those standards require that we plan and perform the audit to obtain reasonable assurance about whether the financial statements are free of material misstatement. We were not engaged to perform an audit of the Company’s internal control over financial reporting. Our audit included consideration of internal control over financial reporting as a basis for designing audit procedures that are appropriate in the circumstances, but not for the purpose of expressing an opinion on the effectiveness of the Company’s internal control over financial reporting. Accordingly, we express no such opinion. An audit also includes examining, on a test basis, evidence supporting the amounts and disclosures in the financial statements, assessing the accounting principles used and significant estimates made by management, and evaluating the overall financial statement presentation. We believe that our audit provides a reasonable basis for our opinion.
In our opinion, the financial statements referred to above present fairly, in all material respects, the consolidated financial position of Sundance Energy Australia Limited at December 31, 2012, and the consolidated results of its operations and its cash flows for the half year ended December 31, 2012, in conformity with International Financial Reporting Standards as issued by the International Accounting Standards Board.
/s/ Ernst & Young |
|
|
|
680 George Street |
|
Sydney NSW 2000 Australia |
|
GP Box 2646 Sydney NSW 2001 |
|
|
|
October 18, 2013 |
|
REPORT OF INDEPENDENT REGISTERED PUBLIC ACCOUNTING FIRM
Board of Directors and Shareholders
Sundance Energy Australia Limited
We have audited the accompanying consolidated statement of financial position of Sundance Energy Australia Limited and subsidiaries (the “Company”) as of June 30, 2012, and the related consolidated statements of profit or loss and other comprehensive income, changes in equity, and cash flows for the year ended June 30, 2012. These financial statements are the responsibility of the Company’s management. Our responsibility is to express an opinion on these financial statements based on our audits.
We conducted our audits in accordance with the standards of the Public Company Accounting Oversight Board (United States). Those standards require that we plan and perform the audit to obtain reasonable assurance about whether the financial statements are free of material misstatement. The Company is not required to have, nor were we engaged to perform an audit of its internal control over financial reporting. Our audits included consideration of internal control over financial reporting as a basis for designing audit procedures that are appropriate in the circumstances, but not for the purpose of expressing an opinion on the effectiveness of the Company’s internal control over financial reporting. Accordingly, we express no such opinion. An audit also includes examining, on a test basis, evidence supporting the amounts and disclosures in the financial statements, assessing the accounting principles used and significant estimates made by management, as well as evaluating the overall financial statement presentation. We believe that our audits provide a reasonable basis for our opinion.
In our opinion, the consolidated financial statements referred to above present fairly, in all material respects, the financial position of Sundance Energy Australia Limited and subsidiaries as of June 30, 2012, and the results of their operations and their cash flows for the year ended June 30, 2012, in conformity with International Financial Reporting Standards as issued by the International Accounting Standards Board.
/s/ GRANT THORNTON LLP |
|
|
|
707 17th Street |
|
Denver, Colorado 80202 |
|
|
|
October 18, 2013 |
|
SUNDANCE ENERGY AUSTRALIA LIMITED
CONSOLIDATED STATEMENT OF PROFIT OR LOSS AND OTHER COMPREHENSIVE INCOME
FOR THE SIX-MONTH PERIOD ENDED DECEMBER 31, 2012
|
|
|
| Consolidated Group |
| ||||
|
| Note |
| 6 months to |
| 12 months to |
| ||
Oil and gas sales revenue |
|
|
| $ | 17,724 |
| $ | 29,787 |
|
Lease operating and production expenses |
| 2 |
| (4,082 | ) | (6,355 | ) | ||
Depreciation and amortisation expense |
|
|
| (6,116 | ) | (11,111 | ) | ||
Employee benefits expense |
|
|
| (2,801 | ) | (4,318 | ) | ||
Administrative expense |
| 3 |
| (3,009 | ) | (2,545 | ) | ||
Interest received |
|
|
| 15 |
| 263 |
| ||
Finance costs |
| 18 |
| (593 | ) | (152 | ) | ||
Impairment of non-current assets |
|
|
| — |
| (357 | ) | ||
Gain on sale of non-current assets |
| 4 |
| 122,327 |
| 3,004 |
| ||
(Loss)/gain on commodity hedging |
|
|
| (639 | ) | 1,945 |
| ||
Realised currency (loss) |
|
|
| — |
| (4 | ) | ||
Profit before income tax |
|
|
| 122,826 |
| 10,157 |
| ||
Income tax expense |
| 5 |
| (46,616 | ) | (4,145 | ) | ||
Profit attributable to owners of the Company |
|
|
| 76,210 |
| 6,012 |
| ||
Other comprehensive income |
|
|
|
|
|
|
| ||
Items that may be reclassified subsequently to profit or loss: |
|
|
|
|
|
|
| ||
Exchange differences arising on translation of foreign operations (no income tax effect) |
|
|
| (154 | ) | (247 | ) | ||
Total comprehensive income attributable to owners of the Company |
|
|
| $ | 76,056 |
| $ | 5,765 |
|
Earnings per share |
|
|
|
|
|
|
| ||
Basic earnings |
| 8 |
| $ | 0.27 |
| $ | 0.02 |
|
Diluted earnings |
| 8 |
| $ | 0.27 |
| $ | 0.02 |
|
The accompanying notes are an integral part of these consolidated financial statements.
SUNDANCE ENERGY AUSTRALIA LIMITED
CONSOLIDATED STATEMENT OF FINANCIAL POSITION
AS AT DECEMBER 31, 2012
|
|
|
| Consolidated Group |
| ||||
|
| Note |
| 31 December 2012 |
| 30 June 2012 |
| ||
CURRENT ASSETS |
|
|
|
|
|
|
| ||
Cash and cash equivalents |
| 9 |
| $ | 154,110 |
| $ | 15,328 |
|
Trade and other receivables |
| 10 |
| 15,672 |
| 12,352 |
| ||
Derivative financial instruments |
| 11 |
| 617 |
| 1,331 |
| ||
Other current assets |
| 12 |
| 5,025 |
| 1,680 |
| ||
TOTAL CURRENT ASSETS |
|
|
| 175,424 |
| 30,691 |
| ||
NON-CURRENT ASSETS |
|
|
|
|
|
|
| ||
Development and production assets |
| 13 |
| 79,729 |
| 87,274 |
| ||
Exploration and evaluation expenditure |
| 14 |
| 33,439 |
| 11,436 |
| ||
Plant and equipment |
| 15 |
| 423 |
| 418 |
| ||
Derivative financial instruments |
| 11 |
| — |
| 476 |
| ||
Other non-current assets |
| 16 |
| 2,420 |
| 21 |
| ||
TOTAL NON-CURRENT ASSETS |
|
|
| 116,011 |
| 99,625 |
| ||
TOTAL ASSETS |
|
|
| $ | 291,435 |
| $ | 130,316 |
|
CURRENT LIABILITIES |
|
|
|
|
|
|
| ||
Trade and other payables |
| 17 |
| 38,770 |
| 22,056 |
| ||
Accrued expenses |
| 17 |
| 13,072 |
| 8,337 |
| ||
TOTAL CURRENT LIABILITIES |
|
|
| 51,842 |
| 30,393 |
| ||
NON-CURRENT LIABILITIES |
|
|
|
|
|
|
| ||
Credit facility, net of $430 and $345 of deferred financing fees, respectively |
| 18 |
| 29,570 |
| 14,655 |
| ||
Restoration provision |
| 19 |
| 1,228 |
| 588 |
| ||
Deferred tax liabilities |
| 20 |
| 56,979 |
| 10,476 |
| ||
TOTAL NON-CURRENT LIABILITIES |
|
|
| 87,777 |
| 25,719 |
| ||
TOTAL LIABILITIES |
|
|
| $ | 139,619 |
| $ | 56,112 |
|
NET ASSETS |
|
|
| $ | 151,816 |
| $ | 74,204 |
|
EQUITY |
|
|
|
|
|
|
| ||
Issued capital |
| 21 |
| $ | 58,694 |
| $ | 57,978 |
|
Share option reserve |
| 22 |
| 4,045 |
| 3,205 |
| ||
Foreign currency translation |
| 22 |
| (1,095 | ) | (941 | ) | ||
Retained earnings |
|
|
| 90,172 |
| 13,962 |
| ||
TOTAL EQUITY |
|
|
| $ | 151,816 |
| $ | 74,204 |
|
The accompanying notes are an integral part of these consolidated financial statements.
SUNDANCE ENERGY AUSTRALIA LIMITED
CONSOLIDATED STATEMENT OF CHANGES IN EQUITY
FOR THE SIX-MONTH PERIOD ENDED DECEMBER 31, 2012
Consolidated Group |
| Issued |
| Retained |
| Foreign |
| Share |
| Total |
| |||||
Balance at 30 June 2011 |
| $ | 57,831 |
| $ | 7,950 |
| $ | (694 | ) | $ | 2,380 |
| $ | 67,467 |
|
Shares issued during the year |
| 147 |
| — |
| — |
| — |
| 147 |
| |||||
Stock compensation, value of services |
| — |
| — |
| — |
| 825 |
| 825 |
| |||||
Profit attributable to owners of the Company |
| — |
| 6,012 |
| — |
| — |
| 6,012 |
| |||||
Other comprehensive loss for the year |
| — |
| — |
| (247 | ) | — |
| (247 | ) | |||||
Balance at 30 June 2012 |
| 57,978 |
| 13,962 |
| (941 | ) | 3,205 |
| 74,204 |
| |||||
Shares issued during the period |
| 716 |
| — |
| — |
| — |
| 716 |
| |||||
Stock compensation, value of services |
| — |
| — |
| — |
| 840 |
| 840 |
| |||||
Profit attributable to owners of the Company |
| — |
| 76,210 |
| — |
| — |
| 76,210 |
| |||||
Other comprehensive loss for the period |
| — |
| — |
| (154 | ) | — |
| (154 | ) | |||||
Balance at 31 December 2012 |
| $ | 58,694 |
| $ | 90,172 |
| $ | (1,095 | ) | $ | 4,045 |
| $ | 151,816 |
|
The accompanying notes are an integral part of these consolidated financial statements
SUNDANCE ENERGY AUSTRALIA LIMITED
CONSOLIDATED STATEMENT OF CASH FLOWS
FOR THE SIX-MONTH PERIOD ENDED DECEMBER 31, 2012
|
|
|
| Consolidated Group |
| ||||
|
| Note |
| 6 months to |
| 12 months to |
| ||
CASH FLOWS FROM OPERATING ACTIVITIES |
|
|
|
|
|
|
| ||
Receipts from sales |
|
|
| $ | 11,648 |
| $ | 20,987 |
|
Payments to suppliers and employees |
|
|
| (2,886 | ) | (8,900 | ) | ||
Interest received |
|
|
| 16 |
| 263 |
| ||
Derivative proceeds (payments) |
|
|
| 608 |
| (297 | ) | ||
Income taxes (paid)/refunded |
|
|
| — |
| (221 | ) | ||
NET CASH PROVIDED BY OPERATING ACTIVITIES |
| 26 |
| 9,386 |
| 11,832 |
| ||
CASH FLOWS FROM INVESTING ACTIVITIES |
|
|
|
|
|
|
| ||
Payments for development expenditure |
|
|
| (32,551 | ) | (34,833 | ) | ||
Payments for exploration expenditure |
|
|
| (8,031 | ) | (5,685 | ) | ||
Payments for acquisition of oil and gas properties |
|
|
| (11,470 | ) | — |
| ||
Sale of non-current assets |
|
|
| 173,822 |
| 4,679 |
| ||
Transaction costs related to sale of non-current assets |
|
|
| (862 | ) | — |
| ||
Payments to establish escrow related to acquisition |
|
|
| (6,230 | ) | — |
| ||
Payments for plant and equipment |
|
|
| (107 | ) | (310 | ) | ||
NET CASH (USED IN) INVESTING ACTIVITIES |
|
|
| 114,571 |
| (36,149 | ) | ||
CASH FLOWS FROM FINANCING ACTIVITIES |
|
|
|
|
|
|
| ||
Proceeds from the issue of shares |
|
|
| 716 |
| 147 |
| ||
Payments for acquisition related costs |
|
|
| (192 | ) | — |
| ||
Borrowing costs, including capitalised financing fees |
|
|
| (678 | ) | (408 | ) | ||
Proceeds from borrowings |
|
|
| 45,000 |
| 15,000 |
| ||
Payments of borrowings |
|
|
| (30,000 | ) | — |
| ||
Realised currency (loss) |
|
|
| — |
| (5 | ) | ||
NET CASH PROVIDED BY FINANCING ACTIVITIES |
|
|
| 14,846 |
| 14,734 |
| ||
Net (decrease)/increase in cash held |
|
|
| 138,803 |
| (9,583 | ) | ||
Cash at beginning of period |
|
|
| 15,328 |
| 25,244 |
| ||
Effect of exchange rates on cash |
|
|
| (21 | ) | (333 | ) | ||
CASH AT END OF PERIOD |
| 9 |
| $ | 154,110 |
| $ | 15,328 |
|
The accompanying notes are an integral part of these consolidated financial statements.
SUNDANCE ENERGY AUSTRALIA LIMITED
NOTES TO THE CONSOLIDATED FINANCIAL STATEMENTS
FOR DECEMBER 31, 2012 AND
THE SIX-MONTH PERIOD THEN ENDED
NOTE 1—STATEMENT OF SIGNIFICANT ACCOUNTING POLICIES
The financial report includes the consolidated financial statements and notes of Sundance Energy Australia Limited (SEAL) and its wholly owned subsidiary, Sundance Energy, Inc. (collectively, the ‘Company,’ ‘Consolidated Group’ or ‘Group’).
Basis of Preparation
The financial report is a general purpose financial report that has been prepared in accordance with Australian Accounting Standards, Australian Accounting Interpretations, other authoritative pronouncements of the Australian Accounting Standards Board (AASB) and the Corporations Act 2001.
These consolidated financial statements comply with International Financial Reporting Standards (IFRS) as issued by the International Accounting Standards Board (IASB). Material accounting policies adopted in the preparation of this financial report are presented below. They have been consistently applied unless otherwise stated.
Change in reporting period
Effective 1 July 2012, the Company changed its financial year end from 30 June to 31 December. This change resulted in the current reporting period being a six-month period. The six-month period ended 31 December 2012 is a shorter reporting period than that of the year ended 30 June 2012, which is the previous reporting period shown in these financial statements; therefore, the amounts presented in the financial statements are not entirely comparable.
Change in presentation currency
The Group’s cash flows and economic returns are principally denominated in US Dollars. From 1 July 2011, SEAL changed the currency in which it presents its consolidated and parent Company Financial Statements from Australian Dollars to US Dollars.
Principles of Consolidation
A controlled entity is any entity over which SEAL has the power to govern the financial and operating policies so as to obtain benefits from its activities. In assessing the power to govern, the existence and effect of holdings of actual and potential voting rights are considered. The consolidated financial statements incorporate the assets and liabilities of all entities controlled by SEAL as at 31 December 2012 and the results of all controlled entities for the financial period then ended.
All inter-group balances and transactions between entities in the Group, including any recognised profits or losses, have been eliminated on consolidation.
a) Income Tax
The income tax expense for the period comprises current income tax expense/(income) and deferred tax expense/(income).
Current income tax expense charged to the statement of profit or loss is the tax payable on taxable income calculated using applicable income tax rates enacted, or substantially enacted, as at the reporting date. Current tax liabilities/(assets) are therefore measured at the amounts expected to be paid to/(recovered from) the relevant taxation authority.
Deferred income tax expense reflects movements in deferred tax asset and deferred tax liability balances during the period as well as unused tax losses. Current and deferred income tax expense/(income) is charged or credited directly to equity instead of the statement of profit or loss when the tax relates to items that are credited or charged directly to equity.
Deferred tax assets and liabilities are ascertained based on temporary differences arising between the tax bases of assets and liabilities and their carrying amounts in the financial statements. Deferred tax assets also result where amounts have been fully expensed but future tax deductions are available. No deferred income tax will be recognised from the initial recognition of an asset or liability, excluding a business combination, where there is no effect on accounting or taxable profit or loss.
Deferred tax assets and liabilities are calculated at the tax rates that are expected to apply to the period when the asset recognised or the liability is settled, based on tax rates enacted or substantively enacted at the reporting date. Their measurement also reflects the manner in which management expects to recover or settle the carrying amount of the related asset or liability.
Deferred tax assets relating to temporary differences and unused tax losses are recognised only to the extent that it is probable that future taxable profit will be available against which the benefits of the deferred tax asset can be utilised.
Where temporary differences exist in relation to investments in subsidiaries, branches, associates, and joint ventures, deferred tax assets and liabilities are not recognised where the timing of the reversal of the temporary difference can be controlled and it is not probable that the reversal will occur in the foreseeable future.
Current tax assets and liabilities are offset where a legally enforceable right of set-off exists and it is intended that net settlement or simultaneous realisation and settlement of the respective asset and liability will occur. Deferred tax assets and liabilities are offset where a legally enforceable right of set-off exists, the deferred tax assets and liabilities relate to income taxes levied by the same taxation authority on either the same taxable entity or different taxable entities where it is intended that net settlement or simultaneous realisation and settlement of the respective asset and liability will occur in future periods in which significant amounts of deferred tax assets or liabilities are expected to be recovered or settled.
b) Development Assets and Plant and Equipment
Development assets and plant and equipment are carried at cost less where applicable, any accumulated depreciation, amortisation and impairment losses. The initial measurement of development and production assets subject to depreciation and amortisation include developed leasehold costs, intangible and tangible drilling and completion costs, allocated drilling overhead, capitalised finance costs and the estimated fair value of restoration provisions as at the date of each wells’ initial production. The initial measurement of development and production assets not subject to depreciation and amoritsation include similar costs of wells that have not had initial production as at the date of the statement of financial position. The initial measurement of plant and equipment assets include primarily office and computer equipment.
The carrying amount of development assets and plant and equipment are reviewed semi-annually to ensure that they are not in excess of the recoverable amount from these assets. The recoverable amount is assessed on the basis of the expected net cash flows that will be received from the assets employment and subsequent disposal. The expected net cash flows have been discounted to their present values in determining recoverable amounts.
Subsequent costs are included in the asset’s carrying amount or recognised as a separate asset, as appropriate, only when it is probable that future economic benefits associated with the item will flow to the group and the cost of the item can be measured reliably. All other repairs and maintenance are charged to the statement of profit or loss during the financial period in which are they are incurred.
Depreciation / Amortisation
Fixed assets are depreciated on a straight-line basis over their useful lives from the time the asset is held and ready for use. Leasehold improvements are depreciated over the shorter of either the unexpired period of the lease or the estimated useful life of the improvement.
The depreciation rates used for each class of depreciable assets are:
Class of Non-Current |
| Asset Depreciation |
| Rate Basis of Depreciation |
|
Plant and Equipment |
| 10 - 33 | % | Straight Line |
|
The Group uses the units of production method to amortise costs carried forward in relation to its development assets. For this approach, the calculation is based upon proved developed reserves.
The assets’ residual values and useful lives are reviewed, and adjusted if appropriate, at the end of each reporting period. An asset’s carrying amount is written down immediately to its recoverable amount if the asset’s carrying amount is greater than its estimated recoverable amount.
Gains and losses on disposals are determined by comparing proceeds with the carrying amount. These gains and losses are included in the statement of profit or loss.
c) Exploration and Evaluation Expenditure
Exploration and evaluation expenditure incurred is accumulated in respect of each identifiable area of interest. The initial measurement of these costs include the acquisition of rights to explore and mineral rights, various topographical, geological, geochemical and geophysical studies and other expenditures associated with finding specific mineral resources. These costs are only carried forward to the extent that they are expected to be recouped through the successful development of the area or where activities in the area have not yet reached a stage that permits reasonable assessment of the existence of economically recoverable reserves.
Accumulated costs in relation to an abandoned area are written off in full against profit in the year in which the decision to abandon the area is made.
When production commences, the accumulated costs for the relevant area of interest are transferred to production assets and amortised over the life of the area according to the rate of depletion of the economically recoverable reserves.
A regular review is undertaken of each area of interest to determine the appropriateness of continuing to carry forward costs in relation to that area of interest.
d) Leases
Leases of fixed assets where substantially all the risks and benefits incidental to the ownership of the asset, but not the legal ownership that are transferred to entities in the consolidated group, are classified as finance leases.
Finance leases are capitalised by recording an asset and a liability at the lower of the amounts equal to the fair value of the leased property or the present value of the minimum lease payments, including any guaranteed residual values. Lease payments are allocated between the reduction of the lease liability and the lease interest expense for the period.
Leased assets are depreciated on a straight-line basis over the shorter of their estimated useful lives or the lease term. Lease payments for operating leases, where substantially all the risks and benefits remain with the lessor, are charged as expenses in the periods in which they are incurred.
Lease incentives under operating leases are recognised as a liability and amortised on a straight-line basis over the life of the lease term.
e) Financial Instruments
Recognition and Initial Measurement
Financial instruments, incorporating financial assets and financial liabilities, are recognised when the entity becomes a party to the contractual provisions of the instrument. Trade date accounting is adopted for financial assets that are delivered within timeframes established by marketplace convention.
Financial instruments are initially measured at fair value plus transactions costs where the instrument is not classified as at fair value through profit or loss. Transaction costs related to instruments classified at fair value through profit or loss are expensed to profit or loss immediately. Financial instruments are classified and measured as set out below.
Derivative Financial Instruments
The Group uses derivative financial instruments to hedge its exposure to changes in commodity prices arising in the normal course of business. The principal derivatives that may be used are commodity crude oil price swap, option, and costless collar contracts. Their use is subject to policies and procedures as approved by the Board of Directors. The Group does not trade in derivative financial instruments for speculative purposes. Derivative financial instruments are initially recognised at cost, which approximates fair value. Subsequent to initial recognition, derivate financial instruments are recognised at fair value. The derivatives are valued on a mark to market valuation and the gain or loss on re-measurement to fair value is recognised through the statement of comprehensive income.
Derecognition
Financial assets are derecognised when the contractual right to receipt of cash flows expires or the asset is transferred to another party whereby the entity no longer has any significant continuing involvement in the risks and benefits associated with the asset. Financial liabilities are derecognised when the related obligations are either discharged, cancelled or expire. The difference between the carrying value of the financial liability extinguished or transferred to another party and the fair value of consideration paid, including the transfer of non-cash assets or liabilities assumed, is recognised in profit or loss.
i) Financial assets at fair value through profit or loss
Financial assets are classified at fair value through profit or loss when they are held for trading for the purpose of short term profit taking, when they are derivatives not held for hedging purposes, or designated as such to avoid an accounting mismatch or to enable performance evaluation where a group of financial assets is managed by key management personnel on a fair value basis in accordance with a documented risk management or investment strategy. Realised and unrealised gains and losses arising from changes in fair value are included in profit or loss in the period in which they arise.
ii) Loans and receivables
Loans and receivables are non-derivative financial assets with fixed or determinable payments that are not quoted in an active market and are subsequently measured at amortised cost using the effective interest rate method.
iii) Held-to-maturity investments
Held-to-maturity investments are non-derivative financial assets that have fixed maturities and fixed or determinable payments, and it is the Group’s intention to hold these investments to maturity. They are subsequently measured at amortised cost using the effective interest rate method.
iv) Available-for-sale financial assets
Available-for-sale financial assets are non-derivative financial assets that are either designated as such or that are not classified in any of the other categories. They comprise investments in the equity of other entities where there is neither a fixed maturity nor fixed determinable payments.
v) Financial liabilities
Non-derivative financial liabilities (excluding financial guarantees) are subsequently measured at amortised cost using the effective interest rate method.
f) Impairment of Non-Financial Assets
At each reporting date, the group reviews the carrying values of its tangible and intangible assets to determine whether there is any indication that those assets have been impaired. If such an indication exists, the recoverable amount of the asset, being the higher of the asset’s fair value less costs to sell and value in use, is compared to the asset’s carrying value. Any excess of the asset’s carrying value over its recoverable amount is expensed to the statement of comprehensive income.
Impairment testing is performed annually for intangible assets with indefinite lives.
Where it is not possible to estimate the recoverable amount of an individual asset, the Group estimates the recoverable amount of the cash-generating unit to which the asset belongs.
g) Foreign Currency Transactions and Balances
Functional and presentation currency
The functional currency of each of the Group’s entities is measured using the currency of the primary economic environment in which that entity operates. The consolidated financial statements are presented in US dollars.
Transactions and Balances
Foreign currency transactions are translated into functional currency using the exchange rates prevailing at the date of the transaction. Foreign currency monetary items are translated at the year-end exchange rate. Non-monetary items measured at historical cost continue to be carried at the exchange rate at the date of the transaction. Non-monetary items measured at fair value are reported at the exchange rate at the date when fair values were determined.
Exchange differences arising on the translation of non-monetary items are recognised directly in equity to the extent that the gain or loss is directly recognised in equity, otherwise the exchange difference is recognised in the income statement of comprehensive income.
Group Companies
The financial results and position of foreign operations whose functional currency is different from the Group’s presentation currency are translated as follows:
· assets and liabilities are translated at year-end exchange rates prevailing at that reporting date;
· income and expenses are translated at average exchange rates for the period; and
· retained profits are translated at the exchange rates prevailing at the date of the transaction.
Exchange differences arising on translation of foreign operations are transferred directly to the Group’s foreign currency translation reserve in the statement of comprehensive income. These differences are recognised in the statement of comprehensive income in the period in which the operation is disposed.
h) Employee Benefits
Provision is made for the Group’s liability for employee benefits arising from services rendered by employees to balance date. Employee benefits that are expected to be settled within one year have been measured at the amounts expected to be paid when the liability is settled, plus related on-costs. Employee benefits payable later than one year have been measured at the present value of the estimated future cash outflows to be made for these benefits. Those cash flows are discounted using market yields on national government bonds with terms to maturity that match the expected timing of cash flows.
Equity—Settled Compensation
The Group has an employee share option plan. The fair value of the options awarded are amortised as an expense in the statement of comprehensive income over their performance period. The total amount to be expensed over the vesting period is determined by reference to the fair value of the options at the grant date.
Restricted Share Unit Plan
The group has a restricted share unit plan (RSU) to motivate management and employees to make decisions benefiting long-term value creation, retain management and employees and reward the achievement of the Group’s long-term goals. The RSUs are based on targets established and approved by the Board. Actual RSUs, awarded annually, are modified according to actual results and vest in four equal tranches beginning on the grant date.
i) Provisions
Provisions are recognised when the group has a legal or constructive obligation, as a result of past events, for which it is probable that an outflow of economic benefits will result and that outflow can be reliably measured.
j) Cash and Cash Equivalents
Cash and cash equivalents include cash on hand, deposits held at call with banks, other short-term highly liquid investments with original maturities of three months or less, unrestricted escrow accounts that management expects to be used to settle current liabilities, capital or operating expenditures, or complete acquisitions and bank overdrafts.
k) Revenue
Revenue from the sale of goods is recognised upon the delivery of goods to customer. Interest revenue is recognised on a proportional basis taking into account the interest rates applicable to the financial assets.
Revenue from the rendering of a service is recognised upon the delivery of the service to the customers. All revenue is stated net of the amount of goods and services tax (GST).
l) Borrowing Costs
Borrowing costs directly attributable to the acquisition, construction or production of assets that necessarily take a substantial period of time to prepare for their intended use or sale are added to the cost of those assets until such time as the assets are substantially ready for their intended use or sale. Borrowings are recognised initially at fair value, net of transaction costs incurred. Subsequent to initial recognition, borrowings are stated as amortised cost with any difference between cost and redemption being recognised in the statement of profit or loss and other comprehensive income over the period of the borrowings on an effective interest basis. No borrowing costs were capitalised in the six month period and year ended 31 December 2012 and 30 June 2012.
All other borrowing costs are recognised in income in the period in which they are incurred.
m) Goods and Services Tax (GST)
Revenues, expenses and assets are recognised net of the amount of GST, except where the amount of GST incurred is not recoverable from the Australian Tax Office. In these circumstances the GST is recognised as part of the cost of acquisition of the asset or as part of an item of the expense. Receivables and payables in the statement of financial position are shown inclusive of GST.
Cash flows are presented in the statement of cash flows on a gross basis, except for the GST component of investing and financing activities, which are disclosed as operating cash flows.
n) Critical Accounting Estimates and Judgments
The Directors evaluate estimates and judgments incorporated into the financial report based on historical knowledge and best available current information. Estimates assume a reasonable expectation of future events and are based on current trends and economic data obtained both externally and within the Group.
Key estimates
Estimates of reserve quantities
The estimated quantities of hydrocarbon reserves reported by the consolidated entity are integral to the calculation of amortisation (depletion), depreciation expense and to assessments of possible impairment of assets. Estimated reserve quantities are based upon interpretations of geological and geophysical models and assessment of the technical feasibility and commercial viability of producing the reserves. For purposes of the calculation of amortization (depletion), and depreciation and the assessment of possible impairment of assets, management prepares reserve estimates which conform to the definitions contained in Rule 4-10(a) of Regulation S-X. These assessments require assumptions to be made regarding future development and production costs, commodity prices, exchange rates and fiscal regimes. The estimates of reserves may change from period to period as the economic assumptions used to estimate the reserves can change from period to period, and as additional geological data is generated during the course of operations. These reserve estimates may differ from estimates prepared in accordance with the rules and regulations of the Securities and Exchange Commission (“SEC”) regarding oil and natural gas reserve reporting including those presented in Note 33.
Exploration and Evaluation
The Company’s policy for exploration and evaluation is discussed in Note 1 (c). The application of this policy requires the Company to make certain estimates and assumptions as to future events and circumstances. Any such estimates and assumptions may change as new information becomes available. If, after having capitalised exploration and evaluation expenditure, the directors conclude that the capitalised expenditure is unlikely to be recovered by future sale or exploitation, then the relevant capitalised amount will be written off through the statement of comprehensive income.
Restoration Provision
A provision for rehabilitation and restoration is provided by the Group to meet all future obligations for the restoration and rehabilitation of oil and gas producing areas when oil and gas reserves are exhausted and the oil and gas fields are abandoned. Restoration liabilities are discounted to present value and capitalised as a component part of capitalised development expenditure. The capitalised costs are amortised over the life of the assets and the provision is revised at each balance date through the statement of profit or loss as the discounting of the liability unwinds.
o) Change in Accounting Estimate
The same accounting policies and methods of computation have been followed in this financial report as were applied in the 30 June 2012 financial statements.
p) Reclassifications
Certain reclassifications have been made to the prior year financial statements and associated notes to the financial statements to conform to the current year presentation.
q) Rounding of amounts
The company is of a kind referred to in Class Order 98/100 issued by the Australian Securities and Investment Commission, relating to rounding of amounts in the financial statements. Amounts have been rounded to the nearest thousand.
r) Parent Entity Financial Information
The financial information for the parent entity, SEAL, discussed in Note 32, has been prepared on the same basis, using the same accounting policies as the consolidated financial statements.
s) Earnings Per Share
The group presents basic and diluted earnings per share for its ordinary shares. Basic earnings per share is calculated by dividing the profit or loss attributable to ordinary shareholders of the Company by the weighted average number of ordinary shares outstanding during the year. Diluted earnings per share is determined by adjusting the profit or loss attributable to
ordinary shareholders and the weighted average number of ordinary shares for the dilutive effect, if any, of outstanding share rights and share options which have been issued to employees.
t) Adoption of New and Revised Accounting Standards
During the current reporting period the Group adopted all of the new and revised International Accounting Standards and Australia Accounting Standards and Interpretations applicable to its operations which became mandatory.
AASB 2011-9 Amendments to Australian Accounting Standards Presentation of Items of Other Comprehensive Income (IAS 1 Amendments)
The IAS 1 Amendments require an entity to group items presented in other comprehensive income into those that, in accordance with other IFRSs: (a) will not be reclassified subsequently to profit or loss and (b) will be reclassified subsequently to profit or loss when specific conditions are met. It is applicable for reporting periods beginning on or after 1 July 2012. The Group’s management adopted this change in the current presentation of items in other comprehensive income. This adoption did not affect the measurement or recognition of such items.
Recently issued accounting standards to be applied in future reporting periods:
The following Standards and Interpretations are effective for annual periods beginning on or after 1 January 2013 and have not been applied in preparing these consolidated financial statements. The Group’s assessment of the impact of these new standards, amendments to standards, and interpretations is set out below.
IFRS 9—Financial Instruments
IFRS 9 introduces new requirements for the classification, measurement, and derecognition of financial assets and financial liabilities. IFRS 9 is effective for annual periods beginning on or after 1 January 2015, and is available for early adoption.
IFRS 10—Consolidated Financial Statements
IFRS 10 replaces the guidance on control and consolidation in IAS 27— Consolidated and Separate Financial Statements and Interpretation 12—Consolidation—Special Purpose Entities. IFRS 10 includes a new definition of control that focuses on the need to have both power and rights or exposure to variable returns.
IFRS 13—Fair Value Measurement
IFRS 13 establishes a single source of guidance for fair value measurements and disclosures. The standard defines fair value, establishes a framework for measuring fair value, and requires more extensive disclosures than current standards. IFRS 13 is effective for annual periods beginning on or after 1 January 2013.
AASB 2011-4 Amendments to Australian Accounting Standards to Remove Individual Key Management Personnel Disclosure
This standard removes the requirements to include individual key management personnel disclosures in the notes to and forming part of the Financial Report. AASB 2011-4 is effective for annual periods beginning on or after 1 July 2013.
AASB 2012-5 Amendments to Australian Accounting Standards arising from Annual Improvements 2009-2011 Cycle
AASB 2012-5 makes amendments to several Australian Accounting Standards. These amendments primarily relate to clarification of narrative requirements for comparative information and segment disclosures for interim financial reports. AASB 2012-5 is effective for annual periods beginning on or after 1 January 2013.
The potential effect of these Standards is yet to be fully determined. However, it is not expected that the new or amended standards will significantly affect the Group’s financial position or performance.
The financial report was authorised for issue on 28 March 2013, by the Board of Directors.
NOTE 2—LEASE OPERATING AND PRODUCTION EXPENSES
|
| Consolidated Group |
| ||||
|
| 6 months to |
| 12 months to |
| ||
Lease operating expense |
| $ | (1,908 | ) | $ | (2,921 | ) |
Workover expense |
| (287 | ) | (180 | ) | ||
Production taxes |
| (1,887 | ) | (3,254 | ) | ||
|
| $ | (4,082 | ) | $ | (6,355 | ) |
NOTE 3—ADMINISTRATIVE EXPENSES
|
| Consolidated Group |
| ||||
|
| 6 months to |
| 12 months to |
| ||
Accounting and company secretarial |
| $ | (150 | ) | $ | (271 | ) |
Acquisition and merger related fees |
| (713 | ) | — |
| ||
Audit fees |
| (145 | ) | (51 | ) | ||
Professional fees |
| (929 | ) | (789 | ) | ||
Travel |
| (280 | ) | (390 | ) | ||
Rent |
| (181 | ) | (287 | ) | ||
Share registry and listing fees |
| (75 | ) | (122 | ) | ||
Other expenses |
| (536 | ) | (635 | ) | ||
|
| $ | (3,009 | ) | $ | (2,545 | ) |
NOTE 4—GAIN ON SALE OF NON-CURRENT ASSETS
On 27 September 2012, the Company sold all of its interest in properties located in the South Antelope field for $172.4 million. Prior to the disposition, the South Antelope development and production properties were part of the Williston Basin depletion base. To determine the carrying costs of the sold properties, the Company used the relative fair value of South Antelope proved developed reserves as compared to the Company’s total proved developed reserves in the Williston Basin. As a result, it was determined that approximately $49.4 million of the Company’s carrying costs related to its South Antelope development and production properties at the time of the disposal. In addition to the South Antelope development and production properties, the Purchaser acquired approximately $3.9 million of assets and assumed approximately $3.8 million of liabilities, which were removed from the Company’s statement of financial position at the time of the sale. The Company incurred approximately $0.9 million of legal and other transaction related costs. This sale resulted in a gain of $122.5 million. The Company also sold all of its properties in the Pawnee prospect for $0.9 million of proceeds, which resulted in a loss of $0.2 million. Both the South Antelope gain and the Pawnee loss on sale are included in the gain on sale of non-current assets in the statement of profit or loss and other comprehensive income for the six month period ended 31 December 2012.
The Company elected to apply Section 1031 “like-kind exchange” treatment of the South Antelope sales proceeds under the US tax rules which allow deferral of the gain if the proceeds are used to acquire “like-kind property” within six months of the closing date of the transaction. In addition, the US tax rules allow the deduction of all intangible drilling costs (“IDCs”) in the period incurred. As at 31 December 2012, the Company expected to defer the majority of the taxable gain on the sale by acquiring qualified replacement properties or utilising IDCs from its development program. In March 2013, the Company completed a transaction in which the majority of the funds remaining in its Section 1031 escrow account were used to acquire oil and gas properties in connection with the Texon Scheme of Arrangement transaction discussed in more detail in Note 29. Management believes the properties acquired qualify as “like-kind property” under Section 1031 which will result in deferral of the majority of the gain associated with the South Antelope sale.
NOTE 5—INCOME TAX EXPENSE
|
|
| Consolidated Group |
| ||||
|
|
| 6 months to |
| 12 months to |
| ||
a) | The components of income tax expense comprise: |
|
|
|
|
| ||
| Current tax benefit/(expense) |
| $ | (11 | ) | $ | 242 |
|
| Deferred tax expense |
| (46,605 | ) | (4,387 | ) | ||
|
|
| $ | (46,616 | ) | $ | (4,145 | ) |
b) | The prima facie tax on income from ordinary activities before income tax is reconciled to the income tax as follows: |
|
|
|
|
| ||
| Profit before income tax |
| $ | 122,826 |
| $ | 10,157 |
|
| Prima facie tax expense on income from ordinary activities before income tax at 30% |
| $ | 36,848 |
| $ | 3,047 |
|
| Add: |
|
|
|
|
| ||
| Tax effect of: |
|
|
|
|
| ||
| —difference of tax rate in US controlled entities |
| 9,417 |
| 862 |
| ||
| —employee options |
| 44 |
| 276 |
| ||
| —other allowable items |
| 93 |
| 4 |
| ||
| —previously unrecognised tax gains used to (reduce)/increase current tax expense |
| — |
| (139 | ) | ||
| —previously unrecognised tax losses used to (reduce)/increase current tax expense |
| — |
| — |
| ||
| —Acquisition related costs |
| 214 |
| — |
| ||
| —Deferred tax assets associated with capital raising costs recognised direct to equity but not meeting the recognition criteria |
| — |
| 95 |
| ||
| Income tax attributable to entity |
| $ | 46,616 |
| $ | 4,145 |
|
c) | Unused tax losses and temporary differences for which no deferred tax asset has been recognised at 30% |
| $ | 375 |
| $ | 375 |
|
At December 31, 2012 the Company had U.S. federal and state net operating loss carryforwards for tax purposes of approximately $58.8 million and $54.5 million, respectively which will expire in 2030 through 2032. We believe that it is more likely than not that the carryforward will be utilized before it expires.
NOTE 6—KEY MANAGEMENT PERSONNEL COMPENSATION
a) Names and positions held of Consolidated Group key management personnel in office at any time during the financial period are:
Mr M Hannell |
| Chairman Non-executive |
Mr E McCrady |
| Chief Executive Officer & Managing Director |
Mr D Hannes |
| Director—Non-executive |
Mr N Martin |
| Director—Non-executive |
Mr W Holcombe |
| Director—Non-executive (appointed as Director on 19 December 2012) |
Mr A Hunter III |
| Director—Executive (resigned as a Director on 13 July 2012) |
Ms C Anderson |
| Chief Financial Officer |
Mr C Gooden |
| Company Secretary |
Other than employees of the Company listed above, there are no additional key management personnel.
b) Key Management Personnel Compensation
Refer to the Remuneration Report contained in the Report of Directors’ for details of the remuneration paid or payable to each member of the Group’s key management personnel (KMP) for the six month period ended 31 December 2012 and year ended 30 June 2012.
The total of remuneration paid to KMP of the Group during the year is as follows:
|
| Consolidated Group |
| ||||
|
| 6 months to |
| 12 months to |
| ||
Short term wages and benefits |
| $ | 695 |
| $ | 1,389 |
|
Equity settled-options based payments |
| 262 |
| 496 |
| ||
Post-employment benefit |
| 17 |
| 31 |
| ||
|
| $ | 974 |
| $ | 1,916 |
|
c) Options Granted as Compensation
Options granted as compensation were zero ($nil fair value) and 1,000,000 ($0.2 million fair value) during the six month period and year ended 31 December and 30 June 2012, respectively, to KMP from the Sundance Energy Employee Stock Option Plan. Options generally vest in five equal tranches of 20% on the grant date and each of the four subsequent anniversaries of the grant date.
d) Restricted Share Units Granted as Compensation
Restricted share units (RSUs) awarded as compensation were 669,642 ($0.5 million fair value) and 776,000 ($0.3 million fair value) during the six month period and year ended 31 December and 30 June 2012, respectively, to KMP from the Sundance Energy Long Term Incentive Plan. RSUs generally vest in four equal tranches of 25% on the grant date and each of the three subsequent anniversaries of the grant date.
NOTE 7—AUDITORS’ REMUNERATION
|
| Consolidated Group |
| ||||
|
| 6 months to |
| 12 months to |
| ||
Remuneration of the auditor for: |
|
|
|
|
| ||
Auditing or review of the financial report |
| $ | 131 |
| $ | 90 |
|
Non-audit services related to Texon acquisition |
| 148 |
| — |
| ||
Taxation services provided by the practice of auditor |
| 14 |
| 13 |
| ||
Total remuneration of the auditor |
| $ | 293 |
| $ | 103 |
|
NOTE 8—EARNINGS PER SHARE (EPS)
|
| Consolidated Group |
| ||||
|
| 6 months to |
| 12 months to |
| ||
Profit for periods used to calculate basic and diluted EPS |
| $ | 76,210 |
| $ | 6,012 |
|
|
| Number of |
| Number of |
|
—Weighted average number of ordinary shares outstanding during the year used in calculation of basic EPS |
| 277,244,883 |
| 277,049,463 |
|
—Incremental shares related to options and restricted share units |
| 2,896,496 |
| 1,900,976 |
|
—Weighted average number of ordinary shares outstanding during the year used in calculation of diluted EPS |
| 280,141,379 |
| 278,950,439 |
|
NOTE 9—CASH AND CASH EQUIVALENTS
|
| Consolidated Group |
| ||||
|
| 31 December 2012 |
| 30 June 2012 |
| ||
Cash at bank and on hand |
| $ | 12,747 |
| $ | 14,353 |
|
Cash equivalents in escrow accounts |
| 141,363 |
| — |
| ||
Short term deposits |
| — |
| 975 |
| ||
|
| $ | 154,110 |
| $ | 15,328 |
|
Included in cash equivalents, the Company has approximately $141.4 million in a Section 1031 escrow account which is not limited in use, except that the timing of tax payments will be accelerated if not used on qualified “like- kind property.” As such, the balance has been included in the Company’s cash and cash equivalents in the statement of financial position and statement of cash flows as at 31 December 2012 and for the six month period then ended.
For the year ended 30 June 2012, the effective interest rate on short term bank deposits was 1.5% for the Group. 94% of deposits were at 24 hours call and the balance of deposits has an average maturity of 49 days. The Groups’ exposure to interest rate risk is summarised at Note 31.
NOTE 10—TRADE AND OTHER RECEIVABLES
|
| Consolidated Group |
| ||||
|
| 31 December 2012 |
| 30 June 2012 |
| ||
Oil and gas sales |
| $ | 11,376 |
| $ | 8,244 |
|
Trade receivables |
| 4,185 |
| 3,940 |
| ||
Other |
| 111 |
| 168 |
| ||
|
| $ | 15,672 |
| $ | 12,352 |
|
At 31 December and 30 June 2012, the Group had receivable balances of $8.6 million and $6.7 million, respectively, which were outside normal trading terms (the receivable was past due but not impaired). Due to the short term nature of these receivables, their carrying amounts are assumed to approximate their fair value.
NOTE 11—DERIVATIVE FINANCIAL INSTRUMENTS
|
| Consolidated Group |
| ||||
|
| 6 months to |
| 12 months to |
| ||
FINANCIAL ASSETS COMPRISE: |
|
|
|
|
| ||
Current |
|
|
|
|
| ||
Derivative financial instruments—commodity contracts |
| $ | 617 |
| $ | 1,331 |
|
Non-current |
|
|
|
|
| ||
Derivative financial instruments—commodity contracts |
| — |
| 476 |
| ||
Total financial assets |
| $ | 617 |
| $ | 1,807 |
|
FINANCIAL LIABILITIES COMPRISE: |
|
|
|
|
| ||
Current |
|
|
|
|
| ||
Derivative financial instruments—commodity contracts |
| $ | — |
| $ | — |
|
Non-current |
|
|
|
|
| ||
Derivative financial instruments—commodity contracts |
| — |
| — |
| ||
Total financial liabilities |
| $ | — |
| $ | — |
|
The following table presents financial assets and liabilities measured at fair value in the statement of financial position in accordance with the fair value hierarchy. This hierarchy groups financial assets and liabilities into three levels based on the significance of inputs used in measuring the fair value of the financial assets and liabilities. The fair value hierarchy has the following levels:
Level 1: |
| quoted prices (unadjusted) in active markets for identical assets or liabilities; |
Level 2: |
| inputs other than quoted prices included within Level 1 that are observable for the asset or liability, either directly (i.e. as prices) or indirectly (i.e. derived from prices); and |
Level 3: |
| inputs for the asset or liability that are not based on observable market data (unobservable inputs). |
The Level within which the financial asset or liability is classified is determined based on the lowest level of significant input to the fair value measurement. The financial assets and liabilities measured at fair value in the statement of financial position are grouped into the fair value hierarchy as follows.
Consolidated 31 December 2012 |
| Level 1 |
| Level 2 |
| Level 3 |
| Total |
| ||||
Assets |
|
|
|
|
|
|
|
|
| ||||
Derivative financial instruments |
| $ | — |
| $ | 617 |
| $ | — |
| $ | 617 |
|
Liabilities |
|
|
|
|
|
|
|
|
| ||||
Derivative financial instruments |
| — |
| — |
| — |
| — |
| ||||
Net fair value |
| $ | — |
| $ | 617 |
| $ | — |
| $ | 617 |
|
Consolidated 30 June 2012 |
| Level 1 |
| Level 2 |
| Level 3 |
| Total |
| ||||
Assets |
|
|
|
|
|
|
|
|
| ||||
Derivative financial instruments |
| $ | — |
| $ | 1,807 |
| $ | — |
| $ | 1,807 |
|
Liabilities |
|
|
|
|
|
|
|
|
| ||||
Derivative financial instruments |
| — |
| — |
| — |
| — |
| ||||
Net fair value |
| $ | — |
| $ | 1,807 |
| $ | — |
| $ | 1,807 |
|
Measurement of Fair Value
The methods and valuation techniques used for the purpose of measuring fair value are unchanged compared to the previous reporting period.
a) Derivatives
Where derivatives are traded either on exchanges or liquid over-the-counter markets the Group uses the closing price at the reporting date. Normally, the derivatives entered into by the Group are not traded in active markets. The fair values of these contracts are estimated using a valuation technique that maximises the use of observable market inputs, eg market exchange and interest rates (Level 2). Most derivatives entered into by the Group are included in Level 2 and consist of commodity contracts.
NOTE 12—OTHER CURRENT ASSETS
|
| Consolidated Group |
| ||||
|
| 31 December 2012 |
| 30 June 2012 |
| ||
Cash advances to other operators |
| $ | 625 |
| $ | 1,514 |
|
Escrow accounts |
| 3,830 |
| — |
| ||
Oil inventory on hand, at cost |
| 69 |
| 46 |
| ||
Prepayments |
| 501 |
| 120 |
| ||
|
| $ | 5,025 |
| $ | 1,680 |
|
On 31 December 2012, the Company completed a transaction to acquire certain oil and gas properties in the Wattenberg field of the Denver-Julesburg (DJ) Basin (the “Wattenberg Acquisition”). In connection with the transaction the Company transferred $3.0 million, $2.7 million and $0.5 million to escrow accounts related to a drilling commitment, title defect and environmental remediation, respectively ($6.2 million collectively). Because the use of the Wattenberg Acquisition related escrow accounts are restricted or generally will not be used to settle short-term Company operating costs, they have been excluded from the Company’s cash and cash equivalents balance in the statement of financial position and statement of cash flows as at 31 December 2012 and for the six month period then ended. Of this $6.2 million escrow account balance, $3.8 million is classified as other current asset in the statement of financial position as at 31 December 2012.
NOTE 13—DEVELOPMENT AND PRODUCTION ASSETS
|
| Consolidated Group |
| ||||||
|
| 31 December 2012 |
| 30 June 2012 |
| ||||
Costs carried forward in respect of areas of interest in: |
|
|
|
|
| ||||
Development and production phase at cost |
| $ | 96,663 |
| $ | 113,830 |
| ||
Accumulated amortisation |
| (14,619 | ) | (24,241 | ) | ||||
Provision for impairment |
| (2,315 | ) | (2,315 | ) | ||||
Total Development and Production Expenditure |
| $ | 79,729 |
| $ | 87,274 |
| ||
| a) | Movements in carrying amounts: |
|
|
|
|
| ||
|
| Development expenditure |
|
|
|
|
| ||
|
| Balance at the beginning of the period |
| $ | 87,274 |
| $ | 45,873 |
|
|
| Amount transferred from exploration phase |
| 527 |
| 2,277 |
| ||
|
| Amounts capitalised during the period |
| 47,949 |
| 50,520 |
| ||
|
| Amortisation expense |
| (6,013 | ) | (10,971 | ) | ||
|
| Development assets sold during the period |
| (50,008 | ) | (425 | ) | ||
|
| Balance at end of period |
| $ | 79,729 |
| $ | 87,274 |
|
NOTE 14—EXPLORATION AND EVALUATION EXPENDITURE
|
| Consolidated Group |
| ||||||
|
| 31 December 2012 |
| 30 June 2012 |
| ||||
Costs carried forward in respect of areas of interest in: |
|
|
|
|
| ||||
Exploration and evaluation phase at cost |
| $ | 35,053 |
| $ | 13,050 |
| ||
Provision for impairment |
| (1,614 | ) | (1,614 | ) | ||||
Total Exploration and Evaluation Expenditure |
| $ | 33,439 |
| $ | 11,436 |
| ||
| a) | Movements in carrying amounts: |
|
|
|
|
| ||
|
| Exploration and evaluation |
|
|
|
|
| ||
|
| Balance at the beginning of the period |
| $ | 11,436 |
| $ | 6,626 |
|
|
| Amounts capitalised during the period |
| 23,348 |
| 8,670 |
| ||
|
| Impairment of exploration and expenditure |
| — |
| (357 | ) | ||
|
| Amount transferred to development phase |
| (527 | ) | (2,277 | ) | ||
|
| Exploration tenements sold during the period |
| (818 | ) | (1,226 | ) | ||
|
| Balance at end of period |
| $ | 33,439 |
| $ | 11,436 |
|
Included in the amounts capitalised during the six month period ended 31 December 2012, was $12.7 million related the Wattenberg Acquisition, which occurred on 31 December 2012. The remaining $1.0 million of the total consideration paid or liabilities assumed was included in the amount capitalised of the Company’s development and production assets.
The ultimate recoupment of costs carried forward for exploration phase is dependent on the successful development and commercial exploitation or sale of respective areas.
NOTE 15—PLANT AND EQUIPMENT
|
| Consolidated Group |
| ||||||
|
| 31 December 2012 |
| 30 June 2012 |
| ||||
Plant and equipment at cost |
| $ | 737 |
| $ | 630 |
| ||
Accumulated depreciation |
| (314 | ) | (212 | ) | ||||
Total Plant and Equipment |
| $ | 423 |
| $ | 418 |
| ||
| a) | Movements in carrying amounts: |
|
|
|
|
| ||
|
| Balance at the beginning of the period |
| $ | 418 |
| $ | 210 |
|
|
| Additions |
| 107 |
| 310 |
| ||
|
| Depreciation |
| (102 | ) | (102 | ) | ||
|
| Balance at end of period |
| $ | 423 |
| $ | 418 |
|
NOTE 16—OTHER NON-CURRENT ASSETS
|
| Consolidated Group |
| ||||
|
| 31 December 2012 |
| 30 June 2012 |
| ||
Escrow accounts |
| $ | 2,400 |
| $ | — |
|
Casing and tubulars at net realisable value |
| 20 |
| 21 |
| ||
|
| $ | 2,420 |
| $ | 21 |
|
The $2.4 million of escrow accounts is the long-term portion related to the escrow accounts discussed in Note 12.
NOTE 17—TRADE AND OTHER PAYABLES AND ACCRUED EXPENSES
|
| Consolidated Group |
| ||||
|
| 31 December 2012 |
| 30 June 2012 |
| ||
Oil and gas related |
| $ | 49,407 |
| $ | 29,059 |
|
Administrative expenses |
| 2,435 |
| 1,334 |
| ||
Total trade and other payable and accrued expenses |
| $ | 51,842 |
| $ | 30,393 |
|
NOTE 18—CREDIT FACILITY
|
| Consolidated Group |
| ||||
|
| 31 December 2012 |
| 30 June 2012 |
| ||
Wells Fargo Credit Facility |
| $ | 30,000 |
| $ | — |
|
Bank of Oklahoma Credit Facility |
| — |
| 15,000 |
| ||
Total credit facilities |
| 30,000 |
| 15,000 |
| ||
Deferred financing fees |
| (430 | ) | (345 | ) | ||
|
| $ | 29,570 |
| $ | 14,655 |
|
On 31 December 2012, Sundance Energy, Inc. (“SEI”), a wholly owned subsidiary of the Company, entered into a credit agreement with Wells Fargo (the “Credit Facility”), pursuant to which up to $300 million is available on a revolving basis. The borrowing base under the Credit Facility is determined by reference to the value of the Company’s proved reserves. The agreement specifies a semi-annual borrowing base redetermination and the Company can request two additional redeterminations each year. The borrowing base was originally set at $30 million. Interest on borrowed funds accrues, at the Company’s option, of i) LIBOR plus a margin that ranges from 175 to 275 basis points or ii) the Base Rate, defined as a rate equal to the highest of (a) the Federal Funds Rate plus 1/2 of 1%, (b) the Prime Rate, or (c) LIBOR plus a margin that ranges from 75 to 175 basis points. The applicable margin varies depending on the amount drawn. The Company also pays a commitment that ranges from 37.5 to 50 basis points on the undrawn balance of the borrowing base. The agreement has a five year term and contains both negative and affirmative covenants, including minimum current ratio and maximum leverage ratio requirements. As at 31 December 2012 the Company requested and received a waiver from Wells Fargo regarding compliance with the maximum leverage ratio as at 31 December 2012 as required under the terms of the Credit Facility. Certain development and production assets are pledged as collateral and the facility is guaranteed by the Parent Company. The Company immediately drew on the Credit Facility’s full $30 million borrowing base and used $15 million of the proceeds to repay and retire its outstanding loan with the Bank of Oklahoma. As a part of its Bank of Oklahoma debt extinguishment, the
Company expensed approximately $0.3 million of unamortised deferred financing costs, which is included in financing costs in the statement of profit or loss and other comprehensive income for the six month period ended 31 December 2012. The Company capitalised $0.4 million of financing costs related to the Wells Fargo credit facility, which will be amortised over the term of the loan. Under the terms of the credit facility, SEI is limited to payment of $2 million in dividends annually to SEAL without prior creditor approval.
NOTE 19—RESTORATION PROVISION
The restoration provision represents the present value of restoration costs relating to the Company’s oil and gas interests, which are expected to be incurred up to 2042. Assumptions, based on the current economic environment, have been made which management believes are a reasonable basis upon which to estimate the future liability. These estimates are reviewed regularly to take into account any material changes to the assumptions. However, actual restoration costs will reflect market conditions at the relevant time. Furthermore, the timing of restoration is likely to depend on when the fields cease to produce at economically viable rates. This in turn will depend on future oil and gas prices, which are inherently uncertain.
|
| Consolidated Group |
| ||||
|
| 31 December 2012 |
| 30 June |
| ||
a) Decommissioning costs: |
|
|
|
|
| ||
Balance at the beginning of the period |
| $ | 588 |
| $ | 349 |
|
New provisions and changes in estimates |
| 310 |
| 230 |
| ||
Dispositions |
| (192 | ) | (2 | ) | ||
New provisions assumed from asset acquisition |
| 506 |
| — |
| ||
Unwinding of discount |
| 16 |
| 11 |
| ||
Balance at end of period |
| $ | 1,228 |
| $ | 588 |
|
NOTE 20—DEFERRED TAX LIABILITIES
|
| Consolidated Group |
| ||||
|
| 31 December 2012 |
| 30 June 2012 |
| ||
The balance comprises temporary differences attributable to: |
|
|
|
|
| ||
Plant and equipment |
| $ | 26 |
| $ | 37 |
|
Development and production expenditure |
| 79,600 |
| 24,276 |
| ||
Net operating loss carried forward |
| (22,647 | ) | (13,837 | ) | ||
|
| $ | 56,979 |
| $ | 10,476 |
|
NOTE 21—ISSUED CAPITAL
Total ordinary shares issued at each year end are fully paid.
|
| Number of Shares |
| |
a) | Ordinary Shares |
|
|
|
| Total shares issued at 30 June 2011 |
| 276,709,585 |
|
| Shares issued during the year |
| 388,889 |
|
| Total shares issued at 30 June 2012 |
| 277,098,474 |
|
| Shares issued during the year |
| 1,666,667 |
|
| Total shares issued at 31 December 2012 |
| 278,765,141 |
|
Ordinary shares participate in dividends and the proceeds on winding of the parent entity in proportion to the number of shares held. At shareholders’ meetings each ordinary share is entitled to one vote when a poll is called, otherwise each shareholder has one vote on a show of hands.
|
|
| Consolidated Group |
| ||||
|
|
| 31 December 2012 |
| 30 June 2012 |
| ||
b) | Issued Capital |
|
|
|
|
| ||
| Opening balance |
| $ | 57,978 |
| $ | 57,831 |
|
| Shares issued during the period |
| 716 |
| 147 |
| ||
| Closing balance at end of period |
| $ | 58,694 |
| $ | 57,978 |
|
c) Options on Issue
Details of the share options outstanding as at the end of the period:
Grant Date |
| Expiry Date |
| Exercise Price |
| 31 December 2012 |
| 30 June 2012 |
|
10 Sep 2010 |
| 31 May 13 |
| A$0.20 |
| 1,000,000 |
| 1,000,000 |
|
10 Sep 2010 |
| 31 May 13 |
| A$0.30 |
| 500,000 |
| 500,000 |
|
02 Dec 2010 |
| 01 Dec 15 |
| A$0.37 |
| 1,166,666 |
| 2,333,333 |
|
02 Mar 2011 |
| 30 Jun 14 |
| A$0.95 |
| 30,000 |
| 30,000 |
|
03 Jun 2011 |
| 31 May 13 |
| A$0.35 |
| 100,000 |
| 100,000 |
|
03 Jun 2011 |
| 15 Jan 16 |
| A$0.65 |
| 500,000 |
| 500,000 |
|
03 Jun 2011 |
| 28 Jan 16 |
| A$0.50 |
| 250,000 |
| 750,000 |
|
06 Jun 2011 |
| 01 Sep 15 |
| A$0.95 |
| 30,000 |
| 30,000 |
|
06 Sep 2011 |
| 31 Dec 18 |
| A$0.95 |
| 1,200,000 |
| 1,200,000 |
|
05 Dec 2011 |
| 05 Mar 19 |
| A$0.95 |
| 1,000,000 |
| 1,000,000 |
|
|
|
|
|
|
| 5,776,666 |
| 7,443,333 |
|
d) Restricted Share Units (RSUs) on Issue
Details of the restricted share units outstanding as at the end of the period:
|
| Consolidated Group |
| ||
Grant Date |
| 31 December 2012 |
| 30 June 2012 |
|
05 Dec 2011 |
| 608,750 |
| — |
|
15 Oct 2012 |
| 1,482,143 |
| — |
|
|
| 2,090,893 |
| — |
|
e) Capital Management
Management controls the capital of the Group in order to maintain a good debt equity ratio, provide the shareholders with adequate returns and ensure that the Group can fund its operations and continue as a going concern.
The Group’s debt and capital includes ordinary share capital and financial liabilities, supported by financial assets. Other than the covenants described in Note 18, the Group has no externally imposed capital requirements.
Management effectively manages the Group’s capital by assessing the Group’s financial risks and adjusting its capital structure in response to changes in these risks and in the market. These responses include the management of debt levels, distributions to shareholders and shareholder issues.
There have been no changes in the strategy adopted by management to control the capital of the Group since the prior year. The strategy is to ensure that the Group’s gearing ratio remains minimal. At 31 December and 30 June 2012, the Company had $30 million and $15 million of outstanding debt, respectively.
NOTE 22—RESERVES
a) Share Option Reserve
The share option reserve records items recognised as expenses on valuation of employee and supplier share options and restricted share units.
b) Foreign Currency Translation Reserve
The foreign currency translation reserve records exchange differences arising on translation of the Parent Company.
NOTE 23—CAPITAL AND OTHER EXPENDITURE COMMITMENTS
Capital commitments relating to joint ventures and tenements
As at 31 December 2012, all of the Company’s exploration and evaluation and development and production assets are located in the United States of America.
The mineral leases in the exploration prospects in the USA have primary terms ranging from 3 years to 5 years and generally have no specific capital expenditure requirements. However, mineral leases that are not successfully drilled and included within a spacing unit for a producing well within the primary term will expire at the end of the primary term unless re-leased.
On 31 December 2012, the Company entered into an agreement to acquire certain oil and gas properties located in the Wattenberg Field and to drill 45 net wells by 31 December 2015 on the acquired properties (the “Drilling Commitment”). As each qualifying well is drilled, approximately $67 thousand is paid from the escrow account to the Company. However, for each required net commitment well not completed by the Company during that prorated commitment year, the Company is to pay the seller of the properties approximately $67 thousand from the escrow account. Certain clawback provisions allow the Company to recoup amounts paid to the sellers if the total 45 wells are drilled by 31 December 2015.
|
| Consolidated Group |
| ||||
|
| 31 December 2012 |
| 30 June 2012 |
| ||
Operating lease commitments |
|
|
|
|
| ||
Commitments for minimum lease payments in relation to non-cancellable operating leases not provided for in the financial statements. |
|
|
|
|
| ||
Lease expenditure commitments |
|
|
|
|
| ||
—due within one year |
| $ | 162 |
| $ | 202 |
|
—due within 1 - 5 years |
| 81 |
| 162 |
| ||
|
| $ | 243 |
| $ | 364 |
|
Drilling commitments |
|
|
|
|
| ||
Commitments for the payment related to drilling not provided for in the financial statements. |
|
|
|
|
| ||
Expenditure commitments |
|
|
|
|
| ||
due within one year |
| $ | 1,000 |
| $ | — |
|
due within 1 - 5 years |
| 2,000 |
| — |
| ||
|
| $ | 3,000 |
| $ | — |
|
Employment and consultant commitments |
|
|
|
|
| ||
Commitments for the payment of salaries and other remuneration under long-term employment and consultant contracts not provided for in the financial statements. |
|
|
|
|
| ||
Expenditure commitments |
|
|
|
|
| ||
—due within one year |
| $ | 275 |
| $ | 180 |
|
—due within 1 - 5 years |
| 104 |
| 270 |
| ||
|
| $ | 379 |
| $ | 450 |
|
Details relating to the employment contracts are set out in the remuneration report.
NOTE 24—CONTINGENT ASSETS AND LIABILITIES
At the date of signing this report, the Group is not aware of any contingent assets or liabilities that should be disclosed in accordance with IAS 37.
NOTE 25—OPERATING SEGMENTS
Management has determined, based upon the reports reviewed by the CEO and used to make strategic decisions, that the Group has one reportable segment being oil and gas exploration and production in the United States of America.
The CEO reviews internal management reports on a monthly basis that are consistent with the information provided in the statement of profit or loss and other comprehensive income, statement of financial position and statement of cash flows. As a result no reconciliation is required, because the information as presented is used by the CEO to make strategic decisions.
NOTE 26—CASH FLOW INFORMATION
|
|
| Consolidated Group |
| ||||
|
|
| 6 months to |
| 12 months to |
| ||
a) | Reconciliation of cash flows from operations with income from ordinary activities after income tax |
|
|
|
|
| ||
| Profit from ordinary activities after income tax |
| $ | 76,210 |
| $ | 6,012 |
|
| Non cash flow in operating income |
|
|
|
|
| ||
| Depreciation and exploration expenditure written off |
| 6,116 |
| 11,468 |
| ||
| Share options expensed |
| 733 |
| 930 |
| ||
| Unrealised losses (gains) on derivatives |
| 1,190 |
| (2,242 | ) | ||
| Net gain on sale of properties |
| (122,327 | ) | (3,004 | ) | ||
| Write-off of Bank of Oklahoma deferred financing fees |
| 349 |
| — |
| ||
| Changes in assets and liabilities: |
|
|
|
|
| ||
| —Increase in current and deferred tax |
| 46,616 |
| 3,732 |
| ||
| —(Increase) / decrease in other assets, excluding investing |
| (381 | ) | 1,517 |
| ||
| —Increase in trade and other receivables |
| (3,320 | ) | (8,814 | ) | ||
| —Increase in trade and other payables |
| 4,200 |
| 2,233 |
| ||
| Net cash provided by operating activities |
| $ | 9,386 |
| $ | 11,832 |
|
b) Non Cash Financing and Investing Activities
During the six month period and year ended 31 December and 30 June 2012, 1,666,667 and 388,889 shares were issued at A$0.41 and A$0.37 per weighted average share, respectively.
c) Business Combinations
There were no non-cash business combinations in the six month period and year ended 31 December and 30 June 2012.
NOTE 27—SHARE BASED PAYMENTS
During the six month period ended 31 December 2012, a total of nil (year ended 30 June 2012: 2,260,000) options were granted to employees pursuant to employment agreements and a total of 1,666,667 (year ended 30 June 2012: 388,889) previously issued options were exercised. There were 700,000 awarded options that the Company expected to issue in early 2013 for which Company employees rendered services during the six month period ended 31 December 2012. Using the best estimate of fair value on the employees’ hire date, the Company began expensing these awards during the six month period ended 31 December 2012. The 700,000 options expected to be issued in early 2013 are excluded from the outstanding options summary below:
|
| Consolidated Group |
| ||||||
|
| 31 December 2012 |
| 30 June 2012 |
| ||||
|
| Number |
| Weighted |
| Number |
| Weighted |
|
Outstanding at start of year |
| 7,443,333 |
| 0.55 |
| 5,632,222 |
| 0.38 |
|
Formally issued |
| — |
| — |
| 2,260,000 |
| 0.95 |
|
Forfeited |
| — |
| — |
| (60,000 | ) | 0.50 - 0.70 |
|
Exercised |
| (1,666,667 | ) | 0.41 |
| (388,889 | ) | 0.37 |
|
Expired |
| — |
| — |
| — |
| — |
|
Outstanding at end of year |
| 5,776,666 |
| 0.59 |
| 7,443,333 |
| 0.55 |
|
Exercisable at end of year |
| 3,729,999 |
| 0.44 |
| 3,551,889 |
| 0.45 |
|
The following tables summarise the options issued and awarded and their related grant date, fair value and vesting conditions for the six month period ended 31 December 2012 and the year ended 30 June 2012:
Options awarded, but not yet issued during the six month period ended 31 December 2012:
Award Date (not issued) |
| Number |
| Estimated |
| Vesting Conditions |
| |
1 November 2012 |
| 350,000 |
| $ | 145 |
| 20% issuance date, 20% first four anniversaries |
|
3 December 2012 |
| 350,000 |
| 157 |
| 20% issuance date, 20% first four anniversaries |
| |
|
| 700,000 |
| $ | 302 |
|
|
|
Options issued during the year ended 30 June 2012:
Grant Date |
| Number |
| Estimated |
| Vesting Conditions |
| |
1 July 2011 |
| 30,000 |
| $ | 14 |
| 33% issuance date, 33% first two anniversaries |
|
1 September 2011 |
| 30,000 |
| 12 |
| 33% issuance date, 33% first two anniversaries |
| |
7 October 2011 |
| 1,200,000 |
| 408 |
| 17% issuance date, 17% first five anniversaries |
| |
5 March 2012 |
| 1,000,000 |
| 212 |
| 20% issuance date, 20% first four anniversaries |
| |
|
| 2,260,000 |
| $ | 646 |
|
|
|
Share based payments expense related to options is determined pursuant to IFRS 2: Share Based Payments, and is recognised pursuant to the attached vesting conditions. The fair value of the options awarded ranged from A$0.42 to A$0.45 for the period ended 31 December 2012 and A$0.21 to A$0.46 for the year ended 30 June 2012, which was calculated using a Black-Sholes options pricing model. Expected volatilities are based upon the historical volatility of the ordinary shares. Historical data is also used to estimate the probability of option exercise and potential forfeitures. No options were issued in the six month period ended 31 December 2012; however, 700,000 awarded options were expected to be issued in early 2013 and were expensed during the period according to the relevant service period.
The following table summarises the key assumptions used to calculate the estimated fair value awarded or granted during the periods:
|
| Expected to be |
| Issued during |
|
Share price: |
| A$0.78 - A$0.82 |
| A$0.38 - 0.96 |
|
Exercise price: |
| A$1.15 |
| A$0.95 |
|
Expected volatility: |
| 65% |
| 75% |
|
Option term: |
| 5.75 years |
| 3.3 to 7.3 years |
|
Risk free interest rate: |
| 2.75% |
| 5.5% to 6.25% |
|
(1) Options subject to formal issuance, but were awarded and expensed beginning on the employees’ hire date during the six month period ended 31 December 2012.
Restricted Share Units
During the six month period and year ended 31 December and 30 June 2012, the Board of Directors awarded 1,482,143 and 910,000 restricted share units (RSUs) to certain employees. These awards were made in accordance with the long term equity component of the Company’s incentive compensation plan, the details of which are described in more detail in the remuneration section of the Directors’ Report. Share based payment expense for RSUs awarded was calculated pursuant to IFRS 2: Share Based Payments. The fair values of RSUs were estimated at the date they were approved by the Board of Directors, 15 October 2012 and 5 December 2011 (the measurement dates). As at 30 June 2012, the 5 December 2011 awards had been approved but not yet issued. All unforfeited awards were issued to employees upon finalisation of the plan documents, which occurred in December 2012. The value of the vested portion of these awards has been recognised within the financial statements. This information is summarised for the Consolidated Group for the six month period ended 31 December 2012 below:
|
| Number |
| Weighted |
|
Awarded, but not yet issued (beginning of period)* |
| 910,000 |
| 0.38 |
|
Forfeited prior to finalisation of plan* |
| (301,250 | ) | 0.38 |
|
Formally issued (in addition to unissued units at beginning of period) |
| 1,482,143 |
| 0.68 |
|
Forfeited subsequent to finalisation of plan |
| — |
| — |
|
Converted to ordinary shares |
| — |
| — |
|
Outstanding at end of period |
| 2,090,893 |
| 0.59 |
|
Vested at end of period |
| 765,286 |
| 0.48 |
|
* RSUs awarded, but not yet issued at beginning of period were issued upon finalisation of the plan during the period ended 31 December 2012 and are included in the total outstanding at end of period (net of forfeited units).
The following tables summarise the RSUs issued and their related grant date, fair value and vesting conditions for the six month period ended 31 December 2012 and the year ended 30 June 2012:
RSUs issued during the six month period ended 31 December 2012:
Award Date (not issued) |
| Number of |
| Estimated |
| Vesting Conditions |
| |
15 October 2012 |
| 1,080,358 |
| $ | 809 |
| 25% issuance date, 25% first three anniversaries |
|
29 November 2012 |
| 401,785 |
| 340 |
| 25% issuance date, 25% first three anniversaries |
| |
|
| 1,482,143 |
| $ | 1,149 |
|
|
|
RSUs awarded during the year ended 30 June 2012:
Award Date (not issued) |
| Number of |
| Estimated |
| Vesting Conditions |
| |
5 December 2011 |
| 375,000 |
| $ | 146 |
| 25% issuance date, 25% first three anniversaries |
|
29 November 2012 |
| 535,000 |
| 212 |
| 25% issuance date, 25% first three anniversaries |
| |
|
| 910,000 |
| $ | 358 |
|
|
|
Upon vesting, and after a certain administrative period, the RSUs are converted to common shares of the Company’s stock. Once converted to common shares, the RSUs are no longer restricted. As the daily closing price of the Company stock approximates its estimated fair value at that time, the Company used the grant date closing price to estimate the fair value of the RSUs.
NOTE 28—JOINT VENTURE INTERESTS
The Group had interests in joint venture operations of 23.34% in oil and gas exploration in the PEL 100 blocks in South Australia. In December 2011, the joint venture interests were sold for $0.5 million. The net book value was nil, as the joint venture interests were impaired in previous years.
NOTE 29—EVENTS AFTER THE BALANCE SHEET DATE
On 8 March 2013, the Company acquired 100% of the outstanding shares of Texon Petroleum Ltd (“Texon”, whose name was changed to Armadillo Petroleum Ltd), an Australian corporation with oil and gas assets in the Eagle Ford formation in the United States. The Company acquired Texon to gain access to its existing production and drilling inventory in the Eagle Ford formation. As consideration, the Company issued 122.7 million ordinary shares (approximately 30.6% of the total outstanding shares immediately subsequent to the acquisition), which had a fair value of $132.1 million on the acquisition date and net cash consideration of $26.3 million for a total purchase price of $158.4 million. The net cash consideration includes a
$141.0 million pre-merger purchase by the Company of certain Texon oil and gas properties, offset by $114.7 million of cash acquired at the time of the merger. The current income tax liability, included in accrued expenses, and deferred tax liability of $30.3 million and $15.1 million, respectively, are comprised of tax liabilities assumed as at the acquisition date and an increase in the tax liability related to the incremental acquisition date fair value of the acquired development and production and exploration and evaluation assets as compared to Texon’s historical basis.
The Company paid $158.4 million for substantially all of the net assets of Armadillo Petroleum Ltd. Due to the complexity and timing of the merger, the fair values are provisional. The following table reflects the assets acquired and the liabilities assumed at their estimated fair value (in thousands). The Company will continue to review the assets acquired and the liabilities assumed for twelve months from the date of the merger.
Estimated fair value of assets acquired: |
|
|
| |
Trade and other receivables |
| $ | 5,284 |
|
Other current assets |
| 456 |
| |
Development and production assets |
| 53,937 |
| |
Exploration and evaluation assets |
| 145,881 |
| |
Prepaid drilling and completion costs |
| 3,027 |
| |
Amount attributable to assets acquired |
| 208,585 |
| |
Estimated fair value of liabilities assumed: |
|
|
| |
Trade and other payables |
| 119 |
| |
Accrued expenses |
| 34,693 |
| |
Restoration provision |
| 277 |
| |
Deferred tax liabilities |
| 15,094 |
| |
Amount attributable to liabilities assumed |
| 50,183 |
| |
Net assets acquired |
| $ | 158,402 |
|
Purchase price: |
|
|
| |
Cash and cash equivalents |
| $ | 26,310 |
|
Issued capital |
| 132,092 |
| |
Total consideration paid |
| $ | 158,402 |
|
Since the acquisition date of March 8, 2013, the Company has earned revenue of $11.3 million and generated income of $5.8 million. The following reflects select pro forma information as if the merger had occurred on July 1, 2012 instead of the closing date of March 8, 2013, and excludes the results of operations for and the disposition of the South Antelope property:
|
| 6 months to |
| |
Oil and gas revenue |
| $ | 913 |
|
Lease operating and production expenses |
| (1,689 | ) | |
Depreciation and amortisation expense |
| (3,471 | ) | |
Employee benefits expense |
| (1,085 | ) | |
Administrative expense |
| (2,098 | ) | |
Finance income |
| 201 |
| |
Exploration and evaluation expenditures |
| (359 | ) | |
Impairment of non-current assets |
| (576 | ) | |
Net gain/loss on sale of non-current assets |
| (122,327 | ) | |
Realised currency loss |
| (108 | ) | |
Profit (loss) before income tax |
| (130,599 | ) | |
Income tax benefit (expense) |
| 49,585 |
| |
|
| (81,014 | ) | |
Profit attributable to owners of the Company for the period |
| 76,210 |
| |
Adjusted profit (loss) attributable to the owners of the Company for the period |
| $ | (4,804 | ) |
Adjusted basic and diluted earnings (loss) per share |
| $ | (0.01 | ) |
In the six month period ended 31 December 2012, the Company incurred approximately $0.7 million of transaction costs related to the acquisition of Texon. These transaction costs are included in the administrative expenses in the statement of profit or loss and other comprehensive income and are not deductible for US tax purposes. These transaction costs continued through the effective date of the acquisition and were expensed as incurred.
In connection with the sale of its South Antelope assets in September 2012, the Company elected Section 1031 “like-kind exchange” treatment which, under the US tax rules, provides for deferral of the gain if the proceeds are used to acquire “like-kind property” within six months of the closing of the transaction. In March 2013, the Company completed a transaction in which the majority of the funds remaining in its Section 1031 escrow account were used to acquire oil and gas properties in connection with the Texon Scheme of Arrangement transaction discussed above. Management believes the properties acquired qualify as “like-kind property” under Section 1031 which will result in deferral of the majority of the gain associated with the South Antelope sale.
On 6 June 2013, SEAL completed an A$48.1 million placement of 55,984,884 shares priced at A$0.86 per share. Proceeds from the placement will be used primarily to accelerate development of the Company’s Eagle Ford and Mississippian/Woodford acreage and for general corporate purposes.
After settlement of the placement, SEAL offered its shareholders with registered addresses in Australia and New Zealand the opportunity to participate in a capital raise pursuant to a Share Purchase Plan at the placement price of A$0.86 per share for up to A$15,000 per shareholder of record as at 30 May 2013 and up to a maximum capital raise of A$15.0 million. The Share Purchase Plan was open for a period from 10 June 2013 through 28 June 2013 and raised A$1.3 million from the sale of 1,517,454 shares.
On 30 August 2013, the Company entered into a second lien five-year term loan with Wells Fargo Energy Capital for $15 million and used the proceeds to pay down the balance of the first lien revolving line of credit with Wells Fargo Bank on 3 September 2013. Substantially all of the Company’s assets are collateralized by both the first lien revolving line of credit and the second lien term loan. The Company’s total outstanding debt remained at $30 million as at 18 October 2013.
The following table provides a summary of derivative contracts entered into during 2013:
Contract Type |
| Basis |
| Quantity/Month |
| Floor Price |
| Ceiling Price |
| Term |
| ||
Swap |
| LLS |
| 3,000 |
| $ | 101.75 |
| $ | 101.75 |
| Jul 13 - Dec 13 |
|
Collar |
| LLS |
| 3,000 |
| 95.00 |
| 104.90 |
| Jul 13 - Dec 13 |
| ||
Swap |
| NYMEX-WTI |
| 1,000 |
| 106.55 |
| 106.55 |
| Oct 13 - Dec 13 |
| ||
Swap |
| LLS |
| 10,000 |
| 110.85 |
| 110.85 |
| Oct 13 - Dec 13 |
| ||
Swap |
| LLS |
| 5,000 |
| 103.75 |
| 103.75 |
| Jul 13 - Dec 13 |
| ||
Swap |
| LLS |
| 3,000 |
| 101.75 |
| 101.75 |
| Jul 13 - Jun 14 |
| ||
Collar |
| NYMEX-WTI |
| 3,000 |
| 90.00 |
| 99.75 |
| Jul 13 - Jun 14 |
| ||
Collar |
| LLS |
| 2,000 |
| 90.00 |
| 102.00 |
| Jan 14 - Dec 14 |
| ||
Collar |
| LLS |
| 3,000 |
| 90.00 |
| 101.30 |
| Jan 14 - Dec 14 |
| ||
Swap |
| NYMEX-WTI |
| 2,000 |
| 97.40 |
| 97.40 |
| Jan 14 - Dec 14 |
| ||
Swap |
| LLS |
| 3,000 |
| 102.30 |
| 102.30 |
| Jan 14 - Dec 14 |
| ||
Collar |
| NYMEX-WTI |
| 3,000 |
| 85.00 |
| 94.75 |
| Jan 14 - Dec 14 |
| ||
Swap |
| LLS |
| 3,000 |
| 100.15 |
| 100.15 |
| Jan 14 - Dec 14 |
| ||
Collar |
| LLS |
| 2,000 |
| 85.00 |
| 102.00 |
| Jul 14 - Dec 14 |
| ||
Collar |
| NYMEX-WTI |
| 2,500 |
| 80.00 |
| 98.25 |
| Jul 14 - Dec 14 |
| ||
Collar |
| NYMEX-WTI |
| 2,000 |
| 75.00 |
| 98.65 |
| Jan 15 - Dec 15 |
| ||
Collar |
| LLS |
| 3,000 |
| 85.00 |
| 101.05 |
| Jan 15 - Dec 15 |
| ||
Contract Type |
| Basis |
| Quantity/Month |
| Floor Price |
| Ceiling Price |
| Term |
| ||
Swap |
| NYMEX-HH |
| 10,000 |
| $ | 4.15 |
| $ | 4.15 |
| May 13 - Dec 13 |
|
Swap |
| HSC |
| 10,000 |
| 4.01 |
| 4.01 |
| Jun 13 - Dec 13 |
| ||
Swap |
| NYMEX-HH |
| 20,000 |
| 4.23 |
| 4.23 |
| Jan 14 - Dec 14 |
| ||
Collar |
| HSC |
| 10,000 |
| 3.75 |
| 4.60 |
| Jan 14 - Dec 14 |
| ||
Other than as detailed above, no matters or circumstances have arisen since the end of the financial year which significantly affected or may significantly affect the operations of the Group, the results of those operations, or the state of affairs of the Group in future financial years.
NOTE 30—RELATED PARTY TRANSACTIONS
Transactions with related parties: N Martin was a partner and is now a consultant of Minter Ellison Lawyers and has been a Director since 1 March 2012. Minter Ellison Lawyers were paid a total of $148,073 and $124,007 for legal services for the period and year ended 31 December and 30 June 2012, respectively.
NOTE 31—FINANCIAL RISK MANAGEMENT
a) Financial Risk Management Policies
The Group is exposed to a variety of financial market risks including interest rate, commodity prices, foreign exchange and liquidity risk. The Group’s risk management focuses on the volatility of commodity markets and protecting cash flow in the event of declines in commodity pricing. The Group utilise derivative financial instruments to hedge certain risk exposures. The Group’s financial instruments consist mainly of deposits with banks, short term investments, accounts receivable, derivative financial instruments, finance facility, and payables. The main purpose of non-derivative financial instruments is to raise finance for the Group operations.
i) Treasury Risk Management
Financial risk management is carried out by Management. The Board sets financial risk management policies and procedures by which Management are to adhere. Management identifies and evaluates all financial risks and enters into financial risk instruments to mitigate these risk exposures in accordance with the policies and procedures outlined by the Board.
ii) Financial Risk Exposure and Management
The main risk the Group is exposed to through its financial instruments is interest rate risk. The interest rate risk is managed with a mixture of fixed and floating rate cash deposits. At 31 December and 30 June 2012 approximately nil and 6% of Group deposits are fixed, respectively. It is the policy of the Group to keep surplus cash in interest yielding deposits.
iii) Commodity Price Risk Exposure and Management
The Board actively reviews oil hedging on a monthly basis. Reports providing detailed analysis of the Group’s hedging activity are continually monitored against Group policy. The Group sells its oil on market using Nymex market spot rates reduced for basis differentials in the basins from which the Company produces. Nymex is a light, sweet crude oil delivered to Cushing, Oklahoma, which is used as the benchmark for onshore United States petroleum prices. Forward contracts are used by the Group to manage its forward commodity price risk exposure. The Group’s policy is to hedge less than 50% of anticipated future oil production for up to 24 months. The Group may hedge over 50% or beyond 24 months with approval of the Board. The Group has not elected to utilise hedge accounting treatment and changes in fair value are recognised in the statement of profit or loss and other comprehensive income.
Commodity Hedge Contracts outstanding at 31 December 2012
Contract Type |
| Counterparty |
| Basis |
| Quantity/mo |
| Strike Price |
| Term |
|
Swap |
| Shell Trading US |
| NYMEX |
| 2,000 BBL |
| $99.00 |
| 1-Mar-12 - 31-Dec-13 |
|
Collar |
| Shell Trading US |
| NYMEX |
| 1,000 BBL |
| $90.00/$117.50 |
| 1-Jan-13 - 31-Dec-13 |
|
Collar |
| Shell Trading US |
| NYMEX |
| 1,000 BBL |
| $95.00/$112.75 |
| 1-Jan-13 - 31-Dec-13 |
|
Swap |
| Shell Trading US |
| NYMEX |
| 3,000 BBL |
| $102.95 |
| 1-Jan-13 - 31-Dec-13 |
|
Swap |
| Shell Trading US |
| NYMEX |
| 10,000 MMBTU |
| $3.58 |
| 1-Jan-13 - 31-Dec-13 |
|
a) Sensitivity Analysis
Interest Rate and Price Risk
The Group has performed a sensitivity analysis relating to its exposure to interest rate risk at balance date. This sensitivity analysis demonstrates the effect on the current period results and equity which could result from a change in these risks. The balance of debt as at 31 December and 30 June 2012 was $30 million and $15 million and is included in the Interest Rate Sensitivity Analysis below.
Interest Rate Sensitivity Analysis
The effect on income and equity as a result of changes in the interest rate, with all other variables remaining constant would be as follows:
|
| Consolidated Group |
| ||||
|
| 6 months to |
| 12 months |
| ||
Change in profit/(loss) |
|
|
|
|
| ||
—increase in interest rates + 2% |
| $ | (157 | ) | $ | 310 |
|
—decrease in interest rates - 2% |
| 157 |
| (234 | ) | ||
Change in equity |
|
|
|
|
| ||
—increase in interest rates + 2% |
| $ | (157 | ) | $ | 310 |
|
—decrease in interest rates - 2% |
| 157 |
| (234 | ) | ||
Foreign Currency Risk Sensitivity Analysis
Effective 1 July 2011, the functional currency was changed from Australian dollars to US dollars. All of the Company’s operations are conducted in the US in transactions denominated in US dollars. Only a relatively immaterial amount of administrative expense is incurred in Australia and paid in Australian dollars and cash balances maintained in Australian banks are also relatively immaterial. Therefore, the impact resulting from changes in the value of the US dollar to the Australian dollar would not have a material effect on income and equity.
Oil Prices Risk Sensitivity Analysis
The effect on profit and equity as a result of changes in oil prices with all variables remaining constant would be as follows:
|
| Consolidated Group |
| ||||
|
| 6 months to |
| 12 months to |
| ||
Change in profit/(loss) |
|
|
|
|
| ||
—improvement in US$ oil price of $10 per barrel |
| $ | 1,476 |
| $ | 3,648 |
|
—decline in US$ oil price of $10 per barrel |
| (1,424 | ) | (3,637 | ) | ||
Change in equity |
|
|
|
|
| ||
—improvement in US$ oil price of $10 per barrel |
| $ | 1,476 |
| $ | 3,648 |
|
—decline in US$ oil price of $10 per barrel |
| (1,424 | ) | (3,637 | ) | ||
b) Net Fair Value of Financial Assets and Liabilities
The net fair value of cash and cash equivalent and non-interest bearing monetary financial assets and financial liabilities of the consolidated entity approximate their carrying value.
The net fair value of other monetary financial assets and financial liabilities is based on discounting future cash flows by the current interest rates for assets and liabilities with similar risk profiles. The balances are not materially different from those disclosed in the statement of financial position of the Group.
c) Credit Risk
The maximum exposure to credit risk, excluding the value of any collateral or other security, at balance date to recognise the financial assets, is the carrying amount, net of any impairment of those assets, as disclosed in the balance sheet and notes to the financial statements.
The Group does not have any material credit risk exposure to any single debtor or group of debtors under financial instruments entered into by the consolidated entity.
d) Major Customers
For the six-month period ended 31 December 2012, our major customers were Helis Oil & Gas Company LLC (“Helis”), EOG Resources Inc. (“EOG”), Hess Corporation (“Hess”) and Suncor Energy Marketing Inc. (“Suncor”) and accounted for 29%, 22%, 21% and 10%, respectively, of our consolidated oil and gas sales revenue. For the year period ended 30 June 2012, our major customers were Helis, Hess, and EOG, and accounted for 47%, 20% and 14%, respectively, of our consolidated oil and gas sales revenue.
Helis, Hess and EOG are operators of our properties in the Bakken; they sell crude oil and natural gas to various purchasers in the region and remit our share of the revenue to us. If any of the companies who purchase the crude oil and natural gas from the operators were to discontinue purchasing production from this area, there are a number of other purchasers to whom we could sell our production with little or no delay. If those parties were to discontinue purchasing our product, there would be challenges initially, but ample markets to handle the disruption.
e) Liquidity Risk
Prudent liquidity risk management implies maintaining sufficient cash and marketable securities and the availability of funding through an adequate committed credit facility. The Company aims to maintain flexibility in funding to meet ongoing operational requirements and exploration and development expenditures by keeping a committed credit facility available. The Company has the following commitments related to its non-derivative financial liabilities:
|
| Consolidated Group |
| ||||
|
| 31 December 2012 |
| 30 June 2012 |
| ||
Trade and other payables |
|
|
|
|
| ||
—due within one year |
| $ | 38,770 |
| $ | 22,056 |
|
—due within 1 - 5 years |
| — |
| — |
| ||
—due later than 5 years |
| — |
| — |
| ||
|
| $ | 38,770 |
| $ | 22,056 |
|
|
| Consolidated Group |
| ||||
|
| 31 December 2012 |
| 30 June 2012 |
| ||
Accrued expenses |
|
|
|
|
| ||
—due within one year |
| $ | 13,072 |
| $ | 8,337 |
|
—due within 1 - 5 years |
| — |
| — |
| ||
—due later than 5 years |
| — |
| — |
| ||
|
| $ | 13,072 |
| $ | 8,337 |
|
|
| Consolidated Group |
| ||||
|
| 31 December 2012 |
| 30 June 2012 |
| ||
Credit facility principal payments |
|
|
|
|
| ||
—due within one year |
| $ | — |
| $ | — |
|
—due within 1 - 5 years |
| 30,000 |
| 15,000 |
| ||
—due later than 5 years |
| — |
| — |
| ||
|
| $ | 30,000 |
| $ | 15,000 |
|
f) Foreign Currency Risk
The Group is exposed to fluctuations in foreign currency arising from transactions in currencies other than the Group’s functional currency (US$).
g) Market Risk
The Company is exposed to fluctuations in its share price arising from the Texon Acquisition Scheme, in which subsequent to 31 December 2012, the Company used approximately 122.7 million newly issued Sundance shares to acquire Texon (“Acquisition Scheme Consideration”). Immediately preceding the announcement of the Acquisition Scheme, Sundance shares were valued at A$0.82 per share, which would have represented equity consideration of A$100.6 million. As at the Acquisition Date, Sundance shares were valued at A$1.05 per share, which resulted in equity consideration fair value of A$128.8 million. Following the completion of the Acquisition Scheme, the Company will undertake a comprehensive assessment of the fair value of the assets acquired and liabilities assumed as at the acquisition date and record the asset and liability fair values accordingly. Any difference between the fair value of the Acquisition Scheme Consideration and the fair value of the net assets acquired will be accounted for as goodwill or a bargain purchase as appropriate.
NOTE 32—PARENT COMPANY INFORMATION
a) Cost Basis
|
| Consolidated Group |
| ||||
|
| 31 December 2012 |
| 30 June 2012 |
| ||
Parent Entity |
|
|
|
|
| ||
Assets |
|
|
|
|
| ||
Current assets |
| $ | 1,490 |
| $ | 986 |
|
Investment in subsidiaries |
| 134,094 |
| 57,643 |
| ||
Total assets |
| $ | 135,584 |
| $ | 58,629 |
|
Liabilities |
|
|
|
|
| ||
Current liabilities |
| $ | 127 |
| $ | 109 |
|
Non-current liabilities |
| — |
| — |
| ||
Total liabilities |
| 127 |
| 109 |
| ||
Total net assets |
| $ | 135,457 |
| $ | 58,520 |
|
Equity |
|
|
|
|
| ||
Issued capital |
| 58,694 |
| 57,978 |
| ||
Share options reserve |
| 386 |
| 386 |
| ||
Retained earnings (loss) |
| 76,377 |
| 156 |
| ||
Total equity |
| $ | 135,457 |
| $ | 58,520 |
|
Financial Performance |
|
|
|
|
| ||
Profit/(loss) for the year |
| $ | (241 | ) | $ | 464 |
|
Other comprehensive income |
| — |
| — |
| ||
Total profit or loss and other comprehensive income |
| $ | (241 | ) | $ | 464 |
|
b) Equity Basis
|
| Consolidated Group |
| ||||
|
| 31 December 2012 |
| 30 June 2012 |
| ||
Parent Entity |
|
|
|
|
| ||
Assets |
|
|
|
|
| ||
Current assets |
| $ | 1,490 |
| $ | 986 |
|
Investment in subsidiaries |
| 150,453 |
| 73,327 |
| ||
Total assets |
| $ | 151,943 |
| $ | 74,313 |
|
Liabilities |
|
|
|
|
| ||
Current liabilities |
| $ | 127 |
| $ | 109 |
|
|
| Consolidated Group |
| ||||
|
| 31 December 2012 |
| 30 June 2012 |
| ||
Non-current liabilities |
| — |
| — |
| ||
Total liabilities |
| 127 |
| 109 |
| ||
Total net assets |
| $ | 151,816 |
| $ | 74,204 |
|
Equity |
|
|
|
|
| ||
Issued capital |
| $ | 58,694 |
| $ | 57,978 |
|
Share options reserve |
| 4,045 |
| 3,205 |
| ||
Foreign currency translation |
| (1,095 | ) | (941 | ) | ||
Retained earnings (loss) |
| 90,172 |
| 13,962 |
| ||
Total equity |
| $ | 151,816 |
| $ | 74,204 |
|
Financial Performance |
|
|
|
|
| ||
Profit/(loss) for the period before equity in income of subsidiaries |
| $ | (241 | ) | $ | 464 |
|
Equity in income of subsidiaries |
| 76,451 |
| 5,548 |
| ||
Other comprehensive income |
| (154 | ) | (247 | ) | ||
Total profit or loss and other comprehensive income |
| $ | 76,056 |
| $ | 5,765 |
|
c) Cash Flow
|
| Consolidated Group |
| ||||
|
| 31 December 2012 |
| 30 June 2012 |
| ||
Cash flow from operating activities |
| $ | (1,655 | ) | $ | 396 |
|
Cash flow from investing activities |
| 11 |
| (7,629 | ) | ||
Cash flow from financing activities |
| 716 |
| 147 |
| ||
Guarantees in relation to relation to the debts of subsidiaries
Sundance Energy Australia Limited has not entered into a deed of cross guarantee with its’ wholly-owned subsidiary, Sundance Energy, Inc. related to the credit facility with Wells Fargo.
NOTE 33. UNAUDITED SUPPLEMENTAL OIL AND GAS DISCLOSURES
Costs Incurred—The following table sets forth the capitalized costs incurred in our oil and gas production, exploration, and development activities:
(in thousands) |
| Six months ended |
| Year ended |
| ||
Property Acquisition Costs |
|
|
|
|
| ||
Proved |
| $ | 986 |
| $ | — |
|
Unproved |
| 23,330 |
| 8,670 |
| ||
Exploration costs |
| — |
| — |
| ||
Development costs |
| 46,981 |
| 50,520 |
| ||
|
| $ | 71,297 |
| $ | 59,190 |
|
Oil and Gas Reserve Information—Proved reserve quantities are based on estimates prepared by the Company in accordance with guidelines established by the Securities and Exchange Commission (SEC). Reserve definitions comply with definitions of Rules 4-10(a) (1)-(32) of Regulation S-X of the SEC.
Netherland, Sewell & Associates, Inc. (“NSAI”), an independent petroleum engineering consulting firm, prepared all of the total future net revenue discounted at 10% attributable to the total interests owned by the Company as at December 31, 2012, and June 30, 2012 and 2011. The individual primarily responsible for overseeing the review is a Senior Vice President with NSAI and a Registered Professional Engineer in the State of Texas with over 30 years of experience in oil and gas reservoir studies and evaluations.
Proved reserves are those quantities of oil and gas, which, by analysis of geosciences and engineering data, can be estimated with reasonable certainty to be economically producible—from a given date forward, from known reservoirs, and under existing economic conditions, operating methods, and government regulations—prior to the time at which contracts providing the right to operate expire, unless evidence indicates that renewal is reasonably certain, regardless of whether deterministic or probabilistic methods are used for the estimation. The project to extract the hydrocarbons must have commenced or the operator must be reasonably certain that it will commence the project within a reasonable time.
There are numerous uncertainties inherent in estimating quantities of proved reserves and projecting future rates of production and the timing of development expenditures. The estimation of our proved reserves employs one or more of the following: production trend extrapolation, analogy, volumetric assessment and material balance analysis. Techniques including review of production and pressure histories, analysis of electric logs and fluid tests, and interpretations of geologic and geophysical data are also involved in this estimation process.
The following reserve data represents estimates only and should not be construed as being exact.
|
| Oil |
| Gas |
| Total Oil |
|
Total proved reserves: |
|
|
|
|
|
|
|
June 30, 2011 |
| 4,788 |
| 7,692 |
| 6,070 |
|
Revisions of previous estimates |
| 220 |
| 170 |
| 248 |
|
Extensions and discoveries |
| 3,309 |
| 5,560 |
| 4,236 |
|
Production |
| (338 | ) | (370 | ) | (399 | ) |
June 30, 2012 |
| 7,979 |
| 13,052 |
| 10,155 |
|
Revisions of previous estimates |
| (556 | ) | (1,205 | ) | (757 | ) |
Extensions and discoveries |
| 1,597 |
| 4,322 |
| 2,317 |
|
Purchases of reserves in-place |
| 827 |
| 5,797 |
| 1,793 |
|
Production |
| (195 | ) | (233 | ) | (234 | ) |
Sales of reserves in-place |
| (3,894 | ) | (4,845 | ) | (4,702 | ) |
December 31, 2012 |
| 5,758 |
| 16,888 |
| 8,572 |
|
Proved developed reserves: |
|
|
|
|
|
|
|
June 30, 2011 |
| 1,497 |
| 2,637 |
| 1,936 |
|
June 30, 2012 |
| 2,564 |
| 4,905 |
| 3,382 |
|
December 31, 2012 |
| 1,932 |
| 5,242 |
| 2,805 |
|
Proved undeveloped reserves: |
|
|
|
|
|
|
|
June 30, 2011 |
| 3,291 |
| 5,055 |
| 4,134 |
|
June 30, 2012 |
| 5,415 |
| 8,147 |
| 6,773 |
|
December 31, 2012 |
| 3,826 |
| 11,646 |
| 5,767 |
|
During the year ended June 30, 2012, we added 4,236 MBoe through extensions and discoveries. Of these additions, approximately 1,486 and 2,750 MBoe were attributable to our Wattenberg and Bakken assets, respectively.
During the six-month period ended December 31, 2012, we added 2,317 MBoe through extensions and discoveries. Of these additions, approximately 1,522, 306 and 489 MBoe were attributable to our Wattenberg, Bakken and Mississippian/Woodford assets, respectively. Our purchase of reserves were located in the Machii Ross project of the Wattenberg, and sales of reserves were located in the South Antelope prospect of the Bakken.
Standardized Measure of Future Net Cash Flows—The “Standardized Measure of Discounted Future Net Cash Flows Relating to Proved Oil and Gas Reserves” (Standardized Measure) is calculated in accordance with guidance provided by the FASB. The Standardized Measure does not purport, nor should it be interpreted, to present the fair value of a company’s proved oil and gas reserves. Fair value would require, among other things, consideration of expected future economic and operating conditions, a discount factor more representative of the time value of money, and risks inherent in reserve estimates.
Under the Standardized Measure, future cash inflows are based upon the forecasted future production of year-end proved reserves. Future cash inflows are then reduced by estimated future production and development costs to determine net pre-tax cash flow. Future income taxes are computed by applying the statutory tax rate to the excess of pre-tax cash flow over our tax basis in the associated oil and gas properties. Tax credits and permanent differences are also considered in the future income tax calculation. Future net cash flow after income taxes is discounted using a 10% annual discount rate to arrive at the Standardized Measure.
The following summary sets forth our Standardized Measure:
(in thousands) |
| Six months ended |
| Year ended |
| ||
Cash inflows |
| $ | 594,549 |
| $ | 773,203 |
|
Production costs |
| (198,304 | ) | (215,252 | ) | ||
Development costs |
| (113,531 | ) | (137,121 | ) | ||
Income tax expense |
| (51,408 | ) | (101,481 | ) | ||
Net cash flow |
| 231,306 |
| 319,349 |
| ||
10% annual discount rate |
| (115,759 | ) | (182,064 | ) | ||
Standardized measure of discounted future net cash flow |
| $ | 115,547 |
| $ | 137,285 |
|
The following are the principal sources of change in the Standardized Measure:
(in thousands) |
| Six months ended |
| Year ended |
| ||
Standardized Measure, beginning of period |
| $ | 137,285 |
| $ | 59,444 |
|
Sales, net of production costs |
| (13,642 | ) | (23,432 | ) | ||
Net change in sales prices, net of production costs |
| (4,997 | ) | 23,379 |
| ||
Extensions and discoveries, net of future production and development costs |
| 41,481 |
| 63,264 |
| ||
Changes in future development costs |
| (3,565 | ) | (13,921 | ) | ||
Previously estimated development costs incurred during the period |
| 33,714 |
| 39,268 |
| ||
Revision of quantity estimates |
| (15,138 | ) | 5,645 |
| ||
Accretion of discount |
| 17,442 |
| 7,750 |
| ||
Change in income taxes |
| 17,098 |
| (19,081 | ) | ||
Purchases of reserves in-place |
| 7,626 |
| — |
| ||
Sales of reserves in-place |
| (87,374 | ) | — |
| ||
Change in production rates and other |
| (14,383 | ) | (5,031 | ) | ||
Standardized Measure, end of period |
| $ | 115,547 |
| $ | 137,285 |
|
Impact of Pricing—The estimates of cash flows and reserve quantities shown above are based upon the unweighted average first-day-of-the-month prices. If future gas sales are covered by contracts at specified prices, the contract prices would be used. Fluctuations in prices are due to supply and demand and are beyond our control.
The following average prices were used in determining the Standardized Measure as at:
|
| December 31, 2012 |
| June 30, 2012 |
| ||
Oil price per Bbl |
| $ | 94.71 |
| $ | 95.67 |
|
Gas price per Mcf |
| $ | 2.75 |
| $ | 3.15 |
|
We calculate the projected income tax effect using the “year-by-year” method for purposes of the supplemental oil and gas disclosures.
SIGNATURES
The registrant hereby certifies that it meets all of the requirements for filing on Form 20-F and that it has duly caused and authorized the undersigned to sign this annual report on its behalf.
| SUNDANCE ENERGY AUSTRALIA LIMITED | |||
|
|
| ||
|
|
|
| |
| By: | /s/ ERIC P. MCCRADY | ||
|
| Name: | Eric P. McCrady | |
|
| Title: | Chief Executive Officer | |
Date: May 15, 2015
EXHIBIT INDEX
Exhibit |
| Description of Exhibit |
1.1 |
| Constitution of Sundance Energy Australia Limited* |
|
|
|
4.1 |
| Credit Agreement, dated as of May 14, 2015, among Sundance Energy Australia Limited, Sundance Energy, Inc., as borrower, Morgan Stanley Energy Capital, Inc., as administrative agent, and the lenders party thereto** |
|
|
|
4.2 |
| Guarantee and Collateral Agreement, dated as of May 14, 2015, by Sundance Energy Australia Limited, Sundance Energy Inc. and other guarantor party thereto, in favor of Morgan Stanley Energy Capital Inc., as administrative agent** |
|
|
|
4.3 |
| Form of Deed of Access, Insurance and Indemnity for Directors and Officers* |
|
|
|
4.4 |
| Form of Employment Agreement, by and between Sundance Energy Inc. and Eric P. McCrady* |
|
|
|
8.1 |
| List of significant subsidiaries of Sundance Energy Australia Limited* |
|
|
|
12.1 |
| Certification of Chief Executive Officer pursuant to Section 302 of the Sarbanes-Oxley Act of 2002** |
|
|
|
12.2 |
| Certification of Chief Financial Officer pursuant to Section 302 of the Sarbanes-Oxley Act of 2002** |
|
|
|
13.1 |
| Certification of Chief Executive Officer pursuant to Section 906 of the Sarbanes-Oxley Act of 2002** |
|
|
|
13.2 |
| Certification of Chief Financial Officer pursuant to Section 906 of the Sarbanes-Oxley Act of 2002** |
|
|
|
15.1 |
| Report of Netherland, Sewell & Associates, Inc. regarding the Company’s estimated proved reserves as of December 31, 2013 dated July 3, 2014* |
15.2 |
| Report of Netherland, Sewell & Associates, Inc. regarding the Company’s estimated proved reserves as of December 31, 2014 dated April 27, 2015** |
* Filed as an Exhibit to our Form 20-F filed with the SEC on July 11, 2014, and incorporated herein by reference.
** Filed herewith.