Exhibit 99.1
Duke Energy Investor Update September 2020

// 2 // 2 SEPTEMBER INVESTOR UPDATE 2020 Safe Harbor statement This presentation includes forward - looking statements within the meaning of the federal securities laws. Actual results could differ materially from such forward - looking statements. The factors that could cause actual results to differ are discussed herein and in Duke Energy’s SEC filings, available at www.sec.gov . Regulation G disclosure In addition, today's discussion includes certain non - GAAP financial measures as defined under SEC Regulation G. A reconciliation of those measures to the most directly comparable GAAP measures is available in the Appendix herein and on our Investor Relations website at www.duke - energy.com/investors/ .
// 3 // 3 SEPTEMBER INVESTOR UPDATE 2020 Safe harbor statement This document includes forward - looking statements within the meaning of Section 27A of the Securities Act of 1933 and Section 21 E of the Securities Exchange Act of 1934. Forward - looking statements are based on management’s beliefs and assumptions and can often be identified by terms and phrases that include “anticipate,” “be lie ve,” “intend,” “estimate,” “expect,” “continue,” “should,” “could,” “may,” “plan,” “project,” “predict,” “will,” “potential,” “forecast,” “target,” “guidance,” “outlook” or other similar terminology. Var ious factors may cause actual results to be materially different than the suggested outcomes within forward - looking statements; accordingly, there is no assurance that such results will be realized. These factors include, but are not limited to: The impact of the COVID - 19 pandemic; State, federal and foreign legislative and regulatory initiatives, including costs of compliance with existing and future environmen tal requirements, including those related to climate change, as well as rulings that affect cost and investment recovery or have an impact on rate structures or market prices; The extent and timing of costs and li abilities to comply with federal and state laws, regulations and legal requirements related to coal ash remediation, including amounts for required closure of certain ash impoundments, are uncerta in and difficult to estimate; The ability to recover eligible costs, including amounts associated with coal ash impoundment retirement obligations and costs related to significant weather events, and to e arn an adequate return on investment through rate case proceedings and the regulatory process; The costs of decommissioning nuclear facilities could prove to be more extensive than amounts estimated a nd all costs may not be fully recoverable through the regulatory process; Costs and effects of legal and administrative proceedings, settlements, investigations and claims; Industrial, commercial and re sidential growth or decline in service territories or customer bases resulting from sustained downturns of the economy and the economic health of our service territories or variations in customer usage pa tte rns, including energy efficiency efforts and use of alternative energy sources, such as self - generation and distributed generation technologies; Federal and state regulations, laws and other efforts designed to promote and expand the use of energy efficiency measures and distributed generation technologies, such as private solar and battery storage, in Duke Energy service territories could resu lt in customers leaving the electric distribution system, excess generation resources as well as stranded costs; Advancements in technology; Additional competition in electric and natural gas markets a nd continued industry consolidation; The influence of weather and other natural phenomena on operations, including the economic, operational and other effects of severe storms, hurricanes, droughts, earthq uak es and tornadoes, including extreme weather associated with climate change; The ability to successfully operate electric generating facilities and deliver electricity to customers including dir ect or indirect effects to the company resulting from an incident that affects the U.S. electric grid or generating resources; The ability to obtain the necessary permits and approvals and to complete necessary or de sirable pipeline expansion or infrastructure projects in our natural gas business; Operational interruptions to our natural gas distribution and transmission activities; The availability of adequate in terstate pipeline transportation capacity and natural gas supply; The impact on facilities and business from a terrorist attack, cybersecurity threats, data security breaches, operational accidents, inform ati on technology failures or other catastrophic events, such as fires, explosions, pandemic health events or other similar occurrences; The inherent risks associated with the operation of nuclear facilities, inc luding environmental, health, safety, regulatory and financial risks, including the financial stability of third - party service providers; The timing and extent of changes in commodity prices and interest rates an d the ability to recover such costs through the regulatory process, where appropriate, and their impact on liquidity positions and the value of underlying assets; The results of financing efforts, in clu ding the ability to obtain financing on favorable terms, which can be affected by various factors, including credit ratings, interest rate fluctuations, compliance with debt covenants and conditions and gene ral market and economic conditions; Credit ratings of the Duke Energy Registrants may be different from what is expected; Declines in the market prices of equity and fixed - income securities and resultant cash f unding requirements for defined benefit pension plans, other post - retirement benefit plans and nuclear decommissioning trust funds; Construction and development risks associated with the completion of t he Duke Energy Registrants’ capital investment projects, including risks related to financing, obtaining and complying with terms of permits, meeting construction budgets and schedules and satisfyin g o perating and environmental performance standards, as well as the ability to recover costs from customers in a timely manner, or at all; Changes in rules for regional transmission organizations, includi ng changes in rate designs and new and evolving capacity markets, and risks related to obligations created by the default of other participants; The ability to control operation and maintenance costs; The level of creditworthiness of counterparties to transactions; The ability to obtain adequate insurance at acceptable costs; Employee workforce factors, including the potential inability to attract and retain k ey personnel; The ability of subsidiaries to pay dividends or distributions to Duke Energy Corporation holding company (the Parent);The performance of projects undertaken by our nonregulated businesses and the su ccess of efforts to invest in and develop new opportunities; The effect of accounting pronouncements issued periodically by accounting standard - setting bodies; The impact of U.S. tax legislation to ou r financial condition, results of operations or cash flows and our credit ratings; The impacts from potential impairments of goodwill or equity method investment carrying values; and the ability to i mpl ement our business strategy, including enhancing existing technology systems. Additional risks and uncertainties are identified and discussed in the Duke Energy Registrants' reports filed with the SEC an d a vailable at the SEC's website at sec.gov. In light of these risks, uncertainties and assumptions, the events described in the forward - looking statements might not occur or might occur to a different extent or at a different time than described. Forward - looking statements speak only as of the date they are made and the Duke Energy Registrants expressly disclaim an obligation to publicly update or revise any f orw ard - looking statements, whether as a result of new information, future events or otherwise.

// 4 // 4 SEPTEMBER INVESTOR UPDATE 2020 x Duke Energy is now a 95% regulated electric and gas utility, with a robust low - risk $56 billion capital plan x Communities we serve are fast growing and vibrant, operating in above - average regulatory jurisdictions x High level of confidence in 4% - 6% EPS growth outlook and 6% rate base CAGR x Carolinas IRPs filed on September 1 represent a significant step toward a cleaner energy future Key Takeaways
// 5 // 5 SEPTEMBER INVESTOR UPDATE 2020 Our Long - Term Investor Value Proposition Scale owner of premium utilities Duke Energy is the largest regulated utility in North America by: Rate base, electric customers and total assets We operate premium utilities in 7 states across the country, benefiting from diversification and strong regional growth trends Strong regulated growth outlook $56Bn 5 - year capital plan De - risked, focused on smaller scale projects Utilities rate base growth rate of 6% Strong customer and load growth fundamentals Low - risk, regulated business Successfully eliminated exposure to businesses with volatile earnings earlier than peers Premium regulated electric and gas franchises Delivering on annual earnings guidance Delivered EPS within our annual guidance range in 7 of the last 8 years Track record of keeping O&M costs flat and driving efficiencies across the enterprise Strong, stable underlying utility businesses drive our consistent earnings results Well positioned for energy transition to renewables Industry leader in carbon reductions Aggressive carbon reduction goals drive future investment opportunities Strong commercial renewables business supports ESG vision and goals History of major project execution and prudent management Retired 51 coal units (6,500 MW) since 2010, replaced with 8,000 MW of cleaner burning natural gas as well as solar generation Prudent decisions to exit projects when risk increases beyond rewards

// 6 // 6 SEPTEMBER INVESTOR UPDATE 2020 Carolinas IRP Highlights
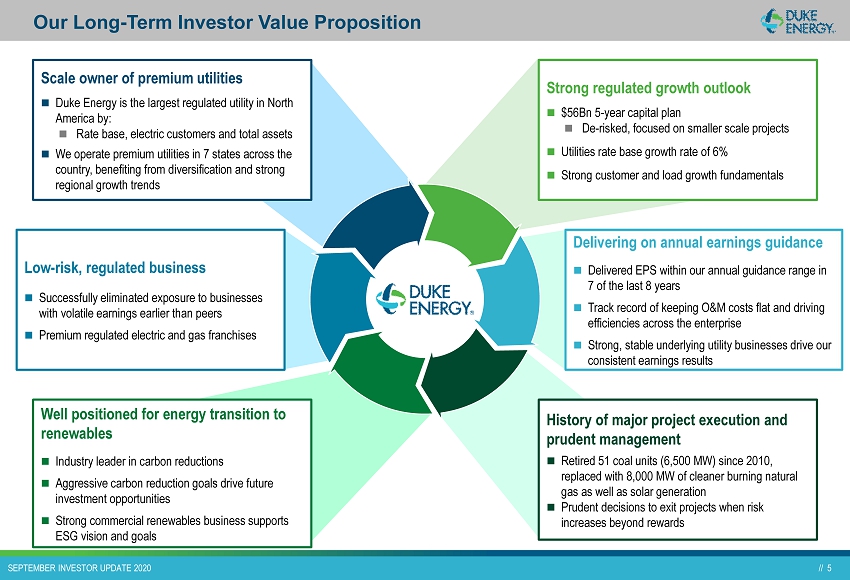
// 7 // 7 SEPTEMBER INVESTOR UPDATE 2020 LDC Infrastructure 7 % Gas Midstream 7% Electric Distribution 38 % Duke Energy’s clean energy future vision for the Carolinas 7 Carolinas IRP s illustrate multiple pathways to a cleaner energy future Collaborated with over 200 Stakeholders to help shape path to achieve our climate goals DESTINATION => 50% REDUCTION IN CO 2 EMISSIONS BY 2030 AND NET - ZERO BY 2050 2030 CARBON REDUCTION IN CAROLINAS WILL RANGE FROM 56% TO 74% KEY MESSAGES ▪ Carolinas Integrated Resource Plans (IRP) filed Sept. 1 include six portfolios – Base case has a least cost standard (1) , following current energy policy – Other portfolios present options for accelerated decarbonization, a Duke Energy priority with emerging support in the Carolinas – All portfolios represent significant capital opportunities ▪ Renewables take center stage in five of six pathways, while natural gas continues to play a vital role – Renewables and storage additions average 16,000 MW across the six portfolios, with gas additions averaging 6,500 MW – Dispatchable resources are needed to support significant renewables additions (recent example in California) – Winter peak in the Carolinas necessitates natural gas generation to supply power on early/dark mornings in January and February – Multiple third party studies (1) support the role of natural gas enabling a cost - effective transition to de - carbonization (1) See appendix slides for additional information

// 8 // 8 SEPTEMBER INVESTOR UPDATE 2020 Carolinas IRPs: Summary Results Base without Carbon Policy Base with Carbon Policy Earliest Practicable Coal Retirements 70% CO 2 Reduction: High Wind 70% CO 2 Reduction: High Small Modular Reactor (SMR) No New Gas Generation Pathway A B C D E F System CO 2 Reduction (2030 | 2035) 56% 53% 59% 62% 64% 64% 70% 73% 71% 74% 65% 73% Present Value Revenue Requirement (PVRR) [$B] (through 2050) 1 $79.8 $82.5 $84.1 $100.5 $95.5 $108.1 Estimated Transmission Investment Required [$B] 2 $0.9 $1.8 $1.3 $7.5 $3.1 $8.9 Total Solar [MW] 3, 4 8,650 12,300 12,400 16,250 16,250 16,400 Incremental Onshore Wind [MW] 3 0 750 1,350 2,850 2,850 3,150 Incremental Offshore Wind [MW] 3 0 0 0 2,650 250 2,650 Incremental SMR Capacity [MW] 3 0 0 0 0 1,350 700 Incremental Storage [MW] 3, 5 1,050 2,200 2,200 4,400 4,400 7,400 Incremental Gas [MW] 3 9,600 7,350 9,600 6,400 6,100 0 Total Contribution from Energy Efficiency and Demand Response Initiatives [MW] 6 2,050 2,050 2,050 3,350 3,350 3,350 Dependency on Technology & Policy Advancement 1 PVRRs exclude the cost of CO 2 as tax . Including CO 2 costs as tax would increase PVRRs by ~ $ 11 - $ 16 B through 2050 2 Represents an estimated nominal transmission investment ; cost is included in PVRR calculation 3 All capacities are Total/Incremental nameplate capacity within the IRP planning horizon 4 Total solar nameplate capacity includes 3 , 925 MW connected in DEC and DEP combined as of year - end 2020 (projected) 5 Includes 4 - hr, 6 - hr, and 8 - hr grid - tied storage, storage at solar plus storage sites, and pumped storage 6 Contribution of EE/DR (including Integrated Volt - Var Control (IVVC) and Distribution System Demand Response (DSDR)) in 2035 to peak winter planning hour
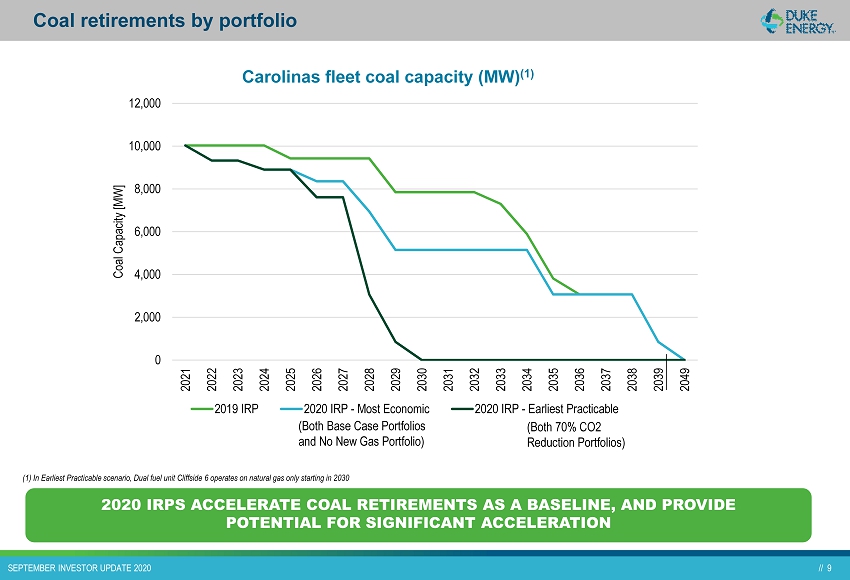
// 9 // 9 SEPTEMBER INVESTOR UPDATE 2020 0 2,000 4,000 6,000 8,000 10,000 12,000 2021 2022 2023 2024 2025 2026 2027 2028 2029 2030 2031 2032 2033 2034 2035 2036 2037 2038 2039 2049 Coal Capacity [MW] 2019 IRP 2020 IRP - Most Economic 2020 IRP - Earliest Practicable Carolinas fleet coal capacity (MW) (1) (1) In Earliest Practicable scenario, Dual fuel unit Cliffside 6 operates on natural gas only starting in 2030 (Both Base Case Portfolios and No New Gas Portfolio) (Both 70% CO2 Reduction Portfolios) Coal retirements by portfolio 2020 IRPS ACCELERATE COAL RETIREMENTS AS A BASELINE, AND PROVIDE POTENTIAL FOR SIGNIFICANT ACCELERATION
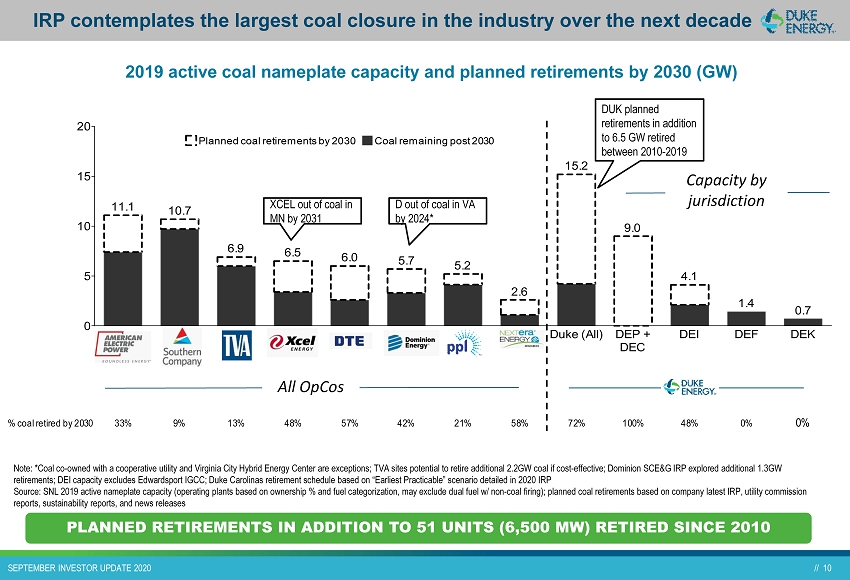
// 10 // 10 SEPTEMBER INVESTOR UPDATE 2020 0 5 10 15 20 11.1 10.7 6.9 6.5 6.0 5.7 5.2 2.6 Duke (All) 15.2 DEP + DEC 9.0 DEI 4.1 DEF 1.4 DEK 0.7 100%57% 58% 48% 0% 0%72%9% 13%% coal retired by 2030 33% 21%48% 42% Planned coal retirements by 2030 Coal remaining post 2030 D out of coal in VA by 2024* XCEL out of coal in MN by 2031 Capacity by jurisdiction All OpCos 2019 active coal nameplate capacity and planned retirements by 2030 (GW) IRP contemplates the largest coal closure in the industry over the next decade Note: *Coal co - owned with a cooperative utility and Virginia City Hybrid Energy Center are exceptions; TVA sites potential to re tire additional 2.2GW coal if cost - effective; Dominion SCE&G IRP explored additional 1.3GW retirements; DEI capacity excludes Edwardsport IGCC; Duke Carolinas retirement schedule based on “Earliest Practicable” scena rio detailed in 2020 IRP Source: SNL 2019 active nameplate capacity (operating plants based on ownership % and fuel categorization, may exclude dual f uel w/ non - coal firing); planned coal retirements based on company latest IRP, utility commission reports, sustainability reports, and news releases PLANNED RETIREMENTS IN ADDITION TO 51 UNITS (6,500 MW) RETIRED S INCE 2010 DUK planned retirements in addition to 6.5 GW retired between 2010 - 2019
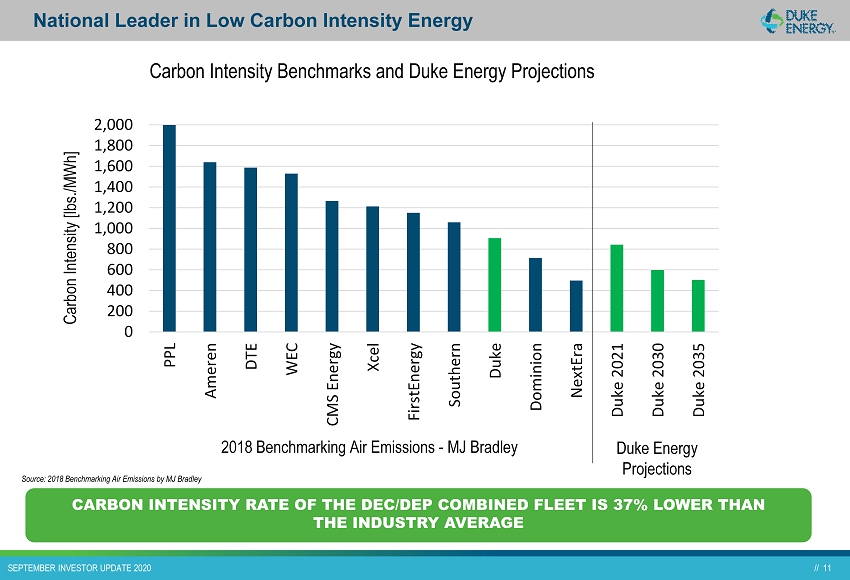
// 11 // 11 SEPTEMBER INVESTOR UPDATE 2020 National Leader in Low Carbon Intensity Energy CARBON INTENSITY RATE OF THE DEC/DEP COMBINED FLEET IS 37% LOWER THAN THE INDUSTRY AVERAGE 0 200 400 600 800 1,000 1,200 1,400 1,600 1,800 2,000 PPL Ameren DTE WEC CMS Energy Xcel FirstEnergy Southern Duke Dominion NextEra Duke 2021 Duke 2030 Duke 2035 Carbon Intensity [lbs./MWh] Carbon Intensity Benchmarks and Duke Energy Projections 2018 Benchmarking Air Emissions - MJ Bradley Duke Energy Projections Source: 2018 Benchmarking Air Emissions by MJ Bradley
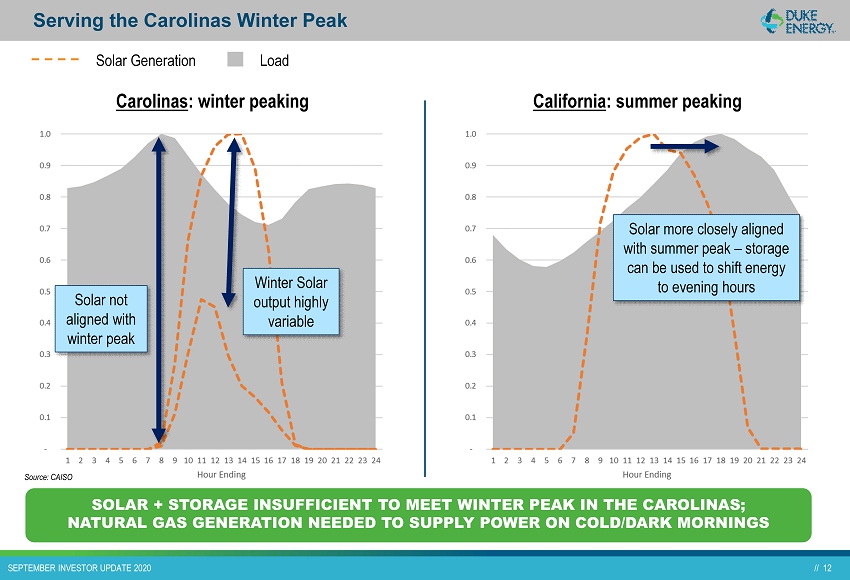
// 12 // 12 SEPTEMBER INVESTOR UPDATE 2020 Carolinas : winter peaking California : summer peaking Solar not aligned with winter peak Solar more closely aligned with summer peak – storage can be used to shift energy to evening hours Source: CAISO Solar Generation Load Winter Solar output highly variable Serving the Carolinas Winter Peak SOLAR + STORAGE INSUFFICIENT TO MEET WINTER PEAK IN THE CAROLINA S; NATURAL GAS GENERATION NEEDED TO SUPPLY POWER ON COLD/DARK MORNI NGS
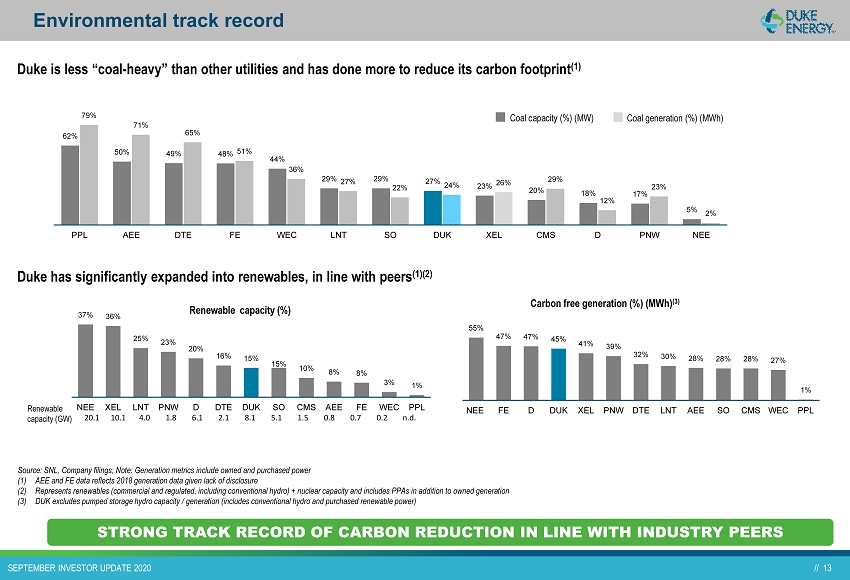
// 13 // 13 SEPTEMBER INVESTOR UPDATE 2020 Duke is less “coal - heavy” than other utilities and has done more to reduce its carbon footprint (1) Duke has significantly expanded into renewables, in line with peers (1)(2) 20.1 10.1 4.0 1.8 6.1 2.1 8.1 5.1 1.5 0.8 0.7 0.2 n.d. Renewable capacity (%) 62% 50% 49% 48% 44% 29% 29% 27% 23% 20% 18% 17% 5% 79% 71% 65% 51% 36% 27% 22% 24% 26% 29% 12% 23% 2% PPL AEE DTE FE WEC LNT SO DUK XEL CMS D PNW NEE Coal capacity (%) (MW) Coal generation (%) (MWh) 37% 36% 25% 23% 20% 16% 15% 15% 10% 8% 8% 3% 1% NEE XEL LNT PNW D DTE DUK SO CMS AEE FE WEC PPL Carbon free generation (%) (MWh) (3) Renewable capacity (GW) Source: SNL, Company filings; Note: Generation metrics include owned and purchased power (1) AEE and FE data reflects 2018 generation data given lack of disclosure (2) Represents renewables (commercial and regulated, including conventional hydro) + nuclear capacity and includes PPAs in addition to owned generation (3) DUK excludes pumped storage hydro capacity / generation (includes conventional hydro and purchased renewable power) 55% 47% 47% 45% 41% 39% 32% 30% 28% 28% 28% 27% 1% NEE FE D DUK XEL PNW DTE LNT AEE SO CMS WEC PPL Environmental track record STRONG TRACK RECORD OF CARBON REDUCTION IN LINE WITH INDUSTRY PE ERS

// 14 // 14 SEPTEMBER INVESTOR UPDATE 2020 Premium Utility Franchises With Attractive Fundamentals
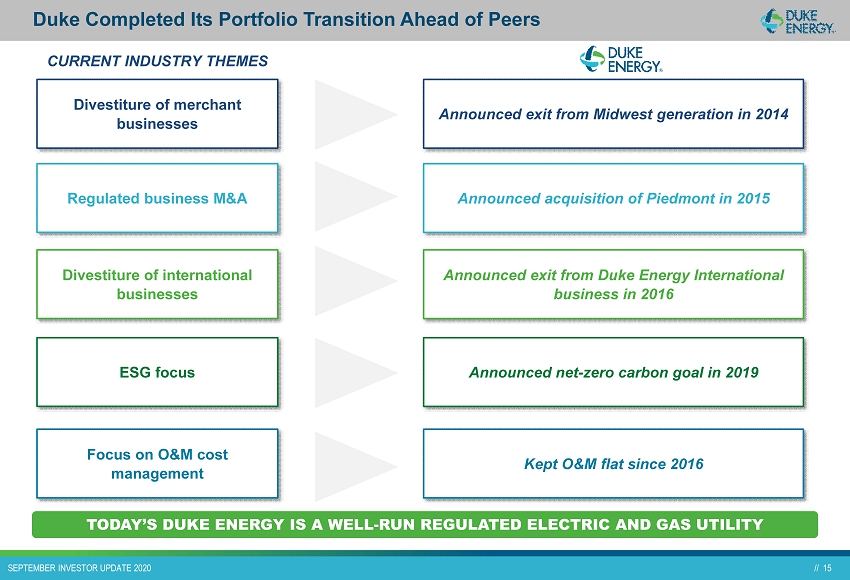
// 15 // 15 SEPTEMBER INVESTOR UPDATE 2020 Duke Completed Its Portfolio Transition Ahead of Peers Divestiture of merchant businesses Regulated business M&A ESG focus Focus on O&M cost management Announced exit from Midwest generation in 2014 Announced acquisition of Piedmont in 2015 Announced net - zero carbon goal in 2019 Kept O&M flat since 2016 Divestiture of international businesses Announced exit from Duke Energy International business in 2016 TODAY’S DUKE ENERGY IS A WELL - RUN REGULATED ELECTRIC AND GAS UTI LITY CURRENT INDUSTRY THEMES
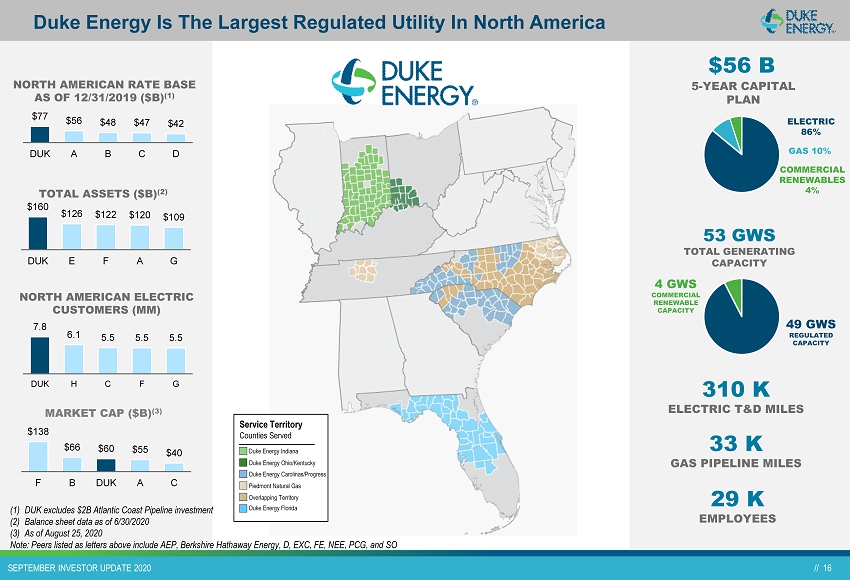
// 16 // 16 SEPTEMBER INVESTOR UPDATE 2020 Duke Energy Is The Largest Regulated Utility In North America Service Territory Counties Served Duke Energy Indiana Duke Energy Ohio/Kentucky Duke Energy Carolinas/Progress Piedmont Natural Gas Overlapping Territory Duke Energy Florida 310 K ELECTRIC T&D MILES 33 K GAS PIPELINE MILES 29 K EMPLOYEES (1) DUK excludes $2B Atlantic Coast Pipeline investment (2) Balance sheet data as of 6/30/2020 (3) As of August 25, 2020 Note: Peers listed as letters above include AEP, Berkshire Hathaway Energy, D, EXC, FE, NEE, PCG, and SO NORTH AMERICAN RATE BASE AS OF 12/31/2019 ($B) (1) $77 $56 $48 $47 $42 DUK A B C D TOTAL ASSETS ($B) (2) $160 $126 $122 $120 $109 DUK E F A G $56 B 5 - YEAR CAPITAL PLAN ELECTRIC 86% GAS 10% COMMERCIAL RENEWABLES 4% 53 GWS TOTAL GENERATING CAPACITY 49 GWS REGULATED CAPACITY 4 GWS COMMERCIAL RENEWABLE CAPACITY MARKET CAP ($B) (3) $138 $66 $60 $55 $40 F B DUK A C NORTH AMERICAN ELECTRIC CUSTOMERS (MM) 7.8 6.1 5.5 5.5 5.5 DUK H C F G
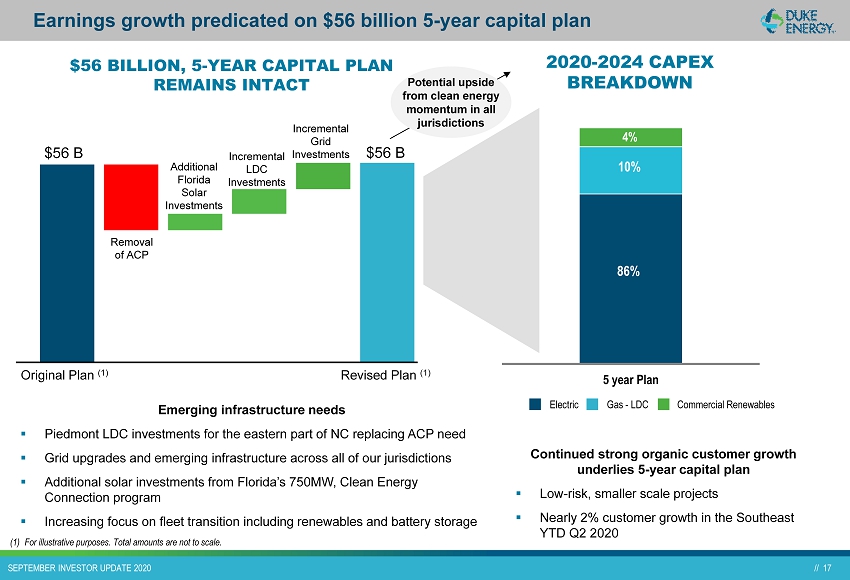
// 17 // 17 SEPTEMBER INVESTOR UPDATE 2020 Earnings growth predicated on $56 billion 5 - year capital plan 17 Removal of ACP Additional Florida Solar Investments Incremental Grid Investments Incremental LDC Investments $56 BILLION, 5 - YEAR CAPITAL PLAN REMAINS INTACT Original Plan (1) Revised Plan (1) $56 B $56 B Emerging infrastructure needs ▪ Piedmont LDC investments for the eastern part of NC replacing ACP need ▪ Grid upgrades and emerging infrastructure across all of our jurisdictions ▪ Additional solar investments from Florida’s 750MW, Clean Energy Connection program ▪ Increasing focus on fleet transition including renewables and battery storage 5 year Plan 86% 4% 10% Gas - LDC Electric Commercial Renewables 2020 - 2024 CAPEX BREAKDOWN Continued strong organic customer growth underlies 5 - year capital plan ▪ Low - risk, smaller scale projects ▪ Nearly 2% customer growth in the Southeast YTD Q2 2020 Potential upside from clean energy momentum in all jurisdictions (1) For illustrative purposes. Total amounts are not to scale.
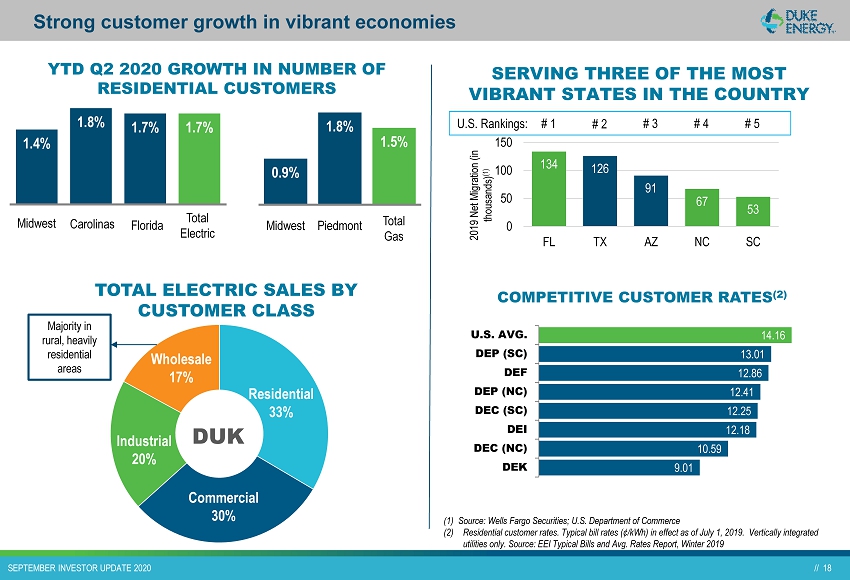
// 18 // 18 SEPTEMBER INVESTOR UPDATE 2020 DUK Residential 33% Commercial 30% Industrial 20% Strong customer growth in vibrant economies TOTAL ELECTRIC SALES BY CUSTOMER CLASS Wholesale 17% Majority in rural, heavily residential areas YTD Q2 2020 GROWTH IN NUMBER OF RESIDENTIAL CUSTOMERS 1.4% 1.8% 1.7% 1.7% Midwest Carolinas Florida Total Electric 0.9% 1.8% 1.5% Midwest Piedmont Total Gas 134 126 91 67 53 0 50 100 150 FL TX AZ NC SC SERVING THREE OF THE MOST VIBRANT STATES IN THE COUNTRY 2019 Net Migration (in thousands) (1) (1) Source: Wells Fargo Securities; U.S. Department of Commerce (2) Residential customer rates. Typical bill rates (¢/kWh) in effect as of July 1, 2019. Vertically integrated utilities only. Source: EEI Typical Bills and Avg. Rates Report, Winter 2019 # 5 # 3 # 2 # 4 # 1 U.S. Rankings: 9.01 10.59 12.18 12.25 12.41 12.86 13.01 14.16 DEK DEC (NC) DEI DEC (SC) DEP (NC) DEF DEP (SC) U.S. AVG. COMPETITIVE CUSTOMER RATES (2)
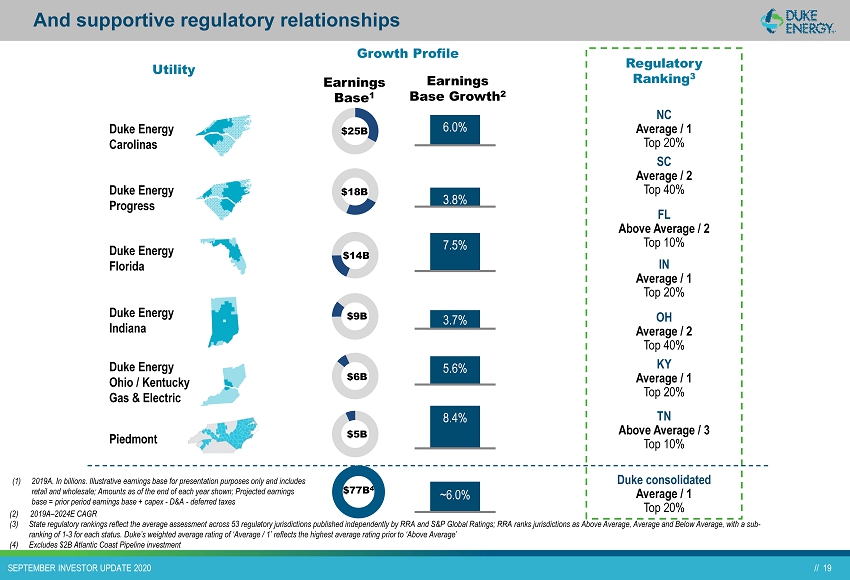
// 19 // 19 SEPTEMBER INVESTOR UPDATE 2020 Duke Energy Carolinas Duke Energy Progress Duke Energy Florida Duke Energy Indiana Duke Energy Ohio / Kentucky Gas & Electric Utility Growth Profile Piedmont Regulatory Ranking 3 FL Above Average / 2 Top 10% IN Average / 1 Top 20% OH Average / 2 Top 40% NC Average / 1 Top 20% SC Average / 2 Top 40% KY Average / 1 Top 20% TN Above Average / 3 Top 10% Duke consolidated Average / 1 Top 20% (1) 2019A. In billions. Illustrative earnings base for presentation purposes only and includes retail and wholesale; Amounts as of the end of each year shown; Projected earnings base = prior period earnings base + capex - D&A - deferred taxes And supportive regulatory relationships $25B $18B $14B $9B $6B $5B $77B 4 Earnings Base 1 Earnings Base Growth 2 6.0% 3.8% 7.5% 3.7% 5.6% 8.4% ~ 6.0% (2) 2019A – 2024E CAGR (3) State regulatory rankings reflect the average assessment across 53 regulatory jurisdictions published independently by RRA an d S &P Global Ratings; RRA ranks jurisdictions as Above Average, Average and Below Average, with a sub - ranking of 1 - 3 for each status. Duke’s weighted average rating of ‘Average / 1’ reflects the highest average rating prior to ‘Ab ove Average’ (4) Excludes $2B Atlantic Coast Pipeline investment
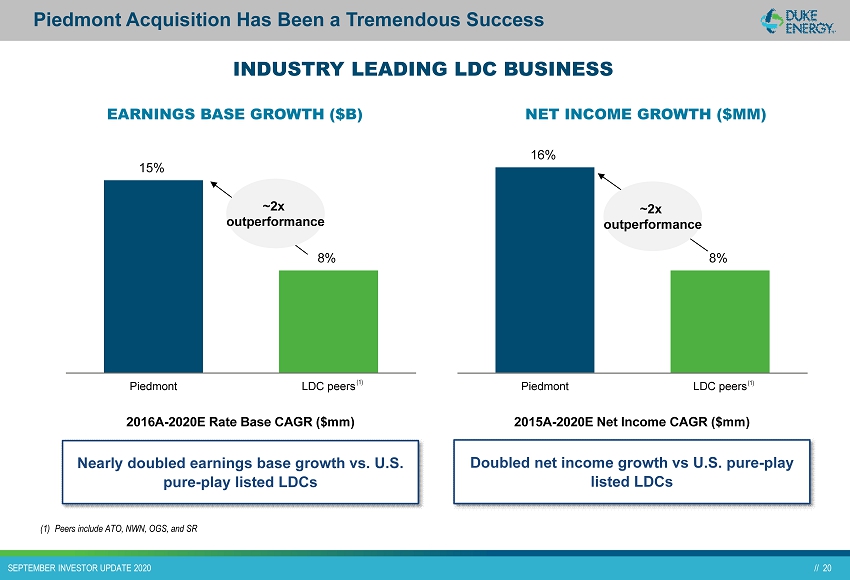
// 20 // 20 SEPTEMBER INVESTOR UPDATE 2020 15% 8% Piedmont LDC peers EARNINGS BASE GROWTH ($B) NET INCOME GROWTH ($MM) Nearly doubled earnings base growth vs. U.S. pure - play listed LDCs Doubled net income growth vs U.S. pure - play listed LDCs (1) Peers include ATO, NWN, OGS, and SR (1) 16% 8% Piedmont LDC peers (1) 2015A - 2020E Net Income CAGR ($mm) 2016A - 2020E Rate Base CAGR ($mm) ~2x outperformance ~2x outperformance INDUSTRY LEADING LDC BUSINESS Piedmont Acquisition Has Been a Tremendous Success
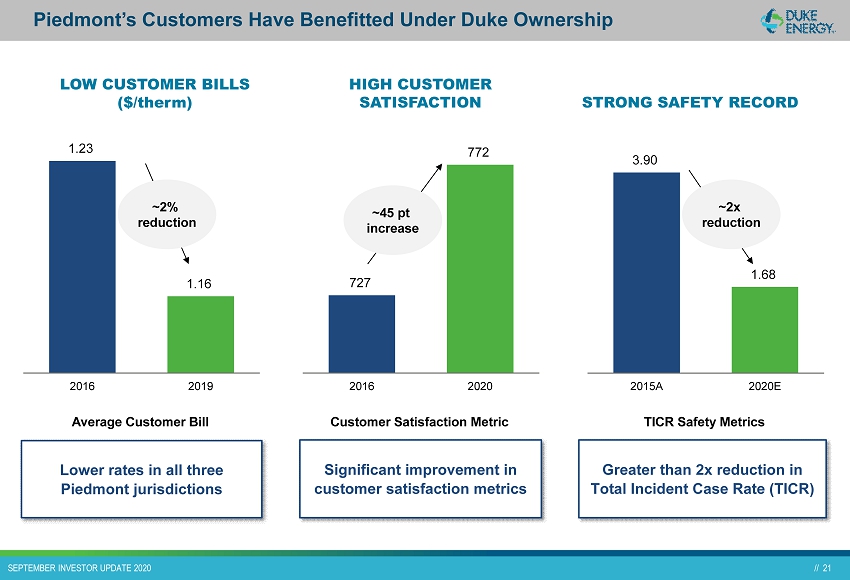
// 21 // 21 SEPTEMBER INVESTOR UPDATE 2020 1.23 1.16 2016 2019 Piedmont’s Customers Have Benefitted Under Duke Ownership LOW CUSTOMER BILLS ($/ therm ) HIGH CUSTOMER SATISFACTION STRONG SAFETY RECORD Lower rates in all three Piedmont jurisdictions Significant improvement in customer satisfaction metrics Greater than 2x reduction in Total Incident Case Rate (TICR) Customer Satisfaction Metric TICR Safety Metrics Average Customer Bill ~2% reduction 727 772 2016 2020 ~45 pt increase 3.90 1.68 2015A 2020E ~2x reduction

// 22 // 22 SEPTEMBER INVESTOR UPDATE 2020 Track Record of Operational Performance
// 23 // 23 SEPTEMBER INVESTOR UPDATE 2020 Strong Track Record of Performance x Met annual guidance in 7 of the last 8 years while exiting businesses with volatile earnings x Kept O&M flat, including absorbing ~$300 million of O&M from the Piedmont acquisition in 2016, in addition to offsetting wage / salary increases and general inflation x Earned at or above allowed ROE’s on a consistent basis x Consistently maintained customer bills below national average across all jurisdictions x Achieved all - time high in customer satisfaction measures in 2Q20, reinforcing the effectiveness of our customer and community outreach x Remained one of the electric utility industry’s top leaders in safety performance for fifth year in a row
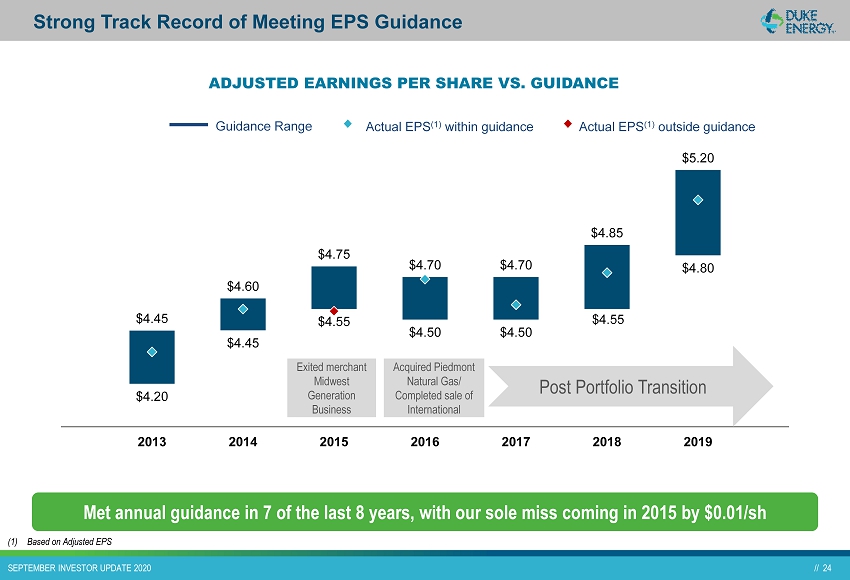
// 24 // 24 SEPTEMBER INVESTOR UPDATE 2020 $4.20 $4.45 $4.55 $4.50 $4.50 $4.55 $4.80 $4.45 $4.60 $4.75 $4.70 $4.70 $4.85 $5.20 2013 2014 2015 2016 2017 2018 2019 Strong Track Record of Meeting EPS Guidance Actual EPS (1) within guidance Guidance Range ADJUSTED EARNINGS PER SHARE VS. GUIDANCE Actual EPS (1) outside guidance Met annual guidance in 7 of the last 8 years, with our sole miss coming in 2015 by $0.01/ sh Post Portfolio Transition Exited merchant Midwest Generation Business Acquired Piedmont Natural Gas/ Completed sale of International (1) Based on Adjusted EPS

// 25 // 25 SEPTEMBER INVESTOR UPDATE 2020 We Have Succeeded On Major Project Development / Management OUTSTANDING PROJECT MANAGEMENT ON KEY PROJECTS… …AND PRUDENT DECISIONS TO NO LONGER PURSUE PROJECTS WHEN POTENTIAL RISKS EXCEED REWARDS x Citrus County Combined Cycle (CC) – 1,640 MW ▪ $1.5 billion investment recovered through GBRA mechanism in FL x Lee CC – 750 MW ▪ $700mm investment ▪ Required additional Piedmont infrastructure x Asheville CC – 570 MW ▪ Part of $1.4 B Western Carolinas Modernization Plan to retire coal early and increase renewables x Edwardsport IGCC – 618 MW ▪ Completed this advanced technology project when others could not ▪ Cost recovery moved to base rates as requested/ approved in most recent rate case x Other significant generation adds to replace coal ▪ Total of 8 GW generation added since 2010 x Levy and Lee new nuclear ▪ Had received approval, but post - Toshiba and Westinghouse bankruptcy saw too much risk ▪ Shifted investment to augmenting natural gas and solar generation x Crystal River Nuclear Plant (CR3) ▪ Stopped investment and recovered legacy Progress investment via securitization x Atlantic Coast Pipeline ▪ Permitting delays and legal challenges created unacceptable cost uncertainty Prudent decision making and efficient execution
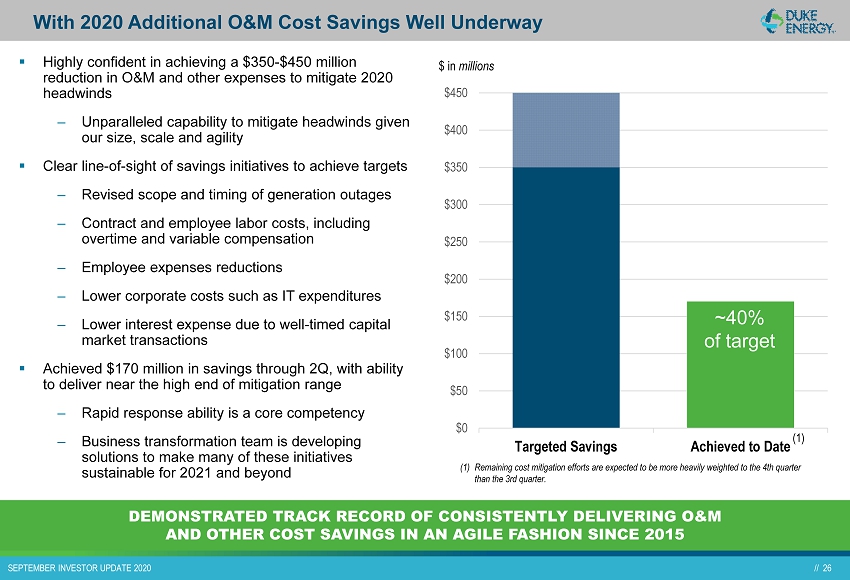
// 26 // 26 SEPTEMBER INVESTOR UPDATE 2020 With 2020 Additional O&M Cost Savings Well Underway ▪ Highly confident in achieving a $350 - $450 million reduction in O&M and other expenses to mitigate 2020 headwinds ‒ Unparalleled capability to mitigate headwinds given our size, scale and agility ▪ Clear line - of - sight of savings initiatives to achieve targets ‒ Revised scope and timing of generation outages ‒ Contract and employee labor costs, including overtime and variable compensation ‒ Employee expenses reductions ‒ Lower corporate costs such as IT expenditures ‒ Lower interest expense due to well - timed capital market transactions ▪ Achieved $170 million in savings through 2Q, with ability to deliver near the high end of mitigation range ‒ Rapid response ability is a core competency ‒ Business transformation team is developing solutions to make many of these initiatives sustainable for 2021 and beyond DEMONSTRATED TRACK RECORD OF CONSISTENTLY DELIVERING O&M AND OTHER COST SAVINGS IN AN AGILE FASHION SINCE 2015 $0 $50 $100 $150 $200 $250 $300 $350 $400 $450 Targeted Savings Achieved to Date ~40% of target $ in millions (1) (1) Remaining cost mitigation efforts are expected to be more heavily weighted to the 4th quarter than the 3rd quarter.

// 27 // 27 SEPTEMBER INVESTOR UPDATE 2020 (1) Non - rider Recoverable O&M excludes special items and other non - recoverable charges incurred. For a reconciliation to GAAP O&M se e accompanying materials at www.duke - energy.com/investors (2) S&P Global Market Intelligence; SNL Energy Data as sourced from FERC Form 1. Data from over 128 U.S. Regulated Utilities with mo re than 100,000 customers, rounded. TOP TIER COST MANAGEMENT CONTINUES ▪ Outstanding track record of cost management ▪ Since 2015, we have kept non - recoverable O&M flat – Includes absorbing ~$300 million of O&M from the Piedmont acquisition in 2016, in addition to offsetting wage and salary increases and general inflation ▪ Leveraging increased cost flexibility to keep non - rider recoverable O&M flat despite inflation ▪ Employing data analytics and digital capabilities to enhance decision making and prioritization ▪ State of the art Innovation Center – Optimist Hall ▪ Utilizing cost saving opportunities as a lever to meet business commitments ▪ Applying our size and scale to transform operational capabilities $4.9 $4.9 $5.0 $4.9 2016 2017 2018 2019 O&M COST MANAGEMENT ($ IN BILLIONS) Non - rider Recoverable O&M Flat to declining O&M (1) Strong O&M Cost Management $410 $450 $550 $650 Duke Top Quartile Median Bottom Quartile TOP QUARTILE O&M PROFILE (Non - Generation O&M $/Customer (2) ) Highly confident in achieving a $350 - $450 million reduction in O&M and other expenses in 2020 to mitigate COVID - 19 impacts

// 28 // 28 SEPTEMBER INVESTOR UPDATE 2020 Focus on Balance Sheet Management

// 29 // 29 SEPTEMBER INVESTOR UPDATE 2020 (1) Key adjustments within the computation include the removal of coal ash remediation spending from FFO, and the adjusted debt balance excludes purchase accounting adjustments (2) Assumes securitization treated as off credit 26% 23% 18% 23% 22% 25% Duke Carolinas Duke Progress Duke Florida 2019A 2020E 2019A 2020E 2019A 2020E FFO/Debt 24% 16% 16% 23% 17% 16% Duke Indiana Duke Ohio Consolidated Piedmont 2019A 2020E 2019A 2020E 2019A 2020E (1) (2) Our utilities have strong credit metrics that support our corporate rating Moody's S&P DUKE ENERGY CORPORATION Stable Stable Senior Unsecured Debt Baa1 BBB+ Commercial Paper P - 2 A - 2 PROGRESS ENERGY, INC. Stable Stable Senior Unsecured Debt Baa1 BBB+ DUKE ENERGY CAROLINAS, LLC Stable Stable Senior Secured Debt Aa2 A Senior Unsecured Debt A1 A - DUKE ENERGY PROGRESS, LLC Stable Stable Senior Secured Debt Aa3 A DUKE ENERGY FLORIDA, LLC Stable Stable Senior Secured Debt A1 A Senior Unsecured Debt A3 A - DUKE ENERGY INDIANA, LLC Stable Stable Senior Secured Debt Aa3 A Senior Unsecured Debt A2 A - DUKE ENERGY OHIO, INC. Stable Stable Senior Secured Debt A2 A Senior Unsecured Debt Baa1 A - DUKE ENERGY KENTUCKY, INC. Stable Stable Senior Unsecured Debt Baa1 A - PIEDMONT NATURAL GAS, INC. Stable Stable Senior Unsecured Debt A3 A - Rated Issuers Note: Fitch announced on January 21, 2020 its intention to withdraw ratings on Duke Energy Corp within 30 days due to commercial reasons
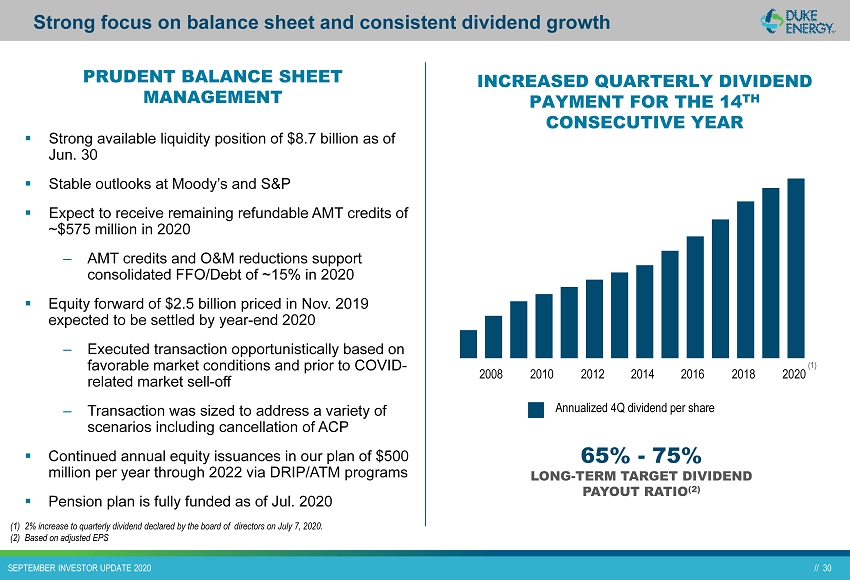
// 30 // 30 SEPTEMBER INVESTOR UPDATE 2020 ▪ Strong available liquidity position of $8.7 billion as of Jun. 30 ▪ Stable outlooks at Moody’s and S&P ▪ Expect to receive remaining refundable AMT credits of ~$575 million in 2020 ‒ AMT credits and O&M reductions support consolidated FFO/Debt of ~15% in 2020 ▪ Equity forward of $2.5 billion priced in Nov. 2019 expected to be settled by year - end 2020 ‒ Executed transaction opportunistically based on favorable market conditions and prior to COVID - related market sell - off ‒ Transaction was sized to address a variety of scenarios including cancellation of ACP ▪ Continued annual equity issuances in our plan of $500 million per year through 2022 via DRIP/ATM programs ▪ Pension plan is fully funded as of Jul. 2020 PRUDENT BALANCE SHEET MANAGEMENT INCREASED QUARTERLY DIVIDEND PAYMENT FOR THE 14 TH CONSECUTIVE YEAR 65% - 75% LONG - TERM TARGET DIVIDEND PAYOUT RATIO (2) Annualized 4Q dividend per share (1) (1) 2% increase to quarterly dividend declared by the board of directors on July 7, 2020. (2) Based on adjusted EPS Strong focus on balance sheet and consistent dividend growth 2020 2018 2016 2014 2012 2010 2008

// 31 // 31 SEPTEMBER INVESTOR UPDATE 2020 Appendix
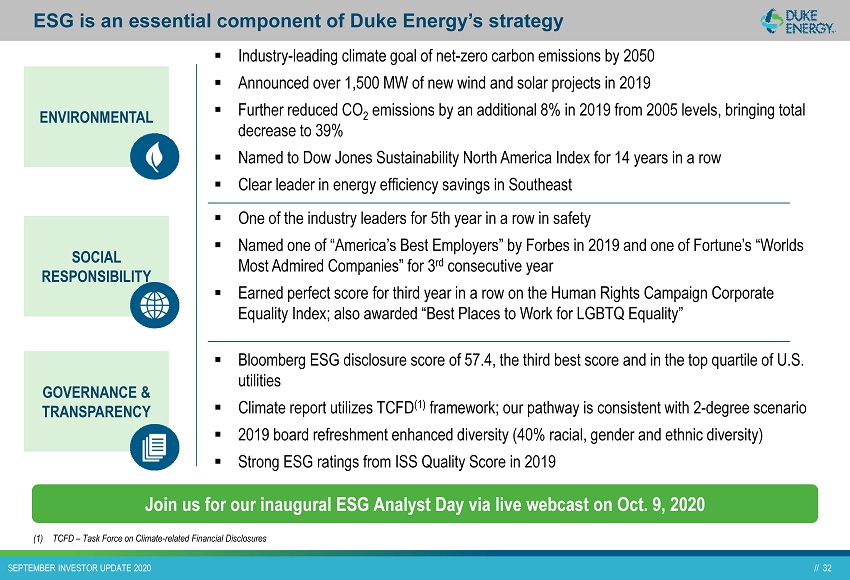
// 32 // 32 SEPTEMBER INVESTOR UPDATE 2020 ▪ Industry - leading climate goal of net - zero carbon emissions by 2050 ▪ Announced over 1,500 MW of new wind and solar projects in 2019 ▪ Further reduced CO 2 emissions by an additional 8% in 2019 from 2005 levels , bringing total decrease to 39% ▪ Named to Dow Jones Sustainability North America Index for 14 years in a row ▪ Clear leader in energy efficiency savings in Southeast ▪ One of the industry leaders for 5th year in a row in safety ▪ Named one of “America’s Best Employers” by Forbes in 2019 and one of Fortune’s “Worlds Most Admired Companies” for 3 rd consecutive year ▪ Earned perfect score for third year in a row on the Human Rights Campaign Corporate Equality Index; also awarded “Best Places to Work for LGBTQ Equality” ▪ Bloomberg ESG disclosure score of 57.4, the third best score and in the top quartile of U.S. utilities ▪ Climate report utilizes TCFD (1) framework; our pathway is consistent with 2 - degree scenario ▪ 2019 board refreshment enhanced diversity (40% racial, gender and ethnic diversity) ▪ Strong ESG ratings from ISS Quality Score in 2019 ESG is an essential component of Duke Energy’s strategy ENVIRONMENTAL SOCIAL RESPONSIBILITY GOVERNANCE & TRANSPARENCY (1) TCFD – Task Force on Climate - related Financial Disclosures Join us for our inaugural ESG Analyst Day via live webcast on Oct. 9, 2020
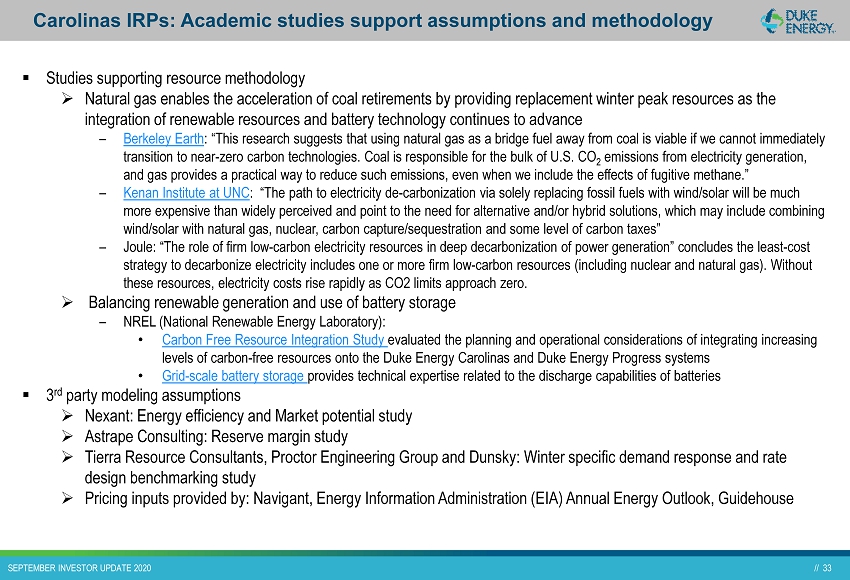
// 33 // 33 SEPTEMBER INVESTOR UPDATE 2020 ▪ Studies supporting resource methodology » Natural gas enables the acceleration of coal retirements by providing replacement winter peak resources as the integration of renewable resources and battery technology continues to advance – Berkeley Earth : “This research suggests that using natural gas as a bridge fuel away from coal is viable if we cannot immediately transition to near - zero carbon technologies. Coal is responsible for the bulk of U.S. CO 2 emissions from electricity generation, and gas provides a practical way to reduce such emissions, even when we include the effects of fugitive methane.” – Kenan Institute at UNC : “The path to electricity de - carbonization via solely replacing fossil fuels with wind/solar will be much more expensive than widely perceived and point to the need for alternative and/or hybrid solutions, which may include combini ng wind/solar with natural gas, nuclear, carbon capture/sequestration and some level of carbon taxes” – Joule: “The role of firm low - carbon electricity resources in deep decarbonization of power generation” concludes the least - cost strategy to decarbonize electricity includes one or more firm low - carbon resources (including nuclear and natural gas). Without these resources, electricity costs rise rapidly as CO2 limits approach zero. » Balancing renewable generation and use of battery storage – NREL (National Renewable Energy Laboratory): • Carbon Free Resource Integration Study evaluated the planning and operational considerations of integrating increasing levels of carbon - free resources onto the Duke Energy Carolinas and Duke Energy Progress systems • Grid - scale battery storage provides technical expertise related to the discharge capabilities of batteries ▪ 3 rd party modeling assumptions » Nexant : Energy efficiency and Market potential study » Astrape Consulting: Reserve margin study » Tierra Resource Consultants, Proctor Engineering Group and Dunsky : Winter specific demand response and rate design benchmarking study » Pricing inputs provided by: Navigant, Energy Information Administration (EIA) Annual Energy Outlook, Guidehouse Carolinas IRPs: Academic studies support assumptions and methodology
// 34 // 34 SEPTEMBER INVESTOR UPDATE 2020 Carolinas IRPs: Commission rules and review process ▪ The 2020 IRP includes a most economic or “least - cost” portfolio, as required by North Carolina Utilities Commission (NCUC) Rule R8 - 60 and subsequent orders, and the Public Service Commission of South Carolina (PSCSC) and The Energy Freedom Act (Act 62), as well as multiple portfolios reflecting a range of potential future resource portfolios ▪ North Carolina requirements – 2 base cases: least cost resources (with and without price on carbon). Additional carbon and coal retirement analyses required for 2020 IRPs – NCUC will not “approve” the IRPs; rather, after a formal docket review with intervenors, the NCUC will “accept” the IRPs as reasonable for planning purposes (or reject some aspects of the IRP or make recommendations for future IRPs) – New generation resources will need to go through specific CPCN approval processes prior to construction and must demonstrate consistency with the most recent IRP ▪ South Carolina requirements – First IRP filed under Act 62; which contemplates several resource portfolios developed with the purpose of fairly evaluating the range of demand - side, supply - side, storage, and other technologies and services available to meet the utility's service obligations; PSCSC will approve or deny or modify; testimony and adversarial evidentiary hearings anticipated – Regulatory condition requires utility to utilize least cost planning – New resources will go through new Act 62 processes and statutory requirements for cost recovery, which do note a competitive procurement process.

// 35 // 35 SEPTEMBER INVESTOR UPDATE 2020 Carolinas IRPs: Carbon Reduction by Scenario

// 36 // 36 SEPTEMBER INVESTOR UPDATE 2020 8% 32% 60% 2% 38% 60% 1% 38% 61% 8% 32% 60% 33% 67% 29% 71% 8% 32% 60% 2% 31% 67% 1% 24% 75% Base Case with Carbon Policy 70% CO 2 Rdctn : High Wind No New Gas Generation Carolinas IRPs: Generation Mix by Portfolio 2025 2030 2035 Coal Natural Gas and Other Fossil Fuels Carbon-Free Generation SIGNIFICANT CARBON REDUCTIONS ACHIEVED IN ALL SCENARIOS 2035 Carbon Intensity: 350 lbs./MWH PVRR: $82.5 B 2035 Carbon Intensity: 240 lbs./MWH PVRR: $100.5 B 2035 Carbon Intensity: 240 lbs./MWH PVRR: $108.1 B
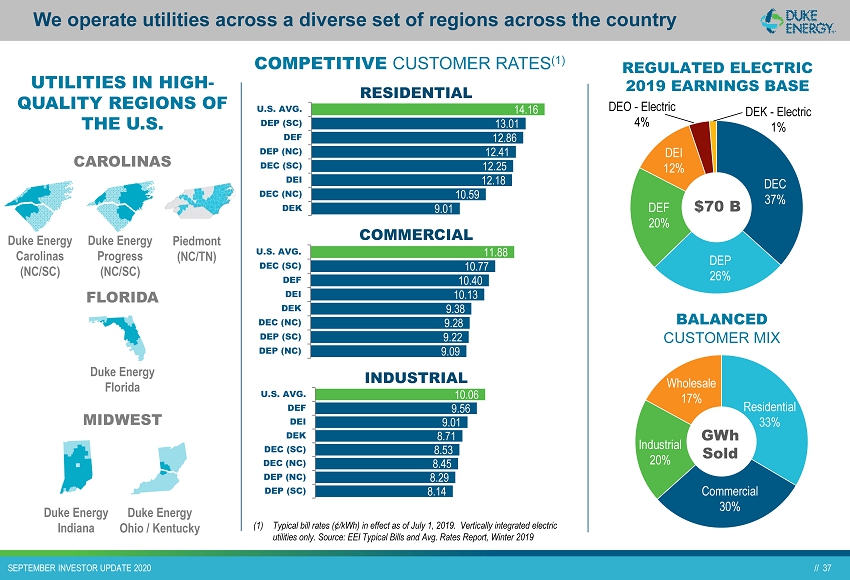
// 37 // 37 SEPTEMBER INVESTOR UPDATE 2020 8.14 8.29 8.45 8.53 8.71 9.01 9.56 10.06 DEP (SC) DEP (NC) DEC (NC) DEC (SC) DEK DEI DEF U.S. AVG. We operate utilities across a diverse set of regions across the country BALANCED CUSTOMER MIX GWh Sold Residential 33% Commercial 30% Industrial 20% Wholesale 17% UTILITIES IN HIGH - QUALITY REGIONS OF THE U.S. CAROLINAS FLORIDA MIDWEST Duke Energy Carolinas (NC/SC) Duke Energy Progress (NC/SC) Duke Energy Florida Duke Energy Indiana Duke Energy Ohio / Kentucky REGULATED ELECTRIC 2019 EARNINGS BASE DEC 37% DEP 26% DEF 20% DEI 12% (1) Typical bill rates (¢/kWh) in effect as of July 1, 2019. Vertically integrated electric utilities only. Source: EEI Typical Bills and Avg. Rates Report, Winter 2019 $70 B DEO - Electric 4% DEK - Electric 1% 9.01 10.59 12.18 12.25 12.41 12.86 13.01 14.16 DEK DEC (NC) DEI DEC (SC) DEP (NC) DEF DEP (SC) U.S. AVG. 9.09 9.22 9.28 9.38 10.13 10.40 10.77 11.88 DEP (NC) DEP (SC) DEC (NC) DEK DEI DEF DEC (SC) U.S. AVG. COMPETITIVE CUSTOMER RATES (1) RESIDENTIAL COMMERCIAL INDUSTRIAL Piedmont (NC/TN)
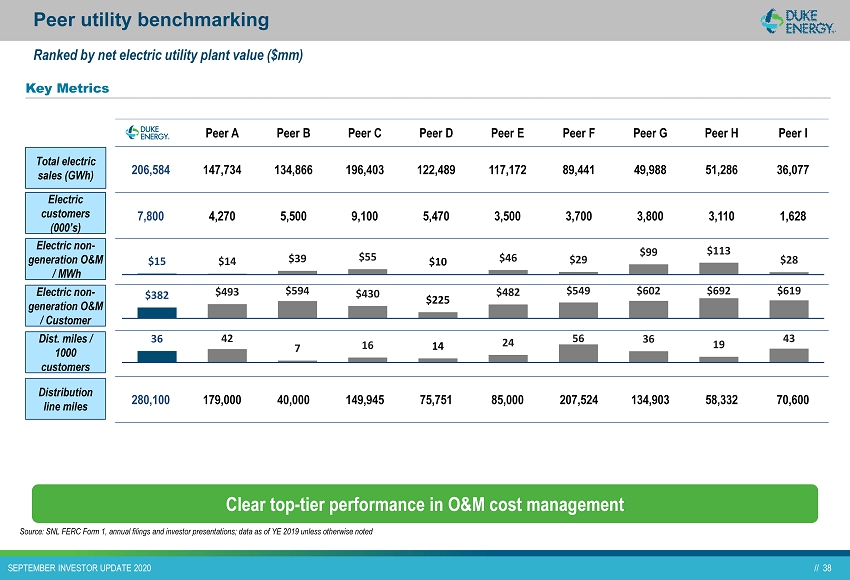
// 38 // 38 SEPTEMBER INVESTOR UPDATE 2020 Peer utility benchmarking Source: SNL FERC Form 1, annual filings and investor presentations; data as of YE 2019 unless otherwise noted Key Metrics Electric customers (000’s) Peer A Peer B Peer C Peer D Peer E Peer F Peer G Peer H Peer I 206,584 147,734 134,866 196,403 122,489 117,172 89,441 49,988 51,286 36,077 7,800 4,270 5,500 9,100 5,470 3,500 3,700 3,800 3,110 1,628 280,100 179,000 40,000 149,945 75,751 85,000 207,524 134,903 58,332 70,600 Ranked by net electric utility plant value ($mm) Electric non - generation O&M / MWh Electric non - generation O&M / Customer Dist. miles / 1000 customers Distribution line miles $15 $14 $39 $55 $10 $46 $29 $99 $113 $28 $382 $493 $594 $430 $225 $482 $549 $602 $692 $619 36 42 7 16 14 24 56 36 19 43 Total electric sales ( GWh ) Clear top - tier performance in O&M cost management
// 39 // 39 SEPTEMBER INVESTOR UPDATE 2020 Advancing our strategic vision MODERNIZE THE ENERGY GRID GENERATE CLEANER ENERGY EXPAND NATURAL GAS INFRASTRUCTURE TRANSFORM THE CUSTOMER EXPERIENCE STAKEHOLDER ENGAGEMENT EMPLOYEE ENGAGEMENT AND OPERATIONAL EXCELLENCE ARE FOUNDATIONAL TO OUR SUCCESS
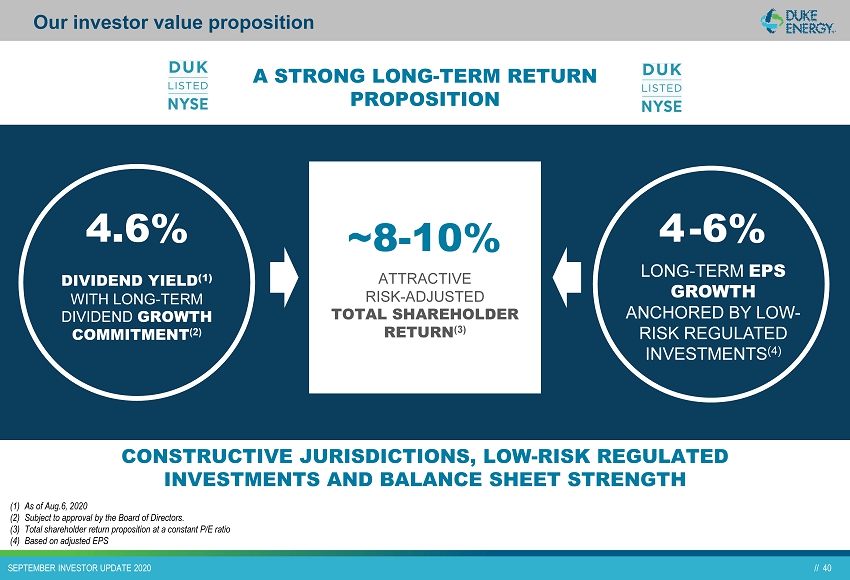
// 40 // 40 SEPTEMBER INVESTOR UPDATE 2020 Our investor value proposition zzz LONG - TERM EPS GROWTH ANCHORED BY LOW - RISK REGULATED INVESTMENTS (4) DIVIDEND YIELD (1) WITH LONG - TERM DIVIDEND GROWTH COMMITMENT (2) CONSTRUCTIVE JURISDICTIONS, LOW - RISK REGULATED INVESTMENTS AND BALANCE SHEET STRENGTH 4 - 6% 4.6% (1) As of Aug.6, 2020 (2) Subject to approval by the Board of Directors. (3) Total shareholder return proposition at a constant P/E ratio (4) Based on adjusted EPS ATTRACTIVE RISK - ADJUSTED TOTAL SHAREHOLDER RETURN (3) ~8 - 10% A STRONG LONG - TERM RETURN PROPOSITION

// 41 // 41 SEPTEMBER INVESTOR UPDATE 2020 Upcoming events & other

// 42 // 42 SEPTEMBER INVESTOR UPDATE 2020 Upcoming events Event Date 2020 ESG Investor day October 9, 2020 3Q 2020 earnings call Early November 2020

// 43 // 43 SEPTEMBER INVESTOR UPDATE 2020 Investor relations contact information BRYAN BUCKLER , VICE PRESIDENT INVESTOR RELATIONS ▪ Bryan.Buckler @duke - energy.com ▪ (704) 382 - 2640 CINDY LEE, DIRECTOR INVESTOR RELATIONS ▪ Cynthia.Lee@duke - energy.com ▪ (980) 373 - 4077 ABBY MOTSINGER, MANAGER INVESTOR RELATIONS ▪ Abby.Motsinger@duke - energy.com ▪ (704) 382 - 7624
For additional information on Duke Energy, please visit: duke - energy.com/investors
 | Duke Energy Corporation Non-GAAP Reconciliations Duke Energy Investor Update September 2020 Adjusted Earnings per Share (EPS) The materials for Duke Energy Corporation’s (Duke Energy) Investor Update in September 2020, include a discussion of adjusted EPS for the year-to-date periods ended December 31, 2019, 2018, 2017, 2016, 2015, 2014 and 2013. The non-GAAP financial measure, adjusted EPS, represents basic EPS available to Duke Energy Corporation common stockholders (GAAP reported EPS), adjusted for the per share impact of special items. Special items represent certain charges and credits, which management believes are not indicative of Duke Energy’s ongoing performance. Management believes the presentation of adjusted EPS provides useful information to investors, as it provides them with an additional relevant comparison of Duke Energy’s performance across periods. Management uses this non-GAAP financial measure for planning and forecasting and for reporting financial results to the Duke Energy Board of Directors, employees, stockholders, analysts and investors. Adjusted EPS is also used as a basis for employee incentive bonuses. The most directly comparable GAAP measure for adjusted EPS is reported basic EPS available to Duke Energy Corporation common stockholders. Reconciliations of adjusted EPS for the year-to-date periods ended December 31, 2019, 2018 2017, 2016, 2015, 2014 and 2013, to the most directly comparable GAAP measures are included here-in. Adjusted EPS Guidance The materials for Duke Energy’s Investor Update in September 2020, include a reference to the forecasted 2019, 2018, 2017, 2016, 2015, 2014 and 2013, adjusted EPS guidance range per share. The materials also reference the long-term range of annual growth of 4% - 6%. The forecasted adjusted EPS is a non-GAAP financial measure as it represents basic EPS available to Duke Energy Corporation common stockholders (GAAP reported EPS), adjusted for the per share impact of special items, as discussed above under Adjusted EPS. Due to the forward-looking nature of this non-GAAP financial measure for future periods, information to reconcile it to the most directly comparable GAAP financial measure is not available at this time, as management is unable to project all special items for future periods, such as legal settlements, the impact of regulatory orders or asset impairments. Available Liquidity The materials for Duke Energy’s Investor Update in September 2020, include a discussion of Duke Energy’s available liquidity balance. The available liquidity balance presented is a non-GAAP financial measure as it represents cash and cash equivalents, excluding certain amounts held in foreign jurisdictions and cash otherwise unavailable for operations, the remaining availability under Duke Energy’s available credit facilities, including the master credit facility and available equity forwards. The most directly comparable GAAP financial measure for available liquidity is cash and cash equivalents. A reconciliation of available liquidity as of June 30, 2020, to the most directly comparable GAAP measure is included here-in. |
 | Non-Rider Recoverable O&M The materials for Duke Energy’s Investor Update in September 2020, include a discussion of Duke Energy’s non-rider recoverable operating, maintenance and other expenses (O&M) for the year-to-date periods ended December 31, 2019, 2018, 2017 and 2016. Non-rider recoverable O&M expenses are non-GAAP financial measures, as they represent reported O&M expenses adjusted for special items and expenses recovered through riders. The most directly comparable GAAP financial measure for non-rider recoverable O&M expenses is reported operating, maintenance and other expenses. A reconciliation of non-rider recoverable O&M expenses for the year-to-date periods ended December 31, 2019, 2018, 2017, and 2016, to the most directly comparable GAAP measure are included here-in. Dividend Payout Ratio The materials for Duke Energy’s Investor Update in September 2020, include a discussion of Duke Energy’s forecasted dividend payout ratio of 65% - 75% based upon adjusted EPS. This payout ratio is a non-GAAP financial measure as it is based upon forecasted basic EPS available to Duke Energy Corporation common stockholders (GAAP reported EPS), adjusted for the per-share impact of special items, as discussed above under Adjusted EPS. The most directly comparable GAAP measure for adjusted EPS is reported basic EPS available to Duke Energy Corporation common stockholders. Due to the forward-looking nature of this non-GAAP financial measure for future periods, information to reconcile it to the most directly comparable GAAP financial measure is not available at this time, as management is unable to project all special items, as discussed above under Adjusted EPS Guidance. Funds From Operations (“FFO”) Ratios The materials for Duke Energy’s Investor Update in September 2020, include a reference to historical and expected FFO to Total Debt ratios. These ratios reflect non-GAAP financial measures. The numerator of the FFO to Total Debt ratio is calculated principally by using net cash provided by operating activities on a GAAP basis, adjusted for changes in working capital, ARO spend, depreciation and amortization of operating leases and reduced for capitalized interest (including any AFUDC interest). The denominator for the FFO to Total Debt ratio is calculated principally by using the balance of long-term debt (excluding purchase accounting adjustments and long-term debt associated with the CR3 Securitization), including current maturities, imputed operating lease liabilities, plus notes payable, commercial paper outstanding, underfunded pension liability, guarantees on joint-venture debt, and adjustments to hybrid debt and preferred stock issuances based on how credit rating agencies view the instruments. The calculation of FFO to Total Debt ratio for the year ended December 31, 2019 is included here-in. Due to the forward-looking nature of this non-GAAP financial measure for future periods, information to reconcile it to the most directly comparable GAAP financial measure is not available at this time, as management is unable to project all special items, as discussed above under Adjusted EPS Guidance. Business Mix Percentage The materials for Duke Energy’s Investor Update in September 2020, reference ninety-five percent of earnings coming from the regulated electric and gas utilities as a percentage of the total projected 2020 adjusted net income (i.e. business mix), excluding the impact of Other. Duke Energy’s regulated electric and gas utilities are included in the Electric Utilities and Infrastructure and Gas Utilities and Infrastructure segments, respectively. Adjusted segment income is a non-GAAP financial measure, as it represents reported segment income adjusted for special items. Due to the forward-looking nature of any forecasted adjusted segment income, information to reconcile this non-GAAP financial measure to the most directly comparable GAAP financial measure is not available at this time, as management is unable to project all special items (as discussed above under Adjusted EPS Guidance). |
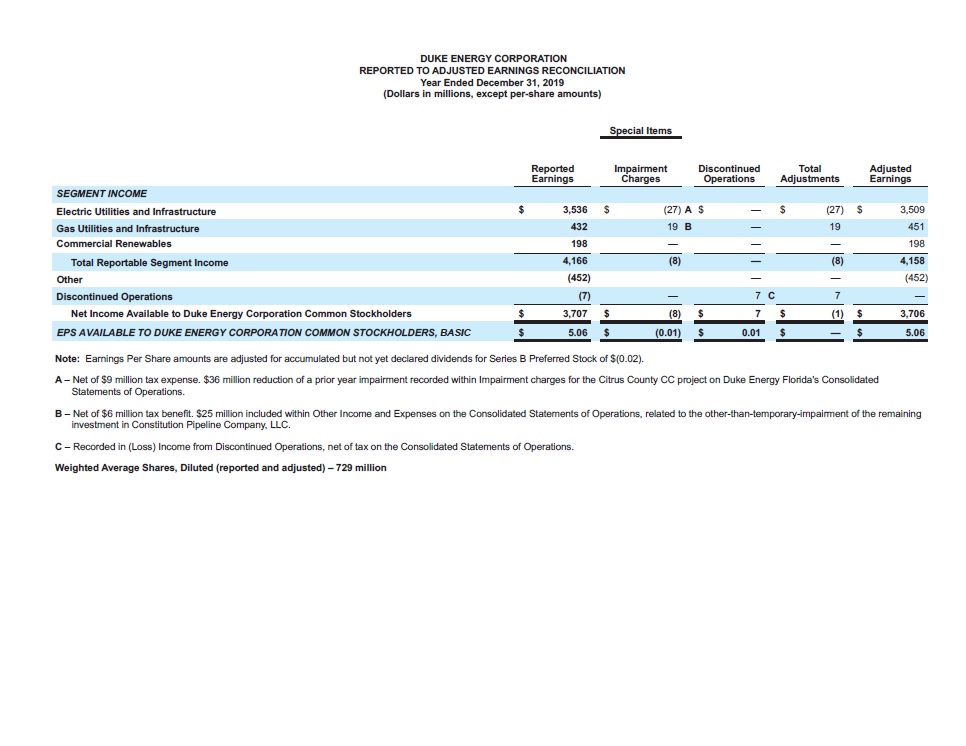 | %6,& &/&3(: $03103"5*0/ 3&1035&% 50 "%+645&% &"3/*/(4 3&$0/$*-*"5*0/ :FBS &OEFE %FDFNCFS 31, 2019 (%PMMBST JO NJMMJPOT, FYDFQU QFS-TIBSF BNPVOUT) 4QFDJBM *UFNT /PUF: &BSOJOHT 1FS 4IBSF BNPVOUT BSF BEKVTUFE GPS BDDVNVMBUFE CVU OPU ZFU EFDMBSFE EJWJEFOET GPS 4FSJFT # 1SFGFSSFE 4UPDL PG $(0.02). " ` /FU PG $9 NJMMJPO UBY FYQFOTF. $36 NJMMJPO SFEVDUJPO PG B QSJPS ZFBS JNQBJSNFOU SFDPSEFE XJUIJO *NQBJSNFOU DIBSHFT GPS UIF $JUSVT $PVOUZ $$ QSPKFDU PO %VLF &OFSHZ 'MPSJEB'T $POTPMJEBUFE 4UBUFNFOUT PG 0QFSBUJPOT. # ` /FU PG $6 NJMMJPO UBY CFOFGJU. $25 NJMMJPO JODMVEFE XJUIJO 0UIFS *ODPNF BOE &YQFOTFT PO UIF $POTPMJEBUFE 4UBUFNFOUT PG 0QFSBUJPOT, SFMBUFE UP UIF PUIFS-UIBO-UFNQPSBSZ-JNQBJSNFOU PG UIF SFNBJOJOH JOWFTUNFOU JO $POTUJUVUJPO 1JQFMJOF $PNQBOZ, --$. $ ` 3FDPSEFE JO (-PTT) *ODPNF GSPN %JTDPOUJOVFE 0QFSBUJPOT, OFU PG UBY PO UIF $POTPMJEBUFE 4UBUFNFOUT PG 0QFSBUJPOT. 8FJHIUFE "WFSBHF 4IBSFT, %JMVUFE (SFQPSUFE BOE BEKVTUFE) b 729 NJMMJPO |
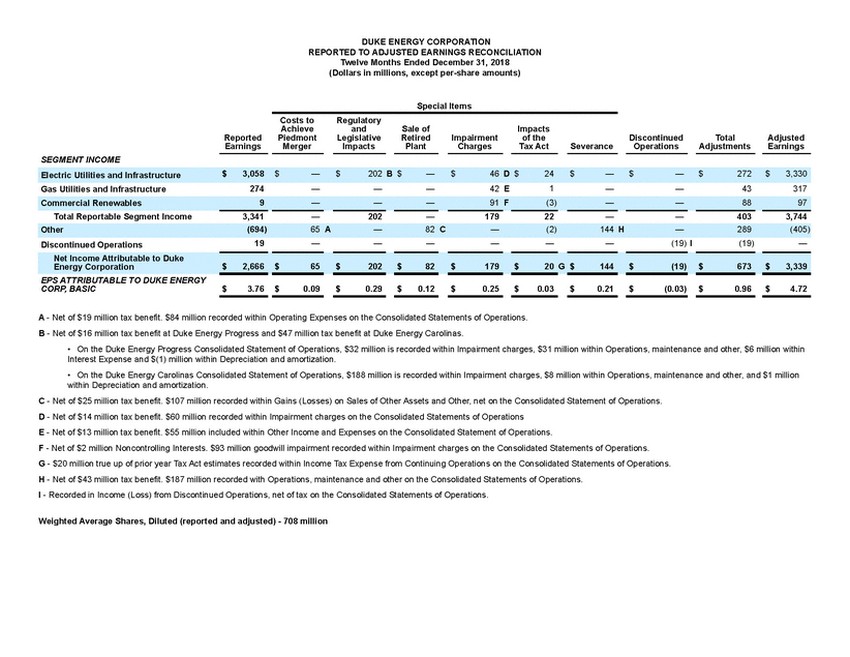 | Costs to Regulatory Special Items Net Income Attributable to Duke Energy Corporation$2,666 $65$202$82$179$20 G $144$(19)$673$3,339 EPS ATTRIBUTABLE TO DUKE ENERGY CORP, BASIC$3.76 $0.09$0.29$0.12$0.25$0.03$0.21$(0.03)$0.96$4.72 A - Net of $19 million tax benefit. $84 million recorded within Operating Expenses on the Consolidated Statements of Operations. B - Net of $16 million tax benefit at Duke Energy Progress and $47 million tax benefit at Duke Energy Carolinas. • On the Duke Energy Progress Consolidated Statement of Operations, $32 million is recorded within Impairment charges, $31 million within Operations, maintenance and other, $6 million within Interest Expense and $(1) million within Depreciation and amortization. • On the Duke Energy Carolinas Consolidated Statement of Operations, $188 million is recorded within Impairment charges, $8 million within Operations, maintenance and other, and $1 million within Depreciation and amortization. C - Net of $25 million tax benefit. $107 million recorded within Gains (Losses) on Sales of Other Assets and Other, net on the Consolidated Statement of Operations. D - Net of $14 million tax benefit. $60 million recorded within Impairment charges on the Consolidated Statements of Operations E - Net of $13 million tax benefit. $55 million included within Other Income and Expenses on the Consolidated Statement of Operations. F - Net of $2 million Noncontrolling Interests. $93 million goodwill impairment recorded within Impairment charges on the Consolidated Statements of Operations. G - $20 million true up of prior year Tax Act estimates recorded within Income Tax Expense from Continuing Operations on the Consolidated Statements of Operations. H - Net of $43 million tax benefit. $187 million recorded with Operations, maintenance and other on the Consolidated Statements of Operations. I - Recorded in Income (Loss) from Discontinued Operations, net of tax on the Consolidated Statements of Operations. Weighted Average Shares, Diluted (reported and adjusted) - 708 million |
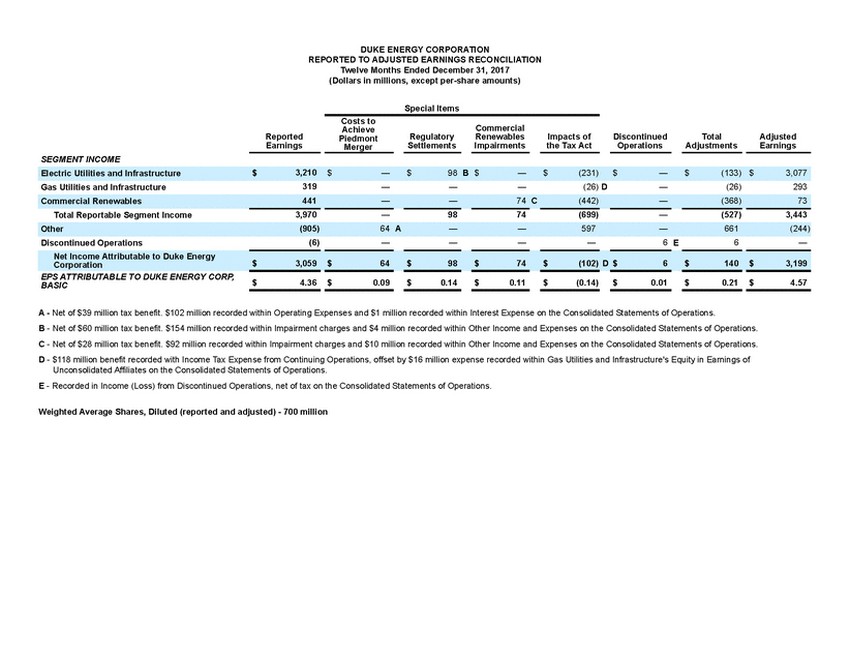 | SEGMENT INCOME Reported Earnings Costs to Achieve Piedmont Merger Special Items Regulatory Settlements Commercial Renewables Impairments Impacts of the Tax Act Discontinued Operations Total Adjustments Adjusted Earnings Electric Utilities and Infrastructure $ 3,210 $ — $ 98 B $ — $ (231) $ — $ (133) $ 3,077 Gas Utilities and Infrastructure 319 — — — (26) D — (26) 293 Commercial Renewables 441 — — 74 C (442) — (368) 73 Total Reportable Segment Income3,970—9874(699)—(527)3,443 Other (905) 64 A — — 597 — 661 (244) Discontinued Operations (6) — — — — 6 E 6 — Net Income Attributable to Duke Energy Corporation$3,059 $64$98$74$(102) D $6$140 $3,199 EPS ATTRIBUTABLE TO DUKE ENERGY CORP, BASIC $ 4.36 $ 0.09 $ 0.14 $ 0.11 $ (0.14) $ 0.01 $ 0.21 $ 4.57 A - Net of $39 million tax benefit. $102 million recorded within Operating Expenses and $1 million recorded within Interest Expense on the Consolidated Statements of Operations. B - Net of $60 million tax benefit. $154 million recorded within Impairment charges and $4 million recorded within Other Income and Expenses on the Consolidated Statements of Operations. C - Net of $28 million tax benefit. $92 million recorded within Impairment charges and $10 million recorded within Other Income and Expenses on the Consolidated Statements of Operations. D - $118 million benefit recorded with Income Tax Expense from Continuing Operations, offset by $16 million expense recorded within Gas Utilities and Infrastructure's Equity in Earnings of Unconsolidated Affiliates on the Consolidated Statements of Operations. E - Recorded in Income (Loss) from Discontinued Operations, net of tax on the Consolidated Statements of Operations. Weighted Average Shares, Diluted (reported and adjusted) - 700 million |
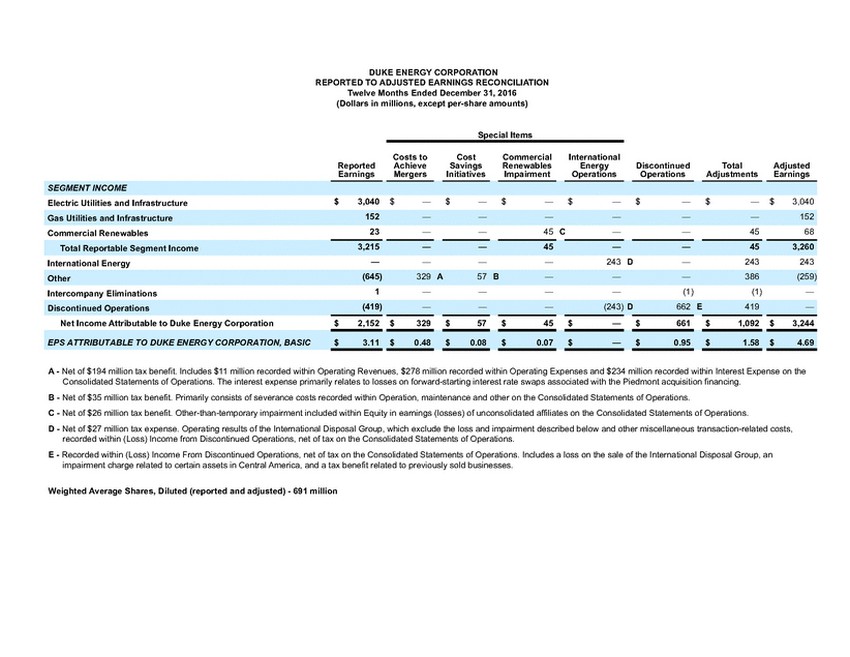 | DUKE ENERGY CORPORATION REPORTED TO ADJUSTED EARNINGS RECONCILIATION Twelve Months Ended December 31, 2016 (Dollars in millions, except per-share amounts) Special Items SEGMENT INCOME Reported Earnings Costs to Achieve Mergers Cost Savings Initiatives Commercial Renewables Impairment International Energy Operations Discontinued Operations Total Adjustments Adjusted Earnings Electric Utilities and Infrastructure $ 3,040 $ — $ — $ — $ — $ — $ — $ 3,040 Gas Utilities and Infrastructure 152 — — — — — — 152 Commercial Renewables 23 — — 45 C — — 45 68 Total Reportable Segment Income3,215——45——453,260 International Energy — — — — 243 D — 243 243 Other (645) 329 A 57 B — — — 386 (259) Intercompany Eliminations 1 — — — — (1) (1) — Discontinued Operations (419) — — — (243) D 662 E 419 — Net Income Attributable to Duke Energy Corporation$2,152 $329$57$45$—$661$1,092 $3,244 EPS ATTRIBUTABLE TO DUKE ENERGY CORPORATION, BASIC $ 3.11 $ 0.48 $ 0.08 $ 0.07 $ — $ 0.95 $ 1.58 $ 4.69 A - Net of $194 million tax benefit. Includes $11 million recorded within Operating Revenues, $278 million recorded within Operating Expenses and $234 million recorded within Interest Expense on the Consolidated Statements of Operations. The interest expense primarily relates to losses on forward-starting interest rate swaps associated with the Piedmont acquisition financing. B - Net of $35 million tax benefit. Primarily consists of severance costs recorded within Operation, maintenance and other on the Consolidated Statements of Operations. C - Net of $26 million tax benefit. Other-than-temporary impairment included within Equity in earnings (losses) of unconsolidated affiliates on the Consolidated Statements of Operations. D - Net of $27 million tax expense. Operating results of the International Disposal Group, which exclude the loss and impairment described below and other miscellaneous transaction-related costs, recorded within (Loss) Income from Discontinued Operations, net of tax on the Consolidated Statements of Operations. E - Recorded within (Loss) Income From Discontinued Operations, net of tax on the Consolidated Statements of Operations. Includes a loss on the sale of the International Disposal Group, an impairment charge related to certain assets in Central America, and a tax benefit related to previously sold businesses. Weighted Average Shares, Diluted (reported and adjusted) - 691 million |
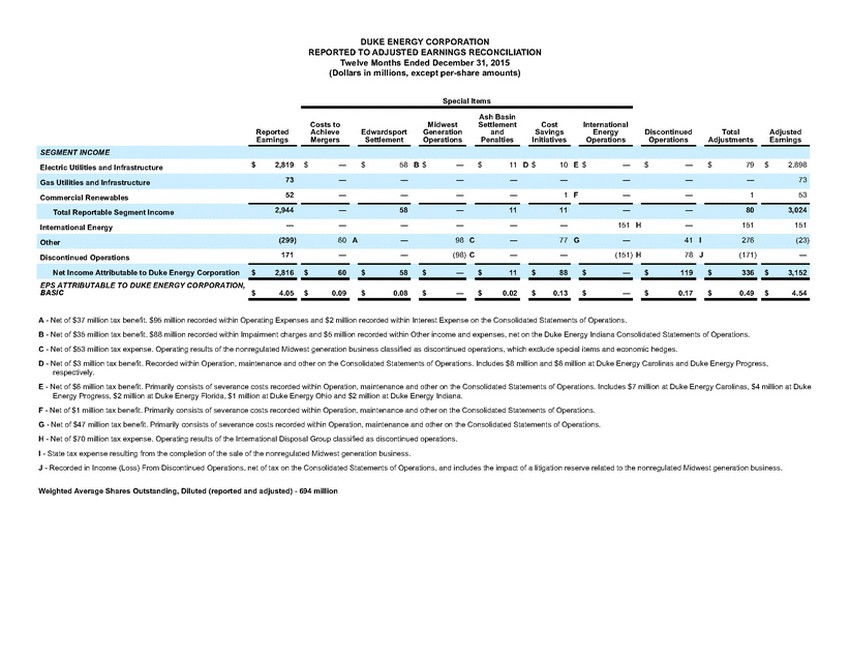 | DUKE ENERGY CORPORATION REPORTED TO ADJUSTED EARNINGS RECONCILIATION Twelve Months Ended December 31, 2015 (Dollars in millions, except per-share amounts) Special Items EPS ATTRIBUTABLE TO DUKE ENERGY CORPORATION, BASIC$4.05 $0.09$0.08$—$0.02$0.13$—$0.17$0.49 $4.54 A - Net of $37 million tax benefit. $95 million recorded within Operating Expenses and $2 million recorded within Interest Expense on the Consolidated Statements of Operations. B - Net of $35 million tax benefit. $88 million recorded within Impairment charges and $5 million recorded within Other income and expenses, net on the Duke Energy Indiana Consolidated Statements of Operations. C - Net of $53 million tax expense. Operating results of the nonregulated Midwest generation business classified as discontinued operations, which exclude special items and economic hedges. D - Net of $3 million tax benefit. Recorded within Operation, maintenance and other on the Consolidated Statements of Operations. Includes $8 million and $6 million at Duke Energy Carolinas and Duke Energy Progress, respectively. E - Net of $6 million tax benefit. Primarily consists of severance costs recorded within Operation, maintenance and other on the Consolidated Statements of Operations. Includes $7 million at Duke Energy Carolinas, $4 million at Duke Energy Progress, $2 million at Duke Energy Florida, $1 million at Duke Energy Ohio and $2 million at Duke Energy Indiana. F - Net of $1 million tax benefit. Primarily consists of severance costs recorded within Operation, maintenance and other on the Consolidated Statements of Operations. G - Net of $47 million tax benefit. Primarily consists of severance costs recorded within Operation, maintenance and other on the Consolidated Statements of Operations. H - Net of $70 million tax expense. Operating results of the International Disposal Group classified as discontinued operations. I - State tax expense resulting from the completion of the sale of the nonregulated Midwest generation business. J - Recorded in Income (Loss) From Discontinued Operations, net of tax on the Consolidated Statements of Operations, and includes the impact of a litigation reserve related to the nonregulated Midwest generation business. Weighted Average Shares Outstanding, Diluted (reported and adjusted) - 694 million |
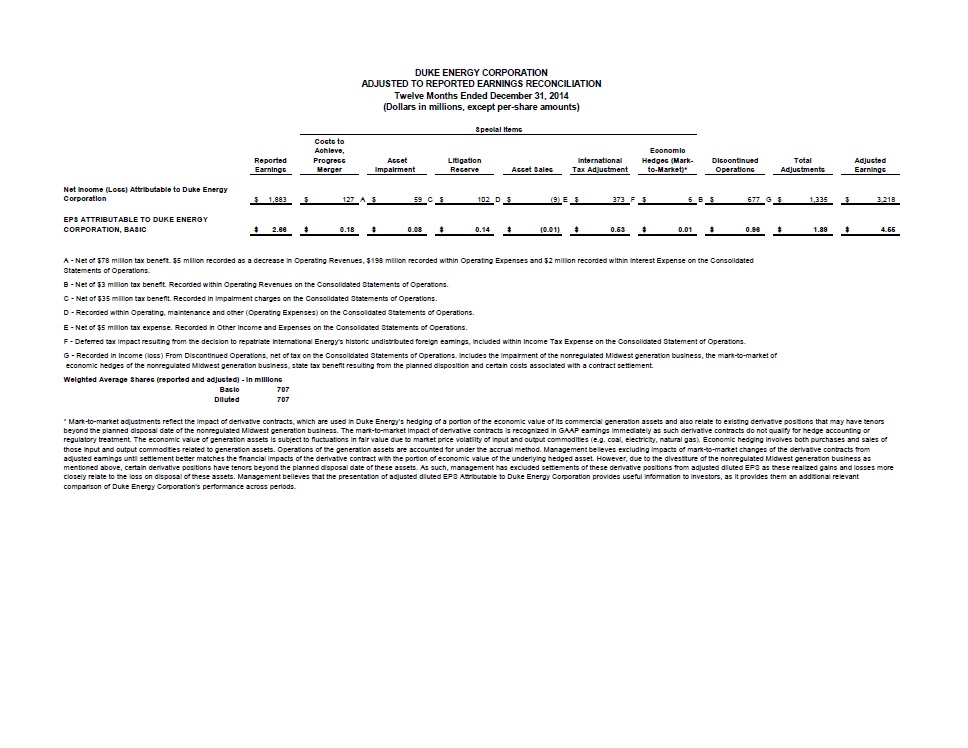 | Reported Earnings Costs to Achieve, Progress Merger Asset Impairment Special Items Litigation Reserve Asset Sales International Tax Adjustment Economic Hedges (Mark-to-Market)* Discontinued Operations Total Adjustments Adjusted Earnings Net Income (Loss) Attributable to Duke Energy Corporation $ 1,883 $ 127 A $ 59 C $ 102 D $ (9) E $ 373 F $ 6 B $ 677 G $ 1,335 $ 3,218 EPS ATTRIBUTABLE TO DUKE ENERGY CORPORATION, BASIC $ 2.66 $ 0.18 $ 0.08 $ 0.14 $ (0.01) $ 0.53 $ 0.01 $ 0.96 $ 1.89 $ 4.55 A - Net of $78 million tax benefit. $5 million recorded as a decrease in Operating Revenues, $198 million recorded within Operating Expenses and $2 million recorded within Interest Expense on the Consolidated Statements of Operations. B - Net of $3 million tax benefit. Recorded within Operating Revenues on the Consolidated Statements of Operations. C - Net of $35 million tax benefit. Recorded in impairment charges on the Consolidated Statements of Operations. D - Recorded within Operating, maintenance and other (Operating Expenses) on the Consolidated Statements of Operations. E - Net of $5 million tax expense. Recorded in Other Income and Expenses on the Consolidated Statements of Operations. F - Deferred tax impact resulting from the decision to repatriate International Energy's historic undistributed foreign earnings, included within Income Tax Expense on the Consolidated Statement of Operations. G - Recorded in Income (loss) From Discontinued Operations, net of tax on the Consolidated Statements of Operations. Includes the impairment of the nonregulated Midwest generation business, the mark-to-market of economic hedges of the nonregulated Midwest generation business, state tax benefit resulting from the planned disposition and certain costs associated with a contract settlement. Weighted Average Shares (reported and adjusted) - in millions Basic 707 Diluted 707 * Mark-to-market adjustments reflect the impact of derivative contracts, which are used in Duke Energy’s hedging of a portion of the economic value of its commercial generation assets and also relate to existing derivative positions that may have tenors beyond the planned disposal date of the nonregulated Midwest generation business. The mark-to-market impact of derivative contracts is recognized in GAAP earnings immediately as such derivative contracts do not qualify for hedge accounting or regulatory treatment. The economic value of generation assets is subject to fluctuations in fair value due to market price volatility of input and output commodities (e.g. coal, electricity, natural gas). Economic hedging involves both purchases and sales of those input and output commodities related to generation assets. Operations of the generation assets are accounted for under the accrual method. Management believes excluding impacts of mark-to-market changes of the derivative contracts from adjusted earnings until settlement better matches the financial impacts of the derivative contract with the portion of economic value of the underlying hedged asset. However, due to the divestiture of the nonregulated Midwest generation business as mentioned above, certain derivative positions have tenors beyond the planned disposal date of these assets. As such, management has excluded settlements of these derivative positions from adjusted diluted EPS as these realized gains and losses more closely relate to the loss on disposal of these assets. Management believes that the presentation of adjusted diluted EPS Attributable to Duke Energy Corporation provides useful information to investors, as it provides them an additional relevant comparison of Duke Energy Corporation's performance across periods. |
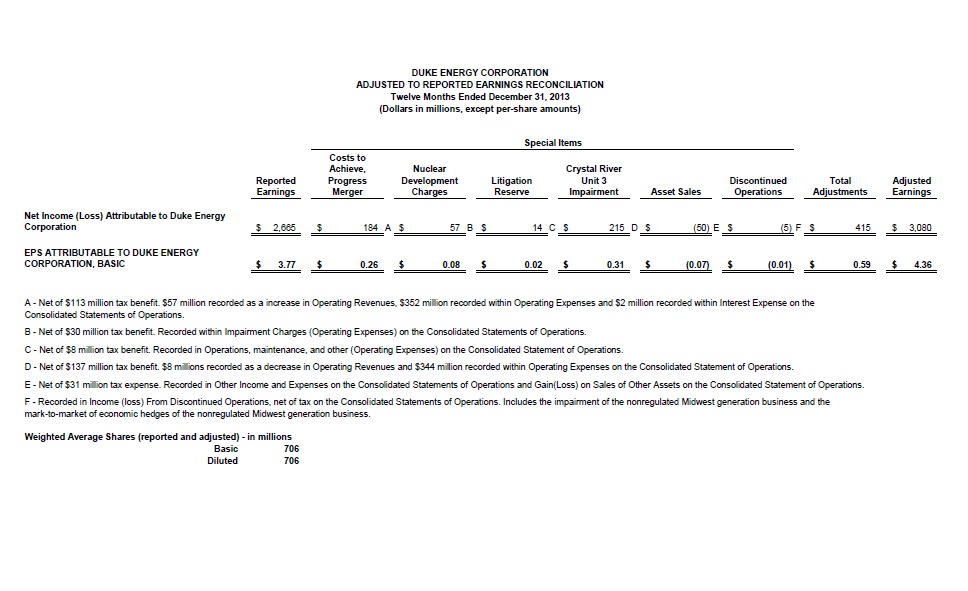 | Costs to Achieve, Nuclear Special Items Crystal River Reported Earnings Progress Merger Development Charges Litigation Reserve Unit 3 ImpairmentAsset Sales Discontinued Operations Total Adjustments Adjusted Earnings Net Income (Loss) Attributable to Duke Energy Corporation $ 2,665 $ 184 A $ 57 B $ 14 C $ 215 D $ (50) E $ (5) F $ 415 $3,080 EPS ATTRIBUTABLE TO DUKE ENERGY CORPORATION, BASIC $3.77$ 0.26$ 0.08$ 0.02$ 0.31$ (0.07)$ (0.01)$ 0.59 $4.36 A - Net of $113 million tax benefit. $57 million recorded as a increase in Operating Revenues, $352 million recorded within Operating Expenses and $2 million recorded within Interest Expense on the Consolidated Statements of Operations. B - Net of $30 million tax benefit. Recorded within Impairment Charges (Operating Expenses) on the Consolidated Statements of Operations. C - Net of $8 million tax benefit. Recorded in Operations, maintenance, and other (Operating Expenses) on the Consolidated Statement of Operations. D - Net of $137 million tax benefit. $8 millions recorded as a decrease in Operating Revenues and $344 million recorded within Operating Expenses on the Consolidated Statement of Operations. E - Net of $31 million tax expense. Recorded in Other Income and Expenses on the Consolidated Statements of Operations and Gain(Loss) on Sales of Other Assets on the Consolidated Statement of Operations. F - Recorded in Income (loss) From Discontinued Operations, net of tax on the Consolidated Statements of Operations. Includes the impairment of the nonregulated Midwest generation business and the mark-to-market of economic hedges of the nonregulated Midwest generation business. Weighted Average Shares (reported and adjusted) - in millions Basic706 Diluted706 |
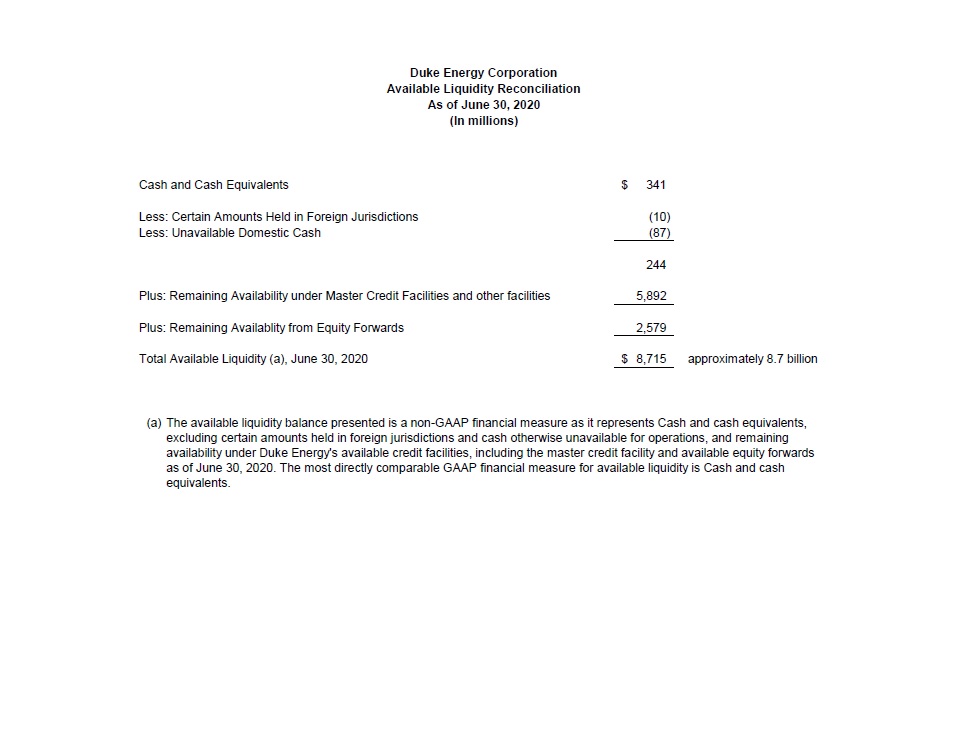 | Duke Energy Corporation Available Liquidity Reconciliation As of June 30, 2020 (In millions) (a) The available liquidity balance presented is a non-GAAP financial measure as it represents Cash and cash equivalents, excluding certain amounts held in foreign jurisdictions and cash otherwise unavailable for operations, and remaining availability under Duke Energy's available credit facilities, including the master credit facility and available equity forwards as of June 30, 2020. The most directly comparable GAAP financial measure for available liquidity is Cash and cash equivalents. |
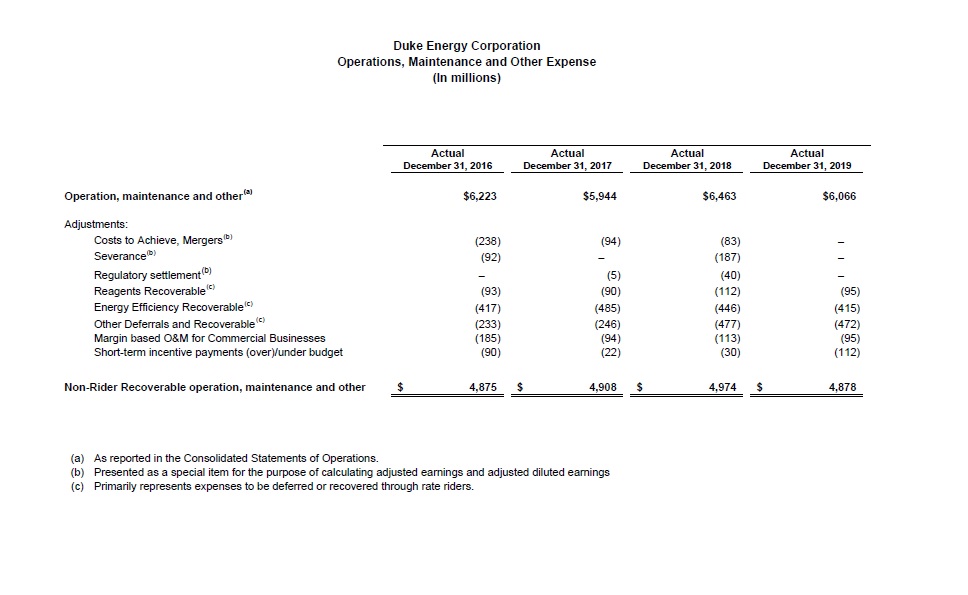 | Duke Energy Corporation Operations, Maintenance and Other Expense (In millions) ActualActualActualActual December 31, 2016December 31, 2017December 31, 2018December 31, 2019 Operation, maintenance and other(a) $6,223$5,944$6,463$6,066 Adjustments: Costs to Achieve, Mergers(b)(238) (94)(83) – Severance(b) (92)–(187) – Regulatory settlement(b) – (5)(40) – Reagents Recoverable(c) (93) (90)(112)(95) Energy Efficiency Recoverable(c)(417)(485)(446)(415) Other Deferrals and Recoverable (c)(233)(246)(477)(472) Margin based O&M for Commercial Businesses(185) (94)(113)(95) Short-term incentive payments (over)/under budget (90) (22)(30)(112) Non-Rider Recoverable operation, maintenance and other$ 4,875$ 4,908$ 4,974$ 4,878 (a) (b) (c) As reported in the Consolidated Statements of Operations. Presented as a special item for the purpose of calculating adjusted earnings and adjusted diluted earnings Primarily represents expenses to be deferred or recovered through rate riders. |
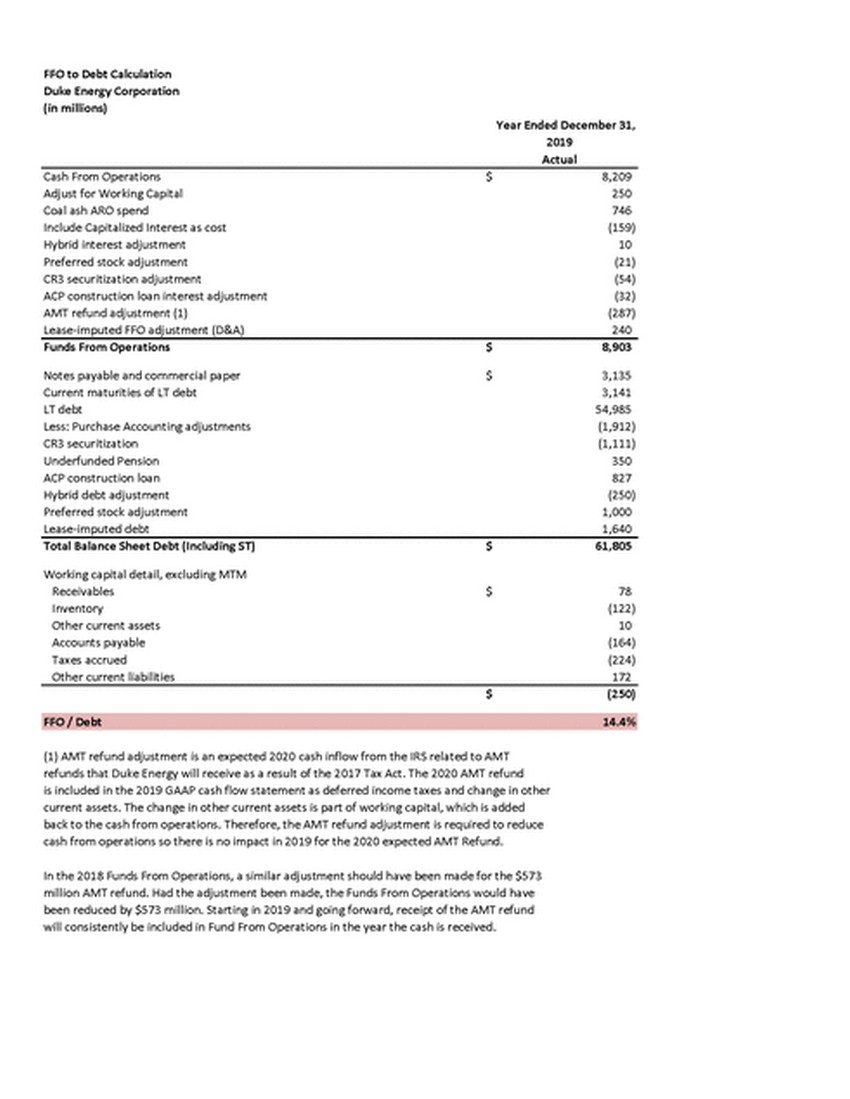 | Duke Energy Corporation (in millions) Year Ended December 31, 2019 Actual FFO / Debt 14.4% (1) AMT refund adjustment is an expected 2020 cash inflow from the IRS related to AMT refunds that Duke Energy will receive as a result of the 2017 Tax Act. The 2020 AMT refund is included in the 2019 GAAP cash flow statement as deferred income taxes and change in other current assets. The change in other current assets is part of working capital, which is added back to the cash from operations. Therefore, the AMT refund adjustment is required to reduce cash from operations so there is no impact in 2019 for the 2020 expected AMT Refund. In the 2018 Funds From Operations, a similar adjustment should have been made for the $573 million AMT refund. Had the adjustment been made, the Funds From Operations would have been reduced by $573 million. Starting in 2019 and going forward, receipt of the AMT refund will consistently be included in Fund From Operations in the year the cash is received. |
 | Duke Energy Carolinas (in millions) Year Ended December 31, 2019 Actual Working capital detail, excluding MTM FFO / Debt26.1% |
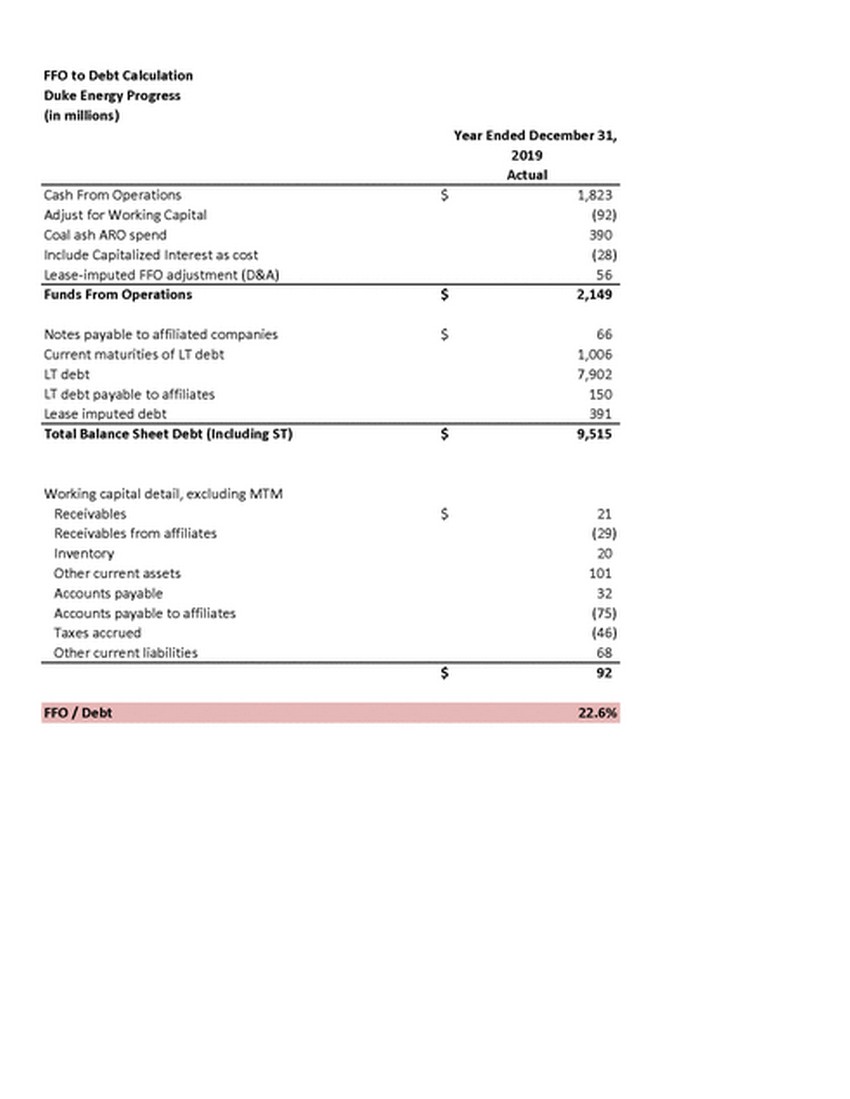 | Working capital detail, excluding MTM FFO / Debt22.6% |
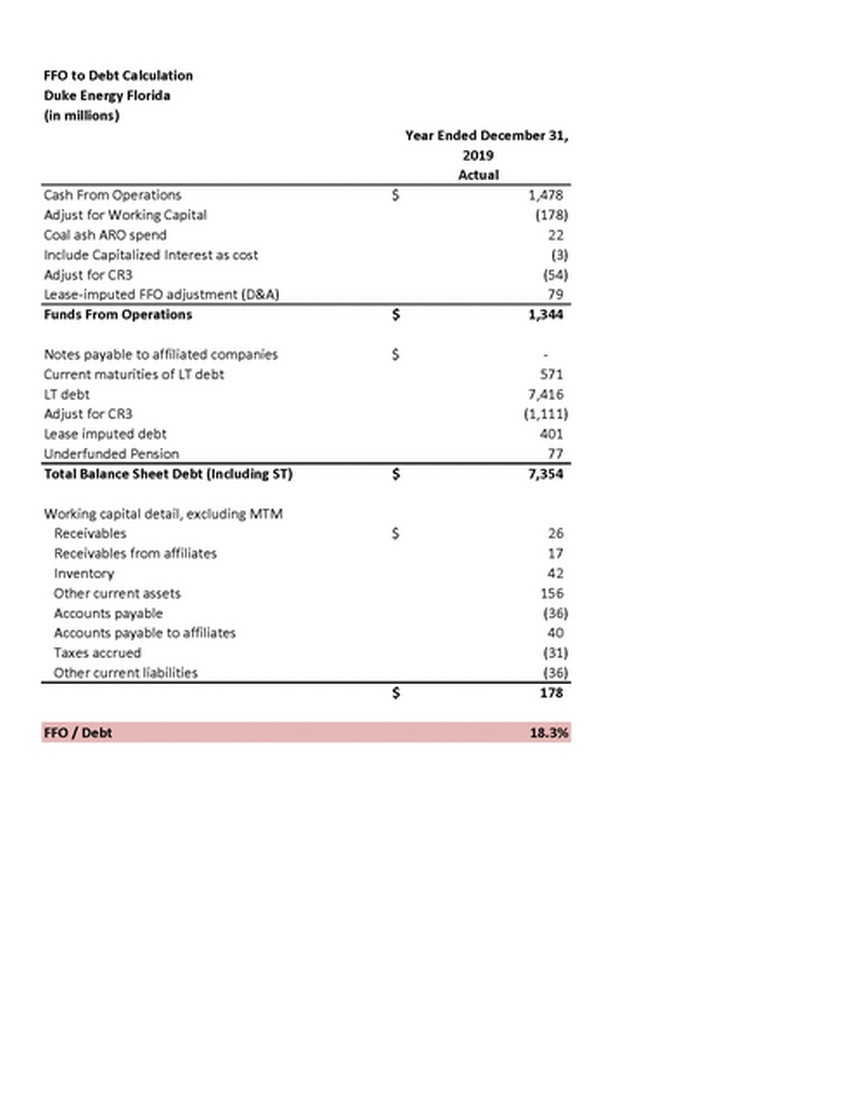 | Year Ended December 31, 2019 Actual Notes payable to affiliated companies$- FFO / Debt18.3% |
 | FFO / Debt24.0% |
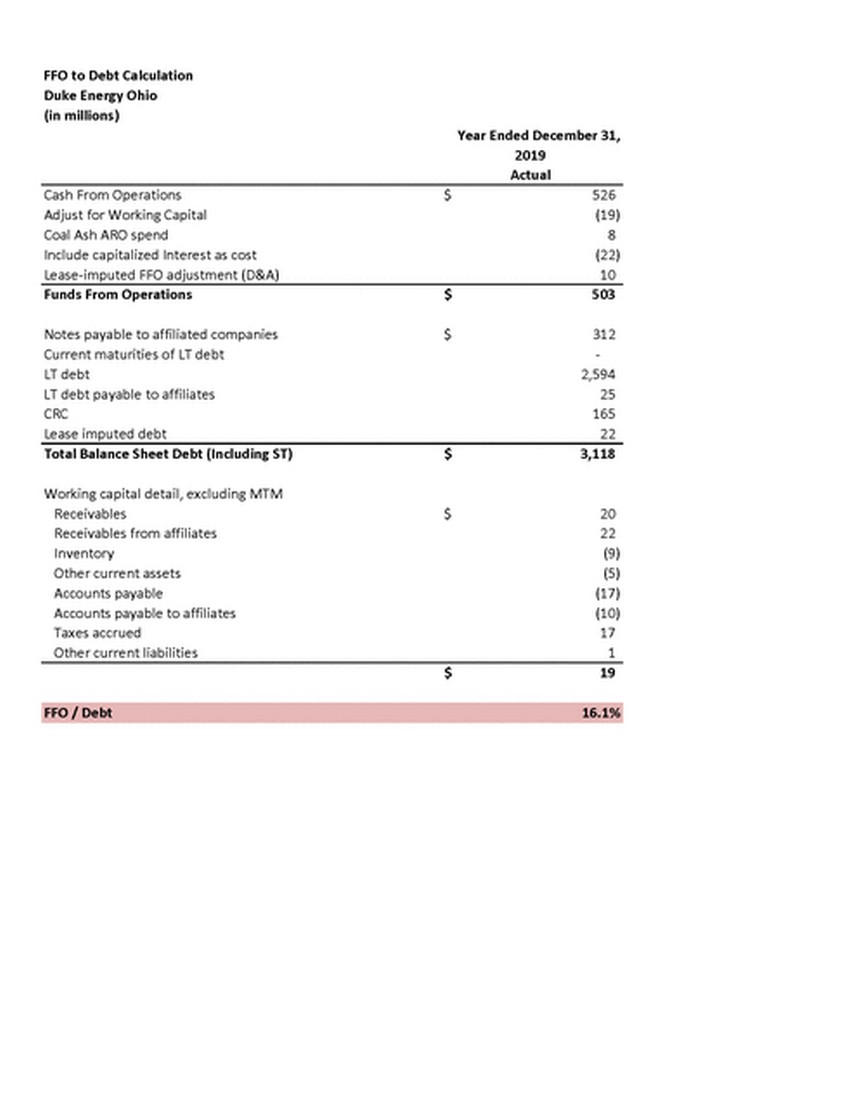 | Current maturities of LT debt- Adjust for Working Capital (19) Coal Ash ARO spend 8 Include capitalized Interest as cost (22) Lease-imputed FFO adjustment (D&A) 10 Funds From Operations $503 Notes payable to affiliated companies $312 LT debt 2,594 LT debt payable to affiliates 25 CRC 165 Lease imputed debt 22 Total Balance Sheet Debt (Including ST) $3,118 Working capital detail, excluding MTM Receivables $20 Receivables from affiliates 22 Inventory (9) Other current assets (5) Accounts payable (17) Accounts payable to affiliates (10) Taxes accrued 17 Other current liabilities 1 $19 |
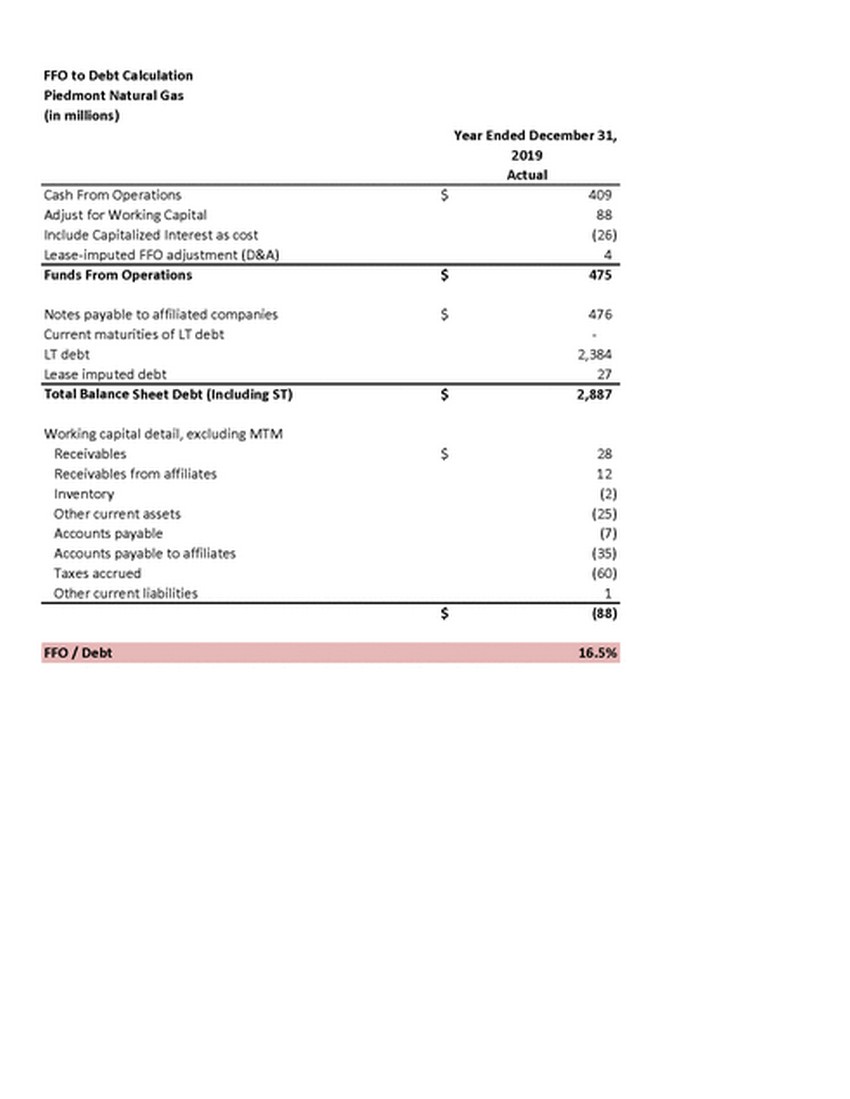 | Adjust for Working Capital88 Include Capitalized Interest as cost(26) Lease-imputed FFO adjustment (D&A)4 Funds From Operations $475 Notes payable to affiliated companies $476 Current maturities of LT debt- LT debt2,384 Lease imputed debt27 Total Balance Sheet Debt (Including ST) $2,887 Working capital detail, excluding MTM Receivables $28 Receivables from affiliates 12 Inventory (2) Other current assets (25) Accounts payable (7) Accounts payable to affiliates (35) Taxes accrued (60) Other current liabilities 1 $(88) FFO / Debt16.5% |