Exhibit 99.1
| // 1 DUKE ENERGY INVESTOR UPDATE June 2021 |
| // 2 // 2 DUKE ENERGY INVESTOR UPDATE – SUMMER 2021 Safe Harbor statement This presentation includes forward-looking statements within the meaning of the federal securities laws. Actual results could differ materially from such forward- looking statements. The factors that could cause actual results to differ are discussed herein and in Duke Energy’s SEC filings, available at www.sec.gov. Regulation G disclosure In addition, today's discussion includes certain non-GAAP financial measures as defined under SEC Regulation G. A reconciliation of those measures to the most directly comparable GAAP measures is available in the Appendix herein and on our Investor Relations website at www.duke-energy.com/investors/. |
| // 3 // 3 DUKE ENERGY INVESTOR UPDATE – SUMMER 2021 This document includes forward-looking statements within the meaning of Section 27A of the Securities Act of 1933 and Section 21E of the Securities Exchange Act of 1934. Forward-looking statements are based on management’s beliefs and assumptions and can often be identified by terms and phrases that include “anticipate,” “believe,” “intend,” “estimate,” “expect,” “continue,” “should,” “could,” “may,” “plan,” “project,” “predict,” “will,” “potential,” “forecast,” “target,” “guidance,” “outlook” or other similar terminology. Various factors may cause actual results to be materially different than the suggested outcomes within forward-looking statements; accordingly, there is no assurance that such results will be realized. These factors include, but are not limited to: The impact of the COVID-19 pandemic; State, federal and foreign legislative and regulatory initiatives, including costs of compliance with existing and future environmental requirements, including those related to climate change, as well as rulings that affect cost and investment recovery or have an impact on rate structures or market prices; The extent and timing of costs and liabilities to comply with federal and state laws, regulations and legal requirements related to coal ash remediation, including amounts for required closure of certain ash impoundments, are uncertain and difficult to estimate; The ability to recover eligible costs, including amounts associated with coal ash impoundment retirement obligations and costs related to significant weather events, and to earn an adequate return on investment through rate case proceedings and the regulatory process; The costs of decommissioning nuclear facilities could prove to be more extensive than amounts estimated and all costs may not be fully recoverable through the regulatory process; Costs and effects of legal and administrative proceedings, settlements, investigations and claims; Industrial, commercial and residential growth or decline in service territories or customer bases resulting from sustained downturns of the economy and the economic health of our service territories or variations in customer usage patterns, including energy efficiency efforts and use of alternative energy sources, such as self-generation and distributed generation technologies; Federal and state regulations, laws and other efforts designed to promote and expand the use of energy efficiency measures and distributed generation technologies, such as private solar and battery storage, in Duke Energy service territories could result in customers leaving the electric distribution system, excess generation resources as well as stranded costs; Advancements in technology; Additional competition in electric and natural gas markets and continued industry consolidation; The influence of weather and other natural phenomena on operations, including the economic, operational and other effects of severe storms, hurricanes, droughts, earthquakes and tornadoes, including extreme weather associated with climate change; Changing customer expectations and demands including heightened emphasis on environmental, social and governance concerns; The ability to successfully operate electric generating facilities and deliver electricity to customers including direct or indirect effects to the company resulting from an incident that affects the U.S. electric grid or generating resources; Operational interruptions to our natural gas distribution and transmission activities; The availability of adequate interstate pipeline transportation capacity and natural gas supply; The impact on facilities and business from a terrorist attack, cybersecurity threats, data security breaches, operational accidents, information technology failures or other catastrophic events, such as fires, explosions, pandemic health events or other similar occurrences; The inherent risks associated with the operation of nuclear facilities, including environmental, health, safety, regulatory and financial risks, including the financial stability of third-party service providers; The timing and extent of changes in commodity prices and interest rates and the ability to recover such costs through the regulatory process, where appropriate, and their impact on liquidity positions and the value of underlying assets; The results of financing efforts, including the ability to obtain financing on favorable terms, which can be affected by various factors, including credit ratings, interest rate fluctuations, compliance with debt covenants and conditions and general market and economic conditions; Credit ratings of the Duke Energy Registrants may be different from what is expected; Declines in the market prices of equity and fixed-income securities and resultant cash funding requirements for defined benefit pension plans, other post-retirement benefit plans and nuclear decommissioning trust funds; Construction and development risks associated with the completion of the Duke Energy Registrants’ capital investment projects, including risks related to financing, obtaining and complying with terms of permits, meeting construction budgets and schedules and satisfying operating and environmental performance standards, as well as the ability to recover costs from customers in a timely manner, or at all; Changes in rules for regional transmission organizations, including changes in rate designs and new and evolving capacity markets, and risks related to obligations created by the default of other participants; The ability to control operation and maintenance costs; The level of creditworthiness of counterparties to transactions; The ability to obtain adequate insurance at acceptable costs; Employee workforce factors, including the potential inability to attract and retain key personnel; The ability of subsidiaries to pay dividends or distributions to Duke Energy Corporation holding company (the Parent);The performance of projects undertaken by our nonregulated businesses and the success of efforts to invest in and develop new opportunities; The effect of accounting pronouncements issued periodically by accounting standard-setting bodies; The impact of U.S. tax legislation to our financial condition, results of operations or cash flows and our credit ratings; The impacts from potential impairments of goodwill or equity method investment carrying values; and the ability to implement our business strategy, including enhancing existing technology systems. Additional risks and uncertainties are identified and discussed in the Duke Energy Registrants' reports filed with the SEC and available at the SEC's website at sec.gov. In light of these risks, uncertainties and assumptions, the events described in the forward-looking statements might not occur or might occur to a different extent or at a different time than described. Forward-looking statements speak only as of the date they are made and the Duke Energy Registrants expressly disclaim an obligation to publicly update or revise any forward-looking statements, whether as a result of new information, future events or otherwise. Safe harbor statement |
| // 4 // 4 DUKE ENERGY INVESTOR UPDATE – SUMMER 2021 Agenda ▪ Value proposition and accomplishments ▪ Large-scale platform ▪ Strong growth outlook ▪ Jurisdictional updates ▪ Operational excellence and governance |
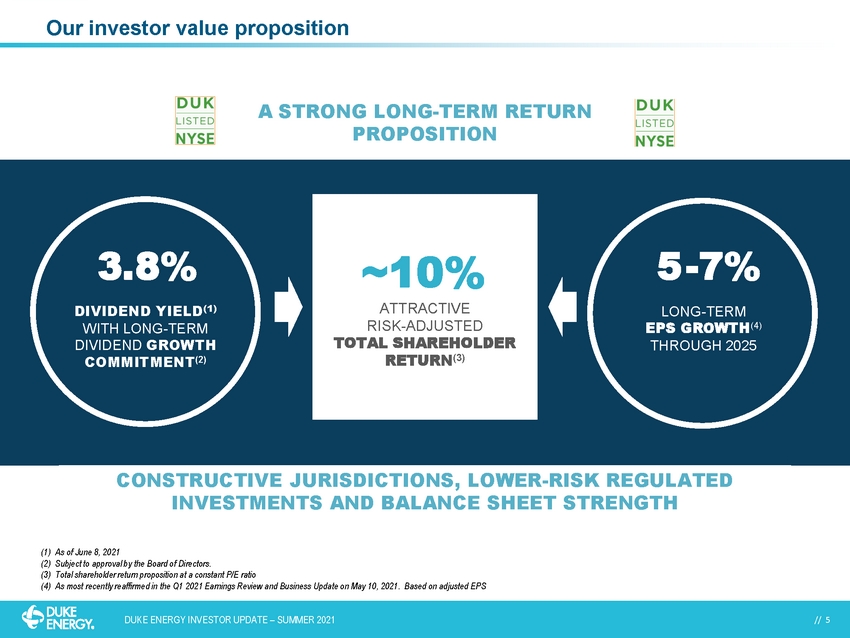
| // 5 // 5 DUKE ENERGY INVESTOR UPDATE – SUMMER 2021 Our investor value proposition zzz LONG-TERM EPS GROWTH(4) THROUGH 2025 DIVIDEND YIELD(1) WITH LONG-TERM DIVIDEND GROWTH COMMITMENT(2) CONSTRUCTIVE JURISDICTIONS, LOWER-RISK REGULATED INVESTMENTS AND BALANCE SHEET STRENGTH 5-7% 3.8% (1) As of June 2, 2021 (2) Subject to approval by the Board of Directors. (3) Total shareholder return proposition at a constant P/E ratio (4) As most recently reaffirmed in the Q1 2021 Earnings Review and Business Update on May 10, 2021. Based on adjusted EPS ATTRACTIVE RISK-ADJUSTED TOTAL SHAREHOLDER RETURN(3) ~10% A STRONG LONG-TERM RETURN PROPOSITION |
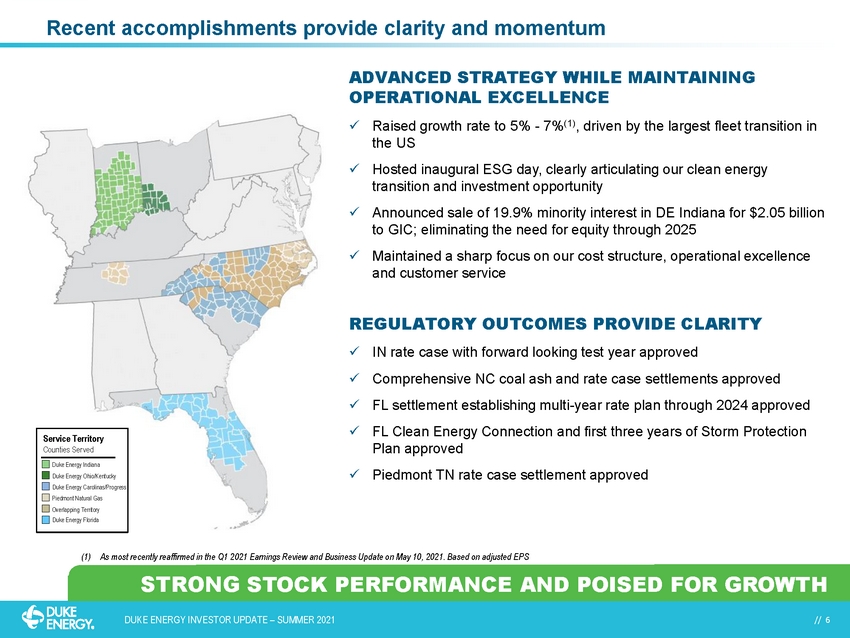
| // 6 // 6 DUKE ENERGY INVESTOR UPDATE – SUMMER 2021 Recent accomplishments provide clarity and momentum STRONG STOCK PERFORMANCE AND POISED FOR GROWTH Service Territory Counties Served Duke Energy Indiana Duke Energy Ohio/Kentucky Duke Energy Carolinas/Progress Piedmont Natural Gas Overlapping Territory Duke Energy Florida ADVANCED STRATEGY WHILE MAINTAINING OPERATIONAL EXCELLENCE ✓ Raised growth rate to 5% - 7%(1), driven by the largest fleet transition in the US ✓ Hosted inaugural ESG day, clearly articulating our clean energy transition and investment opportunity ✓ Announced sale of 19.9% minority interest in DE Indiana for $2.05 billion to GIC; eliminating the need for equity through 2025 ✓ Maintained a sharp focus on our cost structure, operational excellence and customer service REGULATORY OUTCOMES PROVIDE CLARITY ✓ IN rate case with forward looking test year approved ✓ Comprehensive NC coal ash and rate case settlements approved ✓ FL settlement establishing multi-year rate plan through 2024 approved ✓ FL Clean Energy Connection and first three years of Storm Protection Plan approved ✓ Piedmont TN rate case settlement approved (1) As most recently reaffirmed in the Q1 2021 Earnings Review and Business Update on May 10, 2021. Based on adjusted EPS |
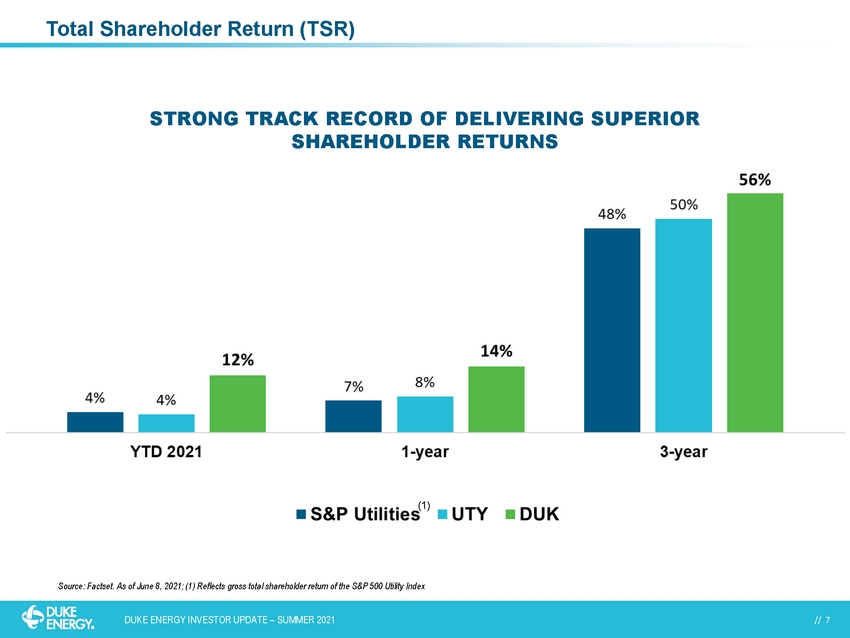
| // 7 // 7 DUKE ENERGY INVESTOR UPDATE – SUMMER 2021 Total Shareholder Return (TSR) Source: Factset. As of June 2, 2021; (1) Reflects gross total shareholder return of the S&P 500 Utility Index STRONG TRACK RECORD OF DELIVERING SUPERIOR SHAREHOLDER RETURNS (1) |
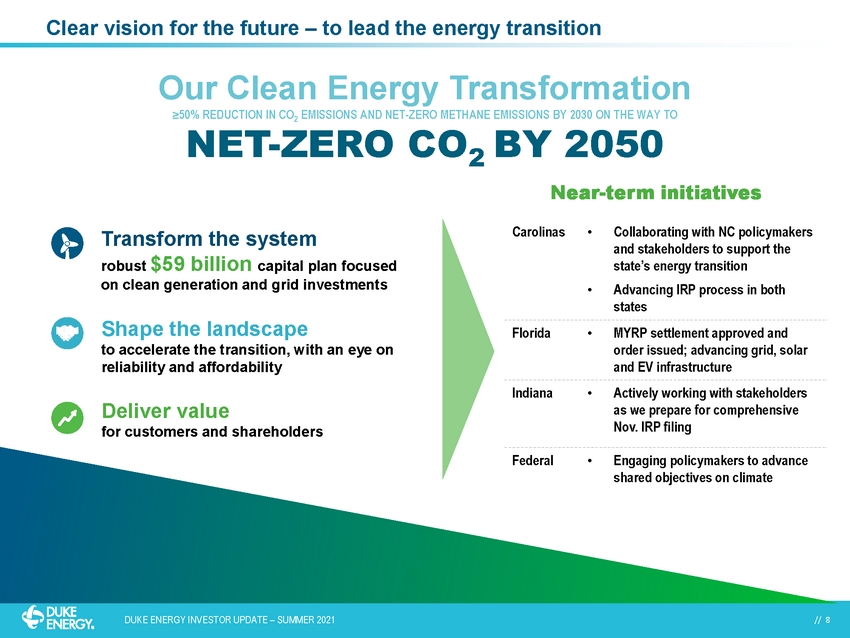
| // 8 // 8 DUKE ENERGY INVESTOR UPDATE – SUMMER 2021 Clear vision for the future – to lead the energy transition Our Clean Energy Transformation ≥50% REDUCTION IN CO2 EMISSIONS AND NET-ZERO METHANE EMISSIONS BY 2030 ON THE WAY TO NET-ZERO CO2 BY 2050 Shape the landscape to accelerate the transition, with an eye on reliability and affordability Transform the system robust $59 billion capital plan focused on clean generation and grid investments Deliver value for customers and shareholders Carolinas • Collaborating with NC policymakers and stakeholders to support the state’s energy transition • Advancing IRP process in both states Florida • MYRP settlement approved; advancing grid, solar and EV infrastructure Indiana • Actively working with stakeholders as we prepare for comprehensive Nov. IRP filing Federal • Engaging policymakers to advance shared objectives on climate Near-term initiatives |
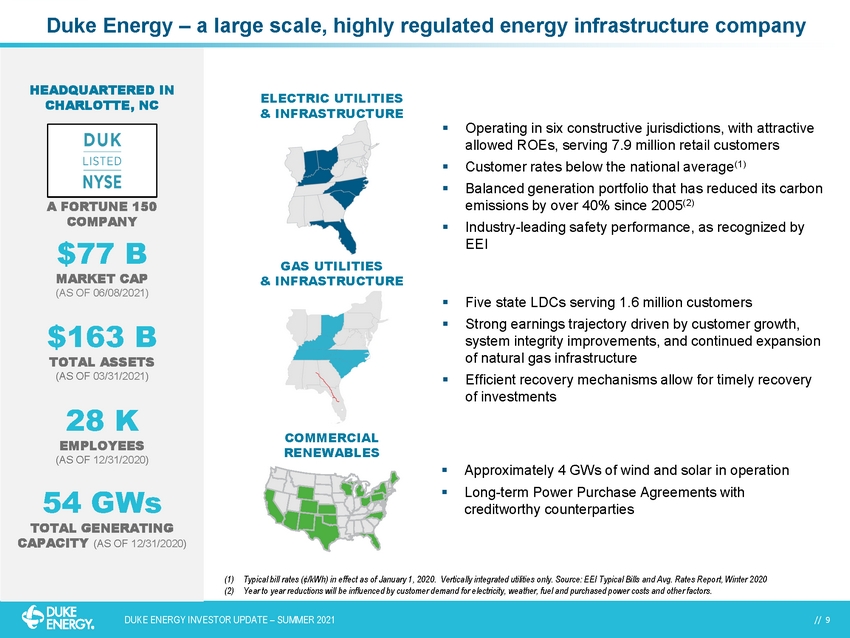
| // 9 // 9 DUKE ENERGY INVESTOR UPDATE – SUMMER 2021 Duke Energy – a large scale, highly regulated energy infrastructure company $77 B MARKET CAP (AS OF 06/02/2021) HEADQUARTERED IN CHARLOTTE, NC $163 B TOTAL ASSETS (AS OF 03/31/2021) 28 K EMPLOYEES (AS OF 12/31/2020) 54 GWs TOTAL GENERATING CAPACITY (AS OF 12/31/2020) ▪ Operating in six constructive jurisdictions, with attractive allowed ROEs, serving 7.9 million retail customers ▪ Customer rates below the national average(1) ▪ Balanced generation portfolio that has reduced its carbon emissions by over 40% since 2005(2) ▪ Industry-leading safety performance, as recognized by EEI ▪ Approximately 4 GWs of wind and solar in operation ▪ Long-term Power Purchase Agreements with creditworthy counterparties ▪ Five state LDCs serving 1.6 million customers ▪ Strong earnings trajectory driven by customer growth, system integrity improvements, and continued expansion of natural gas infrastructure ▪ Efficient recovery mechanisms allow for timely recovery of investments A FORTUNE 150 COMPANY ELECTRIC UTILITIES & INFRASTRUCTURE GAS UTILITIES & INFRASTRUCTURE COMMERCIAL RENEWABLES (1) Typical bill rates (¢/kWh) in effect as of January 1, 2020. Vertically integrated utilities only. Source: EEI Typical Bills and Avg. Rates Report, Winter 2020 (2) Year to year reductions will be influenced by customer demand for electricity, weather, fuel and purchased power costs and other factors. |
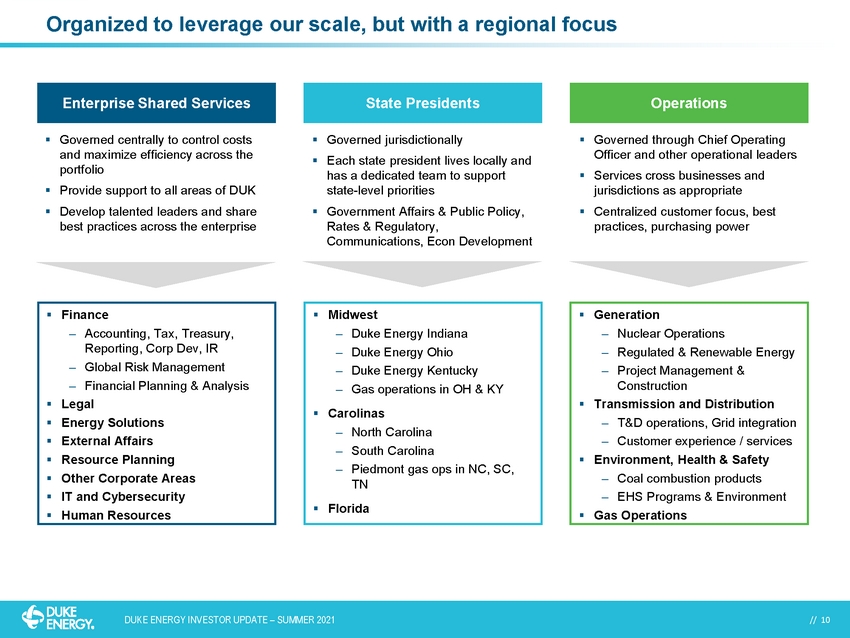
| // 10 // 10 DUKE ENERGY INVESTOR UPDATE – SUMMER 2021 Organized to leverage our scale, but with a regional focus Enterprise Shared Services State Presidents Operations ▪ Governed centrally to control costs and maximize efficiency across the portfolio ▪ Provide support to all areas of DUK ▪ Develop talented leaders and share best practices across the enterprise ▪ Governed jurisdictionally ▪ Each state president lives locally and has a dedicated team to support state-level priorities ▪ Government Affairs & Public Policy, Rates & Regulatory, Communications, Econ Development ▪ Governed through Chief Operating Officer and other operational leaders ▪ Services cross businesses and jurisdictions as appropriate ▪ Centralized customer focus, best practices, purchasing power ▪ Finance ‒ Accounting, Tax, Treasury, Reporting, Corp Dev, IR ‒ Global Risk Management ‒ Financial Planning & Analysis ▪ Legal ▪ Energy Solutions ▪ External Affairs ▪ Resource Planning ▪ Other Corporate Areas ▪ IT and Cybersecurity ▪ Human Resources ▪ Midwest ‒ Duke Energy Indiana ‒ Duke Energy Ohio ‒ Duke Energy Kentucky ‒ Gas operations in OH & KY ▪ Carolinas ‒ North Carolina ‒ South Carolina ‒ Piedmont gas ops in NC, SC, TN ▪ Florida ▪ Generation ‒ Nuclear Operations ‒ Regulated & Renewable Energy ‒ Project Management & Construction ▪ Transmission and Distribution ‒ T&D operations, Grid integration ‒ Customer experience / services ▪ Environment, Health & Safety ‒ Coal combustion products ‒ EHS Programs & Environment ▪ Gas Operations |
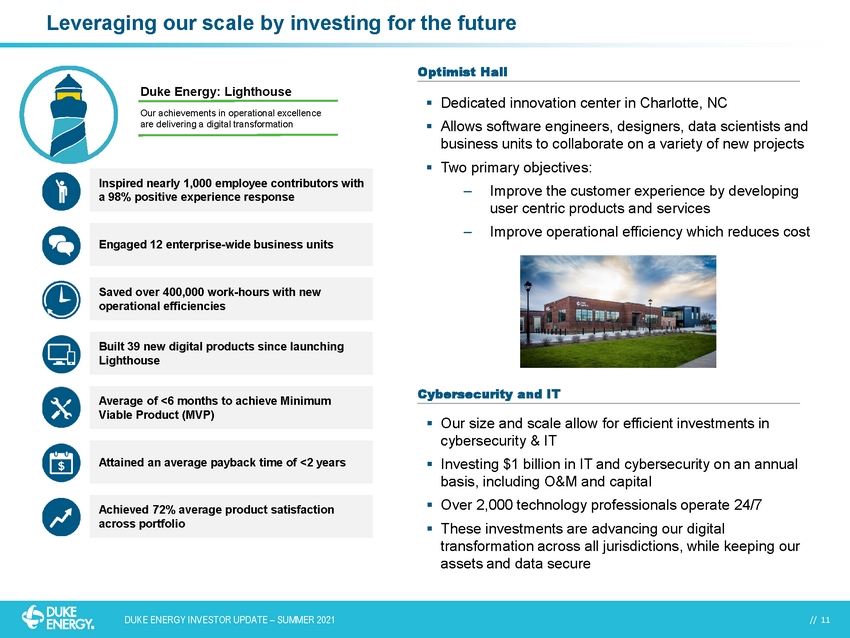
| // 11 // 11 DUKE ENERGY INVESTOR UPDATE – SUMMER 2021 Leveraging our scale by investing for the future Inspired nearly 1,000 employee contributors with a 98% positive experience response Saved over 400,000 work-hours with new operational efficiencies Engaged 12 enterprise-wide business units Built 39 new digital products since launching Lighthouse Optimist Hall ▪ Dedicated innovation center in Charlotte, NC ▪ Allows software engineers, designers, data scientists and business units to collaborate on a variety of new projects ▪ Two primary objectives: ‒ Improve the customer experience by developing user centric products and services ‒ Improve operational efficiency which reduces cost Average of <6 months to achieve Minimum Viable Product (MVP) Attained an average payback time of <2 years Achieved 72% average product satisfaction across portfolio Duke Energy: Lighthouse Our achievements in operational excellence are delivering a digital transformation Cybersecurity and IT ▪ Our size and scale allow for efficient investments in cybersecurity & IT ▪ Investing $1 billion in IT and cybersecurity on an annual basis, including O&M and capital ▪ Over 2,000 technology professionals operate 24/7 ▪ These investments are advancing our digital transformation across all jurisdictions, while keeping our assets and data secure |
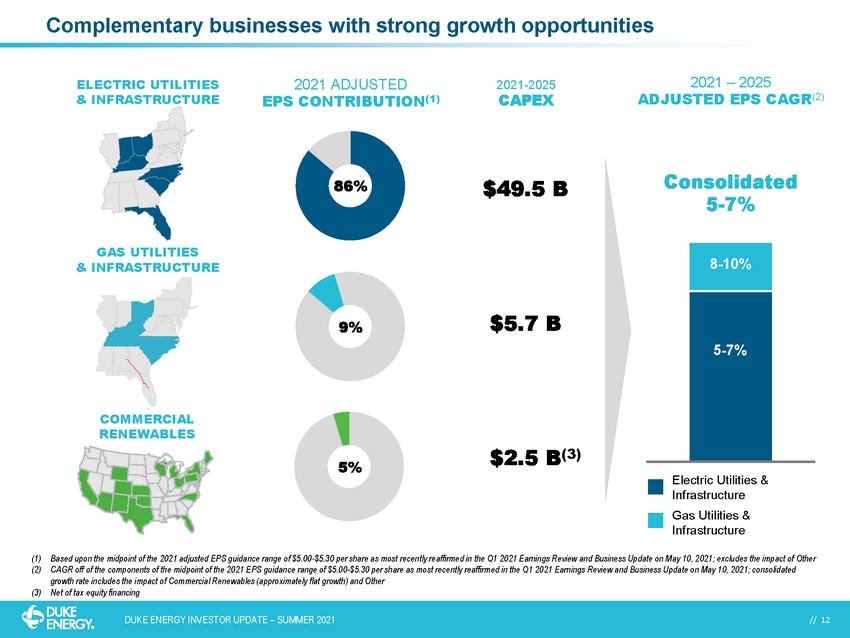
| // 12 // 12 DUKE ENERGY INVESTOR UPDATE – SUMMER 2021 Complementary businesses with strong growth opportunities 86% 9% 5% Consolidated 5-7% 5-7% 8-10% 2021 – 2025 ADJUSTED EPS CAGR(2) 2021 ADJUSTED EPS CONTRIBUTION(1) Electric Utilities & Infrastructure Gas Utilities & Infrastructure 2021-2025 CAPEX $49.5 B $5.7 B $2.5 B(3) (1) Based upon the midpoint of the 2021 adjusted EPS guidance range of $5.00-$5.30 per share as most recently reaffirmed in the Q1 2021 Earnings Review and Business Update on May 10, 2021; excludes the impact of Other (2) CAGR off of the components of the midpoint of the 2021 EPS guidance range of $5.00-$5.30 per share as most recently reaffirmed in the Q1 2021 Earnings Review and Business Update on May 10, 2021; consolidated growth rate includes the impact of Commercial Renewables (approximately flat growth) and Other (3) Net of tax equity financing ELECTRIC UTILITIES & INFRASTRUCTURE GAS UTILITIES & INFRASTRUCTURE COMMERCIAL RENEWABLES |
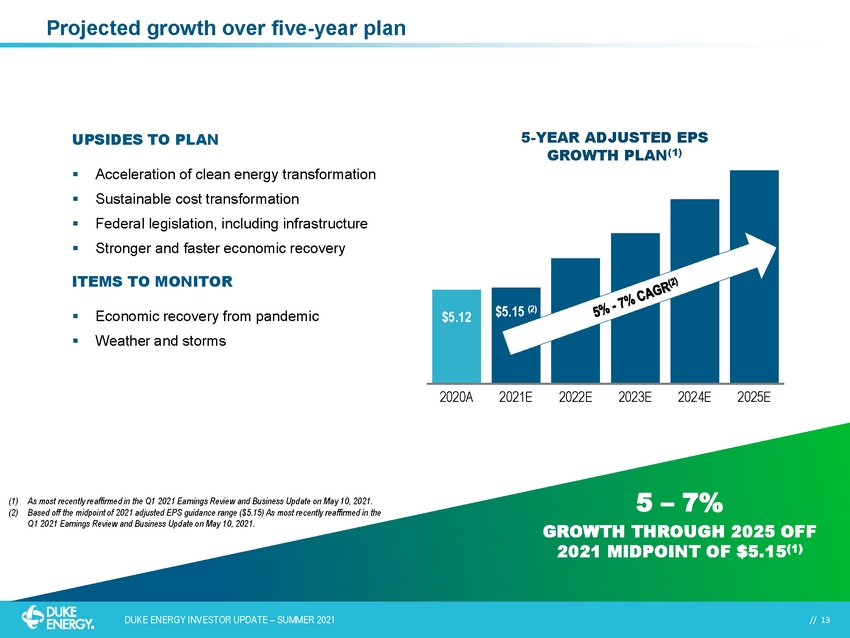
| // 13 // 13 DUKE ENERGY INVESTOR UPDATE – SUMMER 2021 Projected growth over five-year plan $5.12 ($0.13) 5-YEAR ADJUSTED EPS GROWTH PLAN(1) $5.12 $5.15 (2) 2020A 2021E 2022E 2023E 2024E 2025E UPSIDES TO PLAN ▪ Acceleration of clean energy transformation ▪ Sustainable cost transformation ▪ Federal legislation, including infrastructure ▪ Stronger and faster economic recovery ITEMS TO MONITOR ▪ Economic recovery from pandemic ▪ Weather and storms 5 – 7% GROWTH THROUGH 2025 OFF 2021 MIDPOINT OF $5.15(1) (1) As most recently reaffirmed in the Q1 2021 Earnings Review and Business Update on May 10, 2021. (2) Based off the midpoint of 2021 adjusted EPS guidance range ($5.15) As most recently reaffirmed in the Q1 2021 Earnings Review and Business Update on May 10, 2021. |
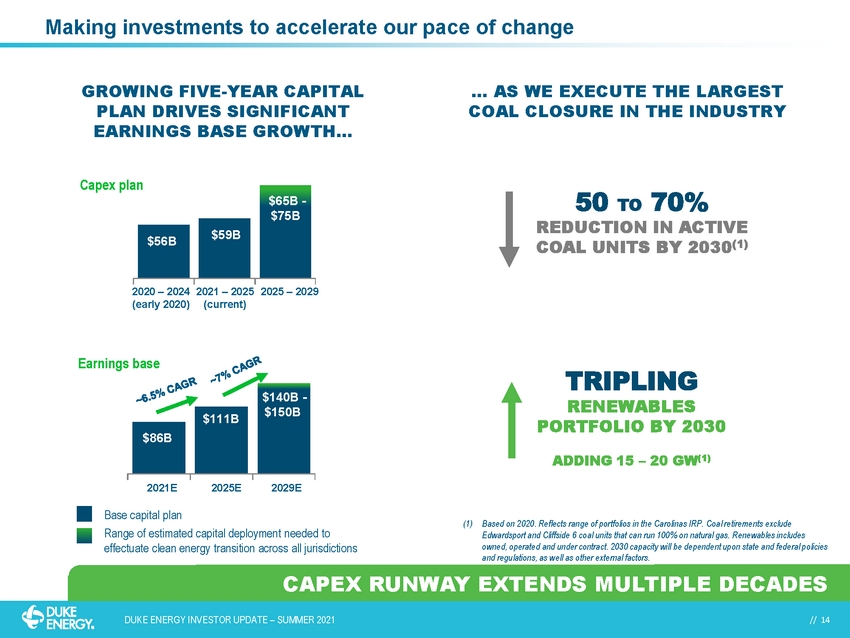
| // 14 // 14 DUKE ENERGY INVESTOR UPDATE – SUMMER 2021 Making investments to accelerate our pace of change CAPEX RUNWAY EXTENDS MULTIPLE DECADES … AS WE EXECUTE THE LARGEST COAL CLOSURE IN THE INDUSTRY GROWING FIVE-YEAR CAPITAL PLAN DRIVES SIGNIFICANT EARNINGS BASE GROWTH… 2021 – 2025 (current) $59B 2025 – 2029 $65B - $75B 2020 – 2024 (early 2020) $56B 2021E 2025E 2029E $86B $111B $140B - $150B Range of estimated capital deployment needed to effectuate clean energy transition across all jurisdictions Base capital plan 50 TO 70% REDUCTION IN ACTIVE COAL UNITS BY 2030(1) TRIPLING RENEWABLES PORTFOLIO BY 2030 ADDING 15 – 20 GW(1) Capex plan Earnings base (1) Based on 2020. Reflects range of portfolios in the Carolinas IRP. Coal retirements exclude Edwardsport and Cliffside 6 coal units that can run 100% on natural gas. Renewables includes owned, operated and under contract. 2030 capacity will be dependent upon state and federal policies and regulations, as well as other external factors. |
| // 15 // 15 DUKE ENERGY INVESTOR UPDATE – SUMMER 2021 Balance sheet supports our long-term growth strategy COMMITTED TO STRONG CASH FLOWS SUPPORTIVE OF CREDIT RATINGS ▪ Duke Energy operates in constructive jurisdictions, with a de-risked financial plan – Rate case orders or settlements in Carolinas, Indiana, Florida and Tennessee ▪ Proven capability to drive operational efficiencies – Track record of cost management and capital optimization – Pension plan fully funded (no expected contributions in 5-year plan) ▪ Creative capital raising supports credit – Partnership with GIC to secure minority investment in DEI – Commercial renewables joint venture with John Hancock – Tax equity partnerships for Commercial Renewables ▪ Current credit ratings provide highly competitive cost of debt ▪ Targeting 14% FFO/Debt throughout the 5-year plan – Provides adequate cushion to absorb unplanned events and maintain current credit profile 95TH CONSECUTIVE YEAR OF PAYING CASH DIVIDENDS NO COMMON EQUITY ISSUANCES IN 5-YEAR PLAN |
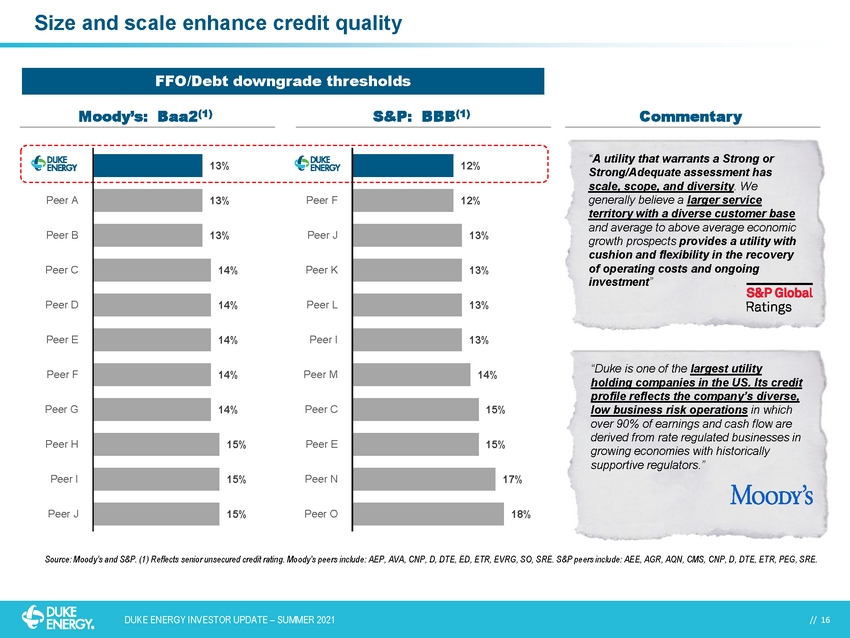
| // 16 // 16 DUKE ENERGY INVESTOR UPDATE – SUMMER 2021 Size and scale enhance credit quality Moody’s: Baa2(1) S&P: BBB(1) Commentary Source: Moody’s and S&P. (1) Reflects senior unsecured credit rating. Moody’s peers include: AEP, AVA, CNP, D, DTE, ED, ETR, EVRG, SO, SRE. S&P peers include: AEE, AGR, AQN, CMS, CNP, D, DTE, ETR, PEG, SRE. “Duke is one of the largest utility holding companies in the US. Its credit profile reflects the company’s diverse, low business risk operations in which over 90% of earnings and cash flow are derived from rate regulated businesses in growing economies with historically supportive regulators.” “A utility that warrants a Strong or Strong/Adequate assessment has scale, scope, and diversity. We generally believe a larger service territory with a diverse customer base and average to above average economic growth prospects provides a utility with cushion and flexibility in the recovery of operating costs and ongoing investment” FFO/Debt downgrade thresholds 15% 15% 15% 14% 14% 14% 14% 14% 13% 13% 13% Peer J Peer I Peer H Peer G Peer F Peer E Peer D Peer C Peer B Peer A 18% 17% 15% 15% 14% 13% 13% 13% 13% 12% 12% Peer O Peer N Peer E Peer C Peer M Peer I Peer L Peer K Peer J Peer F |
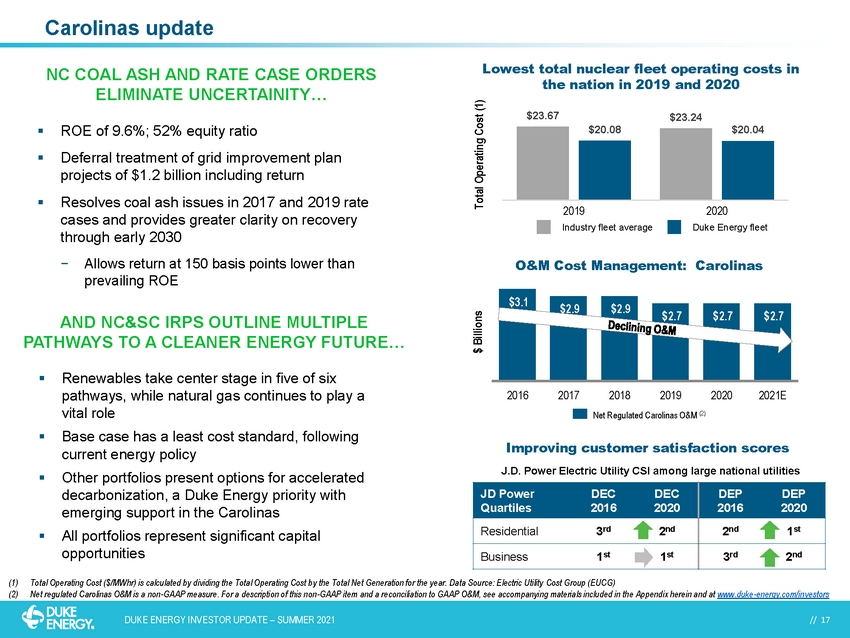
| // 17 // 17 DUKE ENERGY INVESTOR UPDATE – SUMMER 2021 $3.1 $2.9 $2.9 $2.7 $2.7 $2.7 2016 2017 2018 2019 2020 2021E Net Regulated Carolinas O&M (2) NC COAL ASH AND RATE CASE ORDERS ELIMINATE UNCERTAINITY… Carolinas update AND NC&SC IRPS OUTLINE MULTIPLE PATHWAYS TO A CLEANER ENERGY FUTURE… ▪ ROE of 9.6%; 52% equity ratio ▪ Deferral treatment of grid improvement plan projects of $1.2 billion including return ▪ Resolves coal ash issues in 2017 and 2019 rate cases and provides greater clarity on recovery through early 2030 − Allows return at 150 basis points lower than prevailing ROE ▪ Renewables take center stage in five of six pathways, while natural gas continues to play a vital role ▪ Base case has a least cost standard, following current energy policy ▪ Other portfolios present options for accelerated decarbonization, a Duke Energy priority with emerging support in the Carolinas ▪ All portfolios represent significant capital opportunities O&M Cost Management: Carolinas Improving customer satisfaction scores Lowest total nuclear fleet operating costs in the nation in 2019 and 2020 Total Operating Cost (1) J.D. Power Electric Utility CSI among large national utilities JD Power Quartiles DEC 2016 DEC 2020 DEP 2016 DEP 2020 Residential 3rd 2nd 2nd 1st Business 1st 1st 3rd 2nd Duke Energy fleet (1) Total Operating Cost ($/MWhr) is calculated by dividing the Total Operating Cost by the Total Net Generation for the year. Data Source: Electric Utility Cost Group (EUCG) (2) Net regulated Carolinas O&M is a non-GAAP measure. For a description of this non-GAAP item and a reconciliation to GAAP O&M, see accompanying materials included in the Appendix herein and at www.duke-energy.com/investors $23.67 $23.24 $20.08 $20.04 2019 2020 Industry fleet average $ Billions |
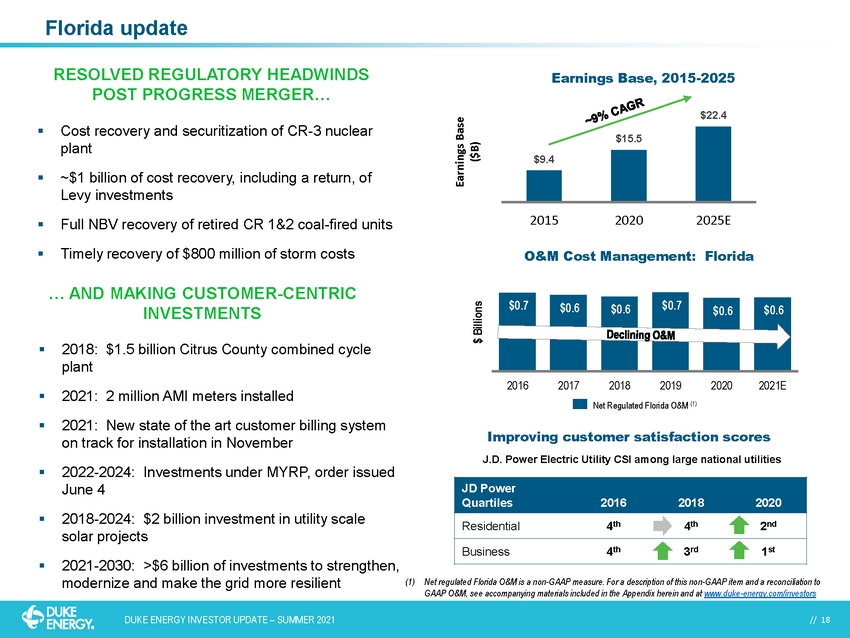
| // 18 // 18 DUKE ENERGY INVESTOR UPDATE – SUMMER 2021 RESOLVED REGULATORY HEADWINDS POST PROGRESS MERGER… Florida update … AND MAKING CUSTOMER-CENTRIC INVESTMENTS ▪ Cost recovery and securitization of CR-3 nuclear plant ▪ ~$1 billion of cost recovery, including a return, of Levy investments ▪ Full NBV recovery of retired CR 1&2 coal-fired units ▪ Timely recovery of $800 million of storm costs ▪ 2018: $1.5 billion Citrus County combined cycle plant ▪ 2021: 2 million AMI meters installed ▪ 2021: New state of the art customer billing system on track for installation in November ▪ 2018-24: $2 billion investment in utility scale solar projects ▪ 2021-2030: >$6 billion of investments to strengthen, modernize and make the grid more resilient $9.4 $15.5 $22.4 2015 2020 2025E Earnings Base ($B) (1) Net regulated Florida O&M is a non-GAAP measure. For a description of this non-GAAP item and a reconciliation to GAAP O&M, see accompanying materials included in the Appendix herein and at www.duke-energy.com/investors Earnings Base, 2015-2025 Improving customer satisfaction scores J.D. Power Electric Utility CSI among large national utilities JD Power Quartiles 2016 2018 2020 Residential 4th 4th 2nd Business 4th 3rd 1st $0.7 $0.6 $0.6 $0.7 $0.6 $0.6 2016 2017 2018 2019 2020 2021E Net Regulated Midwest O&M (1) O&M Cost Management: Florida $ Billions |
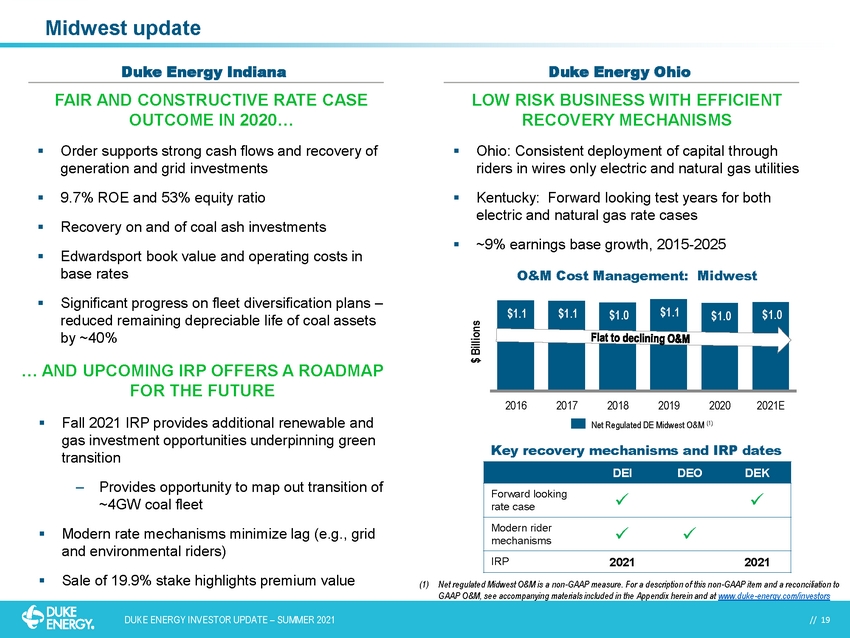
| // 19 // 19 DUKE ENERGY INVESTOR UPDATE – SUMMER 2021 FAIR AND CONSTRUCTIVE RATE CASE OUTCOME IN 2020… Midwest update … AND UPCOMING IRP OFFERS A ROADMAP FOR THE FUTURE ▪ Order supports strong cash flows and recovery of generation and grid investments ▪ 9.7% ROE and 53% equity ratio ▪ Recovery on and of coal ash investments ▪ Edwardsport book value and operating costs in base rates ▪ Significant progress on fleet diversification plans – reduced remaining depreciable life of coal assets by ~40% ▪ Fall 2021 IRP provides additional renewable and gas investment opportunities underpinning green transition ‒ Provides opportunity to map out transition of ~4GW coal fleet ▪ Modern rate mechanisms minimize lag (e.g., grid and environmental riders) ▪ Sale of 19.9% stake highlights premium value Duke Energy Indiana LOW RISK BUSINESS WITH EFFICIENT RECOVERY MECHANISMS ▪ Ohio: Consistent deployment of capital through riders in wires only electric and natural gas utilities ▪ Kentucky: Forward looking test years for both electric and natural gas rate cases ▪ ~9% earnings base growth, 2015-2025 Duke Energy Ohio DEI DEO DEK Forward looking rate case ✓ ✓ Modern rider mechanisms ✓ ✓ IRP 2021 2021 Key recovery mechanisms and IRP dates $1.1 $1.1 $1.0 $1.1 $1.0 $1.0 2016 2017 2018 2019 2020 2021E Net Regulated DE Midwest O&M (1) O&M Cost Management: Midwest $ Billions (1) Net regulated Midwest O&M is a non-GAAP measure. For a description of this non-GAAP item and a reconciliation to GAAP O&M, see accompanying materials included in the Appendix herein and at www.duke-energy.com/investors |
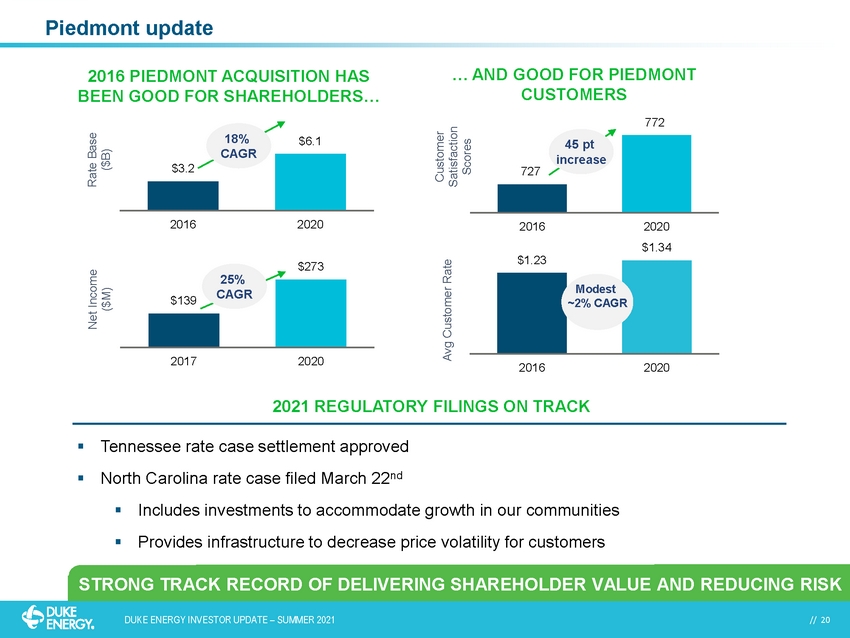
| // 20 // 20 DUKE ENERGY INVESTOR UPDATE – SUMMER 2021 2016 PIEDMONT ACQUISITION HAS BEEN GOOD FOR SHAREHOLDERS… STRONG TRACK RECORD OF DELIVERING SHAREHOLDER VALUE AND REDUCING RISK $3.2 $6.1 2016 2020 Rate Base ($B) 18% CAGR Piedmont update … AND GOOD FOR PIEDMONT CUSTOMERS 727 772 2016 2020 Customer Satisfaction Scores 45 pt increase 2021 REGULATORY FILINGS ON TRACK $1.23 $1.34 2016 2020 Avg Customer Rate ▪ Tennessee rate case settlement approved ▪ North Carolina rate case filed March 22nd ▪ Includes investments to accommodate growth in our communities ▪ Provides infrastructure to decrease price volatility for customers Modest ~2% CAGR $139 $273 2017 2020 Net Income ($M) 25% CAGR |
| // 21 // 21 DUKE ENERGY INVESTOR UPDATE – SUMMER 2021 Operational excellence on behalf of our customers SAFETY ▪ Duke Energy was an industry leader for the sixth year in a row - Total incident case rate (TICR) of 0.33 in 2020 ▪ TICR nearly 50% lower (better) than 2013 levels, the first full year after the Progress merger NUCLEAR PERFORMANCE ▪ 22nd consecutive year with a fleet capacity factor greater than 90% (94.42% in 2020) ▪ All six nuclear sites are recognized by the industry for exemplary performance STORM RESPONSE ▪ Duke Energy has received over 20 Emergency Response Awards since EEI began recognizing storm response in 1998 (includes 7 for assisting other utilities) ▪ Received 7 awards for storm response in our service territories over the past decade CUSTOMER SATISFACTION ▪ Beginning in 2017, developed and implemented an ecosystem of customer satisfaction measurement tools to understand and identify pain points in the current customer experience ▪ By focusing on improving our customers’ actual experiences, we have seen improvements in customer satisfaction that have outpaced the industry (as measured by J.D. Power & Associates’ Customer Satisfaction Index) – Residential J.D. Power CSI scores improved for all jurisdictions with DEP and DEF recognized as ‘Top Movers’ in 2020 – DEC was recognized as a ‘Top Mover’ in the 2020 business study and finished in the top quartile nationally along with DEF |
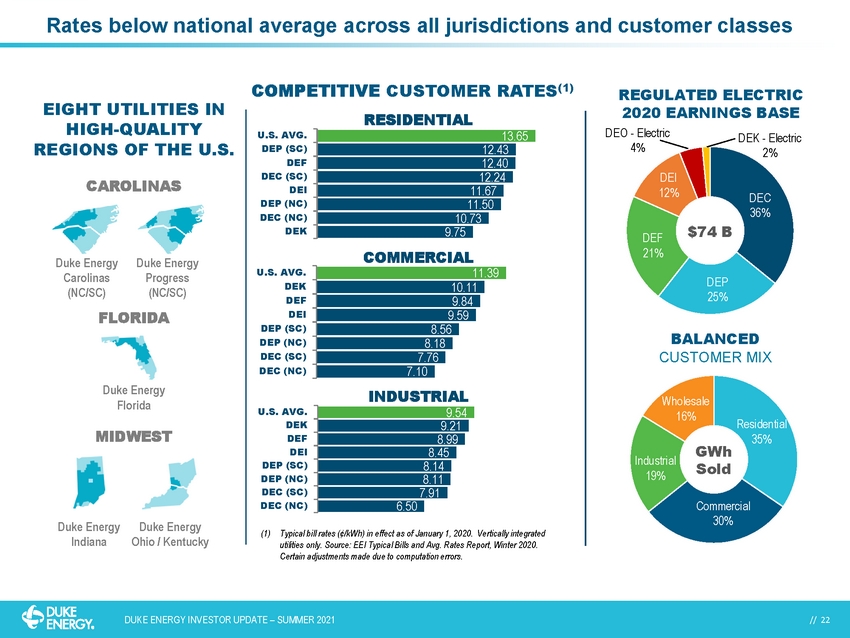
| // 22 // 22 DUKE ENERGY INVESTOR UPDATE – SUMMER 2021 Rates below national average across all jurisdictions and customer classes 6.50 7.91 8.11 8.14 8.45 8.99 9.21 9.54 DEC (NC) DEC (SC) DEP (NC) DEP (SC) DEI DEF DEK U.S. AVG. BALANCED CUSTOMER MIX GWh Sold Residential 35% Commercial 30% Industrial 19% Wholesale 16% EIGHT UTILITIES IN HIGH-QUALITY REGIONS OF THE U.S. CAROLINAS FLORIDA MIDWEST Duke Energy Carolinas (NC/SC) Duke Energy Progress (NC/SC) Duke Energy Florida Duke Energy Indiana Duke Energy Ohio / Kentucky REGULATED ELECTRIC 2020 EARNINGS BASE DEC 36% DEP 25% DEF 21% DEI 12% (1) Typical bill rates (¢/kWh) in effect as of January 1, 2020. Vertically integrated utilities only. Source: EEI Typical Bills and Avg. Rates Report, Winter 2020. Certain adjustments made due to computation errors. $74 B DEO - Electric 4% DEK - Electric 2% 9.75 10.73 11.50 11.67 12.24 12.40 12.43 13.65 DEK DEC (NC) DEP (NC) DEI DEC (SC) DEF DEP (SC) U.S. AVG. 7.10 7.76 8.18 8.56 9.59 9.84 10.11 11.39 DEC (NC) DEC (SC) DEP (NC) DEP (SC) DEI DEF DEK U.S. AVG. COMPETITIVE CUSTOMER RATES(1) RESIDENTIAL COMMERCIAL INDUSTRIAL |
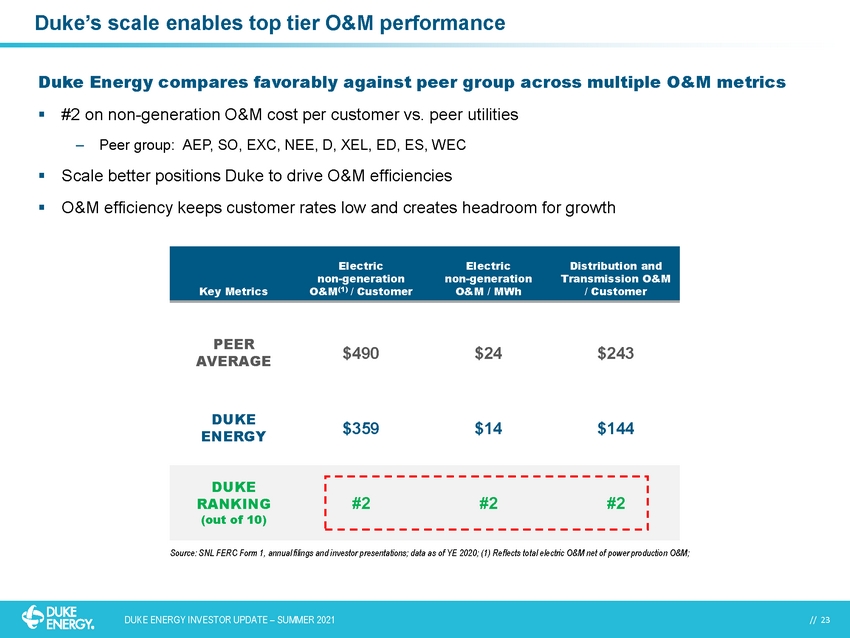
| // 23 // 23 DUKE ENERGY INVESTOR UPDATE – SUMMER 2021 Duke’s scale enables top tier O&M performance Duke Energy compares favorably against peer group across multiple O&M metrics ▪ #2 on non-generation O&M cost per customer vs. peer utilities – Peer group: AEP, SO, EXC, NEE, D, XEL, ED, ES, WEC ▪ Scale better positions Duke to drive O&M efficiencies ▪ O&M efficiency keeps customer rates low and creates headroom for growth Source: SNL FERC Form 1, annual filings and investor presentations; data as of YE 2020; (1) Reflects total electric O&M net of power production O&M; Key Metrics Electric non-generation O&M(1) / Customer Electric non-generation O&M / MWh Distribution and Transmission O&M / Customer PEER AVERAGE $490 $24 $243 DUKE ENERGY $359 $14 $143 DUKE RANKING (out of 10) #2 #2 #2 |
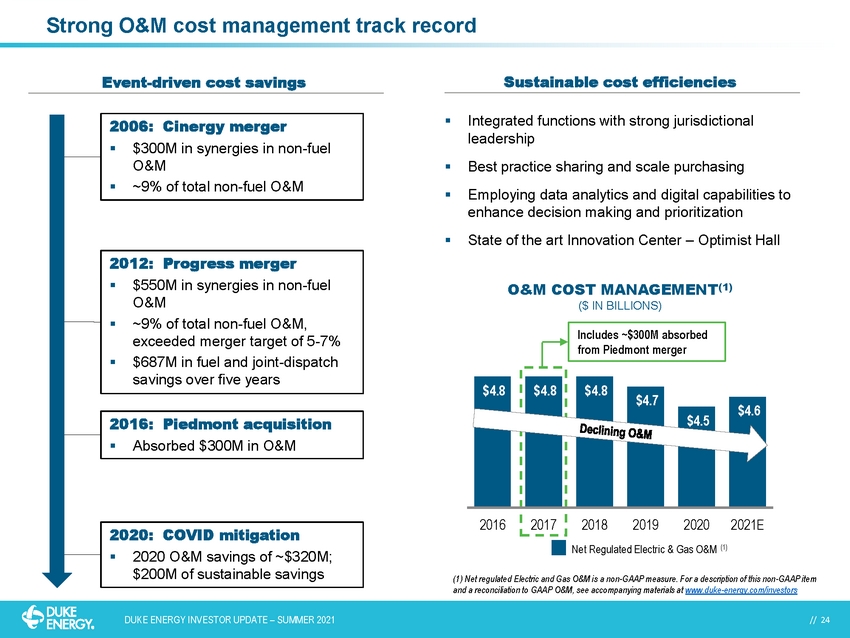
| // 24 // 24 DUKE ENERGY INVESTOR UPDATE – SUMMER 2021 $4.8 $4.8 $4.8 $4.7 $4.5 $4.6 2016 2017 2018 2019 2020 2021E Net Regulated Electric & Gas O&M (1) Strong O&M cost management track record Sustainable cost efficiencies Event-driven cost savings ▪ Integrated functions with strong jurisdictional leadership ▪ Best practice sharing and scale purchasing ▪ Employing data analytics and digital capabilities to enhance decision making and prioritization ▪ State of the art Innovation Center – Optimist Hall O&M COST MANAGEMENT(1) ($ IN BILLIONS) (1) Net regulated Electric and Gas O&M is a non-GAAP measure. For a description of this non-GAAP item and a reconciliation to GAAP O&M, see accompanying materials at www.duke-energy.com/investors Includes ~$300M absorbed from Piedmont merger 2006: Cinergy merger ▪ $300M in synergies in non-fuel O&M ▪ ~9% of total non-fuel O&M 2012: Progress merger ▪ $550M in synergies in non-fuel O&M ▪ ~9% of total non-fuel O&M, exceeded merger target of 5-7% ▪ $687M in fuel and joint-dispatch savings over five years 2016: Piedmont acquisition ▪ Absorbed $300M in O&M 2020: COVID mitigation ▪ 2020 O&M savings of ~$320M; $200M of sustainable savings |
| // 25 // 25 DUKE ENERGY INVESTOR UPDATE – SUMMER 2021 Long-standing history of strong governance driven from diverse Board of Directors Key Stats 38% Racial, Gender and Ethnic Diversity 4.7 Years Average Tenure Key Skills & Experience Risk Management 12 Regulatory / Government 10 Customer Service 9 Environmental 9 Industry 9 Cybersecurity / Technology 8 Human Capital Management 5 Legal 2 Lynn J. Good Chair, President & CEO, Duke Energy Director since: 2013 Michael G. Browning Independent Lead Director Principal, Browning Consolidated Director Since: 2006 Theodore F. Craver Jr. Retired Chairman, President, & CEO, Edison International Director since: 2017 Robert M. Davis President, Merck & Co. Director since: 2018 Caroline Dorsa Retired Executive Vice President & CFO, PSEG Director since: 2021 Nicholas C. Fanandakis Retired EVP, DuPont de Nemours Director since: 2019 John T. Herron Retired President, CEO & Chief Nuclear Officer, Entergy Nuclear Director since: 2013 E. Marie McKee Retired SVP, Corning Director since: 2012 Michael J. Pacilio Retired Executive Vice President & COO, Exelon Generation Director since: 2021 Thomas E. Skains Retired Chairman, President & CEO, Piedmont Natural Gas Director since: 2016 William E. Webster Retired EVP, Institute of Nuclear Power Operations Director since: 2016 W. Roy Dunbar Retired Chairman and CEO, Network Solutions Director since: 2021 FOCUSED ON BOARD COMPOSITION TO OVERSEE THE COMPANY’S LONG-TERM STRATEGY ▪ 9 out of 13 directors were first appointed in the last five years ▪ 12 out of 13 directors are independent (all directors except Chair, President and CEO) ▪ 5 out of 13 directors are female or identify as a part of a minority group Annette K. Clayton President & CEO, North America Operations, Schneider Electric Director since: 2019 |

| // 26 Appendix |

| // 27 Q1 2021 and 2021 guidance support |
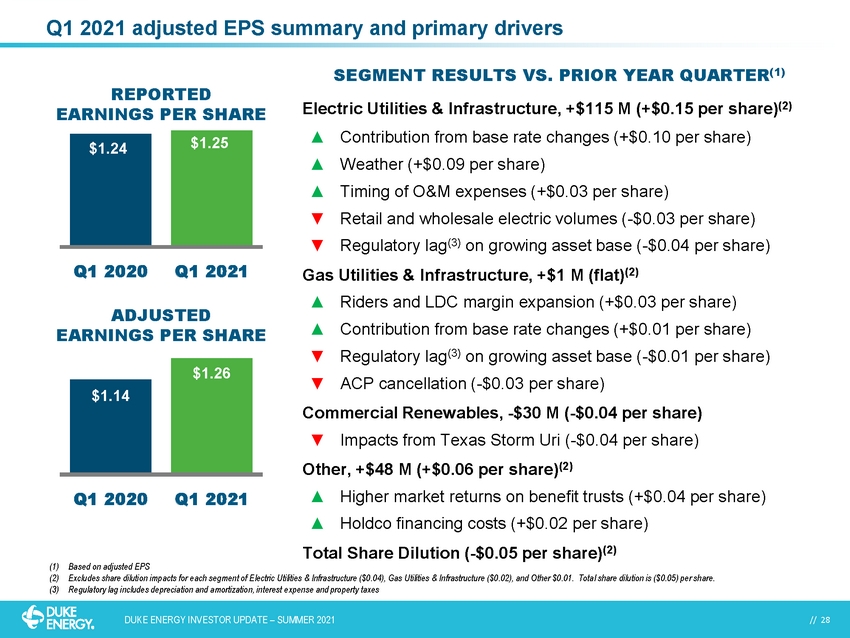
| // 28 // 28 DUKE ENERGY INVESTOR UPDATE – SUMMER 2021 Q1 2021 adjusted EPS summary and primary drivers $5.12 $0.47 (1) Based on adjusted EPS (2) Excludes share dilution impacts for each segment of Electric Utilities & Infrastructure ($0.04), Gas Utilities & Infrastructure ($0.02), and Other $0.01. Total share dilution is ($0.05) per share. (3) Regulatory lag includes depreciation and amortization, interest expense and property taxes ($0.13) SEGMENT RESULTS VS. PRIOR YEAR QUARTER(1) $0.47 $5.12 $0.45 ($0.45) $1.24 $1.25 Q1 2020 Q1 2021 $1.14 $1.26 Q1 2020 Q1 2021 ADJUSTED EARNINGS PER SHARE REPORTED EARNINGS PER SHARE Electric Utilities & Infrastructure, +$115 M (+$0.15 per share)(2) ▲ Contribution from base rate changes (+$0.10 per share) ▲ Weather (+$0.09 per share) ▲ Timing of O&M expenses (+$0.03 per share) ▼ Retail and wholesale electric volumes (-$0.03 per share) ▼ Regulatory lag(3) on growing asset base (-$0.04 per share) Gas Utilities & Infrastructure, +$1 M (flat)(2) ▲ Riders and LDC margin expansion (+$0.03 per share) ▲ Contribution from base rate changes (+$0.01 per share) ▼ Regulatory lag(3) on growing asset base (-$0.01 per share) ▼ ACP cancellation (-$0.03 per share) Commercial Renewables, -$30 M (-$0.04 per share) ▼ Impacts from Texas Storm Uri (-$0.04 per share) Other, +$48 M (+$0.06 per share)(2) ▲ Higher market returns on benefit trusts (+$0.04 per share) ▲ Holdco financing costs (+$0.02 per share) Total Share Dilution (-$0.05 per share)(2) |
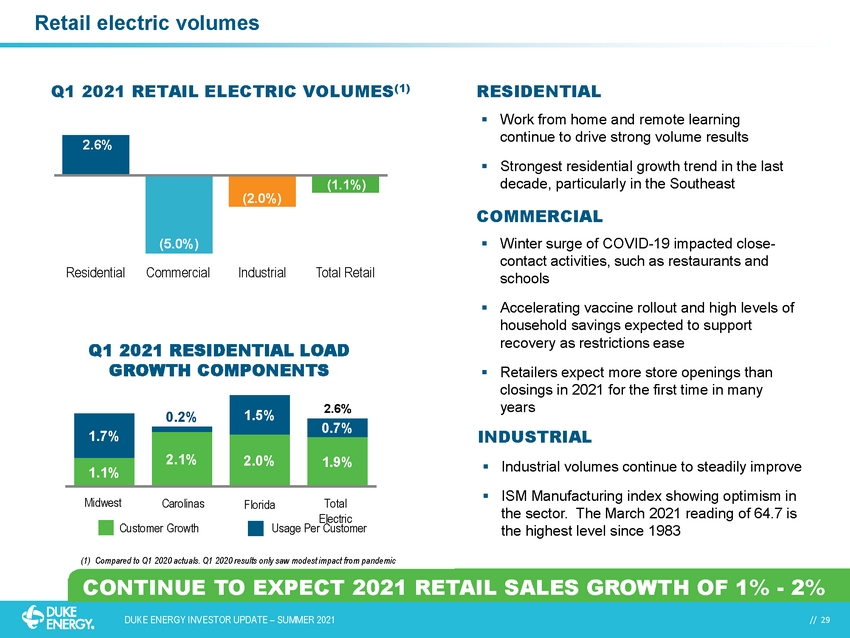
| // 29 // 29 DUKE ENERGY INVESTOR UPDATE – SUMMER 2021 Retail electric volumes RESIDENTIAL (1) Compared to Q1 2020 actuals. Q1 2020 results only saw modest impact from pandemic 1.1% 2.1% 2.0% 1.9% 1.7% 0.2% 1.5% 0.7% Midwest Carolinas Florida Total Electric Q1 2021 RESIDENTIAL LOAD GROWTH COMPONENTS Residential Commercial Industrial Total Retail Q1 2021 RETAIL ELECTRIC VOLUMES(1) 2.6% (5.0%) (2.0%) (1.1%) CONTINUE TO EXPECT 2021 RETAIL SALES GROWTH OF 1% - 2% ▪ Work from home and remote learning continue to drive strong volume results ▪ Strongest residential growth trend in the last decade, particularly in the Southeast COMMERCIAL ▪ Winter surge of COVID-19 impacted close- contact activities, such as restaurants and schools ▪ Accelerating vaccine rollout and high levels of household savings expected to support recovery as restrictions ease ▪ Retailers expect more store openings than closings in 2021 for the first time in many years INDUSTRIAL ▪ Industrial volumes continue to steadily improve ▪ ISM Manufacturing index showing optimism in the sector. The March 2021 reading of 64.7 is the highest level since 1983 Customer Growth Usage Per Customer 2.6% |
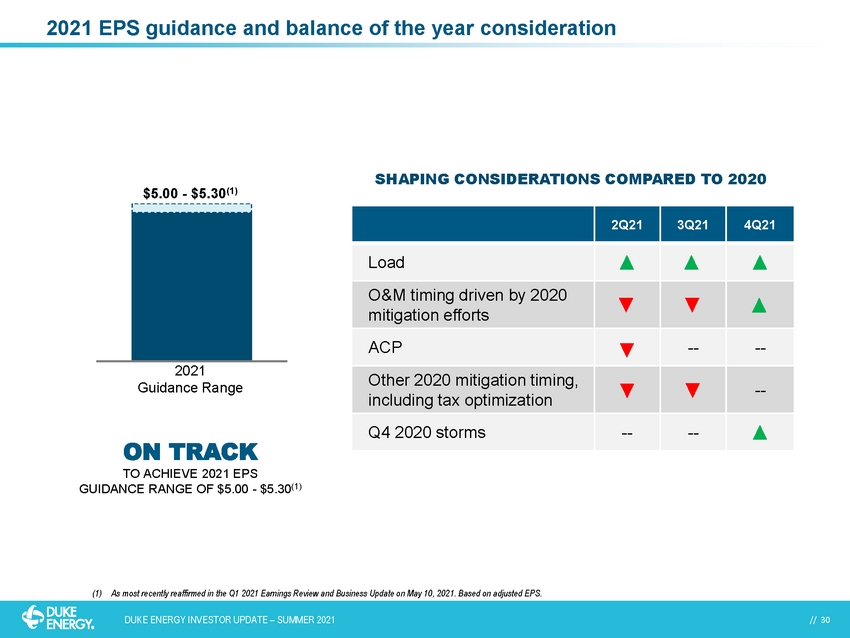
| // 30 // 30 DUKE ENERGY INVESTOR UPDATE – SUMMER 2021 2021 EPS guidance and balance of the year consideration $5.00 - $5.30(1) 2021 Guidance Range 2Q21 3Q21 4Q21 Load O&M timing driven by 2020 mitigation efforts ACP -- -- Other 2020 mitigation timing, including tax optimization -- Q4 2020 storms -- -- SHAPING CONSIDERATIONS COMPARED TO 2020 ON TRACK TO ACHIEVE 2021 EPS GUIDANCE RANGE OF $5.00 - $5.30(1) (1) As most recently reaffirmed in the Q1 2021 Earnings Review and Business Update on May 10, 2021. Based on adjusted EPS. |
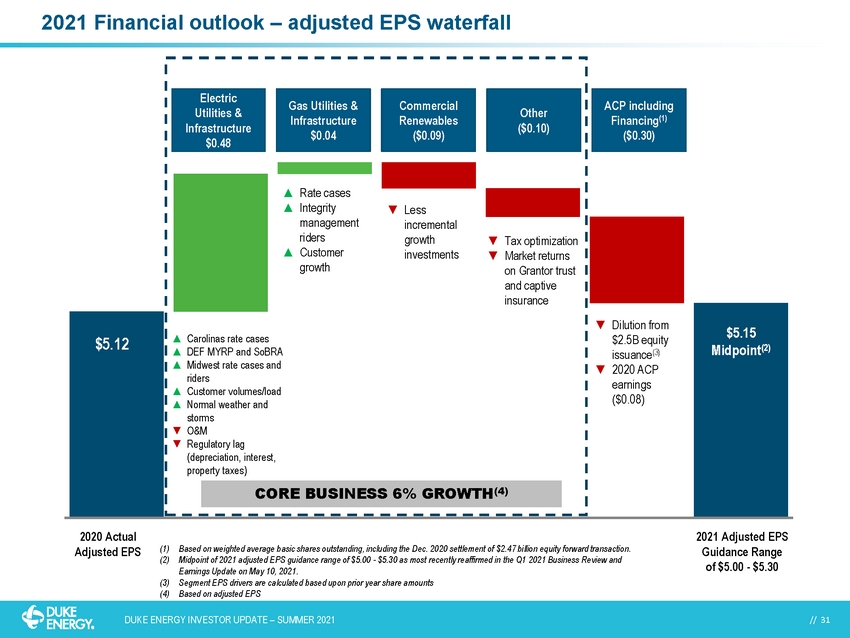
| // 31 // 31 DUKE ENERGY INVESTOR UPDATE – SUMMER 2021 2021 Financial outlook – adjusted EPS waterfall ▲ Rate cases ▲ Integrity management riders ▲ Customer growth $5.12 ▼ Tax optimization ▼ Market returns on Grantor trust and captive insurance ▼ Less incremental growth investments ▼ Dilution from $2.5B equity issuance(3) ▼ 2020 ACP earnings ($0.08) Gas Utilities & Infrastructure $0.04 Electric Utilities & Infrastructure $0.48 ACP including Financing(1) ($0.30) Other ($0.10) 2020 Actual Adjusted EPS 2021 Adjusted EPS Guidance Range of $5.00 - $5.30 $5.15 Midpoint(2) ▲ Carolinas rate cases ▲ DEF MYRP and SoBRA ▲ Midwest rate cases and riders ▲ Customer volumes/load ▲ Normal weather and storms ▼ O&M ▼ Regulatory lag (depreciation, interest, property taxes) (1) Based on weighted average basic shares outstanding, including the Dec. 2020 settlement of $2.47 billion equity forward transaction. (2) Midpoint of 2021 adjusted EPS guidance range of $5.00 - $5.30 as most recently reaffirmed in the Q1 2021 Business Review and Earnings Update on May 10, 2021. (3) Segment EPS drivers are calculated based upon prior year share amounts (4) Based on adjusted EPS Commercial Renewables ($0.09) CORE BUSINESS 6% GROWTH(4) |
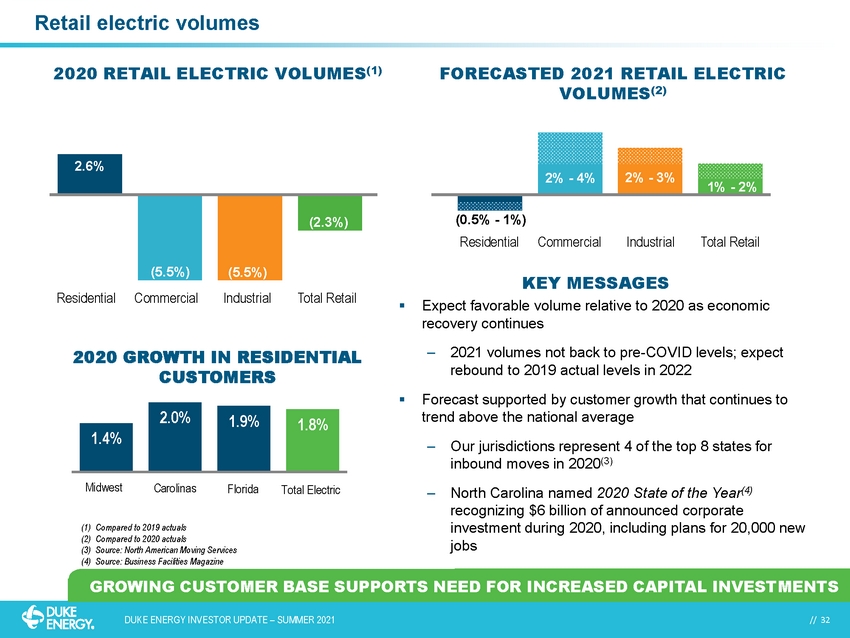
| // 32 // 32 DUKE ENERGY INVESTOR UPDATE – SUMMER 2021 Retail electric volumes ▪ Expect favorable volume relative to 2020 as economic recovery continues ‒ 2021 volumes not back to pre-COVID levels; expect rebound to 2019 actual levels in 2022 ▪ Forecast supported by customer growth that continues to trend above the national average ‒ Our jurisdictions represent 4 of the top 8 states for inbound moves in 2020(3) ‒ North Carolina named 2020 State of the Year(4) recognizing $6 billion of announced corporate investment during 2020, including plans for 20,000 new jobs KEY MESSAGES (1) Compared to 2019 actuals (2) Compared to 2020 actuals (3) Source: North American Moving Services (4) Source: Business Facilities Magazine 1.4% 2.0% 1.9% 1.8% Midwest Carolinas Florida Total Electric 2020 GROWTH IN RESIDENTIAL CUSTOMERS Residential Commercial Industrial Total Retail 2020 RETAIL ELECTRIC VOLUMES(1) 2.6% (5.5%) (5.5%) (2.3%) FORECASTED 2021 RETAIL ELECTRIC VOLUMES(2) (0.5% - 1%) 2% - 4% 1% - 2% 2% - 3% Residential Commercial Industrial Total Retail GROWING CUSTOMER BASE SUPPORTS NEED FOR INCREASED CAPITAL INVESTMENTS |
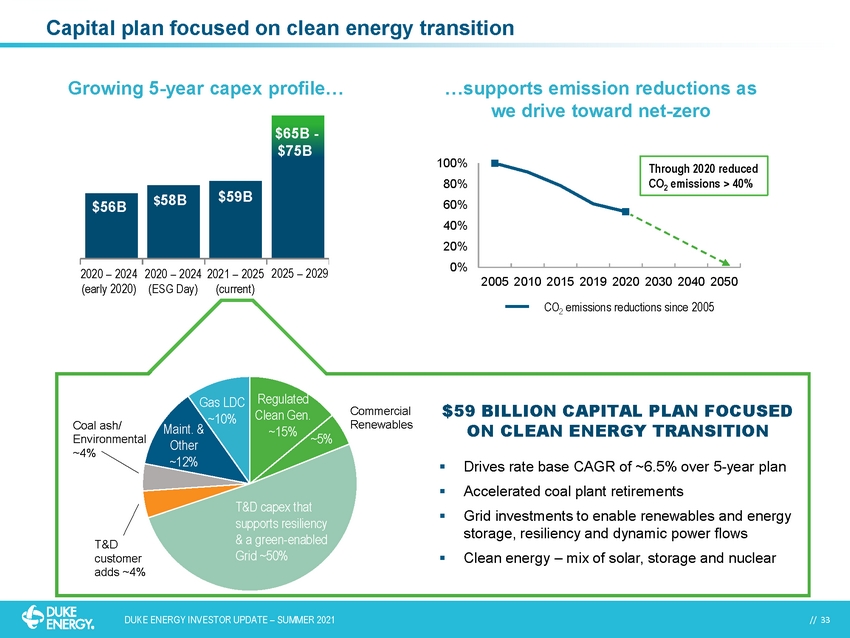
| // 33 // 33 DUKE ENERGY INVESTOR UPDATE – SUMMER 2021 Capital plan focused on clean energy transition LDC Gas 10% ~5% LDC ~10% Growing 5-year capex profile… 2021 – 2025 (current) $58B 2025 – 2029 $65B - $75B $56B 2020 – 2024 (ESG Day) 2020 – 2024 (early 2020) $59B …supports emission reductions as we drive toward net-zero 0% 20% 40% 60% 80% 100% 2005 2010 2015 2019 2020 2030 2040 2050 Through 2020 reduced CO2 emissions > 40% CO2 emissions reductions since 2005 ~5% ▪ Drives rate base CAGR of ~6.5% over 5-year plan ▪ Accelerated coal plant retirements ▪ Grid investments to enable renewables and energy storage, resiliency and dynamic power flows ▪ Clean energy – mix of solar, storage and nuclear $59 BILLION CAPITAL PLAN FOCUSED ON CLEAN ENERGY TRANSITION Commercial Renewables T&D capex that supports resiliency & a green-enabled Grid ~50% Regulated Clean Gen. ~15% Gas LDC ~10% Coal ash/ Environmental ~4% Maint. & Other ~12% T&D customer adds ~4% ~5% |
| // 34 Other Supplemental Information |
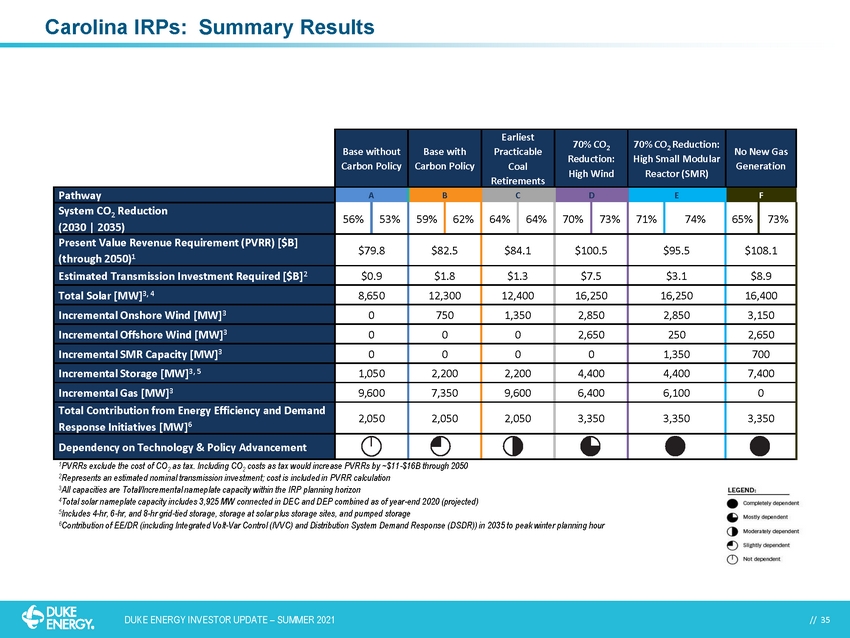
| // 35 // 35 DUKE ENERGY INVESTOR UPDATE – SUMMER 2021 Carolina IRPs: Summary Results Base without Carbon Policy Base with Carbon Policy Earliest Practicable Coal Retirements 70% CO2 Reduction: High Wind 70% CO2 Reduction: High Small Modular Reactor (SMR) No New Gas Generation Pathway ABCDEF System CO2 Reduction (2030 | 2035) 56% 53% 59% 62% 64% 64% 70% 73% 71% 74% 65% 73% Present Value Revenue Requirement (PVRR) [$B] (through 2050)1 $79.8 $82.5 $84.1 $100.5 $95.5 $108.1 Estimated Transmission Investment Required [$B]2 $0.9 $1.8 $1.3 $7.5 $3.1 $8.9 Total Solar [MW]3, 4 8,650 12,300 12,400 16,250 16,250 16,400 Incremental Onshore Wind [MW]3 0 750 1,350 2,850 2,850 3,150 Incremental Offshore Wind [MW]3 0 0 0 2,650 250 2,650 Incremental SMR Capacity [MW]3 0 0 0 0 1,350 700 Incremental Storage [MW]3, 5 1,050 2,200 2,200 4,400 4,400 7,400 Incremental Gas [MW]3 9,600 7,350 9,600 6,400 6,100 0 Total Contribution from Energy Efficiency and Demand Response Initiatives [MW]6 2,050 2,050 2,050 3,350 3,350 3,350 Dependency on Technology & Policy Advancement 1PVRRs exclude the cost of CO2 as tax. Including CO2 costs as tax would increase PVRRs by ~$11-$16B through 2050 2Represents an estimated nominal transmission investment; cost is included in PVRR calculation 3All capacities are Total/Incremental nameplate capacity within the IRP planning horizon 4Total solar nameplate capacity includes 3,925 MW connected in DEC and DEP combined as of year-end 2020 (projected) 5Includes 4-hr, 6-hr, and 8-hr grid-tied storage, storage at solar plus storage sites, and pumped storage 6Contribution of EE/DR (including Integrated Volt-Var Control (IVVC) and Distribution System Demand Response (DSDR)) in 2035 to peak winter planning hour |
| // 36 // 36 DUKE ENERGY INVESTOR UPDATE – SUMMER 2021 ▪ The 2020 IRP includes a most economic or “least-cost” portfolio, as required by North Carolina Utilities Commission (NCUC) Rule R8-60 and subsequent orders, and the Public Service Commission of South Carolina (PSCSC) and The Energy Freedom Act (Act 62), as well as multiple portfolios reflecting a range of potential future resource portfolios ▪ North Carolina requirements – 2 base cases: least cost resources (with and without price on carbon). Additional carbon and coal retirement analyses required for 2020 IRPs – NCUC will not “approve” the IRPs; rather, after a formal docket review with intervenors, the NCUC will “accept” the IRPs as reasonable for planning purposes (or reject some aspects of the IRP or make recommendations for future IRPs) – New generation resources will need to go through specific CPCN approval processes prior to construction and must demonstrate consistency with the most recent IRP ▪ South Carolina requirements – First IRP filed under Act 62; which contemplates several resource portfolios developed with the purpose of fairly evaluating the range of demand-side, supply-side, storage, and other technologies and services available to meet the utility's service obligations; PSCSC will approve or deny or modify; testimony and evidentiary hearings – Regulatory condition requires utility to utilize least cost planning – New resources will go through new Act 62 processes and statutory requirements for cost recovery, which do note a competitive procurement process. Carolinas IRPs: Commission rules and review process |
| // 37 // 37 DUKE ENERGY INVESTOR UPDATE – SUMMER 2021 Regulatory update CONTINUED EXECUTION OF REGULATORY STRATEGY NC RATE CASE ORDERS – DEC AND DEP ▪ Approved Partial Stipulations: − ROE of 9.6%; 52% equity component of cap structure − Deferral treatment of grid improvement plan projects of $1.2 billion including return − Unprotected EDIT flowback period of 5 years ▪ Approved Coal Ash Settlement − Resolves coal ash issues in 2017 and 2019 rate cases − Allows return at 150 basis points lower than prevailing ROE − Accelerates customer savings during pandemic ▪ Issued opinion that IRP docket more appropriate venue for generation retirements DUKE ENERGY FLORIDA SETTLEMENT ▪ FPSC approved the Settlement on May 4 ▪ Clarity through 2024 ▪ ROE band of 8.85% to 10.85%, with innovative trigger mechanism that insulates against rising interest rates ▪ Clean Energy Connection solar buildout: 750 MW to be built 2022- 2024 ($1 billion investment) ▪ EV Charging Station program ($54 million investment) ▪ Accelerated depreciation for coal plants (from 2042 to 2034) ▪ Vision Florida program funds $100 million in emerging technologies LDC RATE CASES FILINGS PIEDMONT-NC/DEK PNG-NC RATE CASE FILING ▪ Filed on March 22, 2021 ▪ Revenue increase request of $109 million − ROE request of 10.25% and 52% equity component − Proposed rate base of $4.8 billion ▪ Includes investments for: − $250 million Robeson LNG facility − System growth, pipeline integrity management, infrastructure and safety and security upgrades ▪ Rates requested to be in effect if approved by the end of 2021 DEK RATE CASE FILING ▪ Rate case filed June 1, 2021 ▪ Expect rates to be in effect January 2022 |
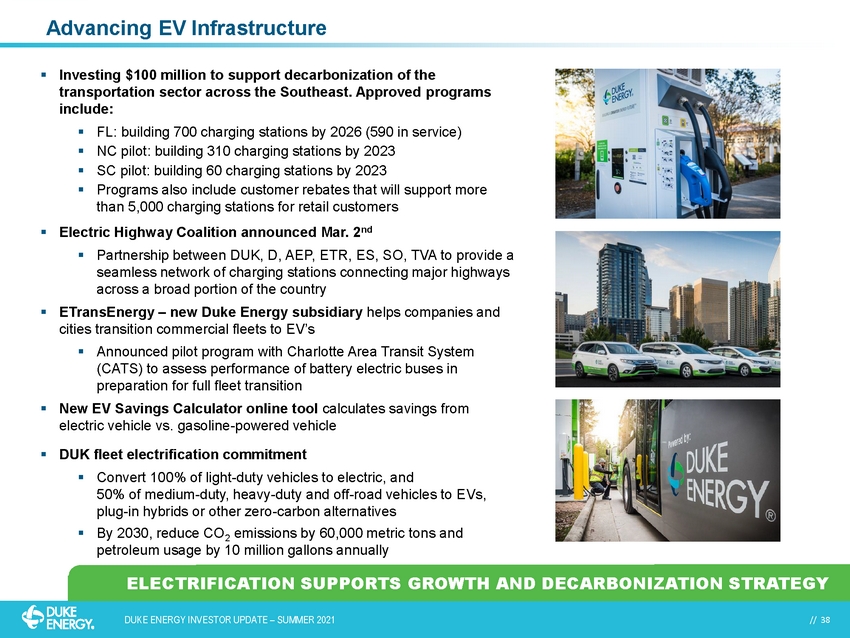
| // 38 // 38 DUKE ENERGY INVESTOR UPDATE – SUMMER 2021 Advancing EV Infrastructure ELECTRIFICATION SUPPORTS GROWTH AND DECARBONIZATION STRATEGY ▪ Investing $100 million to support decarbonization of the transportation sector across the Southeast. Approved programs include: ▪ FL: building 700 charging stations by 2026 (590 in service) ▪ NC pilot: building 310 charging stations by 2023 ▪ SC pilot: building 60 charging stations by 2023 ▪ Programs also include customer rebates that will support more than 5,000 charging stations for retail customers ▪ Electric Highway Coalition announced Mar. 2nd ▪ Partnership between DUK, D, AEP, ETR, ES, SO, TVA to provide a seamless network of charging stations connecting major highways across a broad portion of the country ▪ ETransEnergy – new Duke Energy subsidiary helps companies and cities transition commercial fleets to EV’s ▪ Announced pilot program with Charlotte Area Transit System (CATS) to assess performance of battery electric buses in preparation for full fleet transition ▪ New EV Savings Calculator online tool calculates savings from electric vehicle vs. gasoline-powered vehicle ▪ DUK fleet electrification commitment ▪ Convert 100% of light-duty vehicles to electric, and 50% of medium-duty, heavy-duty and off-road vehicles to EVs, plug-in hybrids or other zero-carbon alternatives ▪ By 2030, reduce CO2 emissions by 60,000 metric tons and petroleum usage by 10 million gallons annually |
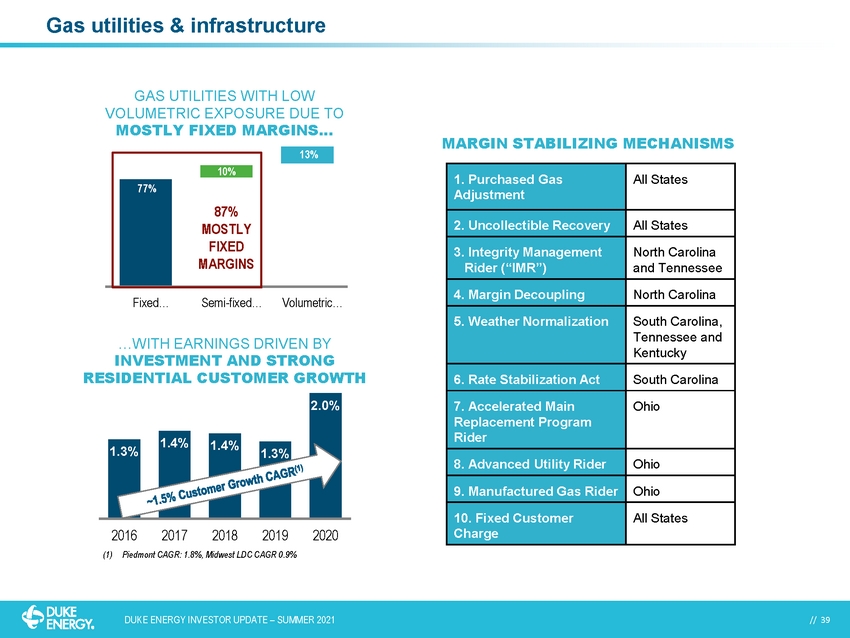
| // 39 // 39 DUKE ENERGY INVESTOR UPDATE – SUMMER 2021 Gas utilities & infrastructure (1) Piedmont CAGR: 1.8%, Midwest LDC CAGR 0.9% Fixed… Semi-fixed… Volumetric… GAS UTILITIES WITH LOW VOLUMETRIC EXPOSURE DUE TO MOSTLY FIXED MARGINS… 77% 10% 13% 87% MOSTLY FIXED MARGINS 1.3% 1.4% 1.4% 1.3% 2.0% 2016 2017 2018 2019 2020 …WITH EARNINGS DRIVEN BY INVESTMENT AND STRONG RESIDENTIAL CUSTOMER GROWTH MARGIN STABILIZING MECHANISMS 1. Purchased Gas Adjustment All States 2. Uncollectible Recovery All States 3. Integrity Management Rider (“IMR”) North Carolina and Tennessee 4. Margin Decoupling North Carolina 5. Weather Normalization South Carolina, Tennessee and Kentucky 6. Rate Stabilization Act South Carolina 7. Accelerated Main Replacement Program Rider Ohio 8. Advanced Utility Rider Ohio 9. Manufactured Gas Rider Ohio 10. Fixed Customer Charge All States |
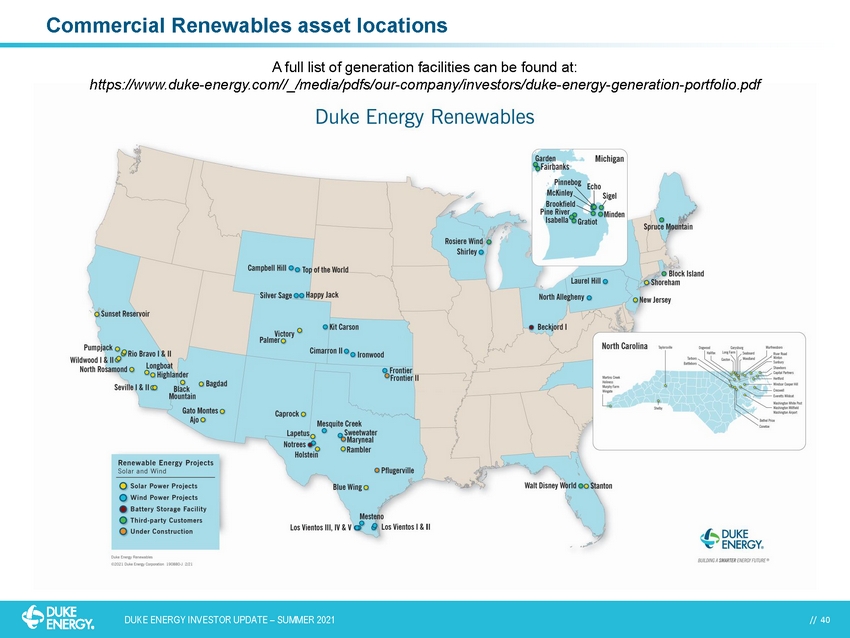
| // 40 // 40 DUKE ENERGY INVESTOR UPDATE – SUMMER 2021 Commercial Renewables asset locations A full list of generation facilities can be found at: https://www.duke-energy.com//_/media/pdfs/our-company/investors/duke-energy-generation-portfolio.pdf |
| // 41 Upcoming Events & Other |

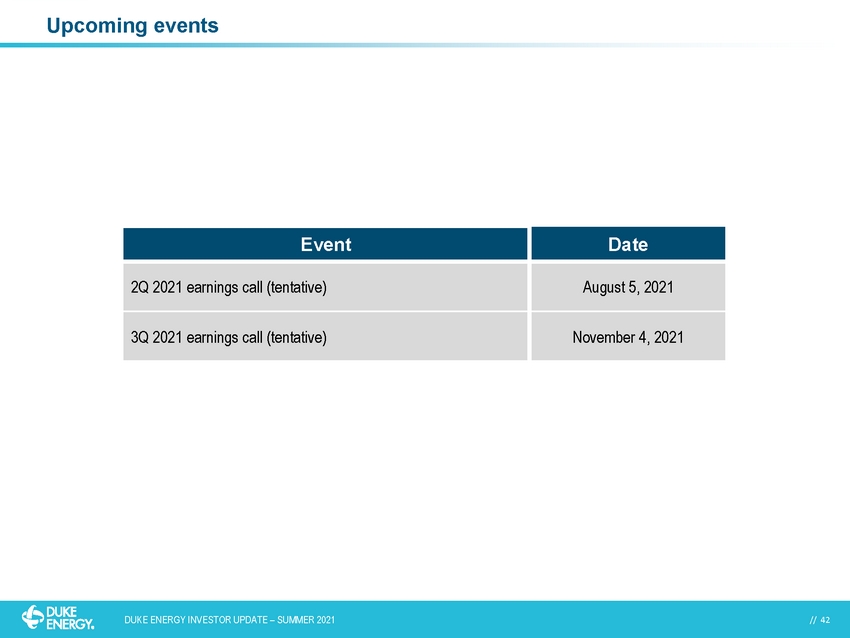
| // 42 // 42 DUKE ENERGY INVESTOR UPDATE – SUMMER 2021 Upcoming events Event Date 2Q 2021 earnings call (tentative) August 5, 2021 3Q 2021 earnings call (tentative) November 4, 2021 |
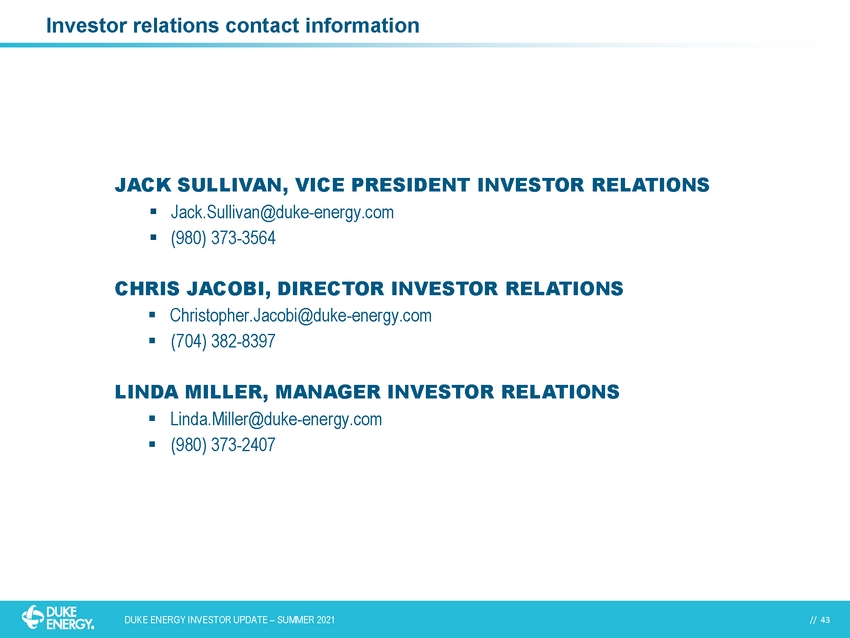
| // 43 // 43 DUKE ENERGY INVESTOR UPDATE – SUMMER 2021 Investor relations contact information JACK SULLIVAN, VICE PRESIDENT INVESTOR RELATIONS ▪ Jack.Sullivan@duke-energy.com ▪ (980) 373-3564 CHRIS JACOBI, DIRECTOR INVESTOR RELATIONS ▪ Christopher.Jacobi@duke-energy.com ▪ (704) 382-8397 LINDA MILLER, MANAGER INVESTOR RELATIONS ▪ Linda.Miller@duke-energy.com ▪ (980) 373-2407 |
| // 44 // 44 DUKE ENERGY INVESTOR UPDATE – SUMMER 2021 For additional information on Duke Energy, please visit: duke-energy.com/investors |
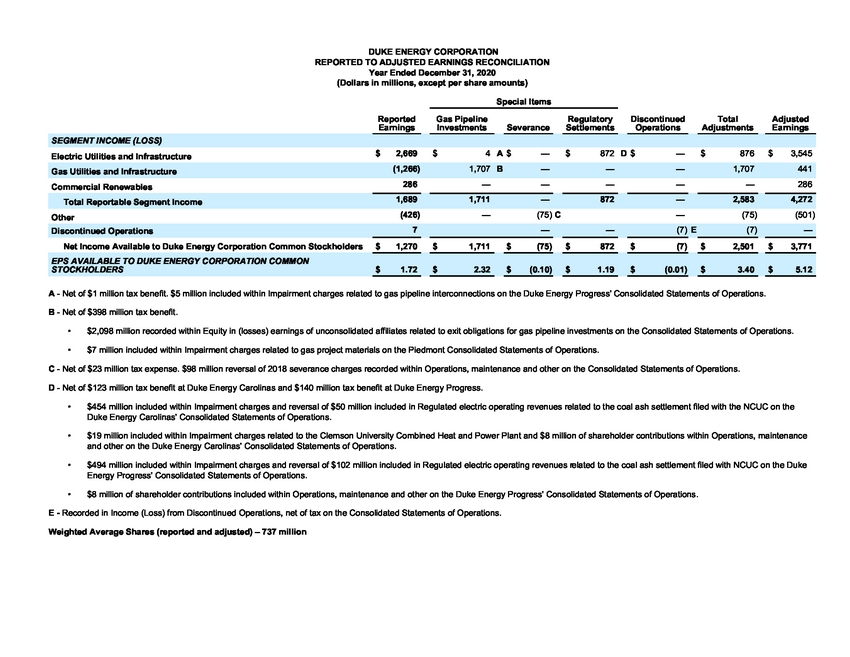
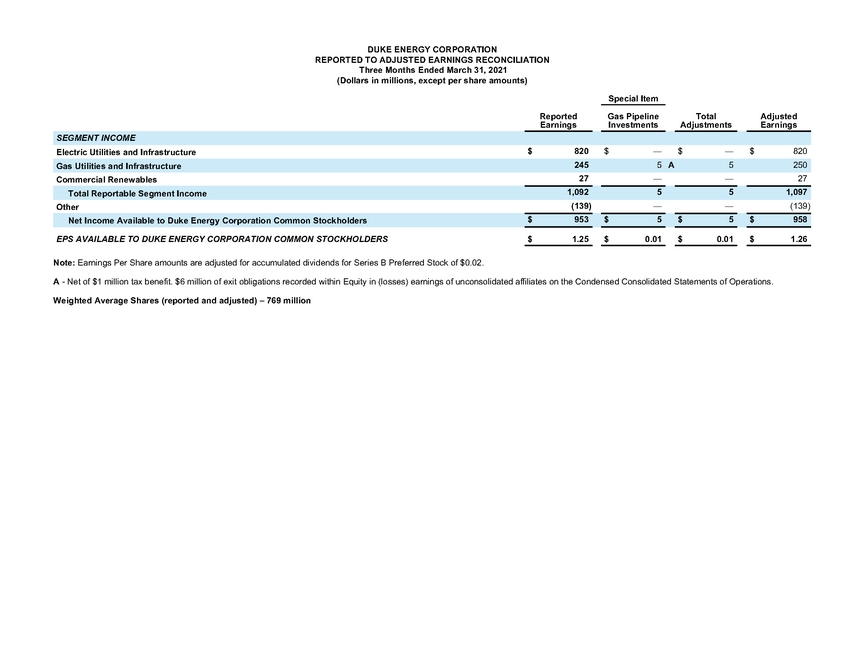
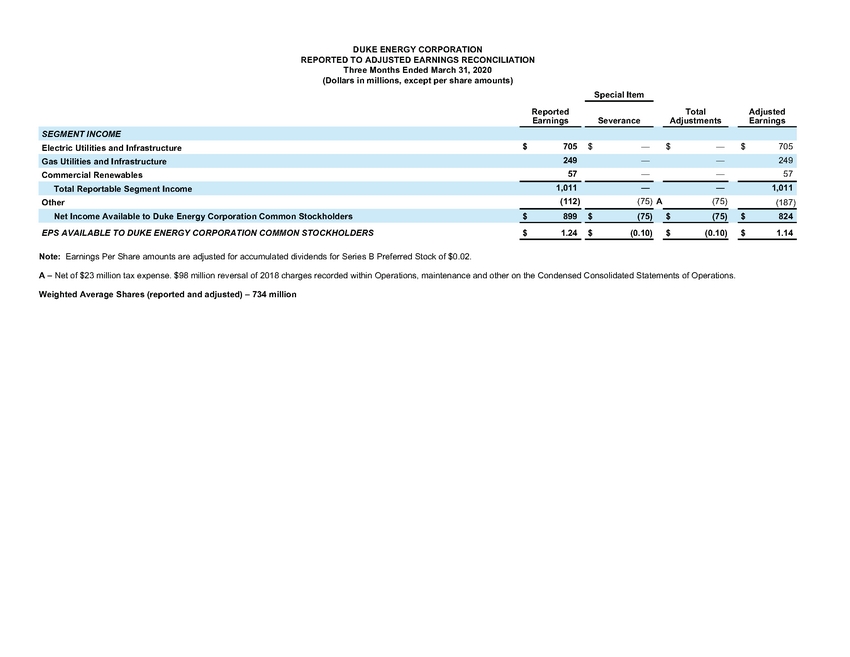
| Duke Energy Corporation Non-GAAP Reconciliations Duke Energy Investor Update June 2021 Adjusted Earnings per Share (EPS) The materials for Duke Energy Corporation’s (Duke Energy) Investor Update in June 2021 include a discussion of adjusted EPS for the quarter-to-date periods ended March 31, 2021 and 2020 and the year-to- date period ended December 31, 2020. The non-GAAP financial measure, adjusted EPS, represents basic EPS available to Duke Energy Corporation common stockholders (GAAP reported EPS), adjusted for the per share impact of special items. As discussed below, special items represent certain charges and credits, which management believes are not indicative of Duke Energy’s ongoing performance. Management believes the presentation of adjusted EPS provides useful information to investors, as it provides them with an additional relevant comparison of Duke Energy’s performance across periods. Management uses this non-GAAP financial measure for planning and forecasting and for reporting financial results to the Duke Energy Board of Directors, employees, stockholders, analysts and investors. Adjusted EPS is also used as a basis for employee incentive bonuses. The most directly comparable GAAP measure for adjusted EPS is reported basic EPS available to Duke Energy Corporation common stockholders. A reconciliation of adjusted EPS for the quarter-to-date periods ended March 31, 2021 and 2020 and the year-to-date period ended December 31, 2020, to the most directly comparable GAAP measure is included herein. Special items included in the periods presented include the following items, which management believes do not reflect ongoing costs: Gas Pipeline Investments represents costs related to the cancellation of the ACP pipeline and additional exit costs related to Constitution. Regulatory Settlements represents charges related to Duke Energy Carolinas and Duke Energy Progress coal ash settlement and the partial settlements in the 2019 North Carolina rate cases. Severance represents the reversal of 2018 costs, which were deferred as a result of a partial settlement in the Duke Energy Carolinas and the Duke Energy Progress 2019 North Carolina rate cases. Adjusted EPS Guidance The materials for Duke Energy’s Investor Update in June 2021 include a reference to forecasted 2021 adjusted EPS guidance range of $5.00 to $5.30 per share and the midpoint of forecasted 2021 adjusted EPS guidance range of $5.15. The materials also reference the long-term range of annual growth of 5% - 7% through 2025 off the midpoint of 2021 adjusted EPS guidance range of $5.15. In addition, the materials reference the expected five-year EPS growth in the Gas Utilities and Infrastructure segment of 8-10% (on a compound annual growth rate (CAGR) basis) and the five-year expected EPS growth in the Electric Utilities and Infrastructure segment of 5-7% (on a CAGR basis). The forecasted adjusted EPS is a non-GAAP financial measure as it represents basic EPS available to Duke Energy Corporation common stockholders (GAAP reported EPS), adjusted for the per share impact of special items (as discussed above under Adjusted EPS). |
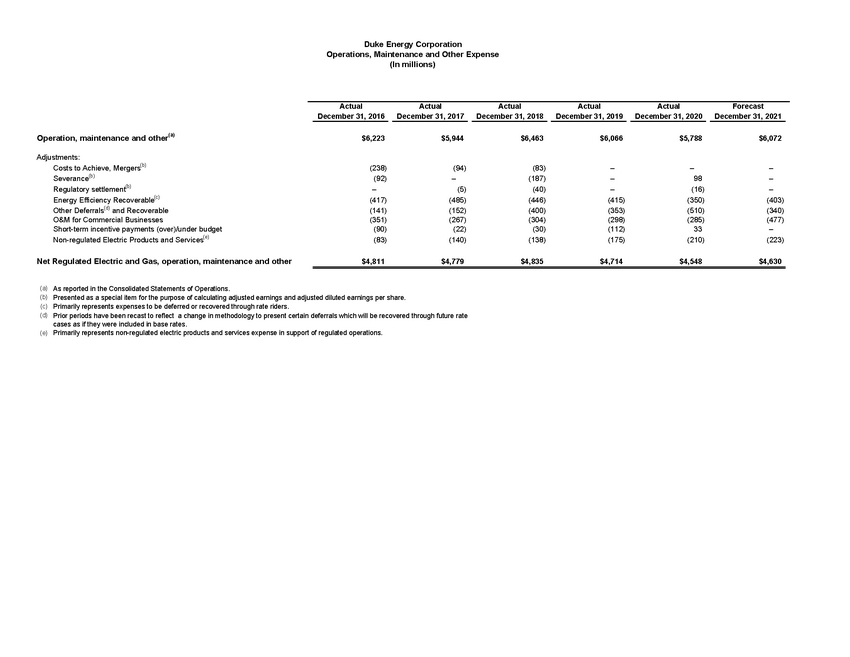
| Due to the forward-looking nature of this non-GAAP financial measure for future periods, information to reconcile it to the most directly comparable GAAP financial measure is not available at this time, as management is unable to project all special items for future periods, such as legal settlements, the impact of regulatory orders or asset impairments. Adjusted Segment Income (Loss) and Adjusted Other Net Loss The materials for Duke Energy’s Investor Update in June 2021 include a discussion of the change in adjusted segment income (loss) and adjusted other net loss for the quarter ended March 31, 2021 compared to the quarter ended March 31, 2020, and a discussion of 2021 forecasted adjusted segment income and forecasted adjusted other net loss. Adjusted segment income (loss) and adjusted other net loss are non-GAAP financial measures, as they represent reported segment income (loss) and other net loss adjusted for special items (as discussed above under Adjusted EPS). Management believes the presentation of adjusted segment income (loss) and adjusted other net expense provides useful information to investors, as it provides an additional relevant comparison of a segment’s or Other’s performance across periods. When a per share impact is provided for a segment income (loss) driver, the after-tax driver is derived using the pretax amount of the item less income taxes based on the segment statutory tax rate of 24% for Electric Utilities and Infrastructure, 23% for Gas Utilities and Infrastructure and Other, or an effective tax rate for Commercial Renewables. The after-tax earnings drivers are divided by the Duke Energy weighted average shares outstanding for the period. The most directly comparable GAAP measures for adjusted segment income (loss) and adjusted other net loss are reported segment income (loss) and other net loss, which represents segment income (loss) and other net loss from continuing operations, including any special items. Reconciliations of adjusted segment income (loss) and adjusted other net loss for the quarters ended March 31, 2021 and March 31, 2020, to the most directly comparable GAAP measures is included herein. Due to the forward-looking nature of any forecasted adjusted segment income (loss) and forecasted other net loss and any related growth rates for future periods, information to reconcile these non-GAAP financial measures to the most directly comparable GAAP financial measures are not available at this time, as the company is unable to forecast all special items, as discussed above under Adjusted EPS guidance. Funds From Operations (“FFO”) Ratio The materials for Duke Energy’s Investor Update in June 2021 include a reference to the expected FFO to Total Debt ratio. This ratio is a non-GAAP financial measure. The numerator of the FFO to Total Debt ratio is calculated principally by using net cash provided by operating activities on a GAAP basis, adjusted for changes in working capital, ARO spend, depreciation and amortization of operating leases and reduced for capitalized interest (including any AFUDC interest). The denominator for the FFO to Total Debt ratio is calculated principally by using the balance of long-term debt (excluding purchase accounting adjustments and long-term debt associated with the CR3 Securitization), including current maturities, imputed operating lease liabilities, plus notes payable, commercial paper outstanding, underfunded pension liability, guarantees on joint-venture debt, and adjustments to hybrid debt and preferred stock issuances based on how credit rating agencies view the instruments. Due to the forward-looking nature of this non-GAAP financial measure for future periods, information to reconcile it to the most directly comparable GAAP financial measure is not available at this time, as management is unable to project all special items, as discussed above under Adjusted EPS Guidance. Net Regulated Electric and Gas O&M The materials for Duke Energy’s Investor Update in June 2021 include a discussion of Duke Energy’s net regulated Electric and Gas operating, maintenance and other expenses (O&M) for the year-to-date periods |
| ended December 31, 2020, 2019, 2018, 2017 and 2016, as well as the forecasted year-to-date period ended December 31, 2021. Net regulated Electric and Gas O&M is a non-GAAP financial measure, as it represents reported O&M expenses adjusted for special items and expenses recovered through riders and excludes O&M expenses for Duke Energy’s non-margin based Commercial businesses and non-regulated electric products and services supporting regulated operations. Management believes the presentation of net regulated Electric and Gas O&M provides useful information to investors, as it provides a meaningful comparison of financial performance across periods. The most directly comparable GAAP financial measure for net regulated Electric and Gas O&M is reported operating, maintenance and other expenses. A reconciliation of net regulated Electric and Gas O&M for the year-to-date periods ended December 31, 2020, 2019, 2018, 2017 and 2016, as well as the forecasted year-to-date period ended December 31, 2021, to the most directly comparable GAAP measure are included here-in. Business Mix Percentage The materials for Duke Energy’s Investor Update in June 2021 reference each segment’s 2021 projected adjusted segment income as a percentage of the total projected 2021 adjusted net income (i.e. business mix), excluding the impact of Other. Duke Energy’s segments are comprised of Electric Utilities and Infrastructure, Gas Utilities and Infrastructure and Commercial Renewables. Adjusted segment income is a non-GAAP financial measure, as it represents reported segment income adjusted for special items as discussed above. Due to the forward-looking nature of any forecasted adjusted segment income, information to reconcile this non-GAAP financial measure to the most directly comparable GAAP financial measure is not available at this time, as management is unable to project all special items (as discussed above under Adjusted EPS Guidance). |
| ÿ ÿ ÿ ÿ ÿ ÿ ÿ ÿ ! " " ÿ # $% ÿ & ' ( ÿ ) 0 ) 0 1 2 3 3 4 ÿ 5 ! ÿ $5 3 3 5 2 ! 4 ( ÿ 6 # 7 8 ÿ 7 ÿ 4 9 ÿ $2 @ ! 8 4 A 7 # 5 3 ÿ 8 $4 7 2 8 " ÿ ! 5 ! B 4 4 ÿ 5 7 3 5 ! ÿ ! C 4 8 $ ! 8 4 C ! # B @ 3 8 2 D ÿ 8 8 3 $ ! 8 4 5 4 # 2 ! 8 5 ! @ " ÿ 7 8 5 2 ! 4 2 8 3 ÿ " E @ 4 8 $ ! 8 4 " E @ 4 8 " ÿ ! 5 ! B 4 F G HIGP Q ÿ S P T UIGÿ V W UFF X 3 # 8 5 # ÿ 8 5 3 5 8 5 4 ÿ ! " ÿ ! Y 4 8 @ # 8 @ ` ÿ) ( a a b ÿc ÿe ÿ c ÿfÿc ÿg h i ÿ c ÿfÿc ÿg h p ÿ c ÿq r s e s ÿ 4 ÿ 8 5 3 5 8 5 4 ÿ ! " ÿ ! Y 4 8 @ # 8 @ 1 ' ( ) a a A ÿt r h u h ÿ vfÿfÿfÿt r h u h ÿ e e t ÿ 2 $$ # 5 3 ÿ ! w % 3 4 ) x a ÿfÿfÿfÿfÿfÿ i g p ÿ 2 8 3 ÿ 7 2 8 % 3 ÿ B $ ! 8 ÿ ! # 2 $ ' ( a x b ÿ' ( y ' ' ÿ€ÿx y ) ÿ€ÿ) ( x & ÿ ‚ ( ) y ) ÿ 8 9 1 ‚ ) a Afƒ h s „ fÿƒ h s „ ƒ s u t „ 5 4 # 2 ! 8 5 ! @ " ÿ 7 8 5 2 ! 4 y ÿfÿfÿƒ h „ ƒ h „ f 8 ÿ ! # 2 $ ÿ C 5 3 % 3 ÿ 8 2 ÿ @ … ÿ ! B D ÿ 2 7 2 8 5 2 ! ÿ 2 $$2 ! ÿ 8 2 # … 9 2 3 " 4` ÿ' ( ) y 0 ÿ` ÿ' ( y ' ' ÿ` ÿ1 y A` x y ) ÿ` ÿ1 y A` ) ( 0 ' ÿ ` ÿ& ( y y ' ÿ G † F ÿ ‡ ˆ ‡ S W ‡ ‰ W G ÿ Q Uÿ ‘ ’ G ÿ G P G “ H”ÿ T U“† U“‡ Q S UPÿ T UIIUPÿ F Q UT’ • UW G “ F` ÿ' – y ) ÿ` ÿ) – & ) ÿ` ÿ1 0 – ' 0 A ÿ` ÿ' – ' b ÿ` ÿ1 0 – 0 ' A ÿ` ÿ& – ‚ 0 ÿ ` ÿ – ' ) ÿ ÿ — ÿ ˜ ™ d ÿ e f ÿ c t ÿ gh i i h e j ÿ d k l ÿ m ™ j ™ f h d n ÿ c s ÿ gh i i h e j ÿ h j o i p q ™ q ÿ r h d s h j ÿ t gu k h v g™ j d ÿ o s k v w ™ x ÿ v ™ i k d ™ q ÿ d e ÿ w k x ÿ u h u ™ i h j ™ ÿ h j d ™ v o e j j ™ o d h e j x ÿ e j ÿ d s ™ ÿ y p z ™ ÿ { j ™ v w | ÿ } v e w v ™ x x ~ ÿ e j x e i h q k d ™ q ÿ € d k d ™ g™ j d x ÿ e f ÿ u ™ v k d h e j x n v ÿ — ÿ ˜ ™ d ÿ e f ÿ c q ‚ g ÿ gh i i h e j ÿ d k l ÿ m ™ j ™ f h d n ƒ c i r u ‚ g ÿ gh i i h e j ÿ v ™ o e v q ™ q ÿ r h d s h j ÿ { „ p h d | ÿ h j ÿ ƒ i e x x ™ x „ ÿ ™ k v j h j w x ÿ e f ÿ p j o e j x e i h q k d ™ q ÿ k f f h i h k d ™ x ÿ v ™ i k d ™ q ÿ d e ÿ ™ l h d ÿ e m i h w k d h e j x ÿ f e v ÿ w k x ÿ u h u ™ i h j ™ ÿ h j … ™ x d g™ j d x ÿ e j ÿ d s ™ ÿ e j x e i h q k d ™ q ÿ € d k d ™ g™ j d x ÿ e f ÿ u ™ v k d h e j x n ƒ c h ÿ gh i i h e j ÿ h j o i p q ™ q ÿ r h d s h j ÿ t gu k h v g™ j d ÿ o s k v w ™ x ÿ v ™ i k d ™ q ÿ d e ÿ w k x ÿ u v e † ™ o d ÿ gk d ™ v h k i x ÿ e j ÿ d s ™ ÿ } h ™ q ge j d ÿ e j x e i h q k d ™ q ÿ € d k d ™ g™ j d x ÿ e f ÿ u ™ v k d h e j x n ÿ — ÿ ˜ ™ d ÿ e f ÿ c i q ÿ gh i i h e j ÿ d k l ÿ ™ l u ™ j x ™ n ÿ c ‚ g ÿ gh i i h e j ÿ v ™ … ™ v x k i ÿ e f ÿ i u t g ÿ x ™ … ™ v k j o ™ ÿ o s k v w ™ x ÿ v ™ o e v q ™ q ÿ r h d s h j ÿ u ™ v k d h e j x r ÿ gk h j d ™ j k j o ™ ÿ k j q ÿ e d s ™ v ÿ e j ÿ d s ™ ÿ e j x e i h q k d ™ q ÿ € d k d ™ g™ j d x ÿ e f ÿ u ™ v k d h e j x n ÿ — ÿ ˜ ™ d ÿ e f ÿ c t i q ÿ gh i i h e j ÿ d k l ÿ m ™ j ™ f h d ÿ k d ÿ y p z ™ ÿ { j ™ v w | ÿ k v e i h j k x ÿ k j q ÿ c t e u ÿ gh i i h e j ÿ d k l ÿ m ™ j ™ f h d ÿ k d ÿ y p z ™ ÿ { j ™ v w | ÿ } v e w v ™ x x n ƒ c e s e ÿ gh i i h e j ÿ h j o i p q ™ q ÿ r h d s h j ÿ t gu k h v g™ j d ÿ o s k v w ™ x ÿ k j q ÿ v ™ … ™ v x k i ÿ e f ÿ c s u ÿ gh i i h e j ÿ h j o i p q ™ q ÿ h j ÿ ‡ ™ w p i k d ™ q ÿ ™ i ™ o d v h o ÿ e u ™ v k d h j w ÿ v ™ … ™ j p ™ x ÿ v ™ i k d ™ q ÿ d e ÿ d s ™ ÿ o e k i ÿ k x s ÿ x ™ d d i ™ g™ j d ÿ f h i ™ q ÿ r h d s ÿ d s ™ ÿ ˜ ˆ ÿ e j ÿ d s ™ y p z ™ ÿ { j ™ v w | ÿ k v e i h j k x ~ ÿ e j x e i h q k d ™ q ÿ € d k d ™ g™ j d x ÿ e f ÿ u ™ v k d h e j x n ƒ c t ‚ ÿ gh i i h e j ÿ h j o i p q ™ q ÿ r h d s h j ÿ t gu k h v g™ j d ÿ o s k v w ™ x ÿ v ™ i k d ™ q ÿ d e ÿ d s ™ ÿ i ™ gx e j ÿ ˆ j h … ™ v x h d | ÿ e gm h j ™ q ÿ ‰ ™ k d ÿ k j q ÿ } e r ™ v ÿ } i k j d ÿ k j q ÿ c g ÿ gh i i h e j ÿ e f ÿ x s k v ™ s e i q ™ v ÿ o e j d v h m p d h e j x ÿ r h d s h j ÿ u ™ v k d h e j x r ÿ g k h j d ™ j k j o ™ k j q ÿ e d s ™ v ÿ e j ÿ d s ™ ÿ y p z ™ ÿ { j ™ v w | ÿ k v e i h j k x ~ ÿ e j x e i h q k d ™ q ÿ € d k d ™ g™ j d x ÿ e f ÿ u ™ v k d h e j x n ƒ c e ‚ e ÿ gh i i h e j ÿ h j o i p q ™ q ÿ r h d s h j ÿ t gu k h v g™ j d ÿ o s k v w ™ x ÿ k j q ÿ v ™ … ™ v x k i ÿ e f ÿ c t u i ÿ gh i i h e j ÿ h j o i p q ™ q ÿ h j ÿ ‡ ™ w p i k d ™ q ÿ ™ i ™ o d v h o ÿ e u ™ v k d h j w ÿ v ™ … ™ j p ™ x ÿ v ™ i k d ™ q ÿ d e ÿ d s ™ ÿ o e k i ÿ k x s ÿ x ™ d d i ™ g™ j d ÿ f h i ™ q ÿ r h d s ÿ ˜ ˆ ÿ e j ÿ d s ™ ÿ y p z ™ { j ™ v w | ÿ } v e w v ™ x x ~ ÿ e j x e i h q k d ™ q ÿ € d k d ™ g™ j d x ÿ e f ÿ u ™ v k d h e j x n ƒ c g ÿ gh i i h e j ÿ e f ÿ x s k v ™ s e i q ™ v ÿ o e j d v h m p d h e j x ÿ h j o i p q ™ q ÿ r h d s h j ÿ u ™ v k d h e j x r ÿ gk h j d ™ j k j o ™ ÿ k j q ÿ e d s ™ v ÿ e j ÿ d s ™ ÿ y p z ™ ÿ { j ™ v w | ÿ } v e w v ™ x x ~ ÿ e j x e i h q k d ™ q ÿ € d k d ™ g™ j d x ÿ e f ÿ u ™ v k d h e j x n ÿ Š ÿ ‡ ™ o e v q ™ q ÿ h j ÿ t j o e g™ ÿ ƒ ‹ e x x „ ÿ f v e gÿ y h x o e j d h j p ™ q ÿ u ™ v k d h e j x r ÿ j ™ d ÿ e f ÿ d k l ÿ e j ÿ d s ™ ÿ e j x e i h q k d ™ q ÿ € d k d ™ g™ j d x ÿ e f ÿ u ™ v k d h e j x n Œ 5 B 9 8 " ÿ C B ÿ 9 4 ÿ 1 7 2 8 " ÿ ! " ÿ " E @ 4 8 " A ÿ ÿ y & y ÿ $5 3 3 5 2 ! |
| DUKE ENERGY CORPORATION REPORTED TO ADJUSTED EARNINGS RECONCILIATION Three Months Ended March 31, 2021 (Dollars in millions, except per share amounts) Special Item Reported Earnings Gas Pipeline Investments Total Adjustments Adjusted Earnings SEGMENT INCOME Electric Utilities and Infrastructure $ 820 $ — $ — $ 820 Gas Utilities and Infrastructure 245 5 A 5 250 Commercial Renewables 27 — — 27 Total Reportable Segment Income 1,092 5 5 1,097 Other (139) — — (139) Net Income Available to Duke Energy Corporation Common Stockholders $ 953 $ 5 $ 5 $ 958 EPS AVAILABLE TO DUKE ENERGY CORPORATION COMMON STOCKHOLDERS $ 1.25 $ 0.01 $ 0.01 $ 1.26 Note: Earnings Per Share amounts are adjusted for accumulated dividends for Series B Preferred Stock of $0.02. A - Net of $1 million tax benefit. $6 million of exit obligations recorded within Equity in (losses) earnings of unconsolidated affiliates on the Condensed Consolidated Statements of Operations. Weighted Average Shares (reported and adjusted) – 769 million |
| DUKE ENERGY CORPORATION REPORTED TO ADJUSTED EARNINGS RECONCILIATION Three Months Ended March 31, 2020 (Dollars in millions, except per share amounts) Special Item Reported Earnings Severance Total Adjustments Adjusted Earnings SEGMENT INCOME Electric Utilities and Infrastructure $ 705 $ — $ — $ 705 Gas Utilities and Infrastructure 249 — — 249 Commercial Renewables 57 — — 57 Total Reportable Segment Income 1,011 — — 1,011 Other (112) (75) A (75) (187) Net Income Available to Duke Energy Corporation Common Stockholders $ 899 $ (75) $ (75) $ 824 EPS AVAILABLE TO DUKE ENERGY CORPORATION COMMON STOCKHOLDERS $ 1.24 $ (0.10) $ (0.10) $ 1.14 Note: Earnings Per Share amounts are adjusted for accumulated dividends for Series B Preferred Stock of $0.02. A – Net of $23 million tax expense. $98 million reversal of 2018 charges recorded within Operations, maintenance and other on the Condensed Consolidated Statements of Operations. Weighted Average Shares (reported and adjusted) – 734 million |
| Actual Actual Actual Actual Actual Forecast December 31, 2016 December 31, 2017 December 31, 2018 December 31, 2019 December 31, 2020 December 31, 2021 $6,223 $5,944 $6,463 $6,066 $5,788 $6,072 Costs to Achieve, Mergers(b) (238) (94) (83) – – – Severance(b) (92) – (187) – 98 – Regulatory settlement(b) – (5) (40) – (16) – Energy Efficiency Recoverable (c) (417) (485) (446) (415) (350) (403) Other Deferrals(d) and Recoverable (141) (152) (400) (353) (510) (340) Margin based O&M for Commercial Businesses (185) (94) (113) (95) (67) (208) Short-term incentive payments (over)/under budget (90) (22) (30) (112) 33 – Non-Margin based O&M for Commercial Businesses (e) (166) (173) (191) (203) (218) (269) Non-regulated Electric Products and Services(f) (83) (140) (138) (175) (210) (223) $4,811 $4,779 $4,835 $4,714 $4,548 $4,630 (a) (b) (c) (d) (e) Primarily represents the operations, maintenance and other expense of the Commercial Renewables segment excluding REC Solar. (f) Primarily represents non-regulated electric products and services expense in support of regulated operations. Prior periods have been recast to reflect a change in methodology to present certain deferrals which will be recovered through future rate cases as if they were included in base rates. Net Regulated Electric and Gas, operation, maintenance and other As reported in the Consolidated Statements of Operations. Presented as a special item for the purpose of calculating adjusted earnings and adjusted diluted earnings per share. Primarily represents expenses to be deferred or recovered through rate riders. Duke Energy Corporation Operations, Maintenance and Other Expense (In millions) Operation, maintenance and other(a) Adjustments: |
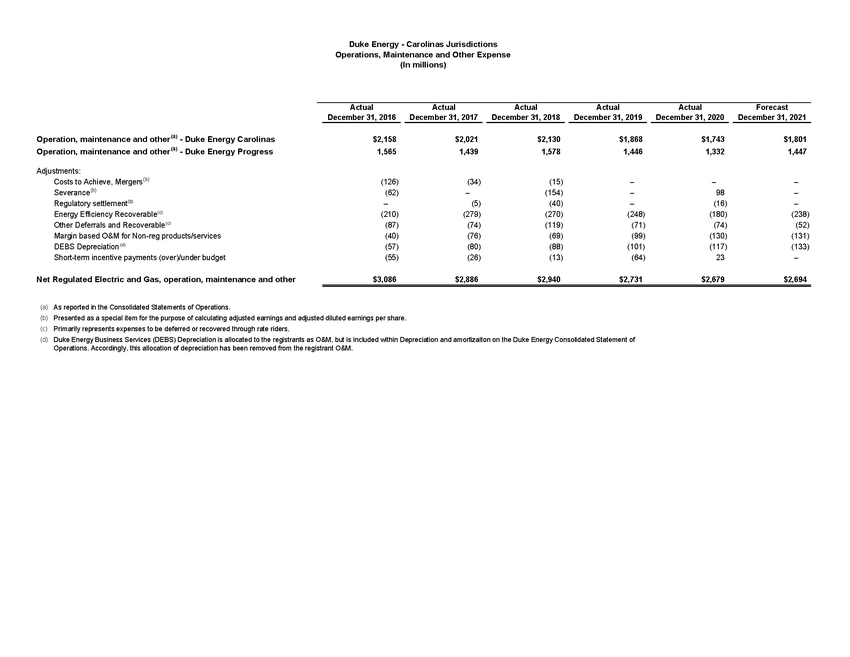
| Actual Actual Actual Actual Actual Forecast December 31, 2016 December 31, 2017 December 31, 2018 December 31, 2019 December 31, 2020 December 31, 2021 $2,158 $2,021 $2,130 $1,868 $1,743 $1,801 1,565 1,439 1,578 1,446 1,332 1,447 Costs to Achieve, Mergers(b) (126) (34) (15) – – – Severance(b) (62) – (154) – 98 – Regulatory settlement(b) – (5) (40) – (16) – Energy Efficiency Recoverable(c) (210) (279) (270) (248) (180) (238) Other Deferrals and Recoverable (c) (87) (74) (119) (71) (74) (52) Margin based O&M for Non-reg products/services (40) (76) (69) (99) (130) (131) DEBS Depreciation (d) (57) (80) (88) (101) (117) (133) Short-term incentive payments (over)/under budget (55) (26) (13) (64) 23 – $3,086 $2,886 $2,940 $2,731 $2,679 $2,694 (a) As reported in the Consolidated Statements of Operations. (b) Presented as a special item for the purpose of calculating adjusted earnings and adjusted diluted earnings per share. (c) Primarily represents expenses to be deferred or recovered through rate riders. (d) Adjustments: Net Regulated Electric and Gas, operation, maintenance and other Duke Energy Business Services (DEBS) Depreciation is allocated to the registrants as O&M, but is included within Depreciation and amortizaiton on the Duke Energy Consolidated Statement of Operations. Accordingly, this allocation of depreciation has been removed from the registrant O&M. Operation, maintenance and other(a) - Duke Energy Progress Duke Energy - Carolinas Jurisdictions Operations, Maintenance and Other Expense (In millions) Operation, maintenance and other(a) - Duke Energy Carolinas |
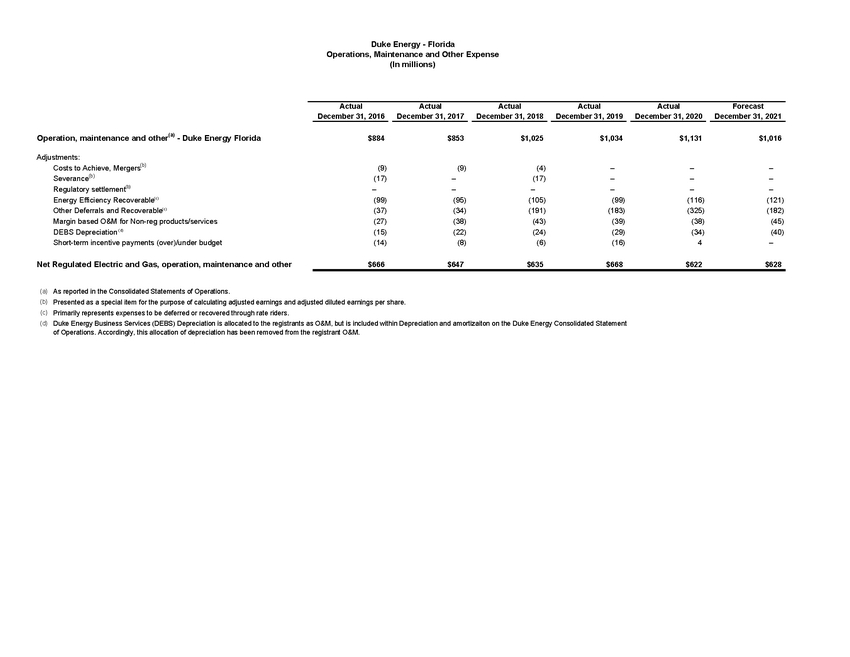
| Actual Actual Actual Actual Actual Forecast December 31, 2016 December 31, 2017 December 31, 2018 December 31, 2019 December 31, 2020 December 31, 2021 $884 $853 $1,025 $1,034 $1,131 $1,016 Costs to Achieve, Mergers(b) (9) (9) (4) – – – Severance(b) (17) – (17) – – – Regulatory settlement(b) – – – – – – Energy Efficiency Recoverable (c) (99) (95) (105) (99) (116) (121) Other Deferrals and Recoverable (c) (37) (34) (191) (183) (325) (182) Margin based O&M for Non-reg products/services (27) (38) (43) (39) (38) (45) DEBS Depreciation (d) (15) (22) (24) (29) (34) (40) Short-term incentive payments (over)/under budget (14) (8) (6) (16) 4 – $666 $647 $635 $668 $622 $628 (a) As reported in the Consolidated Statements of Operations. (b) Presented as a special item for the purpose of calculating adjusted earnings and adjusted diluted earnings per share. (c) Primarily represents expenses to be deferred or recovered through rate riders. (d) Net Regulated Electric and Gas, operation, maintenance and other Duke Energy Business Services (DEBS) Depreciation is allocated to the registrants as O&M, but is included within Depreciation and amortizaiton on the Duke Energy Consolidated Statement of Operations. Accordingly, this allocation of depreciation has been removed from the registrant O&M. Duke Energy - Florida Operations, Maintenance and Other Expense (In millions) Operation, maintenance and other(a) - Duke Energy Florida Adjustments: |
| Actual Actual Actual Actual Actual Forecast December 31, 2016 December 31, 2017 December 31, 2018 December 31, 2019 December 31, 2020 December 31, 2021 $727 $743 $788 $790 $762 $782 514 530 480 520 463 471 Costs to Achieve, Mergers(b) (10) (12) (16) – – – Severance(b) (10) – (13) – – – Regulatory settlement(b) – – – – – – Energy Efficiency Recoverable(c) (86) (104) (71) (68) (54) (45) Other Deferrals and Recoverable (c) (39) (48) (89) (99) (101) (106) Margin based O&M for Non-reg products/services (9) (16) (11) (12) (9) (13) DEBS Depreciation (d) (16) (23) (25) (30) (34) (40) Short-term incentive payments (over)/under budget (5) (7) – (21) 8 – $1,066 $1,063 $1,043 $1,080 $1,035 $1,049 (a) As reported in the Consolidated Statements of Operations. (b) Presented as a special item for the purpose of calculating adjusted earnings and adjusted diluted earnings per share. (c) Primarily represents expenses to be deferred or recovered through rate riders. (d) Duke Energy Business Services (DEBS) Depreciation is allocated to the registrants as O&M, but is included within Depreciation and amortizaiton on the Duke Energy Consolidated Statement of Operations. Accordingly, this allocation of depreciation has been removed from the registrant O&M. Operation, maintenance and other(a) - Duke Energy Ohio Net Regulated Electric and Gas, operation, maintenance and other Duke Energy - Midwest Jurisdictions Operations, Maintenance and Other Expense (In millions) Operation, maintenance and other(a) - Duke Energy Indiana Adjustments: |
