 CREATING THE LEADING U.S. UTILITY January 10, 2011 Exhibit 99.2 OH KY NC SC FL |
 Creating the Leading U.S. Utility – January 10, 2011 Safe Harbor 2 |
 Creating the Leading U.S. Utility – January 10, 2011 Safe Harbor (cont’d) ADDITIONAL INFORMATION AND WHERE TO FIND IT This document does not constitute an offer to sell or the solicitation of an offer to buy any securities, or a solicitation of any vote or approval, nor shall there be any sale of securities in any jurisdiction in which such offer, solicitation or sale would be unlawful prior to registration or qualification under the securities laws of any such jurisdiction. In connection with the proposed merger between Duke Energy and Progress Energy, Duke Energy will file with the SEC a Registration Statement on Form S-4 that will include a joint proxy statement of Duke Energy and Progress Energy that also constitutes a prospectus of Duke Energy. Duke Energy and Progress Energy will deliver the joint proxy statement/prospectus to their respective shareholders. Duke Energy and Progress Energy urge investors and shareholders to read the joint proxy statement/prospectus regarding the proposed merger when it becomes available, as well as other documents filed with the SEC, because they will contain important information. You may obtain copies of all documents filed with the SEC regarding this transaction, free of charge, at the SEC's website (www.sec.gov). You may also obtain these documents, free of charge, from Duke Energy’s website (www.duke-energy.com) under the heading “Investors” and then under the heading “Financials/SEC Filings.” You may also obtain these documents, free of charge, from Progress Energy’s website (www.progress-energy.com) under the tab “Investors” and then under the heading “SEC Filings.” PARTICIPANTS IN THE MERGER SOLICITATION Duke Energy, Progress Energy, and their respective directors, executive officers and certain other members of management and employees may be soliciting proxies from Duke Energy and Progress Energy shareholders in favor of the merger and related matters. Information regarding the persons who may, under the rules of the SEC, be deemed participants in the solicitation of Duke Energy and Progress Energy shareholders in connection with the proposed merger will be set forth in the joint proxy statement/prospectus when it is filed with the SEC. You can find information about Duke Energy’s executive officers and directors in its definitive proxy statement filed with the SEC on March 22, 2010. You can find information about Progress Energy’s executive officers and directors in its definitive proxy statement filed with the SEC on March 31, 2010. Additional information about Duke Energy’s executive officers and directors and Progress Energy’s executive officers and directors can be found in the above-referenced Registration Statement on Form S-4 when it becomes available. You can obtain free copies of these documents from Duke Energy and Progress Energy using the contact information above. 3 |
 Creating the Leading U.S. Utility – January 10, 2011 Safe Harbor (cont’d) REG G DISCLOSURE In addition, today's discussion includes certain non-GAAP financial measures as defined under SEC Regulation G. A reconciliation of those measures to the most directly comparable GAAP measures is available on our Investor Relations websites at www.duke-energy.com and www.progress-energy.com. 4 |
 Creating the Leading U.S. Utility – January 10, 2011 Agenda Transaction Overview Company Highlights Financial Summary Closing |
 Creating the Leading U.S. Utility – January 10, 2011 Transaction Overview |
 Creating the Leading U.S. Utility – January 10, 2011 7 Compelling Strategic Transaction Creates largest U.S. utility, supported by substantial, diversified regulated earnings and cash flows Unmatched financial and operational scale, scope and strength Principally regulated earnings base supports dividend Significant scale of operating cash flows Highly-regulated business mix Regulated: comprises approximately 85% of combined company adjusted segment EBIT Non-regulated: comprises approximately 15% of combined company adjusted segment EBIT Overall Strategic Benefits 1 Duke Energy’s forecasted 2010 adjusted EBIT based upon midpoint of original 2010 adjusted diluted EPS range of $1.25 - $1.30; excludes operations labeled as ‘Other’; Progress Energy’s forecasted 2010 adjusted EBIT based upon midpoint of original 2010 ongoing EPS range of $2.85 - $3.05 1 1 Leverages “best-in-class” operational and customer service practices Enhances industry leadership position to shape federal and state energy policies |
 Creating the Leading U.S. Utility – January 10, 2011 8 Compelling Strategic Transaction (cont’d) Earnings accretive in year one Attractive total shareholder return proposition supported by strong dividend Maintain Duke Energy dividend and policy Significant rate base growth expected to drive 4-6% long-term EPS growth Strong balance sheet and credit profile Investor Benefits Ability to derive meaningful operational efficiencies for regulated electric customers over time Significant benefits to Carolinas customers from fuel and joint dispatch efficiencies Continued commitment to delivering clean, affordable and reliable energy to our customers Strong, complementary management teams Experience with execution of large-scale merger transactions Management Expertise Customer Benefits 1 Based upon adjusted diluted earnings per share. Long-term EPS growth rate off a stand-alone Duke Energy base year of 2011 1 1 |
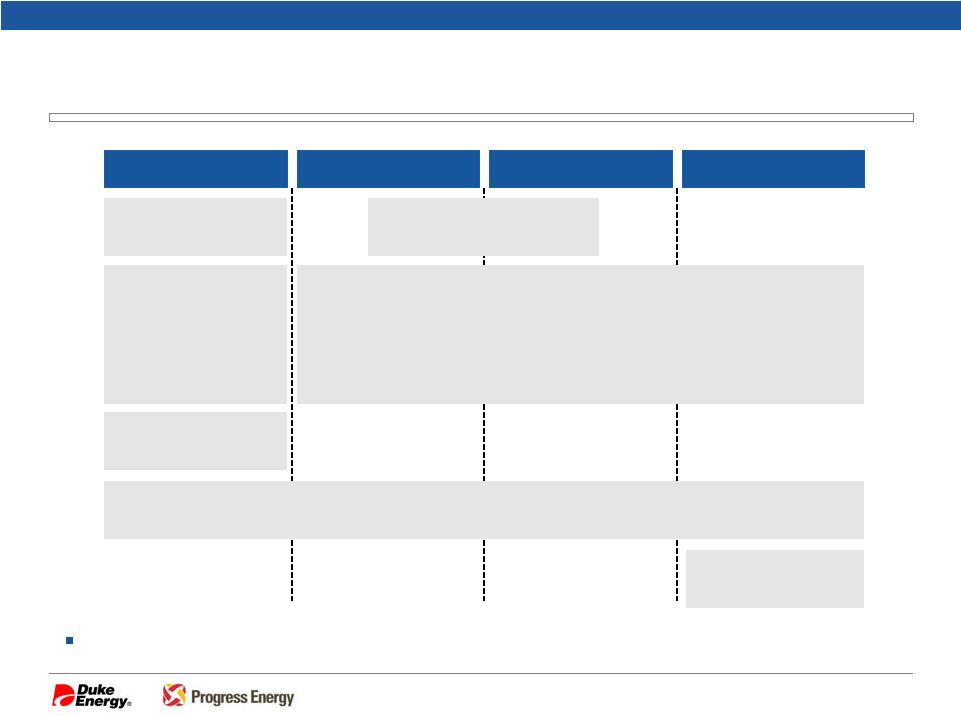
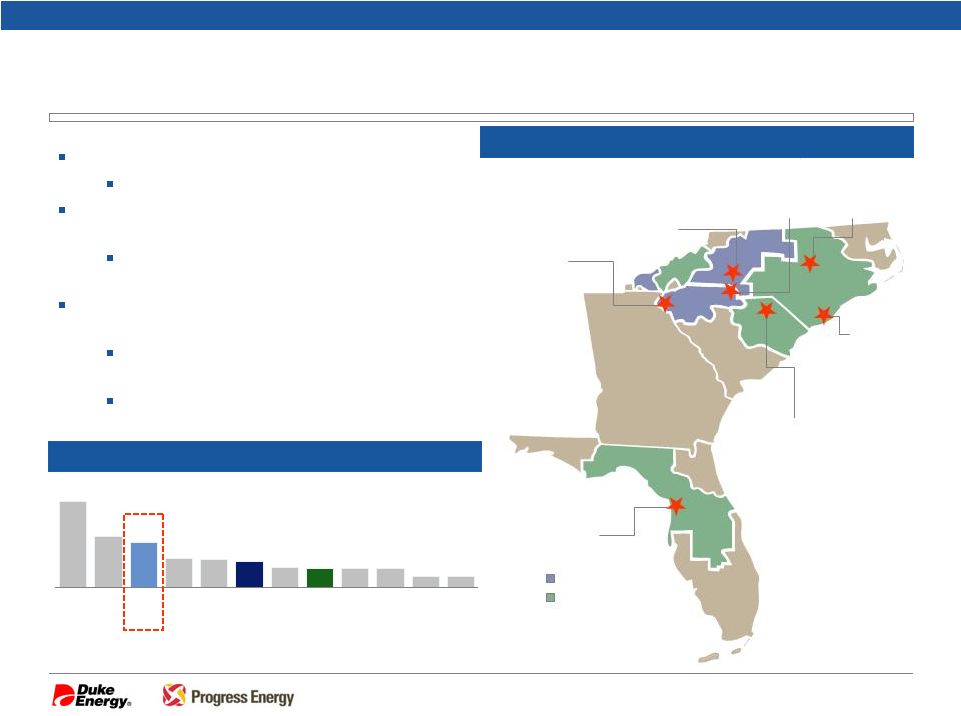
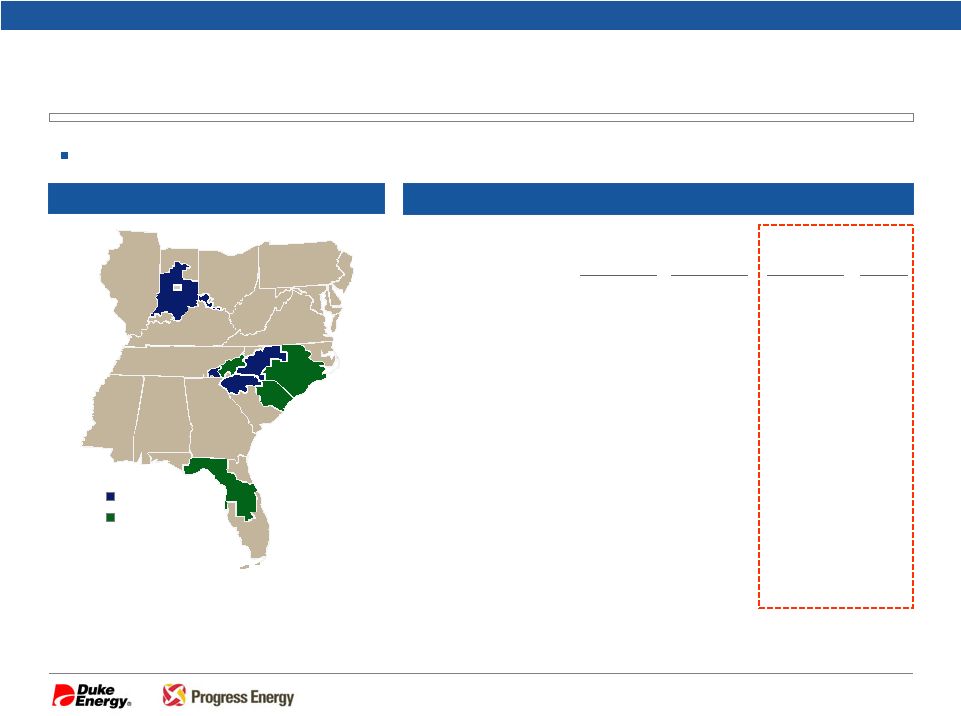 Creating the Leading U.S. Utility – January 10, 2011 Diverse Service Territories Creating the Largest U.S. Utility The combined company will create the largest U.S. utility, with unmatched scale and scope Combined Statistics Enterprise Value $40.2 B $25.1 B $65.3 B #1 Market Cap. $23.6 B $12.8 B $36.5 B #1 Electric Customers 4.0 M 3.1 M 7.1 M #1 Generation Capacity 35.4 GW 21.8 GW 57.2 GW¹ #1 Total Assets $57.9 B $32.7 B $90.6 B #1 Rate Base $23 B $17 B $40 B #1 Regulated EBIT Mix 77% 100% 85% N/A Duke Energy Progress Energy Combined Rank IN Duke Energy Progress Energy IN 9 OH KY NC SC FL 2 3 1 Source: FactSet as 12/31/2010 Note: Customer data as of 12/31/2009; rate base data estimated as of 12/31/2010; total assets and generation capacity as of 09/30/2010 ¹ Excludes purchased power and approximately 4 GW of Duke Energy International assets ² Total assets are a summation of the two stand-alone companies and do not include any purchase accounting adjustments from this transaction. 3 Duke Energy’s forecasted 2010 adjusted EBIT based upon midpoint of original 2010 adjusted diluted EPS range of $1.25 - $1.30; excludes operations labeled as ‘Other’; Progress Energy’s forecasted 2010 adjusted EBIT based upon midpoint of original 2010 ongoing EPS range of $2.85 - $3.05 |
 Creating the Leading U.S. Utility – January 10, 2011 10 Key Transaction Terms Following shareholder vote and regulatory approvals, targeting closing transaction by end of 2011 Timing/Approvals Corporate: Charlotte; significant presence in Raleigh Utilities: No change Headquarters 100% stock 2.6125 shares of Duke Energy per Progress Energy share Consideration Duke Energy shareholders: 63% Progress Energy shareholders: 37% Pro Forma Ownership Executive Chairman: Jim Rogers President and CEO: Bill Johnson Board composition 11 nominated by Duke Energy, including Jim Rogers 7 nominated by Progress Energy, including Bill Johnson Lead Director to be designated by Duke Energy Governance Duke Energy Corporation Company Name |
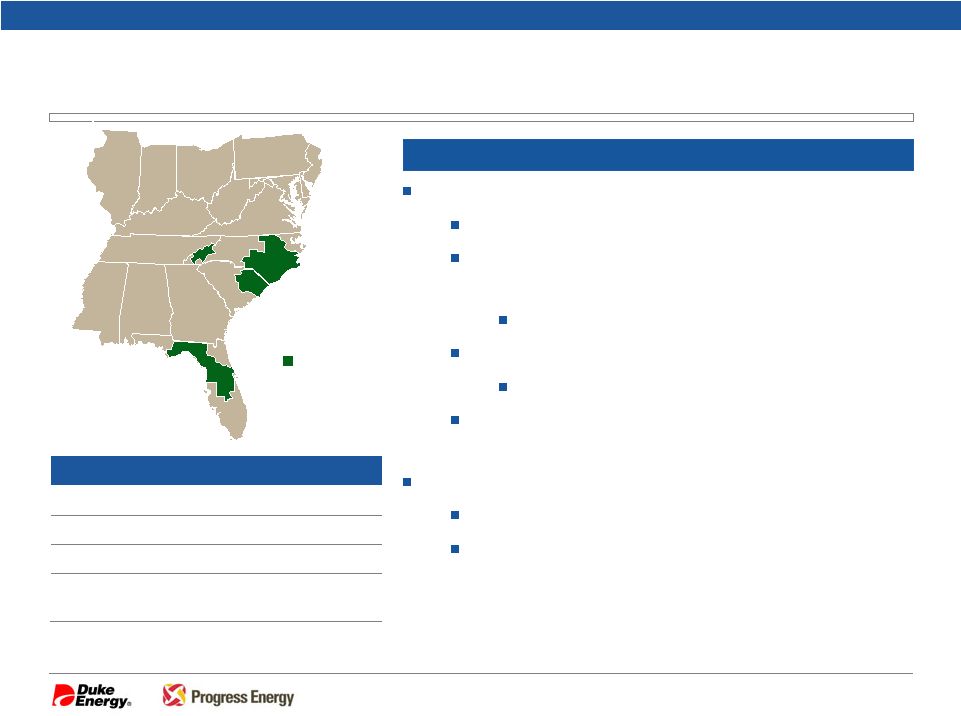 Creating the Leading U.S. Utility – January 10, 2011 11 Duke Energy Transaction Rationale Investor and strategic benefits EPS accretive in year one¹ Creates unmatched financial and operational scale, scope and strength Poised for strong growth and economic recovery Expanded U.S. regulated earnings base and cash flows Operating in constructive regulatory environments Improved business risk profile due to increased proportion of regulated earnings and cash flows Significant customer benefits Fuel and joint dispatch savings in the Carolinas Operational efficiencies through leveraging mutual “best- in-class” customer service capabilities Transaction Rationale ¹ Based on adjusted diluted EPS 2 Generation capacity as of 09/30/2010; excludes purchased power Progress Energy at a Glance Generation 21.8 GW Rate base ~$17 B (estimated as of 12/31/10) Customers 3.1 M (electric) Jurisdictions North Carolina, South Carolina and Florida Progress Energy NC SC OH KY IN FL 2 |
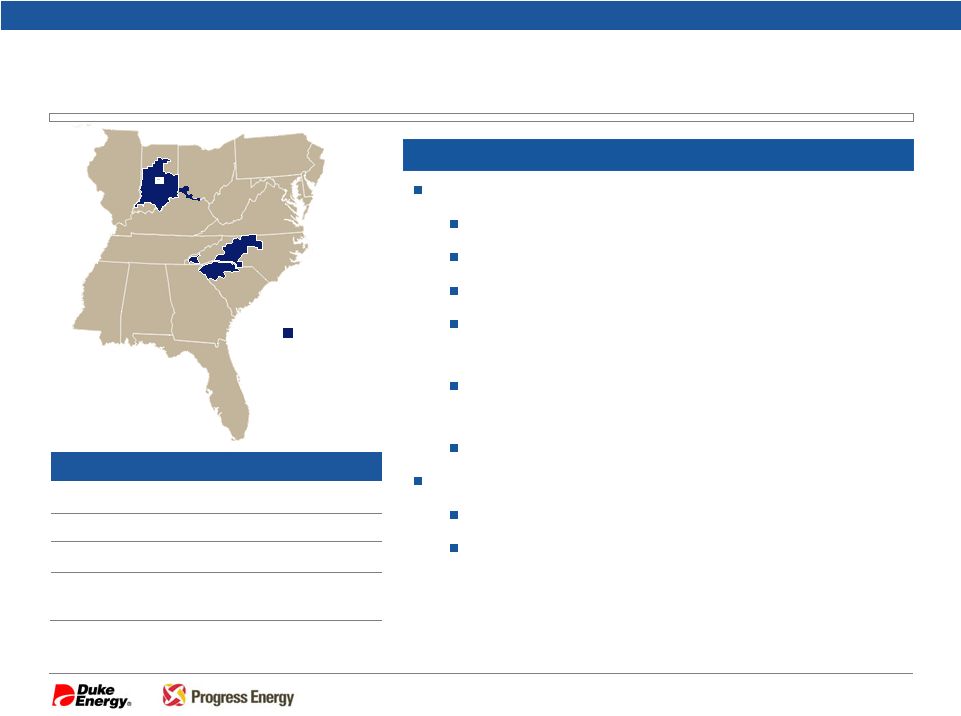 Creating the Leading U.S. Utility – January 10, 2011 12 Progress Energy Transaction Rationale Transaction Rationale ¹ Premium expressed relative to unaffected Progress Energy 1/05/2011 closing share price of $43.39. The premium to the Progress Energy 1/07/2011 closing share price of $44.72 is 3.9%. ² Based on adjusted diluted EPS 3 Generation capacity as of 09/30/2010; excludes purchased power and approximately 4 GW of Duke Energy International assets Investor and strategic benefits 7.1% premium to Progress Energy shareholders 1 Dividend and EPS accretive in year one 2 Improved EPS & dividend growth Increased regulatory and earnings diversity in six service territories Improved business risk profile due to stronger balance sheet and credit metrics Enhanced growth opportunities and strategic optionality Significant customer benefits Fuel and joint dispatch savings in the Carolinas Operational efficiencies through leveraging mutual “best-in-class” customer service capabilities Duke Energy at a Glance Generation 35.4 GW Rate base ~$23 B (estimated as of 12/31/10) Customers 4.0 M (electric); 0.5 M (gas) Jurisdictions North Carolina, South Carolina, Indiana, Ohio and Kentucky Duke Energy IN NC FL OH KY SC 3 |
 Creating the Leading U.S. Utility – January 10, 2011 Highly Experienced Leadership Team 18 Member Board of Directors Bill Johnson President & CEO Lynn Good Chief Financial Officer Mark Mulhern Chief Administrative Officer Keith Trent Commercial Businesses Jennifer Weber Chief Human Resources Officer Dhiaa Jamil Nuclear Generation John McArthur Regulated Utilities General Counsel Jeff Lyash Energy Supply Lloyd Yates Customer Operations Chief Integration Officers A.R. Mullinax Paula Sims Jim Rogers Executive Chairman 13 |
 Creating the Leading U.S. Utility – January 10, 2011 Indicative Timeline to Close and Regulatory Approvals Q1 2011 Q2 2011 Q3 2011 Q4 2011 Merger announcement Make regulatory filings North Carolina, South Carolina, U.S. DOJ, FERC, and NRC File joint proxy statement Secure appropriate state and federal regulatory approvals Duke Energy and Progress Energy shareholder meetings Develop and initiate transition implementation plans Close merger (Targeted) We will work collaboratively with all of our state regulators 14 |
 Creating the Leading U.S. Utility – January 10, 2011 Company Highlights |
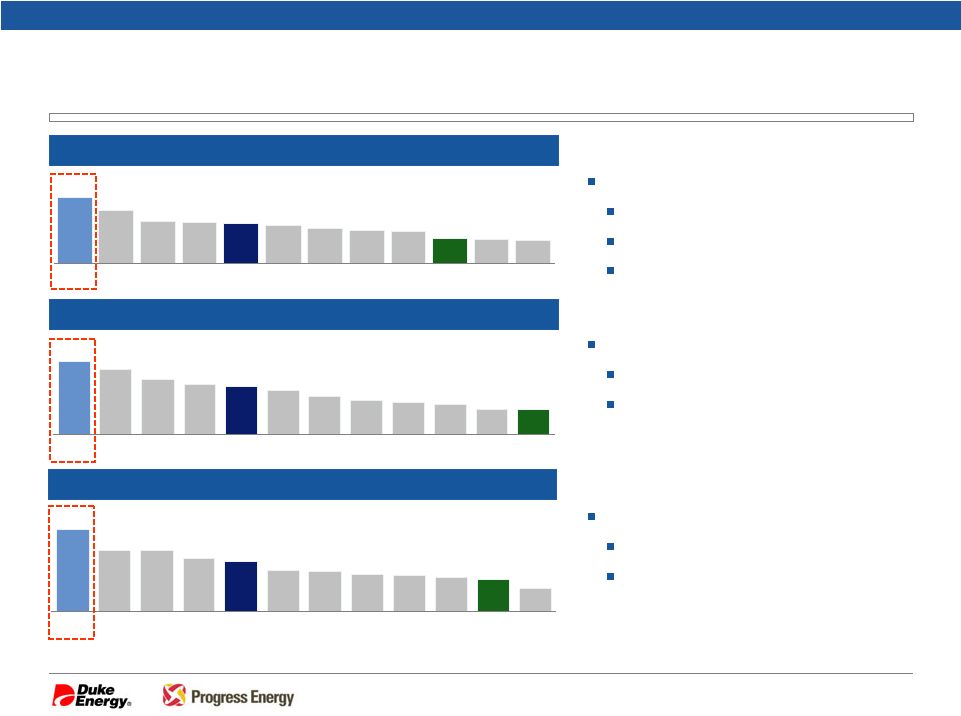 Creating the Leading U.S. Utility – January 10, 2011 16.0 21.8 23.7 24.9 25.6 27.9 28.3 37.0 42.7 42.9 35.4 57.2 PF DUK SO NEE AEP DUK CPN ETR D EXC FE/AYE PGN PEG Enterprise Value ($ B) $23.6 $24.9 $25.1 $32.5 $33.6 $35.0 $37.8 $40.2 $41.5 $41.6 $65.3 $52.7 PF DUK SO D NEE DUK EXC AEP FE/AYE PCG PGN PEG ETR Market Capitalization ($ B) $12.8 $12.9 $15.4 $16.1 $17.3 $19.3 $21.8 $23.6 $24.8 $27.5 $36.5 $32.4 PF DUK SO EXC D DUK NEE PCG AEP PEG FE/AYE ETR PGN The Leading U.S. Utility #1 U.S. utility by enterprise value $65.3 B enterprise value 24% larger than the #2 utility $90.6 B in total assets #1 U.S. utility by market capitalization $36.5 B equity value 13% larger than the #2 utility #1 U.S. utility by generation capacity 57.2 GW total capacity 33% larger than the #2 generator Capacity Owned (GW) 16 1 Source: Market data as of 12/31/2010, company filings; capacity owned as of 09/30/2010 for Duke Energy and Progress Energy; as of 12/31/2009 for other companies Total assets are as of 9/30/2010 and are a summation of the two stand-alone companies and do not include any purchase accounting adjustments from this transaction. 1 |
 Creating the Leading U.S. Utility – January 10, 2011 By Type: 235 TWh By Geography Attractive, Diversified Operations Presence in six attractive growth service territories with constructive regulatory traditions More electric customers than any other U.S. utility, serving 7.1 M domestic regulated electric customers Customer Diversity: 7.1 M regulated customers FL 23% Carolinas 54% Residential 35% Commercial 30% Wholesale/Other 15% Industrial 20% IN 16% Carolinas 54% OH 6% FL 22% KY 2% IN 11% OH 10% KY 2% Rate Base Diversity: $40 B Note: Customer data as of 12/31/2009; rate base data estimated as of 12/31/2010 (see Note on slide 24); customer data only includes regulated customers Duke Energy Progress Energy NC SC FL OH Diverse Service Territories 17 IN KY |
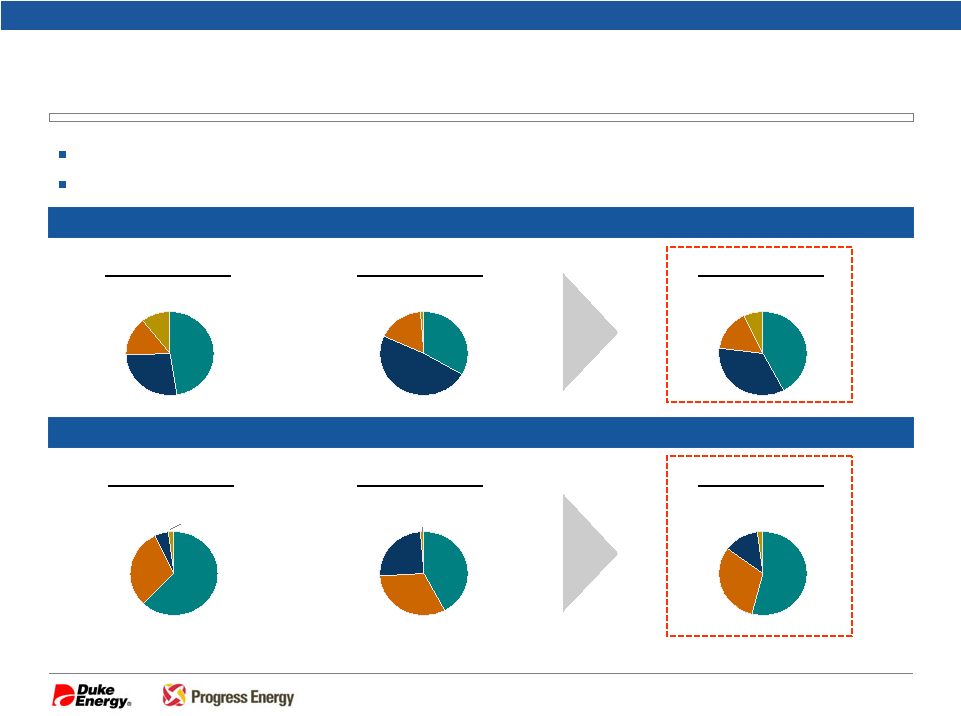 Creating the Leading U.S. Utility – January 10, 2011 Highly diversified generation capacity and fuel profile Capacity and fuel diversity projected to increase, migrating the combined fleet to greater gas and less coal exposure By Actual Generation: 231 TWh¹ Source: SNL Energy, Ventyx, company filings ¹ Note: Capacity owned as of 09/30/2010 excludes approximately 4 GW of Duke Energy International assets. Actual generation includes twelve-months ended 12/31/2009 and excludes purchased power U.S. Generation Diversity Nuclear 15% Gas/Oil 27% Coal 42% By Owned Capacity: 57 GW¹ Gas/Oil 48% Coal 48% Hydro/Wind 11% Nuclear 16% Gas/Oil 35% Coal 33% Hydro/Wind 7% Coal 42% Gas/Oil 25% Nuclear 32% Duke Energy Progress Energy Combined Hydro/Wind 1% Duke Energy Progress Energy Combined Hydro/Wind 1% Coal 62% Nuclear 31% Coal 54% Nuclear 31% Gas/Oil 13% Hydro/Wind 2% Nuclear 17% Gas/Oil 5% Hydro/Wind 2% 18 |
 Creating the Leading U.S. Utility – January 10, 2011 19 U.S. Generation Well Positioned for Pending Environmental Regulations Announced Retirements Duke Energy 1.9 Progress Energy 1.5 Subtotal 3.4 Potential Additional Retirements/Investments Duke Energy 2.2 Progress Energy 1.0 Subtotal 3.2 Total Unscrubbed Coal 6.6 Unscrubbed Coal Capacity (GW) Generation Capacity by Technology (GW / %) Duke Energy Progress Energy Combined Unscrubbed Coal 4.0 GW / 11% Gas/Oil 9.4 GW / 27% Non-Emitting¹ 9.1 GW / 26% Scrubbed Coal 12.9 GW / 36% Unscrubbed Coal 6.6 GW / 11% Gas/Oil 19.9 GW / 35% Non-Emitting¹ 13.1 GW / 23% Scrubbed Coal 17.6 GW / 31% Unscrubbed Coal 2.5 GW / 12% Gas/Oil 10.5 GW / 48% Non-Emitting¹ 4.0 GW / 18% Scrubbed Coal 4.7 GW / 22% ¹ Duke Energy: Nuclear (15%), Hydro (9%), Renewables (2%); Progress Energy: Nuclear (17%), Hydro (1%); Combined: Nuclear (16%), Hydro (6%), Renewables (1%) Note: Generation capacity as of 09/30/2010 excludes approximately 4 GW of Duke Energy International assets |
 Creating the Leading U.S. Utility – January 10, 2011 Source: SNL Energy, Ventyx, company filings Note: Capacity owned as of 09/30/2010 for Duke Energy and Progress Energy; as of 12/31/2009 for other companies Nuclear Generation Overview Nuclear Generation Capacity Owned (GW) 17.0 10.1 2.2 2.2 3.7 3.7 3.8 4.0 5.2 5.5 5.8 9.0 EXC ETR PF DUK D NEE DUK FE/AYE PGN SO PEG PCG AEP Combination creates the largest U.S. regulated nuclear fleet 7 stations and 12 units with ~9 GW of owned generation Commitment to top quartile operational performance for nuclear fleet Combination of nuclear fleets to drive best practices and achieve operating efficiencies Size and scale better positions combined company for the continued pursuit of new nuclear development opportunities COLs have been filed with the NRC for three potential sites New nuclear will only be pursued with the appropriate regulatory recovery mechanisms in place Duke Energy Progress Energy NC SC FL Oconee McGuire Catawba Crystal River Robinson Brunswick Harris Combined Nuclear Generation Fleet 20 Creating the Leading U.S. Utility – January 10, 2011 |
 Creating the Leading U.S. Utility – January 10, 2011 Financial Summary |
 Creating the Leading U.S. Utility – January 10, 2011 Accretive to earnings in the first year after close Joint dispatch and fuel savings will immediately benefit Carolinas’ customers ($600 - 800 M from 2012 - 2016) Non-fuel merger benefits help achieve first year earnings accretion No equity issuance requirements assumed Long-term adjusted diluted EPS CAGR target: 4 – 6% Principally driven by significant regulated capital investment opportunities Duke Energy reverse stock split at transaction close Split ratio to be determined prior to closing Exchange ratio in the merger will be appropriately adjusted to reflect the reverse split Pro Forma Earnings Profile Based upon adjusted diluted earnings (excludes costs to achieve) Based upon base year of 2011 22 1 1 2 2 |
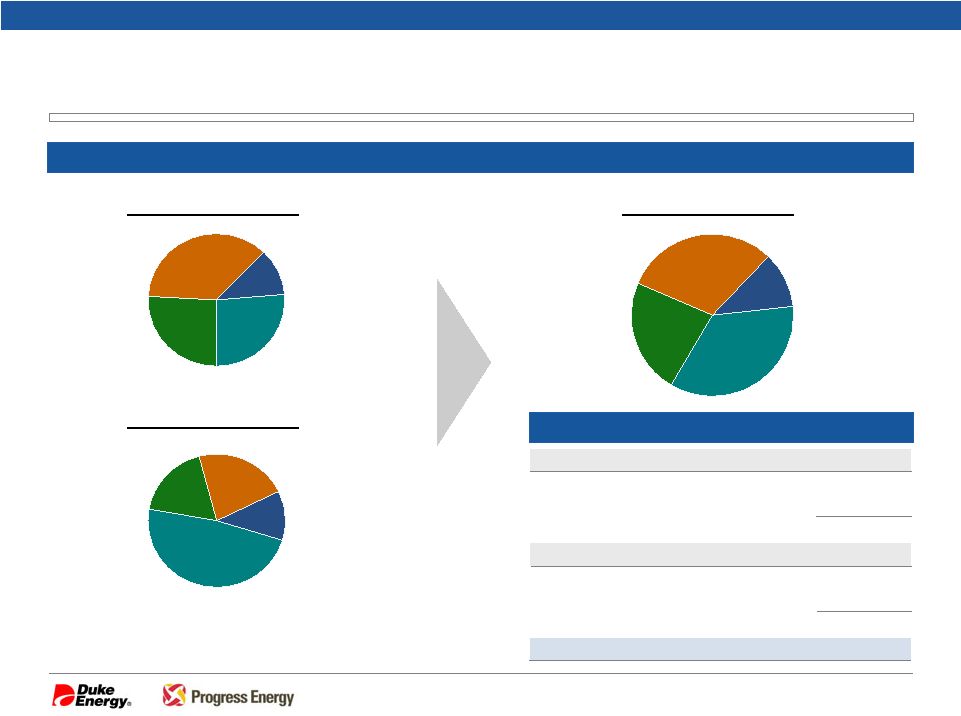
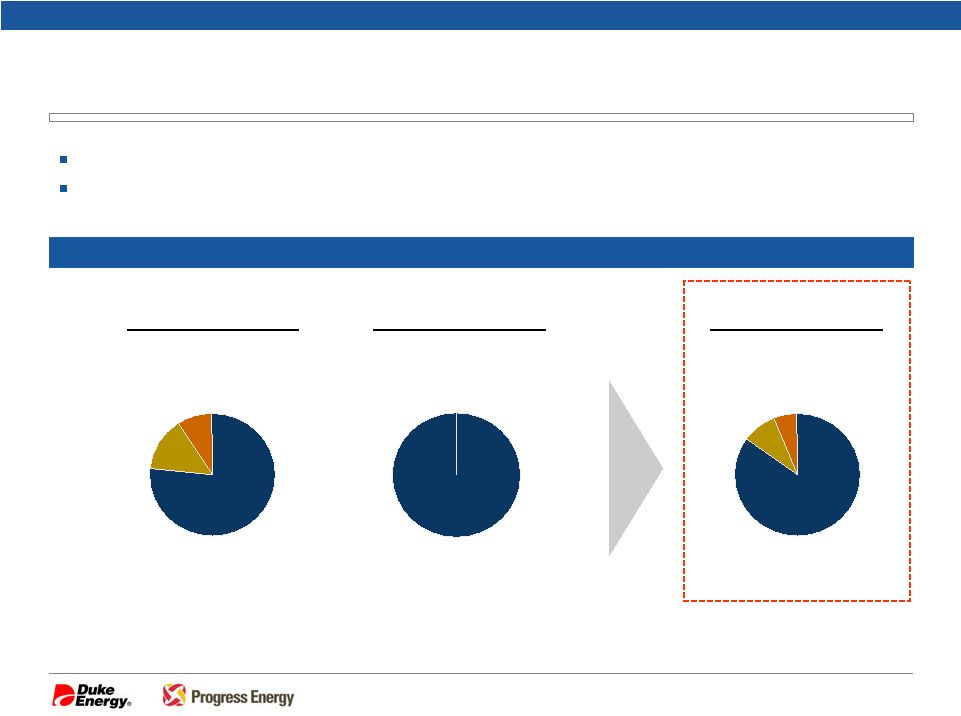 Creating the Leading U.S. Utility – January 10, 2011 Predominantly Regulated Earnings Base and Cash Flows Business Mix Commercial Power 9% Regulated ~100% Duke Energy 2010E EBIT: ~$3.4 B Progress Energy Combined Regulated 77% 2010E EBIT: ~$2.1 B DEI 9% 2010E EBIT: ~$5.5 B Regulated 85% DEI 14% Commercial Power 6% Regulated EBIT contribution of the combined operations will be approximately 85% Duke Energy is committed to growing its strong regulated earnings base 23 Note: Duke Energy’s forecasted 2010 adjusted EBIT based upon midpoint of original 2010 adjusted diluted EPS range of $1.25 - $1.30; excludes operations labeled as ‘Other’ Progress Energy’s forecasted 2010 adjusted EBIT based upon midpoint of original 2010 ongoing EPS range of $2.85 - $3.05 |
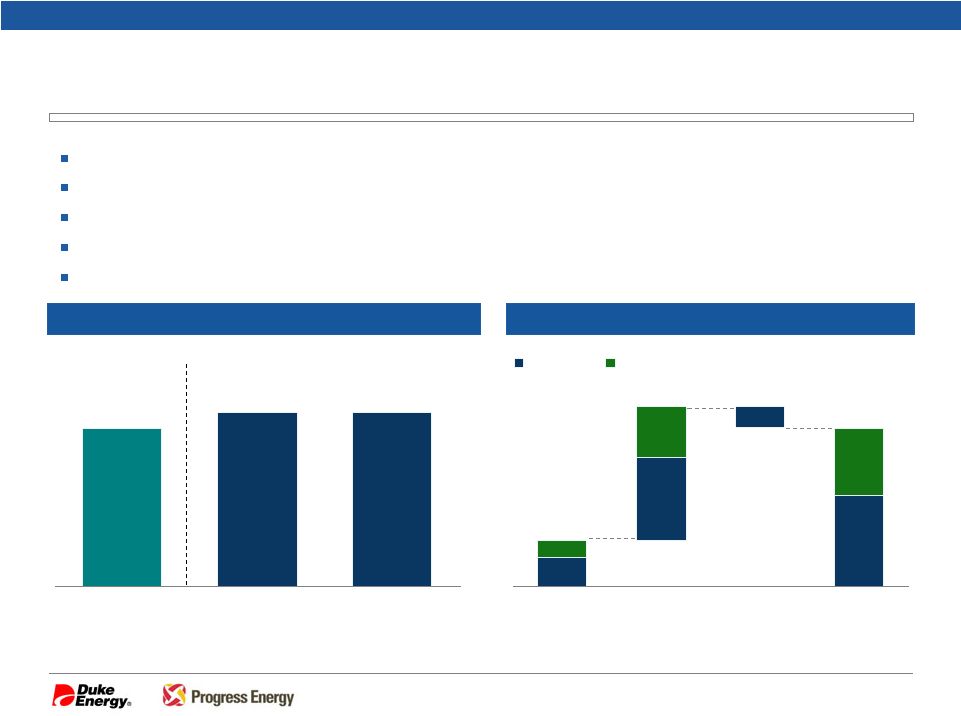
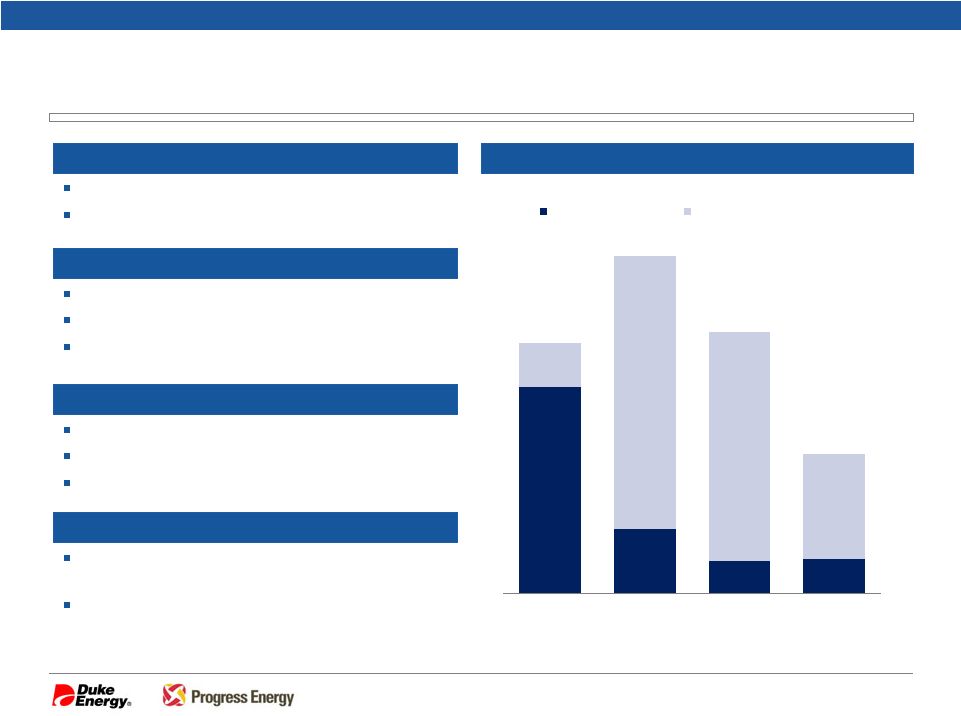
 Creating the Leading U.S. Utility – January 10, 2011 Projected Rate Base ($ B) Attractive Rate Base Growth $17 $19 $20 $23 $27 $29 $49 $46 $40 2010E 2011E 2012E 2013E 2014E Progress Energy Duke Energy $3 $3 $3 $4 $3 $2 $1 $1 $1 $1 $1 $8 $8 $7 2010E 2011E 2012E Regulated Maintenance Regulated Growth Non-Regulated Discretionary Range Projected Capital Expenditures ($ B) Illustrative 24 Note: Forecasted capital expenditures are based on the original 2010-2012E standalone forecasts of Duke Energy and Progress Energy, as disclosed in February 2010, respectively, as well as the midpoint of Duke Energy’s expected discretionary capital expenditure range; Projected rate base includes both retail and wholesale; Duke Energy’s projected rate base is based upon estimated amounts which would be expected to qualify for rate base treatment at each period and is not based upon actual expected timing of rate base changes resulting from rate cases. |
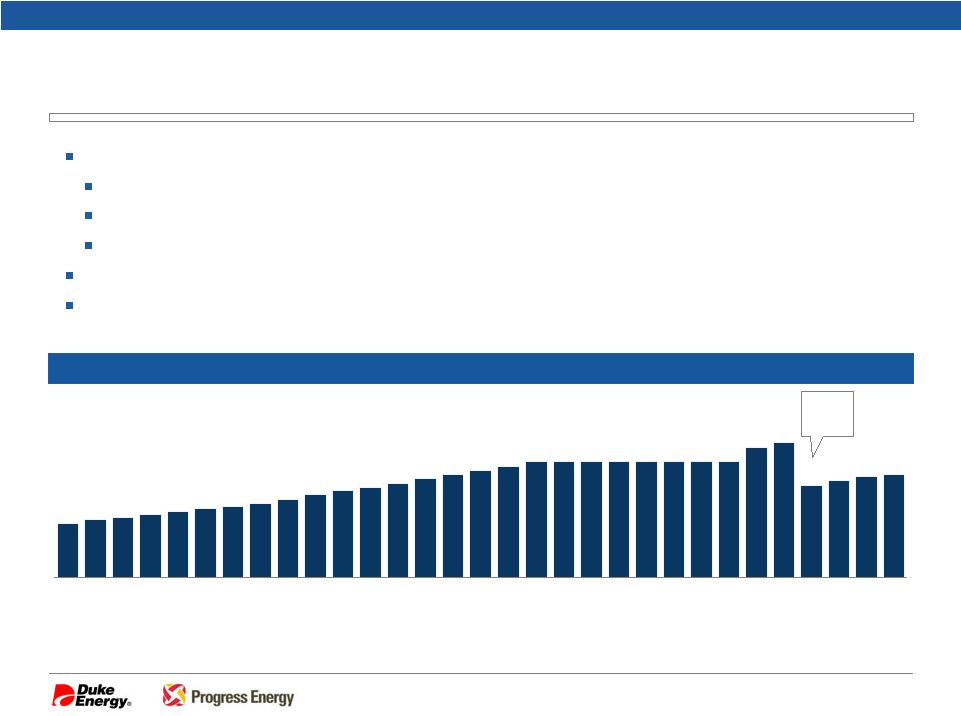 Creating the Leading U.S. Utility – January 10, 2011 Attractive Dividend Policy Duke Energy dividend and policy to be maintained Continued growth in dividend at a rate slower than growth of adjusted diluted EPS Targeting a long-term payout range of 65% to 70% Attractive payout and yield underscores compelling shareholder value proposition Dividend quality supported by strong pro forma regulated earnings base Duke Energy and Progress Energy have 84 and 65-year histories, respectively, of consecutive quarterly cash dividend payments DUK Annual Dividend Per Share History Source: FactSet Based upon adjusted diluted EPS 2007 decrease due to the spin-off of Spectra Energy to shareholders on 1/2/2007 as dividends subsequent to the spin-off were split proportionately between Duke Energy and Spectra Energy such that the sum of the dividends of the two stand-alone companies approximated the former total dividend prior to the spin-off Note: Annual dividends are split-adjusted and reflect annualized Q4 dividend per share for each year $0.98 $0.96 $0.92 $0.88 $1.28 $1.24 $1.10 $1.10 $1.10 $1.10 $1.10 $1.10 $1.10 $1.10 $1.06 $1.02 $0.98 $0.94 $0.90 $0.86 $0.82 $0.78 $0.74 $0.70 $0.67 $0.65 $0.62 $0.59 $0.57 $0.55 $0.51 1985 1987 1988 1989 1990 1991 1992 1993 1994 1995 1996 1997 1998 1999 2000 2001 2002 2003 2004 2005 2006 2007 2008 2009 2010 Spectra Energy Spin-Off² 1980 1981 1982 1983 1984 1986 25 1 1 2 |
 Creating the Leading U.S. Utility – January 10, 2011 Strong Credit Quality and Liquidity $0.7 $2.0 $2.7 $1.1 $3.3 $3.6 $0.8 $1.8 $5.3 $6.3 $0.8 Duke Energy Progress Energy Pro Forma Liquidity ($ B) Projected Debt/Total Capitalization 50% 51% 51% Note: Debt/Total Capitalization is unadjusted; 2011E is estimated as transaction is not targeted to close until end of 2011 1 2012E 2013E 2011E Cash and equivalents Total Available Credit Facilities Utilized Amount Available Liquidity Highly committed to Duke Energy’s current strong credit ratings Lower overall risk profile resulting from increased regulated earnings base and cash flows Strong balance sheet strength with $91 B in total assets Increased regulatory diversity with presence in six traditionally constructive regulatory jurisdictions Broad and reliable access to capital markets and liquidity 26 Total assets are as of 9/30/2010 and are a summation of the two stand-alone companies and do not include any purchase accounting adjustments from this transaction. Note: Pro forma liquidity is as of 09/30/2010; Duke Energy cash and equivalents excludes certain cash and short-term investments in foreign jurisdictions of approximately $675 M 1 |
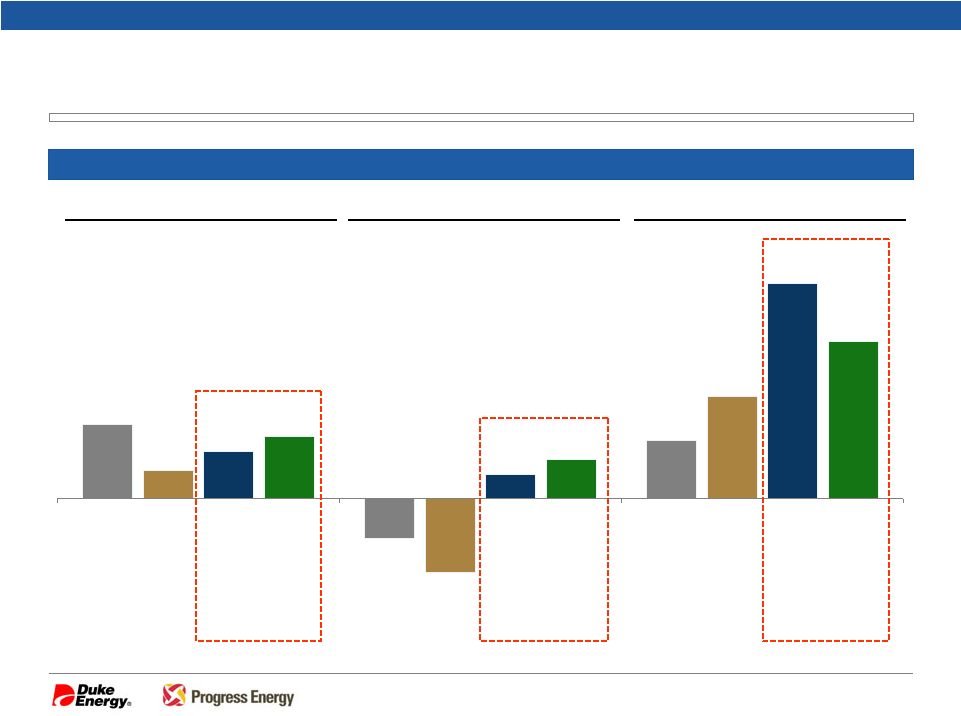 Creating the Leading U.S. Utility – January 10, 2011 Shareholder Value Track Record 15.1% (8.3%) 12.0% 5.7% (15.4%) 20.9% 9.5% 4.7% 44.2% 12.6% 7.9% 32.3% Total Shareholder Return (%) S&P 500 UTY Duke Energy Progress Energy 1 year S&P 500 UTY 3 year S&P 500 UTY 5 year Source: Bloomberg as of 12/31/2010 Duke Energy Progress Energy Duke Energy Progress Energy 27 |
 Creating the Leading U.S. Utility – January 10, 2011 Closing |
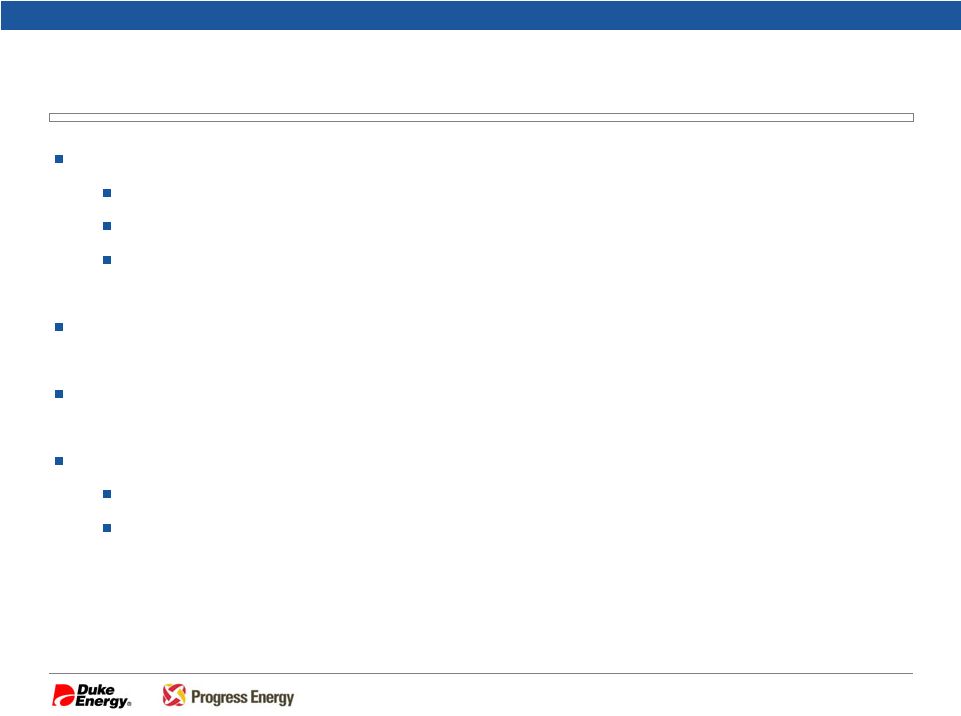 Creating the Leading U.S. Utility – January 10, 2011 29 Summary Highlights Creates largest U.S. utility, supported by substantial, diversified regulated earnings and cash flows Unmatched financial and operational scale, scope and strength Principally regulated earnings base supports dividend Significant scale of operating cash flows Leverages “best-in-class” operational and customer service practices Enhances industry leadership position to shape federal and state energy policies Highly-regulated business mix Regulated: comprises approximately 85% of combined company adjusted segment EBIT Non-regulated: comprises approximately 15% of combined company adjusted segment EBIT 1 1 Duke Energy’s forecasted 2010 adjusted EBIT based upon midpoint of original 2010 adjusted diluted EPS range of $1.25 - $1.30; excludes operations labeled as ‘Other’; Progress Energy’s forecasted 2010 adjusted EBIT based upon midpoint of original 2010 ongoing EPS range of $2.85 - $3.05 1 |
 Creating the Leading U.S. Utility – January 10, 2011 Appendix |
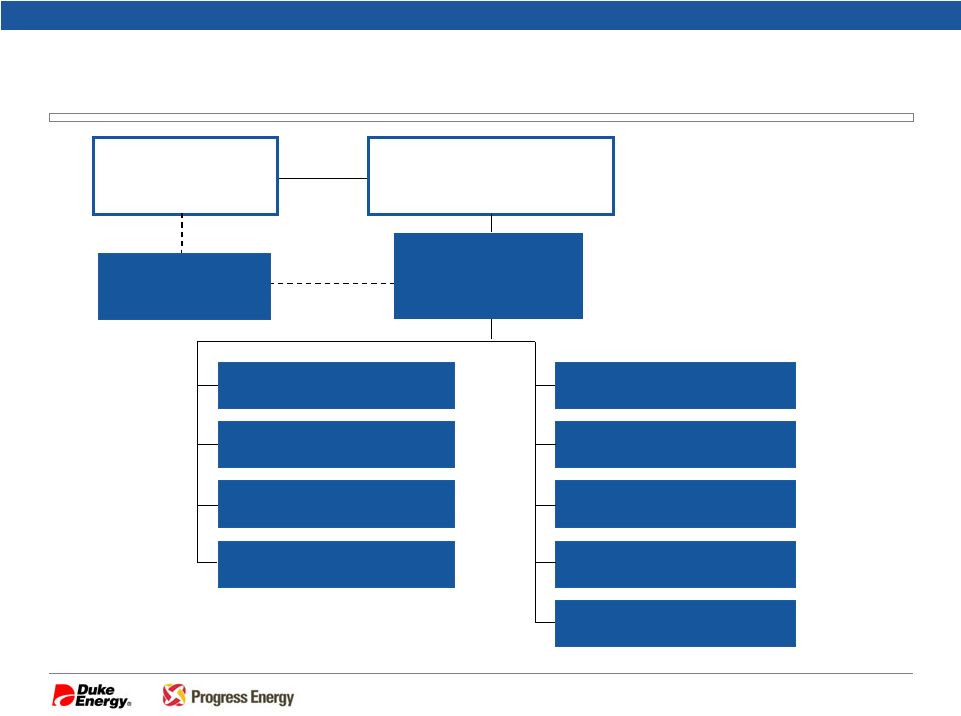
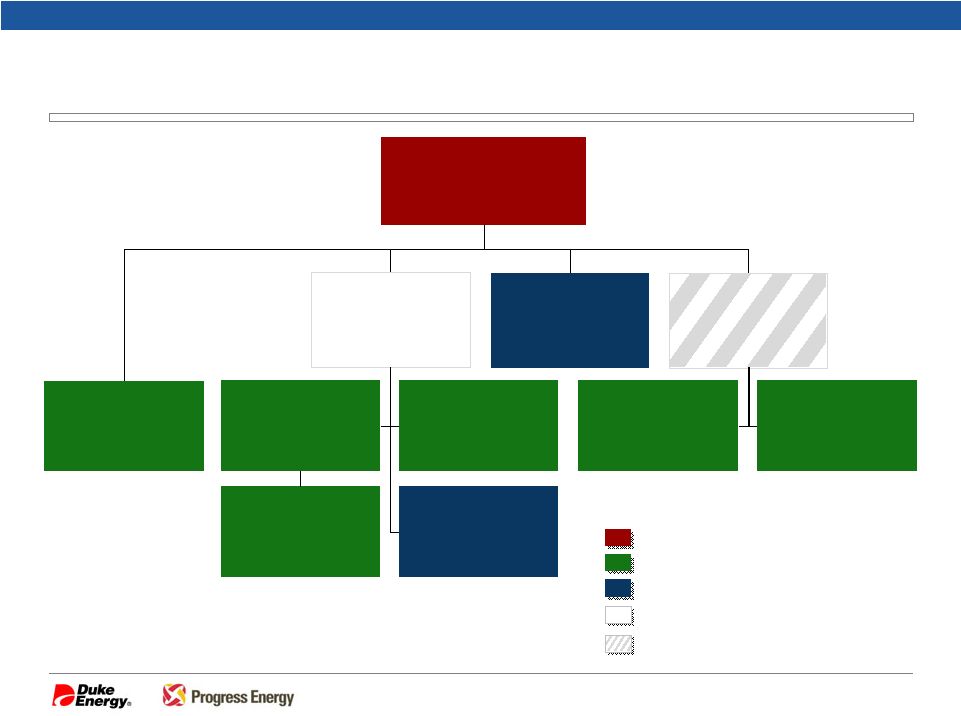              Creating the Leading U.S. Utility – January 10, 2011 31 Simplified Financing Structure by Legal Entity Commercial Paper and LT Financings Project / International Financings Money Pool and LT Financings Duke Energy (HoldCo) Duke Energy (HoldCo) Duke Energy Carolinas Duke Energy Carolinas Duke Energy International Duke Energy International Duke Energy Ohio Duke Energy Ohio Duke Energy Kentucky Duke Energy Kentucky Duke Energy Indiana Duke Energy Indiana Other Non-Reg Other Non-Reg Progress Energy Carolinas Progress Energy Carolinas Progress Energy Florida Progress Energy Florida Issuer Legend Dormant Entity Existing Debt But No Future Issuance Cinergy Corp. (HoldCo) Progress Energy (HoldCo) |
 Creating the Leading U.S. Utility – January 10, 2011 Duke Energy – Summary of Major Capital Projects 32 1 Project costs include direct capital and AFUDC Edwardsport – Indiana 618 MW IGCC facility expected in-service in 2012 Project status (as of 09/30/10) Overall project: 74% complete Final engineering: over 90% complete Construction: 52% complete Cliffside – Carolinas 825 MW advanced clean-coal unit expected in-service in 2012 Project is 72% complete and on budget (as of 09/30/10) Buck – Carolinas 620 MW combined-cycle gas-fired plant expected in-service in 2011 Project is 15% complete (as of 09/30/10) Dan River – Carolinas 620 MW combined-cycle gas-fired plant expected in-service in 2012 Project broke ground Q4-2010 US FE&G Major Construction Projects¹ ($ M) Renewables Projects Top of the World – 200 MW In-service ahead of schedule and under budget Kit Carson – 51 MW In-service ahead of schedule and under budget Blue Wing – 14 MW In-service ahead of schedule and on budget $2,025 $1,550 $350 $225 $855 $850 $350 $485 Edwardsport Cliffside Buck CC Dan River CC Spent as of 09/30/10 Estimated expenditures to complete project |
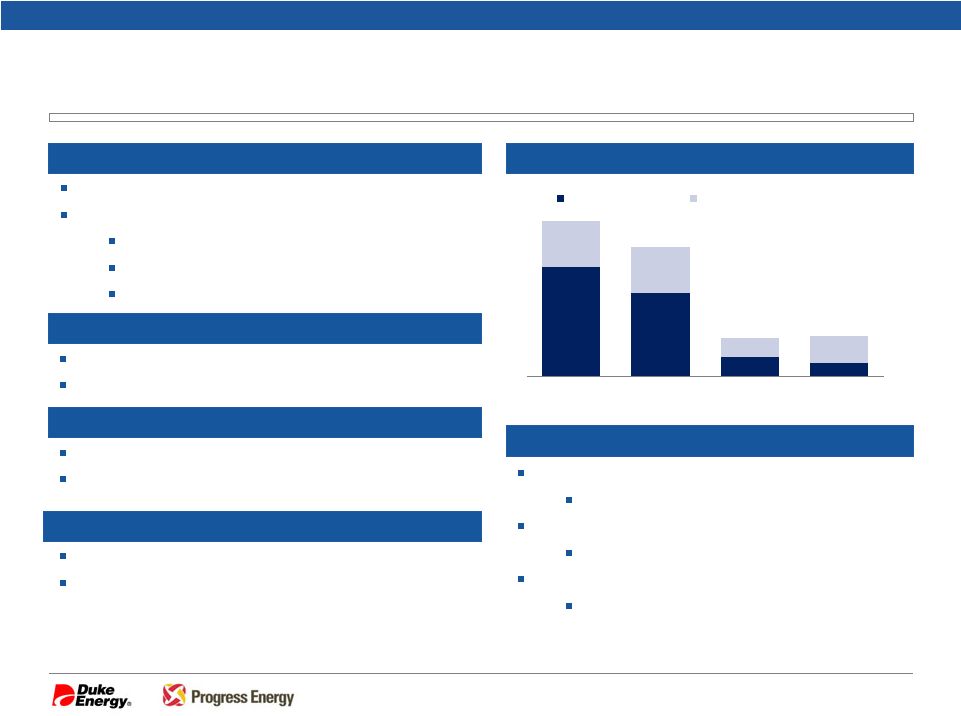
 Creating the Leading U.S. Utility – January 10, 2011 Progress Energy – Summary of Major Capital Projects 33 $475 $150 $75 $80 $100 $625 $525 $240 Richmond County Lee Sutton Smart Grid Spent as of 09/30/10 Estimated expenditures to complete project Richmond County CCGT – North Carolina 635 MW combined-cycle gas-fired plant Expected in-service in June 2011 Lee CCGT – North Carolina 920 MW combined-cycle gas-fired plant Project broke ground in September 2010 Expected in-service in January 2013 Sutton CCGT – North Carolina 625 MW combined-cycle gas-fired plant Construction is expected to begin in 2H-2011 Expected in-service in January 2014 Smart Grid – Carolinas & Florida Received $200M grant from the DOE in August 2009 ($100M each for PEC and PEF) Leverages already-planned investments of $320M ($200M for PEC and $120M for PEF) Progress Energy Major Construction Projects¹ ($ M) Project costs include direct capital, AFUDC and the cost of all transmission additions and upgrades necessary to integrate the generator into the system. 1 |
 Creating the Leading U.S. Utility – January 10, 2011 Example calculation of Progress Energy dividend based on Duke Energy’s current annual dividend per share Duke Energy annual dividend Multiplied by: exchange ratio Progress Energy exchange-ratio adjusted dividend Progress Energy current annual dividend Progress Energy expected dividend accretion Dividend Accretion to Progress Energy – Illustrative Example Current $0.98 2.6125x $2.56 $2.48 $0.08 or 3.2% Pro Forma 1-for-2 Stock Split $1.96 1.30625x $2.56 $2.48 $0.08 or 3.2% Dividend accretion to Progress Energy is expected to increase over time given Duke Energy’s historical dividend per share growth rate of ~2% 1 Stock split ratio to be determined subsequently; 1-for-2 used for illustrative purposes only 34 1 |
 Creating the Leading U.S. Utility – January 10, 2011 |