
Creditor Presentation October 2016 Exhibit 99.1
Confidentiality and Nature of Projections The following slide presentation may contain confidential information of LINN Energy, LLC and its subsidiaries, including Berry Petroleum Company, LLC (collectively, “LINN” or the “Company”). By accepting and reviewing this presentation, you expressly acknowledge and agree that: (i) you will not copy, fax, reproduce, divulge, or distribute any information contained herein, in whole or in part, without the express written consent of the Company and (ii) the information herein will be treated as confidential information except to the extent such information is or becomes publicly available other than as a result of a disclosure by you or your representatives. Any financial projections or forecasts included in this presentation were not prepared with a view toward public disclosure or compliance with the published guidelines of the Securities and Exchange Commission or the guidelines established by the American Institute of Certified Public Accountants regarding projections or forecasts. The projections do not purport to present the Company’s financial condition in accordance with accounting principles generally accepted in the United States. The Company’s independent accountants have not examined, compiled or otherwise applied procedures to the projections and, accordingly, do not express an opinion or any other form of assurance with respect to the projections. The inclusion of the projections should not be regarded as an indication that the Company or its affiliates or representatives consider the projections to be a reliable prediction of future events, and the projections should not be relied upon as such. Neither the Company nor any of its affiliates or representatives has made or makes any representation to any person regarding the ultimate outcome of the Company’s restructuring compared to the projections, and none of them undertakes any obligation to publicly update the projections to reflect circumstances existing after the date when the projections were made or to reflect the occurrence of future events, even in the event that any or all of the assumptions underlying the projections are shown to be in error.
Forward-Looking Statements and Risk Factors This presentation contains forward-looking statements. These statements, including those relating to the intent, beliefs, plans or expectations of the Company are based upon current expectations and are subject to a number of risks, uncertainties and assumptions. It is not possible to predict or identify all such factors and the following list should not be considered a complete statement of all potential risks and uncertainties relating to the Company’s business and the filing of the Bankruptcy Petitions, including, but not limited to: (i) the Company’s ability to obtain the Court’s approval with respect to motions or other requests made to the Court in the Chapter 11 Cases, including maintaining strategic control as debtor-in-possession, (ii) the ability of the Company and its subsidiaries to negotiate, develop, confirm and consummate a plan of reorganization, (iii) the effects of the filing of the Bankruptcy Petitions on the Company’s business and the interests of various constituents, (iv) the Court rulings in the Chapter 11 Cases, as well the outcome of all other pending litigation and the outcome of the Chapter 11 Cases in general, (v) the length of time that the Company will operate under Chapter 11 protection and the continued availability of operating capital during the pendency of the Chapter 11 proceedings, (vi) risks associated with third party motions in the Chapter 11 Cases, which may interfere with the Company’s ability to confirm and consummate a plan of reorganization, (vii) the potential adverse effects of the Chapter 11 proceedings on the Company’s liquidity or results of operations, (viii) increased advisory costs to execute the Company’s reorganization, (ix) the impact of a potential NASDAQ suspension of trading and commencement of delisting proceedings on the liquidity and market price of the units representing limited liability company interests of the Company (“units”) and on the Company’s ability to access the public capital markets, (x) the uncertainty that any trading market for units will exist or develop in the over-the-counter markets, and (xi) other risks and uncertainties. These risks and uncertainties could cause actual results to differ materially from those described in the forward-looking statements. For a more detailed discussion of risk factors, please see Part I, Item 1A, “Risk Factors” of the Company’s most recent Annual Report on Form 10-K for more information. The Company assumes no obligation and expressly disclaims any duty to update the information contained herein except as required by law.
Reserve Estimates The SEC permits oil and natural gas companies, in their filings with the SEC, to disclose only proved, probable and possible reserves that meet the SEC’s definitions for such terms. The Company may use terms in this presentation that the SEC’s guidelines strictly prohibit in SEC filings, such as “estimated ultimate recovery” or “EUR,” “Resources,” “LRP Resources,” “net resources,” “total resource potential” and similar terms to estimate oil and natural gas that may ultimately be recovered. These estimates are by their nature more speculative than estimates of proved, probable and possible reserves as used in SEC filings and, accordingly, are subject to substantially greater uncertainty of being actually realized. For illustrative purposes, company estimated producing reserve volumes may be combined in this presentation with undeveloped reserve estimates with no differentiation as to the uncertainty of recovery. These estimates have not been fully risked by management and do not represent an SEC equivalent reserve report. Actual quantities that may be ultimately recovered will likely differ substantially from these estimates. Factors affecting ultimate recovery include the scope of LINN’s actual drilling program, which will be directly affected by the availability of capital, drilling and production costs, commodity prices, availability of drilling services and equipment, lease expirations, transportation constraints, regulatory approvals, field spacing rules, actual recoveries of oil and natural gas in place, length of horizontal laterals, actual drilling results, including geological and mechanical factors affecting recovery rates and other factors. These estimates may change significantly as the development of properties provides additional data. In addition, the forecasted realized oil, natural gas, and NGL prices include estimated forward looking differentials to NYMEX and Henry Hub Indices that may or may not conform to historical trends. Production taxes, such as ad valorem and California carbon allowances are also presented as forward looking Company estimates.
Amortization of contracts assumed through merger: adjustments to GAAP-related items to represent true cash costs Cash payment adjustments – A/P, Reorganization, Ad Val: timing true-up for items that had been previously accrued but not paid Hedge settlements included in unwind proceeds: proceeds from derivatives which settled during the period (prior to cancellation of the contracts) that were included in the net proceeds received on canceled derivatives Income taxes – cash: projected cash taxes LRP: abbreviation of “long range plan” LRP Resource: represents net resource potential for all investment cases scheduled during the five year LRP period. It is a LINN estimate and does not reflect SEC Reserve Reporting guidelines. The LRP Resource has a July 1, 2016 effective date and was based on July 25, 2016 strip pricing estimates. PV-10: represents the present value, discounted at 10% per year, of estimated future net revenues. The Company’s calculation of PV-10 differs from the standardized measure of discounted future net cash flows determined in accordance with the rules and regulations of the SEC. The information used to calculate PV-10 is not derived directly from data determined in accordance with the provisions of applicable accounting standards. The Company’s calculation of PV-10 should not be considered as an alternative to the standardized measure of discounted future net cash flows determined in accordance with the rules and regulations of the SEC. Restructuring, general & administrative expenses: pre-petition expenses related to the restructuring process Reorganization items, net: post-petition expenses related to the restructuring process Taxes, other than income taxes: includes severance taxes, ad valorem (“Ad Val”) taxes, and California carbon allowances (when applicable) UNDEV: represents the estimated recoverable volumes associated with the all investment cases scheduled during the five year LRP period. Select Financial Model Definitions
LINN Stand-Alone
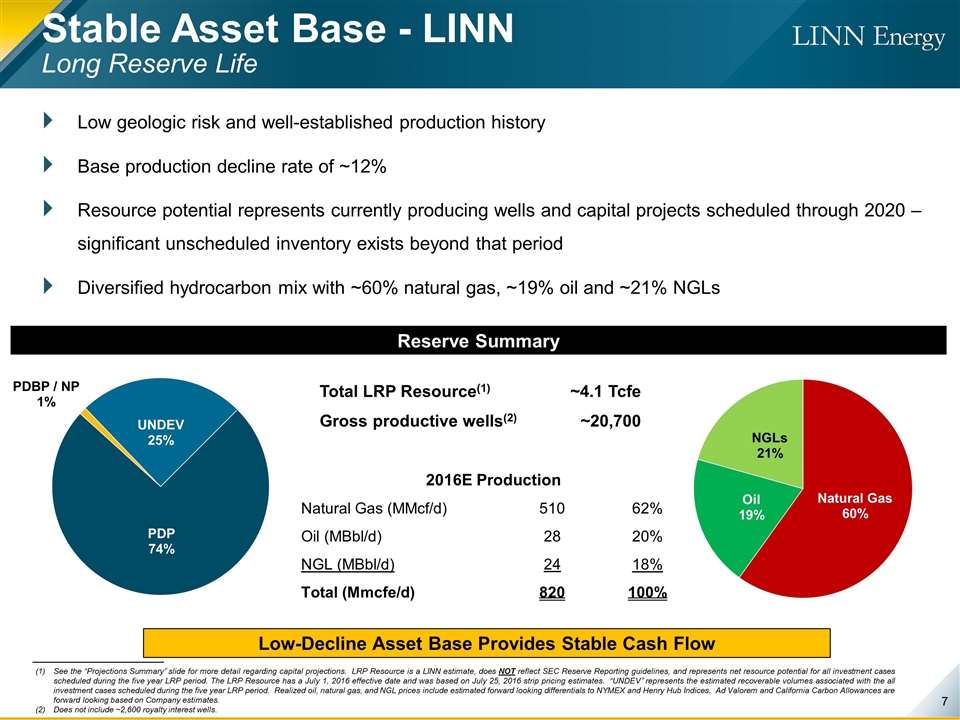
Total LRP Resource(1) ~4.1 Tcfe Gross productive wells(2) ~20,700 Low geologic risk and well-established production history Base production decline rate of ~12% Resource potential represents currently producing wells and capital projects scheduled through 2020 – significant unscheduled inventory exists beyond that period Diversified hydrocarbon mix with ~60% natural gas, ~19% oil and ~21% NGLs Reserve Summary 2016E Production Natural Gas (MMcf/d) 510 62% Oil (MBbl/d) 28 20% NGL (MBbl/d) 24 18% Total (Mmcfe/d) 820 100% Low-Decline Asset Base Provides Stable Cash Flow Stable Asset Base - LINN Long Reserve Life See the “Projections Summary” slide for more detail regarding capital projections. LRP Resource is a LINN estimate, does NOT reflect SEC Reserve Reporting guidelines, and represents net resource potential for all investment cases scheduled during the five year LRP period. The LRP Resource has a July 1, 2016 effective date and was based on July 25, 2016 strip pricing estimates. “UNDEV” represents the estimated recoverable volumes associated with the all investment cases scheduled during the five year LRP period. Realized oil, natural gas, and NGL prices include estimated forward looking differentials to NYMEX and Henry Hub Indices. Ad Valorem and California Carbon Allowances are forward looking based on Company estimates. Does not include ~2,600 royalty interest wells.
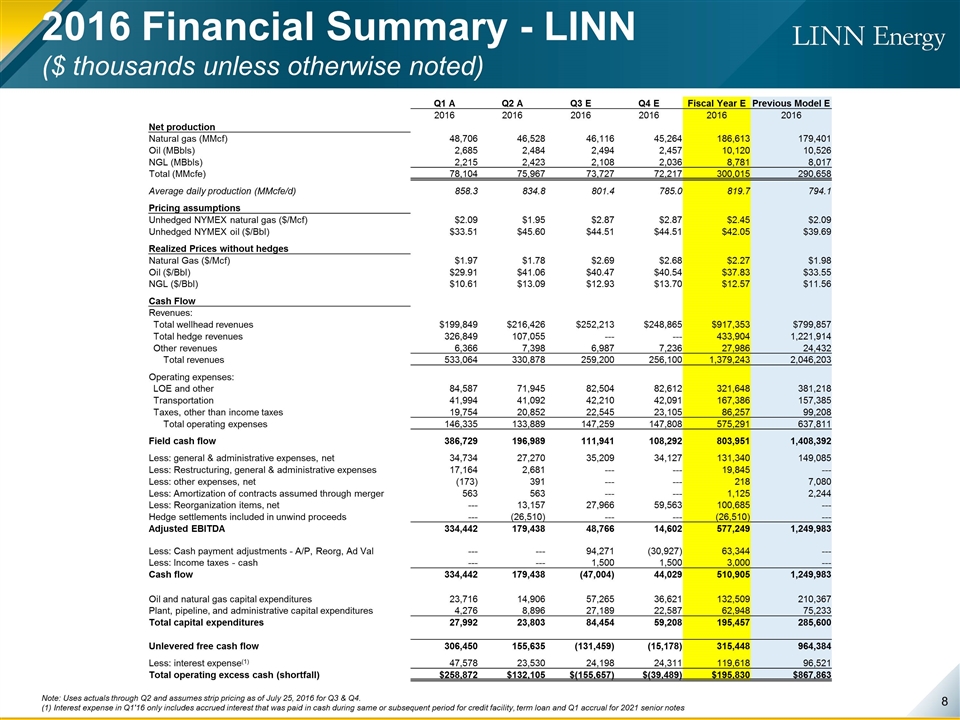
2016 Financial Summary - LINN ($ thousands unless otherwise noted) Note: Uses actuals through Q2 and assumes strip pricing as of July 25, 2016 for Q3 & Q4. (1) Interest expense in Q1'16 only includes accrued interest that was paid in cash during same or subsequent period for credit facility, term loan and Q1 accrual for 2021 senior notes Q1 A Q2 A Q3 E Q4 E Fiscal Year E Previous Model E 2016 2016 2016 2016 2016 2016 Net production Natural gas (MMcf) 48,706 46,528 46,116 45,264 186,613 179,401 Oil (MBbls) 2,685 2,484 2,494 2,457 10,120 10,526 NGL (MBbls) 2,215 2,423 2,108 2,036 8,781 8,017 Total (MMcfe) 78,104 75,967 73,727 72,217 300,015 290,658 Average daily production (MMcfe/d) 858.3 834.8 801.4 785.0 819.7 794.1 Pricing assumptions Unhedged NYMEX natural gas ($/Mcf) $2.09 $1.95 $2.87 $2.87 $2.45 $2.09 Unhedged NYMEX oil ($/Bbl) $33.51 $45.60 $44.51 $44.51 $42.05 $39.69 Realized Prices without hedges Natural Gas ($/Mcf) $1.97 $1.78 $2.69 $2.68 $2.27 $1.98 Oil ($/Bbl) $29.91 $41.06 $40.47 $40.54 $37.83 $33.55 NGL ($/Bbl) $10.61 $13.09 $12.93 $13.70 $12.57 $11.56 Cash Flow Revenues: Total wellhead revenues $199,849 $216,426 $252,213 $248,865 $917,353 $799,857 Total hedge revenues 326,849 107,055 --- --- 433,904 1,221,914 Other revenues 6,366 7,398 6,987 7,236 27,986 24,432 Total revenues 533,064 330,878 259,200 256,100 1,379,243 2,046,203 Operating expenses: LOE and other 84,587 71,945 82,504 82,612 321,648 381,218 Transportation 41,994 41,092 42,210 42,091 167,386 157,385 Taxes, other than income taxes 19,754 20,852 22,545 23,105 86,257 99,208 Total operating expenses 146,335 133,889 147,259 147,808 575,291 637,811 Field cash flow 386,729 196,989 111,941 108,292 803,951 1,408,392 Less: general & administrative expenses, net 34,734 27,270 35,209 34,127 131,340 149,085 Less: Restructuring, general & administrative expenses 17,164 2,681 --- --- 19,845 --- Less: other expenses, net (173) 391 --- --- 218 7,080 Less: Amortization of contracts assumed through merger 563 563 --- --- 1,125 2,244 Less: Reorganization items, net --- 13,157 27,966 59,563 100,685 --- Hedge settlements included in unwind proceeds --- (26,510) --- --- (26,510) --- Adjusted EBITDA 334,442 179,438 48,766 14,602 577,249 1,249,983 Less: Cash payment adjustments - A/P, Reorg, Ad Val --- --- 94,271 (30,927) 63,344 --- Less: Income taxes - cash --- --- 1,500 1,500 3,000 --- Cash flow 334,442 179,438 (47,004) 44,029 510,905 1,249,983 Oil and natural gas capital expenditures 23,716 14,906 57,265 36,621 132,509 210,367 Plant, pipeline, and administrative capital expenditures 4,276 8,896 27,189 22,587 62,948 75,233 Total capital expenditures 27,992 23,803 84,454 59,208 195,457 285,600 Unlevered free cash flow 306,450 155,635 (131,459) (15,178) 315,448 964,384 Less: interest expense(1) 47,578 23,530 24,198 24,311 119,618 96,521 Total operating excess cash (shortfall) $258,872 $132,105 $(155,657) $(39,489) $195,830 $867,863
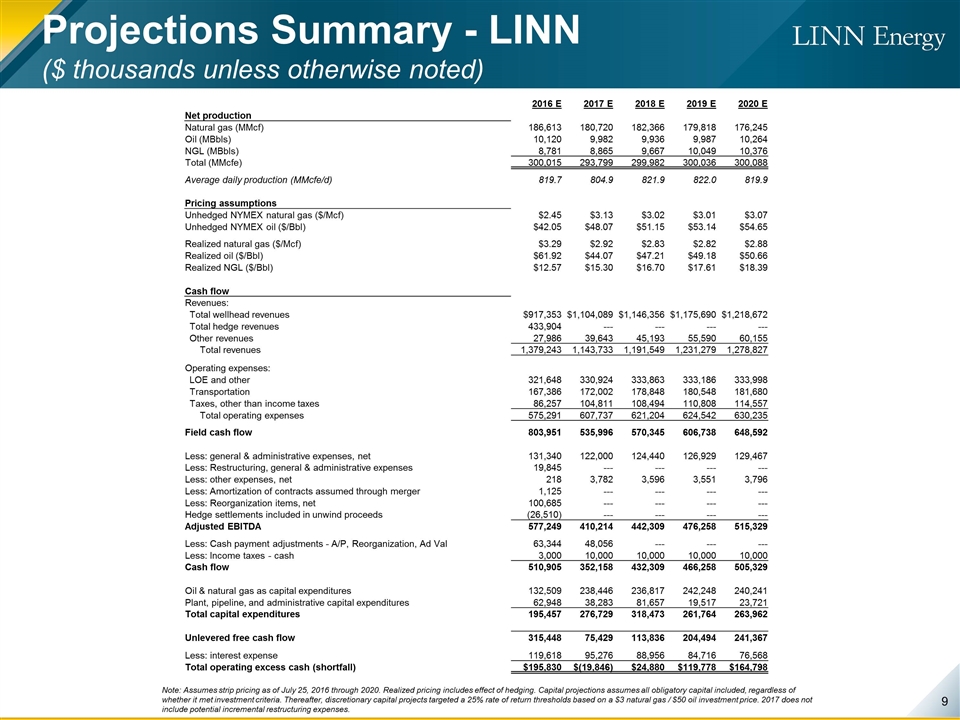
Note: Assumes strip pricing as of July 25, 2016 through 2020. Realized pricing includes effect of hedging. Capital projections assumes all obligatory capital included, regardless of whether it met investment criteria. Thereafter, discretionary capital projects targeted a 25% rate of return thresholds based on a $3 natural gas / $50 oil investment price. 2017 does not include potential incremental restructuring expenses. Projections Summary - LINN ($ thousands unless otherwise noted) 2016 E 2017 E 2018 E 2019 E 2020 E Net production Natural gas (MMcf) 186,613 180,720 182,366 179,818 176,245 Oil (MBbls) 10,120 9,982 9,936 9,987 10,264 NGL (MBbls) 8,781 8,865 9,667 10,049 10,376 Total (MMcfe) 300,015 293,799 299,982 300,036 300,088 Average daily production (MMcfe/d) 819.7 804.9 821.9 822.0 819.9 Pricing assumptions Unhedged NYMEX natural gas ($/Mcf) $2.45 $3.13 $3.02 $3.01 $3.07 Unhedged NYMEX oil ($/Bbl) $42.05 $48.07 $51.15 $53.14 $54.65 Realized natural gas ($/Mcf) $3.29 $2.92 $2.83 $2.82 $2.88 Realized oil ($/Bbl) $61.92 $44.07 $47.21 $49.18 $50.66 Realized NGL ($/Bbl) $12.57 $15.30 $16.70 $17.61 $18.39 Cash flow Revenues: Total wellhead revenues $917,353 $1,104,089 $1,146,356 $1,175,690 $1,218,672 Total hedge revenues 433,904 --- --- --- --- Other revenues 27,986 39,643 45,193 55,590 60,155 Total revenues 1,379,243 1,143,733 1,191,549 1,231,279 1,278,827 Operating expenses: LOE and other 321,648 330,924 333,863 333,186 333,998 Transportation 167,386 172,002 178,848 180,548 181,680 Taxes, other than income taxes 86,257 104,811 108,494 110,808 114,557 Total operating expenses 575,291 607,737 621,204 624,542 630,235 Field cash flow 803,951 535,996 570,345 606,738 648,592 Less: general & administrative expenses, net 131,340 122,000 124,440 126,929 129,467 Less: Restructuring, general & administrative expenses 19,845 --- --- --- --- Less: other expenses, net 218 3,782 3,596 3,551 3,796 Less: Amortization of contracts assumed through merger 1,125 --- --- --- --- Less: Reorganization items, net 100,685 --- --- --- --- Hedge settlements included in unwind proceeds (26,510) --- --- --- --- Adjusted EBITDA 577,249 410,214 442,309 476,258 515,329 Less: Cash payment adjustments - A/P, Reorganization, Ad Val 63,344 48,056 --- --- --- Less: Income taxes - cash 3,000 10,000 10,000 10,000 10,000 Cash flow 510,905 352,158 432,309 466,258 505,329 Oil & natural gas as capital expenditures 132,509 238,446 236,817 242,248 240,241 Plant, pipeline, and administrative capital expenditures 62,948 38,283 81,657 19,517 23,721 Total capital expenditures 195,457 276,729 318,473 261,764 263,962 Unlevered free cash flow 315,448 75,429 113,836 204,494 241,367 Less: interest expense 119,618 95,276 88,956 84,716 76,568 Total operating excess cash (shortfall) $195,830 $(19,846) $24,880 $119,778 $164,798
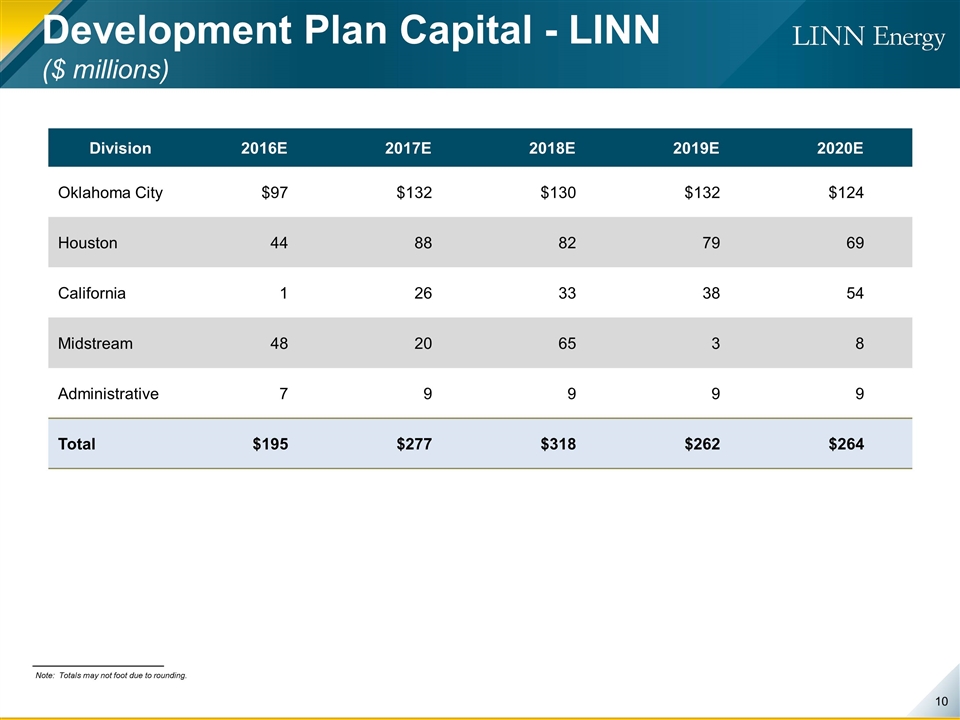
Development Plan Capital - LINN ($ millions) Division 2016E 2017E 2018E 2019E 2020E Oklahoma City $97 $132 $130 $132 $124 Houston 44 88 82 79 69 California 1 26 33 38 54 Midstream 48 20 65 3 8 Administrative 7 9 9 9 9 Total $195 $277 $318 $262 $264 Note: Totals may not foot due to rounding.
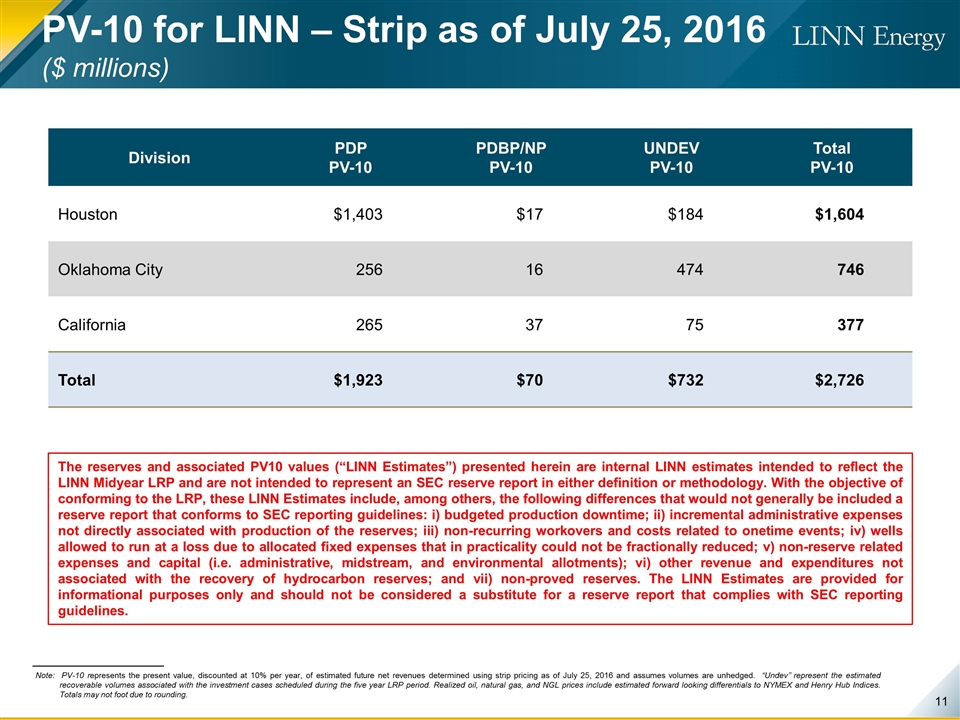
Division PDP PV-10 PDBP/NP PV-10 UNDEV PV-10 Total PV-10 Houston $1,403 $17 $184 $1,604 Oklahoma City 256 16 474 746 California 265 37 75 377 Total $1,923 $70 $732 $2,726 PV-10 for LINN – Strip as of July 25, 2016 ($ millions) Note: PV-10 represents the present value, discounted at 10% per year, of estimated future net revenues determined using strip pricing as of July 25, 2016 and assumes volumes are unhedged. “Undev” represent the estimated recoverable volumes associated with the investment cases scheduled during the five year LRP period. Realized oil, natural gas, and NGL prices include estimated forward looking differentials to NYMEX and Henry Hub Indices. Totals may not foot due to rounding. The reserves and associated PV10 values (“LINN Estimates”) presented herein are internal LINN estimates intended to reflect the LINN Midyear LRP and are not intended to represent an SEC reserve report in either definition or methodology. With the objective of conforming to the LRP, these LINN Estimates include, among others, the following differences that would not generally be included a reserve report that conforms to SEC reporting guidelines: i) budgeted production downtime; ii) incremental administrative expenses not directly associated with production of the reserves; iii) non-recurring workovers and costs related to onetime events; iv) wells allowed to run at a loss due to allocated fixed expenses that in practicality could not be fractionally reduced; v) non-reserve related expenses and capital (i.e. administrative, midstream, and environmental allotments); vi) other revenue and expenditures not associated with the recovery of hydrocarbon reserves; and vii) non-proved reserves. The LINN Estimates are provided for informational purposes only and should not be considered a substitute for a reserve report that complies with SEC reporting guidelines.
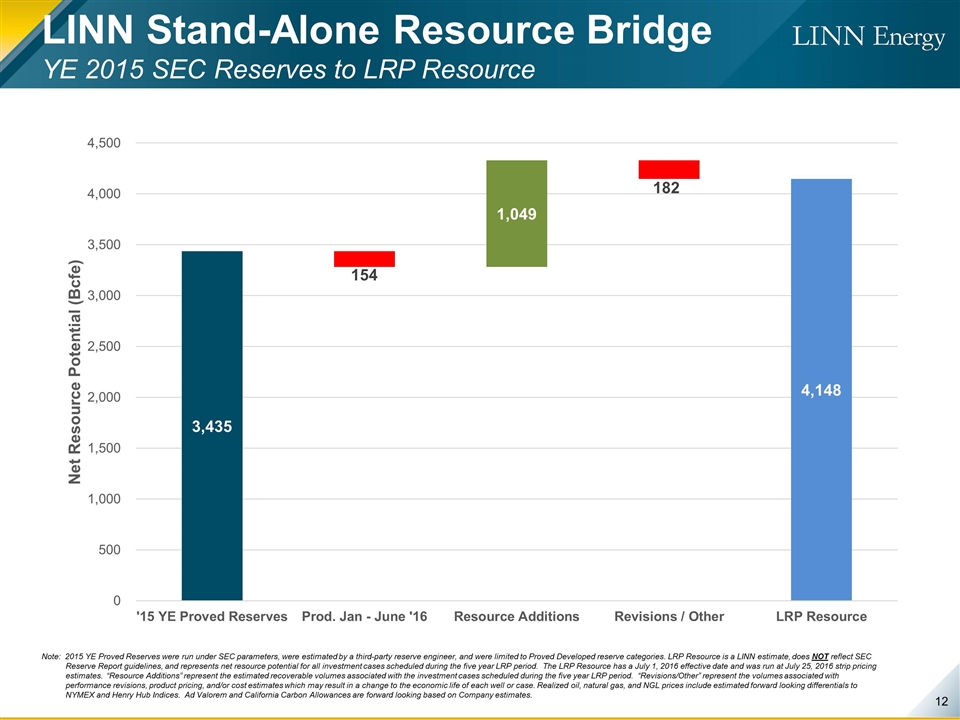
LINN Stand-Alone Resource Bridge YE 2015 SEC Reserves to LRP Resource Note: 2015 YE Proved Reserves were run under SEC parameters, were estimated by a third-party reserve engineer, and were limited to Proved Developed reserve categories. LRP Resource is a LINN estimate, does NOT reflect SEC Reserve Report guidelines, and represents net resource potential for all investment cases scheduled during the five year LRP period. The LRP Resource has a July 1, 2016 effective date and was run at July 25, 2016 strip pricing estimates. “Resource Additions” represent the estimated recoverable volumes associated with the investment cases scheduled during the five year LRP period. “Revisions/Other” represent the volumes associated with performance revisions, product pricing, and/or cost estimates which may result in a change to the economic life of each well or case. Realized oil, natural gas, and NGL prices include estimated forward looking differentials to NYMEX and Henry Hub Indices. Ad Valorem and California Carbon Allowances are forward looking based on Company estimates.

Appendix
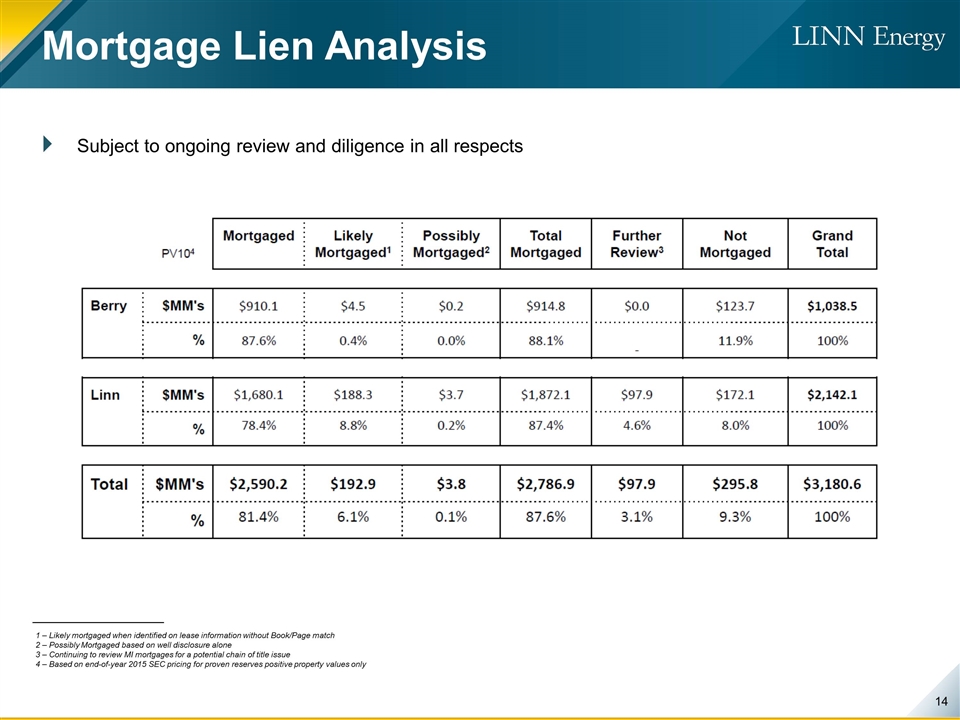
Mortgage Lien Analysis 1 – Likely mortgaged when identified on lease information without Book/Page match 2 – Possibly Mortgaged based on well disclosure alone 3 – Continuing to review MI mortgages for a potential chain of title issue 4 – Based on end-of-year 2015 SEC pricing for proven reserves positive property values only Subject to ongoing review and diligence in all respects
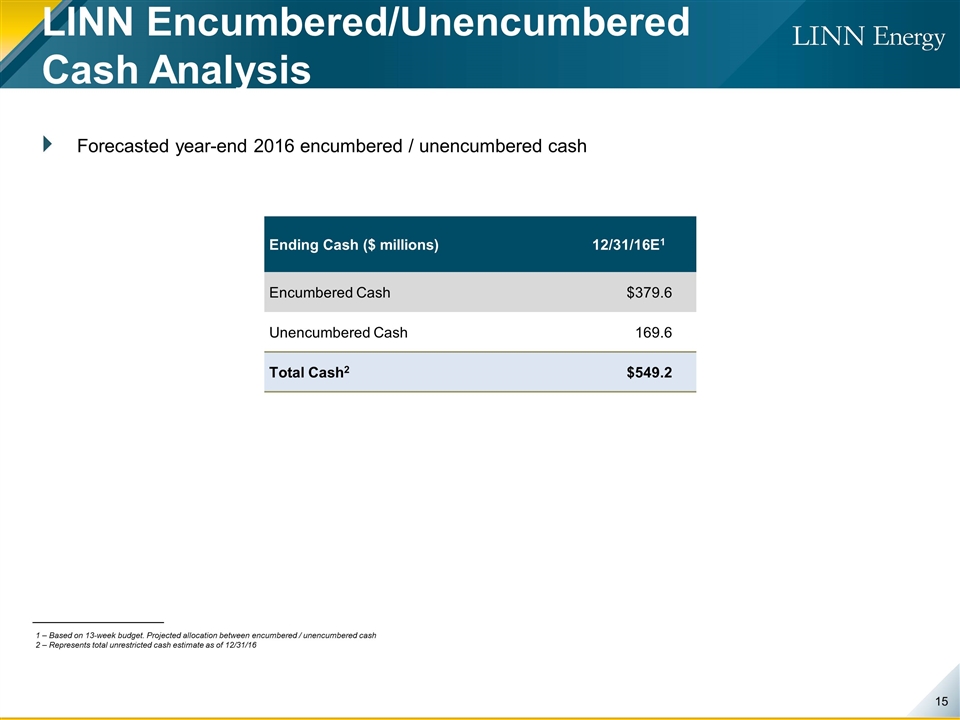
LINN Encumbered/Unencumbered Cash Analysis 1 – Based on 13-week budget. Projected allocation between encumbered / unencumbered cash 2 – Represents total unrestricted cash estimate as of 12/31/16 Forecasted year-end 2016 encumbered / unencumbered cash Ending Cash ($ millions) 12/31/16E1 Encumbered Cash $379.6 Unencumbered Cash 169.6 Total Cash2 $549.2
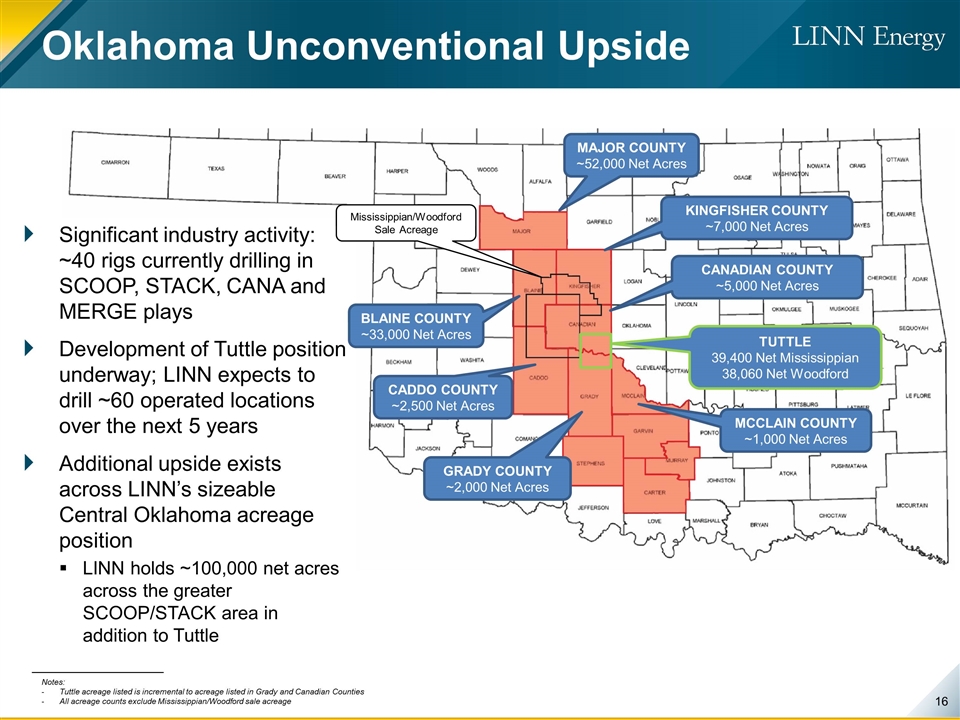
Oklahoma Unconventional Upside MCCLAIN COUNTY ~1,000 Net Acres GRADY COUNTY ~2,000 Net Acres CANADIAN COUNTY ~5,000 Net Acres CADDO COUNTY ~2,500 Net Acres MAJOR COUNTY ~52,000 Net Acres TUTTLE 39,400 Net Mississippian 38,060 Net Woodford Significant industry activity: ~40 rigs currently drilling in SCOOP, STACK, CANA and MERGE plays Development of Tuttle position underway; LINN expects to drill ~60 operated locations over the next 5 years Additional upside exists across LINN’s sizeable Central Oklahoma acreage position LINN holds ~100,000 net acres across the greater SCOOP/STACK area in addition to Tuttle BLAINE COUNTY ~33,000 Net Acres Mississippian/Woodford Sale Acreage KINGFISHER COUNTY ~7,000 Net Acres Notes: Tuttle acreage listed is incremental to acreage listed in Grady and Canadian Counties All acreage counts exclude Mississippian/Woodford sale acreage
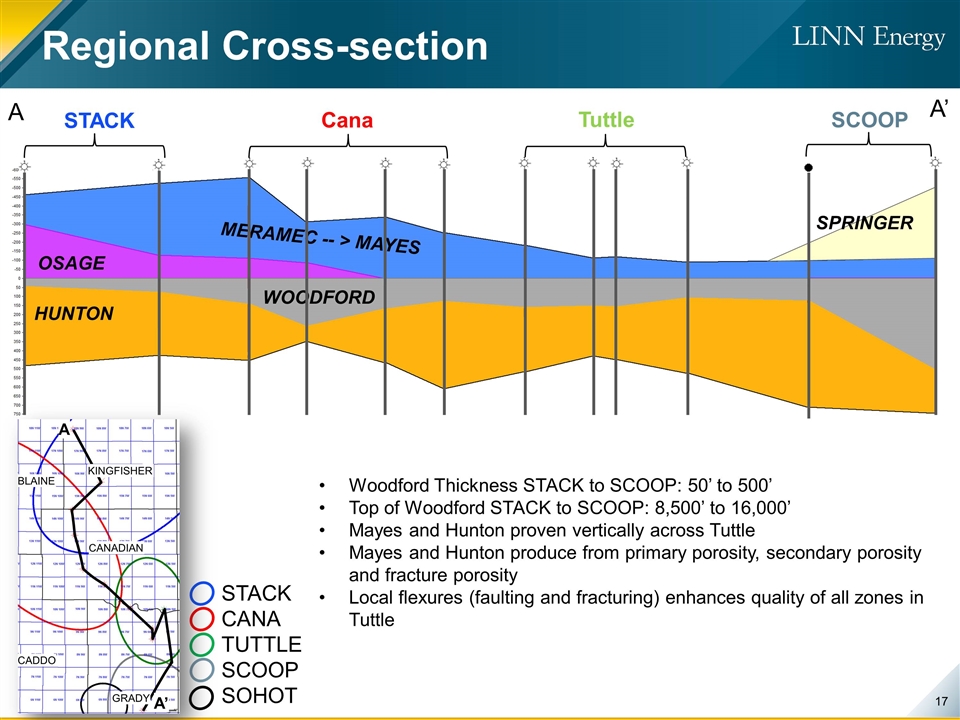
Regional Cross-section A STACK HUNTON Cana Tuttle SCOOP A’ Woodford Thickness STACK to SCOOP: 50’ to 500’ Top of Woodford STACK to SCOOP: 8,500’ to 16,000’ Mayes and Hunton proven vertically across Tuttle Mayes and Hunton produce from primary porosity, secondary porosity and fracture porosity Local flexures (faulting and fracturing) enhances quality of all zones in Tuttle OSAGE STACK CANA TUTTLE SCOOP SOHOT WOODFORD MERAMEC -- > MAYES A A’ KINGFISHER CANADIAN GRADY CADDO BLAINE SPRINGER
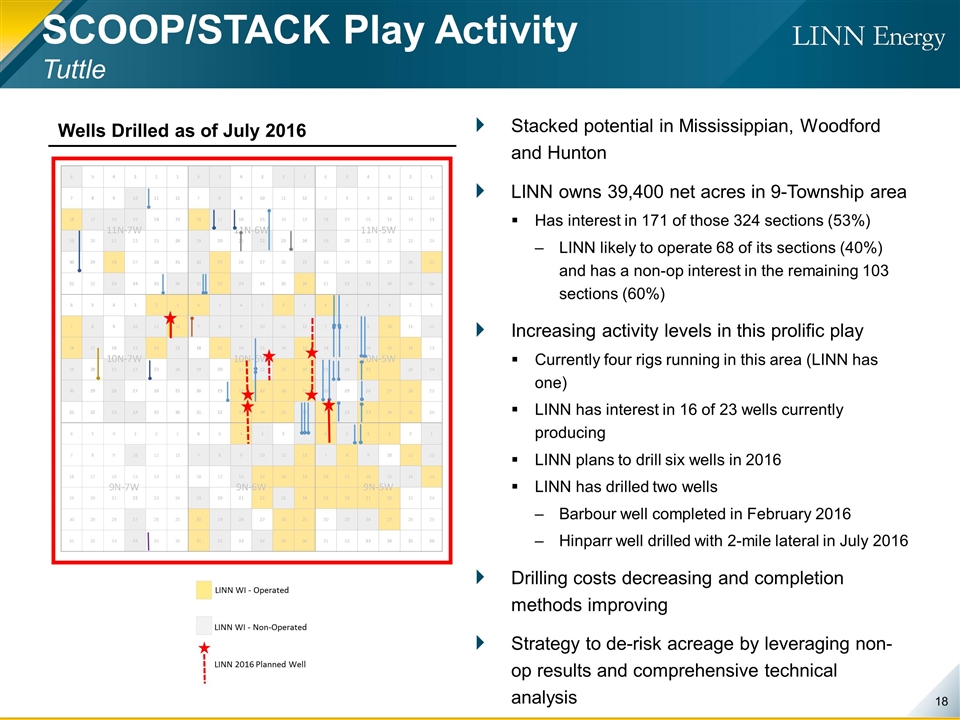
Stacked potential in Mississippian, Woodford and Hunton LINN owns 39,400 net acres in 9-Township area Has interest in 171 of those 324 sections (53%) LINN likely to operate 68 of its sections (40%) and has a non-op interest in the remaining 103 sections (60%) Increasing activity levels in this prolific play Currently four rigs running in this area (LINN has one) LINN has interest in 16 of 23 wells currently producing LINN plans to drill six wells in 2016 LINN has drilled two wells Barbour well completed in February 2016 Hinparr well drilled with 2-mile lateral in July 2016 Drilling costs decreasing and completion methods improving Strategy to de-risk acreage by leveraging non-op results and comprehensive technical analysis SCOOP/STACK Play Activity Tuttle Wells Drilled as of July 2016 LINN WI - Operated LINN WI - Non-Operated LINN 2016 Planned Well

Tuttle Type Well IP- 397 Bopd B- 1.2 De- 79% IP- 3.3 MMcfpd B- 1.2 De- 57% *OK Tax Holiday – 2% for 36 mos. Then reversion to 7.1%

Tuttle Midstream Market Overview Midstream Opportunity Estimated 4+ TCF EUR from Miss/Woodford/Hunton in this 9 Township area Insufficient current takeaway capacity Current gathering systems are generally low-pressure, designed to service older vertical wells Existing plants are designed for 3-4 GPM while Miss/Woodford/Hunton gas is expected to be 6-8 GPM LINN’s Strategic Position Largest leaseholder in the 9 township area (39,400 acres) LINN has experience in operating plants and gathering systems Granite Wash gathering in Texas Panhandle and Jayhawk & Satanta processing plants in Kansas Current Plans Build gathering, compression and processing facilities in phases to accommodate LINN development program Gather all LINN operated horizontal wells and all LINN volumes from non-op wells where feasible Key Issues Economics justified on LINN volumes alone but compete to capture 3rd party volumes to improve returns Plan to spend $42 MM in second half of 2016 with potential of ~$150+ MM total investment Tuttle Midstream Infrastructure LINN 9 section Tuttle Area


