|
Exhibit 99.3 
|
LINN Energy
Supplemental Emergence Presentation
February 28, 2017
LINN Energy
Forward-Looking Statements and Risk Factors
Statements made in these presentation slides and by representatives of LINN Energy (“LINN” or the “Company”) during the course of this presentation that are not historical facts are “forward-looking statements.” These statements are based on certain assumptions and expectations made by the Company, which reflect management’s experience, estimates and perception of historical trends, current conditions, and anticipated future developments. Such statements are subject to a number of assumptions, risks and uncertainties, many of which are beyond the control of the Company, which may cause actual results to differ materially from those implied or anticipated in the forward-looking statements. These include risks relating to financial performance and results, ability to improve our financial results and profitability following emergence from bankruptcy, availability of sufficient cash flow to execute our business plan, continued low or further declining commodity prices and demand for oil, natural gas and natural gas liquids, ability to hedge future production, ability to replace reserves and efficiently develop current reserves, and the regulatory environment and other important factors that could cause actual results to differ materially from those anticipated or implied in the forward-looking statements. These and other important factors could cause actual results to differ materially from those anticipated or implied in the forward-looking statements. Please read “Risk Factors” in the Company’s
Annual Reports on Form10-K, Quarterly Reports on Form10-Q and other public filings. We undertake no obligation to publicly update any forward-looking statements, whether as a result of new information or future events.
LINN Energy
Reserve Estimates
The SEC permits oil and natural gas companies, in their filings with the SEC, to disclose only proved, probable and possible reserves that meet the SEC’s definitions for such terms. The Company may use terms in this presentation that the SEC’s guidelines strictly prohibit in SEC filings, such as “estimated ultimate recovery” or “EUR,” “resources,” “net resources,” “total resource potential” and similar terms to estimate oil and natural gas that may ultimately be recovered. These estimates are by their nature more speculative than estimates of proved, probable and possible reserves as used in SEC filings and, accordingly, are subject to substantially greater uncertainty of being actually realized. These estimates have not been fully risked by management. Actual quantities that may be ultimately recovered will likely differ substantially from these estimates. Factors affecting ultimate recovery include the scope of the Company’s actual drilling program, which will be directly affected by the availability of capital, drilling and production costs, commodity prices, availability of drilling services and equipment, lease expirations, transportation constraints, regulatory approvals, field spacing rules, actual drilling results and recoveries of oil and natural gas in place, and other factors. These estimates may change significantly as the development of properties provides additional data.
PV-10
PV-10 represents the present value, discounted at 10% per year, of estimated future net cash flows. The Company’s calculation of PV-10 herein differs from the standardized measure of discounted future net cash flows determined in accordance with the rules and regulations of the SEC in that it is calculated before income taxes and including the impact of helium, using strip prices as of February 15, 2017, rather than after income taxes and not including the impact of helium, using the average price during the 12-month period, determined as an unweighted average of the first-day-of-the-month price for each month. The Company’s calculation of PV-10 should not be considered as an alternative to the standardized measure of discounted future net cash flows determined in accordance with the rules and regulations of the SEC.
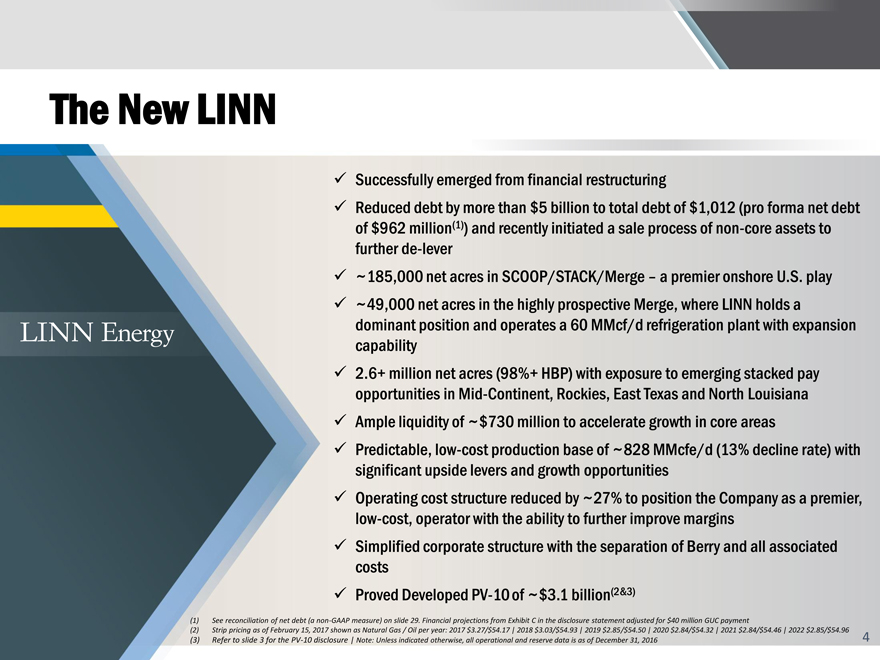
The New LINN
LINN Energy
Successfully emerged from financial restructuring
Reduced debt by more than $5 billion to total debt of $1,012 (pro forma net debt of $962 million(1)) and recently initiated a sale process ofnon-core assets to furtherde-lever
~185,000 net acres in SCOOP/STACK/Merge – a premier onshore U.S. play
~49,000 net acres in the highly prospective Merge, where LINN holds a dominant position and operates a 60 MMcf/d refrigeration plant with expansion capability
2.6+ million net acres (98%+ HBP) with exposure to emerging stacked pay opportunities inMid-Continent, Rockies, East Texas and North Louisiana
Ample liquidity of ~$730 million to accelerate growth in core areas
Predictable,low-cost production base of ~828 MMcfe/d (13% decline rate) with significant upside levers and growth opportunities
Operating cost structure reduced by ~27% to position the Company as a premier,low-cost, operator with the ability to further improve margins
Simplified corporate structure with the separation of Berry and all associated costs
Proved DevelopedPV-10 of ~$3.1 billion(2&3)
(1) See reconciliation of net debt (anon-GAAP measure) on slide 29. Financial projections from Exhibit C in the disclosure statement adjusted for $40 million GUC payment
(2) Strip pricing as of February 15, 2017 shown as Natural Gas / Oil per year: 2017 $3.27/$54.17 | 2018 $3.03/$54.93 | 2019 $2.85/$54.50 | 2020 $2.84/$54.32 | 2021 $2.84/$54.46 | 2022 $2.85/$54.96 (3) Refer to slide 3 for thePV-10 disclosure | Note: Unless indicated otherwise, all operational and reserve data is as of December 31, 2016 4
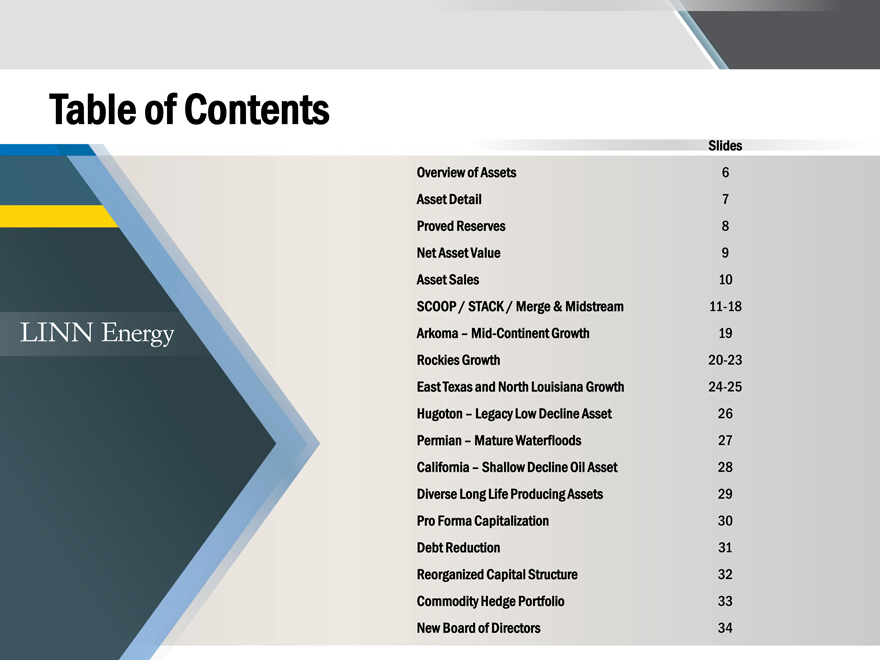
Table of Contents
LINN Energy
Slides Overview of Assets 6 Asset Detail 7 Proved Reserves 8 Net Asset Value 9 Asset Sales 10 SCOOP / STACK / Merge & Midstream11-18 Arkoma –Mid-Continent Growth 19 Rockies Growth20-23 East Texas and North Louisiana Growth24-25 Hugoton – Legacy Low Decline Asset 26 Permian – Mature Waterfloods 27 California – Shallow Decline Oil Asset 28 Diverse Long Life Producing Assets 29 Pro Forma Capitalization 30 Debt Reduction 31 Reorganized Capital Structure 32 Commodity Hedge Portfolio 33 New Board of Directors 34
Overview of LINN’s Assets
LINN Energy
Williston
Michigan
Jonah
Salt Creek
Illinois
Washakie
Uinta
Bluebell Altamont Drunkards Wash
Hugoton
SCOOP STACK Merge
Eastern Oklahoma Waterfloods
Panhandle
California
Permian
Arkoma
East Texas North Louisiana
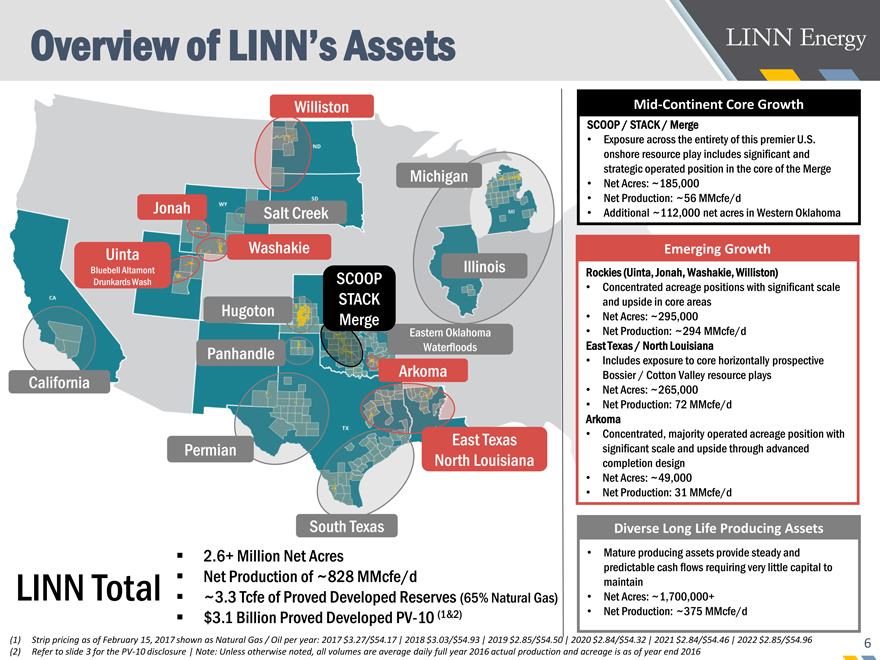
Mid-Continent Core Growth
SCOOP / STACK / Merge
• Exposure across the entirety of this premier U.S. onshore resource play includes significant and strategic operated position in the core of the Merge
• Net Acres: ~185,000
• Net Production: ~56 MMcfe/d
• Additional ~112,000 net acres in Western Oklahoma
Emerging Growth
Rockies (Uinta, Jonah, Washakie, Williston)
• Concentrated acreage positions with significant scale and upside in core areas
• Net Acres: ~295,000
• Net Production: ~294 MMcfe/d East Texas / North Louisiana
• Includes exposure to core horizontally prospective Bossier / Cotton Valley resource plays
• Net Acres: ~265,000
• Net Production: 72 MMcfe/d Arkoma
• Concentrated, majority operated acreage position with significant scale and upside through advanced completion design
• Net Acres: ~49,000
• Net Production: 31 MMcfe/d
Diverse Long Life Producing Assets
• Mature producing assets provide steady and predictable cash flows requiring very little capital to maintain
• Net Acres: ~1,700,000+
• Net Production: ~375 MMcfe/d
South Texas??2.6+ Million Net Acres LINN Total??Net Production of ~828 MMcfe/d
??~3.3 Tcfe of Proved Developed Reserves (65% Natural Gas)??$3.1 Billion Proved DevelopedPV-10 (1&2)
(1) Strip pricing as of February 15, 2017 shown as Natural Gas / Oil per year: 2017 $3.27/$54.17 | 2018 $3.03/$54.93 | 2019 $2.85/$54.50 | 2020 $2.84/$54.32 | 2021 $2.84/$54.46 | 2022 $2.85/$54.96 (2) Refer to slide 3 for thePV-10 disclosure | Note: Unless otherwise noted, all volumes are average daily full year 2016 actual production and acreage is as of year end 2016
LINN Energy
LINN Asset Detail
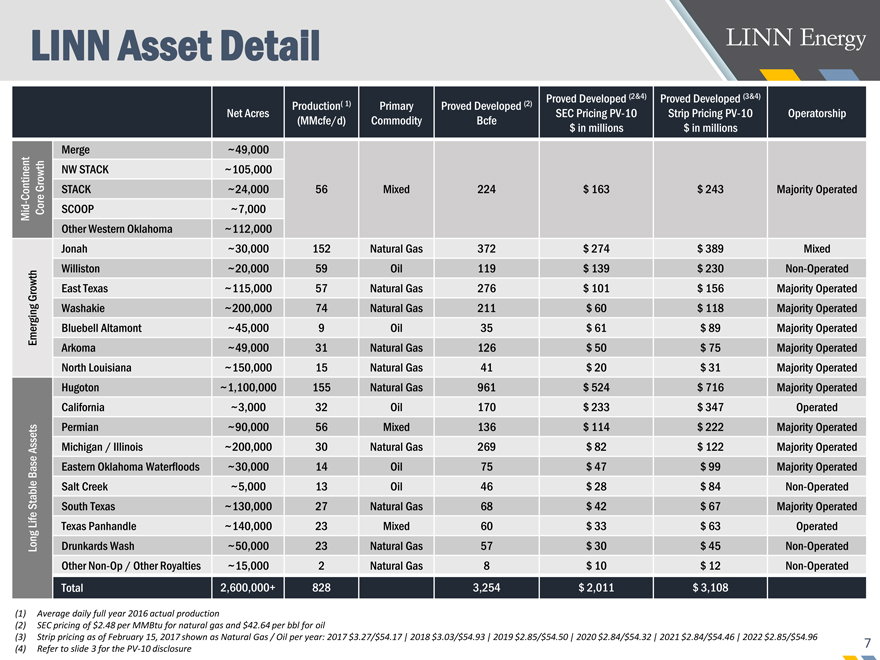
Production( 1) Primary Proved Developed (2) Proved Developed (2&4) Proved Developed (3&4)
Net Acres SEC PricingPV-10 Strip PricingPV-10 Operatorship (MMcfe/d) Commodity Bcfe $ in millions $ in millions Merge ~49,000 Growth NW STACK ~105,000 STACK ~24,000 56 Mixed 224 $ 163 $ 243 Majority Operated Continent Mid—Core SCOOP ~7,000 Other Western Oklahoma ~112,000 Jonah ~30,000 152 Natural Gas 372 $ 274 $ 389 Mixed Williston ~20,000 59 Oil 119 $ 139 $ 230Non-Operated Growth East Texas ~115,000 57 Natural Gas 276 $ 101 $ 156 Majority Operated Washakie ~200,000 74 Natural Gas 211 $ 60 $ 118 Majority Operated Emerging Bluebell Altamont ~45,000 9 Oil 35 $ 61 $ 89 Majority Operated Arkoma ~49,000 31 Natural Gas 126 $ 50 $ 75 Majority Operated North Louisiana ~150,000 15 Natural Gas 41 $ 20 $ 31 Majority Operated Hugoton ~1,100,000 155 Natural Gas 961 $ 524 $ 716 Majority Operated California ~3,000 32 Oil 170 $ 233 $ 347 Operated Permian ~90,000 56 Mixed 136 $ 114 $ 222 Majority Operated Assets Michigan / Illinois ~200,000 30 Natural Gas 269 $ 82 $ 122 Majority Operated Base Eastern Oklahoma Waterfloods ~30,000 14 Oil 75 $ 47 $ 99 Majority Operated Stable Salt Creek ~5,000 13 Oil 46 $ 28 $ 84Non-Operated South Texas ~130,000 27 Natural Gas 68 $ 42 $ 67 Majority Operated Life Texas Panhandle ~140,000 23 Mixed 60 $ 33 $ 63 Operated Long Drunkards Wash ~50,000 23 Natural Gas 57 $ 30 $ 45Non-Operated OtherNon-Op / Other Royalties ~15,000 2 Natural Gas 8 $ 10 $ 12Non-Operated Total 2,600,000+ 828 3,254 $ 2,011 $ 3,108
(1) Average daily full year 2016 actual production
(2) SEC pricing of $2.48 per MMBtu for natural gas and $42.64 per bbl for oil
(3) Strip pricing as of February 15, 2017 shown as Natural Gas / Oil per year: 2017 $3.27/$54.17 | 2018 $3.03/$54.93 | 2019 $2.85/$54.50 | 2020 $2.84/$54.32 | 2021 $2.84/$54.46 | 2022 $2.85/$54.96 (4) Refer to slide 3 for thePV-10 disclosure
Proved Reserves
LINN Energy
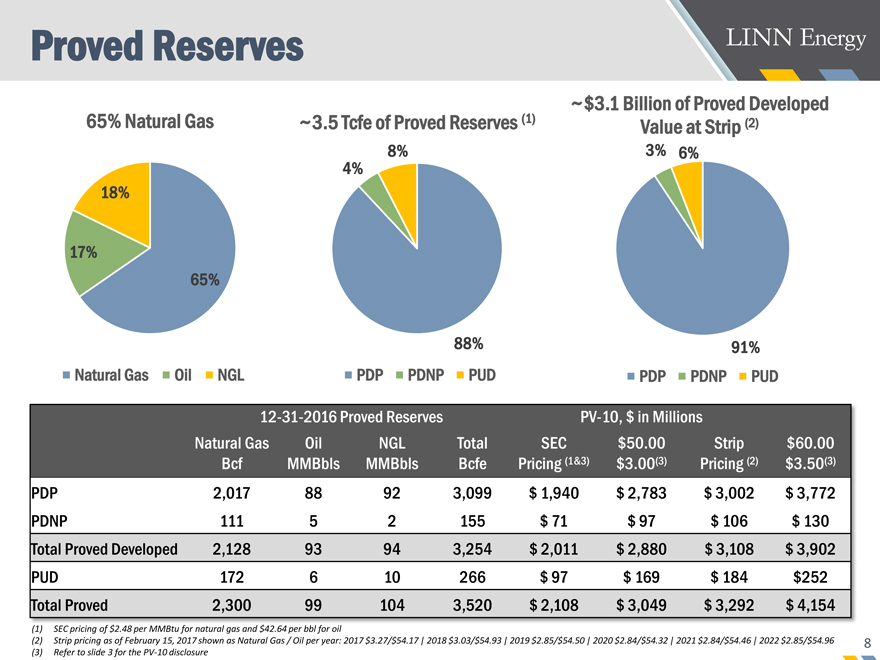
(1) ~$3.1 Billion of Proved Developed 65% Natural Gas ~3.5 Tcfe of Proved Reserves Value at Strip (2)
8% 3% 6% 4% 18%
17%
65%
88% 91% Natural Gas Oil NGL PDP PDNP PUD PDP PDNP PUD
12-31-2016 Proved ReservesPV-10, $ in Millions
Natural Gas Oil NGL Total SEC $50.00 Strip $60.00 Bcf MMBbls MMBbls Bcfe Pricing (1&3) $3.00(3) Pricing (2) $3.50(3) PDP 2,017 88 92 3,099 $ 1,940 $ 2,783 $ 3,002 $ 3,772 PDNP 111 5 2 155 $ 71 $ 97 $ 106 $ 130 Total Proved Developed 2,128 93 94 3,254 $ 2,011 $ 2,880 $ 3,108 $ 3,902 PUD 172 6 10 266 $ 97 $ 169 $ 184 $252 Total Proved 2,300 99 104 3,520 $ 2,108 $ 3,049 $ 3,292 $ 4,154
(1) SEC pricing of $2.48 per MMBtu for natural gas and $42.64 per bbl for oil
(2) Strip pricing as of February 15, 2017 shown as Natural Gas / Oil per year: 2017 $3.27/$54.17 | 2018 $3.03/$54.93 | 2019 $2.85/$54.50 | 2020 $2.84/$54.32 | 2021 $2.84/$54.46 | 2022 $2.85/$54.96 (3) Refer to slide 3 for thePV-10 disclosure
LINN Energy
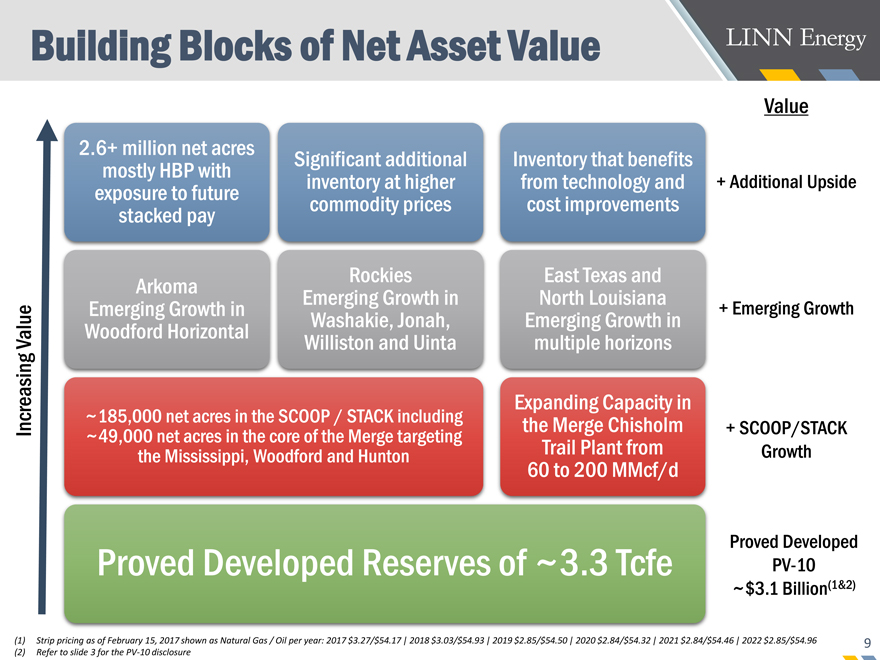
Building Blocks of Net Asset Value
Value
2.6+ million net acres
Significant additional Inventory that benefits mostly HBP with inventory at higher from technology and + Additional Upside exposure to future commodity prices cost improvements stacked pay
Rockies East Texas and Arkoma
Emerging Growth in North Louisiana
Emerging Growth in + Emerging Growth Washakie, Jonah, Emerging Growth in Value Woodford Horizontal Williston and Uinta multiple horizons
Expanding Capacity in
~185,000 net acres in the SCOOP / STACK including the Merge Chisholm
Increasing ~49,000 net acres in the core of the Merge targeting Trail Plant from + SCOOP/STACK the Mississippi, Woodford and Hunton Growth
60 to 200 MMcf/d
Proved Developed
Proved Developed Reserves of ~3.3 TcfePV-10
~$3.1 Billion(1&2)
(1) Strip pricing as of February 15, 2017 shown as Natural Gas / Oil per year: 2017 $3.27/$54.17 | 2018 $3.03/$54.93 | 2019 $2.85/$54.50 | 2020 $2.84/$54.32 | 2021 $2.84/$54.46 | 2022 $2.85/$54.96 (2) Refer to slide 3 for thePV-10 disclosure
LINN Energy
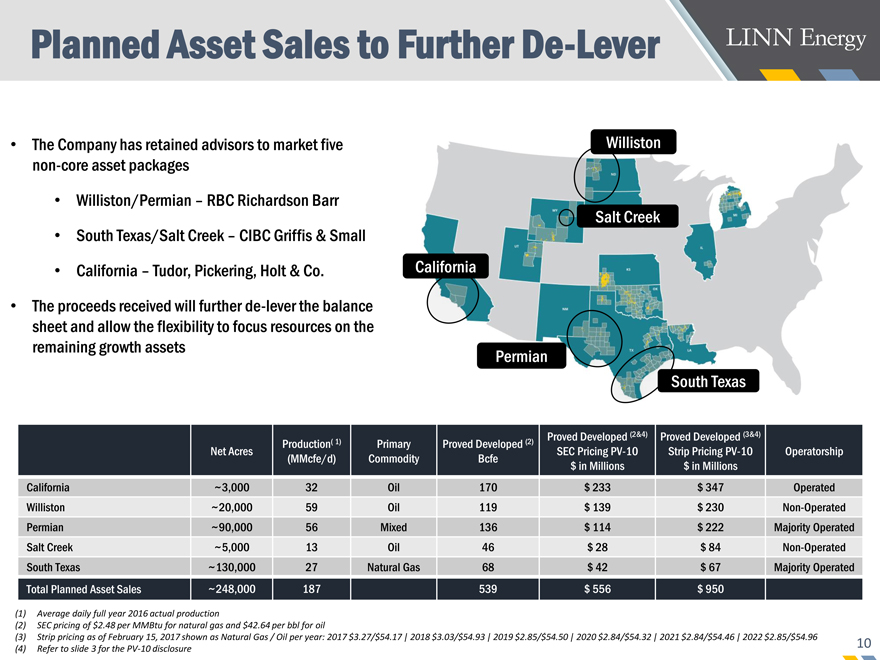
Planned Asset Sales to FurtherDe-Lever
• The Company has retained advisors to market five Willistonnon-core asset packages
• Williston/Permian – RBC Richardson Barr
Salt Creek
• South Texas/Salt Creek – CIBC Griffis & Small
• California – Tudor, Pickering, Holt & Co. California
• The proceeds received will furtherde-lever the balance sheet and allow the flexibility to focus resources on the remaining growth assets
Permian
South Texas
Production( 1) Primary Proved Developed (2) Proved Developed (2&4) Proved Developed (3&4)
Net Acres SEC PricingPV-10 Strip PricingPV-10 Operatorship (MMcfe/d) Commodity Bcfe $ in Millions $ in Millions California ~3,000 32 Oil 170 $ 233 $ 347 Operated Williston ~20,000 59 Oil 119 $ 139 $ 230Non-Operated Permian ~90,000 56 Mixed 136 $ 114 $ 222 Majority Operated Salt Creek ~5,000 13 Oil 46 $ 28 $ 84Non-Operated South Texas ~130,000 27 Natural Gas 68 $ 42 $ 67 Majority Operated Total Planned Asset Sales ~248,000 187 539 $ 556 $ 950
(1) Average daily full year 2016 actual production
(2) SEC pricing of $2.48 per MMBtu for natural gas and $42.64 per bbl for oil
(3) Strip pricing as of February 15, 2017 shown as Natural Gas / Oil per year: 2017 $3.27/$54.17 | 2018 $3.03/$54.93 | 2019 $2.85/$54.50 | 2020 $2.84/$54.32 | 2021 $2.84/$54.46 | 2022 $2.85/$54.96 (4) Refer to slide 3 for thePV-10 disclosure
Linn energy
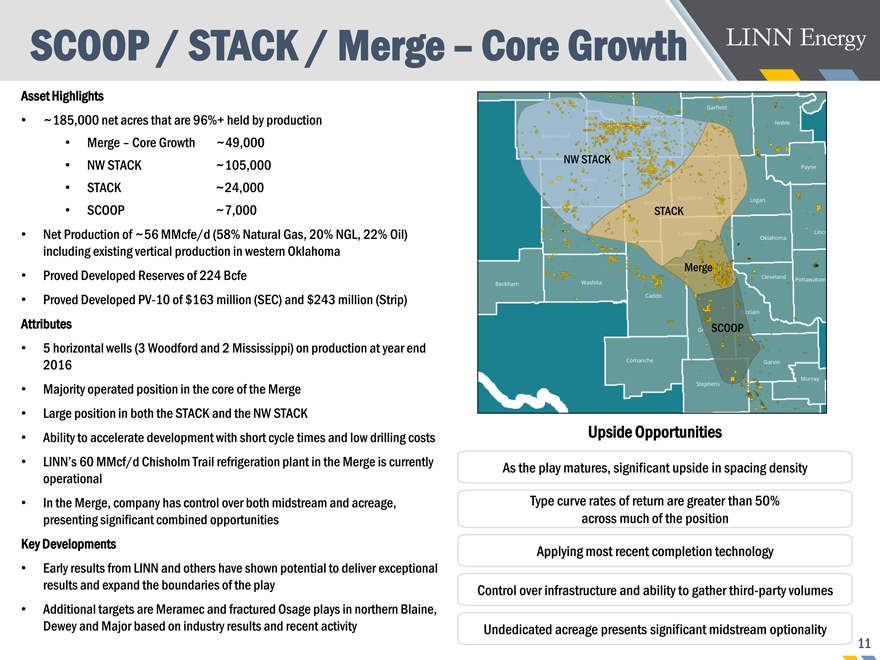
SCOOP / STACK / Merge – Core Growth
Asset Highlights
• ~185,000 net acres that are 96%+ held by production
• Merge – Core Growth ~49,000
• NW STACK ~105,000 NW STACK
• STACK ~24,000
• SCOOP ~7,000 STACK
• Net Production of ~56 MMcfe/d (58% Natural Gas, 20% NGL, 22% Oil) including existing vertical production in western Oklahoma
Merge
• Proved Developed Reserves of 224 Bcfe
• Proved DevelopedPV-10 of $163 million (SEC) and $243 million (Strip)
Attributes SCOOP
• 5 horizontal wells (3 Woodford and 2 Mississippi) on production at year end 2016
• Majority operated position in the core of the Merge
• Large position in both the STACK and the NW STACK
• Ability to accelerate development with short cycle times and low drilling costs Upside Opportunities
• LINN’s 60 MMcf/d Chisholm Trail refrigeration plant in the Merge is currently As the play matures, significant upside in spacing density operational
• In the Merge, company has control over both midstream and acreage, Type curve rates of return are greater than 50% presenting significant combined opportunities across much of the position Key Developments
Applying most recent completion technology
• Early results from LINN and others have shown potential to deliver exceptional results and expand the boundaries of the play Control over infrastructure and ability to gather third-party volumes
• Additional targets are Meramec and fractured Osage plays in northern Blaine,
Dewey and Major based on industry results and recent activity Undedicated acreage presents significant midstream optionality
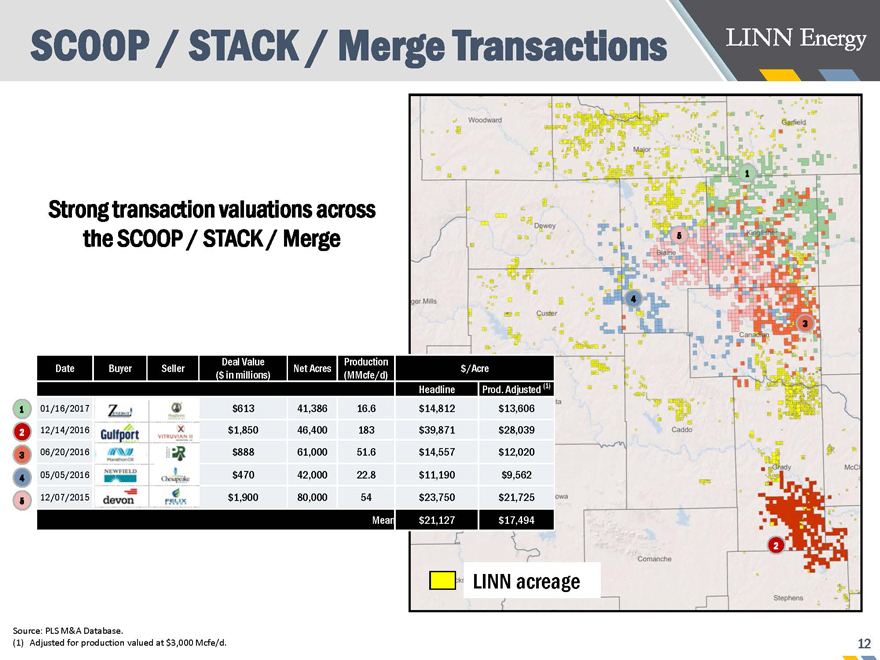
SCOOP / STACK / Merge Transactions
1
Strong transaction valuations across
the SCOOP / STACK / Merge 5
4
3
Deal Value Production
Date Buyer Seller Net Acres $/Acre
($ in millions) (MMcfe/d)
Headline Prod. Adjusted (1)
1 01/16/2017 $613 41,386 16.6 $14,812 $13,606
2 12/14/2016 $1,850 46,400 183 $39,871 $28,039
3 06/20/2016 $888 61,000 51.6 $14,557 $12,020
4 05/05/2016 $470 42,000 22.8 $11,190 $9,562
5 12/07/2015 $1,900 80,000 54 $23,750 $21,725
Mean $21,127 $17,494
2
LINN acreage
Source: PLS M&A Database.
(1) Adjusted for production valued at $3,000 Mcfe/d. 12
Linn energy
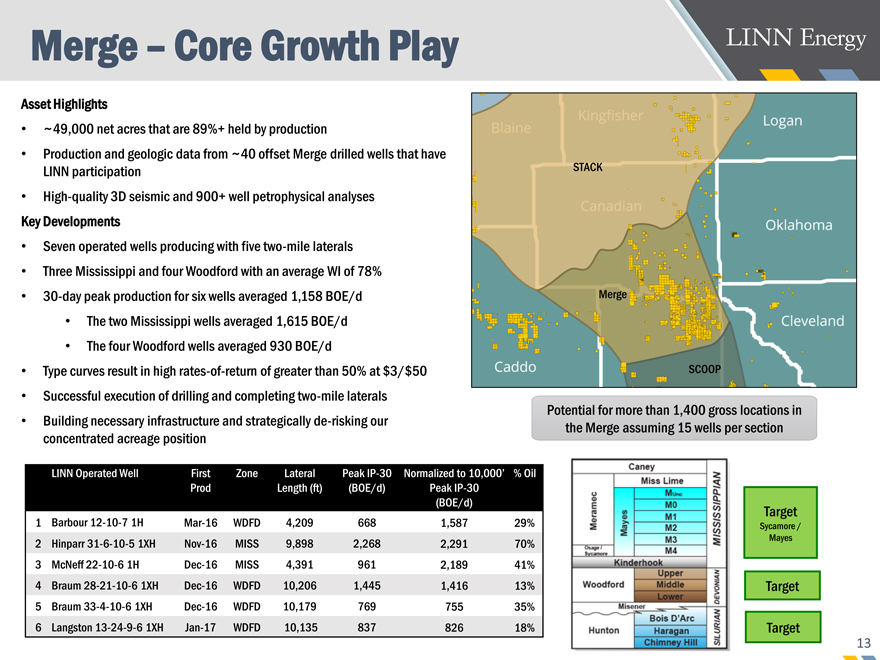
Merge – Core Growth Play
Asset Highlights
• ~49,000 net acres that are 89%+ held by production
• Production and geologic data from ~40 offset Merge drilled wells that have
LINN participation STACK
• High-quality 3D seismic and 900+ well petrophysical analyses Key Developments
• Seven operated wells producing with fivetwo-mile laterals
• Three Mississippi and four Woodford with an average WI of 78%
•30-day peak production for six wells averaged 1,158 BOE/d Merge
• The two Mississippi wells averaged 1,615 BOE/d
• The four Woodford wells averaged 930 BOE/d
• Type curves result in highrates-of-return of greater than 50% at $3/$50 SCOOP
• Successful execution of drilling and completingtwo-mile laterals
Potential for more than 1,400 gross locations in
• Building necessary infrastructure and strategicallyde-risking our the Merge assuming 15 wells per section concentrated acreage position
LINN Operated Well First Zone Lateral PeakIP-30 Normalized to 10,000’ % Oil Prod Length (ft) (BOE/d) PeakIP-30 (BOE/d)
Target
1 Barbour12-10-7 1HMar-16 WDFD 4,209 668 1,587 29% Sycamore / Mayes
2 Hinparr31-6-10-5 1XHNov-16 MISS 9,898 2,268 2,291 70%
3 McNeff22-10-6 1HDec-16 MISS 4,391 961 2,189 41%
4 Braum28-21-10-6 1XHDec-16 WDFD 10,206 1,445 1,416 13% Target
5 Braum33-4-10-6 1XHDec-16 WDFD 10,179 769 755 35%
6 Langston13-24-9-6 1XHJan-17 WDFD 10,135 837 826 18% Target
Linn energy
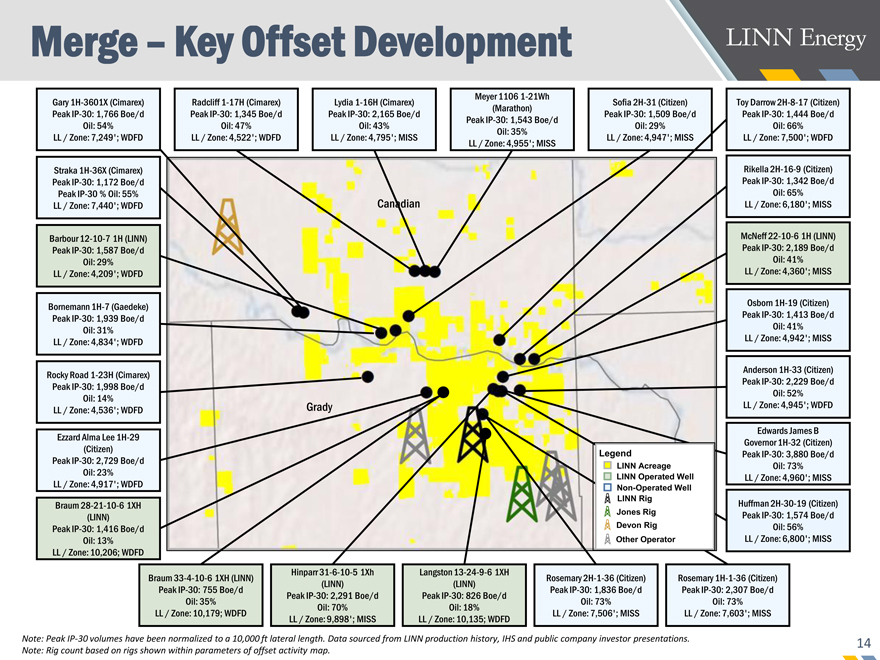
South Texa Merge – Key Offset Development
Meyer 11061-21Wh
Gary1H-3601X (Cimarex) Radcliff1-17H (Cimarex) Lydia1-16H (Cimarex) Sofia2H-31 (Citizen) Toy Darrow2H-8-17 (Citizen) (Marathon) PeakIP-30: 1,766 Boe/d PeakIP-30: 1,345 Boe/d PeakIP-30: 2,165 Boe/d PeakIP-30: 1,509 Boe/d PeakIP-30: 1,444 Boe/d PeakIP-30: 1,543 Boe/d Oil: 54% Oil: 47% Oil: 43% Oil: 29% Oil: 66% Oil: 35% LL / Zone: 7,249’; WDFD LL / Zone: 4,522’; WDFD LL / Zone: 4,795’; MISS LL / Zone: 4,947’; MISS LL / Zone: 7,500’; WDFD
LL / Zone: 4,955’; MISS
Straka1H-36X (Cimarex) Rikella2H-16-9 (Citizen) PeakIP-30: 1,172 Boe/d PeakIP-30: 1,342 Boe/d PeakIP-30 % Oil: 55% Oil: 65% LL / Zone: 7,440’; WDFD Canadian LL / Zone: 6,180’; MISS
Barbour12-10-7 1H (LINN) McNeff22-10-6 1H (LINN) PeakIP-30: 1,587 Boe/d PeakIP-30: 2,189 Boe/d Oil: 29% Oil: 41% LL / Zone: 4,209’; WDFD LL / Zone: 4,360’; MISS
Bornemann1H-7 (Gaedeke) Osborn1H-19 (Citizen) PeakIP-30: 1,939 Boe/d PeakIP-30: 1,413 Boe/d Oil: 31% Oil: 41% LL / Zone: 4,834’; WDFD LL / Zone: 4,942’; MISS
Anderson1H-33 (Citizen) Rocky Road1-23H (Cimarex) PeakIP-30: 2,229 Boe/d PeakIP-30: 1,998 Boe/d Oil: 52% Oil: 14% Grady LL / Zone: 4,945’; WDFD
LL / Zone: 4,536’; WDFD
Edwards James B Ezzard Alma Lee1H-29 Governor1H-32 (Citizen) (Citizen) Legend PeakIP-30: 3,880 Boe/d PeakIP-30: 2,729 Boe/d
LINN Acreage Oil: 73% Oil: 23%
LINN Operated Well LL / Zone: 4,960’; MISS LL / Zone: 4,917’; WDFDNon-Operated Well LINN Rig Huffman2H-30-19 (Citizen) Braum28-21-10-6 1XH
Jones Rig PeakIP-30: 1,574 Boe/d (LINN) Devon Rig
PeakIP-30: 1,416 Boe/d Oil: 56%
Oil: 13% Other Operator LL / Zone: 6,800’; MISS LL / Zone: 10,206; WDFD
Hinparr31-6-10-5 1Xh Langston13-24-9-6 1XH
Braum33-4-10-6 1XH (LINN) Rosemary2H-1-36 (Citizen) Rosemary1H-1-36 (Citizen) (LINN) (LINN) PeakIP-30: 755 Boe/d PeakIP-30: 1,836 Boe/d PeakIP-30: 2,307 Boe/d PeakIP-30: 2,291 Boe/d PeakIP-30: 826 Boe/d Oil: 35% Oil: 73% Oil: 73% Oil: 70% Oil: 18% LL / Zone: 10,179; WDFD LL / Zone: 7,506’; MISS LL / Zone: 7,603’; MISS
LL / Zone: 9,898’; MISS LL / Zone: 10,135; WDFD
ote: PeakIP-30 volumes have been normalized to a 10,000 ft lateral length. Data sourced from LINN production history, IHS and public company investor presentations. ote: Rig count based on rigs shown within parameters of offset activity map.
s
linn energy
15
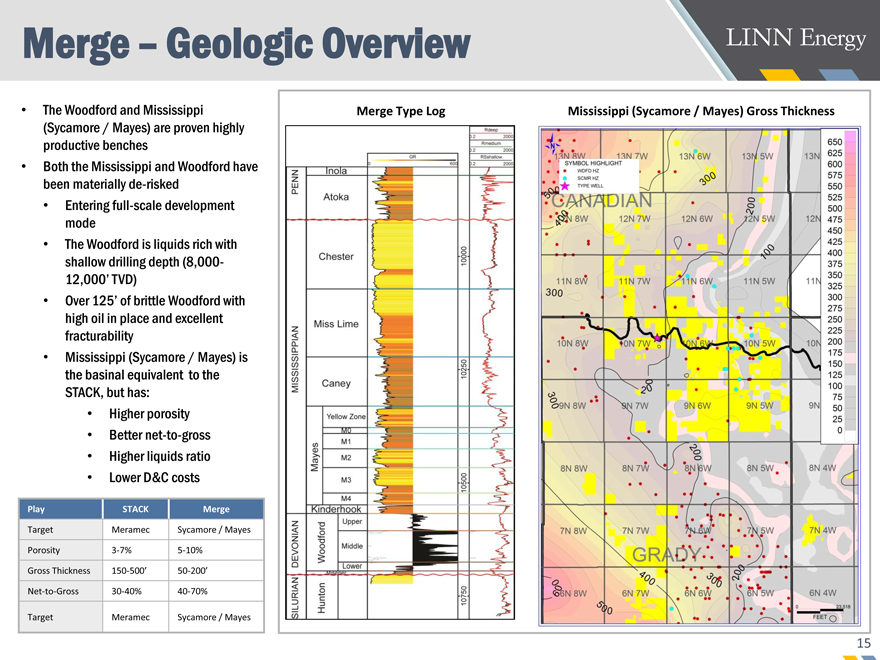
Merge – Geologic Overview
Merge Type Log Mississippi (Sycamore / Mayes) Gross Thickness
Play STACK Merge
Target Meramec Sycamore / Mayes
Porosity3-7%5-10%
Gross Thickness150-500’50-200’
Net-to-Gross30-40%40-70%
Target Meramec Sycamore / Mayes
• The Woodford and Mississippi
(Sycamore / Mayes) are proven highly
productive benches
• Both the Mississippi and Woodford have
been materiallyde-risked
• Entering full-scale development
mode
• The Woodford is liquids rich with
shallow drilling depth (8,000-
12,000’ TVD)
• Over 125’ of brittle Woodford with
high oil in place and excellent
fracturability
• Mississippi (Sycamore / Mayes) is
the basinal equivalent to the
STACK, but has:
• Higher porosity
• Betternet-to-gross
• Higher liquids ratio
• Lower D&C costs
Braums (2)
Doris
McNeff
Hinparr
Jackson
Dream Cooler
Langston
Jesse Chisholm
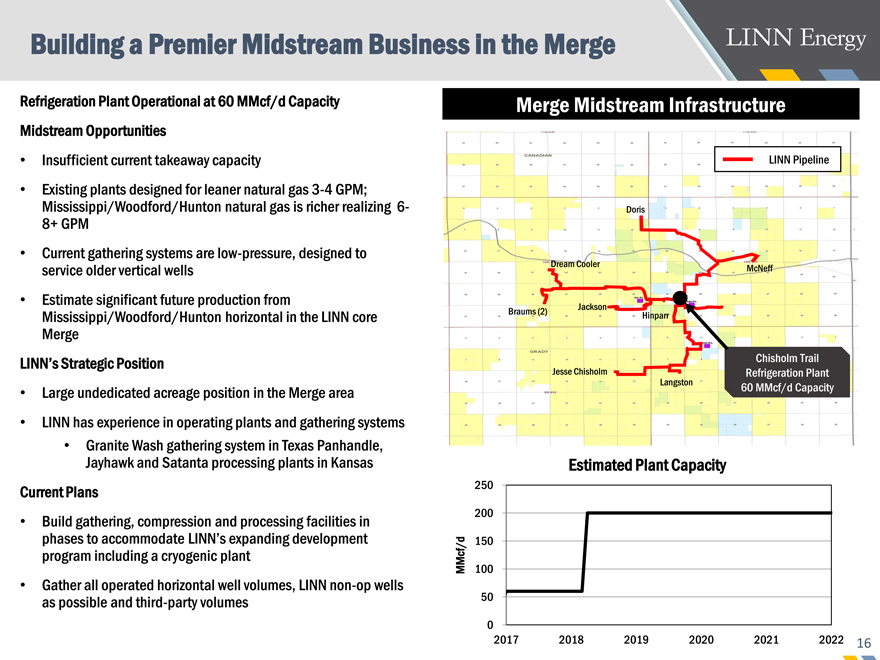
Refrigeration Plant Operational at 60 MMcf/d Capacity
Midstream Opportunities
• Insufficient current takeaway capacity
• Existing plants designed for leaner natural gas3-4 GPM;
Mississippi/Woodford/Hunton natural gas is richer realizing 6-
8+ GPM
• Current gathering systems arelow-pressure, designed to
service older vertical wells
• Estimate significant future production from
Mississippi/Woodford/Hunton horizontal in the LINN core
Merge
LINN’s Strategic Position
• Large undedicated acreage position in the Merge area
• LINN has experience in operating plants and gathering systems
• Granite Wash gathering system in Texas Panhandle,
Jayhawk and Satanta processing plants in Kansas
Current Plans
• Build gathering, compression and processing facilities in
phases to accommodate LINN’s expanding development
program including a cryogenic plant
• Gather all operated horizontal well volumes, LINNnon-op wells
as possible and third-party volumes
16
Building a Premier Midstream Business in the Merge
0
50
100
150
200
250
2017 2018 2019 2020 2021 2022
MMcf/d
Estimated Plant Capacity
Merge Midstream Infrastructure
Chisholm Trail
Refrigeration Plant
60 MMcf/d Capacity
LINN Pipeline
17
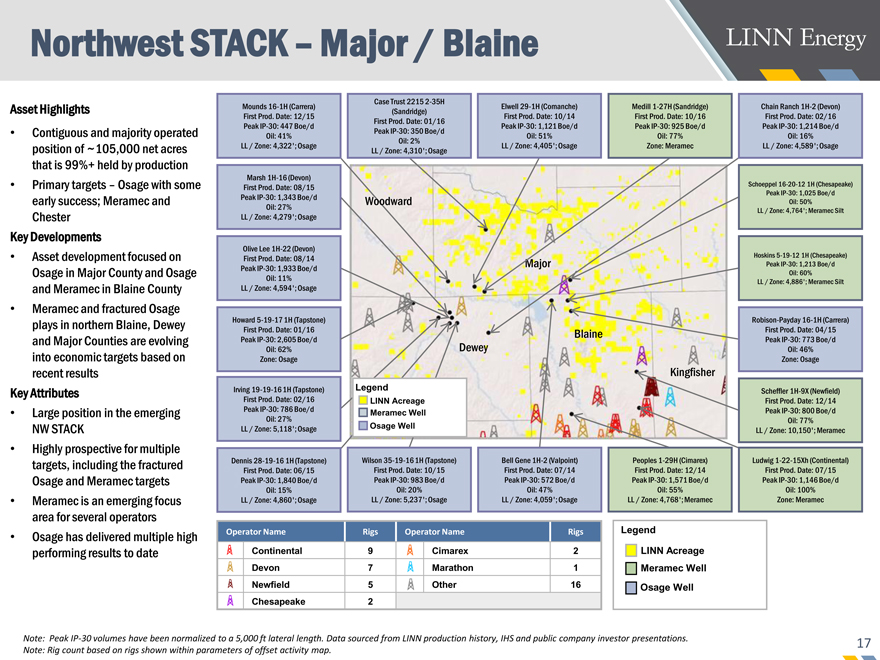
Northwest STACK – Major / Blaine
Asset Highlights
• Contiguous and majority operated
position of ~105,000 net acres
that is 99%+ held by production
• Primary targets – Osage with some
early success; Meramec and
Chester
Key Developments
• Asset development focused on
Osage in Major County and Osage
and Meramec in Blaine County
• Meramec and fractured Osage
plays in northern Blaine, Dewey
and Major Counties are evolving
into economic targets based on
recent results
Key Attributes
• Large position in the emerging
NW STACK
• Highly prospective for multiple
targets, including the fractured
Osage and Meramec targets
• Meramec is an emerging focus
area for several operators
• Osage has delivered multiple high
performing results to date
Dewey Blaine
Operator Name Rigs Operator Name Rigs
Continental 9 Cimarex 2
Devon 7 Marathon 1
Newfield 5 Other 16
Chesapeake 2
Note: PeakIP-30 volumes have been normalized to a 5,000 ft lateral length. Data sourced from LINN production history, IHS and public company investor presentations.
Note: Rig count based on rigs shown within parameters of offset activity map.
Legend
Osage Well
Meramec Well
LINN Acreage
Dennis28-19-16 1H (Tapstone)
First Prod. Date: 06/15
PeakIP-30: 1,840 Boe/d
Oil: 15%
LL / Zone: 4,860’; Osage
Olive Lee1H-22 (Devon)
First Prod. Date: 08/14
PeakIP-30: 1,933 Boe/d
Oil: 11%
LL / Zone: 4,594’; Osage
Chain Ranch1H-2 (Devon)
First Prod. Date: 02/16
PeakIP-30: 1,214 Boe/d
Oil: 16%
LL / Zone: 4,589’; Osage
Wilson35-19-16 1H (Tapstone)
First Prod. Date: 10/15
PeakIP-30: 983 Boe/d
Oil: 20%
LL / Zone: 5,237’; Osage
Elwell29-1H (Comanche)
First Prod. Date: 10/14
PeakIP-30: 1,121 Boe/d
Oil: 51%
LL / Zone: 4,405’; Osage
Irving19-19-16 1H (Tapstone)
First Prod. Date: 02/16
PeakIP-30: 786 Boe/d
Oil: 27%
LL / Zone: 5,118’; Osage
Robison-Payday16-1H (Carrera)
First Prod. Date: 04/15
PeakIP-30: 773 Boe/d
Oil: 46%
Zone: Osage
Bell Gene1H-2 (Valpoint)
First Prod. Date: 07/14
PeakIP-30: 572 Boe/d
Oil: 47%
LL / Zone: 4,059’; Osage
Hoskins5-19-12 1H (Chesapeake)
PeakIP-30: 1,213 Boe/d
Oil: 60%
LL / Zone: 4,886’; Meramec Silt
Schoeppel16-20-12 1H (Chesapeake)
PeakIP-30: 1,025 Boe/d
Oil: 50%
LL / Zone: 4,764’; Meramec Silt
Scheffler1H-9X (Newfield)
First Prod. Date: 12/14
PeakIP-30: 800 Boe/d
Oil: 77%
LL / Zone: 10,150’; Meramec
Ludwig1-22-15Xh (Continental)
First Prod. Date: 07/15
PeakIP-30: 1,146 Boe/d
Oil: 100%
Zone: Meramec
Peoples1-29H (Cimarex)
First Prod. Date: 12/14
PeakIP-30: 1,571 Boe/d
Oil: 55%
LL / Zone: 4,768’; Meramec
Marsh1H-16 (Devon)
First Prod. Date: 08/15
PeakIP-30: 1,343 Boe/d
Oil: 27%
LL / Zone: 4,279’; Osage
Case Trust 22152-35H
(Sandridge)
First Prod. Date: 01/16
PeakIP-30: 350 Boe/d
Oil: 2%
LL / Zone: 4,310’; Osage
Major
Dewey
Blaine
Woodward
Kingfisher
Mounds16-1H (Carrera)
First Prod. Date: 12/15
PeakIP-30: 447 Boe/d
Oil: 41%
LL / Zone: 4,322’; Osage
Legend
Osage Well
Meramec Well
LINN Acreage
Howard5-19-17 1H (Tapstone)
First Prod. Date: 01/16
PeakIP-30: 2,605 Boe/d
Oil: 62%
Zone: Osage
Medill1-27H (Sandridge)
First Prod. Date: 10/16
PeakIP-30: 925 Boe/d
Oil: 77%
Zone: Meramec
18
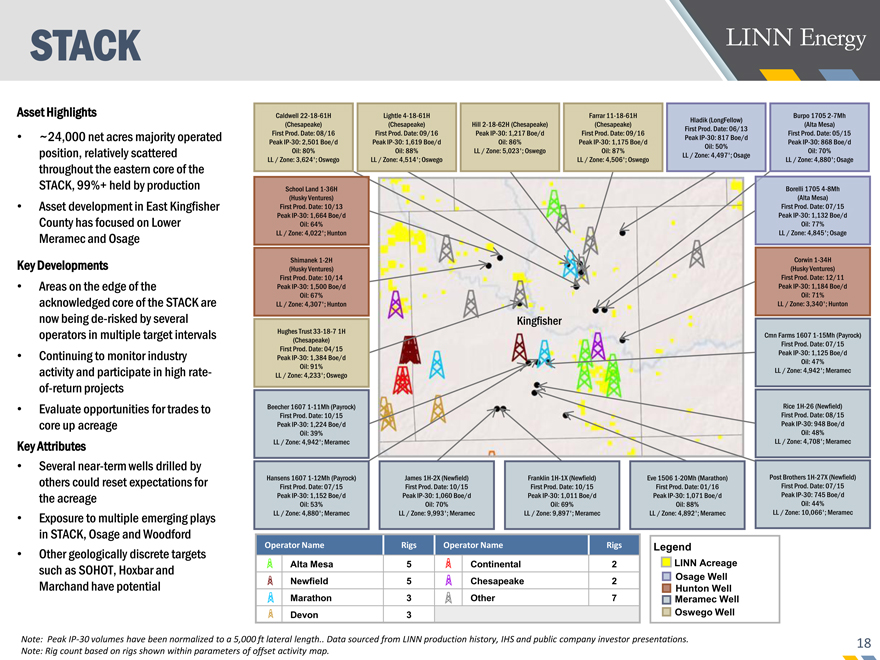
STACK
Asset Highlights
• ~24,000 net acres majority operated
position, relatively scattered
throughout the eastern core of the
STACK, 99%+ held by production
• Asset development in East Kingfisher
County has focused on Lower
Meramec and Osage
Key Developments
• Areas on the edge of the
acknowledged core of the STACK are
now beingde-risked by several
operators in multiple target intervals
• Continuing to monitor industry
activity and participate in high rateof-
return projects
• Evaluate opportunities for trades to
core up acreage
Key Attributes
• Several near-term wells drilled by
others could reset expectations for
the acreage
• Exposure to multiple emerging plays
in STACK, Osage and Woodford
• Other geologically discrete targets
such as SOHOT, Hoxbar and
Marchand have potential
Note: PeakIP-30 volumes have been normalized to a 5,000 ft lateral length.. Data sourced from LINN production history, IHS and public company investor presentations.
Note: Rig count based on rigs shown within parameters of offset activity map.
Franklin1H-1X (Newfield)
First Prod. Date: 10/15
PeakIP-30: 1,011 Boe/d
Oil: 69%
LL / Zone: 9,897’; Meramec
Post Brothers1H-27X (Newfield)
First Prod. Date: 07/15
PeakIP-30: 745 Boe/d
Oil: 44%
LL / Zone: 10,066’; Meramec
School Land1-36H
(Husky Ventures)
First Prod. Date: 10/13
PeakIP-30: 1,664 Boe/d
Oil: 64%
LL / Zone: 4,022’; Hunton
Shimanek1-2H
(Husky Ventures)
First Prod. Date: 10/14
PeakIP-30: 1,500 Boe/d
Oil: 67%
LL / Zone: 4,307’; Hunton
Beecher 16071-11Mh (Payrock)
First Prod. Date: 10/15
PeakIP-30: 1,224 Boe/d
Oil: 39%
LL / Zone: 4,942’; Meramec
Hansens 16071-12Mh (Payrock)
First Prod. Date: 07/15
PeakIP-30: 1,152 Boe/d
Oil: 53%
LL / Zone: 4,880’; Meramec
Borelli 17054-8Mh
(Alta Mesa)
First Prod. Date: 07/15
PeakIP-30: 1,132 Boe/d
Oil: 77%
LL / Zone: 4,845’; Osage
Eve 15061-20Mh (Marathon)
First Prod. Date: 01/16
PeakIP-30: 1,071 Boe/d
Oil: 88%
LL / Zone: 4,892’; Meramec
Rice1H-26 (Newfield)
First Prod. Date: 08/15
PeakIP-30: 948 Boe/d
Oil: 48%
LL / Zone: 4,708’; Meramec
Burpo 17052-7Mh
(Alta Mesa)
First Prod. Date: 05/15
PeakIP-30: 868 Boe/d
Oil: 70%
LL / Zone: 4,880’; Osage
Corwin1-34H
(Husky Ventures)
First Prod. Date: 12/11
PeakIP-30: 1,184 Boe/d
Oil: 71%
LL / Zone: 3,340’; Hunton
Hughes Trust33-18-7 1H
(Chesapeake)
First Prod. Date: 04/15
PeakIP-30: 1,384 Boe/d
Oil: 91%
LL / Zone: 4,233’; Oswego
Cmn Farms 16071-15Mh (Payrock)
First Prod. Date: 07/15
PeakIP-30: 1,125 Boe/d
Oil: 47%
LL / Zone: 4,942’; Meramec
Hladik (LongFellow)
First Prod. Date: 06/13
PeakIP-30: 817 Boe/d
Oil: 50%
LL / Zone: 4,497’; Osage
James1H-2X (Newfield)
First Prod. Date: 10/15
PeakIP-30: 1,060 Boe/d
Oil: 70%
LL / Zone: 9,993’; Meramec
Caldwell22-18-61H
(Chesapeake)
First Prod. Date: 08/16
PeakIP-30: 2,501 Boe/d
Oil: 80%
LL / Zone: 3,624’; Oswego
Hill2-18-62H (Chesapeake)
PeakIP-30: 1,217 Boe/d
Oil: 86%
LL / Zone: 5,023’; Oswego
Lightle4-18-61H
(Chesapeake)
First Prod. Date: 09/16
PeakIP-30: 1,619 Boe/d
Oil: 88%
LL / Zone: 4,514’; Oswego
Farrar11-18-61H
(Chesapeake)
First Prod. Date: 09/16
PeakIP-30: 1,175 Boe/d
Oil: 87%
LL / Zone: 4,506’; Oswego
Operator Name Rigs Operator Name Rigs
Alta Mesa 5 Continental 2
Newfield 5 Chesapeake 2
Marathon 3 Other 7
Devon 3
Kingfisher
Legend
Osage Well
Hunton Well
Meramec Well
Oswego Well
LINN Acreage
19
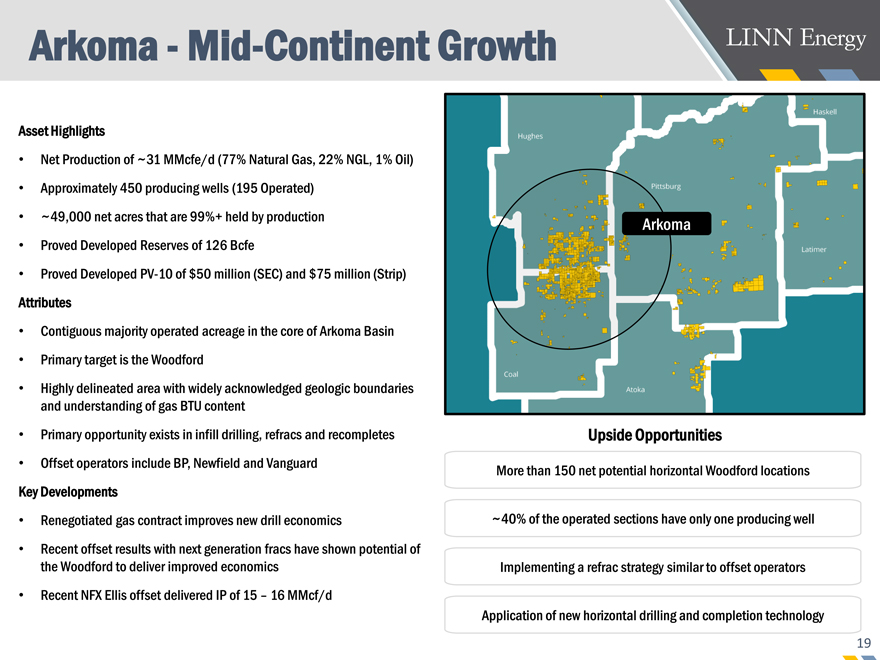
Arkoma—Mid-Continent Growth
Asset Highlights
• Net Production of ~31 MMcfe/d (77% Natural Gas, 22% NGL, 1% Oil)
• Approximately 450 producing wells (195 Operated)
• ~49,000 net acres that are 99%+ held by production
• Proved Developed Reserves of 126 Bcfe
• Proved DevelopedPV-10 of $50 million (SEC) and $75 million (Strip)
Attributes
• Contiguous majority operated acreage in the core of Arkoma Basin
• Primary target is the Woodford
• Highly delineated area with widely acknowledged geologic boundaries
and understanding of gas BTU content
• Primary opportunity exists in infill drilling, refracs and recompletes
• Offset operators include BP, Newfield and Vanguard
Key Developments
• Renegotiated gas contract improves new drill economics
• Recent offset results with next generation fracs have shown potential of
the Woodford to deliver improved economics
• Recent NFX Ellis offset delivered IP of 15 – 16 MMcf/d
More than 150 net potential horizontal Woodford locations
~40% of the operated sections have only one producing well
Upside Opportunities
Implementing a refrac strategy similar to offset operators
Arkoma
Application of new horizontal drilling and completion technology
20
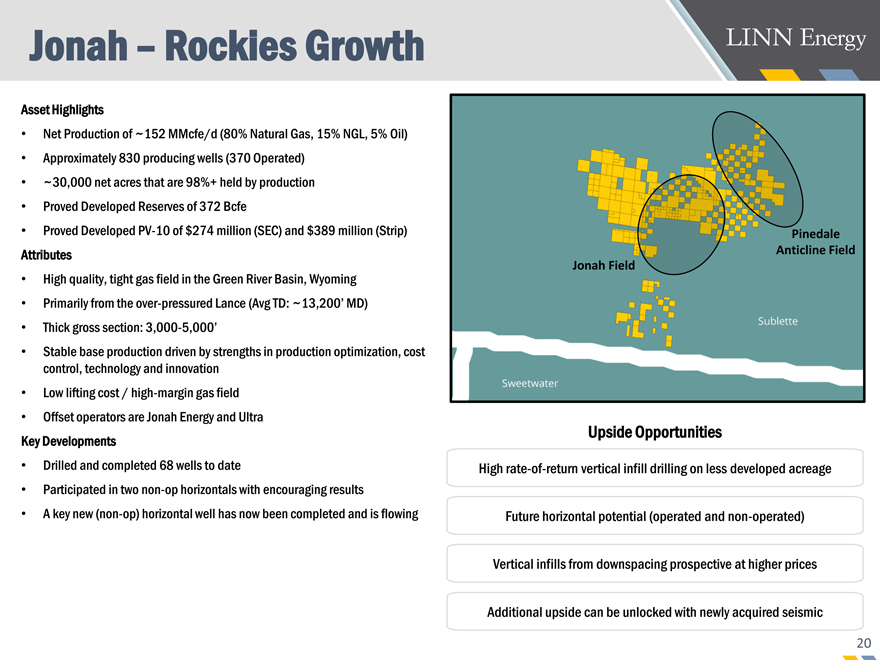
Jonah – Rockies Growth
Asset Highlights
• Net Production of ~152 MMcfe/d (80% Natural Gas, 15% NGL, 5% Oil)
• Approximately 830 producing wells (370 Operated)
• ~30,000 net acres that are 98%+ held by production
• Proved Developed Reserves of 372 Bcfe
• Proved DevelopedPV-10 of $274 million (SEC) and $389 million (Strip)
Attributes
• High quality, tight gas field in the Green River Basin, Wyoming
• Primarily from the over-pressured Lance (Avg TD: ~13,200’ MD)
• Thick gross section:3,000-5,000’
• Stable base production driven by strengths in production optimization, cost
control, technology and innovation
• Low lifting cost / high-margin gas field
• Offset operators are Jonah Energy and Ultra
Key Developments
• Drilled and completed 68 wells to date
• Participated in twonon-op horizontals with encouraging results
• A key new(non-op) horizontal well has now been completed and is flowing
Highrate-of-return vertical infill drilling on less developed acreage
Future horizontal potential (operated andnon-operated)
Upside Opportunities
Vertical infills from downspacing prospective at higher prices
Additional upside can be unlocked with newly acquired seismic
Pinedale
Anticline Field
Jonah Field
21
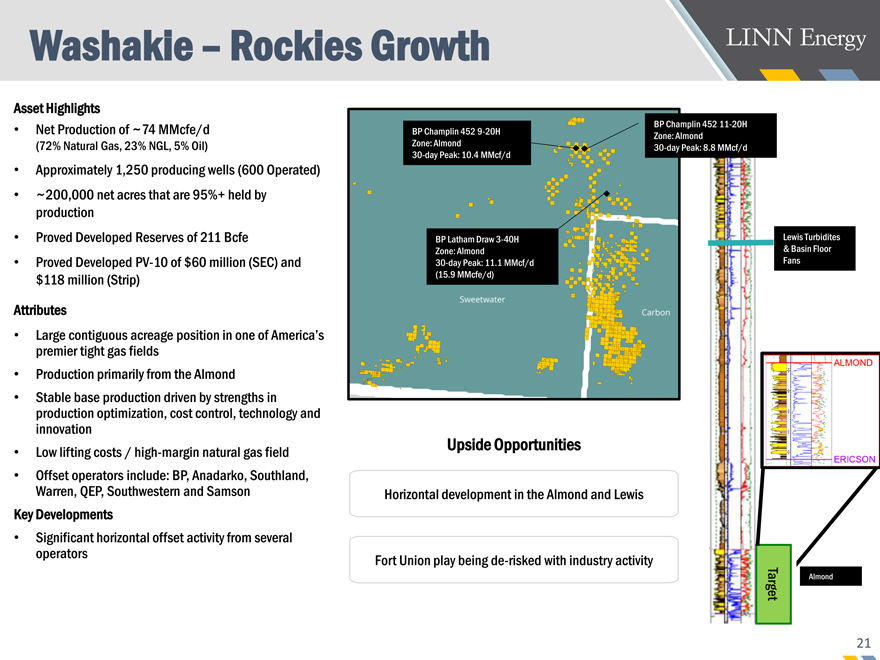
Washakie – Rockies Growth
Asset Highlights
• Net Production of ~74 MMcfe/d
(72% Natural Gas, 23% NGL, 5% Oil)
• Approximately 1,250 producing wells (600 Operated)
• ~200,000 net acres that are 95%+ held by
production
• Proved Developed Reserves of 211 Bcfe
• Proved DevelopedPV-10 of $60 million (SEC) and
$118 million (Strip)
Attributes
• Large contiguous acreage position in one of America’s
premier tight gas fields
• Production primarily from the Almond
• Stable base production driven by strengths in
production optimization, cost control, technology and
innovation
• Low lifting costs / high-margin natural gas field
• Offset operators include: BP, Anadarko, Southland,
Warren, QEP, Southwestern and Samson
Key Developments
• Significant horizontal offset activity from several
operators
Horizontal development in the Almond and Lewis
Fort Union play beingde-risked with industry activity
Upside Opportunities
Lewis Turbidites
& Basin Floor
Fans
Almond
Target
BP Champlin 4529-20H
Zone: Almond
30-day Peak: 10.4 MMcf/d
BP Latham Draw3-40H
Zone: Almond
30-day Peak: 11.1 MMcf/d
(15.9 MMcfe/d)
BP Champlin 45211-20H
Zone: Almond
30-day Peak: 8.8 MMcf/d
22
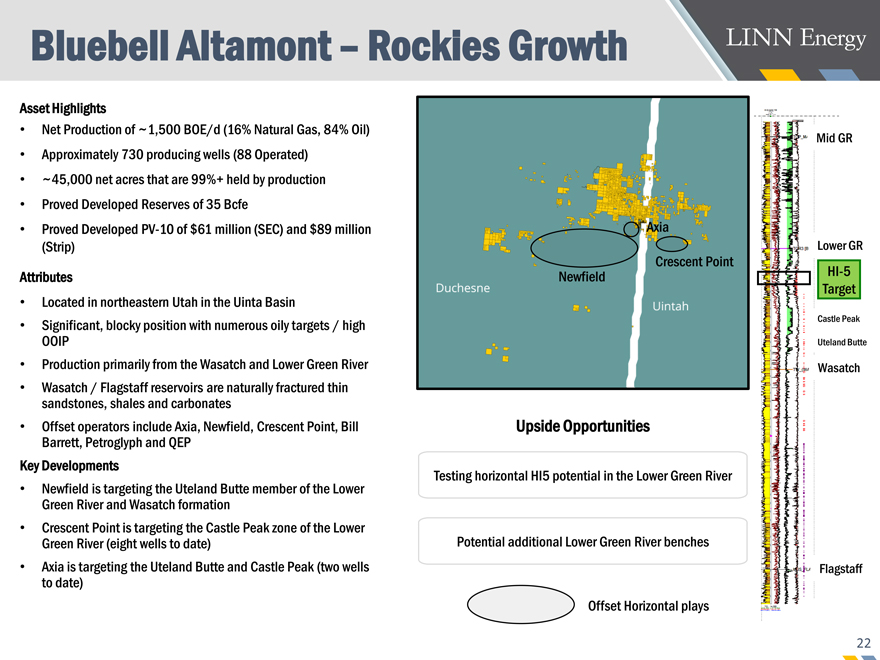
Bluebell Altamont – Rockies Growth
Asset Highlights
• Net Production of ~1,500 BOE/d (16% Natural Gas, 84% Oil)
• Approximately 730 producing wells (88 Operated)
• ~45,000 net acres that are 99%+ held by production
• Proved Developed Reserves of 35 Bcfe
• Proved DevelopedPV-10 of $61 million (SEC) and $89 million (Strip)
Attributes
• Located in northeastern Utah in the Uinta Basin
• Significant, blocky position with numerous oily targets / high OOIP
• Production primarily from the Wasatch and Lower Green River
• Wasatch / Flagstaff reservoirs are naturally fractured thin sandstones, shales and carbonates
• Offset operators include Axia, Newfield, Crescent Point, Bill Barrett, Petroglyph and QEP
Key Developments
• Newfield is targeting the Uteland Butte member of the Lower Green River and Wasatch formation
• Crescent Point is targeting the Castle Peak zone of the Lower Green River (eight wells to date)
• Axia is targeting the Uteland Butte and Castle Peak (two wells to date)
Testing horizontal HI5 potential in the Lower Green River
Potential additional Lower Green River benches
Upside Opportunities
Lower GR
Flagstaff
HI-5
Target
Mid GR
Wasatch
Offset Horizontal plays
Castle Peak
Uteland Butte
Newfield
Crescent Point
Axia
23
Williston Basin – Rockies Growth
Asset Highlights
• Net Production of ~9,800 BOE/d (57% Oil , 22% NGL, 21% Natural Gas)
• Approximately 1,100 producing wells (Allnon-Operated)
• ~20,000 net acres that are 98%+ held by production
• Proved Developed Reserves of 119 Bcfe
• Proved DevelopedPV-10 of $139 million (SEC) and $230 million (Strip)
Attributes
• Improved completions have led to attractive economics
• High-quality partners (including NFX, HES, XTO, WLL and CLR)
• 2016 capital spend of $23 million with partners
• More than 50 wells drilled and awaiting completion
More than 700 gross horizontal locations in the Bakken and Three Forks
Ongoing evolution of completions improving type curves
Upside Opportunities
Further downspacing in both the Bakken and the Three Forks
Basin focused midstream projects to improve economics
Source Rock
Source Rock
Reservoir
Reservoir
Reservoir
Middle Bakken
Upper Three Forks
Middle Three Forks
Upper Bakken Shale
Lower Bakken Shale
TARGET
TARGET
Parshall
Nesson
Ant
icline 24
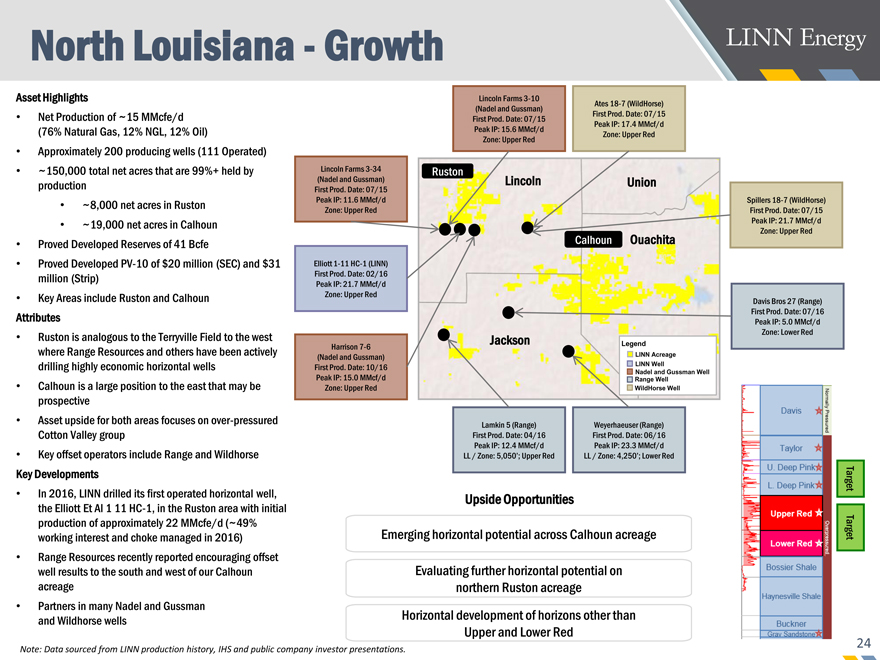
North Louisiana—Growth
Asset Highlights
• Net Production of ~15 MMcfe/d (76% Natural Gas, 12% NGL, 12% Oil)
• Approximately 200 producing wells (111 Operated)
• ~150,000 total net acres that are 99%+ held by production
• ~8,000 net acres in Ruston
• ~19,000 net acres in Calhoun
• Proved Developed Reserves of 41 Bcfe
• Proved DevelopedPV-10 of $20 million (SEC) and $31 million (Strip)
• Key Areas include Ruston and Calhoun
Attributes
• Ruston is analogous to the Terryville Field to the west where Range Resources and others have been actively drilling highly economic horizontal wells
• Calhoun is a large position to the east that may be prospective
• Asset upside for both areas focuses on over-pressured Cotton Valley group
• Key offset operators include Range and Wildhorse
Key Developments
• In 2016, LINN drilled its first operated horizontal well, the Elliott Et Al 1 11HC-1, in the Ruston area with initial production of approximately 22 MMcfe/d (~49% working interest and choke managed in 2016)
• Range Resources recently reported encouraging offset well results to the south and west of our Calhoun acreage
• Partners in many Nadel and Gussman and Wildhorse wells
Emerging horizontal potential across Calhoun acreage
Evaluating further horizontal potential on
northern Ruston acreage
Upside Opportunities
Target
Horizontal development of horizons other than
Upper and Lower Red
Lincoln Farms3-10 (Nadel and Gussman) First Prod. Date: 07/15
Peak IP: 15.6 MMcf/d
Zone: Upper Red
Lincoln Farms3-34 (Nadel and Gussman) First Prod. Date: 07/15
Peak IP: 11.6 MMcf/d
Zone: Upper Red
Spillers18-7 (WildHorse) First Prod. Date: 07/15
Peak IP: 21.7 MMcf/d
Zone: Upper Red
Ates18-7 (WildHorse) First Prod. Date: 07/15
Peak IP: 17.4 MMcf/d
Zone: Upper Red
Elliott1-11HC-1 (LINN) First Prod. Date: 02/16
Peak IP: 21.7 MMcf/d
Zone: Upper Red
Harrison7-6 (Nadel and Gussman) First Prod. Date: 10/16
Peak IP: 15.0 MMcf/d Zone: Upper Red
Lamkin 5 (Range) First Prod. Date: 04/16
Peak IP: 12.4 MMcf/d
LL / Zone: 5,050’; Upper Red
Davis Bros 27 (Range) First Prod. Date: 07/16
Peak IP: 5.0 MMcf/d
Zone: Lower Red
Weyerhaeuser (Range) First Prod. Date: 06/16
Peak IP: 23.3 MMcf/d
LL / Zone: 4,250’; Lower Red
Ouachita
Lincoln
Union
Jackson Legend LINN Well Nadel and Gussman Well Range Well WildHorse Well LINN Acreage
Ruston
Calhoun
Note: Data sourced from LINN production history, IHS and public company investor presentations.
Target
25
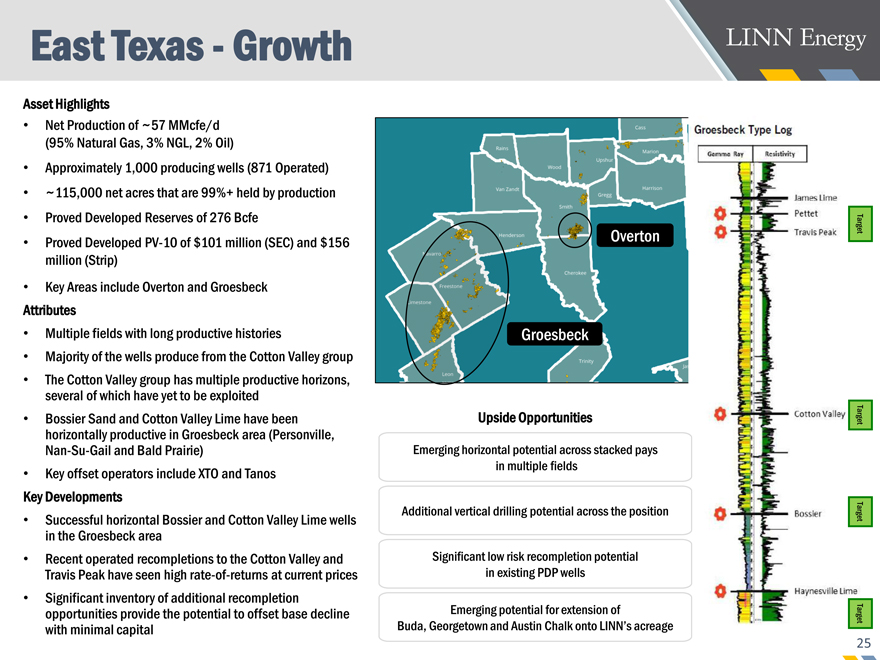
East Texas—Growth
Asset Highlights
• Net Production of ~57 MMcfe/d (95% Natural Gas, 3% NGL, 2% Oil)
• Approximately 1,000 producing wells (871 Operated)
• ~115,000 net acres that are 99%+ held by production
• Proved Developed Reserves of 276 Bcfe
• Proved DevelopedPV-10 of $101 million (SEC) and $156 million (Strip)
• Key Areas include Overton and Groesbeck
Attributes
• Multiple fields with long productive histories
• Majority of the wells produce from the Cotton Valley group
• The Cotton Valley group has multiple productive horizons, several of which have yet to be exploited
• Bossier Sand and Cotton Valley Lime have been horizontally productive in Groesbeck area (Personville,Nan-Su-Gail and Bald Prairie)
• Key offset operators include XTO and Tanos
Key Developments
• Successful horizontal Bossier and Cotton Valley Lime wells in the Groesbeck area
• Recent operated recompletions to the Cotton Valley and Travis Peak have seen highrate-of-returns at current prices
• Significant inventory of additional recompletion opportunities provide the potential to offset base decline with minimal capital
Emerging horizontal potential across stacked pays
in multiple fields
Additional vertical drilling potential across the position
Upside Opportunities
Significant low risk recompletion potential
in existing PDP wells
Emerging potential for extension of
Buda, Georgetown and Austin Chalk onto LINN’s acreage
Groesbeck
Overton
Target
Target
Target
Target
26
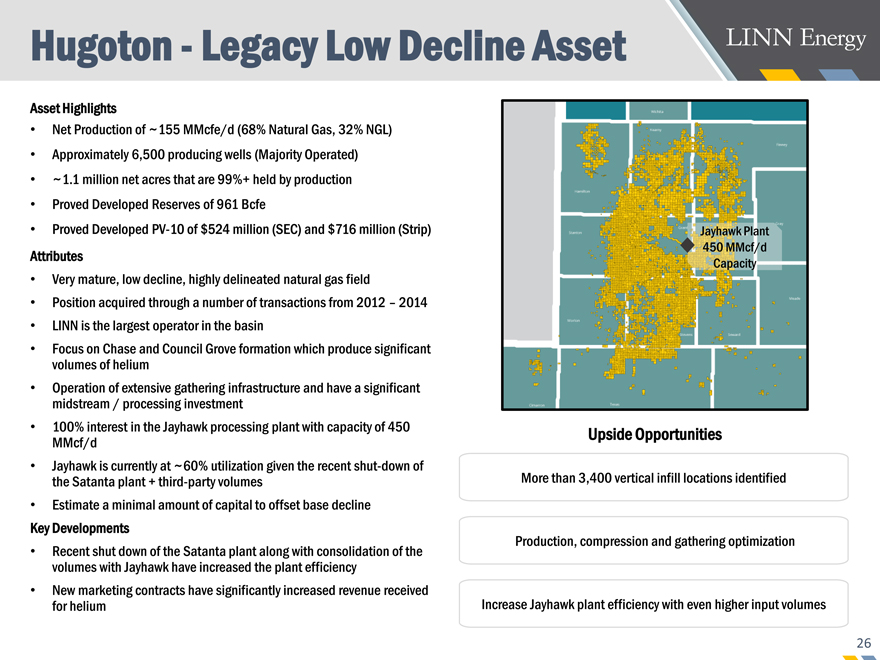
Hugoton—Legacy Low Decline Asset
Asset Highlights
• Net Production of ~155 MMcfe/d (68% Natural Gas, 32% NGL)
• Approximately 6,500 producing wells (Majority Operated)
• ~1.1 million net acres that are 99%+ held by production
• Proved Developed Reserves of 961 Bcfe
• Proved DevelopedPV-10 of $524 million (SEC) and $716 million (Strip)
Attributes
• Very mature, low decline, highly delineated natural gas field
• Position acquired through a number of transactions from 2012 – 2014
• LINN is the largest operator in the basin
• Focus on Chase and Council Grove formation which produce significant volumes of helium
• Operation of extensive gathering infrastructure and have a significant midstream / processing investment
• 100% interest in the Jayhawk processing plant with capacity of 450 MMcf/d
• Jayhawk is currently at ~60% utilization given the recent shut-down of the Satanta plant + third-party volumes
• Estimate a minimal amount of capital to offset base decline
Key Developments
• Recent shut down of the Satanta plant along with consolidation of the volumes with Jayhawk have increased the plant efficiency
• New marketing contracts have significantly increased revenue received for helium
More than 3,400 vertical infill locations identified
Upside Opportunities
Production, compression and gathering optimization
Increase Jayhawk plant efficiency with even higher input volumes
Jayhawk Plant
450 MMcf/d Capacity
27
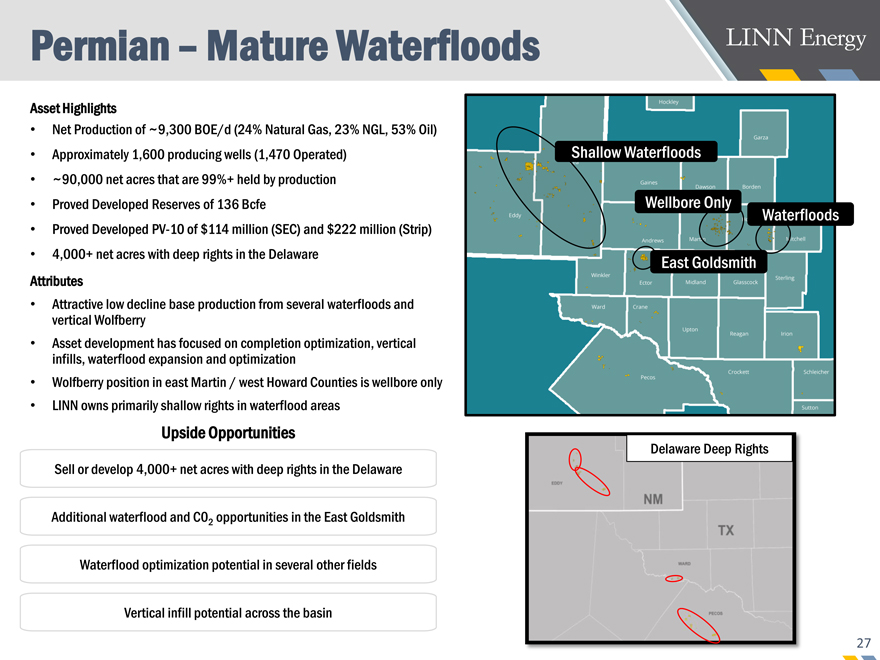
Permian – Mature Waterfloods
Asset Highlights
• Net Production of ~9,300 BOE/d (24% Natural Gas, 23% NGL, 53% Oil)
• Approximately 1,600 producing wells (1,470 Operated)
• ~90,000 net acres that are 99%+ held by production
• Proved Developed Reserves of 136 Bcfe
• Proved DevelopedPV-10 of $114 million (SEC) and $222 million (Strip)
• 4,000+ net acres with deep rights in the Delaware
Attributes
• Attractive low decline base production from several waterfloods and vertical Wolfberry
• Asset development has focused on completion optimization, vertical infills, waterflood expansion and optimization
• Wolfberry position in east Martin / west Howard Counties is wellbore only
• LINN owns primarily shallow rights in waterflood areas
Sell or develop 4,000+ net acres with deep rights in the Delaware
Additional waterflood and C02 opportunities in the East Goldsmith
Upside Opportunities
Waterflood optimization potential in several other fields
Vertical infill potential across the basin
Shallow Waterfloods
Waterfloods
East Goldsmith
Wellbore Only
Delaware Deep Rights
28
California – Shallow Decline Oil Asset
CA
Belridge
Brea
Asset Highlights
• Net Production of ~5,300 BOE/d (99% Oil, 1% NGL)
• Approximately 800 producing wells with high working interest
• ~3,000 net acres that are 100% held by production
• Proved Developed Reserves of 170 Bcfe
• Proved DevelopedPV-10 of $233 million (SEC) and $347 million (Strip)
Belridge
• Asset development has focused on waterflood down spacing and thermal development opportunities
• Concentrated acreage position with stacked reservoirs (Diatomite and Tulare) and significant resource in place
• Uniquely developed asset relative to offset positions in area and proven reservoir and geologic model
• Offset operators include Aera, CRC, and Berry
Brea
• Stable long life oil field with ~4% base decline
• Natural gas is converted to electricity to power the field, reducing operating expenses and assisting emissions requirements
• Natural gas processing facility
~100 gross infill locations in the Tulare steamflood
withrates-of-return greater than 30% at $3 / $50
Over 800 gross infill locations in the Diatomite waterflood
~230 withrates-of-return greater than 30% at $3 / $50
Upside Opportunities
Continued base optimization and margin improvement
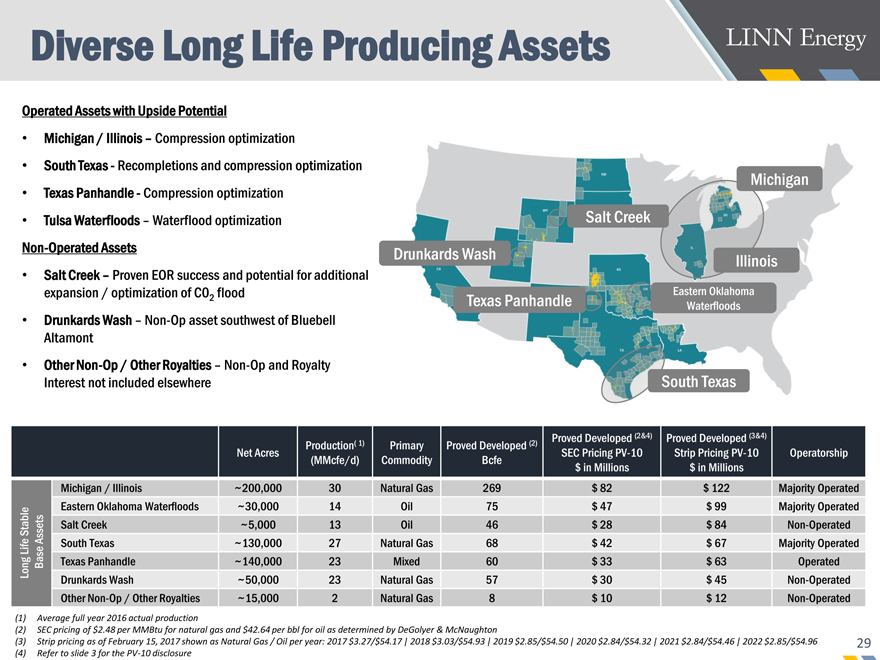
Operated Assets with Upside Potential
• Michigan / Illinois – Compression optimization
• South Texas—Recompletions and compression optimization
• Texas Panhandle—Compression optimization
• Tulsa Waterfloods – Waterflood optimization
Non-Operated Assets
• Salt Creek – Proven EOR success and potential for additional expansion / optimization of C02 flood
• Drunkards Wash –Non-Op asset southwest of Bluebell Altamont
• OtherNon-Op / Other Royalties –Non-Op and Royalty Interest not included elsewhere
Diverse Long Life Producing Assets
Drunkards Wash
Michigan
Salt Creek
Illinois
South Texas
Texas Panhandle
(1) Average full year 2016 actual production
(2) SEC pricing of $2.48 per MMBtu for natural gas and $42.64 per bbl for oil as determined by DeGolyer & McNaughton
(3) Strip pricing as of February 15, 2017 shown as Natural Gas / Oil per year: 2017 $3.27/$54.17 | 2018 $3.03/$54.93 | 2019 $2.85/$54.50 | 2020 $2.84/$54.32 | 2021 $2.84/$54.46 | 2022 $2.85/$54.96
(4) Refer to slide 3 for thePV-10 disclosure
Net Acres
Production( 1)
(MMcfe/d)
Primary
Commodity
Proved Developed (2)
Bcfe
Proved Developed (2&4) SEC PricingPV-10
$ in Millions
Proved Developed (3&4) Strip PricingPV-10
$ in Millions
Long Life Stable
Base Assets
Michigan / Illinois
~200,000
30
Natural Gas
269
$82
$122
Eastern Oklahoma Waterfloods
~30,000
14
Oil
75
$47
$99
Salt Creek
~5,000
13
Oil
46
$28
$84
South Texas
~130,000
27
Natural Gas
68
$42
$67
Texas Panhandle
~140,000
23
Mixed
60
$33
$63
Drunkards Wash
~50,000
23
Natural Gas
57
$30
$45
OtherNon-Op / Other Royalties
~15,000
2
Natural Gas
8
$10
$12
30
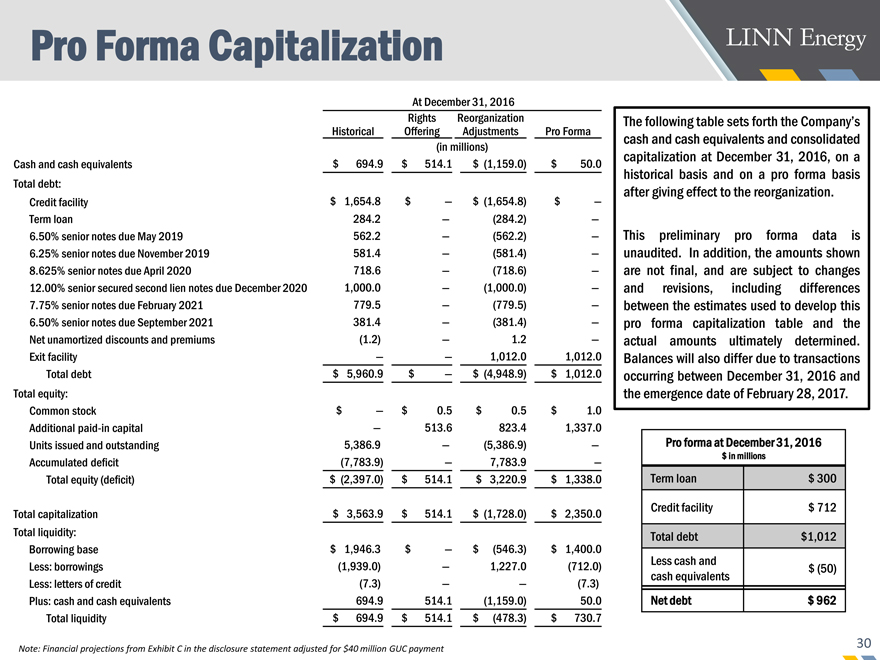
Pro Forma Capitalization At December 31, 2016
Historical
Rights Offering
Reorganization Adjustments
Pro Forma
(in millions)
Cash and cash equivalents
$694.9
$514.1
$(1,159.0)
$50.0
Total debt:
Credit facility
$1,654.8
$—
$(1,654.8)
$—
Term loan
284.2
—
(284.2)
—
6.50% senior notes due May 2019
562.2
—
(562.2)
—
6.25% senior notes due November 2019
581.4
—
(581.4)
—
8.625% senior notes due April 2020
718.6
—
(718.6)
—
12.00% senior secured second lien notes due December 2020
1,000.0
—
(1,000.0)
—
7.75% senior notes due February 2021
779.5
—
(779.5)
—
6.50% senior notes due September 2021
381.4
—
(381.4)
—
Net unamortized discounts and premiums
(1.2)
—
1.2
—
Exit facility
—
—
1,012.0
1,012.0
Total debt
$5,960.9
$—
$(4,948.9)
$1,012.0
Total equity:
Common stock
$—
$0.5
$0.5
$1.0
Additionalpaid-in capital
—
513.6
823.4
1,337.0
Units issued and outstanding
5,386.9
—
(5,386.9)
—
Accumulated deficit
(7,783.9)
—
7,783.9
—
Total equity (deficit)
$(2,397.0)
$514.1
$3,220.9
$1,338.0
Total capitalization
$3,563.9
$514.1
$(1,728.0)
$2,350.0
Total liquidity:
Borrowing base
$1,946.3
$—
$(546.3)
$1,400.0
Less: borrowings
(1,939.0)
—
1,227.0
(712.0)
Less: letters of credit
(7.3)
—
—
(7.3)
Plus: cash and cash equivalents
694.9
514.1
(1,159.0)
50.0
Total liquidity
$694.9
$514.1
$(478.3)
$730.7
31
Debt Reduction
$3,088
$2,215
$662
500
500
300
1,000
1,000
3,857
3,023
$8,445
$6,738
$962
0
1,000
2,000
3,000
4,000
5,000
6,000
7,000
8,000
9,000
12/31/2015 with Berry 12/31/15 excluding Berry Est. 2/28/17
$ Millions
RBL Term Loan Second Lien Notes Unsecured Notes
Pro Forma Annual Interest
Expense
$497 million $415 million $55 million(2)
Debt Reduction Contributors
Berry Separation $1,707
Equitize Second Lien / Unsecured Notes 4,023
Hedge Unwind 1,190
New Money Investment 530
Other 33
Total $7,483
Total Net Debt and Annual Interest Expense estimated to be lowered by ~90%
(1)
(1) See reconciliation of net debt (anon-GAAP measure) on slide 29. Financial projections from Exhibit C in the disclosure statement adjusted for $40 million GUC payment
(2) 2017 estimated interest expense pro forma for a 1/1/2017 emergence date
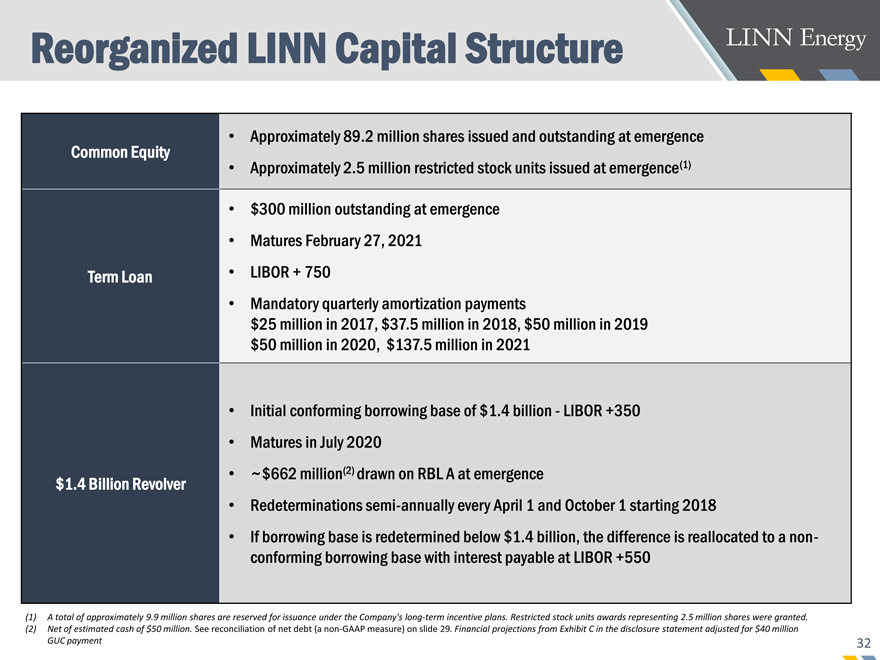
Common Equity
• Approximately 89.2 million shares issued and outstanding at emergence
• Approximately 2.5 million restricted stock units issued at emergence(1)
Term Loan
• $300 million outstanding at emergence
• Matures February 27, 2021
• LIBOR + 750
• Mandatory quarterly amortization payments
$25 million in 2017, $37.5 million in 2018, $50 million in 2019
$50 million in 2020, $137.5 million in 2021
$1.4 Billion Revolver
• Initial conforming borrowing base of $1.4 billion—LIBOR +350
• Matures in July 2020
• ~$662 million(2) drawn on RBL A at emergence
• Redeterminations semi-annually every April 1 and October 1 starting 2018
• If borrowing base is redetermined below $1.4 billion, the difference is reallocated to a nonconforming
borrowing base with interest payable at LIBOR +550
32
(1) A total of approximately 9.9 million shares are reserved for issuance under the Company’s long-term incentive plans. Restricted stock units awards representing 2.5 million shares were granted.
(2) Net of estimated cash of $50 million. See reconciliation of net debt (anon-GAAP measure) on slide 29. Financial projections from Exhibit C in the disclosure statement adjusted for $40 million
GUC payment
Reorganized LINN Capital Structure
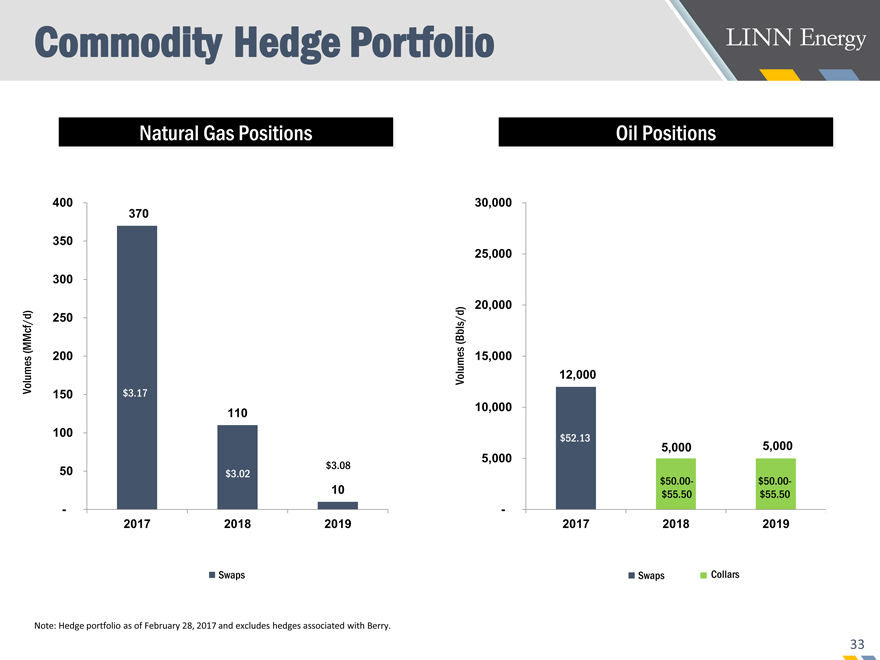
370
110
10
-
50
100
150
200
250
300
350
400
2017 2018 2019
12,000
5,000 5,000
-
5,000
10,000
15,000
20,000
25,000
30,000
2017 2018 2019
Natural Gas Positions
Volumes (MMcf/d)
33
Commodity Hedge Portfolio
Swaps
Volumes (Bbls/d)
Oil Positions
Swaps Collars
$3.17
$52.13
$3.02
$50.00-
$55.50
Note: Hedge portfolio as of February 28, 2017 and excludes hedges associated with Berry.
$50.00-
$55.50
$3.08
34
New Board of Directors
Mark E. Ellis is President and Chief Executive Officer of LINN Energy. Mr. Ellis has more than 35 years of experience in the oil and natural gas industry. He joined LINN in December 2006 as Executive Vice President and Chief Operating Officer, was promoted to President and Chief Operating Officer in December 2007, President and Chief Executive Officer in January 2010 and Chairman, President and Chief Executive Officer in December 2011. Before joining LINN, Mr. Ellis served as President of the Lower 48 for ConocoPhillips. Prior to joining ConocoPhillips, he served as Senior Vice President of North American Production for Burlington Resources. He first joined Burlington Resources in 1985 and served in roles of increasing responsibility, including President of Burlington Resources Canada Ltd., Vice President and Chief Engineer, Vice President of the San Juan Division and Manager of Acquisitions. He began his career at The Superior Oil Company, where he served in several engineering positions in the onshore and offshore divisions. Mr. Ellis holds a bachelor’s degree in petroleum engineering from Texas A&M University.
Mark E. Ellis
President and Chief Executive Officer
David B. Rottino is Executive Vice President and Chief Financial Officer of LINN Energy. Mr. Rottino oversees the accounting, tax, investor relations, business development and strategic planning functions. Mr. Rottino has over 25 years of total experience and over 20 years of experience in the oil and natural gas industry. Prior to joining LINN in June 2008, he served at El Paso Energy, ConocoPhillips and Burlington Resources in various finance, accounting and strategic planning roles. Mr. Rottino earned a bachelor’s degree in business administration from Texas Tech University and anM.B.A. from Texas Christian University.
David B. Rottino Chief Financial Officer
Matthew Bonanno joined York Capital Management in July 2010 and is a Partner of the firm. Matthew joined York from the Blackstone Group, where he worked as an associate focusing on restructuring, recapitalization and reorganization transactions. Prior to joining the Blackstone Group, he worked on financing and strategic transactions at News Corporation and as an investment banker at JP Morgan and Goldman Sachs. Mr. Bonanno is currently a member of the board, in his capacity as a York employee, of Rever Offshore AS, all entities incorporated pursuant to York’s partnership with Costamare Inc. and Augustea Bunge Maritime, Next Decade LLC and Vantage Drilling Co. He received a bachelor’s degree in history from Georgetown University and an M.B.A. in finance from TheWharton School of the University of Pennsylvania.
Matthew Bonanno
Director
Philip Brown joined P. Schoenfeld Asset Management (“PSAM”) in 2009 and is a Partner of the firm where he focuses on credit-oriented investments across various industries. Prior to joining PSAM, Mr. Brown held positions at Sun Capital Partners, Inc., an operationally-focused private equity firm, and Buckeye Capital Partners, an event-driven hedge fund. He began his career as an investment banking analyst at Wasserstein Perella & Co. Mr. Brown graduated from Georgetown University in 1999 with bachelor’s degrees in economics and history.
Phil Brown
Director
Mr. Lederman joined Fir Tree in February, 2011 and is a Managing Director,Co-Head of Restructuring and a Partner at Fir Tree Partners. Prior to joining Fir Tree, Mr. Lederman worked in the Business Finance and Restructuring groups at Weil, Gotshal & Manges LLP and Cravath, Swaine & Moore LLP. In addition to Linn Energy, Mr. Lederman is currently a member of the board, in his capacity as a Fir Tree Partner’s employee, of New Emerald Energy, LLC and Deer Finance, LLC . Mr. Lederman received a J.D. degree with honors from New York University School of Law and a B.A., magna cum laude, from New York University.
Evan Lederman
Director
Kevin Mahony is a Principal at Centerbridge Partners, which he joined in July 2014. Prior to joining Centerbridge, Mr. Mahony was an associate at Oaktree Capital Management in its Global Principal Group and an investment banking analyst at Lazard in its Restructuring Group. He is currently a member of the board of directors, in his capacity as a Centerbridge employee, of Genco Shipping & Trading. Mr. Mahony graduated with honors from the University of Virginia with a B.S. in Commerce with concentrations in finance, management and a track in entrepreneurship, and a B.A. in Art History.
Kevin Mahony
Director
Andy Taylor is a member of the investment team of Elliott Management Corporation, a New York-based trading firm, where he is responsible for various corporate investments. Prior to joining Elliott in 2015, Mr. Taylor held similar positions in BlackRock’s Distressed Products Group, R3 Capital Partners and the Global Principal Strategies team at Lehman Brothers. He earned a bachelor’s degree inmechanical engineering from Rose-Hulman Institute of Technology in 1999, and an M.B.A., with honors, from the University of Chicago Booth School of Business in 2006.
Andy Taylor Di