QuickLinks -- Click here to rapidly navigate through this document
As filed with the Securities and Exchange Commission on June 28, 2005
Registration No. 333-125007
UNITED STATES
SECURITIES AND EXCHANGE COMMISSION
Washington, D.C. 20549
AMENDMENT NO. 1
TO
FORM S-1
REGISTRATION STATEMENT UNDER THE SECURITIES ACT OF 1933
GOLF GALAXY, INC.
(Exact name of Registrant as specified in its charter)
| Minnesota (State or other jurisdiction of incorporation or organization) | 5940 (Primary Standard Industrial Classification Code Number) | 41-1831724 (I.R.S. Employer Identification No.) | ||
7275 Flying Cloud Drive Eden Prairie, Minnesota 55344 (952) 941-8848 (Address, including zip code, and telephone number, including area code, of Registrant's principal executive offices) | ||||
Randall K. Zanatta President, Chief Executive Officer and Chairman Golf Galaxy, Inc. 7275 Flying Cloud Drive Eden Prairie, Minnesota 55344 (952) 941-8848 (Name, address, including zip code, and telephone number, including area code, of agent for service) | ||||
Copies to: | ||
| John R. Houston, Esq. Robins, Kaplan, Miller & Ciresi L.L.P. 2800 LaSalle Plaza 800 LaSalle Avenue Minneapolis, Minnesota 55402-2015 (612) 349-8500 | David B. Miller, Esq. Michael K. Coddington, Esq. Faegre & Benson LLP 2200 Wells Fargo Center 90 South Seventh Street Minneapolis, Minnesota 55402-3901 (612) 766-7000 | |
Approximate date of commencement of proposed sale to public:
As soon as practicable after this registration statement becomes effective.
If any of the securities being registered on this Form are to be offered on a delayed or continuous basis pursuant to Rule 415 under the Securities Act of 1933, check the following box: o
If this Form is filed to register additional securities for an offering pursuant to Rule 462(b) under the Securities Act, check the following box and list the Securities Act registration statement number of the earlier effective registration statement for the same offering: o
If this Form is a post-effective amendment filed pursuant to Rule 462(c) under the Securities Act, check the following box and list the Securities Act registration statement number of the earlier effective registration statement for the same offering: o
If this Form is a post-effective amendment filed pursuant to Rule 462(d) under the Securities Act, check the following box and list the Securities Act registration statement number of the earlier effective registration statement for the same offering: o
If delivery of the prospectus is expected to be made pursuant to Rule 434, please check the following box: o
The Registrant hereby amends this Registration Statement on such date or dates as may be necessary to delay its effective date until the Registrant shall file a further amendment which specifically states that this Registration Statement shall thereafter become effective in accordance with Section 8(a) of the Securities Act of 1933 or until the Registration Statement shall become effective on such date as the Commission, acting pursuant to said Section 8(a), may determine.
Subject to completion, dated June 28, 2005
The information in this prospectus is not complete and may be changed. We may not sell these securities until the Securities and Exchange Commission declares our registration statement effective. This prospectus is not an offer to sell these securities and is not soliciting an offer to buy these securities in any state where the offer or sale is not permitted.
Shares
| GOLF GALAXY, INC. |  |
Common Stock
$ per share
- •
- Golf Galaxy, Inc. is offering shares and selling shareholders are offering shares. We will not receive any proceeds from the sale of our shares by the selling shareholders.
- •
- We anticipate that the initial public offering price will be between $ and $ per share.
- •
- This is our initial public offering and no public market currently exists for our shares.
- •
- Reserved trading symbol: Nasdaq National Market—GGXY
This investment involves risk. See "Risk Factors" beginning on page 9.
| | Per Share | Total | ||||
|---|---|---|---|---|---|---|
| Public offering price | $ | $ | ||||
| Underwriting discount | $ | $ | ||||
| Proceeds, before expenses, to Golf Galaxy, Inc. | $ | $ | ||||
| Proceeds, before expenses, to selling shareholders | $ | $ | ||||
The underwriters have a 30-day option to purchase up to additional shares of common stock from selling shareholders to cover over-allotments, if any. We will not receive any of the proceeds from the sale of such shares by the selling shareholders.
Neither the Securities and Exchange Commission nor any state securities commission has approved of anyone's investment in these securities or determined if this prospectus is truthful or complete. Any representation to the contrary is a criminal offense.
| Piper Jaffray | William Blair & Company |
| A.G. Edwards | Wedbush Morgan Securities |
The date of this prospectus is , 2005.


| | Page | |
|---|---|---|
| Summary | 1 | |
Risk Factors | 9 | |
A Special Note Regarding Forward Looking Statements | 20 | |
Use of Proceeds | 22 | |
Dividend Policy | 22 | |
Capitalization | 23 | |
Dilution | 26 | |
Selected Financial Information | 28 | |
Management's Discussion and Analysis of Financial Condition and Results of Operations | 32 | |
Business | 52 | |
Management | 71 | |
Certain Relationships and Related Party Transactions | 80 | |
Principal and Selling Shareholders | 82 | |
Description of Capital Stock | 85 | |
Shares Eligible for Future Sale | 88 | |
U.S. Federal Tax Consequences for Non-U.S. Holders | 90 | |
Underwriting | 94 | |
Legal Matters | 97 | |
Experts | 97 | |
Where You Can Find More Information | 97 | |
Index to Financial Statements | F-1 |
You should rely only on the information contained in this prospectus. We have not, and the underwriters have not, authorized any other person to provide you with different information. This prospectus is not an offer to sell, nor is it seeking an offer to buy, these securities in any state where the offer or sale is not permitted. The information in this prospectus is complete and accurate as of the date on the front cover, but the information may have changed since that date.
"Golf Galaxy", "Everything for the Game.", "Outward 9", "Rae's Creek" and our other marks mentioned or used in this prospectus are our registered trademarks and service marks. This prospectus also contains trademarks and service marks belonging to other entities.
i
The items in the following summary are described in more detail later in this prospectus. This summary provides an overview of selected information and does not contain all the information you should consider. Therefore, you should also read the more detailed information set out in this prospectus, including the financial statements and the related notes appearing elsewhere in this prospectus.
Golf Galaxy, Inc.
We are a leading golf specialty retailer offering a distinctive combination of competitively priced merchandise from the leading national brands in golf equipment and apparel, together with non-commissioned sales assistance and pro shop services. Our 45 superstores, generally ranging from 13,000 to 18,000 selling square feet, are located in 19 states. Our "Everything for the Game." core strategy is to provide avid and casual golfers, as well as gift purchasers, a category dominant selection of leading national brand products, expert sales assistance and professional services, the combination of which is generally not available elsewhere. We offer our customers an exciting, interactive environment that contrasts sharply with the shopping experience at smaller independent golf stores, on-course pro shops and the golf departments of general sporting goods retailers.
Key to our strategy is our focus on the leading national brands in golf, rather than promoting private label products or lesser known brands. Our non-commissioned sales associates and PGA professionals offer customers knowledgeable advice and expertise. We believe this selling strategy is distinctive and builds a trust relationship that is critical to creating long-term customer loyalty and encouraging word of mouth referrals. We employ a consultative selling approach that focuses on maximizing each customer relationship for the long-term by delivering the best solution for each golfer. For instance, in the clubs category, we utilize our expertise to custom fit clubs to our customers' needs. We also build customer loyalty through exclusive Advantage Club member in-store events and offers.
Our stores feature full-time Professional Golfers' Association of America (PGA) professionals who offer customers a specialized level of expertise and service. Our value-added pro shop services, directed by our in-store PGA professionals, utilize state-of-the-art technology and facilities. These services, which we refer to as "PGA services", include golf lessons featuring digital video swing analysis, club and ball fittings using high-speed ball launch monitors and full-service club repair and upgrade services. Our professionally designed "superstore" format features a racetrack layout highlighting broad product offerings along with many interactive features, such as an artificial bent grass putting green and golf simulators.
According to the National Golf Foundation (NGF), an independent industry research firm, the aggregate size of the U.S. golf market was estimated at $24.3 billion in 2002, which included spending on greens fees, equipment and accessories, and food and beverages. Golf clubs, balls, bags, gloves and footwear represented $4.7 billion of this total. The golf market, as defined by the NGF, does not include certain products that we sell such as pre-owned clubs, golf and casual apparel, and golf-related gifts, novelties and services. We estimate the total golf market we serve, including these additional products and services, is over $7.5 billion.
We believe our combination of leading national brands, a commitment to superior customer service, and interactive store features, together with our guaranteed low prices, provides a distinctive superstore concept which will enable us to achieve our objective of becoming the nation's leading golf specialty retailer.
1
Competitive Strengths
We believe that a combination of factors creates a distinctive retail concept that distinguishes us from our competitors and is key to our continuing success. These factors include the following:
- •
- our extensive selection of leading national brands in golf equipment, which we believe are preferred by most golfers;
- •
- our extensive assortment and professional merchandising of golf apparel and footwear;
- •
- our commitment to a superior level of customer service, golf expertise and value-added PGA services;
- •
- our full-time, in-store PGA professionals who use our state-of-the-art technology and facilities to provide our customers with specialized PGA services;
- •
- our superstore format that offers a distinctive combination of extensive product assortments and golf-related services in a fun and interactive setting;
- •
- our marketing program that we believe gives us, in most of our markets, the leading share of voice in advertising in the golf category, and which includes our complimentary "Advantage Club" customer loyalty program;
- •
- our "Low Prices. Everyday. Guaranteed." policy that extends 30 days beyond the purchase date to protect our customers in the event they find a lower price;
- •
- our comprehensive competitive shopping program that monitors in-store pricing at our competitors allowing us to proactively adjust our prices to match local competition; and
- •
- our management team with extensive superstore and golf industry experience.
Growth Strategy
Our long-term objectives are to build the Golf Galaxy brand and to become the nation's leading golf specialty retailer. Over the past few years, we have made significant investments in our infrastructure, including information systems and experienced management, to support our growth strategy. To achieve our goal, we plan to expand our store base, including a total of 14 to 16 new stores in the current fiscal year, of which eleven have already been opened, and 14 to 16 new stores in fiscal 2007. We also plan to focus on leveraging our efficient direct-to-store distribution model that eliminates the need to support store growth with costly warehouse facilities, systems and related inventory; pursue a number of initiatives to continue to grow comparable store sales and increase store profitability; and expand our direct sales through both our eCommerce operations and toll-free telephone orders, both of which are supported by our in-house fulfillment and customer contact center.
Risks Affecting Us
Our business is subject to numerous risks as discussed more fully in the section entitled "Risk Factors" immediately following this Summary. In particular, the risks affecting us include the following:
- •
- we depend on the continued popularity of golf and golf-related products, the continued development of new golf-related products, and our ability to purchase and sell such products;
2
- •
- our ability to execute our accelerated growth strategy profitably in new and existing markets;
- •
- the effect of competition in our industry;
- •
- the effects of the economy;
- •
- the effects of weather;
- •
- if our business continues to grow, the continued growth may place strains on our systems and management team; and
- •
- if we are not able to access additional capital, our ability to expand our business may be impaired.
Office Location
Our principal executive offices are located at 7275 Flying Cloud Drive, Eden Prairie, Minnesota 55344 and our telephone number is (952) 941-8848. Our Internet site is located atwww.golfgalaxy.com. The information contained in our Internet site is not a part of this prospectus.
3
The Offering
| | | |||
|---|---|---|---|---|
| Common stock offered: | ||||
| By us | shares | |||
| By selling shareholders | shares | |||
| Total | shares | |||
| Common stock outstanding after the offering | shares | |||
| Offering price | $ per share | |||
| Use of proceeds | We intend to use our net proceeds from this offering, together with cash provided by operations and, if necessary, funds available under our credit facility, to continue to open new retail stores across the country and for general corporate purposes, including potential acquisitions, and we will use approximately $ million of our net proceeds to pay our preferred shareholders all of the accrued and unpaid dividends due upon conversion of their shares of outstanding preferred stock into shares of our common stock. We will not receive any of the proceeds from the sale of common stock offered by the selling shareholders. See "Use of Proceeds." | |||
Reserved Nasdaq National Market symbol | GGXY | |||
The number of shares of common stock outstanding after this offering excludes, as of June 27, 2005:
- •
- 873,125 shares of our common stock issuable upon exercise of currently outstanding options under our 1996 Stock Option and Incentive Plan, as amended (1996 Plan), at a weighted average exercise price of $5.43 per share;
- •
- 30,325 shares of our common stock reserved for future grants under our 1996 Plan;
- •
- 165,900 shares of our common stock issuable upon exercise of currently outstanding options under our 2004 Stock Incentive Plan (2004 Plan), at a weighted average price of $7.69 per share;
- •
- 167,500 shares of our common stock issuable to certain employees upon the exercise of options authorized for issuance under our 2004 Plan effective as of the date of this prospectus, at an exercise price equal to the price per share of our common stock sold in this offering;
- •
- 666,600 shares of our common stock reserved for future grants under our 2004 Plan; and
- •
- 14,921 shares of our common stock issuable upon exercise of an outstanding warrant having an exercise price of $6.30 per share.
Except as otherwise indicated, all information in this prospectus assumes:
- •
- no exercise of the underwriters' over-allotment option;
- •
- all outstanding shares of our preferred stock will convert into shares of common stock upon the closing of this offering; and
- •
- no outstanding options have been exercised since June 27, 2005.
4
You should read the summary financial data presented below in conjunction with the financial statements and the related notes and "Management's Discussion and Analysis of Financial Condition and Results of Operations" included elsewhere in this prospectus. Historical results are not necessarily indicative of the results of operations expected for future periods. Quarterly results are not necessarily indicative of full year results. See "Management's Discussion and Analysis of Financial Condition and Results of Operations—Quarterly Results of Operations and Seasonality."
Our fiscal year ends on the Saturday closest to the end of February, resulting in fiscal years of 52 or 53 weeks in length. Fiscal 2001, 2002, 2003, 2004 and 2005 represent the periods ended March 3, 2001, March 2, 2002, March 1, 2003, February 28, 2004 and February 26, 2005. Based on this schedule, fiscal 2001 was a 53-week year and all other fiscal years presented were 52-week years.
| | Fiscal Year Ended | Three Months Ended | |||||||||||||||||||||
|---|---|---|---|---|---|---|---|---|---|---|---|---|---|---|---|---|---|---|---|---|---|---|---|
| | March 3, 2001 | March 2, 2002 | March 1, 2003 | February 28, 2004 | February 26, 2005 | May 29, 2004 | May 28, 2005 | ||||||||||||||||
| | (in thousands, except per share data) | ||||||||||||||||||||||
| Statement of Operations Data | |||||||||||||||||||||||
| Net sales | $ | 77,608 | $ | 88,889 | $ | 85,213 | $ | 99,630 | $ | 133,080 | $ | 38,419 | $ | 58,570 | |||||||||
| Cost of sales | 59,033 | 67,909 | 63,745 | 72,403 | 93,964 | 26,856 | 40,342 | ||||||||||||||||
| Gross profit | 18,575 | 20,980 | 21,468 | 27,227 | 39,116 | 11,563 | 18,228 | ||||||||||||||||
| Operating expenses: | |||||||||||||||||||||||
| Store operating | 15,315 | 16,887 | 15,223 | 16,677 | 24,382 | 6,972 | 10,932 | ||||||||||||||||
| General and administrative | 5,659 | 6,803 | 4,709 | 6,876 | 8,372 | 2,147 | 3,102 | ||||||||||||||||
| Preopening | 1,433 | 260 | 113 | 1,065 | 2,095 | 518 | 1,310 | ||||||||||||||||
| Income (loss) from operations | (3,832 | ) | (2,970 | ) | 1,423 | 2,609 | 4,267 | 1,926 | 2,884 | ||||||||||||||
| Other income | — | — | — | — | 8,410 | (1) | — | — | |||||||||||||||
| Interest (expense) income, net | (441 | ) | (153 | ) | (109 | ) | (177 | ) | (4 | ) | (36 | ) | 15 | ||||||||||
| Income (loss) before income taxes | (4,273 | ) | (3,123 | ) | 1,314 | 2,432 | 12,673 | 1,890 | 2,899 | ||||||||||||||
| Income tax benefit (expense) | — | — | — | 5,145 | (2) | (5,135 | ) | (765 | ) | (1,206 | ) | ||||||||||||
| Net income (loss) | (4,273 | ) | (3,123 | ) | 1,314 | 7,577 | 7,538 | 1,125 | 1,693 | ||||||||||||||
| Less preferred stock dividends | — | (7,546 | ) | (3,169 | ) | (3,430 | ) | (3,696 | ) | (901 | ) | (998 | ) | ||||||||||
| Net (loss) income applicable to common shareholders | $ | (4,273 | ) | $ | (10,669 | ) | $ | (1,855 | ) | $ | 4,147 | $ | 3,842 | $ | 224 | $ | 695 | ||||||
| Net (loss) income per share: | |||||||||||||||||||||||
| Basic | $ | (2.42 | ) | $ | (6.03 | ) | $ | (1.03 | ) | $ | 2.29 | $ | 2.06 | $ | 0.12 | $ | 0.37 | ||||||
| Diluted | $ | (2.42 | ) | $ | (6.03 | ) | $ | (1.03 | ) | $ | 0.99 | $ | 0.98 | $ | 0.11 | $ | 0.21 | ||||||
| Weighted average basic shares outstanding | 1,768 | 1,771 | 1,800 | 1,814 | 1,866 | 1,862 | 1,884 | ||||||||||||||||
| Weighted average diluted shares outstanding | 1,768 | 1,771 | 1,800 | 7,691 | 7,721 | 1,951 | 8,043 | ||||||||||||||||
5
| | Fiscal Year Ended | Three Months Ended | ||||||||||||||||||||
|---|---|---|---|---|---|---|---|---|---|---|---|---|---|---|---|---|---|---|---|---|---|---|
| | March 3, 2001 | March 2, 2002 | March 1, 2003 | February 28, 2004 | February 26, 2005 | May 29, 2004 | May 28, 2005 | |||||||||||||||
| | (dollars in thousands) | |||||||||||||||||||||
| Other Financial Data | ||||||||||||||||||||||
| Gross profit as a percentage of sales | 23.9 | % | 23.6 | % | 25.2 | % | 27.3 | % | 29.4 | % | 30.1 | % | 31.1 | % | ||||||||
| Store contribution(3) | $ | 3,260 | $ | 4,093 | $ | 6,245 | $ | 10,550 | $ | 14,734 | $ | 4,591 | $ | 7,296 | ||||||||
| Store contribution margin(4) | 4.2 | % | 4.6 | % | 7.3 | % | 10.6 | % | 11.1 | % | 11.9 | % | 12.5 | % | ||||||||
| Adjusted EBITDA(5) | $ | (1,423 | ) | $ | (334 | ) | $ | 3,821 | $ | 5,010 | $ | 7,496 | $ | 2,633 | $ | 4,026 | ||||||
Store Data | ||||||||||||||||||||||
| Comparable store sales increase (decrease)(6) | 2.4 | % | 0.1 | % | (2.4 | )% | 5.6 | % | 6.7 | % | 7.4 | % | 10.5 | % | ||||||||
| Number of stores at end of period | 19 | 20 | 20 | 24 | 34 | 29 | 45 | |||||||||||||||
| Selling square feet at end of period(7) | 314,861 | 328,257 | 328,257 | 382,169 | 516,551 | 450,370 | 676,380 | |||||||||||||||
| Average inventory per store(8) | $ | 993 | $ | 925 | $ | 870 | $ | 863 | $ | 872 | — | — | ||||||||||
(1)Represents the gain realized on the sale of our equity investment in Golf Town Canada Inc. See "Business—Golf Town Canada."
(2)The income tax benefit in fiscal 2004 is due to the reversal of an income tax valuation allowance against our net deferred tax assets generated in prior fiscal years, partially offset by the fiscal 2004 income tax provision. See "Management's Discussion and Analysis of Financial Condition and Results of Operations" and "Notes to Financial Statements" elsewhere in this prospectus for more information.
(3)Store contribution consists of income (loss) from operations, before the effect of general and administrative costs and pre-opening costs. This term, as we define it, may not be comparable to a similarly titled measure used by other companies and is not a measure of performance presented in accordance with GAAP. We use store contribution as a measure of operating performance for our retail operations as a supplement, but not as a substitute for income (loss) from operations or other financial data prepared in accordance with GAAP.
We believe store contribution is useful to an investor evaluating our operating performance because:
- •
- it provides a measure of the incremental contribution of store operations without the impact of general and administrative costs; and
- •
- it helps investors more meaningfully evaluate and compare the results of our operations from period to period by removing the impact of the cost of opening new stores, which varies due to the timing, location, format and number of new store openings.
Our management uses store contribution:
- •
- to assist in evaluating retail operating performance because we believe it provides:
- –
- a measure of the incremental contribution of store operations net of advertising and depreciation without the impact of general and administrative costs; and
- –
- a measure of the results of retail operations excluding the incremental costs related to preparing and opening new stores, which do not directly impact the operating results of existing stores and vary from period to period depending on the timing, location, format and number of new store openings; and
- •
- in presentations to the members of our board of directors to enable our board to have the same consistent measurement basis of operating performance used by management.
6
The following table provides a reconciliation of income (loss) from operations to store contribution.
| | Fiscal Year Ended | Three Months Ended | |||||||||||||||||||
|---|---|---|---|---|---|---|---|---|---|---|---|---|---|---|---|---|---|---|---|---|---|
| | March 3, 2001 | March 2, 2002 | March 1, 2003 | February 28, 2004 | February 26, 2005 | May 29, 2004 | May 28, 2005 | ||||||||||||||
| | (dollars in thousands) | ||||||||||||||||||||
| Income (loss) from operations | $ | (3,832 | ) | $ | (2,970 | ) | $ | 1,423 | $ | 2,609 | $ | 4,267 | $ | 1,926 | $ | 2,884 | |||||
| General and administrative expenses | 5,659 | 6,803 | 4,709 | 6,876 | 8,372 | 2,147 | 3,102 | ||||||||||||||
| Preopening expenses | 1,433 | 260 | 113 | 1,065 | 2,095 | 518 | 1,310 | ||||||||||||||
| Store contribution | $ | 3,260 | $ | 4,093 | $ | 6,245 | $ | 10,550 | $ | 14,734 | $ | 4,591 | $ | 7,296 | |||||||
(4)Calculated as store contribution divided by net sales for the fiscal period. See footnote 3, above, for a discussion of store contribution and a reconciliation of income (loss) from operations to store contribution.
(5)Adjusted EBITDA consists of net income (loss), before the effect of net interest expense, income tax expense or benefit, non-operating income and depreciation and amortization. This term, as we define it, may not be comparable to a similarly titled measure used by other companies and is not a measure of performance presented in accordance with GAAP. We use Adjusted EBITDA as a measure of operating performance, but we do not use it as a measure of liquidity. Adjusted EBITDA should not be used as a measure of liquidity or considered as a substitute for net income (loss), net cash provided by or used in operations, or other financial data prepared in accordance with GAAP.
We believe Adjusted EBITDA is useful to an investor in evaluating our operating performance because:
- •
- it measures our operating performance without regard to items such as depreciation and amortization, which can vary depending upon accounting methods, the book value of assets, and the method by which assets were acquired;
- •
- it helps investors more meaningfully evaluate and compare the results of our operations from period to period by removing the impact of our capital structure, primarily net interest expense from our credit facility, and our non-operating income; and
- •
- it helps investors more meaningfully evaluate and compare the results of our operations from period to period by removing the impact of net income tax expense or benefit, which can vary over time based on changes in management's estimates and assumptions related to current and future operating results, income tax rates and income tax laws.
Our management uses Adjusted EBITDA:
- •
- as a measurement of operating performance because it assists us in comparing our performance on a consistent basis, as it removes from our operating results the impact of:
- –
- our asset base, including the impact of depreciation and amortization of our assets, which can vary depending on the book value and method of acquisition of the assets;
- –
- income tax expense or benefit, which can vary significantly based on management's estimates and assumptions related to current and future operating results, tax rates and regulations;
- –
- our capital structure, including the impact of interest expense from our credit facility and interest income on invested funds; and
- –
- our non-operating income; and
- •
- in presentations to the members of our board of directors to enable our board to have the same consistent measurement basis of operating performance used by management.
7
The following table provides a reconciliation of net income (loss) to Adjusted EBITDA.
| | Fiscal Year Ended | Three Months Ended | |||||||||||||||||||||
|---|---|---|---|---|---|---|---|---|---|---|---|---|---|---|---|---|---|---|---|---|---|---|---|
| | March 3, 2001 | March 2, 2002 | March 1, 2003 | February 28, 2004 | February 26, 2005 | May 29, 2004 | May 28, 2005 | ||||||||||||||||
| | (dollars in thousands) | ||||||||||||||||||||||
| Net income (loss) | $ | (4,273 | ) | $ | (3,123 | ) | $ | 1,314 | $ | 7,577 | $ | 7,538 | $ | 1,125 | $ | 1,693 | |||||||
| Adjusted for: | |||||||||||||||||||||||
| Income tax (benefit) expense | — | — | — | (5,145 | ) | 5,135 | 765 | 1,206 | |||||||||||||||
| Interest expense (income), net | 441 | 153 | 109 | 177 | 4 | 36 | (15 | ) | |||||||||||||||
| Other income | — | — | — | — | (8,410 | ) | — | — | |||||||||||||||
| Depreciation and amortization | 2,409 | 2,636 | 2,398 | 2,401 | 3,229 | 707 | 1,142 | ||||||||||||||||
| Adjusted EBITDA | $ | (1,423 | ) | $ | (334 | ) | $ | 3,821 | $ | 5,010 | $ | 7,496 | $ | 2,633 | $ | 4,026 | |||||||
(6)A new or relocated store is included in the comparable store base after it has been in operation for 12 full fiscal months following the month of the store's grand opening weekend. A store that is closed for remodel or repair is excluded from the comparable store sales calculation during the period of closure and the comparable period of the succeeding year. Sales from our eCommerce operations are not included in the comparable store sales calculation. Comparable store results for a 53-week fiscal year are presented on a 52/52 week basis.
(7)We define selling square feet to include all space where we conduct retail activities with our customers, including the PGA services area, hitting nets, golf simulators and check-out areas. Selling square feet excludes our receiving and back room storage areas, management office space, employee breakrooms, restrooms and vacant space.
(8)Average inventory per store represents the 12 fiscal month average inventory for stores open through the full fiscal year excluding our eCommerce operations. Inventory includes inventory at average cost, before adjustments for shrink, obsolescence, capitalized freight and vendor funding.
Recent Developments
For the fiscal month ended July 2, 2005, our net sales were $ , an increase of % over net sales of $ for the comparable period of the prior fiscal year. The increase reflected additional sales from new stores opened in fiscal 2005 and the first quarter of fiscal 2006, and a comparable store sales increase of % for the fiscal month ended July 2, 2005. These results are not necessarily indicative of full quarter or full year results.
8
An investment in our common stock involves a high degree of risk. You should carefully consider the risks described below before participating in this offering. If any of the following risks actually occur, our business, financial condition, operating results or cash provided by operations could be materially harmed. As a result, the trading price of our common stock could decline, and you might lose all or part of your investment. When determining whether to buy our common stock, you should also refer to the other information in this prospectus, including our financial statements and the related notes.
Risks Related to Golf Galaxy, Inc.
A decline in the popularity of golf or the market for golf-related products and services could materially adversely affect our sales and profitability.
We generate substantially all of our sales from the sale of golf-related equipment, apparel and services. The demand for our products and services is directly related to the popularity of golf, including the number of golf participants, the number of rounds of golf being played by these participants, and television viewership of and attendance at professional and other golf tournaments and events. According to the NGF, the number of golf rounds played declined slightly from 2001 to 2003 due, we believe, to a number of factors including a decline in the stock market, a weak economy, reduced leisure travel and unfavorable weather. If golf participation or golf rounds played significantly decreases, sales of our products and services could be materially adversely affected. We depend on the exposure of the brands we sell to reinforce the quality of the products we sell. Any significant reduction in television coverage of professional or other golf tournaments and events, or any other significant decreases in either attendance at golf tournaments or viewership of golf tournaments, will reduce the visibility of the brands we sell and could materially adversely affect our sales and profitability.
If our key suppliers limit the amount or variety of products they sell to us or provide us less favorable pricing, allowances or other terms, our sales and profitability could be materially adversely affected.
We rely on a limited number of suppliers of the leading national brands in golf for a majority of our sales. During fiscal 2005, we purchased approximately 60% of our merchandise from our five largest suppliers. Three of our suppliers that provide multiple golf brands, namely Acushnet Company (Titleist,FootJoy andCobra), Callaway Golf Company (Callaway,Odyssey,Top-Flite andBen Hogan) and Taylor Made Golf Company (TaylorMade,adidas andMaxfli), each represented more than 10% of our purchases. Our extensive assortment of leading national brand merchandise is one of our key competitive strengths. Our customers expect to find the leading national brands and the newest products in the market in our stores. We are also subject to risks, such as the unavailability of raw materials, labor disputes, union organizing activity, strikes, inclement weather, natural disasters, war and terrorism, and adverse general economic and political conditions, as well as the high demand for popular products, that might limit our suppliers' ability to provide us with quality merchandise on a timely basis. Due to our extensive purchases of merchandise, we benefit from vendor pricing allowances and marketing support in the ordinary course of business. We have no long-term contractual arrangements providing for continued supply, pricing, allowances or other terms from our key suppliers and our suppliers may discontinue selling to us, or may alter pricing, allowances or other terms at any time. If our suppliers refuse to distribute their products to us, limit the amount or variety of products they distribute to us, or provide us with less favorable pricing, allowances or other terms, our sales and profitability may be materially and adversely affected.
9
Our sales and profitability could be materially adversely affected if our suppliers fail to develop and introduce new products or if the introduction of new products results in excessive close-outs of existing inventories.
Our future success will depend, in part, upon our suppliers' continued ability to develop and introduce innovative products in the golf equipment market that appeal to our customers. The success of new products depends in part upon the various subjective preferences of golfers, including a golf club's "look and feel," and the level of acceptance that the golf product has among professional and recreational golfers. The subjective preferences of purchasers of golf products are difficult to predict and may be subject to rapid and unanticipated changes. If our suppliers fail to successfully develop and introduce innovative and popular products on a timely basis, then our sales and profits may suffer materially. If our suppliers introduce new products too rapidly, however, it could result in close-outs of existing inventories. Close-outs can result in reduced margins on the sale of older products, as well as reduced sales of new products given the availability of older products at lower prices. These reduced margins and sales may materially adversely affect our results of operations.
Our operating results are subject to seasonal fluctuations which could cause the market price of our common stock to decline.
Our business is highly seasonal. Our sales during our first two fiscal quarters of each year, which include Father's Day, and our sales during the year-end holiday selling season, have historically contributed and are expected to continue to contribute a disproportionate percentage of our sales. Our occupancy costs, which are included in cost of sales, and a significant portion of our store operating expenses and general and administrative expenses, do not vary proportionately with fluctuations in sales. As a result, all our income from operations has been generated during the first two fiscal quarters of the year, and we expect this seasonality to continue. In addition, we expect quarterly fluctuations in our operating results to continue as a result of seasonal demand in our markets. Such patterns may change, however, as a result of entering new markets. We also make decisions regarding merchandise well in advance of the season in which it will be sold, particularly for Father's Day and the year-end holiday selling season. We incur significant additional expenses in our first two fiscal quarters and the December holiday season in anticipation of higher sales in those periods, including acquiring additional inventory, preparing and mailing our direct mail pieces, advertising, creating in-store promotions and hiring additional employees. This seasonality may result in volatility or have an adverse effect on the market price for our common stock.
Our profitability may be materially adversely affected due to weather conditions in our markets.
The golf season and the number of rounds played in the markets in which our stores are located fluctuate based on, among other things, the weather. In the event of unseasonable weather in our markets, our sales may be lower. In addition, if our sales during our peak seasons are lower than we expect for any reason as a result of weather or otherwise, we may not be able to adjust our expenses and inventory in a timely fashion. As a result, our profitability may be materially adversely affected.
Our current concentration of stores in northern and midwestern states makes us highly susceptible to adverse conditions in these regions, including unseasonable weather, which could materially adversely affect our sales and profitability.
Most of our stores are located in northern and midwestern states. As a result, our operations could be more susceptible to regional factors than the operations of more geographically diversified competitors. These factors include regional economic and weather conditions, natural disasters, and demographic and population changes in the states in which we operate. If these regions were to suffer an economic downturn, unseasonable weather or other adverse event, our operating results could suffer.
10
If we cannot successfully implement our growth strategy, the profitability of our company as a whole could be materially adversely affected.
Our growth strategy will require the deployment of a significant amount of capital and may not be profitable. We opened no new stores in fiscal 2003. During fiscal 2004, we opened four new stores. During fiscal 2005, we opened ten new stores and prepared to open eleven new stores in the first quarter of fiscal 2006, all of which were opened.
We currently plan to spend approximately $1.1 million per store to open a total of 14 to 16 new stores in fiscal 2006, of which eleven have already been opened. In addition, we plan to open 14 to 16 new stores in fiscal 2007. These amounts are estimates and actual store opening costs may vary.
The ability to open new stores, the related opening costs and the profitability of our new stores are subject to various contingencies, some of which are beyond our control. These contingencies include our ability to:
- •
- locate suitable store sites;
- •
- negotiate acceptable lease terms;
- •
- build out or refurbish sites on a timely and cost-effective basis;
- •
- hire, train and retain skilled managers and PGA professionals;
- •
- hire sales associates;
- •
- obtain adequate capital resources; and
- •
- integrate new stores into existing operations successfully.
We intend to open additional stores in some of our existing markets. Because our stores typically draw customers from their local areas, a new store may draw customers away from nearby existing stores and may cause sales performance and customer counts at those existing stores to decline, which may materially adversely affect our overall operating results.
We also intend to open stores in new markets. The risks associated with entering a new market include difficulties in attracting customers due to a reduced level of customer familiarity with our brand, our lack of familiarity with local customer preferences, seasonal differences in the market, and difficulties in hiring a sufficient number of qualified store associates. In addition, entry into new markets may bring us into competition with new, unfamiliar competitors or with existing competitors with a large, established market presence. We cannot assure you that we will be successful in operating our stores in new markets on a profitable basis. If we are not, then the profitability of our company as a whole may be materially adversely affected.
In addition to these risks and uncertainties, our new stores may add strain on our management information systems and may divert our management's attention from existing operations. We cannot assure you that our new stores will be a profitable deployment of our capital resources. If any of our new stores are not profitable, then the profitability of our company as a whole may be materially adversely affected.
11
Competition in the golf and sporting goods retail industry and from prospective competitors could materially adversely affect our sales and profitability.
The retail market for golf-related products and services is highly fragmented and competitive. Our current and prospective competitors include companies that have substantially greater market presence, name recognition, and financial, marketing and other resources than we do and may be able to devote greater resources to sourcing, promoting and selling their products. We compete with the following categories of companies: other golf specialty retailers, on-course pro shops, catalog and Internet retailers, franchise and independent golf retailers, general sporting goods retailers and mass merchants. Traditional and golf specialty retailers are expanding more aggressively in marketing leading national brand golf equipment, thereby competing directly with us for products, customers and locations. In addition, some of our key suppliers have begun to operate retail stores or Internet sites that sell directly to consumers and may compete with us and reduce our sales. Pressure from our competitors could require us to reduce our prices or increase our spending for advertising and promotion which would erode our margins. As a result of this competition, we may experience lower sales or greater operating costs, such as marketing costs, which would have a material adverse effect on our profitability.
A decline in discretionary consumer spending could harm our operating results.
Our products are recreational in nature and, therefore, are discretionary purchases for consumers. Consumers are generally more willing to make discretionary purchases of golf-related products and services during favorable economic conditions. Discretionary spending is affected by many factors, including, among others, general business conditions, interest rates, inflation, consumer debt levels, the availability of consumer credit, taxation, stock market performance, unemployment trends, terrorist attacks and acts of war and other matters that influence consumer confidence and spending.
Our customers' purchases of discretionary items, including our products and services, could decline during periods when disposable income is lower or periods of actual or perceived unfavorable economic conditions. If this occurs, our operating results could suffer materially.
The growth of our business will be dependent upon the availability of adequate capital.
The growth of our business will depend on the availability of adequate capital, which in turn will depend in large part on cash flow generated by our business and the availability of equity and debt financing. We cannot assure you that our operations will generate positive cash flow or that we will be able to obtain equity or debt financing on acceptable terms or at all. Our credit facility contains provisions that restrict our ability to incur additional indebtedness or make substantial asset sales that might otherwise be used to finance our expansion. The security interests in our inventory and financial assets that secure our obligations under the credit facility may further limit our access to certain capital markets or lending sources. The actual availability of funds under our credit facility is limited to specified percentages of our eligible inventory. Accordingly, opportunities for increasing our cash on hand through sales of inventory would be partially offset by reduced availability under our credit facility. As a result, we cannot assure you that we will be able to finance our current expansion plans.
If we lose the services of key members of our management team, we may not be able to manage our operations and implement our growth strategy effectively.
Our future success depends, in large part, on the efforts and abilities of our senior management, including our Chief Executive Officer and co-founder, Randall K. Zanatta; our Chief Operating Officer and co-founder, Gregory B. Maanum; our Chief Financial Officer, Richard C. Nordvold; our Chief Marketing Officer, Michael W. McCormick; and our Senior Vice President—Sales and Operations, Ronald G. Hornbaker. Our senior management team may terminate their employment with us and are
12
precluded from competing with us for only six months after such termination. We do not maintain key person insurance on any employees except for Messrs. Zanatta and Maanum. If we lose the services of one or more of our key executives, we may not be able to manage our business successfully or achieve our growth objectives. As our business grows, we will need to attract and retain additional qualified management personnel in a timely manner.
We rely heavily on our management information and other systems for inventory management, distribution and other functions. If our systems fail to perform these functions adequately or if we experience an interruption in their operation or security, our business and results of operations could be materially adversely affected.
The efficient operation of our business is dependent on our management information systems. We rely heavily on our management information systems to manage order entry, order fulfillment, point-of-sale and inventory replenishment processes. The failure of our management information systems to perform as we anticipate could disrupt our business and could result in decreased sales, increased overhead costs, excess inventory and product shortages, causing our business and results of operations to suffer materially.
In addition, our management information systems are vulnerable to damage or interruption from:
- •
- earthquake, fire, flood and other natural disasters; and
- •
- power loss, computer systems failure, Internet and telecommunications or data network failure.
Any such interruption could have a material adverse effect on our business.
If we are unable to protect the confidential information provided by our eCommerce customers, our sales and profitability may be materially adversely affected.
The success of our eCommerce operations depends on the secure transmission of confidential information over public networks. There can be no assurance that advances in computer capabilities, new discoveries in the field of cryptography, or other events or developments will not result in a compromise or breach of the algorithms we use to protect customer transactions and personal data contained in our customer database. If any such compromise of our security were to occur, it could have a material adverse effect on our reputation, business, operating results and financial condition and may cost us additional expense to protect against such security breaches.
A disruption in or failure to expand our systems supporting our eCommerce operations, particularly as our eCommerce sales grow, may materially adversely affect our results of operations.
Our eCommerce sales will depend on the number of visitors who shop on our Internet site and the volume of orders we can fill on a timely basis. We rely on several third party providers to host our Internet site and support our electronic data interchange, or EDI, system. Technical problems either we or our third party service providers experience with our Internet site or order fulfillment systems could materially reduce the volume of goods sold and the attractiveness of purchasing our merchandise through our Internet site. Also, we or our third party service providers may be required to further expand and upgrade our technology, transaction processing systems and network infrastructure if there is a substantial increase in the volume of traffic on our Internet site or the number of orders placed by our customers. We cannot assure you that we will be able to project accurately the rate or timing of increases, if any, or be able to negotiate with our third party providers, to expand and upgrade our systems and infrastructure to accommodate such increases on a timely basis.
13
A change in U.S. GAAP accounting standards for employee stock options will have a significant adverse effect on the reporting of our results of operations.
In December 2004, the Financial Accounting Standards Board (FASB) issued a revision to Statement of Financial Accounting Standards (SFAS) No. 123,Accounting for Stock-Based Compensation, which requires the calculation of the fair value of stock-based compensation, estimation of future forfeitures and income taxes, and recognition of the fair value as a non-cash expense over the vesting period of the underlying instruments. SFAS No. 123(R),Share-Based Payment, eliminates the ability to account for stock-based compensation transactions using the footnote disclosure-only provisions of Accounting Principles Board (APB) Opinion No. 25,Accounting for Stock Issued to Employees, and instead requires that such transactions be recognized and reflected in financial statements using a fair-value-based method. Based on current guidance, we will be required to implement the provisions of SFAS No. 123(R) beginning in fiscal 2007. We are currently evaluating option valuation methodologies and assumptions. We expect that we will record substantial non-cash compensation expenses as a result of the adoption of SFAS No. 123(R), which will have a significant adverse impact on our results of operations.
If we do not anticipate and respond to the changing preferences of our customers, we could be required to take significant markdowns in inventory and our sales could materially decline.
Our success depends, in large part, on our ability to identify and anticipate the changing preferences of our customers and stock our stores with a wide selection of quality merchandise that appeals to their preferences. Our customers' preferences for merchandise and particular brands vary from location to location, and may vary significantly over time. We cannot guarantee that we will accurately identify or anticipate the changing preferences of our customers or stock our stores with merchandise that appeals to them. If we do not accurately identify and anticipate our customers' preferences, we may lose sales, which may in turn cause us to lose volume purchasing allowances from vendors, or we may overstock merchandise, which may require us to take significant markdowns on our inventory. In either case, our sales could significantly decline and our business and financial results may suffer materially.
A disruption in the services of our primary common carriers may decrease our profitability.
We do not maintain a central distribution facility. Instead, one of our key strategies is that our manufacturers distribute their products directly to our retail stores, enabling us to more effectively control the level and mix of inventory at our stores. We use United Parcel Service of America, Inc. (UPS) and Roadway Express, Inc. (Roadway) for substantially all of our ground shipments of products sold in our stores. Any significant interruption in UPS or Roadway services or in common carrier services generally due to strikes, terrorism, inclement weather or otherwise, would impede our ability to receive merchandise on a timely basis and maintain appropriate inventory levels and product mixes in our stores. This impediment could cause us to lose sales and customers. In the event of such an interruption, we may not be able to engage appropriate alternatives to distribute our products in a timely manner on equally favorable terms. If we incur higher shipping costs, we may be unable to pass these costs on to our customers, which could materially decrease our profitability.
If we are unable to enforce our intellectual property rights, or if we are accused of infringing on a third party's intellectual property rights, our sales and profitability may be materially adversely affected.
We currently own two registered trademarks and three registered service marks in the U.S. The exclusive right to use these trademarks and service marks has helped establish our market share. The loss or reduction of any of our significant proprietary rights could hurt our ability to distinguish our stores from our competitors' stores, causing us to lose significant market share. If we lose market share, our sales and profitability may be materially adversely affected.
14
Additionally, third parties may assert claims against us alleging infringement, misappropriation or other violations of patent, trademark or other proprietary rights, whether or not such claims have merit. Such claims can be time consuming and expensive to defend and could require us to cease using and selling the allegedly infringing products, which may have a significant impact on our sales and cause us to incur significant litigation costs and expenses.
We may pursue strategic acquisitions, which could have a material adverse impact on our business.
While we are not currently considering any acquisitions, we have considered acquisitions in the past and we may from time to time acquire complementary businesses, products or technologies. Acquisitions may result in difficulties in assimilating acquired companies, and may result in the diversion of our capital and our management's attention from other business issues and opportunities. We may not be able to successfully integrate companies that we acquire, including their personnel, financial systems, distribution, operations and general store operating procedures. If we fail to successfully integrate acquired companies, our business could suffer. In addition, the integration of any acquired company, and its financial results, into ours may materially adversely affect our operating results.
Our net income in fiscal 2004 and fiscal 2005 was positively impacted by non-recurring items which might cause investors to overestimate our future net income.
Our net income in fiscal 2005 included a one-time gain on the sale of our Golf Town Canada Inc. stock which increased net income by $5.0 million, after taxes, and our net income for fiscal 2004 included a non-cash income tax benefit totaling $6.2 million resulting from the reversal of a previously established income tax valuation allowance. These non-recurring items might cause investors to overestimate net income results in future years if the non-recurring items are not fully considered.
Risks Related to this Offering
We may issue shares of preferred stock without shareholder approval, which could materially adversely affect the rights of holders of our common stock.
Our articles of incorporation permit us to establish the rights, privileges, preferences and restrictions, including voting rights, of future series of our preferred stock and to issue such stock without approval from our shareholders. The rights of holders of our common stock may suffer materially as a result of the rights granted to holders of preferred stock that may be issued in the future. In addition, we could issue preferred stock to prevent a change in control of our company, depriving holders of our common stock of an opportunity to sell their stock at a price in excess of the prevailing market price.
Certain provisions of Minnesota law and our articles of incorporation and bylaws may make a takeover of our company more difficult, depriving shareholders of opportunities to sell shares at above-market prices.
Certain provisions of Minnesota law and our bylaws may have the effect of discouraging attempts to acquire us without the approval of our board of directors. Section 302A.671 of the Minnesota Statutes, with certain exceptions, requires approval of any acquisition of the beneficial ownership of 20% or more of our voting stock then outstanding by a majority vote of our shareholders prior to its consummation. In general, shares acquired in the absence of such approval are denied voting rights and are redeemable by us at their then fair market value within 30 days after the acquiring person failed to give a timely information statement to us or the date our shareholders voted not to grant voting rights to the acquiring person's shares. Section 302A.673 of the Minnesota Statutes generally prohibits any business combination by us, with an interested shareholder, which includes any shareholder that purchases 10% or more of our voting shares within four years following such
15
interested shareholder's share acquisition date, unless the business combination is approved by a committee of one or more disinterested members of our board of directors before the interested shareholder's share acquisition date. In addition, our bylaws, effective upon the closing of this offering, provide for an advance notice procedure for nomination of candidates to our board of directors that could have the effect of delaying, deterring or preventing a change in control. Consequently, our holders of our common stock may lose opportunities to sell their stock for a price in excess of the prevailing market price due to these statutory protective measures.
In addition, our board of directors has amended our articles of incorporation and bylaws, effective upon the closing of this offering, to classify our board of directors so that only one-third of our directors are elected each year. Our shareholders approved the amendments to our articles of incorporation at a meeting held on June 15, 2005. A classified board will have the effect of discouraging, delaying or preventing a change in control or an unsolicited proposal that a shareholder might consider favorable, including a proposal that might result in the payment of a premium over the market price for the shares held by shareholders.
See "Description of Capital Stock—Potential Anti-Takeover Effects of Certain Provisions of Minnesota State Law and Our Articles of Incorporation and Bylaws—Articles of Incorporation and Bylaws" for more information regarding these provisions of Minnesota law.
Our management will have broad discretion regarding the use of proceeds from this offering and we may use our proceeds from this offering in ways with which you may disagree.
We estimate that we will receive net proceeds from this offering of approximately $ million. We intend to use the net proceeds from our sale of shares in this offering to continue to open new retail stores across the country and for general corporate purposes, and we will use approximately $ million of our net proceeds to pay our preferred shareholders all of the accrued and unpaid dividends due upon conversion of their shares of preferred stock into shares of our common stock. Our management will have broad discretion, however, regarding how we use our proceeds from this offering and the occurrence of unforeseen events or changes in business conditions could result in the application of our net proceeds from this offering in a manner other than described in this prospectus and you may disagree with the way our management allocates these funds.
We will face new challenges and increased costs as a public company.
As a public company with a listed equity security, we will need to comply with new laws, regulations and requirements, certain provisions of the Sarbanes-Oxley Act of 2002, related Securities and Exchange Commission (SEC) regulations and requirements of the Nasdaq National Market with which we are not required to comply as a private company. Complying with these statutes, regulations and requirements will occupy a significant amount of the time of our board of directors and management and will increase our costs and expenses. We will need to:
- •
- create or expand the roles and duties of our board of directors, our board committees and management;
- •
- establish an internal audit function;
- •
- institute a more comprehensive compliance function;
- •
- design, establish, evaluate and maintain a system of internal control over financial reporting in compliance with the requirements of Section 404 of the Sarbanes-Oxley Act
16
- •
- prepare and distribute periodic public reports in compliance with our obligations under the federal securities laws;
- •
- establish new internal policies, such as those relating to disclosure controls and procedures and insider trading;
- •
- Involve and retain to a greater degree outside counsel and accountants in the above activities; and
- •
- enhance our investor relations function.
of 2002 and the related rules and regulations of the SEC and the Public Company Accounting Oversight Board (PCAOB);
In addition, we expect that being a public company subject to these rules and regulations will make it more expensive for us to obtain director and officer liability insurance, and we may be required to accept reduced coverage or incur substantially higher costs to obtain coverage. These factors could also make it more difficult for us to attract and retain qualified members of our board of directors, particularly to serve on our audit and compensation committees, and qualified executive officers.
We will be exposed to risks relating to evaluations of controls required by Section 404 of the Sarbanes-Oxley Act of 2002.
Following this offering, we will begin evaluating our internal controls systems to allow management to report on, and our independent auditors to attest to, our internal control over financial reporting. We will be performing the system and process evaluation and testing (and any necessary remediation) required to comply with the management certification and auditor attestation requirements of Section 404 of the Sarbanes-Oxley Act of 2002. We are required to comply with Section 404 by no later than March 3, 2007. However, we cannot be certain as to the timing of completion of our evaluation, testing and remediation actions or the impact of the same on our operations. Furthermore, upon completion of this process, we may identify control deficiencies of varying degrees of severity under applicable SEC and PCAOB rules and regulations that remain unremediated. As a public company, we will be required to report, among other things, control deficiencies that constitute a "material weakness" or changes in internal controls that, or are reasonably likely to, materially affect our internal control over financial reporting. A "material weakness" is a significant deficiency, or combination of significant deficiencies, that results in more than a remote likelihood that a material misstatement of the annual or interim financial statements will not be prevented or detected. If we fail to implement the requirements of Section 404 in a timely manner, we might be subject to sanctions or investigation by regulatory authorities such as the SEC or the Nasdaq National Market, and if we fail to remedy any material weakness, our financial statements may be inaccurate, we may face restricted access to the capital markets and our stock price may be adversely affected.
We cannot assure you that a market will develop for our common stock or, if a market develops, what the market price of our common stock will be.
The initial public offering price for our common stock will be determined through our negotiations with the underwriters and may not bear any relationship to the market price at which it will trade after this offering. Before this offering, there was no public trading market for our common stock and we cannot assure you that one will develop or be sustained after this offering. If a market does not develop or is not sustained, it may be difficult for you to sell your shares of common stock at an attractive price or at all. We cannot predict the prices at which our common stock will trade.
17
The price of our common stock may be volatile.
The trading price of our common stock following this offering may fluctuate substantially. The price of our common stock after this offering may be higher or lower than the price you pay, depending on many factors, some of which are beyond our control and may not be related to our operating performance. These fluctuations could cause you to lose part or all of your investment in shares of our common stock. The factors that could cause fluctuations include, but are not limited to, the following:
- •
- price and volume fluctuations in the overall stock market from time to time;
- •
- significant volatility in the market price and trading volume of the stock of golf specialty, sporting goods and other retail companies;
- •
- actual or anticipated changes in our net income, fluctuations in our operating results or the failure to meet the expectations of financial market analysts and investors;
- •
- investor perceptions of the golf and sporting goods industry and retail industries in general and our company in particular;
- •
- the operating and stock performance of comparable companies and our competitors;
- •
- the opening of new stores and the closing of existing stores;
- •
- general economic conditions and trends;
- •
- major catastrophic events;
- •
- changes in accounting standards, policies, guidance, interpretation or principles;
- •
- unseasonable weather conditions in our markets;
- •
- loss of external funding sources;
- •
- adverse events affecting our key suppliers;
- •
- sales of large blocks of our stock or sales by insiders; or
- •
- departures of key personnel.
If you purchase shares of common stock sold in this offering, you will experience immediate dilution.
If you purchase shares of our common stock in this offering, you will experience significant immediate dilution, which would have been $ per share as of based on an assumed initial public offering price of $ per share, because the price that you pay will be substantially greater than the net book value per share of the shares you acquire. You will experience additional dilution upon the exercise of options and the warrant to purchase our common stock, including those options currently outstanding and those granted in the future, and any issuance of restricted stock or other equity awards under our stock incentive plans.
18
We do not anticipate paying cash dividends on shares of our common stock in the foreseeable future.
We have never declared or paid any cash dividends on shares of our common stock. We intend to retain any future earnings to fund the operation and expansion of our business and, therefore, we do not anticipate paying cash dividends on shares of our common stock in the foreseeable future. In addition, our credit facility restricts, among other things, our ability to pay cash dividends or other non-stock distributions on any shares of our common stock.
Our principal shareholders, directors and executive officers may exercise significant control over our company.
Our principal shareholders, directors and executive officers, and entities affiliated with them, will own approximately % of the outstanding shares of our common stock after this offering. As a result, these shareholders, if acting together, will be able to influence or control matters requiring approval by our shareholders, including the election of directors and the approval of mergers or other extraordinary transactions. They may also have interests that differ from yours and may vote in a way with which you disagree and which may be adverse to your interests. The concentration of ownership may have the effect of delaying, preventing or deterring a change of control of our company, could deprive our shareholders of an opportunity to receive a premium for their common stock as part of a sale of our company and might ultimately affect the market price of our common stock.
Common stock available for future sale by our shareholders may materially adversely affect our stock price.
We may sell additional shares of common stock in subsequent public offerings. We may also issue additional shares of common stock to finance future acquisitions. After the completion of this offering, we will have outstanding shares of common stock. This number includes shares that we are selling in this offering, which may be resold immediately in the public market. shares of our common stock, or % of our total outstanding shares, are restricted from immediate resale under the federal securities laws and the lock-up agreements between certain of our current shareholders and the underwriters described in the section entitled "Underwriting," but may be sold into the market in the near future. These shares will become available for sale at various times following the expiration of the lock-up agreements which, without the prior consent of Piper Jaffray, is 180 days (subject to an extension of no more than 34 days as a result of an earnings release by us) after the date of this prospectus, subject to volume limitations and manner-of-sale requirements under Rule 144 of the Securities Act of 1933, as amended (Securities Act). However, Piper Jaffray may release all or a portion of these shares subject to lock-up agreements at any time without notice. The period immediately following expiration of the lock-up agreements may experience relatively higher levels of selling activity.
After this offering, several of our existing shareholders owning shares of our common stock, are expected to be parties to a registration rights agreement with us. Under that agreement, these shareholders will have the right, after the expiration of the lock-up period, to require us to effect the registration of their shares. In addition, if we propose to register, or are required to register following the exercise of a "demand" registration right as described in the previous sentence, any of our shares of common stock under the Securities Act, all the shareholders who are parties to the registration rights agreement will be entitled to include their shares of common stock in that registration. We cannot predict the size of future issuances of our common stock or the effect, if any, that future issuances and sales of shares of our common stock will have on the market price of our common stock. Sales of substantial amounts of our common stock (including shares issued in connection with an acquisition), or the perception that such sales could occur, may materially adversely affect prevailing market prices for our common stock. These sales could also make it more difficult for us to issue and sell shares of our common stock or other equity securities in the future.
19
A SPECIAL NOTE REGARDING FORWARD-LOOKING STATEMENTS
This prospectus contains forward-looking statements that are based on our beliefs, assumptions and expectations of future events taking into account the information currently available to us. All statements other than statements of historical fact contained in this prospectus are forward-looking statements. Many of the forward-looking statements are contained in the sections entitled "Summary," "Risk Factors," "Use of Proceeds," "Management's Discussion and Analysis of Financial Condition and Results of Operations" and "Business." These statements involve known and unknown risks, uncertainties and other factors that may cause our actual results, performances, financial condition or achievements to differ materially from the expected future results, performances, financial condition or achievements as expressed or implied in any forward-looking statements. Factors that could contribute to these differences include but are not limited to:
- •
- the continued popularity of golf and golf-related products;
- •
- the continued development of new golf-related products and our ability to purchase and sell such products;
- •
- our dependence on key suppliers;
- •
- our ability to execute our growth strategy profitably in new and existing markets;
- •
- the effect of competition in our industry;
- •
- the regional concentration of our stores and the seasonal fluctuations in our business;
- •
- the effects of weather in our markets;
- •
- the effects of the economy;
- •
- our ability to access adequate capital;
- •
- our ability to attract and retain management talent;
- •
- our ability to develop and maintain our management information and other systems;
- •
- our ability to anticipate and respond to the changing preferences of our customers;
- •
- the uninterrupted service of the common carriers we use;
- •
- our ability to enforce our intellectual property rights and avoid claims of infringement of a third party's intellectual property rights; and
- •
- other factors discussed under the headings "Risk Factors," "Management's Discussion and Analysis of Financial Condition and Results of Operations" and "Business."
In some cases, you can identify forward-looking statements by terms such as "anticipates," "believes," "estimates," "expects," "intends," "plans," "seeks," "predicts," "projects," "strives," "potential," "objective," "may," "could," "should," "would," "will" and similar expressions intended to identify forward-looking statements. Forward-looking statements reflect our current views with respect to future events, are based on our assumptions and are subject to risks and uncertainties. Given these
20
uncertainties, you should not place undue reliance on these forward-looking statements. You should read this prospectus and the documents that we reference in this prospectus and have filed as exhibits to the registration statement completely and with the understanding that our actual future results may be materially different from what we expect them to be.
Our forward-looking statements speak only as of the date of this prospectus. We assume no obligation to update or revise any forward-looking statements publicly, or to update the reasons actual results could differ materially from those anticipated in any forward-looking statements, even if new information becomes available in the future.
21
The net proceeds from our sale of shares of our common stock are estimated to be approximately $ million, based on an estimated offering price of $ per share, after deducting underwriting discounts and commissions and estimated offering expenses payable by us.
We intend to use the net proceeds from our sale of shares in this offering, together with cash provided by operations and, if necessary, funds available under our credit facility, to continue to open new retail stores across the country and for general corporate purposes, and we will use approximately $ million of our net proceeds to pay our preferred shareholders all of the accrued and unpaid dividends due upon conversion of their shares of preferred stock into shares of our common stock. During fiscal 2005, we opened ten new stores and we expect to open a total of 28 to 32 stores in fiscal 2006 and fiscal 2007, of which eleven have already been opened. In fiscal 2006, we expect our capital expenditures to be approximately $14.0 million, substantially all of which will relate to planned store openings in fiscal 2006 and the first quarter of fiscal 2007. Our preferred shareholders have agreed to convert their shares of our preferred stock into shares of our common stock simultaneously with the closing of this offering. See "Certain Relationships and Related Party Transactions." All accrued and unpaid dividends on our preferred stock will be paid in connection with this offering.
The foregoing represents our current intentions based upon our current plans and business condition. Management will have broad discretion in the application of our net proceeds from this offering, and the occurrence of unforeseen events or changes in business conditions could result in the application of our net proceeds from this offering in a manner other than as described in this prospectus. From time to time, we evaluate potential acquisitions of complementary businesses, products and technologies. Should we determine to employ cash resources for acquisitions, the amounts available for the purposes described above may be significantly reduced. At this time, we have no specific agreements, understandings, commitments or arrangements with respect to any acquisition. Pending application of our net proceeds, we intend to invest the net proceeds in short-term, interest-bearing, investment-grade securities.
Selling shareholders have agreed to sell up to shares of common stock. We will not receive any proceeds from the sale of shares of common stock by the selling shareholders.
We have never declared or paid any cash dividends on shares of our common stock. We currently intend to retain any future earnings for use in the operation and expansion of our business and do not anticipate paying any cash dividends on shares of our common stock in the foreseeable future. Any payment of cash dividends on shares of our common stock in the future will be at the discretion of our board of directors and will depend upon our results of operations, earnings, capital requirements, financial condition, future prospects, future financing agreements and other factors deemed relevant by our board of directors. In addition, our credit facility restricts our ability to pay cash dividends or other distributions on any shares of our common stock. See "Management's Discussion and Analysis of Financial Condition and Results of Operations—Liquidity and Capital Resources" for additional information regarding our credit facility.
22
The following table sets forth our cash, cash equivalents and capitalization as of May 28, 2005:
- •
- on an actual basis; and
- •
- on a pro forma, as adjusted, basis to give effect to:
- –
- the conversion of all outstanding shares of our preferred stock into shares of our common stock upon the closing of this offering;
- –
- the payment of the dividends payable to our preferred shareholders in the aggregate amount of $ upon conversion of their shares of preferred stock into shares of our common stock; and
- –
- the sale by us of shares of our common stock in this offering at an assumed initial public offering price of $ per share and the receipt by us of the estimated $ million in net proceeds from our sale of common stock in this offering, after deducting underwriting discounts and commissions and estimated offering expenses payable by us.
23
You should read the information below in conjunction with the financial statements and the related notes and "Management's Discussion and Analysis of Financial Condition and Results of Operations" included elsewhere in this prospectus.
| | As of May 28, 2005 | ||||||
|---|---|---|---|---|---|---|---|
| | Actual | Pro Forma, as Adjusted | |||||
| | (dollars in thousands) | ||||||
| Cash and cash equivalents | $ | 9,159 | $ | ||||
Short-term debt(1) | — | ||||||
Long-term debt, including current portion | — | ||||||
Redeemable convertible preferred stock: | |||||||
Series A redeemable convertible preferred stock, par value $1.00 per share: 80,000 shares authorized, 80,000 shares issued and outstanding actual, including $6,338 of accumulated, undeclared preferred stock dividends; no shares authorized, issued and outstanding pro forma, as adjusted | 14,338 | ||||||
Series B redeemable convertible preferred stock, par value $1.00 per share: 35,000 shares authorized, 35,000 shares issued and outstanding actual, including $2,363 of accumulated, undeclared preferred stock dividends; no shares authorized, issued and outstanding pro forma, as adjusted | 5,863 | ||||||
Series C redeemable convertible preferred stock, par value $1.00 per share: 100,000 shares authorized, 100,000 shares issued and outstanding actual, including $5,945 of accumulated, undeclared preferred stock dividends; no shares authorized, issued and outstanding pro forma, as adjusted | 15,945 | ||||||
Series D redeemable convertible preferred stock, par value $1.00 per share: 150,000 shares authorized, 94,000 shares issued and outstanding actual, including $4,193 of accumulated, undeclared preferred stock dividends; no shares authorized, issued and outstanding pro forma, as adjusted | 13,593 | ||||||
Shareholders' equity (deficit): | |||||||
Preferred stock, par value $1.00 per share: 10,000,000 shares authorized and 9,635,000 shares undesignated and 365,000 shares designated Series A, B, C and D issued and outstanding actual; 10,000,000 shares authorized and no shares issued and outstanding pro forma, as adjusted | — | ||||||
Common stock, par value $0.01 per share: 40,000,000 shares authorized and 1,883,969 shares issued and outstanding actual; 40,000,000 shares authorized and shares issued and outstanding pro forma, as adjusted(2) | 19 | ||||||
Additional paid-in capital | — | ||||||
Accumulated deficit | (17,260 | ) | |||||
Total shareholders' equity (deficit) | (17,241 | ) | |||||
Total capitalization | $ | 32,498 | $ | ||||
(1)At May 28, 2005, we had available funds under our credit facility in the amount of $15 million.
24
(2)Excludes:
- •
- 1,039,025 shares of our common stock reserved for future issuance upon the exercise of stock options outstanding as of June 27, 2005 under our stock incentive plans, at a weighted average exercise price of $5.80 per share;
- •
- 167,500 shares of our common stock reserved for future issuance upon the exercise of stock options authorized for issuance effective as of the date of this prospectus, at an exercise price equal to the price per share of our common stock sold in this offering;
- •
- 696,925 shares of our common stock reserved for future issuance under our stock incentive plans; and
- •
- 14,921 shares of our common stock issuable upon exercise of an outstanding warrant having an exercise price of $6.30 per share.
For further information regarding our stock and stock incentive plans, see "Description of Capital Stock" and "Management—Stock Incentive Plans."
25
Our net book value of common shareholders' equity (deficit) as of May 28, 2005, the end of the first quarter of fiscal 2006, was approximately $(17.2) million, or approximately $(9.15) per share of our common stock. Our pro forma net book value per share of common stock was $ as of May 28, 2005, which includes reserves for the payment of the accrued and unpaid dividends on shares of our outstanding preferred stock. Pro forma net book value per share represents our total assets reduced by our total liabilities and divided by the number of shares of our common stock outstanding as of May 28, 2005, after giving effect to the conversion of all outstanding preferred stock into common stock upon the closing of this offering. Dilution in pro forma net book value per share represents the difference between the amount per share paid by purchasers of our common stock in this offering and the pro forma net book value per share of our common stock immediately after this offering.
After giving effect to our sale of shares of common stock in this offering at an assumed initial public offering price of $ per share; deducting the underwriting discounts, commissions and the estimated offering expenses payable by us; and paying approximately $ in accrued and unpaid dividends to our preferred shareholders upon conversion of their shares of preferred stock into shares of our common stock at the closing of this offering, our pro forma net book value as of May 28, 2005 would have been approximately $ , or $ per share. This represents an immediate increase in pro forma net book value of $ per share to existing shareholders and immediate dilution of $ per share to new investors purchasing shares of common stock in this offering. If the initial public offering price is higher or lower than the assumed initial public offering price of $ per share, the dilution to the new investors will be higher or lower, respectively. The following table illustrates this per share dilution.
| Assumed initial public offering price per share | $ | |||
| Pro forma net book value per share as of May 28, 2005 | $ | |||
| Increase per share attributable to new investors | $ | |||
| Pro forma net book value per share after this offering | $ | |||
| Dilution per share to new investors | $ | |||
The following table sets forth as of May 28, 2005, on the pro forma basis described above, the total number of shares of our common stock, the total consideration paid and the average price per share paid by our existing shareholders and by new investors, calculated before deducting underwriting discounts and commissions and estimated offering expenses payable by us, and the payment of dividends to our preferred shareholders.
| | Shares Purchased | Total Consideration | | ||||||||||
|---|---|---|---|---|---|---|---|---|---|---|---|---|---|
| | Average Price Per Share | ||||||||||||
| | Number | Percent | Amount | Percent | |||||||||
| Existing shareholders | 7,636,436 | % | $ | 33,399,830 | % | $ | 4.37 | ||||||
| New investors | % | $ | % | $ | |||||||||
| Total | 100.0 | % | $ | 100.0 | % | $ | |||||||
If the underwriters' over-allotment option is exercised in full, the number of shares held by existing shareholders after this offering would be reduced to , or % of the total number of shares of our common stock outstanding after this offering and the number of shares held by new investors would increase to , or % of the total number of shares of our common stock outstanding after this offering.
26
The foregoing discussion and table assume that neither the options nor the warrant to purchase in the aggregate 1,054,946 shares of common stock outstanding as of May 28, 2005, with a weighted average exercise price of $5.80, have been exercised. Since May 28, 2005, we authorized for issuance effective as of the date of this prospectus options to purchase 167,500 shares at an exercise price equal to the price per share of our common stock sold in this offering. To the extent that any of these options or the warrant is exercised, there will be further dilution to new investors.
27
SELECTED FINANCIAL INFORMATION
You should read the selected financial data presented below in conjunction with the financial statements and the related notes and "Management's Discussion and Analysis of Financial Condition and Results of Operations" included elsewhere in this prospectus. The selected financial data presented below under the heading "Statement of Operations Data" for the years ended March 1, 2003, February 28, 2004 and February 26, 2005, and the selected financial data presented below under the heading "Balance Sheet Data" as of February 28, 2004 and February 26, 2005, have been derived from our audited financial statements included elsewhere in this prospectus. The selected financial data presented below under the heading "Statement of Operations Data" for the years ended March 3, 2001 and March 2, 2002, and the selected financial data presented below under the heading "Balance Sheet Data" as of March 2, 2002 and March 1, 2003, have been derived from our audited financial statements that are not included in this prospectus. The selected financial data presented below under the headings "Statement of Operations Data" and "Balance Sheet Data" as of and for the three months ended May 29, 2004 and May 28, 2005 are unaudited, have been derived from our unaudited financial statements which are included elsewhere in this prospectus, have been prepared on the same basis as our annual financial statements, and include all adjustments, consisting of only normal recurring adjustments, necessary for a fair statement of our financial position and operating results for the unaudited periods. Quarterly results are not indicative of full year results. See "Management's Discussion and Analysis of Financial Condition and Results of Operations—Quarterly Results of Operations and Seasonality." The unaudited selected financial data presented below under the heading "Balance Sheet Data" as of March 3, 2001, and under the headings "Other Financial Data" and "Store Data" for all periods, have been derived from our internal records of our operations, except with respect to gross profit as a percentage of sales for all periods, which is derived from our audited financial statements included elsewhere in this prospectus or from our audited financial statements that are not included in this prospectus. Historical results are not necessarily indicative of the results of operations to be expected for future periods. See Note 2 of "Notes to Financial Statements" for a description of the method used to compute basic and diluted net income (loss) per share applicable to the holders of our common stock.
| | Fiscal Year Ended(1) | Three Months Ended | |||||||||||||||||||||
|---|---|---|---|---|---|---|---|---|---|---|---|---|---|---|---|---|---|---|---|---|---|---|---|
| | March 3, 2001 | March 2, 2002 | March 1, 2003 | February 28, 2004 | February 26, 2005 | May 29, 2004 | May 28, 2005 | ||||||||||||||||
| | (in thousands, except per share data) | ||||||||||||||||||||||
| Statement of Operations Data | |||||||||||||||||||||||
| Net sales | $ | 77,608 | $ | 88,889 | $ | 85,213 | $ | 99,630 | $ | 133,080 | $ | 38,419 | $ | 58,570 | |||||||||
| Cost of sales | 59,033 | 67,909 | 63,745 | 72,403 | 93,964 | 26,856 | 40,342 | ||||||||||||||||
| Gross profit | 18,575 | 20,980 | 21,468 | 27,227 | 39,116 | 11,563 | 18,228 | ||||||||||||||||
| Operating expenses: | |||||||||||||||||||||||
| Store operating | 15,315 | 16,887 | 15,223 | 16,677 | 24,382 | 6,972 | 10,932 | ||||||||||||||||
| General and administrative | 5,659 | 6,803 | 4,709 | 6,876 | 8,372 | 2,147 | 3,102 | ||||||||||||||||
| Preopening | 1,433 | 260 | 113 | 1,065 | 2,095 | 518 | 1,310 | ||||||||||||||||
| Income (loss) from operations | (3,832 | ) | (2,970 | ) | 1,423 | 2,609 | 4,267 | 1,926 | 2,884 | ||||||||||||||
| Other income | — | — | — | — | 8,410 | (2) | — | — | |||||||||||||||
| Interest (expense) income, net | (441 | ) | (153 | ) | (109 | ) | (177 | ) | (4 | ) | (36 | ) | 15 | ||||||||||
| Income (loss) before income taxes | (4,273 | ) | (3,123 | ) | 1,314 | 2,432 | 12,673 | 1,890 | 2,899 | ||||||||||||||
| Income tax (benefit) expense | — | — | — | (5,145) | (3) | 5,135 | 765 | 1,206 | |||||||||||||||
| Net income (loss) | (4,273 | ) | (3,123 | ) | 1,314 | 7,577 | 7,538 | 1,125 | 1,693 | ||||||||||||||
| Less preferred stock dividends | — | (7,546 | ) | (3,169 | ) | (3,430 | ) | (3,696 | ) | (901 | ) | (998 | ) | ||||||||||
| Net (loss) income applicable to common shareholders | $ | (4,273 | ) | $ | (10,669 | ) | $ | (1,855 | ) | $ | 4,147 | $ | 3,842 | $ | 224 | $ | 695 | ||||||
| Net (loss) income per share: | |||||||||||||||||||||||
| Basic | $ | (2.42 | ) | $ | (6.03 | ) | $ | (1.03 | ) | $ | 2.29 | $ | 2.06 | $ | 0.12 | $ | 0.37 | ||||||
| Diluted | $ | (2.42 | ) | $ | (6.03 | ) | $ | (1.03 | ) | $ | 0.99 | $ | 0.98 | $ | 0.11 | $ | 0.21 | ||||||
| Weighted average basic shares outstanding | 1,768 | 1,771 | 1,800 | 1,814 | 1,866 | 1,862 | 1,884 | ||||||||||||||||
| Weighted average diluted shares outstanding | 1,768 | 1,771 | 1,800 | 7,691 | 7,721 | 1,951 | 8,043 | ||||||||||||||||
28
| | Fiscal Year Ended(1) | Three Months Ended | ||||||||||||||||||||
|---|---|---|---|---|---|---|---|---|---|---|---|---|---|---|---|---|---|---|---|---|---|---|
| | March 3, 2001 | March 2, 2002 | March 1, 2003 | February 28, 2004 | February 26, 2005 | May 29, 2004 | May 28, 2005 | |||||||||||||||
| | (dollars in thousands) | |||||||||||||||||||||
| Balance Sheet Data | ||||||||||||||||||||||
| Cash and cash equivalents | $ | 369 | $ | 344 | $ | 4,173 | $ | 4,943 | $ | 3,245 | $ | 7,607 | $ | 9,159 | ||||||||
| Inventories, net | 18,312 | 19,292 | 15,274 | 25,564 | 30,415 | 28,565 | 44,492 | |||||||||||||||
| Total assets | 34,193 | 34,323 | 31,742 | 51,527 | 65,137 | 60,459 | 93,478 | |||||||||||||||
| Accounts payable | 8,047 | 10,516 | 8,201 | 16,568 | 15,826 | 23,202 | 39,399 | |||||||||||||||
| Borrowings under the credit agreement | 1,271 | 267 | — | — | — | — | — | |||||||||||||||
| Redeemable convertible preferred stock | 29,627 | 30,293 | 30,900 | 30,900 | 30,900 | 30,900 | 30,900 | |||||||||||||||
| Accumulated, undeclared preferred stock dividends | — | 7,546 | 10,715 | 14,145 | 17,841 | 15,046 | 18,839 | |||||||||||||||
| Total shareholders' equity (deficit) | (12,663 | ) | (23,986 | ) | (26,378 | ) | (21,917 | ) | (17,936 | ) | (21,692 | ) | (17,241 | ) | ||||||||
Other Financial Data | ||||||||||||||||||||||
| Gross profit as a percentage of sales | 23.9 | % | 23.6 | % | 25.2 | % | 27.3 | % | 29.4 | % | 30.1 | % | 31.1 | % | ||||||||
| Store contribution(4) | $ | 3,260 | $ | 4,093 | $ | 6,245 | $ | 10,550 | $ | 14,734 | $ | 4,591 | $ | 7,296 | ||||||||
| Store contribution margin(5) | 4.2 | % | 4.6 | % | 7.3 | % | 10.6 | % | 11.1 | % | 11.9 | % | 12.5 | % | ||||||||
| Adjusted EBITDA(6) | $ | (1,423 | ) | $ | (334 | ) | $ | 3,821 | $ | 5,010 | $ | 7,496 | $ | 2,633 | $ | 4,026 | ||||||
Store Data | ||||||||||||||||||||||
| Comparable store sales increase (decrease)(7) | 2.4 | % | 0.1 | % | (2.4 | )% | 5.6 | % | 6.7 | % | 7.4 | % | 10.5 | % | ||||||||
| Number of stores at end of period | 19 | 20 | 20 | 24 | 34 | 29 | 45 | |||||||||||||||
| Selling square feet at end of period(8) | 314,861 | 328,257 | 328,257 | 382,169 | 516,551 | 450,370 | 676,380 | |||||||||||||||
| Average inventory per store(9) | $ | 993 | $ | 925 | $ | 870 | $ | 863 | $ | 872 | — | — | ||||||||||
(1)Our fiscal year ends on the Saturday closest to the end of February, resulting in fiscal years of 52 or 53 weeks in length. Fiscal 2001, 2002, 2003, 2004 and 2005 represent the periods ended March 3, 2001, March 2, 2002, March 1, 2003, February 28, 2004 and February 26, 2005. Based on this schedule, fiscal 2001 was a 53-week year and all other fiscal years presented were 52-week years.
29
(2)Represents the gain realized on the sale of our equity investment in Golf Town Canada Inc. See "Business—Golf Town Canada."
(3)The income tax benefit in fiscal 2004 is due to the reversal of an income tax valuation allowance against our net deferred tax assets generated in prior fiscal years, partially offset by the fiscal 2004 income tax provision. See "Management's Discussion and Analysis of Financial Condition and Results of Operations" and "Notes to Financial Statements" elsewhere in this prospectus for more information.
(4)Store contribution consists of income (loss) from operations, before the effect of general and administrative costs and pre-opening costs. This term, as we define it, may not be comparable to a similarly titled measure used by other companies and is not a measure of performance presented in accordance with GAAP. We use store contribution as a measure of operating performance for our retail operations as a supplement, but not as a substitute for income (loss) from operations or other financial data prepared in accordance with GAAP.
We believe store contribution is useful to an investor evaluating our operating performance because:
- •
- it provides a measure of the incremental contribution of store operations without the impact of general and administrative costs; and
- •
- it helps investors more meaningfully evaluate and compare the results of our operations from period to period by removing the impact of the cost of opening new stores, which varies due to the timing, location, format and number of new store openings.
Our management uses store contribution:
- •
- to assist in evaluating retail operating performance because we believe it provides:
- –
- a measure of the incremental contribution of store operations net of advertising and depreciation without the impact of general and administrative costs; and
- –
- a measure of the results of retail operations excluding the incremental costs related to preparing and opening new stores, which do not directly impact the operating results of existing stores and vary from period to period depending on the timing, location, format and number of new store openings; and
- •
- in presentations to the members of our board of directors to enable our board to have the same consistent measurement basis of operating performance used by management.
The following table provides a reconciliation of income (loss) from operations to store contribution.
| | Fiscal Year Ended | Three Months Ended | |||||||||||||||||||
|---|---|---|---|---|---|---|---|---|---|---|---|---|---|---|---|---|---|---|---|---|---|
| | March 3, 2001 | March 2, 2002 | March 1, 2003 | February 28, 2004 | February 26, 2005 | May 29, 2004 | May 28, 2005 | ||||||||||||||
| | (dollars in thousands) | ||||||||||||||||||||
| Income (loss) from operations | $ | (3,832 | ) | $ | (2,970 | ) | $ | 1,423 | $ | 2,609 | $ | 4,267 | $ | 1,926 | $ | 2,884 | |||||
| General and administrative expenses | 5,659 | 6,803 | 4,709 | 6,876 | 8,372 | 2,147 | 3,102 | ||||||||||||||
| Preopening expenses | 1,433 | 260 | 113 | 1,065 | 2,095 | 518 | 1,310 | ||||||||||||||
| Store contribution | $ | 3,260 | $ | 4,093 | $ | 6,245 | $ | 10,550 | $ | 14,734 | $ | 4,591 | $ | 7,296 | |||||||
(5)Calculated as store contribution divided by net sales for the fiscal period. See footnote 4, above, for a discussion of store contribution and a reconciliation of income (loss) from operations to store contribution.
(6)Adjusted EBITDA consists of net income (loss), before the effect of net interest expense, income tax expense or benefit, non-operating income and depreciation and amortization. This term, as we define it, may not be comparable to a similarly titled measure used by other companies and is not a measure of performance presented in accordance with GAAP. We use Adjusted EBITDA as a measure of operating performance, but we do not use it as a measure of liquidity. Adjusted EBITDA should not be used as a measure of liquidity or considered as a substitute for net income (loss), net cash provided by or used in operations, or other financial data prepared in accordance with GAAP.
We believe Adjusted EBITDA is useful to an investor in evaluating our operating performance because:
- •
- it measures our operating performance without regard to items such as depreciation and amortization, which can vary depending upon accounting methods, the book value of assets, and the method by which assets were acquired;
- •
- it helps investors more meaningfully evaluate and compare the results of our operations from period to period by removing the impact of our capital structure, primarily net interest expense from our credit facility, and our non-operating income; and
30
- •
- it helps investors more meaningfully evaluate and compare the results of our operations from period to period by removing the impact of net income tax expense or benefit, which can vary over time based on changes in management's estimates and assumptions related to current and future operating results, income tax rates and income tax laws.
Our management uses Adjusted EBITDA:
- •
- as a measurement of operating performance because it assists us in comparing our performance on a consistent basis, as it removes from our operating results the impact of:
- –
- our asset base, including the impact of depreciation and amortization of our assets, which can vary depending on the book value and method of acquisition of the assets;
- –
- income tax expense or benefit, which can vary significantly based on management's estimates and assumptions related to current and future operating results, tax rates and regulations;
- –
- our capital structure, including the impact of interest expense from our credit facility and interest income on invested funds; and
- –
- our non-operating income; and
- •
- in presentations to the members of our board of directors to enable our board to have the same consistent measurement basis of operating performance used by management.
The following table provides a reconciliation of net income (loss) to Adjusted EBITDA.
| | Fiscal Year Ended | Three Months Ended | |||||||||||||||||||||
|---|---|---|---|---|---|---|---|---|---|---|---|---|---|---|---|---|---|---|---|---|---|---|---|
| | March 3, 2001 | March 2, 2002 | March 1, 2003 | February 28, 2004 | February 26, 2005 | May 29, 2004 | May 28, 2005 | ||||||||||||||||
| | (dollars in thousands) | ||||||||||||||||||||||
| Net income (loss) | $ | (4,273 | ) | $ | (3,123 | ) | $ | 1,314 | $ | 7,577 | $ | 7,538 | $ | 1,125 | $ | 1,693 | |||||||
| Adjusted for: | |||||||||||||||||||||||
| Income tax (benefit) expense | — | — | — | (5,145 | ) | 5,135 | 765 | 1,206 | |||||||||||||||
| Interest expense (income), net | 441 | 153 | 109 | 177 | 4 | 36 | (15 | ) | |||||||||||||||
| Other income | — | — | — | — | (8,410 | ) | — | — | |||||||||||||||
| Depreciation and amortization | 2,409 | 2,636 | 2,398 | 2,401 | 3,229 | 707 | 1,142 | ||||||||||||||||
| Adjusted EBITDA | $ | (1,423 | ) | $ | (334 | ) | $ | 3,821 | $ | 5,010 | $ | 7,496 | $ | 2,633 | $ | 4,026 | |||||||
(7)A new or relocated store is included in the comparable store base after it has been in operation for 12 full fiscal months following the month of the store's grand opening weekend. A store that is closed for remodel or repair is excluded from the comparable store sales calculation during the period of closure and the comparable period of the succeeding year. Sales from our eCommerce operations are not included in the comparable store sales calculation. Comparable store results for a 53-week fiscal year are presented on a 52/52 week basis.
(8)We define selling square feet to include all space where we conduct retail activities with our customers, including the PGA services area, hitting nets, golf simulators and check-out areas. Selling square feet excludes our receiving and back room storage areas, management office space, employee breakrooms, restrooms and vacant space.
(9)Average inventory per store represents the 12 fiscal month average inventory for stores open through the full fiscal year excluding our eCommerce operations. Inventory includes inventory at average cost, before adjustments for shrink, obsolescence, capitalized freight and vendor funding.
31
MANAGEMENT'S DISCUSSION AND ANALYSIS OF FINANCIAL CONDITION AND RESULTS OF OPERATIONS
The following discussion and analysis of our financial condition and results of operations should be read in conjunction with our financial statements and the related notes to our financial statements and with "Selected Financial Information" included elsewhere in this prospectus. This discussion contains certain statements of a forward-looking nature that involve risks and uncertainties. As a result of many factors, such as those set forth under "Risk Factors" and elsewhere in this prospectus, our actual results may differ materially from those anticipated by such forward-looking statements.
Overview
We have built our business around our "Everything for the Game." strategy by offering our customers a broad and deep assortment of golf equipment, accessories, apparel and footwear, as well as non-commissioned sales assistance and pro shop services, all at guaranteed low prices. We carry the leading national brands in golf, includingCallaway,TaylorMade,Titleist,NIKE Golf,PING,Cleveland, Cobra, Odyssey, Top Flite andMizuno. Each of our stores employs at least one full-time PGA professional to provide our customers with specialized, value-added services. Our growth strategy entails opening new stores, increasing comparable store sales and profitability, and expanding sales in new channels.
We opened our first retail store in Bloomington, Minnesota in April 1997, creating what we believe is an exciting, interactive superstore targeting consumers of golf-related products and services. Based upon the success of our first store, we were able to raise $30.9 million of private equity financing to supplement the $1.9 million of start up capital that we had raised through a private placement financing. The additional financing provided us the capital to open six new stores in each of fiscal 1999, fiscal 2000 and fiscal 2001. Since 1997, we have expanded our store base to 45 stores in 19 states. In March 2004, we launched our eCommerce operations with our Internet site,www.golfgalaxy.com.
Strategic Initiatives. In fiscal 2002, facing a challenging economy, lower discretionary consumer spending and a weak market for golf-related products, we made a strategic decision to dramatically slow our rate of expansion, opening only two new stores and closing an underperforming store. In fiscal 2003, we did not open any new stores and focused our efforts on improving the financial performance of our existing stores. We launched initiatives to improve our inventory management and supply chain discipline, refined our store operating model and site selection process, invested in our infrastructure and developed new product and service offerings and channels of distribution, all to improve our profitability and build a solid foundation for future growth.
To improve our inventory management and supply chain discipline, we implemented an EDI system that enabled us to automate and accelerate our purchasing and replenishment cycle with most of our key vendors. In addition, we refined our product assortment while focusing on improving our in-stock levels of higher-demand merchandise. As a result of these and other inventory management and supply chain initiatives, we were able to reduce average inventory per store from $993,000 in fiscal 2001 to $872,000 per store in fiscal 2005, while improving our in-stock inventory levels. Over the same time period, we also decreased our "owned inventory," or our inventory net of accounts payable, reducing the amount of working capital needed per store. At the same time, we were able to improve our overall gross profit as a percentage of sales from 23.9% in fiscal 2001 to 29.4% in fiscal 2005 through purchasing leverage and more effective inventory management disciplines to reduce markdowns.
32
We also analyzed and modified our store operating model to improve our store profitability. We reduced the average annual payroll per store by refining our in-store labor model, focusing particularly on store management and staffing of our in-store services area. We also revised our advertising program to improve our return on advertising expenditures. Finally, we closed an underperforming store in fiscal 2002 that failed to achieve our desired economic returns. The combination of all of these strategic initiatives enabled us to improve our store contribution margin from 4.2% in fiscal 2001 to 11.1% in fiscal 2005.
In anticipation of our accelerated growth plans, we made significant investments in our corporate infrastructure to facilitate the future growth of our business. We assembled a senior management team with high growth retail and golf industry experience. Moreover, we made investments in other infrastructure, such as our eCommerce capabilities, including in-house eCommerce distribution and fulfillment capabilities. We expect that our current infrastructure will support our accelerated store opening program, which we believe will enable us to leverage our general and administrative expenses further.
In fiscal 2002, we began purchasing pre-owned clubs in exchange for in-store credit. After testing the sale of pre-owned clubs in a limited number of stores in fiscal 2003, we began reselling the higher quality pre-owned clubs in all of our stores in fiscal 2004. Clubs taken in trade that we do not resell in our stores are sold to a third party. Pre-owned clubs have continued to grow as a percentage of our sales and they provide higher margins than new club sales.
To market directly to our best customers, we launched our complimentary "Advantage Club" customer loyalty program in March 2003. The Advantage Club provides members advance notice of special in-store events, exclusive offers and information. The Advantage Club has over 625,000 members and we expect membership to reach 850,000 by the end of the current fiscal year. In March 2004, we launched our eCommerce operations. Our eCommerce marketing efforts are fully integrated with our in-store marketing efforts and provide us additional marketing opportunities, as well as a new sales channel to reach existing and new customers through another medium.
We opened ten new stores in fiscal 2005 and eleven new stores in the first quarter of fiscal 2006, building on the improved financial performance that resulted from the initiatives described above. We used the insights we had gained from the performance of our existing store base to refine our site selection criteria to improve a new store's anticipated economic performance. Identifying appropriate new store sites is essential to our growth strategy. Our direct-to-store distribution allows us to be opportunistic in entering new markets, unencumbered by the need to have our own distribution infrastructure. Further, we believe our flexible real estate strategy, utilizing our store prototype which generally ranges from 13,000 to 18,000 selling square feet, provides us with increased opportunities to find optimal real estate locations at terms that meet our financial objectives.
In fiscal 2006 and fiscal 2007, we plan to open a total of 28 to 32 new stores, of which eleven have already been opened. Due to the increased preopening expenses associated with a greater number of new stores and the fact that store expenses comprise a larger percentage of sales in newly opened stores than in more mature stores, we expect that our total store contribution margins for fiscal 2006 and fiscal 2007 may be lower as compared to fiscal 2005.
Key Financial Measures. We measure our total company performance using the following key operating statistics: comparable store sales, comparable store gross profit, gross profit as a percentage of sales and store operating expenses as a percentage of sales. We also track total store contribution, which is calculated by deducting our total store operating expenses from our total gross profit, and total store contribution margin, which is total store contribution expressed as a percentage of total
33
sales. The total store contribution margin measures the overall profitability of our retail operations, before deducting corporate overhead expenses.
We also measure general and administrative expenses, in absolute dollars and as a percentage of sales, in an effort to track our success in achieving operating leverage by growing the profitability of our store base faster than the growth in our general and administrative expenses. Finally, we measure income from operations in order to determine our overall operating profitability after deducting the costs of corporate overhead.
At the store level, we measure sales, gross profit as a percentage of sales and store contribution, which we use to evaluate the profitability of each store before deducting corporate overhead expenses. Store contribution is calculated by deducting a store's operating expenses from its gross profit. We focus on managing controllable expenses at the store level such as payroll and supplies expenses in an effort to promote efficient store operations. We also measure average sales dollars per transaction at each store in order to measure the effectiveness of our sales techniques in each store.
We believe that increased purchasing volumes resulting from our projected growth will enable us to improve our gross profit as a percentage of sales through purchasing leverage and achieving greater vendor support throughout our supply chain. Our gross profit as a percentage of sales is also influenced by the relative mix of merchandise in our total sales. As we continue sales and store growth, a number of other factors may impact, positively or negatively, our gross profit as a percentage of sales, including:
- •
- the introduction of new products;
- •
- changes in our merchandise and services mix;
- •
- changes in the geographic mix of our stores;
- •
- price competition; and
- •
- the effectiveness of our inventory management.
The most significant store operating expenses are store associate payroll and related employee benefits, advertising and depreciation. We believe that a combination of increased sales volume and improved labor management disciplines within our stores will allow us to better leverage payroll expenses over time. Our store employees are compensated on a non-commissioned basis, which affords us the opportunity to benefit from the leverage associated with growing store sales at a rate faster than the growth in store payroll, which is largely fixed. We also monitor advertising costs as a percentage of sales. These costs are largely variable which allows us to direct and control them to facilitate achieving our store sales, gross profit rate and store contribution objectives.
We also focus on our balance sheet disciplines by measuring the amount of capital invested in our retail locations, including inventory and property and equipment. We measure inventory efficiency by analyzing average inventory per store and inventory turns, or the number of times store inventory turns over in a given period. Inventory turns are based on cost of sales and trailing thirteen fiscal month average inventory for the applicable period. In merchandise categories that experience slower inventory turns, we continue to work with vendors to increase our trade credit terms to reduce our investment in owned inventory. We also measure amounts of owned inventory in an effort to reduce the amount of working capital invested in our stores.
34
We make our most significant investments in property and equipment at the time we open a store. We make a decision on whether or not to open a new store by analyzing the store's projected return compared to the initial investment required. We gather market and store-specific performance data for each location from a combination of internal and external sources and use that data to project the anticipated return on investment for the proposed store. We then compare the projected return on investment to our pre-determined return on investment criteria in order to make our decision on whether or not to proceed with a proposed store location. Once a store has opened, we measure each store's ongoing return on invested capital to ensure that each store is generating acceptable returns on the working capital and fixed capital invested in each store.
Factors affecting comparability. We set forth below selected factors that we believe have had, or are expected to have, a significant effect on the comparability of recent or future results of operations:
Impact of Income Tax Valuation Allowance.
In the period from our inception through fiscal 2002, we incurred significant operating losses that resulted in a net operating loss carryforward for tax purposes and net deferred tax assets. Until fiscal 2003, we provided a 100% valuation allowance for all net deferred tax assets due to uncertainty regarding our ability to utilize the tax assets in future periods. Accordingly, we did not record an income tax benefit in fiscal 2001 and fiscal 2002, and did not record an income tax provision in fiscal 2003.
In fiscal 2004, we determined it was more likely than not that the deferred tax assets would be fully utilized. As a result, in accordance with SFAS No. 109,Accounting for Income Taxes, all of the valuation allowance applied to net deferred tax assets was reversed during the year ended February 28, 2004. Reversal of the valuation allowance resulted in a non-cash income tax benefit totaling $6.2 million, which accounted for 82% of our net income of $7.6 million in fiscal 2004. Our effective tax rate for the period ended February 26, 2005 was 40.5%.
Non-Operating Income from Sale of Golf Town Canada Stock.
Other income for the year ended February 26, 2005 represents an $8.4 million non-recurring pre-tax gain from the sale of our equity investment in Golf Town Canada Inc.
Stock option expense.
In December 2004, the FASB issued a revision to SFAS No. 123,Accounting for Stock-Based Compensation, which requires the calculation of the fair value of stock-based compensation, estimation of future forfeitures and income taxes, and recognition of the fair value as a non-cash expense over the vesting period of the underlying instruments. SFAS No. 123(R),Share-Based Payment, eliminates the ability to account for stock-based compensation transactions using the footnote disclosure-only provisions of APB Opinion No. 25,Accounting for Stock Issued to Employees, which we now employ, and instead requires that such transactions be recognized and reflected in our financial statements using a fair-value-based method. The implementation of SFAS No. 123(R) can be made on either a modified prospective basis or modified retroactive basis. Based on current guidance, we will be required to implement the provisions of SFAS No. 123(R) beginning in fiscal 2007.
Under SFAS No. 123(R), companies will be required to recognize an expense for compensation costs related to stock-based payment arrangements including stock options. The amount of compensation expense recognized will vary depending on numerous factors, including the option valuation methodology adopted, the number and vesting period of option grants, the
35
publicly traded stock price of the underlying option security and the volatility of that stock price. The cumulative effect of adoption, if any, would be measured and recognized in the period of adoption. We currently account for stock-based payments to our employees using APB Opinion No. 25's intrinsic value method and, as such, recognize no compensation cost for employee stock options issued at fair market value. Accordingly, the adoption of SFAS No. 123(R)'s fair-value-based method will have a significant adverse impact on our results of operations, although it will have no impact on our overall cash flows. We are currently evaluating option valuation methodologies and assumptions. While we expect that we will record substantial non-cash compensation expenses as a result of the adoption of SFAS No. 123(R) and that our results of operations will be significantly adversely affected, the impact of adoption of SFAS No. 123(R) cannot be predicted with more specificity at this time because it will depend on the option methodology adopted, the assumptions utilized and the levels of stock-based payments granted in the future.
Public company expense.
Upon consummation of our initial public offering, we will become a public company, and our shares of common stock will be publicly traded on the Nasdaq National Market. As a result, we will need to comply with new laws, regulations and requirements that we did not need to comply with as a private company, including certain provisions of the Sarbanes-Oxley Act of 2002, related regulations of the Securities and Exchange Commission and the requirements of the Nasdaq National Market. Compliance with the requirements of being a public company will require us to increase our general and administrative expenses in order to pay our employees, legal counsel and accountants to assist us in, among other things, instituting and monitoring a more comprehensive compliance and board governance function, establishing and maintaining internal control over financial reporting in accordance with Section 404 of the Sarbanes-Oxley Act of 2002, and preparing and distributing periodic public reports in compliance with our obligations under the federal securities laws. In addition, being a public company will make it more expensive for us to obtain director and officer liability insurance.
Fiscal Year. Our fiscal year ends on the Saturday closest to the end of February, resulting in fiscal years of 52 or 53 weeks in length. Fiscal 2001, 2002, 2003, 2004 and 2005 represent the periods ended March 3, 2001, March 2, 2002, March 1, 2003, February 28, 2004 and February 26, 2005. Based on this schedule, fiscal 2001 was a 53-week year and all other fiscal years presented were 52-week years.
Recent Developments. For the fiscal month ended July 2, 2005, our net sales were $ , an increase of % over net sales of $ for the comparable period of the prior fiscal year. The increase reflected additional sales from new stores opened in fiscal 2005 and the first quarter of fiscal 2006, and a comparable store sales increase of % for the fiscal month ended July 2, 2005. These results are not necessarily indicative of full quarter or full year results.
36
Results of Operations
The following table presents for the periods indicated selected items in the statements of income as a percentage of our net sales.
| | Fiscal Year Ended | Three Months Ended | |||||||||
|---|---|---|---|---|---|---|---|---|---|---|---|
| | March 1, 2003 | February 28, 2004 | February 26, 2005 | May 29, 2004 | May 28, 2005 | ||||||
| Statement of Operations Data | |||||||||||
Net sales | 100.0 | % | 100.0 | % | 100.0 | % | 100.0 | % | 100.0 | % | |
Cost of sales | 74.8 | % | 72.7 | % | 70.6 | % | 69.9 | % | 68.9 | % | |
| Gross profit | 25.2 | % | 27.3 | % | 29.4 | % | 30.1 | % | 31.1 | % | |
Store operating expenses | 17.9 | % | 16.7 | % | 18.3 | % | 18.2 | % | 18.6 | % | |
| Store contribution | 7.3 | % | 10.6 | % | 11.1 | % | 11.9 | % | 12.5 | % | |
General and administrative expenses | 5.6 | % | 6.9 | % | 6.3 | % | 5.6 | % | 5.3 | % | |
Preopening expenses | 0.1 | % | 1.1 | % | 1.6 | % | 1.3 | % | 2.2 | % | |
| Income from operations | 1.6 | % | 2.6 | % | 3.2 | % | 5.0 | % | 5.0 | % | |
Other income | — | — | 6.3 | % | — | — | |||||
Interest expense, net | (0.1 | )% | (0.2 | )% | — | (0.1 | )% | — | |||
Income before income taxes | 1.5 | % | 2.4 | % | 9.5 | % | 4.9 | % | 5.0 | % | |
Income tax benefit (expense) | 0.0 | % | 5.2 | % | (3.8 | )% | (2.0 | )% | (2.1 | )% | |
| Net income | 1.5 | % | 7.6 | % | 5.7 | % | 2.9 | % | 2.9 | % | |
Net sales consist of sales, net of returns, from comparable stores and new stores, and sales from our eCommerce operations which we launched in March 2004. A new or relocated store is included in the comparable store base after it has been in operation for 12 full fiscal months following the month of the store's grand opening weekend. New store sales include all sales from stores that have not yet become comparable stores.
Cost of goods sold includes the cost of merchandise net of certain vendor allowances, direct costs of services, freight, inventory shrinkage, other inventory valuation adjustments and store occupancy costs. Vendor allowances include promotional support, rebates and volume discounts. Store occupancy costs include rent, real estate taxes and common area maintenance charges.
Store operating expenses primarily include store associate payroll and related employee benefits, advertising and depreciation. Store operating expenses also include maintenance, utilities, insurance, bank and credit card charges and other store level expenses.
General and administrative expenses include all expenses associated with operating our corporate headquarters.
Preopening expenses consist primarily of occupancy, payroll, recruiting and other costs incurred prior to a new store opening as well as incremental advertising in conjunction with the store opening.
37
Three Months Ended May 28, 2005 (13 weeks) compared to Three Months Ended May 29, 2004 (13 weeks)
Net Sales. Net sales increased by $20.2 million, or 52.6%, to $58.6 million in the first quarter of fiscal 2006 from $38.4 million in the first quarter of fiscal 2005. The increase in net sales resulted primarily from $15.4 million in sales from new stores opened in the current or prior fiscal year, before becoming comparable stores, and a comparable store sales increase of $3.9 million, or 10.5%. The increase in comparable store sales was primarily attributable to increased sales of clubs, which was driven by several new product introductions. Increased sales of golf balls resulting from increased promotion and merchandising focus on this product group also contributed to the comparable store sales gains.
Gross Profit. Gross profit increased by $6.6 million, or 56.9%, to $18.2 million in the first quarter of fiscal 2006 from $11.6 million in the first quarter of fiscal 2005. The gross profit rate increased by 1.0% of sales to 31.1% in the first quarter of fiscal 2006 from 30.1% in the prior fiscal year's first quarter. The increase was primarily due to increases in vendor allowances resulting in higher margins achieved in clubs and balls, partially offset by higher freight costs.
Store Operating Expenses. Store operating expenses increased by $3.9 million, or 55.7%, to $10.9 million in the first quarter of fiscal 2006 from $7.0 million in the first quarter of fiscal 2005. The store operating expense rate increased to 18.6% of sales in the first quarter of fiscal 2006 from 18.2% of sales in the first quarter of fiscal 2005. The increase in store operating expenses as a percentage of sales primarily related to new stores opened in the first quarter of fiscal 2006. New stores generally have higher operating expenses as a percentage of sales in comparison to mature stores due to the impact of a partial year of sales and because mature stores generally have higher sales volumes. The increase in the store operating expense rate also reflected a higher level of advertising to establish our new markets and increased promotional spending overall.
General and Administrative Expenses. General and administrative expenses increased by $1.0 million, or 47.6%, to $3.1 million in the first quarter of fiscal 2006 from $2.1 million in the first quarter of fiscal 2005 principally due to a $0.7 million increase in payroll expenses at our corporate headquarters primarily associated with an accrual for performance-based bonuses and additional personnel to support our store expansion. General and administrative expenses as a percentage of sales decreased to 5.3% in the first quarter of fiscal 2006 from 5.6% in the first quarter of fiscal 2005, primarily due to a reduction in payroll expenses as a percentage of sales.
Preopening Expenses. Preopening expenses increased by $0.8 million to $1.3 million in the first quarter of fiscal 2006 from $0.5 million in the first quarter of fiscal 2005. The increase was primarily related to opening eleven new stores during the first quarter of fiscal 2006, compared to five new stores opened in the first quarter of fiscal 2005.
Income from Operations. Income from operations increased by $1.0 million, or 52.6%, to $2.9 million in the first quarter of fiscal 2006 from $1.9 million in the first quarter of fiscal 2005. The increase was primarily due to the increase in sales and a higher gross margin rate, partially offset by an increase in operating costs as a percentage of sales due to the higher expense rates incurred in the new stores opened in the first quarter of fiscal 2006.
Interest (Expense) Income. Net interest (expense) income was not significant in either the first quarter of fiscal 2006 or the first quarter of fiscal 2005.
38
Income Tax (Benefit) Expense. We recorded an income tax provision of $1.2 million in the first quarter of fiscal 2006, compared to an income tax provision of $0.8 million recorded in the first quarter of fiscal 2005. The income tax provision in the first quarters of fiscal 2006 and fiscal 2005 were based on estimated effective income tax rates of 41.6% and 40.5%, respectively.
Net Income. Net income was $1.7 million in the first quarter of fiscal 2006, compared to $1.1 million in the first quarter of fiscal 2005, an increase of $0.6 million, or 54.5%.
Fiscal Year Ended February 26, 2005 (52 weeks) compared to Fiscal Year Ended February 28, 2004 (52 weeks)
Net Sales. Net sales increased by $33.5 million, or 33.6%, to $133.1 million in fiscal 2005 from $99.6 million in fiscal 2004. The increase in net sales resulted primarily from $25.5 million in sales from new stores opened in fiscal 2005 or fiscal 2004, before becoming comparable stores, and an increase in comparable store sales of $6.5 million, or 6.7%. The increase in comparable store sales was primarily attributable to increased sales of clubs, apparel and golf balls due principally to new product introductions in each of these product groups, improvements in retail training, and expanded targeted marketing.
Gross Profit. Gross profit increased by $11.9 million, or 43.8%, to $39.1 million in fiscal 2005 from $27.2 million in fiscal 2004. The gross profit rate increased by 2.1% of sales to 29.4% in fiscal 2005 from 27.3% in fiscal 2004. The increase was primarily due to higher margins achieved on the sales of clubs and apparel as our vendor allowances continued to increase and the increased sales in those product groups. To a lesser degree, the gross profit rate also benefited from a lower cost of services and occupancy as a percentage of sales.
Store Operating Expenses. Store operating expenses increased by $7.7 million, or 46.1%, to $24.4 million in fiscal 2005 from $16.7 million in fiscal 2004. The store operating expense rate increased to 18.3% of sales in fiscal 2005 from 16.7% of sales in 2004. The increase in store operating expenses as a percentage of sales resulted partially from the cost of new stores opened during the fiscal year. New stores generally have higher operating expenses as a percentage of sales in comparison to mature stores due to the impact of a partial year of sales and because mature stores generally have higher sales volumes. The store operating expense rate also reflected a higher level of advertising to establish our new markets and increased promotional spending overall.
General and Administrative Expenses. General and administrative expenses increased by $1.5 million, or 21.7%, to $8.4 million in fiscal 2005 from $6.9 million in fiscal 2004. The increase was principally due to $1.1 million in additional payroll expense at our corporate headquarters primarily associated with an accrual for performance-based bonuses and additional personnel to support our store expansion. The general and administrative expense rate decreased to 6.3% of sales in fiscal 2005 from 6.9% of sales in fiscal 2004. The reduction in the general and administrative expense rate is primarily attributable to a reduction in payroll expenses as a percentage of sales.
Preopening Expenses. Preopening expenses of $2.1 million in fiscal 2005 were due to the ten stores opened in that period and stores to be opened in the first quarter of fiscal 2006. Preopening expenses of $1.1 million in fiscal 2004 represented the costs of opening four stores in that period and costs related to stores opened in the first quarter of fiscal 2005.
Income From Operations. Income from operations increased by $1.7 million, or 65.4%, to $4.3 million in fiscal 2005 from $2.6 million in fiscal 2004. The increase was primarily attributable to the increase in sales and a higher gross margin rate, partially offset by an increase in operating costs as
39
a percentage of sales resulting from the impact of opening ten new stores during fiscal 2005 and preparations to open eleven new stores in the first quarter of fiscal 2006, as compared to opening four new stores in fiscal 2004 and preparations to open five new stores in the first quarter of fiscal 2005.
Other Income. Other income of $8.4 million represents the pre-tax gain realized on the sale of our entire equity investment in Golf Town Canada Inc. See "Business—Golf Town Canada."
Interest (Expense) Income. Net interest expense of $4,000 in fiscal 2005 was $0.2 million lower than the $0.2 million recorded in fiscal 2004. The decrease was primarily attributable to our positive cash position through fiscal 2005, resulting in interest income substantially offsetting the minimal interest expense and costs of maintaining a revolving credit facility during the period.
Income Tax Benefit (Expense). We recorded an income tax provision of $5.1 million in fiscal 2005, compared to an income tax benefit of $5.1 million in fiscal 2004. The income tax expense in fiscal 2005 represents our estimated effective federal and state income tax rates applied to income before income taxes. The income tax benefit for fiscal 2004 consisted of an income tax provision of $1.1 million offset by the $6.2 million income tax benefit from the reversal of a previously established valuation allowance. Prior to the fourth quarter of fiscal 2004, all of our deferred tax assets were fully reserved and not presented on the balance sheet due to uncertainty regarding our ability to utilize the deferred tax assets in future periods. In the fourth quarter of fiscal 2004, we determined it was more likely than not that the deferred tax assets would be fully realized.
Net Income. Net income was $7.5 million in fiscal 2005, compared to $7.6 million in fiscal 2004. As discussed above, net income in fiscal 2005 included the non-recurring gain on the sale of our Golf Town Canada Inc. stock, which increased net income by $5.0 million, after taxes. In addition, net income for fiscal 2004 included the $6.2 million reversal of a previously established income tax valuation allowance. Exclusive of these items, net income would have been $2.5 million in fiscal 2005 and $1.4 million in fiscal 2004.
Net income, excluding the effect of non-recurring items, represents net income in each of fiscal 2004 and fiscal 2005, without the impact of the one-time reversal of the valuation allowance against our net deferred tax assets in fiscal 2004 and the sale in fiscal 2005 of our equity investment in Golf Town Canada Inc., net of taxes. This term, as we define it, is not a measure of performance presented in accordance with GAAP. We use net income, excluding the effect of non-recurring items, as a supplement, but not as a substitute for net income or other financial data prepared in accordance with GAAP.
We believe that net income, excluding the effect of non-recurring items, is an important measurement of our financial results because:
- •
- the non-recurring items in fiscal 2004 and fiscal 2005 make net income for those years difficult to assess relative to results in prior years; and
- •
- the non-recurring items might cause investors to overestimate net income results in future years if the non-recurring items are not fully considered.
Our management uses net income, excluding the effect of non-recurring items, to provide a consistent measure of profitability after taxes, excluding non-recurring, non-operating factors.
40
The following table provides a reconciliation of net income, as reported, to net income, excluding the effect of non-recurring items:
| | Fiscal | ||||||
|---|---|---|---|---|---|---|---|
| | 2004 | 2005 | |||||
| | (in millions) | ||||||
| Net income, as reported | $ | 7.6 | $ | 7.5 | |||
| Less: Other income(1) | — | (8.4 | ) | ||||
| Plus: Income tax provision related to other income(2) | — | 3.4 | |||||
| Less: reversal of valuation allowances against deferred tax assets(3) | (6.2 | ) | — | ||||
| Net income, excluding the effect of non-recurring items | $ | 1.4 | $ | 2.5 | |||
- (1)
- Other income of $8.4 million represents the pre-tax gain realized on the sale of our equity investment in Golf Town Canada Inc.
- (2)
- The income tax provision related to the gain realized on the sale of our equity investment in Golf Town Canada Inc. is computed by multiplying the pre-tax gain by the effective income tax rate of 40.5%.
- (3)
- In fiscal 2004, we reversed a valuation allowance of $6.2 million against our deferred tax assets because management determined it was more likely than not that the deferred tax assets would be fully realized.
Fiscal Year Ended February 28, 2004 (52 weeks) compared to Fiscal Year Ended February 1, 2003 (52 weeks)
Net Sales. Net sales increased by $14.4 million, or 16.9%, to $99.6 million in fiscal 2004 from $85.2 million in fiscal 2003. The increase in net sales resulted primarily from a comparable store sales increase of $4.7 million, or 5.6%, and sales of $9.5 million from four new stores opened during fiscal 2004. The increase in comparable store sales was primarily attributable to increased sales of pre-owned clubs, as we expanded that product group to all stores in fiscal 2004, as well as increased sales of new clubs.
Gross Profit. Gross profit increased by $5.7 million, or 26.5%, to $27.2 million in fiscal 2004 from $21.5 million in fiscal 2003. The gross profit rate increased by 2.1% of sales to 27.3% in fiscal 2004 from 25.2% in fiscal 2003. The increase was largely due to the significant increase in sales of pre-owned clubs, which generally achieve higher margins compared to new clubs. In addition, better inventory management led to reduced markdowns on apparel, also contributing to the increase in gross profit rate. Store occupancy costs also decreased as a percentage of sales, as sales in our full-year stores increased while occupancy costs remained relatively fixed.
Store Operating Expenses. Store operating expenses increased by $1.5 million, or 9.9%, to $16.7 million in fiscal 2004 from $15.2 million in fiscal 2003. The store operating expense rate decreased to 16.7% of sales in fiscal 2004 from 17.9% of sales in 2003. The decrease in store operating expenses as a percentage of sales resulted primarily from an increase in comparable store sales and a moderate decrease in payroll and depreciation costs for those stores.
General and Administrative Expenses. General and administrative expenses increased by $2.2 million, or 46.8%, to $6.9 million in fiscal 2004 from $4.7 million in fiscal 2003. The general and administrative expense rate increased to 6.9% of sales in fiscal 2004 from 5.6% of sales in fiscal 2003. Payroll-related costs increased by 0.9% of sales, the majority of which related to management
41
bonuses earned in fiscal 2004 as a result of our strong financial performance in relation to our plan. The remainder of the increase is largely due to the reversal in fiscal 2003 of a $0.3 million reserve remaining from a store closing reserve established in fiscal 2002.
Preopening Expenses. Preopening expenses of $1.1 million in fiscal 2004 were due to the four stores opened in that period, stores opened in the first quarter of fiscal 2005 and pre-launch costs of our eCommerce operations. We did not open any new stores in fiscal 2003. Preopening expenses of $0.1 million in fiscal 2003 represented a portion of the preopening costs associated with the two stores opened in the first quarter of fiscal 2004.
Income From Operations. Income from operations increased by $1.2 million, or 85.7%, to $2.6 million in fiscal 2004 from $1.4 million in fiscal 2003. The increase was primarily attributable to the increase in sales, a higher gross margin rate and lower store operating expense rate, partially offset by an increase in operating costs to support the four new stores opened in fiscal 2004 and preparations to open five new stores in the first quarter of fiscal 2005.
Interest Expense (Income). Net interest expense of $0.2 million in fiscal 2004 was $0.1 million higher than the $0.1 million recorded in fiscal 2003. The increase was primarily attributable to a minimum borrowing requirement under our former credit facility that was effective for five months of fiscal 2003 and the first nine months of fiscal 2004. The requirement was removed in the fourth quarter of fiscal 2004.
Income Tax Benefit (Expense).�� We recorded an income tax benefit of $5.1 million in fiscal 2004, compared to no net income tax provision in fiscal 2003. The income tax benefit for fiscal 2004 consisted of an income tax provision of $1.1 million offset by the $6.2 million income tax benefit from the reversal of a previously established valuation allowance. Prior to the fourth quarter of fiscal 2004, all of our deferred tax assets were fully reserved and not presented on the balance sheet due to uncertainty regarding our ability to utilize the deferred tax assets in future periods. In the fourth quarter of fiscal 2004, we determined it was more likely than not that the deferred tax assets would be fully realized.
Net Income. Net income was $7.6 million in fiscal 2004, compared to $1.3 million in fiscal 2003. As discussed above, net income for fiscal 2004 included the $6.2 million reversal of a previously established income tax valuation allowance. Exclusive of this item, net income would have been $1.4 million in fiscal 2004. See "Fiscal Year Ended February 26, 2005 (52 weeks) compared to Fiscal Year Ended February 28, 2004 (52 weeks)—Net Income."
42
Quarterly Results of Operations and Seasonality
The following table sets forth certain unaudited financial and operating data in each quarter during fiscal 2004, fiscal 2005 and the first quarter of fiscal 2006. The unaudited quarterly information reflects all adjustments, which include only normal and recurring adjustments, necessary to present fairly the information shown.
| | Fiscal 2004 | ||||||||||||
|---|---|---|---|---|---|---|---|---|---|---|---|---|---|
| | Quarter Ended May 31, 2003 | Quarter Ended August 30, 2003 | Quarter Ended Nov. 29, 2003 | Quarter Ended Feb. 28, 2004 | |||||||||
| | (dollars in thousands, except per share data) | ||||||||||||
| Statement of Operations Data | |||||||||||||
| Net sales | $ | 30,109 | $ | 36,086 | $ | 14,050 | $ | 19,385 | |||||
| Gross profit | 8,256 | 10,563 | 3,444 | 4,964 | |||||||||
| Gross profit as a percentage of sales | 27.4 | % | 29.3 | % | 24.5 | % | 25.6 | % | |||||
| Store operating expense | 4,789 | 4,900 | 3,423 | 3,565 | |||||||||
| General and administrative expense | 1,821 | 1,879 | 1,539 | 1,637 | |||||||||
| Preopening expense | 200 | 32 | 367 | 466 | |||||||||
| Income (loss) from operations | 1,446 | 3,752 | (1,885 | ) | (704 | ) | |||||||
| Income (loss) before income taxes | 1,395 | 3,708 | (1,937 | ) | (734 | ) | |||||||
| Net income (loss) | $ | 1,340 | $ | 3,651 | $ | (1,937 | ) | $ | 4,523 | ||||
| Basic net income (loss) per share | $ | 0.28 | $ | 1.55 | $ | (1.55 | ) | $ | 1.98 | ||||
| Diluted net income (loss) per share | $ | 0.17 | $ | 0.47 | $ | (1.55 | ) | $ | 0.59 | ||||
Comparable store sales increase(1) | 3.4 | % | 8.6 | % | 2.6 | % | 5.8 | % | |||||
| Stores opened during the period | 2 | — | 2 | — | |||||||||
| Number of stores at end of period | 22 | 22 | 24 | 24 | |||||||||
| Selling square feet at end of period | 354,861 | 354,861 | 382,169 | 382,169 | |||||||||
| | Fiscal 2005 | ||||||||||||
| | Quarter Ended May 29, 2004 | Quarter Ended August 28, 2004 | Quarter Ended Nov. 27, 2004 | Quarter Ended Feb. 26, 2005 | |||||||||
| | (dollars in thousands, except per share data) | ||||||||||||
| Statement of Operations Data | |||||||||||||
| Net sales | $ | 38,419 | $ | 47,540 | $ | 20,281 | $ | 26,840 | |||||
| Gross profit | 11,563 | 14,875 | 5,089 | 7,589 | |||||||||
| Gross profit as a percentage of sales | 30.1 | % | 31.3 | % | 25.1 | % | 28.3 | % | |||||
| Store operating expense | 6,972 | 7,127 | 4,793 | 5,490 | |||||||||
| General and administrative expense | 2,147 | 1,842 | 2,520 | 1,863 | |||||||||
| Preopening expense | 518 | 46 | 599 | 932 | |||||||||
| Income (loss) from operations | 1,926 | 5,860 | (2,823 | ) | (696 | ) | |||||||
| Other Income | — | — | 8,410 | — | |||||||||
| Income (loss) before income taxes | 1,890 | 5,864 | 5,598 | (679 | ) | ||||||||
| Net income (loss) | $ | 1,125 | $ | 3,513 | $ | 3,351 | $ | (451 | ) | ||||
| Basic net income (loss) per share | $ | 0.12 | $ | 1.39 | $ | 1.30 | $ | (0.74 | ) | ||||
| Diluted net income (loss) per share | $ | 0.11 | $ | 0.46 | $ | 0.43 | $ | (0.74 | ) | ||||
Comparable store sales increase(1) | 7.4 | % | 5.9 | % | 9.9 | % | 4.8 | % | |||||
| Stores opened during the period | 5 | — | 3 | 2 | |||||||||
| Number of stores at end of period | 29 | 29 | 32 | 34 | |||||||||
| Selling square feet at end of period | 450,370 | 450,370 | 486,737 | 516,551 | |||||||||
43
| | Fiscal 2006 | | | | ||||||
|---|---|---|---|---|---|---|---|---|---|---|
| | Quarter Ended May 28, 2005 | | | | ||||||
| | (dollars in thousands, except per share data) | | | | ||||||
| Statement of Operations Data | ||||||||||
| Net sales | $ | 58,570 | ||||||||
| Gross profit | 18,228 | |||||||||
| Gross profit as a percentage of sales | 31.1 | % | ||||||||
| Store operating expense | 10,932 | |||||||||
| General and administrative expense | 3,102 | |||||||||
| Preopening expense | 1,310 | |||||||||
| Income (loss) from operations | 2,884 | |||||||||
| Other Income | — | |||||||||
| Income (loss) before income taxes | 2,899 | |||||||||
| Net income (loss) | $ | 1,693 | ||||||||
| Basic net income (loss) per share | $ | 0.37 | ||||||||
| Diluted net income (loss) per share | $ | 0.21 | ||||||||
Comparable store sales increase(1) | 10.5 | % | ||||||||
| Stores opened during the period | 11 | |||||||||
| Number of stores at end of period | 45 | |||||||||
| Selling square feet at end of period | 676,380 | |||||||||
(1)A new or relocated store is included in the comparable store base after it has been in operation for 12 full fiscal months following the month of the store's grand opening weekend. A store that is closed for remodel or repair is excluded from the comparable store sales calculation during the period of closure and the comparable period of the succeeding year. Sales from our eCommerce operations are not included in the comparable store sales calculation. Comparable store results for a 53-week fiscal year are presented on a 52/52 week basis.
Our business is subject to seasonal fluctuations, with the highest sales activity and all income from operations occurring during the first and second quarters of our fiscal year. Most of our stores are located in northern and midwestern states where late spring and summer represent the peak of the golf season. It is possible the impact of seasonal fluctuation could change as we enter additional geographic regions. The Father's Day holiday in June drives a significant seasonal sales increase, and sales also increase during the year-end holiday season, albeit to a lesser extent.
Our quarterly operating results may also fluctuate significantly because of other factors. Our customers' demand for our products and services, and consequently our sales, can also be significantly impacted by weather conditions that affect outdoor activities like golf and the demand for golf-related apparel, accessories, equipment and services. The timing of new store openings and related expenses; the profitability of new stores; the impact on store results during remodeling; changes in competitors in our markets, such as new store openings or store closings by our competitors; and general economic conditions, also affect our quarterly results. The fixed costs of our operations make our operating results sensitive to changes, favorable and unfavorable, in demand for our products and services. Due to these factors, results for any particular quarter may not be indicative of results to be expected for any other quarter or for a full fiscal year.
Our preopening expenses have varied from quarter to quarter primarily due to the timing of store openings. We have historically opened the majority of our new stores in either the first or third quarters of the fiscal year. Going forward, we anticipate that store openings will occur predominantly in the first, third and fourth quarters of the fiscal year. We typically incur most preopening expenses
44
for a new store during the three months immediately preceding its opening. In addition, our labor and operating costs for a newly opened store are greater during the first one to two months of operation. Accordingly, the volume and timing of new store openings in any quarter has had and is expected to continue to have a significant impact on quarterly preopening costs and store labor and operating expenses.
Our results of operations in the fourth quarter of fiscal 2004 and the third quarter of fiscal 2005 were affected particularly by non-recurring items. In the fourth quarter of fiscal 2004, we reversed a valuation allowance of $6.2 million against our deferred tax assets because management determined it was more likely than not that the deferred tax assets would be fully realized. In the third quarter of fiscal 2005, we sold our equity investment in Golf Town Canada Inc. for a pre-tax gain of $8.4 million.
Liquidity and Capital Resources
Our primary capital requirements are for inventory, capital expenditures such as tenant improvements and fixtures, and preopening expenses to support our new store growth. Our working capital needs change significantly from quarter to quarter due to the impact of seasonality and the timing of new store openings. Our main source of liquidity is cash provided by operations. We supplement this periodically, if necessary, with cash borrowed under our credit facility. Historically, our main source of liquidity has been the proceeds from our equity financings.
The following chart summarizes the principal elements of our cash flows for the first quarters of fiscal 2006 and fiscal 2005 and for the past three fiscal years, and the number of stores opened and closed during each period.
| | Fiscal Year Ended | Three Months Ended | |||||||||||||||
|---|---|---|---|---|---|---|---|---|---|---|---|---|---|---|---|---|---|
| | March 1, 2003 | February 28, 2004 | February 26, 2005 | May 29, 2004 | May 28, 2005 | ||||||||||||
| Net cash provided by operating activities | $ | 4,942 | $ | 5,795 | $ | 2,255 | $ | 4,069 | $ | 9,084 | |||||||
| Net cash used in investing activities: | |||||||||||||||||
| Purchases of property and equipment | (915 | ) | (5,140 | ) | (12,452 | ) | (1,405 | ) | (3,170 | ) | |||||||
| Proceeds from sale of Golf Town Canada Inc. stock | — | — | 8,416 | — | — | ||||||||||||
| Net cash used in investing activities | (915 | ) | (5,140 | ) | (4,036 | ) | (1,405 | ) | (3,170 | ) | |||||||
| Net cash (used in) provided by financing activities: | |||||||||||||||||
| Short-term repayments under the credit agreement, net | (267 | ) | — | — | — | — | |||||||||||
| Credit facility issuance costs | — | — | (55 | ) | — | — | |||||||||||
| Proceeds from sale of common stock | 69 | 115 | 138 | — | — | ||||||||||||
| Net cash (used in) provided by financing activities | $ | (198 | ) | $ | 115 | $ | 83 | — | — | ||||||||
| Stores opened | — | 4 | 10 | 5 | 11 | ||||||||||||
Net cash provided by operating activities was $9.1 million in the first quarter of fiscal 2006, compared to $4.1 million in the first quarter of fiscal 2005. The increase in cash provided by operating activities in the first quarter of fiscal 2006 compared to the first quarter of fiscal 2005 was substantially due to the timing of payments for certain inventory purchases and our increased levels of net income.
45
Net cash used in investing activities was $3.2 million in the first quarter of fiscal 2006, compared to $1.4 million in the first quarter of fiscal 2005. Net cash used in investing activities for the first quarter of fiscal 2006 consists principally of investments in tenant improvements and fixtures associated with new store openings. The increase in net cash used in investing activities in the first quarter of fiscal 2006 as compared to the first quarter of fiscal 2005 is attributable to the increased level of store openings as we opened eleven new stores in the first quarter of fiscal 2006 compared to five new stores in the first quarter of fiscal 2005.
Net cash provided by operating activities was $2.3 million in fiscal 2005, compared to $5.8 million in fiscal 2004 and $4.9 million in fiscal 2003. The decrease in cash provided by operating activities in fiscal 2005 compared to fiscal 2004 was substantially due to additional investment in inventories related to our store growth and income tax payments related to our increased net income, including taxes on the gain realized on the sale of our equity investment in Golf Town Canada Inc. These factors were partially offset by a higher amount of cash generated from operations before taxes and tenant allowances received from landlords related to our new stores opened during fiscal 2005. The increase in cash provided by operating activities in fiscal 2004 compared to fiscal 2003 resulted from the increase in pre-tax income in 2004, partially offset by our net investment in inventories related to store growth.
Net cash used in investing activities was $4.0 million in fiscal 2005, compared to $5.1 million in fiscal 2004 and $0.9 million in fiscal 2003. Net cash used in investing activities for fiscal 2005 and fiscal 2004 consists principally of investments in tenant improvements and fixtures associated with new store openings. In fiscal 2005, $12.5 million of cash used for capital expenditures primarily related to our store growth was partially offset by $8.4 million received from the sale of our equity investment in Golf Town Canada Inc. The increase in net cash used in investing activities in fiscal 2004 compared to fiscal 2003 is attributable to the increased level of store openings, as we opened four new stores in fiscal 2004 and prepared to open five new stores in the first quarter of fiscal 2005. We did not open any new stores during fiscal 2003.
Net cash provided by (used in) financing activities was $0.1 million in fiscal 2005, $0.1 million in fiscal 2004 and $(0.2) million in fiscal 2003. The increase in net cash provided by financing activities in fiscal 2004 compared to fiscal 2003 principally resulted from the proceeds generated by the issuance of common stock as part of the exercise of certain stock options in fiscal 2004 and the net repayment of borrowings under our former credit facility in fiscal 2003.
To meet liquidity and working capital needs, we maintain a revolving credit facility. Our former credit facility expired in September 2004 and was replaced in October 2004 with a new credit facility with a commercial bank. The credit facility has a term of four years and provides for revolving loans in an aggregate up to $15.0 million, of which $5.0 million may be in the form of letters of credit. At our option, the credit facility can be expanded to $20.0 million. Borrowings under the credit facility are secured by our inventories, accounts receivable, and financial and intangible assets. Availability under the credit facility is calculated on the basis of eligible inventory, net of specified reserves, and less any outstanding letters of credit.
There were no outstanding borrowings on our credit facilities as of May 28, 2005 or May 29, 2004, or as of our three most recent fiscal year-ends. Our total borrowing capacity under our credit facility as of May 28, 2005 and as of February 26, 2005 was $15.0 million. Our total borrowing capacity under the former credit facility was $14.8 million and $9.1 million as of February 28, 2004 and March 1, 2003, respectively. Interest on any outstanding indebtedness under our credit facility accrues at the prime lending rate or an adjusted LIBOR as defined in the agreement for the credit facility.
46
The agreement for our credit facility includes reporting requirements to the lender and certain restrictions on our ability to change our capital structure, incur additional debt and pay dividends. In addition, the agreement requires us to maintain a minimum availability of 10% of the commitment under the credit facility at all times. The agreement also provides for administrative fees, letter of credit commitment fees, and fees of 0.25% applied to the unused commitment under the facility. We were in compliance with all covenants included in the agreement as of May 28, 2005 and February 26, 2005.
Our former credit facility included covenants that limited our annual capital expenditures and required us to maintain minimum levels of tangible net worth and a minimum borrowing availability. In fiscal 2004, we received a waiver related to the maximum annual capital expenditures covenant, and were in compliance with all other covenants as of February 28, 2004. We were in compliance with all covenants as of March 1, 2003.
Our future capital requirements will primarily depend on the number of new stores we open and the timing of those openings within a given fiscal year. These requirements will include costs directly related to opening new stores and may also include costs necessary to ensure that our infrastructure is able to support a larger store base. Additional capital may also be needed in the future to remodel or relocate existing stores. We opened ten new stores in fiscal 2005, and plan to open 14 to 16 new stores in fiscal 2006, of which eleven stores have already been opened. In fiscal 2006, we expect our capital expenditures to be approximately $14.0 million, substantially all of which will relate to planned store openings in fiscal 2006 and the first quarter of fiscal 2007. In addition, we will utilize approximately $ of proceeds from this offering to pay accrued and unpaid dividends payable upon conversion of our outstanding preferred stock. We intend to satisfy our capital requirements over the next 12 fiscal months with cash provided by operations, the proceeds of this offering and, if necessary, funds available under our credit facility.
Impact of Inflation
We do not believe that inflation has had a material impact on our results of operations for the first quarters of fiscal 2005 or fiscal 2006, or for each of our fiscal years in the three-year period ended February 26, 2005. We cannot assure you that inflation will not have an adverse impact on our operating results and financial condition in future periods.
Contractual Obligations
The following table contains supplemental information regarding our total contractual obligations as of February 26, 2005.
| | Payments due by period | |||||||||||||||
|---|---|---|---|---|---|---|---|---|---|---|---|---|---|---|---|---|
| | Total | Less than 1 year | 1-3 years | 3-5 years | More than 5 years | |||||||||||
| | (dollars in thousands) | |||||||||||||||
| Capital Lease Obligations | $ | 147 | $ | 40 | $ | 69 | $ | 37 | $ | 1 | ||||||
| Operating Lease Obligations(1) | 95,930 | 10,970 | 23,454 | 21,699 | 39,807 | |||||||||||
| Purchase Obligations(2) | 21,930 | 21,930 | — | — | — | |||||||||||
| Preferred Stock Dividends(3) | 17,841 | — | 17,841 | — | — | |||||||||||
| Total | $ | 135,848 | $ | 32,940 | $ | 41,364 | $ | 21,736 | $ | 39,808 | ||||||
(1)Operating lease obligations represent future minimum lease payments associated with our retail store locations and corporate headquarters. In addition to future minimum lease payments, our store leases typically require us to make additional rent payments. These additional costs typically include real estate taxes, common area maintenance charges, insurance and percentage
47
rent. The amounts in the table do not include additional costs. Additional costs represented approximately 28% of our minimum lease payments in fiscal 2005.
(2)Our purchase obligations as of February 26, 2005 represent open purchase orders with our vendors as well as future purchase agreements and other agreements we entered into in the normal course of business. To operate our business effectively, we provide purchase forecasts to certain vendors to obtain the appropriate quantities and mix of inventory for a selling season. We believe that certain of these commitments could be modified or cancelled without penalty, but there are currently no intentions to do so.
(3)Dividends on the outstanding shares of preferred stock compound quarterly from the date of issuance at an annual rate of 8.0%. The dividends are cumulative and can be declared payable by our board of directors anytime; however, the holders of the preferred stock have waived rights to receive dividends before May 28, 2006. Upon the closing of this offering, the preferred stock will be converted into shares of our common stock and the accumulated dividends will become immediately due and payable. These accumulated dividends will be paid in full using a portion of the net proceeds of this offering. See "Use of Proceeds."
Impact of Recent Accounting Pronouncements
EITF Issue No. 02-16. We receive allowances in various forms from certain vendors as a result of promoting and purchasing their products. In 2002, the Emerging Issues Task Force (EITF) reached a consensus on Issue No. 02-16,Accounting by a Customer (Including a Reseller) for Certain Consideration Received from a Vendor. Effective for arrangements entered into after December 31, 2002, EITF Issue No. 02-16 directs that cash consideration received from a vendor is presumed to be a reduction in the cost of inventory purchased and is recognized as a reduction of cost of sales when the related inventory is sold. Vendor allowances received as a reimbursement for specific, incremental and identifiable costs incurred to promote a vendor's product are recorded as a reduction in advertising expense. The adoption of EITF Issue No. 02-16 had no impact on sales, cash provided by operations or financial position and the impact on net income was immaterial.
EITF Issue No. 03-10. In fiscal 2003, we adopted EITF Issue No. 03-10,Application of Issue 02-16 by Resellers to Sales Incentives Offered to Consumers by Manufacturers, which amends EITF Issue No. 02-16. According to the amended guidance, if certain criteria are met, consideration received by a reseller in the form of reimbursement from a vendor for honoring the vendor's sales incentives offered directly to the consumers (manufacturer's coupons) should not be recorded as a reduction of the cost of the reseller's purchases from the vendor. The adoption of EITF Issue No. 03-10 did not have any impact on our financial position or results of operations.
SFAS No. 150. In 2003, we adopted SFAS No. 150,Accounting for Certain Financial Instruments with Characteristics of both Liabilities and Equity. SFAS No. 150 clarifies the classification and measurement of certain financial instruments with characteristics of both liabilities and equity, and is effective for financial instruments entered into or modified after May 31, 2003 or otherwise for the first interim period beginning after June 15, 2003. The adoption of SFAS No. 150 had no impact on our financial positions or results of operations.
SFAS No. 123(R). In December 2004, the FASB issued a revision to SFAS No. 123,Accounting for Stock-Based Compensation,, which requires the calculation of the fair value of stock-based compensation, estimation of future forfeitures and income taxes, and recognition of the fair value as a non-cash expense over the vesting period of the underlying instruments. The implementation of SFAS No. 123(R),Share-Based Payment, can be made on either a modified prospective or modified retroactive basis. Based on current guidance, we will be required to implement the provisions of SFAS No. 123(R) beginning in fiscal 2007. SFAS No. 123(R) eliminates the ability to account for stock-based compensation transactions using APB Opinion No. 25 and generally requires instead that such transactions be accounted for using a fair-value-based method. Companies are required to recognize an expense for compensation cost related to stock-based payment arrangements, including stock options and employee stock purchase plans. We currently account for stock-based payments to our employees
48
using APB Opinion No. 25's intrinsic value method and, as such, generally recognize no compensation cost for employee stock options. Accordingly, the adoption of SFAS No. 123(R)'s fair-value-based method will have a significant adverse impact on our results of operations, although it will have no impact on our overall cash flows. We are currently evaluating option valuation methodologies and assumptions. While we expect that we will record substantial non-cash compensation expenses as a result of the adoption of SFAS No. 123(R) and that our results of operations will be significantly adversely affected, the impact of adoption of SFAS No. 123(R) cannot be predicted with more specificity at this time because it will depend on the option methodology adopted, the assumptions utilized and the levels of stock-based payments granted in the future.
Critical Accounting Policies and Use of Estimates
Our financial statements are prepared in accordance with generally accepted accounting principles. In connection with the preparation of the financial statements, we are required to make assumptions, estimates and judgments that affect the reported amounts of assets, liabilities, net sales, cost of sales, expenses and the related disclosures. We base our assumptions, estimates and judgments on historical experience, current trends and other factors that we believe to be relevant at the time the consolidated financial statements are prepared. On a regular basis, we review our accounting policies, assumptions, estimates and judgments to ensure that our financial statements are presented fairly and in accordance with generally accepted accounting principles. However, because future events and their effects cannot be determined with certainty, actual results could differ from our assumptions and estimates, and such differences could be material.
Our significant accounting policies are discussed in Note 2 of "Notes to Financial Statements" included elsewhere in this prospectus. We believe that the following accounting policies involve our more significant judgments and estimates used in the preparation of our financial statements and are the most critical to aid in fully understanding and evaluating our reported financial results.
Inventory Valuation. We maintain inventory at the lower of cost or market. We reduce inventory costs for estimates of vendor allowances, such as rebates, volume allowances and vendor marketing funds. Inventory valuation reserves are established based primarily on forecasted consumer demand, inventory aging and obsolescence. If our estimates regarding consumer demand are inaccurate or other changes impact demand for certain products in an unforeseen manner, we may be exposed to losses in excess of our established reserves that could be material.
We also establish reserves for inventory shrinkage. Physical inventory counts are taken semi-annually to ensure the amounts reflected in our financial statements are properly stated. During the interim period between physical inventory counts, we accrue for anticipated physical inventory losses on a location-by-location basis, based on a number of factors, including historical results. If our estimates regarding inventory losses are inaccurate, we may be exposed to losses in excess of our established reserves that could be material.
Insurance. We retain a portion of the risk related to certain general liability, workers' compensation, property loss and employee medical claims. Liabilities associated with these risks are recorded based on claims filed and estimates of claims incurred but not yet reported, at our estimate of their ultimate cost, based upon analysis of historical data and insurance industry trends. Our reserves for such claims are based on estimates and the ultimate costs may differ from the amounts accrued.
Valuation of Long-Lived Assets. Long-lived assets and certain identifiable intangibles are reviewed for impairment whenever events or changes in circumstances indicate that the net carrying amount of an asset may not be recoverable. Recoverability of assets to be held and used is measured by a
49
comparison of the carrying amount of the assets to future net cash flows estimated by us to be generated by these assets. If such assets are considered to be impaired, the impairment to be recognized is the amount by which the net carrying amount of the assets exceeds the fair value of the assets.
Our impairment loss calculation contains uncertainty because management must estimate future cash provided by operations and use judgment to forecast estimated fair values and to determine the useful lives of the assets. If actual results are not consistent with our assumptions and estimates regarding these factors, we may be exposed to losses that could be material.
Costs Associated with Exit Activities. The calculation of our location closing liability requires us to make assumptions and to apply judgment regarding the timing and duration of future vacancy periods, the amount and timing of future lump sum settlement payments and the amount and timing of potential future sublease income.
When making these assumptions, we consider a number of factors, including historical settlement experience, the owner of the property, the location and condition of the property, the terms of the underlying lease, the specific marketplace demand and general economic conditions. If actual results are not consistent with our assumptions and judgments, we may be exposed to additional charges that could be material. We are not aware of any events or changes in circumstances at this time that would indicate to us that we need to consider closing any of our existing stores.
Income Taxes. We account for income taxes as prescribed by SFAS No. 109,Accounting for Income Taxes. SFAS No. 109 prescribes the use of the asset and liability method to compute the differences between the tax bases of assets and liabilities and the related financial amounts, using currently enacted tax laws. Valuation allowances are established, when necessary, to reduce deferred tax assets to the amount that more likely than not will be realized. Realization of the deferred tax assets, net of deferred tax liabilities, is principally dependent upon achievement of projected future taxable income offset by deferred tax liabilities. We exercise significant judgment in determining our provisions for income taxes, our deferred tax assets and liabilities and our future taxable income for purposes of assessing our ability to utilize any future tax benefit from our deferred tax assets. Although we believe that our tax estimates are reasonable, the ultimate tax determination involves significant judgments that could become subject to examination by tax authorities in the ordinary course of business. We periodically assess the likelihood of adverse outcomes resulting from these examinations to determine the impact on our deferred taxes and income tax liabilities and the adequacy of our provision for income taxes. Changes in income tax legislation, statutory income tax rates, or future taxable income levels, among other things, could materially impact our valuation of income tax assets and liabilities and could cause our income tax provision to vary significantly among financial reporting periods.
Prior to fiscal 2004, we had provided a valuation allowance for all net deferred tax assets. Because we achieved our second consecutive year of pre-tax book income in fiscal 2004 and expected to be profitable in future years, we concluded that it is more likely than not that all of our net deferred tax assets will be realized. As a result, in accordance with SFAS No. 109, the valuation allowance applied to such net deferred tax assets of $6.2 million at March 1, 2003, was reversed during the fourth quarter of fiscal 2004.
Quantitative and Qualitative Disclosures About Market Risk
During different times of the year, due to the seasonality of our business, we have borrowed under our revolving credit facility. To the extent we borrow under our revolving credit facility, which bears interest at floating rates based either on the prime rate or LIBOR, we are exposed to market risk related to changes in interest rates. At May 28, 2005 and February 26, 2005, we did not have any
50
borrowings outstanding under our credit facility, although any borrowings would have had an interest rate of 6.0% and 5.5% per annum, respectively. As we did not have any outstanding borrowings at May 28, 2005 and February 26, 2005, there would have been no effect on our income before income taxes if interest rates were to increase by 100 basis points. We are not a party to any derivative financial instruments.
Change in Independent Auditor
During fiscal 2003, we replaced Arthur Andersen, LLP as our independent auditor and, upon authorization by our board of directors, engaged Ernst & Young LLP as our independent auditor. We did not consult with Ernst & Young on any financial or accounting matters in the period before its appointment. As part of the engagement of Ernst & Young, an audit was performed on each of the fiscal years 2001, 2002 and 2003. During the year ended March 2, 2002, and the period from fiscal 1999 through the date of dismissal, Arthur Andersen did not have any disagreement with us on any matter of accounting principles or practices, financial statement disclosure or auditing scope or procedures, which disagreement, if not resolved to the satisfaction of Arthur Andersen, would have caused it to make reference to the subject matter of the disagreement in connection with its report on our financial statements. The report of Arthur Andersen on our financial statements for fiscal 2000 did not contain an adverse opinion or disclaimer of opinion, and was not qualified or modified as to uncertainty, audit scope or accounting principles. No report of Arthur Andersen is included in this prospectus.
51
Our Company
We are a leading golf specialty retailer offering a distinctive combination of competitively priced merchandise from the leading national brands in golf equipment and apparel, together with non-commissioned sales assistance and pro shop services. We operate 45 superstores, generally ranging from 13,000 to 18,000 selling square feet, located in 19 primarily northern and midwestern states. Our "Everything for the Game." core strategy is to provide avid and casual golfers, as well as gift purchasers, a category dominant selection of leading national brand products, expert sales assistance and professional services, the combination of which is generally not available elsewhere. We offer our customers an exciting, interactive environment that contrasts sharply with the shopping experience at smaller independent golf stores, on-course pro shops and the golf departments of general sporting goods retailers.
Key to our strategy is our focus on the leading national brands in golf, rather than promoting private label products or lesser known brands. Our non-commissioned sales associates and PGA professionals offer customers knowledgeable advice and expertise. We believe this selling strategy is distinctive and builds a trust relationship that is critical to creating long-term customer loyalty and encouraging word of mouth referrals. We employ a consultative selling approach that focuses on maximizing each customer relationship for the long-term by delivering the best solution for each golfer. For instance, in the clubs category, we utilize our expertise to custom fit clubs to our customers' needs. We also build customer loyalty through exclusive Advantage Club member in-store events and offers.
Our stores feature full-time PGA professionals who offer customers a specialized level of expertise and service. Our value-added pro shop services, directed by our in-store PGA professionals, utilize state-of-the-art technology and facilities. These services include golf lessons featuring digital video swing analysis, club and ball fittings using high-speed ball launch monitors and full-service club repair and upgrade services. Through our highly trained "Get Fit Experts," we believe we offer customers high quality, custom club-fitting.
We staff our stores with golf enthusiasts who embody our brand personality—approachable, fun, passionate and knowledgeable. Our professionally designed "superstore" format features a racetrack layout highlighting broad product offerings along with many interactive features, such as an artificial bent grass putting green and golf simulators. The friendly, no-pressure selling approach of our non-commissioned sales staff encourages customers to spend time exploring the store and testing the products before making a purchase decision.
Our extensive selection of products and services positions our stores as the "pro shop for the public golfer" and also appeals to private club golfers and gift purchasers. We believe our combination of leading national brands, a commitment to superior customer service, and interactive store features, together with our guaranteed low prices, provides a distinctive superstore concept which will enable us to achieve our objective of becoming the nation's leading golf specialty retailer.
Our Industry
According to the National Golf Foundation (NGF), an independent industry research firm, the aggregate size of the U.S. golf market was estimated at $24.3 billion in 2002, which included spending on greens fees, equipment and accessories, and food and beverages. Golf clubs, balls, bags, gloves and footwear represented $4.7 billion of this total. The golf market, as defined by the NGF, does not include certain products that we sell such as pre-owned clubs, golf and casual apparel, and golf-related gifts, novelties and services. We estimate the total golf market we serve, including these additional products and services, is over $7.5 billion.
52
Over the past 30 years, the golf industry has experienced significant growth in participation and popularity. According to the NGF, the number of Americans who play golf has increased from 11.2 million in 1970 to 27.3 million in 2004. The industry has also experienced long-term increases in the number of rounds played per year, increasing from 266.0 million in 1970 to 495.0 million in 2003. According to the NGF, from 1994 to 2002, the off-course golf specialty store channel gained market share among avid golfers from the general sporting goods stores and mass merchants. In addition, according to the NGF's 2002 survey, the off-course golf specialty store channel is the number one golf retail channel for clubs and balls among avid golfers and customers spending at least $1,000 per year on golf-related purchases.
Our History
Our company was founded in December 1995 by our Chief Executive Officer, Randall K. Zanatta, and our Chief Operating Officer, Gregory B. Maanum, two experienced retail executives who saw the opportunity to bring proven superstore retailing strategies and execution to the golf equipment and apparel market. We opened our first store in April 1997 in Bloomington, Minnesota, and have grown to 45 stores today. We funded our early growth and development through private equity sponsorship.
Over the past three years, we have further refined and enhanced our store model economics through intense focus on merchandising, execution and efficiency. In the past two years, we added both a database direct marketing program and an eCommerce Internet site, positioning our company to become a golf industry leader in multichannel, integrated retailing. Using our refined store model and leveraging our investments in our infrastructure, we are executing an expansion strategy that we believe will help us achieve our objective of becoming the nation's leading golf specialty retailer.
Competitive Strengths
We believe that a combination of the following factors creates a distinctive retail concept that distinguishes us from our competitors and is key to our continuing success.
Extensive Selection of Leading National Brands. We believe that our focus on a broad and deep assortment of the leading national brands in golf equipment, includingTaylorMade,Callaway,Cleveland,Cobra,Titleist,MacGregor, PING,NIKE Golf,Odyssey,Mizuno, Adams, Wilson, Ben Hogan, Top-Flite, US kids, LaJolla, Tommy Armour andRam, differentiates us from our competitors. In clubs, for instance, many of our competitors offer a limited assortment of the leading national brands and some also focus on private label and lesser known brands. We believe that most golfers, and especially avid golfers who, according to the NGF, represented 23% of all golfers and were responsible for 57% of all golf equipment purchases in the U.S. in 2002, prefer the leading national brands. Our extensive selection of golf equipment includes substantially all of the leading national brands.
We believe our extensive apparel assortments, experienced apparel sales associates and high quality presentations of apparel differentiate us from our competitors. As a result, we have access to the leading national brands of golf apparel and footwear, includingFootJoy,NIKE Golf,Ashworth,adidas,Greg Norman,Tommy Hilfiger,Callaway,Sport Haley,Liz Golf,Dunning Golf, Ecco andBen Hogan.
The golf industry has experienced significant consolidation in vendors. According to Golf Datatech, in 2004, the top six golf club brands represented more than 70% of off-course golf club sales in the U.S. Rather than promoting private label or lesser known brands with little or no market presence or market share, we focus our selling strategy on offering an extensive selection of the leading national brands in golf clubs. We believe this selling strategy results in higher market share for our stores, greater customer loyalty and satisfaction and, therefore, more repeat business.
53
We purchase pre-owned clubs in exchange for in-store credit and resell the higher quality pre-owned clubs at all of our stores. We believe this increases our new club business by reducing the cost of new clubs for many customers. Additionally, the resale of pre-owned clubs is complementary to our product offering, allowing value-conscious customers to buy high quality, leading national brand clubs at prices considerably lower than prices for comparable new clubs.
Commitment to Superior Customer Service. A key element of our competitive strategy is to provide a compelling shopping experience based on a superior level of customer service, golf expertise and value-added PGA services. We staff our stores with knowledgeable and enthusiastic associates who love golf as much as our customers. We supplement our sales associates' personal golf knowledge and experience with proprietary training programs. We employ a non-commissioned sales approach which we believe is key to providing a superior level of customer service and knowledgeable advice. To support our commitment to superior customer service, we developed all of our sales channels to be fully integrated. Products purchased in-store or online may be returned through either channel. This commitment to superior customer service is at the core of our company culture.
In-store PGA Professionals. A critical element of our strategy that differentiates us from our competition is our in-store PGA professionals. All of our stores employ and feature full-time PGA professionals, all of whom are Class A PGA professionals and receive certification by major manufacturers, includingCallaway,TaylorMade andPING, to custom fit their products. We use state-of-the-art technology and facilities to provide our customers with specialized services directed by our PGA professionals. These services include golf lessons featuring digital video swing analysis, club and ball fittings using high-speed ball launch monitors and full-service club repair and upgrade services. We believe that our focus on custom fitting leading national brand clubs, combined with our automated special order process, offers customers a superior shopping experience and positions us as experts with the golf consumer. Our PGA professionals are part of the store management team and assist our sales associates in selling our products.
Interactive Superstore Format. Our golf superstores, which generally range in size from 13,000 to 18,000 selling square feet, offer a distinctive combination of extensive product assortments and golf-related services in a fun and interactive setting. Our store design highlights our key categories of products and services and incorporates interactive features, including an artificial bent grass putting green, golf simulators for club trial, in-store lessons from PGA professionals and a highly visible club repair and upgrade services area. Our interactive store design and equipment displays encourage customers to test our products before making a purchase decision.
Distinctive Marketing Program. We use a combination of print, radio, television, direct mail, e-mail and in-store events to keep our brand top of mind with customers. In most of our markets, we believe we have the leading share of voice in advertising in the golf category, often greater than all of our golf specialty retail competitors combined. We market directly to our best customers through our complimentary "Advantage Club" customer loyalty program, which provides members with advance notice of special in-store events, exclusive offers and information. We believe our Advantage Club gives us a significant advantage over our competitors by helping us to identify the most desirable customers and, in turn, allowing us to provide those customers with targeted offers. Launched in March 2003, the Advantage Club has over 625,000 members and we expect membership to reach 850,000 by the end of the current fiscal year. We also promote store visits and sales with in-store events including player appearances, clinics, special event nights and tech van appearances.
In March 2004, we launched our eCommerce Internet site,www.golfgalaxy.com, designed to provide another point of contact for our customers, a marketing opportunity and a new sales channel. Frequently visited pages on the site include the store locator, bargain bunker and list of upcoming in-store events. Our eCommerce site has enabled us to expand our assortment of merchandise without
54
increasing inventory at the store level. Customers may access this wider assortment from our eCommerce site on the Internet or in our stores from one of the in-store Internet kiosks.
Guaranteed Low Prices. We are committed to offering our customers the best price everyday. Our "Low Prices. Everyday. Guaranteed." policy extends 30 days beyond the purchase date to protect our customers in the event they find a lower price either before or after the sale. We feature this guarantee prominently in our advertisements with our "Never Undersold. Period." message. We also have a comprehensive competitive shopping program that monitors in-store pricing at local competitors. When we find a lower price, we adjust our price. Our systems allow us to match any lower price on a store-by-store basis. We seek price parity with local competition, which instills confidence in our store staffs and validates our value proposition to our customers.
Leading Market Share. We strive to achieve the leading share of the golf specialty retail market in each of our markets. We believe we have the leading share of the golf specialty retail market in a majority of the markets in which we have operated for at least 18 months. This enables us to achieve the leading share of voice in advertising in the golf category on a cost-effective basis and enhances our brand recognition and consumer awareness. It also allows us to leverage our management and other fixed, market specific costs.
Management Team with Extensive Superstore and Golf Industry Experience. Our Chief Executive Officer and our Chief Operating Officer, who co-founded our company, and our Chief Financial Officer, have extensive retail management experience at Best Buy Co., Inc. The other two members of our senior management team have, collectively, held executive positions with Callaway Golf Company, NIKE, Inc. and Select Comfort Corporation. See "Management" for additional information about our management team.
Growth Strategy
Our long-term objectives are to build the Golf Galaxy brand and to become the nation's leading golf specialty retailer. Over the past few years, we have made significant investments in our infrastructure, including information systems and experienced management, to support our growth strategy. To achieve our goal, we plan to expand our store base by opening stores in both new and existing markets, continue to leverage our efficient distribution process, grow our comparable store sales and store profitability, and expand sales in new channels.
Expand Our Store Base and Leverage our Efficient Distribution Process. We believe that our distinctive retail concept has broad appeal to customers and that there are significant opportunities to continue profitable new store expansion through the opening of new stores. We plan to open a total of 14 to 16 new stores in the current fiscal year, of which eleven have already been opened. We have signed leases for two additional stores scheduled to open in the current fiscal year. We plan to open 14 to 16 new stores in fiscal 2007, of which we have one signed lease. We estimate that there are approximately 250 locations in the U.S. suitable for our prototype store which generally ranges from 13,000 to 18,000 selling square feet. Our flexible store size and our efficient direct-to-store distribution model increase the number of potential markets and store sites that are suitable for our concept, which we believe will provide us adequate locations to meet our expansion plan. We believe there is ample availability of real estate at reasonable occupancy costs to accommodate our future growth in both new and existing markets. We may also consider strategic acquisitions from time to time.
Our store model has attractive unit level economics, producing positive cash flow in the first full year of operation in predominantly all of our stores. We believe that our record of successful new market
55
entries, based on store profitability, and our management's experience in other high growth retail concepts provide a foundation for continued profitable growth.
Our efficient direct-to-store distribution model eliminates the need to support store growth with costly warehouse facilities, systems and related inventory. Since substantially all store inventories are drop-shipped directly from our vendors to our stores, we are not dependent on regional distribution centers and we can take advantage of real estate opportunities in any market without needing to expand only into geographically contiguous states.
To enhance our distribution process, in fiscal 2003 we introduced an EDI system to establish electronic trading with most of our key suppliers, accelerating our replenishment time, increasing our in-stock position and automating invoice processing. In fiscal 2005, we implemented an Internet-based special order system with our key vendors at all of our stores. All of our systems are scalable and were designed to support our growth strategy.
Grow Comparable Store Sales and Store Profitability. We are pursuing a number of initiatives to continue to grow comparable store sales and increase store profitability. We believe all of these initiatives will leverage our position as having the leading share of voice in advertising in the golf category in most of our markets. We plan to continue to grow our comparable store sales and profitability by aggressively supporting the growth of our Advantage Club customer loyalty program, which we believe will increase store visit frequency and more efficiently deploy our advertising expenditures. We also plan to continue to increase gross profit as a percentage of sales through purchasing leverage, through continued focus on inventory management, through improved selling strategies that focus on margin enhancement opportunities, by raising the percentage of sales from higher margin pre-owned clubs, and by building sales of PGA services which we believe will help further drive equipment sales and build customer loyalty.
Expand Sales in New Channels. In March 2004, we launched our eCommerce operations supported by our in-house fulfillment and customer contact center. With the addition of this direct fulfillment capability, we have begun to develop our direct sales both online and through toll-free telephone orders. We plan to grow our sales in these channels by leveraging our strong brand awareness through several methods such as in-store promotions, inclusion in our integrated marketing messages, inclusion in our Advantage Club communications, joint media promotions and potential relationships with other parties in the golf industry.
Merchandising
The key elements of our merchandising strategy that support our "Everything for the Game." strategy are:
- •
- An extensive selection of the leading national brands of golf products;
- •
- Highly visible PGA services and interactive store features that reinforce our expertise and encourage testing our products;
- •
- Knowledgeable advice from our trained non-commissioned sales associates and PGA professionals;
- •
- Professionally-designed stores that are easy to shop and inviting to golfers of all skill levels, and product displays that communicate category dominant assortments and compelling value;
- •
- Aggressive promotion of new products and technology, supported by deep in-stock positions;
56
- •
- Tailored product assortments by store based on demographic, regional or seasonal differences;
- •
- An extensive selection of pre-owned clubs;
- •
- Special purchase items and exclusive items from key suppliers that communicate value and build margin; and
- •
- Guaranteed low prices backed by an active competitive shopping program.
Extensive offering of products and services. We offer a broad and deep assortment of clubs, equipment, apparel, footwear, accessories and golf themed art, gifts and software to meet the needs of golfers at all skill levels. We carry virtually all of the leading national brands in golf, including some not available to other golf specialty retailers and general sporting goods stores. We are frequently among the first retailers to market with new product introductions due to our strong vendor relationships and high sales volume per store. We are often among the first retailers to receive access from our key suppliers to deeply discounted closeout, pre-owned and exclusive products that enhance our value proposition and improve our gross profit as a percentage of sales.
While we focus on the leading national brands in golf, we have developed two proprietary brands:Outward 9 for equipment andRae's Creek for apparel. These proprietary brands are positioned at lower price points where the leading national brands do not have products.
Our categories of products and services are:
- •
- Clubs. Golf Clubs is our largest category, representing approximately half of our net sales in fiscal 2005. We carry a broad and deep selection of woods, irons, wedges, putters and specialty clubs for golfers of every skill level. We also have extensive club selections for often underserved customer segments such as women, juniors and left-handed players. Our deep in-stock position of various loft, flex and shaft options enables us to provide customers an immediate opportunity to acquire clubs specifically fit to their particular needs.
- •
- Bags, Balls, Gloves and Accessories. This category includes bags, balls, carts, gloves, tees, training aids and hundreds of miscellaneous accessory items. We also offer golf themed art, home furnishings, books, videos, computer software, gifts, novelty items, sunglasses, watches, brief cases, pens and travel accessories. These products offer us incremental sales and gross profit opportunities while enhancing the shopping experience with interesting and distinctive items.
The key brands of clubs that we carry includeTaylorMade,Callaway,Cleveland,Cobra,Titleist,MacGregor,PING,NIKE Golf,Odyssey,Mizuno,Adams,Wilson,Ben Hogan,Top-Flite,US kids,LaJolla,Tommy Armour andRam.
We also purchase pre-owned clubs in exchange for in-store credit and resell the high quality pre-owned clubs at all of our stores. Clubs taken in trade that we do not resell in our stores are sold to a third party. We promote our "We Take Trades" message prominently in our marketing. We believe this increases our new club business by reducing the cost of new clubs for many customers. Additionally, the resale of pre-owned clubs is complementary to our product offering, allowing value-conscious customers to buy high quality, leading national brand clubs at prices considerably lower than prices for comparable new clubs.
57
- •
- Apparel and Footwear. We believe that the extensive assortments, experienced apparel sales associates and high quality presentations in our Apparel and Footwear category differentiates us from our competition. We carry leading national brands in both apparel and footwear includingFootJoy,NIKE Golf,Ashworth,adidas,Greg Norman,Tommy Hilfiger,Callaway,Sport Haley,Liz Golf,Dunning Golf, EccoandBen Hogan.
- •
- PGA Services. According to the NGF, in 2002, 79% of all golfers did not belong to a private club. These public golfers played a variety of courses and did not have regular access to PGA professionals. Our PGA services position us as the "pro shop for the public golfer." Our PGA services are directed by our in-store PGA professionals, all of whom are Class A professionals, and are key to our "Everything for the Game." strategy. Although PGA services represented only a small percentage of our net sales in fiscal 2005, the availability of these services and the PGA professionals in our stores contribute significantly to the fitting and sale of our clubs. Our in-store PGA services provided by our on-staff PGA professionals distinguish us from our primary off-course competitors.
We feature our merchandise in department store quality presentations, with mannequins and displays that feature the quality and selection of our offerings, organized by brand. We customize our apparel and footwear assortments to the local market. We merchandise apparel in the center of the store to highlight this high margin category. We promote and merchandise this category under our tag line "Golf. Life. Style." We also offer non-golf casualwear.
The PGA services that we offer under the supervision of our PGA professionals include:
Lessons—We offer indoor golf lessons with PGA professionals using a state-of-the-art digital video swing analysis system. Two cameras simultaneously capture the golf swing digitally, allowing the PGA professional to isolate and correct swing faults. We record the entire lesson, including the PGA professional's comments, for customers to review at home.
Ball launch monitor fitting—This tool allows us to fit customers with the best performing driver and ball for their swing characteristics. High speed cameras capture the club face and ball at the moment of impact and measure several variables including launch angle, speed and spin rate, the keys to maximizing distance. This system is a proven technology used by tour pros and has great benefit for most players.
Club repair and regripping—We offer complete repair and regripping for clubs in a highly visible on-site repair center. We guarantee 24-hour turnaround time on regripping. We stock all of the most popular grips fromWinn,Golf Pride,Lamkin and others.
Club upgrade—We offer complete upgrade services to enhance the performance of customers' current equipment. The recent trend to high performance, aftermarket shafts has created an opportunity to sell both a new shaft and the installation service. We stock all of the leading after-market shafts fromGraffaloy,True Temper,UST,Aldila,Fujikura and others.
Custom fitting—We offer custom fitting of clubs and can make adjustments on-site, including length, lie angle and swing weight. All of our stores are equipped with the required specialized tools. All of our PGA professionals receive factory training and
58
certification by major manufacturers, includingCallaway,TaylorMade andPING, to custom fit their products.
Our PGA professionals are also responsible for the training and certification in our "Get Fit Experts" program that qualifies other store associates to custom fit clubs.
Interactive Store Design. We designed our stores to deliver on our "Everything for the Game." strategy and create an exciting and interactive shopping environment that highlights our extensive product assortments and value-added PGA services. Interactive areas, such as an artificial bent grass putting green and golf simulators, add to the entertainment value of the shopping experience. Our store design and equipment displays encourage customers to test our products before making a purchase decision. Our highly visible service areas reinforce the expertise available from our staff.
Our professionally designed superstores are bright and colorful, featuring open ceilings painted blue to emulate the sky with a racetrack layout main aisle circling the interior of the store. Equipment is located on the outside of the racetrack, with apparel offered in the center. We bulk and mass display deep product offerings in key areas to encourage impulse purchasing and add-on sales. The store layout and display fixtures are highly flexible and allow us to expand and adjust our merchandise offerings by season and market.
Pricing. Maintaining a price leadership position in our markets is a key element of our merchandising strategy. Our pricing strategy is to maintain every day low prices that are competitive with all local competitors and national direct catalog and Internet retailers. We monitor all forms of media and change prices promptly to match any lower priced offers. In addition, we have a comprehensive competitive shopping program that monitors in-store pricing at local competitors. When we find a lower price, we adjust our price. Our systems allow us to match any lower price on a store-by-store basis. We seek price parity with local competition, which instills confidence in our store staffs and validates our value proposition to our customers. We also offer a 30-day low price guarantee to protect our customers in the event they find lower pricing either before or after a sale.
We achieve price leadership through a variety of programs including:
- •
- In-store signage and staff training of our "Low Prices. Everyday. Guaranteed." offer, which includes our 30-day guaranteed price protection;
- •
- Advertisements that reinforce our low price commitment with our aggressive "Never Undersold. Period." message;
- •
- Regular competitive shopping of key competitors and proactive price adjustments to match the competition; and
- •
- Promotion of special closeout buys, opportunistically purchased and often exclusive to us, both in advertising and in-store that reinforce the value and low price message.
Marketing and Advertising
Our marketing communicates our "Everything for the Game." strategy and is designed to position us as the branded industry leader in selection, service and expertise. According to a study commissioned by us in August 2004, we had the leading share of voice in advertising in the golf category in most of our markets from July 2003 to June 2004, as measured by newspaper, radio and television advertising expenditures. Our mass-media messages are designed to communicate our outstanding value while enhancing our brand.
59
Although the demographic profile of our core customer is a male who is 30 to 61 years old and has a high disposable income, our marketing messages are designed to appeal to four major golf customer segments, namely: (i) avid golfers, who play 25 plus rounds of golf per year, visit us multiple times, and are early adopters, wealthy, well educated and brand conscious; (ii) recreational/value golfers, who make economically driven purchase decisions as a result of income limitations or an inability to commit much time to the game of golf; (iii) female golfers, who represent an incremental opportunity for us and are the subject of increasingly focused marketing initiatives; and (iv) junior golfers, who are important because they may be lifetime customers and their parents represent additional potential customers.
We use a combination of print, radio, television, direct mail, e-mail and in-store events to drive awareness of our brand and communicate our message during the key selling seasons. Our marketing plan includes newspaper advertisements, celebrity endorsement radio in key markets, broadcast television commercials during professional golf tournaments in most weekends from February through August, additional national cable television advertising including sponsorship of programming on The Golf Channel, direct mail catalogs, e-mail offers, online positioning atwww.golfonline.com, advertising inGolf Magazine, and local golf tournament sponsorship.
In March 2003, we launched Advantage Club, our customer loyalty program, designed to create a direct relationship with our best customers using advance notice of special in-store events, exclusive offers and information. Membership in our Advantage Club is free. To date, we have registered over 625,000 Advantage Club members and we expect membership to reach 850,000 by the end of the current fiscal year. We track member transactions and, in fiscal 2005, sales to Advantage Club members were approximately 35% of our total sales. We target our direct mail catalogs and e-mail offers to this group of customers who generate above average response rates, thus enhancing our marketing efficiency. We believe our Advantage Club gives us a significant advantage over our competitors by helping us to identify the most desirable customers and, in turn, allowing us to provide those customers with targeted offers. It also allows the marketing communication to be relevant to each of the different customer segments, or other identified groups of customers such as those with low handicaps (0-10) or unique purchasing patterns and those who are loyal to particular brands.
In addition to more traditional price and item advertising, our marketing strategy includes the promotion of a variety of special in-store events of interest to customers. Our marketing events are highly customized. We have an extensive effort to promote store visits and sales through event marketing, which in the past have included:
- •
- Player Appearances—interactive in-store events with such PGA tour players as John Daly, Ernie Els, Charles Howell III and Hank Kuehne, NBC golf analyst Johnny Miller and LPGA star Annika Sorenstam.
- •
- Tech Van Appearances—vendor tour trailers where representatives discuss products and offer club fitting and custom built clubs on site. Participating vendors have includedCallaway,TaylorMade,PING,Cleveland, Wilson, Cobra andNIKE.
- •
- Event Nights—special events such as our annual Women's Night in all of our stores, featuring a ladies only theme and supported by The Executive Woman's Golf Association and the Susan G. Komen Breast Cancer Foundation's Golf for the Cure. Approximately 4,000 women attended the event in 2005.
- •
- Free Clinics—conducted by our PGA professionals throughout the year. These clinics are promoted in-store and through e-mail to the Advantage Club members. Past clinics focused on ball launch monitor fitting, etiquette, women, juniors and beginners.
60
In March 2004, we launched our eCommerce Internet site,www.golfgalaxy.com. Our eCommerce site provides another point of contact for our customers, as well as a marketing opportunity and a new sales channel. Frequently visited pages on our eCommerce site include the store locator, bargain bunker and list of upcoming in-store events.
In March 2005, we launched multi-purpose Internet kiosks in all of our stores. The kiosks can be used forgolfgalaxy.com sales, Advantage Club new member sign-ups, and marketing messages to support our marketing programs.
We developed all of our sales channels to be fully integrated. Products purchased in-store or online may be returned through either channel. Our marketing materials promote the option of shopping at our stores, using our in-store Internet kiosks, online or through a toll-free telephone number. We are committed to offering our customers a high level of convenience and flexibility by offering a quality experience through whatever point of contact the customer prefers.
Purchasing and Distribution
During fiscal 2005, our five largest vendors represented approximately 60% of our purchases. Three of our vendors that provide multiple golf brands, namely Acushnet Company (Titleist,FootJoy andCobra), Callaway Golf Company (Callaway,Odyssey,Top-Flite andBen Hogan) and Taylor Made Golf Company (TaylorMade,adidas andMaxfli), each represented more than 10% of our purchases. While we have a centralized purchasing model, all product shipments are delivered by our vendors direct to each store. Our direct-to-store distribution eliminates the need for distribution facilities, resulting in faster replenishment to stores and lower distribution costs. Our direct-to-store distribution model is a key element of our real estate strategy. This model has many positive economic benefits and eliminates the need to support store growth with costly distribution facilities, systems and excess inventory. We can be highly opportunistic in seeking locations in new markets. Since our store inventories are drop-shipped directly from the manufacturer to the stores and, therefore, we are not dependent on regional distribution centers, we can take advantage of the best real estate opportunities in any market as they occur independent of any distribution-related constraints.
Our management information system generates suggested orders using auto-replenishment logic based on historical sales activity, sales forecasts and current inventory levels. Our merchandise planning and control department reviews the system-generated orders and then transmits purchase orders electronically to our vendors. We implemented a scalable EDI system to exchange orders and invoices with our key vendors, which automates and accelerates replenishment, improves accuracy and reduces costs.
Our store receiving associates count and scan deliveries. We receive products at our stores directly from vendors, minimizing handling and freight costs. The vendors' established distribution systems support direct store deliveries which enables us to respond efficiently to changes in customer product demand and special order requests, as well as to open stores in geographically separated markets.
We focus on maintaining a current assortment of the latest golf equipment and apparel from the leading national brands. We are able to tailor our merchandise assortment at the store level and to respond quickly to changing customer demands and regional preferences. We used our auto-replenishment system, electronic order and invoicing and analytical tools to reduce average store inventory by 20% over the past five years while improving our in-stock position.
Retail Stores and Markets
We generally locate our stores in metropolitan areas, targeting key suburban shopping areas with a high concentration of our target golf customers. We attempt to open the optimal number of stores in
61
new markets as quickly as possible to gain advertising efficiency and to achieve the leading market share. We strive to achieve the leading share of the golf specialty retail market in each of our markets. We believe that we have the leading share of the golf specialty retail market in a majority of the markets in which we have operated for at least 18 months. Our store model is based on prototype store which generally ranges from 13,000 to 18,000 selling square feet. Our flexible real estate strategy enables us to vary our store size based on market characteristics, demographics and the availability of suitable sites. Our sophisticated assortment planning and replenishment process allows us to accommodate varying store sizes, as well as to customize product presentations to the local market.
Site Selection. We select geographic markets and store sites on the basis of demographic information, quality of adjacent tenants, store visibility and lease economics. Key demographics include population density, income levels and golf participation rates in the market. Our internal real estate group, with the assistance of local brokers and our sales management team, identify our new store opportunities. We have also used independent third parties to evaluate markets and trade areas and to develop first year store sales projections. Generally, we seek to locate our new stores in high traffic retail areas near other specialty retailers, such as Bed, Bath and Beyond, Best Buy, Guitar Center and Michaels.
Our store format is highly adaptable, which gives us the flexibility to lease both second use facilities and build-to-suit locations as the market dictates. We believe there is ample availability of real estate at reasonable occupancy costs to accommodate our future growth. Also, based on the demographic profile of our core customer, many national landlords are pursuing us as a tenant.
Our growth strategy is to open stores in both new and existing markets. In existing markets, we plan to fill in stores, where appropriate, to take advantage of economies of scale in advertising, promotion and sales management costs.
Store Construction. Typically, our new store construction costs range from $700,000 to $850,000 for leasehold improvements, store fixtures and technology. Often these costs are partially offset by tenant allowance funds we receive. For some new stores, however, we may receive no tenant allowance funds.
Generally, it takes approximately 90 days to open a new store from the date we take possession of the property. Prior to and during that time, we finalize the architectural drawings and receive construction permits, complete the leasehold improvements, install the store fixtures and technology, merchandise the store with inventory, and hire and train new employees.
62
Store Locations.
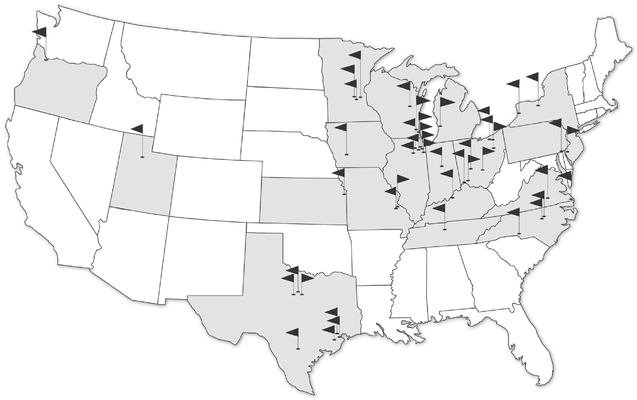
Store Locations
(opening date by fiscal month;signed leases for future stores in italics)
| Colorado | ||||
| Denver (Fall 2005) | ||||
Illinois | ||||
| Chicago Metropolitan Area | ||||
| • | Downers Grove (April 2000) | |||
| • | Naperville (April 2000) | |||
| • | Orland Park (June 2000) | |||
| • | Schaumburg (June 2000) | |||
| • | Vernon Hills (April 2001) | |||
| • | Gurnee (December 2004) | |||
Indiana | ||||
| Indianapolis Metropolitan Area | ||||
| • | Castleton (November 1999) | |||
Iowa | ||||
| West Des Moines (November 1998) | ||||
Kansas | ||||
| Kansas City Metropolitan Area | ||||
| • | Overland Park (March 2005) | |||
Kentucky | ||||
| Louisville (November 2004) | ||||
Michigan | ||||
| Grand Rapids (June 1998) | ||||
Minnesota | ||||
| Minneapolis/St. Paul Metropolitan Area | ||||
| • | Bloomington (April 1997) | |||
| • | Roseville (March 1998) | |||
| • | Plymouth (July 1998) | |||
Missouri | ||||
| St. Louis Metropolitan Area | ||||
| • | Chesterfield (March 2003) | |||
| • | Brentwood (March 2004) | |||
New Jersey | ||||
| Philadelphia Metropolitan Area | ||||
| • | Mount Laurel (March 2005) | |||
New York | ||||
| Rochester (November 2003) | ||||
| Buffalo (November 2004) | ||||
North Carolina | ||||
| Charlotte (April 2005) | ||||
| Raleigh/Durham Metropolitan Area | ||||
| • | Cary (March 2005) | |||
| • | Durham (March 2005) | |||
Ohio | ||||
| Dayton (February 1999) | ||||
| Columbus (March 1999) | ||||
| Cincinnati Metropolitan Area | ||||
| • | Eastgate (April 1999) | |||
| • | Tri County (April 1999) | |||
| Cleveland Metropolitan Area | ||||
| • | Mayfield Heights (November 1999) | |||
| • | North Olmsted (May 2000) | |||
| Akron (March 2003) | ||||
Oregon | ||||
| Portland Metropolitan Area | ||||
| • | Beaverton (November 2003) | |||
Pennsylvania | ||||
| Philadelphia Metropolitan Area | ||||
| • | Devon (March 2004) | |||
Tennessee | ||||
| Nashville (November 2004) | ||||
Texas | ||||
| Dallas Metropolitan Area | ||||
| • | Lewisville (March 2005) | |||
| • | Plano (March 2005) | |||
| • | North Park (April 2005) | |||
| • | Dallas (Fall 2006) | |||
| Houston Metropolitan Area | ||||
| • | Baybrook (March 2005) | |||
| • | Willowbrook (April 2005) | |||
| • | Galleria (May 2005) | |||
| San Antonio (February 2005) | ||||
Utah | ||||
| Salt Lake City (March 2001) | ||||
Virginia | ||||
| Virginia Beach (March 2004) | ||||
| Richmond (May 2004) | ||||
| Newport News (Winter 2006) | ||||
Wisconsin | ||||
| Milwaukee Metropolitan Area | ||||
| • | Greenfield (May 1998) | |||
| • | Brookfield (February 2000) | |||
| Appleton (April 2004) | ||||
63
Retail Store Operations
We design our hiring, training and compensation programs to reinforce our focus on superior customer service and honest, expert advice. We designate our sales associates as "Player's Assistants" and our corporate headquarters is named the "Retail Support Office" to emphasize our focus on the customer.
Store Staffing. We staff each of our stores with a store general manager, a PGA professional, either two or three assistant store managers depending on store size and a receiving associate. In addition, we generally employ 20 to 30 sales associates in our stores who assist our customers with their purchases. Approximately 22% of the store staff is full-time, with the remainder part-time or seasonal.
Regional and Store Management. We divide our store operations into districts having seven to ten stores each. We currently have five districts. We operate our stores on a decentralized basis, pushing decisions as close to the customer as possible. District managers are located in the markets and have significant authority and control over their business. Store general managers are responsible for the successful operation of their store, including profitability, and have significant input on marketing and product assortments in coordination with our centralized operations in the corporate headquarters. The store general managers are also responsible for maintaining competitive pricing in their market.
Hiring and Training. We attempt to recruit and hire store associates who share our passion for golf. Our extensive product assortments, interactive store format, non-commission selling strategy and positive culture appeal to a wide range of potential candidates and allow us to attract and retain high quality, experienced store associates and PGA professionals. Our turnover rate in fiscal 2005 for full-time store associates was approximately 20%, significantly below the retail industry average of approximately 40% as reported by the National Retail Foundation and adjusted for similarly staffed stores.
We supplement our sales associates' personal golf knowledge and experience with several training programs. We designed our proprietary DVD-based sales training program to teach selling skills and create a consistent approach in all stores. Our vendors conduct product training using in-store seminars and one-on-one sessions. We train and test our hardlines sales associates so that they may earn our exclusive "Get Fit Expert" designation, which identifies those associates who have the technical expertise to custom fit customers and elevates their pay scale. We offer a similar program to train our Club Tech technicians to provide club repair and upgrade services.
Our in-store PGA professionals are all fully trained as defined by the PGA. Additionally, we send our PGA professionals to the manufacturers' factories for extensive product and club-fitting training and for certification with several key club manufacturers, includingCallaway,TaylorMade andPING. Our PGA professionals are responsible for supervision of our in-house club fitting certification program.
We are committed to creating an environment of opportunity for our associates which we believe fosters a motivated and enthusiastic culture. We promoted 41 of our 45 current store general managers from within the organization. We provide management training to our existing and future store general managers regularly at our corporate headquarters.
Compensation. We compensate our store teams with competitive salaries and hourly wages. We believe that our non-commissioned sales approach is key to providing a superior level of customer service and knowledgeable advice. In addition to a base salary, the store general managers, assistant store managers and PGA professionals have monthly bonus opportunities based on the sales and gross profit budgets and controllable expenses of their respective stores. Our district managers receive a base salary and are eligible for an annual bonus based on our achieving annual corporate profitability goals.
64
All of our store managers, PGA professionals and district managers also participate in our long-term stock incentive plans. We also have monthly, team-based contests and bonus incentives which we believe create a team selling approach that delivers a positive shopping experience for our customers.
Hours. Our stores are open seven days a week, generally from 10:00 a.m. until 9:00 p.m. Monday through Friday, 9:00 a.m. to 8:00 p.m. on Saturday, and 10:00 a.m. to 6:00 p.m. on Sunday, except during the year-end holiday season when we extend our hours of operation. In some markets, we vary the hours slightly based on local conditions or seasonality.
Seasonality
Our business is subject to seasonal fluctuation, with the highest sales activity occurring during our first and second fiscal quarters, the spring and summer golf seasons, which include the Father's Day weekend, our biggest weekend of the year. We also experience increased demand in our fourth fiscal quarter, during the holiday season. Our customers' demand for our products and, therefore, our sales, can be significantly impacted by unseasonable weather conditions that affect outdoor activities.
Properties
Our corporate headquarters is located in Eden Prairie, Minnesota, where we lease from an unaffiliated third party approximately 25,000 square feet of office space, as well as approximately 23,000 square feet of warehouse space to support our eCommerce operations. The term of the lease ends in January 2010, subject to a five-year renewal at our option.
All of our 45 stores are leased. All but one of our store facilities are owned by unaffiliated third parties. Initial lease terms are generally 10 to 15 years and most leases contain multiple five-year renewal options and rent escalation provisions.
Employees
As of May 28, 2005, we had approximately 1,440 employees, of whom approximately 386, or 27%, were employed on a full-time basis. Our remaining employees are part-time and seasonal employees, working primarily as sales associates. We consider our relationship with all of our employees to be good. None of our employees is covered under a collective bargaining agreement.
Information Systems
Our information systems provide corporate management and store general managers with daily information on sales, gross profit rate and inventory levels. Our point of sale system and core management information system is a fully integrated solution from Retail Pro, a provider of inventory control/POS software for small to mid-tier retailers. We have developed additional functionality utilizing information processing tools from third party providers. We have implemented EDI and other electronic order transmission and invoicing with most of our key product vendors. Our eCommerce Internet site is hosted by a third party and is integrated with our core Retail Pro system. We also have a third party database management relationship to support our Advantage Club and automated special order processes. We believe our systems are scaleable and have the capacity to handle our growth plans.
Industry and Competition
Industry. According to the NGF, the aggregate size of the U.S. golf market was estimated at $24.3 billion in 2002, which included spending on greens fees, equipment and accessories, and food and beverages. Golf clubs, balls, bags, gloves and footwear represented $4.7 billion of this total. The
65
golf market, as defined by the NGF, does not include certain products that we sell such as pre-owned clubs, golf and casual apparel, and golf-related gifts, novelties and services. We estimate the total golf market we serve, including these additional products and services, is over $7.5 billion.
Over the past 30 years, the golf industry has experienced significant growth in participation and popularity. According to the NGF, the number of adult Americans who played golf in the years 2000 through 2004 has been relatively flat, although the number of golfers decreased from 28.4 million in 2003 to 27.3 million in 2004. The NGF study of the number of golfers in 2004 has a margin of error of plus or minus 1.1 million golfers.
The industry has experienced long-term increases in the number of rounds played per year, increasing from 266.0 million in 1970 to 495.0 million in 2003. According to the NGF, after many years of growth in rounds played, the number of rounds played declined slightly from 2001 to 2003 due, we believe, to a number of factors including a decline in the stock market, a weak economy, reduced leisure travel and unseasonable weather. However, for the approximately 16,000 golf course facilities operating in 2003, the NGF reported that the number of rounds played at those facilities increased by 0.7% in 2004 over rounds played in 2003.
GOLF PARTICIPATION RATE(1)
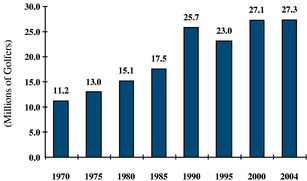
Source: National Golf Foundation
(1)Prior to 1990, the NGF included everyone five years of age or older that played one round or more on a regulation-length course. However, from 1990 to 2004, the NGF limited the study to those golfers age 18 and older and included golfers who played one or more rounds on any course.
ROUNDS PLAYED(1)
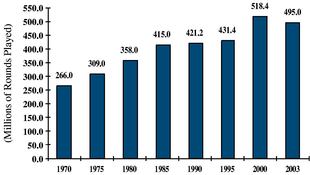
Source: National Golf Foundation
(1)The most recent available data on total rounds played was published in 2003.
Growth Drivers. We believe the popularity of golf and the sale of golf equipment, apparel and accessories, is influenced by, among other things, the following factors:
- •
- Growth in golf course facilities. According to the NGF, the number of golf course facilities has grown by 2,374 facilities over the last ten years, from 13,683 in 1994 to 16,057 in 2004. Most of this growth is attributable to new public or daily fee courses, which now represent approximately 73% of all golf course facilities, significantly improving access to the game.
- •
- Favorable demographic trends. The aging of the sizable baby boomer population segment should continue to have a positive impact on golf equipment spending as those golfers ages 45 to 64 spend more than the average golfer. According to the NGF, in 2002, 45- to 64-year olds accounted for approximately 38% of golf equipment spending though they represented only 32% of golfers. Given the expected 30% increase in population for this age demographic from 2000 to 2010, sales of golf equipment may be positively affected.
66
DISTRIBUTION OF GOLFERS BY
AGE AND SPENDING
| Age | Number of Golfers | Equipment Spending | |||
|---|---|---|---|---|---|
| 18-29 | 22 | % | 16 | % | |
| 30-44 | 34 | % | 36 | % | |
| 45-64 | 32 | % | 38 | % | |
| 65+ | 12 | % | 10 | % | |
| Total | 100 | % | 100 | % |
Source: National Golf Foundation
POPULATION SHIFTS BY AGE (2000-2010)
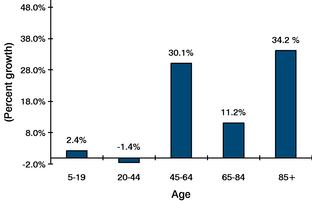
Source: U.S. Census Bureau
- •
- Industry initiatives. Over the past few years, there have been numerous initiatives supported by the PGA, LPGA, USGA, World Golf Foundation and others to increase golf participation. These include programs designed to introduce golf to juniors, programs offering discounted or free introductory lessons to beginning golfers, and numerous programs designed to attract, develop and retain golfers.
- •
- Increased visibility. We believe the visibility of golf and golf equipment has been enhanced by increased media coverage of professional and other golf tournaments and events, greater exposure on television including The Golf Channel, an increased number of tour and special events and outings, and the emergence of superstars such as Tiger Woods, Annika Sorenstam and Michelle Wie. In addition, we believe advertising and promotions by equipment manufacturers have increased, and high profile sporting goods manufacturers, such asNIKE, have entered the golf equipment market.
- •
- Significant technological advances in golf equipment. Over the past ten years, there have been significant technological advances in club head and shaft construction, design and materials. The continuous introduction of this improved technology, together with advertising and promotions by equipment manufacturers emphasizing the importance of equipment to one's game, has encouraged golfers to change equipment frequently and made golf more enjoyable for the average player.
Retail Channels of Distribution. The retail channel for golf-related equipment, apparel and accessories is highly competitive and fragmented. According to the NGF, in 2003, there were 6.0 million avid golfers — golfers who played more than 25 rounds per year. Avid golfers represented 23% of all golfers and were responsible for 57% of all golf equipment purchases in the U.S. in 2002. In addition, according to the NGF, avid golfers purchased more clubs and balls in 2002 through the
67
off-course specialty retail channel than through any other channel. The off-course specialty retail channel has also gained market share from the other channels.
SPENDING BY CHANNEL IN 2002*
| Channel of Distribution | Clubs | Balls | ||
|---|---|---|---|---|
| Off-Course Specialty | 53% | 42% | ||
| On-Course | 32% | 24% | ||
| Sporting Goods | 3% | 15% | ||
| Mass Merchant | 2% | 8% | ||
| Mail Order | 2% | 1% | ||
| Internet | 2% | 1% | ||
| Warehouse Club | 2% | 4% | ||
| Other | 4% | 5% | ||
| Total: | 100% | 100% |
Source: National Golf Foundation
* Includes avid golfers and customers spending at least $1,000 per year on golf-related purchases.
Competition. The golf retail industry is highly competitive. Our stores compete against other off-course specialty retail chains, franchise and independent golf retailers, on-course pro shops, general sporting goods retailers, mass merchants, catalog and Internet-based retailers and warehouse clubs. General sporting goods retailers and mass merchants continue to increase their assortments of golf clubs, balls and accessories, particularly in low end, high turnover merchandise. Similarly, department stores and apparel specialty stores are expanding their assortments of golf apparel.
We compete principally on the basis of breadth and depth of product selection, brands, customer service, shopping experience, store location and pricing. We believe our extensive selection of leading national brands, commitment to superior customer service, in-store PGA professionals, interactive superstore format, distinctive marketing program, guaranteed low prices, leading market share and experienced management team position us to meet current and future competitive challenges. See "Business—Competitive Strengths."
Our principal competitors include the following:
- •
- Off-course golf specialty retail chains—such as Golfsmith, Edwin Watts and 2nd Swing
- •
- Franchise and independent golf retailers—such as Nevada Bob's, Pro Golf Discount and Golf USA
- •
- On-course pro shops—found at country clubs, public golf courses and other golf facilities
- •
- General sporting goods—such as Dick's Sporting Goods and The Sports Authority
- •
- Mass merchants and warehouse clubs—such as Wal-Mart, Target and Costco
- •
- Catalogs and Internet-based retailers—such as Golfsmith, Edwin Watts and The Golf Warehouse
68
Off-course golf specialty retail chains—These stores vary greatly in size and strategy, as well as geographic location. Some also employ large format stores and some focus on private label brands and components for the club-builder market. Most of these competitors do not have PGA professionals and services or demonstration and trial facilities. Most of these stores offer limited apparel and have limited access to the leading national brands of golf apparel.
Franchise and independent golf retailers—These are generally small stores from 2,000 to 5,000 square feet, positioned in secondary locations. We believe these stores often offer a more limited selection and depth of inventory. Many promote sales of their private label or lesser known brands with a commissioned sales staff and have no PGA professionals and services or demonstration and trial facilities.
On-course pro shops—These retailers are located at golf courses or other golf facilities such as driving ranges. They stock very little inventory in clubs or equipment, instead focusing their merchandising on the apparel category. These shops generally have PGA professionals on-staff but many do not have video lessons, ball launch monitors or club repair facilities.
General sporting goods—These stores are typically 20,000 to 100,000 square feet and offer a broad selection of sporting goods merchandise covering a variety of categories, including golf. These stores seek to combine numerous specialty shops under one store format. Prices at these stores are generally competitive; however, we believe the amount of space devoted to golf products limits the extent of their offering. These retailers often do not have access to certain of the leading national brands in both clubs and apparel. Most do not have PGA professionals and services or demonstration and trial facilities.
Mass merchants and warehouse clubs—These stores typically range in size from 50,000 to over 200,000 square feet. Golf products represent a very small portion of their retail square footage and their total sales. We believe that their product selection and access to the leading national brands are more limited than in our stores and that these stores offer minimal levels of customer service.
Catalog and Internet-based retailers—These retailers sell a broad selection of merchandise through the use of catalogs and the Internet. The products are competitively priced and the direct channel offers relative convenience to customers. However, catalog and Internet retailers are not able to provide the hands-on product testing, fitting or face-to-face customer service and support offered in our retail stores. In addition, since fiscal 2004, we have been able to compete directly with these retailers through our interactive eCommerce Internet site featuring our low-price guarantee.
Golf Town Canada
Golf Town Canada Inc., founded in 1998, is a golf specialty retailer operating 23 stores across Canada and employing a sales strategy similar to ours. In 1998, we entered into a consulting agreement with Golf Town Canada, then privately held, pursuant to which, among other things, we received common stock in Golf Town Canada. In October 2004, we amended the consulting agreement to clarify several restrictive covenants. We agreed not to provide consulting services in Canada, enter into any franchise agreement in Canada, or open a retail store in Canada until 2008, and Golf Town Canada agreed that it will not advertise outside of Canada until 2008, compete with us except in Canada until 2010, or open any retail stores in the United States until 2013. Neither of us will solicit the employees of the other until 2010.
In November 2004, Golf Town Canada reorganized through a newly formed income trust as part of its initial public offering as a Canadian income fund. In connection with that transaction, we sold all
69
our shares of Golf Town Canada for approximately $8.4 million and terminated our formal relationship with Golf Town Canada other than the previously described, on-going restrictions in the amended consulting agreement.
Proprietary Rights
We have registered our Golf Galaxy logo and each of "Golf Galaxy", "Everything for the Game.", "Outward 9" and "Rae's Creek" as a service mark or trademark, as applicable, with the United States Patent and Trademark Office.
Legal Proceedings
Although we are subject to litigation or other legal proceedings from time to time in the ordinary course of our business, we are not a party to any pending legal proceedings that we believe is reasonably likely to have a material impact on our business or our results of operations or financial condition.
70
The following table sets forth the name, age and positions of each of our executive and other officers and directors as of June 27, 2005.
| Name | Age | Position | ||
|---|---|---|---|---|
| Randall K. Zanatta* | 47 | President, Chief Executive Officer and Chairman | ||
| Gregory B. Maanum* | 43 | Chief Operating Officer and Director | ||
| Richard C. Nordvold* | 34 | Chief Financial Officer | ||
| Michael W. McCormick* | 42 | Chief Marketing Officer | ||
| Ronald G. Hornbaker* | 46 | Senior Vice President—Sales and Operations | ||
| Dana J. Busch | 41 | Vice President—Merchandising | ||
| Peter M. Harding | 44 | Vice President—Real Estate | ||
| Scott H. Kurtz | 46 | Vice President—Finance and Controller | ||
| Julia Y. Dittberner | 44 | Vice President—Human Resources | ||
| Mary L. Forby | 43 | Vice President—Information Technology | ||
| David E. Bloom | 55 | Director | ||
| Jack W. Eugster | 59 | Director | ||
| David S. Gellman | 47 | Director | ||
| Thomas C. Healy | 43 | Director | ||
| William C. Mulligan | 51 | Director | ||
| Gregg S. Newmark | 46 | Director |
*Executive Officer
Randall K. Zanatta is our President, Chief Executive Officer and Chairman of our board of directors. Mr. Zanatta co-founded our company with Mr. Maanum in December 1995. Before co-founding our company, Mr. Zanatta spent 17 years with Best Buy Co., Inc., a consumer electronics retailer, from 1979 to 1995, most recently as senior vice president—marketing and merchandising. During Mr. Zanatta's tenure at Best Buy Co., Inc., Mr. Zanatta also served on the executive committee, which was the primary guiding body of the organization.
Gregory B. Maanum is our Chief Operating Officer and a director of our company. Mr. Maanum co-founded our company with Mr. Zanatta in December 1995. Mr. Maanum directly oversees our merchandising and inventory planning functions. He also directs our real estate selection process, store design and construction activities. In addition, Mr. Maanum has overall responsibility for our retail sales and operations. Before co-founding our company, Mr. Maanum spent 12 years with Best Buy Co., Inc. from 1982 to 1995, most recently as vice president—visual merchandising after founding Best Buy's visual merchandising department.
Richard C. Nordvold is our Chief Financial Officer. Mr. Nordvold joined our company in March 2004 after spending five years with Best Buy Co., Inc., most recently as director—corporate finance, and six years with Arthur Andersen, LLP, an accounting firm, most recently as manager in audit and business advisory services. Mr. Nordvold oversees our finance, accounting, information systems, human resources and administrative functions.
Michael W. McCormick is our Chief Marketing Officer. Mr. McCormick joined our company in January 2003 after spending three years with Callaway Golf Company, a manufacturer of golf products, as executive vice president—global sales, and nine years with NIKE, Inc., a manufacturer of
71
athletic equipment, shoes and apparel, as director—national sales. Mr. McCormick directly oversees our marketing, advertising, PGA services and eCommerce functions.
Ronald G. Hornbaker is our Senior Vice President—Sales and Operations. Mr. Hornbaker oversees our retail store sales, operations and training functions. Mr. Hornbaker joined our company in May 2000 after spending six years at Select Comfort Corporation, a manufacturer of premium, adjustable-firmness beds, most recently as vice president—operations and training. During Mr. Hornbaker's tenure at Select Comfort, Mr. Hornbaker directed store operations, sales and product training for 341 stores and developed the field infrastructure for multi-store management including seven regional and 50 district sales managers. Mr. Hornbaker also spent 13 years in various sales management positions with Tandy Name Brand Retail Group, a subsidiary of RadioShack Corporation, a consumer electronics retailer.
Dana J. Busch is our Vice President—Merchandising, having been promoted to the position of Vice President in November 2003. Mr. Busch joined our company in March 1998 as our Director—Merchandise Planning. Prior to joining our company, Mr. Busch spent 11 years with The Athletic Fitters, Inc. where he was responsible for retail operations and information systems for 97 locations.
Peter M. Harding has been our Vice President—Real Estate since April 2004. Mr. Harding joined our company in January 1998 serving as our Director—Design and Construction and our Director—Real Estate before being promoted to his present position. Prior to joining our company, Mr. Harding spent seven years with Best Buy Co., Inc., most recently in the positions of purchasing manager and store planning manager.
Scott H. Kurtz has been our Vice President—Finance and Controller since October 2003. Mr. Kurtz joined our company as Controller in February 1998. Prior to joining our company, Mr. Kurtz had 11 years of experience in various financial accounting positions with Target Corporation and County Seat Stores, Inc. Mr. Kurtz also had previous experience in public accounting with Deloitte & Touche LLP.
Julia Y. Dittberner has been our Vice President—Human Resources since February 2005. Ms. Dittberner oversees our human resources function and office administration at the corporate headquarters. Prior to joining our company, from 2003 to 2005, Ms. Dittberner was an independent executive coach for Drake Beam Morin, Inc., a global human resources service provider headquartered in Philadelphia, Pennsylvania. From 1998 to 2002, she was a director of human resources for eFunds Corporation, a former subsidiary of Deluxe Corporation. Prior to that, for two years, Ms. Dittberner was the director of human resources for County Seat Stores, Inc.
Mary L. Forby has been our Vice President—Information Technology since June 2005. Prior to joining our company, from 2004 to 2005, Ms. Forby was the director of technical support at ShopNBC.com, a commercial internet site operated by ValueVision Media, Inc. Prior to that, from 2000 to 2004, Ms. Forby was employed by Travelers Express MoneyGram, a subsidiary operation of MoneyGram International, Inc., where she was a manager of server systems, director of infrastructure, and, most recently, the director of production control. From 1998 to 2000, Ms. Forby was employed by Conseco Finance Corp.
David E. Bloom has been a director of our company since February 1999. Mr. Bloom is the president and chief executive officer and serves on the board of Le Gourmet Chef. From 1994 to 1998, he served as chief executive officer of Sneaker Stadium, an athletic shoe retail company that he founded. From 1984 to 1994, he served as president of two other retail companies, Herman's World Sporting Goods and Record World.
72
Jack W. Eugster has been a director of our company since October 2000. Mr. Eugster was the chairman of the board, president and chief executive officer of Musicland Stores Corporation, a pre-packaged music and movie retailer, when he retired in 2001. Mr. Eugster is a director of Donaldson Company, Inc., a manufacturer of filtration systems and replacement parts; a director and former chairman of the board for ShopKo Stores, Inc., a regional retailer of a variety of goods and services; and a director of Black Hills Corp., an integrated power company based in Rapid City, South Dakota.
David S. Gellman has been a director of our company since July 1999. Since 1995, Mr. Gellman has been a managing director of FdG Associates, a private equity investment firm. From 1988 to 1995, he was an investment professional with AEA Investors Inc., a private equity firm. Mr. Gellman also serves on the boards of directors of several privately held companies.
Thomas C. Healy has been a director of our company since August 2004. Mr. Healy is executive vice president—Best Buy for Business of Best Buy Co., Inc., a consumer electronics retailer, where he has been employed since 1990. He has served Best Buy in several capacities, including as a senior vice president—segment lead from 2003 to 2004, and as president—Best Buy International from 2001 to 2003.
William C. Mulligan has been a director of our company since January 1998. Mr. Mulligan has been a managing director of Primus Venture Partners, Inc. a private equity investment firm, since July 1985. Mr. Mulligan serves on the board of directors of Universal Electronics, Inc., a publicly held developer and manufacturer of universal remote controls. Mr. Mulligan also serves on the boards of directors of several privately held companies.
Gregg S. Newmark has been a director of our company since January 1998. Mr. Newmark has been with William Blair Capital Partners, a private equity investment firm, since 1985, serving as managing director since 1995, and is a principal of William Blair & Company. Mr. Newmark's principal responsibilities at William Blair Capital Partners include sourcing and managing investments. Mr. Newmark also serves on the boards of directors of several privately held companies.
Board of Directors; Committees
Our board of directors consists of eight members. Our board of directors has amended our articles of incorporation and bylaws, effective upon the closing of this offering, to provide that our board of directors will be divided into three classes. Our shareholders approved the amendments to our articles of incorporation at a meeting held on June 15, 2005. The term of office of directors to be assigned to Class I will expire at our regular meeting of shareholders in 2006 and at each third succeeding regular meeting thereafter. The term of office of directors to be assigned to Class II will expire at our regular meeting of shareholders in 2007 and at each third succeeding regular meeting thereafter. The term of office of directors to be assigned to Class III will expire at our regular meeting of shareholders in 2008 and at each third succeeding regular meeting thereafter. Following the completion of this offering, Messrs. Bloom, Healy and Mulligan will serve as Class I directors, Messrs. Eugster, Maanum and Newmark will serve as Class II directors and Messrs. Gellman and Zanatta will serve as Class III directors.
This classification of our board of directors may delay or prevent a change of control of our company or in our management. See "Description of Capital Stock—Potential Anti-Takeover Effects of Certain Provisions of Minnesota State Law and Our Articles of Incorporation and Bylaws—Articles of Incorporation and Bylaws."
73
A majority of our directors are independent directors in accordance with the rules of the Nasdaq National Market and relevant federal securities laws and regulations. Certain members of our board of directors were elected as designees of investors that had contractual rights to nominate a director under the terms of our preferred stock financing documents. Mr. Newmark is the designee of the holders of our Series A preferred stock; Mr. Mulligan is the designee of the holders of our Series A and Series B preferred stock; Mr. Gellman is the designee of the holders of our Series C preferred stock; and Mr. Healy is the designee of the holder of our Series D preferred stock. Messrs. Zanatta and Maanum also have certain rights to be designated as members of our board of directors. All of these designation rights will terminate following this offering.
Our board of directors has established an audit committee, a compensation committee and, effective upon the closing of this offering, a nominating and governance committee.
Audit Committee. The members of our audit committee are Messrs. Newmark, Mulligan and Eugster. Following the closing of this offering, we will reconsider the composition of the audit committee to assure compliance with the independence and other requirements of the Nasdaq National Market and relevant federal securities laws and regulations. The audit committee assists our board of directors in monitoring the integrity of our financial statements; the independent auditor's performance, qualifications and independence; the performance of our internal audit function; and our compliance with legal and regulatory requirements.
Compensation Committee. The members of our compensation committee are Messrs. Bloom, Gellman and Newmark. Following the closing of this offering, we will reconsider the composition of our compensation committee to assure compliance with the independence requirements of the Nasdaq National Market and relevant federal securities laws and regulations. The compensation committee has overall responsibility for evaluating and approving our executive officer base, incentive, benefit, severance, equity-based and other compensation plans, policies and programs. The compensation committee will also be responsible for producing an annual report on executive compensation for inclusion in our proxy statements.
Nominating and Governance Committee. Effective with the closing of this offering, our board of directors has established a nominating and governance committee comprised of Messrs. Newmark, Gellman and Eugster, all of whom have been determined by our board of directors to be independent directors in accordance with the rules of the Nasdaq National Market and relevant securities laws and regulations. The nominating and governance committee will assist our board of directors in promoting our best interests and the best interests of our shareholders through the implementation of sound corporate governance principles and practices. In furtherance of this purpose, the nominating and governance committee will identify individuals qualified to become members of our board of directors and to recommend to our board the director nominees for the next regular meeting of shareholders. It will also review the qualifications and independence of the members of our board of directors and its various committees on a regular basis and make such recommendations the committee members may deem appropriate from time to time concerning any recommended changes in the composition of our board of directors and its committees. The nominating and governance committee will also recommend to our board of directors the corporate governance guidelines and standards regarding the independence of outside directors applicable to our company and review such guidelines and standards and the provisions of the nominating and governance committee charter on a regular basis to confirm that such guidelines, standards and charter remain consistent with sound governance practices and with any legal or regulatory requirements of the Nasdaq National Market. The nominating and governance committee will also monitor the performance of our board of directors and our compliance with any commitments made to our regulators regarding changes in corporate governance practices and will lead our board of directors in its annual review of the performance of our board of directors.
74
Limitation of Liability and Indemnification
Minnesota law and our articles of incorporation provide that our directors will not be personally liable for monetary damages to us or our shareholders for a breach of fiduciary duty to the full extent that the law permits the limitation or elimination of the liability of directors.
Compensation of Directors
At the beginning of fiscal 2004, we began to pay directors who are not executive officers of our company or designees of our preferred shareholders, namely Messrs. Bloom and Eugster, $1,500 per meeting for each of the quarterly board meetings they attend. We have granted these two directors options pursuant to our 1996 Stock Option and Incentive Plan, as amended, to purchase a combined total of 40,000 shares of our common stock, which options were 50% vested on the grant date and were 100% vested on the first anniversary of the grant date, all of which are now fully vested. Such grants were at the discretion of the compensation committee. We also reimburse all of our directors for reasonable travel expenses incurred in attending our meetings. Following the closing of this offering, we will re-evaluate the compensation of our non-management directors.
Corporate Governance
We believe that shortly after completion of this offering, we will comply with all Nasdaq National Market corporate governance and listing requirements. In the interim, we will rely on transition periods available to companies listing in conjunction with their initial public offering.
Compensation Committee Interlocks and Insider Participation
During fiscal 2005, Messrs. Bloom, Gellman and Newmark served as the members of our compensation committee. No executive officer currently serves, or in the past has served, on the compensation committee or the board of directors of any other company of which any of the members of our compensation committee or any of our directors is an executive officer.
Executive Compensation
The following table sets forth the compensation earned by our Chief Executive Officer and our four other most highly compensated executive officers in fiscal 2005, all of whom are referred to in this prospectus as the named executive officers.
75
| | | | | Long-Term Compensation | | ||||||||
|---|---|---|---|---|---|---|---|---|---|---|---|---|---|
| | | Annual Compensation | | ||||||||||
| Name and Principal Position | Fiscal Year | Securities Underlying Options | All Other Compensation(2) | ||||||||||
| Salary | Bonus(1) | ||||||||||||
| Randall K. Zanatta President, Chief Executive Officer andChairman | 2005 | $ | 237,500 | $ | 118,750 | 10,000 | $ | 4,777 | |||||
| Gregory B. Maanum Chief Operating Officer | 2005 | 217,692 | 108,846 | 10,000 | 4,777 | ||||||||
| Michael W. McCormick Chief Marketing Officer | 2005 | 209,692 | 104,846 | 10,000 | 4,777 | ||||||||
| Ronald G. Hornbaker Senior Vice President—Sales and Operations | 2005 | 163,269 | 81,634 | 10,000 | 4,777 | ||||||||
| Richard C. Nordvold Chief Financial Officer | 2005 | 147,692 | 73,846 | 75,000 | 3,858 | ||||||||
(1)Earned in respect of fiscal 2005 but paid in fiscal 2006.
(2)Consists of medical and dental health insurance premiums paid on behalf of the officers which are not available generally to all our employees.
Option Grants in Last Fiscal Year
The following table sets forth certain information concerning option grants to the named executive officers during the fiscal year ended February 26, 2005.
| | Individual Grants | | | ||||||||||||
|---|---|---|---|---|---|---|---|---|---|---|---|---|---|---|---|
| | Potential Realizable Value at Assumed Rates of Stock Price Appreciation for Option Term(1) | ||||||||||||||
| | Number of Securities Underlying Options Granted | Percent of Total Options Granted to Employees in Fiscal Year | | | |||||||||||
| Name | Exercise Price | Expiration Date | |||||||||||||
| 5% | 10% | ||||||||||||||
| Randall K. Zanatta | 10,000 | (2) | 4 | % | $ | 6.30 | 5/4/14 | $ | 39,620 | $ | 100,406 | ||||
| Gregory B. Maanum | 10,000 | (2) | 4 | % | 6.30 | 5/4/14 | 39,620 | 100,406 | |||||||
| Michael W. McCormick | 10,000 | (2) | 4 | % | 6.30 | 5/4/14 | 39,620 | 100,406 | |||||||
| Ronald G. Hornbaker | 10,000 | (2) | 4 | % | 6.30 | 5/4/14 | 39,620 | 100,406 | |||||||
| Richard C. Nordvold | 75,000 | (3) | 30 | % | 6.30 | 3/15/14 | 297,153 | 753,043 | |||||||
(1)In accordance with the rules of the SEC, the amounts shown on this table represent hypothetical gains that could be achieved for the respective options if exercised at the end of the option term. These gains are based on assumed rates of stock appreciation of 5% and 10%, compounded annually, and do not reflect our estimates or projections of the future price of our common stock. These amounts represent assumed rates of appreciation in the value of our common stock from the fair value of our common stock as of the date of grant, as determined by our board of directors. The gains shown are net of the option exercise price, but do not include deductions for taxes or other expenses associated with the exercise. Actual gains, if any, on stock option exercises will depend on the future performance of our common stock, the option holder's continued employment through the option period, and the date on which the options are exercised.
(2)The options were granted under our 1996 Stock Option and Incentive Plan on May 4, 2004, and vest as to 25% of the shares on each of the first four anniversaries of the date of grant.
(3)The options were granted under our 1996 Stock Option and Incentive Plan on March 15, 2004, and vest as to 25% of the shares on each of the first four anniversaries of the date of grant.
76
The following table sets forth information concerning exercisable and unexercisable options held by the named executive officers during the fiscal year ended February 26, 2005. The table also reports values for "in-the-money" options that represent the positive spread between the exercise prices of outstanding options and the fair market value of our common stock at the end of fiscal 2005.
Aggregated Option Exercises in Fiscal 2005 and Year-End Option Values
| | | | Number of Securities Underlying Unexercised Options at Fiscal Year-End | | | |||||||||
|---|---|---|---|---|---|---|---|---|---|---|---|---|---|---|
| | | | Value of Unexercised In-The-Money Options at Fiscal Year-End(1) | |||||||||||
| | Number of Shares Acquired on Exercise | | ||||||||||||
| Name | Value Realized | |||||||||||||
| Exercisable | Unexercisable | Exercisable | Unexercisable | |||||||||||
| Randall K. Zanatta | — | — | 100,625 | 11,875 | $ | 375,281 | $ | 17,694 | ||||||
| Gregory B. Maanum | — | — | 100,625 | 11,875 | 375,281 | 17,694 | ||||||||
| Michael W. McCormick | — | — | 43,750 | 66,250 | 65,188 | 98,712 | ||||||||
| Ronald G. Hornbaker | — | — | 30,625 | 16,875 | 57,231 | 25,144 | ||||||||
| Richard C. Nordvold | — | — | — | 75,000 | — | 111,750 | ||||||||
(1)Assumes a fair market value price of $7.79 per share of our common stock, as of February 26, 2005, as determined by our board of directors and based on a third-party appraisal to estimate the value of the common stock at that point in time, given our then-existing capital structure and the priority of preferred stock, among other factors.
Employment and Retention Agreements. We have employment agreements with all five of our executive officers. On December 31, 1997, we entered into employment agreements with Mr. Zanatta and Mr. Maanum pursuant to which Mr. Zanatta is serving as our President and Chief Executive Officer and Mr. Maanum is serving as our Chief Operating Officer. On January 6, 2003, we entered into an employment agreement with Mr. McCormick pursuant to which he is serving as our Chief Marketing Officer. On March 15, 2004, we entered into an employment agreement with Mr. Nordvold pursuant to which he is serving as our Chief Financial Officer. On May 11, 2005, we entered into an employment agreement with Mr. Hornbaker pursuant to which he is serving as our Senior Vice President—Sales and Operations.
Each employment agreement will continue in effect until either party terminates it. Pursuant to the terms of each employment agreement, the executive officer receives, among other things, an annual base salary as determined by the board of directors and a bonus from time to time at the sole discretion of the board of directors. In the event we terminate the executive officer's employment without cause or the executive officer terminates his employment with us for good reason, we must pay to the executive officer his then-current annual base salary for the six-month period immediately following his termination of employment, plus any bonuses that the executive officer would have received had he remained an employee during the six-month period following his termination assuming all performance criteria had been met. We must also continue for such six-month period to provide benefits to the executive officer at the same levels and with the expenses allocated as they were immediately before the executive officer's termination. In addition, all options granted to the executive officer would immediately vest and become exercisable.
Additionally, pursuant to his employment agreement, Mr. McCormick received grants of options to purchase 100,000 shares of our common stock and reimbursement of relocation and moving expenses. Pursuant to his employment agreement, Mr. Nordvold received grants of options to purchase 75,000 shares of common stock. Upon his employment in May 2000, Mr. Hornbaker received grants of options to purchase 20,000 shares of common stock.
77
On December 31, 1997, we entered into retention agreements with Mr. Zanatta and Mr. Maanum. In the event we terminate the executive officer's employment in connection with a change in control or within one year after a change in control, and other than for cause or initiated by the executive officer for other than good reason, we must pay to the executive officer his then-current annual base salary for the six-month period immediately following his termination of employment, plus any bonuses that the executive officer would have received had he remained an employee during the six-month period following his termination assuming all performance criteria had been met. We must also continue for such six-month period to provide benefits to the executive officer at the same levels and with the expenses allocated as they were immediately before the executive officer's termination. In addition, all options granted to the executive officer would immediately vest and become exercisable. Each retention agreement may be terminated on August 31 of any year by the affirmative vote of a majority of the board of directors prior to June 1 of that year and prior to the occurrence or active consideration of a change in control.
Each executive officer has agreed, for the period of his employment with us and for a period of six months thereafter, that he will not compete with us and he will not solicit our employees to terminate their employment with us.
Employee Benefit Plans
401(k) Plan. We offer a 401(k) savings and investment plan that is intended to qualify under Section 401(k) of the Internal Revenue Code of 1986, as amended. All of our full-time employees who have at least one year of service, have worked 1,000 hours during the year and are at least 21 years of age are eligible to participate in the plan. Participants may contribute up to 18% of their pay on a pre-tax basis, and such deferred amounts are deducted each pay period. Our board of directors has the discretion to authorize us to match employee contributions to the 401(k) plan. Effective July 1, 2005, we will begin matching 50% of the first 4% of eligible compensation contributed to the 401(k) plan by each participant. Previously, no matching contributions have been made.
Stock Incentive Plans
1996 Stock Option and Incentive Plan. Pursuant to our 1996 Stock Option and Incentive Plan, as amended (1996 Plan), we have reserved 1,000,000 shares of our common stock for issuance to persons who provide services to us or to our affiliates as an employee, consultant or other service provider. The types of awards that may be granted under the 1996 Plan include incentive and non-qualified stock options and restricted stock. Under the 1996 Plan, our compensation committee determines when and to whom awards will be granted, the form of each award, the amount of each award, and any other terms or conditions of each award consistent with the terms of the 1996 Plan. Each award agreement specifies the number and type of award, together with any other terms and conditions as determined by the compensation committee.
All stock options granted under the 1996 Plan will expire no later than 121 months from the date the options were granted, and the exercise price for incentive stock options may not be less than 100% of the fair market value of the shares at the time the option is granted. Options granted under the 1996 Plan may be designated as exercisable in one or more installments, upon the happening of certain events, upon the fulfillment of certain conditions or upon such other terms and conditions as may be determined upon grant.
Restricted stock awards granted under the 1996 Plan entitle the holder to receive shares of our common stock, subject to forfeiture if specified conditions are not satisfied at the end of a specified period. During the period when the shares of our common stock are restricted, the holder will not be permitted to transfer the shares, but will have all of the rights of a shareholder in our company with
78
respect to such shares, including the right to vote the shares and receive dividends and other distributions with respect to the shares.
At June 27, 2005, options to purchase 873,125 shares were outstanding under the 1996 Plan, with exercise prices ranging from $3.00 to $6.30 per share. In addition, 96,550 shares have been issued pursuant to the exercise of options issued under the 1996 Plan. We have not granted any awards of restricted stock under the 1996 Plan.
2004 Stock Incentive Plan. In July 2004, our shareholders approved our 2004 Stock Incentive Plan (2004 Plan), for which we have reserved 1,000,000 shares of our common stock for issuance to directors, officers, employees, consultants and other service providers of our company and our affiliates. Like the 1996 Plan, the types of awards that may be granted under the 2004 Plan include incentive and non-qualified stock options and restricted stock. Under the 2004 Plan, our compensation committee determines when and to whom awards will be granted, the form of each award, the amount of each award, and any other terms or conditions of each award consistent with the terms of the 2004 Plan.
All stock options granted under the 2004 Plan will expire no later than ten years from the date the options were granted, and the exercise price for incentive stock options may not be less than 100% of the fair market value of the shares at the time the option is granted. Options granted under the 2004 Plan may be designated as exercisable in one or more installments, upon the happening of certain events, upon the fulfillment of certain conditions or upon such other terms and conditions as may be determined upon grant.
Restricted stock awards granted under the 2004 Plan entitle the holder to receive shares of our common stock, subject to forfeiture if specified conditions are not satisfied at the end of a specified period. During the period when the shares of our common stock are restricted, the holder will not be permitted to transfer the shares, but will have all of the rights of a shareholder in our company with respect to such shares, including the right to vote the shares and receive dividends and other distributions with respect to the shares.
At June 27, 2005, options to purchase 165,900 shares were outstanding under the 2004 Plan, with exercise prices ranging from $6.30 to $8.00 per share. In addition, we authorized for issuance, effective as of the date of this prospectus, options to purchase 167,500 shares at an exercise price equal to the price per share of our common stock sold in this offering. No shares have been issued pursuant to the exercise of options issued under the 2004 Plan. We have not granted any awards of restricted stock under the 2004 Plan.
79
CERTAIN RELATIONSHIPS AND RELATED PARTY TRANSACTIONS
Preferred Stock Agreement. Consistent with similar agreements entered into in each of the last three years, effective May 28, 2005, we amended a preferred stock agreement with all of the holders of the outstanding shares of our preferred stock pursuant to which such holders agreed to defer their rights under our articles of incorporation to receive all accrued and unpaid dividends and their redemption rights until May 28, 2006. In addition, they waived any claims against us based on the deferral of these rights. The holders, William Blair Capital Partners V, L.P., Primus Capital Fund IV L.P., Primus Executive Fund L.P., FdG Capital Partners LLC, FdG – Chase Capital Partners LLC and Best Buy Co., Inc., each has a designee on our board of directors and beneficially owns more than 10% of our common stock on an as-converted basis as of May 28, 2005.
Conversion Agreement. On May 16, 2005, we entered into a conversion agreement with all of the holders of the outstanding shares of our preferred stock (Conversion Agreement) pursuant to which such holders agreed to voluntarily convert all of their shares of preferred stock into shares of our common stock upon the closing of this offering and we agreed to pay the accrued and outstanding dividends upon the closing of this offering as set forth in the following table:
| Preferred Shareholder | Preferred Shares* | Common Stock Per Share Conversion Price | Common Shares | Amount of Accrued and Unpaid Dividends Payable upon Conversion | ||||||
|---|---|---|---|---|---|---|---|---|---|---|
| William Blair Capital Partners V, L.P. | ||||||||||
| Series A Preferred Stock | 50,000 | $ | 4.35 | 1,149,425 | ||||||
| Series B Preferred Stock | 21,875 | 5.20 | 420,673 | |||||||
| Series C Preferred Stock | 12,500 | 5.72 | 218,531 | |||||||
| Primus Capital Fund IV L.P. | ||||||||||
| Series A Preferred Stock | 28,800 | 4.35 | 662,068 | |||||||
| Series B Preferred Stock | 12,600 | 5.20 | 242,307 | |||||||
| Series C Preferred Stock | 7,200 | 5.72 | 125,874 | |||||||
| Primus Executive Fund L.P. | ||||||||||
| Series A Preferred Stock | 1,200 | 4.35 | 27,586 | |||||||
| Series B Preferred Stock | 525 | 5.20 | 10,096 | |||||||
| Series C Preferred Stock | 300 | 5.72 | 5,244 | |||||||
| FdG Capital Partners LLC | ||||||||||
| Series C Preferred Stock | 74,146 | 5.72 | 1,296,258 | |||||||
| FdG – Chase Capital Partners LLC | ||||||||||
| Series C Preferred Stock | 5,854 | 5.72 | 102,342 | |||||||
| Best Buy Co., Inc. | ||||||||||
| Series D Preferred Stock | 94,000 | 6.30 | 1,492,063 | |||||||
*For purposes of conversion, each share of preferred stock is valued at $100 per share.
Pursuant to the Conversion Agreement, the holders of our outstanding preferred stock have agreed to waive certain rights, including any anti-dilution or preemptive rights, any registration rights they may have in connection with or immediately prior to this offering, any redemption rights they may have and any rights to designate or elect members of our board of directors.
Sale of Stock to Jack W. Eugster. On November 9, 2004 we authorized, and on January 18, 2005 we sold, 20,000 shares of our common stock to Jack W. Eugster, a member of our board of directors, for $6.30 per share.
Purchase of Inventory from The Golf Works. We purchase certain inventory from The Golf Works (Golf Works), a manufacturer and distributor of golf club components. An executive officer of Golf Works is the brother of Michael W. McCormick, our Chief Marketing Officer. Our decision to conduct business with Golf Works was based on both qualitative and quantitative factors including product offerings, pricing and customer service. Our Chief Executive Officer and Chief Operating Officer have reviewed our transactions with Golf Works, determined that the transactions were at arm's-length and approved Golf Works as an ongoing supplier of certain inventory. Total purchases from Golf Works during fiscal 2005, 2004 and 2003, were $727,573, $593,557 and $381,584, respectively.
80
Sublease of Property from Best Buy Co., Inc. On August 6, 2004, we entered into a sublease for our Gurnee, Illinois store with Best Buy Co., Inc. (Best Buy) as sublessor. Best Buy is our only Series D preferred shareholder and a beneficial owner of our common stock. Pursuant to a preferred stock agreement, Best Buy has designated Thomas C. Healy, its executive vice president—Best Buy for Business, to serve as a member of our board of directors. The terms of the sublease provide that from December 1, 2004 until January 31, 2010, minimum annual rent will be $232,499, or $19,375 per month. From February 1, 2010 to January 31, 2015, minimum annual rent will be $243,727, or $20,311 per month. The sublease will expire on January 31, 2015. We began making rent payments on December 1, 2004. The total amount paid to Best Buy during fiscal 2005, including payments for real estate taxes and common area charges, was $88,663.
81
PRINCIPAL AND SELLING SHAREHOLDERS
The following table sets forth information with respect to the beneficial ownership of our common stock as of June 27, 2005, and after the sale of shares in this offering, for
- •
- each person who is known by us to own beneficially more than 5% of our common stock;
- •
- each of our directors;
- •
- each of our named executive officers;
- •
- all of our directors and executive officers as a group; and
- •
- each selling shareholder that will participate in this offering.
Beneficial ownership is determined in accordance with applicable SEC rules and regulations. The percentage of ownership is based on 1,883,969 shares of our common stock outstanding on June 27, 2005. In computing the percentage of shares beneficially owned by any shareholder, the number of shares of common stock deemed outstanding "Prior to Offering" assumes the conversion of all preferred stock into shares of our common stock at the respective conversion ratios in effect on that date. In addition, shares of our common stock subject to outstanding options held by a person that are exercisable within 60 days of June 27, 2005, are deemed to be beneficially owned by that person, although they are not deemed outstanding for the purpose of computing the percentage ownership of any other person. The number of shares of common stock deemed outstanding "After Offering" includes the shares of common stock offered by us in this offering.
Unless otherwise indicated in a footnote below, the listed beneficial owner has sole voting power and investment power with respect to such shares. The mailing address for each person listed is 7275 Flying Cloud Drive, Eden Prairie, Minnesota 55344, except as otherwise provided.
| | Beneficial Ownership Prior to Offering | Beneficial Ownership After Offering | | Beneficial Ownership After Over-allotment | |||||||||||
|---|---|---|---|---|---|---|---|---|---|---|---|---|---|---|---|
| Name and Address of Beneficial Owner | Over-allotment Shares being Offered(1) | ||||||||||||||
| Shares | Percent | Shares | Percent | Shares | Percent | ||||||||||
Named Executive Officers and Directors | |||||||||||||||
Randall K. Zanatta | 805,000 | (2) | 10.4 | % | |||||||||||
Gregory B. Maanum | 605,000 | (2) | 7.8 | % | |||||||||||
Michael W. McCormick | 52,500 | (3) | * | ||||||||||||
Ronald G. Hornbaker | 37,500 | (3) | * | ||||||||||||
Richard C. Nordvold | 18,750 | (3) | * | ||||||||||||
David E. Bloom | 30,000 | (3) | * | ||||||||||||
Jack W. Eugster 2655 Kelly Avenue Excelsior, Minnesota 55331 | 30,000 | (4) | * | ||||||||||||
82
David S. Gellman FdG Associates 299 Park Avenue, 16th Floor New York, New York 10171 | 1,398,600 | (5) | 18.3 | % | |||||||||||
Thomas C. Healy Best Buy Co., Inc. 7601 Penn Avenue South Richfield, Minnesota 55423 | 1,492,063 | (6) | 19.5 | % | |||||||||||
William C. Mulligan Primus Venture Partners, Inc. 5900 Landerbrook Drive, Suite 200 Cleveland, Ohio 44124 | 1,073,175 | (7) | 14.1 | % | |||||||||||
Gregg S. Newmark William Blair Capital Management, LLC 222 West Adams Street Chicago, Illinois 60606 | 1,788,629 | (8) | 23.4 | % | |||||||||||
All executive officers and directors as a group (11 persons) | 7,331,217 | (9) | 91.7 | % | |||||||||||
All other 5% and Selling Shareholders | |||||||||||||||
William Blair Capital Partners V, L.P. 222 West Adams Street Chicago, Illinois 60606 | 1,788,629 | (8) | 23.4 | % | |||||||||||
Primus Capital Fund IV L.P. 5900 Landerbrook Drive, Suite 200 Cleveland, Ohio 44124 | 1,073,175 | (7) | 14.1 | % | |||||||||||
Primus Executive Fund L.P. 5900 Landerbrook Drive, Suite 200 Cleveland, Ohio 44124 | 1,073,175 | (7) | 14.1 | % | |||||||||||
FdG Capital Partners LLC 299 Park Avenue, 16th Floor New York, New York 10171 | 1,398,600 | (5) | 18.3 | % | |||||||||||
FdG – Chase Capital Partners LLC 299 Park Avenue, 16th Floor New York, New York 10171 | 1,398,600 | (5) | 18.3 | % | |||||||||||
Best Buy Co., Inc. 7601 Penn Avenue South Richfield, Minnesota 55423 | 1,492,063 | (6) | 19.5 | % |
*Less than 1%
(1)Amounts presented assume that the over-allotment option is exercised in full.
(2)Includes 105,000 shares of our common stock issuable upon exercise of outstanding options that are exercisable within 60 days.
(3)Represents shares of our common stock issuable upon exercise of outstanding options that are exercisable within 60 days.
83
(4)Includes 20,000 shares of common stock outstanding and 10,000 shares of our common stock issuable upon exercise of options that are exercisable within 60 days.
(5)Represents 1,296,258 shares of our common stock issuable upon conversion of shares of our preferred stock held by FdG Capital Partners LLC (FdG Capital) and 102,342 shares of our common stock issuable upon conversion of shares of our preferred stock held by FdG—Chase Capital Partners LLC. (FdG Chase). The Managing Member of both FdG Capital and FdG Chase is FdG Capital Associates LLC (FdG Associates). Each of FdG Capital, FdG Chase and FdG Associates is a Delaware limited liability company. FdG Associates is managed by a board of managers, comprised of Charles de Gunzburg, Martin Edelman, David Gellman and Mark Hauser, which has full voting power over our shares. The FdG Associates investment committee, comprised of Richard Fisher, David Gellman and Mark Hauser, has full investment discretion over our shares. No single member of the board of managers or investment committee has voting or dispositive authority over our shares. Consequently, each member, including Mr. Gellman, disclaims beneficial ownership of such securities except to the extent of his pecuniary interest therein.
(6)Represents shares of our common stock issuable upon conversion of shares of our preferred stock held by Best Buy Co., Inc., a publicly traded company. While investment decisions of Best Buy Co., Inc. are made by investment committees which do not include Mr. Healy, as an executive officer of Best Buy Co., Inc., Mr. Healy has legal power to vote and dispose of the shares and thus may be deemed to beneficially own them. However, Best Buy Co., Inc. treats the shares as a corporate asset which is not beneficially owned by any individual employee and Mr. Healy disclaims any such beneficial ownership.
(7)Represents 1,030,249 shares of our common stock issuable upon conversion of shares of our preferred stock held by Primus Capital Fund IV L.P. (PCF IV) and 42,926 shares of our common stock issuable upon conversion of shares of our preferred stock held by Primus Executive Fund L.P. (PEF). The sole General Partner of both PCF IV and PEF is Primus Venture Partners IV Limited Partnership (PVP LP). Each of PCF IV, PEF, and PVP LP is a Delaware limited partnership. The sole General Partner of PVP LP is Primus Venture Partners IV, Inc. (PVP Inc.), a Delaware corporation. Voting power and investment power over our shares is shared among the five individuals who are the directors of PVP Inc. The five individuals are William C. Mulligan, Loyal W. Wilson, James T. Bartlett, Jonathan E. Dick and Steven Rothman, each of whom disclaims beneficial ownership of all shares held by PCV IV and PEF except to the extent of his pecuniary interest therein.
(8)Represents 1,788,629 shares of our common stock issuable upon conversion of shares of our preferred stock held by William Blair Capital Partners V, L.P. (WBCP Partnership). William Blair Capital Management, LLC (WBCM) is the general partner of WBCP Partnership and, through a six-person board of managers composed of certain of its members, has voting and investment power over the shares held by the WBCP Partnership. Decisions of the board of managers of WBCM are made by a majority vote of its members plus Edgar D. Jannotta, and, as a result, no single member of the board of managers has voting or investment power over the shares. Mr. Newmark is a managing director and Timothy Burke, David G. Chandler, John Ettelson, Mr. Jannotta, Timothy M. Murray, and Thomas C. Theobald are the members of the board of managers of WBCM. No single managing director or member of the board of managers of WBCM has voting or investment power over the shares. Consequently, each managing director and member of the board of directors, including Mr. Newmark, disclaims beneficial ownership of the shares held by the WBCP Partnership except to the extent of his pecuniary interest therein.
(9)Represents shares of our common stock which may be purchased within 60 days from the date hereof pursuant to the exercise of outstanding options as described above, and the following number of shares of our common stock issuable upon conversion of shares of our preferred stock: Mr. Newmark, 1,788,629 shares held by WBCP, for which Mr. Newmark may be deemed to be the beneficial owner but for which Mr. Newmark disclaims beneficial ownership, except to the extent of any individual pecuniary interest therein; Mr. Mulligan, 1,030,249 shares held by PCF IV and 42,926 shares held by PEF, for which Mr. Mulligan may be deemed to be the beneficial owner but for which Mr. Mulligan disclaims beneficial ownership, except to the extent of any individual pecuniary interest therein; Mr. Gellman, 1,296,258 shares held by FdG Capital and 102,342 shares held by FdG Chase, for which Mr. Gellman may be deemed to be the beneficial owner but for which Mr. Gellman disclaims beneficial ownership, except to the extent of any individual pecuniary interest therein; and Mr. Healy, 1,492,063 shares held by Best Buy Co., Inc., for which Mr. Healy may be deemed the beneficial owner but for which Mr. Healy disclaims beneficial ownership.
84
We are authorized by our articles of incorporation to issue an aggregate of 50,000,000 shares of capital stock, of which 40,000,000 are common stock, par value $0.01 per share and 10,000,000 are preferred stock, par value $1.00 per share. A description of the material terms and provisions of our articles of incorporation and bylaws affecting the rights of the common stock is set forth below.
Common Stock
As of June 27, 2005, there were 1,883,969 shares of our common stock outstanding and 90 holders of record of our common stock. All outstanding shares of our common stock are legally issued, fully paid and nonassessable and upon consummation of this offering, all then outstanding shares of our common stock will be legally issued, fully paid and nonassessable. Holders of our common stock are entitled to one vote per share in the election of directors and on all other matters on which shareholders are entitled or permitted to vote. Holders of common stock are not entitled to cumulative voting rights. Therefore, holders of a majority of the shares voting for the election of directors can elect all of our directors. The holders of our common stock are entitled to dividends in amounts and at times as may be declared by our board of directors out of funds legally available, subject to the preferential rights of the holders of any shares of our preferred stock. Upon our liquidation or dissolution, holders of common stock are entitled to share ratably in all net assets available for distribution to shareholders after payment of any liquidation preferences to holders of preferred stock that we may issue in the future. Holders of our common stock have no redemption, conversion or preemptive rights. We have reserved the trading symbol "GGXY" for quoting our common stock on the Nasdaq National Market.
Preferred Stock
As of June 27, 2005, the following shares of preferred stock were outstanding:
- •
- 80,000 shares of our Series A preferred stock held of record by three holders;
- •
- 35,000 shares of our Series B preferred stock held of record by three holders;
- •
- 100,000 shares of our Series C preferred stock held of record by five holders; and
- •
- 94,000 shares of our Series D preferred stock held of record by one holder.
The preferred stock is convertible to common stock at the values, subject to adjustments, as follows:
| Series | Number of Shares | Conversion Price Per Share | Number of Common Shares if Converted | ||||
|---|---|---|---|---|---|---|---|
| A | 80,000 | $ | 4.35 | 1,839,079 | |||
| B | 35,000 | 5.20 | 673,076 | ||||
| C | 100,000 | 5.72 | 1,748,249 | ||||
| D | 94,000 | 6.30 | 1,492,063 | ||||
Regular dividends with respect to each share of preferred stock have been accumulating from (and including) the date on which such share was first issued and these regular dividends have not yet been declared or paid. Upon the closing of this offering, each share of preferred stock will convert into shares of common stock and at such time, the accrued and unpaid dividends will become immediately due and payable. We will pay the accrued and cumulated dividends in cash at closing to the holders using the net proceeds from this offering. See "Use of Proceeds."
85
No shares of our preferred stock will be outstanding immediately following the closing of this offering. Our articles of incorporation will permit us to issue up to 10,000,000 shares of preferred stock without shareholder approval, from time to time, in one or more series and with such designation and preferences for each series as are stated in the resolutions providing for the designation and issue of each such series adopted by our board of directors. Our articles of incorporation authorize our board of directors to determine the voting, dividend, redemption and liquidation preferences and limitations pertaining to such series. The board of directors, without shareholder approval, may issue preferred stock with voting rights and other rights that could adversely affect the voting power of the holders of our common stock and could have certain anti-takeover effects. We have no present plans to issue any shares of preferred stock. The ability of the board of directors to issue preferred stock without shareholder approval could have the effect of delaying, deferring or preventing a change in control of our company or the removal of existing management.
Advance Notice Provision
Our bylaws include, effective upon the closing of this offering, an advance notice procedure for the nomination, other than by or at the direction of the board of directors, of candidates for election as directors to be considered at regular meetings of shareholders. In general, notice of intent to nominate a director or raise matters at such meetings will have to be received by us not less than 90 and not more than 120 days prior to the date corresponding to the prior year's regular meeting, and must contain certain information concerning the person to be nominated or the matters to be brought before the meeting and concerning the shareholder submitting the proposal.
Transfer Agent and Registrar
Wells Fargo Bank N.A. has been appointed as the transfer agent and registrar for our common stock.
Potential Anti-Takeover Effects of Certain Provisions of Minnesota State Law and Our Articles of Incorporation and Bylaws
Minnesota State Law. Certain provisions of Minnesota law described below could have an anti-takeover effect. These provisions are intended to provide management flexibility, to enhance the likelihood of continuity and stability in the composition of our board of directors and in the policies formulated by our board of directors and to discourage an unsolicited takeover if our board of directors determines that such a takeover is not in our best interests or the best interests of our shareholders. However, these provisions could have the effect of discouraging certain attempts to acquire us that could deprive our shareholders of opportunities to sell their shares of our stock at higher values.
Section 302A.671 of the Minnesota Statutes applies, with certain exceptions, to any acquisitions of our stock (from a person other than us, and other than in connection with certain mergers and exchanges to which we are a party) resulting in the beneficial ownership of 20% or more of the voting stock then outstanding. Section 302A.671 requires approval of any such acquisition by a majority vote of our shareholders prior to its consummation. In general, shares acquired in the absence of such approval are denied voting rights and are redeemable by us at their then-fair market value within 30 days after the acquiring person has failed to give a timely information statement to us or the date the shareholders voted not to grant voting rights to the acquiring person's shares.
Section 302A.673 of the Minnesota Statutes generally prohibits any business combination by us, or any of our subsidiaries, with an interested shareholder, which means any shareholder that purchases 10% or more of our voting shares within four years following such interested shareholder's share acquisition date, unless the business combination is approved by a committee of one or more
86
disinterested members of our board of directors before the interested shareholder's share acquisition date.
Articles of Incorporation and Bylaws. Our board of directors has amended our articles of incorporation and bylaws, effective upon the closing of this offering, to include provisions that may have the effect of discouraging, delaying or preventing a change in control or an unsolicited acquisition proposal that a shareholder might consider favorable, including a proposal that might result in the payment of a premium over the market price for the shares held by shareholders. The amendments provide for our board of directors to be divided into three classes of directors serving staggered, three year terms, with one-third of the board of directors being elected each year. Our shareholders approved the amendments to our articles of incorporation at a meeting held on June 15, 2005. The classification of our board will have the effect of requiring at least two regular meetings of shareholders, instead of one, to replace a majority of the members of our board of directors. Our classified board, together with certain other provisions of our articles of incorporation and bylaws authorizing the board of directors to fill vacant directorships, may prevent or delay shareholders from removing incumbent directors and simultaneously gaining control of the board of directors by filling vacancies created by such removal with their own nominees.
Indemnification of Certain Persons
Minnesota law and our bylaws provide that we will, under certain circumstances and subject to certain limitations, indemnify any person made or threatened to be made a party to a proceeding by reason of that person's former or present official capacity with us against judgments, penalties, fines, settlements and reasonable expenses. Any such person is also entitled, subject to certain limitations, to payment or reimbursement of reasonable expenses in advance of the final disposition of the proceeding.
Limitations of Director Liability
Our articles of incorporation limit personal liability for breach of the fiduciary duty of our directors to the fullest extent provided by Minnesota law. Such provisions eliminate the personal liability of directors for damages occasioned by breach of fiduciary duty, except for liability based on the director's duty of loyalty to us or our shareholders, liability for acts or omissions not made in good faith, liability for acts or omissions involving intentional misconduct or knowing violation of law, liability based on payments of improper dividends, liability based on a transaction from which the director derives an improper personal benefit, and liability based on violation of state securities laws. If the Minnesota Business Corporation Act is amended to authorize corporate action further eliminating or limiting the personal liability of directors, then the liability of our directors will be eliminated or limited to the fullest extent permitted by the Minnesota Business Corporation Act, as so amended. Any amendment to or repeal of such provisions will not adversely affect any right or protection of a director for or with respect to any acts or omissions of such director occurring prior to such amendment or repeal.
87
SHARES ELIGIBLE FOR FUTURE SALE
Upon the closing of this offering, based upon the 1,883,969 shares of our common stock outstanding as of June 27, 2005, and the conversion of all outstanding shares of our preferred stock into shares of our common stock, we will have 7,636,436 shares of our common stock outstanding. Of these shares, shares of our common stock sold in this offering will be freely tradable without restriction under the Securities Act of 1933, as amended (Securities Act), except that any shares of our common stock purchased by our affiliates, as that term is defined in Rule 144 under the Securities Act, may generally only be sold in compliance with the limitations of Rule 144 described below.
The remaining shares of our common stock outstanding upon completion of this offering are deemed "restricted shares" under Rule 144 or Rule 701 under the Securities Act. Of these restricted securities, shares will be eligible for sale in the public market on the date of this prospectus and an additional shares of our common stock will be eligible for sale in the public market pursuant to Rule 701 and Rule 144 commencing 90 days from the date of this prospectus. Upon expiration of the lock-up agreements described below, 180 days after the date of this prospectus, an additional shares will be eligible for sale in the public market pursuant to Rule 144 or Rule 701.
Rule 144
In general, under Rule 144 promulgated under the Securities Act, a person (or persons whose shares are required to be aggregated, including our affiliates) who has beneficially owned shares of our common stock for at least one year would be entitled to sell within any three-month period a number of shares that does not exceed the greater of:
- •
- one percent of the number of shares of our common stock then outstanding, which will equal approximately shares immediately after this offering, or
- •
- the average weekly trading volume of our common stock on the Nasdaq National Market during the four calendar weeks preceding the filing of a notice on Form 144 with respect to the sale.
Sales under Rule 144 are generally subject to certain manner of sale provisions and notice requirements, and to the availability of current public information about us.
Rule 144(k)
Under Rule 144(k), a person who is not deemed to have been one of our affiliates at any time during the 90 days preceding a sale and who has beneficially owned the shares proposed to be sold for at least two years, including the holding period of any prior owner other than one of our affiliates, is entitled to sell the shares without complying with the manner of sale, public information, volume limitation or notice provisions of Rule 144. Certain outstanding shares of our common stock will qualify as "144(k)" shares within 180 days of the date of this prospectus.
Rule 701
Rule 701 permits resales of shares in reliance upon Rule 144 but without compliance with some of the restrictions of Rule 144, including the holding period requirement. Most of our employees, officers, directors or consultants who purchased shares under a written compensatory plan or contract may be entitled to rely on the resale provisions of Rule 701, but all holders of "Rule 701" shares are required to wait until 90 days after the date of this prospectus before selling their shares pursuant to the Rule.
88
Stock Incentives. Following this offering, we intend to file with the Securities and Exchange Commission registration statements under the Securities Act covering the shares of common stock reserved for issuance under our stock incentive plans. The registration statements are expected to become effective as soon as practicable after the closing of this offering. Accordingly, shares registered under these registration statements will, subject to Rule 144 volume limitations applicable to affiliates and the lock-up agreements described below, be available for sale in the open market.
Lock-Up Agreements
For a description of the lock-up agreements with the underwriters that restrict sales of shares by us, our directors, officers and holders of shares of our preferred stock, see the information under the heading "Underwriting."
Registration Rights
Messrs. Zanatta and Maanum, the holders of our preferred stock and the holder of our outstanding warrant have certain demand registration and piggyback registration rights.
Pursuant to our registration rights agreement, the holders of our preferred stock have demand registration rights as to 5,752,467 shares of our common stock issued, or issuable upon conversion of the preferred stock. The demand registration rights may be exercised at any time after the expiration of the lock-up period in connection with the initial public offering of our common stock. Each series of preferred stock may demand registration of the shares of common stock issued or issuable upon conversion of that series upon a request by holders of either (a) more than 15% of the then existing shares of our common stock issued, or issuable upon conversion of our preferred stock, or (b) shares of our common stock that would have an estimated aggregate offering price of at least $20 million. The holders may request one registration on Form S-1, and may request a second registration on Form S-1 if not all of the shares requested to be registered are actually registered. There is no limit on the number of demand registrations on Form S-2 or S-3 that such holders may request.
Messrs. Zanatta and Maanum, the holders of our preferred stock and the holder of our outstanding warrant also have certain piggyback registration rights. If we propose to register any securities under the Securities Act for our own account or for the account of our shareholders, holders of piggyback rights may require that we include all of their registrable securities in such registration. In connection with any such offering, the managing underwriter thereof can limit the number of shares held by persons with piggyback registration rights to be included in such registration. The holders of our preferred stock and the holder of our outstanding warrant have agreed to waive their piggyback registration rights with respect to this offering.
We will be responsible for all expenses incurred in connection with the registration rights described above.
89
U.S. FEDERAL TAX CONSEQUENCES FOR NON-U.S. HOLDERS
The following is a discussion of the material U.S. federal income and estate tax consequences of the acquisition, ownership, and disposition of our common stock acquired pursuant to this prospectus by a beneficial owner that, for U.S. federal income tax purposes, is a "non-U.S. holder" as we define that term below. We assume in this discussion that non-U.S. holders will hold our common stock as a capital asset, generally, property held for investment. As used in this discussion, the term "non-U.S. holder" means a beneficial owner of our common stock that is not, for U.S. federal income tax purposes:
- •
- an individual, who is a citizen or resident of the U.S.;
- •
- a corporation, including any entity treated as a corporation for U.S. tax purposes, organized in or under the laws of the United States, any state thereof or the District of Columbia;
- •
- an estate, the income of which is includible in gross income for U.S. tax purposes regardless of its source; or
- •
- a trust, in general, if (1) a U.S. court is able to exercise primary supervision over the administration of the trust and one or more U.S. persons have authority to control all substantial decisions of the trust or (2) the trust was in existence on August 20, 1996, was treated as a U.S. person prior to such date, and validly elected to continue to be so treated.
Subject to certain exceptions, an individual may be treated as resident of the United States in any calendar year for U.S. federal income tax purposes, instead of a nonresident, by, among other ways, being present in the United States on at least 31 days in that calendar year and for an aggregate of at least 183 days during a three year period ending in the current calendar year. For purposes of this calculation, you would count all of the days present in the current year, one-third of the days present in the immediately preceding year and one-sixth of the days present in the second preceding year. Residents are taxed for U.S. federal income tax purposes in the same manner as U.S. citizens.
This discussion does not consider U.S. state or local or non-U.S. tax consequences, and it does not consider all aspects of U.S. federal taxation that may be important to particular non-U.S. holders in light of their individual investment circumstances, such as special tax rules that may apply to a non-U.S. holder that is a dealer in securities or foreign currencies, financial institution, bank, insurance company, tax-exempt organization, former citizen or former long-term resident of the United States, or that holds our common stock as part of a "straddle," "hedge," "conversion transaction," "synthetic security" or other integrated investment. We also do not discuss the U.S. federal tax treatment of beneficial owners that are partnerships or other entities treated as partnerships or flow-through entities for U.S. federal income tax purposes.
If a partnership is a beneficial owner of our common stock, the treatment of a partner in the partnership will generally depend upon the status of the partner and the activities of the partnership. A beneficial owner of our common stock that is a partnership and partners in such a partnership should consult their tax advisors about the U.S. federal income tax consequences of acquiring, owning, and disposing of our common stock.
The following discussion is based on provisions of the Internal Revenue Code, applicable U.S. Treasury regulations and administrative and judicial interpretations, all as in effect and generally available on
90
the date of this prospectus. All of these authorities are subject to change, retroactively or prospectively.Prospective investors are urged to consult their own advisors regarding the U.S. federal, state, local, and non-U.S. income, estate and other tax consequences to them with respect to acquiring, owning, and disposing of our common stock.
Distributions on Common Stock
As described under "Dividend Policy" above, we do not anticipate paying dividends on our common stock in the foreseeable future. However, if we make cash distributions on our common stock, such distributions will constitute dividends for U.S. federal income tax purposes to the extent paid from our current or accumulated earnings and profits, as determined under U.S. federal income tax principles. Distributions in excess of earnings and profits will constitute a return of capital that is applied against and reduces the non-U.S. holder's adjusted tax basis in our common stock. Any remaining excess will be treated as gain realized on the sale or other disposition of the common stock and will be treated as described under "Gain on Sale, Exchange or Disposition of Common Stock" below.
Dividends paid to a non-U.S. holder that are not effectively connected with the non-U.S. holder's conduct of a trade or business in the United States will generally be subject to withholding of U.S. federal income tax at the rate of 30 percent, or if a tax treaty applies, a lower rate specified by the treaty. Non-U.S. holders should consult their tax advisers regarding their entitlement to benefits under a relevant income tax treaty.
Under applicable U.S. Treasury regulations, for purposes of the withholding discussed above and for purposes of determining the applicability of a tax treaty rate:
- •
- a non-U.S. holder who claims the benefit of an applicable income tax treaty rate generally will be required to satisfy certain certification and other requirements;
- •
- in the case of common stock held by a foreign trust, the certification requirement will generally be applied to the trust or the beneficial owners of the trust depending on whether the trust is a "foreign complex trust," "foreign simple trust" or "foreign grantor trust" as defined in the U.S. Treasury regulations; and
- •
- look-through rules will apply for foreign simple trusts and foreign grantor trusts.
Dividends that are effectively connected with a non-U.S. holder's conduct of a trade or business in the United States and, if an income tax treaty applies, attributable to a permanent establishment or fixed base maintained by the non-U.S. holder in the United States, are taxed on a net income basis at the regular graduated U.S. federal income tax rates in much the same manner as if the non-U.S. holder were a resident of the United States. In such cases, we will not have to withhold U.S. federal income tax if the non-U.S. holder complies with applicable certification and disclosure requirements. In addition, a "branch profits tax" may be imposed at a 30 percent rate, or a lower rate under an applicable income tax treaty, on dividends received by a foreign corporation that are effectively connected with the conduct of a trade or business in the United States.
To claim the benefit of a tax treaty or an exemption from withholding because the income is effectively connected with the conduct of a trade or business in the United States, a non-U.S. holder must provide a properly executed Internal Revenue Service, or IRS, Form W-8BEN for treaty benefits or W-8ECI for effectively connected income, before the payment of dividends. These forms must be periodically updated. Non-U.S. holders may obtain a refund of any excess amounts withheld by timely filing an appropriate claim for refund.
91
Gain on Sale, Exchange or Disposition of Common Stock
A non-U.S. holder generally will not be subject to U.S. federal income tax or any withholding thereof with respect to gain realized on a sale, exchange or disposition of our common stock unless one of the following applies:
- •
- the gain is effectively connected with the non-U.S. holder's conduct of a trade or business in the United States and, if an income tax treaty applies, is attributable to a permanent establishment or a fixed base maintained by the non-U.S. holder in the United States; in this case, the non-U.S. holder will generally be taxed on its net gain derived from the disposition at the regular graduated U.S. federal income tax rates and in much the same manner as is applicable to U.S. persons and, if the non-U.S. holder is a foreign corporation, the additional "branch profits tax" described above may also apply;
- •
- the non-U.S. holder is an individual who is present in the United States for 183 days or more in the taxable year of the disposition and meets certain other requirements; in this case, the non-U.S. holder will be subject to a 30% tax on the gain derived from the disposition (which may be offset by U.S. source capital losses of the non-U.S. holder, if any); or
- •
- we are or have been, at any time during the five year period preceding such disposition (or the non-U.S. holder's holding period, if shorter) a "U.S. real property holding corporation" within the meaning of Section 897(c)(2) of the Internal Revenue Code, unless our common stock is regularly traded on an established securities market and the non-U.S. holder holds no more than 5% of our outstanding common stock, directly or indirectly, during the relevant period. If we are determined to be a U.S. real property holding corporation and the foregoing exception does not apply, then a purchaser may withhold 10% of the proceeds payable to a non-U.S. holder from a sale of our common stock and the non-U.S. holder generally will be taxed on its net gain derived from the disposition at the regular graduated U.S. federal income tax rates and in much the same manner as is applicable to U.S. persons and, if the non-U.S. holder is a foreign corporation, the additional "branch profits tax" described above may also apply.
We believe that we have not been and are not currently a U.S. real property holding corporation, and do not expect to become a U.S. real property holding corporation in the future. However, no assurances can be made in this regard. Furthermore, no assurances can be provided that our stock will be considered to be regularly traded on an established securities market for purposes of Section 897 of the Internal Revenue Code.
Information Reporting and Backup Withholding
We must report annually to the IRS and to each non-U.S. holder the amount of dividends paid to that holder and the tax withheld from those dividends. These reporting requirements apply regardless of whether withholding was reduced or eliminated by an applicable tax treaty. Copies of the information returns reporting those dividends and withholding may also be made available to the tax authorities in the country in which the non-U.S. holder is a resident under the provisions of an applicable income tax treaty or agreement.
Under some circumstances, U.S. Treasury regulations require additional information reporting and backup withholding on reportable payments on common stock. The gross amount of dividends paid to a non-U.S. holder that fails to certify its non-U.S. holder status in accordance with applicable U.S. Treasury regulations generally will be reduced by backup withholding at the applicable rate, currently
92
28%. In general, backup withholding will not apply to dividends on our common stock paid by us or our paying agents, in their capacities as such, to a non-U.S. holder if such non-U.S. holder has provided the required certification and neither we nor our paying agent has actual knowledge to the contrary.
The payment of the proceeds of the sale or other disposition of common stock by a non-U.S. holder or through the U.S. office of any broker, U.S. or foreign, generally will be reported to the IRS and reduced by backup withholding, unless the non-U.S. holder either certifies its status as a non-U.S. holder under penalties of perjury or otherwise establishes an exemption and the broker has no actual knowledge to the contrary. The payment of the proceeds of the disposition of common stock by a non-U.S. holder to or through a non-U.S. office of a non-U.S. broker will not be reduced by backup withholding or reported to the IRS, unless the non-U.S. broker has certain enumerated connections with the United States. In general, the payment of proceeds from the disposition of common stock by or through a non-U.S. office of a broker that is a U.S. person or has certain enumerated connections with the United States will be reported to the IRS and may be reduced by backup withholding at the applicable rate, currently 28% unless the broker receives a statement from the non-U.S. holder that certifies its status as a non-U.S. holder under penalties of perjury or the broker has documentary evidence in its files that the holder is a non-U.S. holder and the broker has no actual knowledge to the contrary.
Backup withholding is not an additional tax. Any amounts withheld under the backup withholding rules from a payment to a non-U.S. holder can be refunded or credited against the non-U.S. holder's U.S. federal income tax liability, if any, provided that the required information is furnished to the IRS in a timely manner. These backup withholding and information reporting rules are complex and non-U.S. holders are urged to consult their own advisors regarding the application of these rules to them.
U.S. Federal Estate Tax
Common stock owned or treated as owned by an individual who is not a citizen or resident of the United States, as specifically defined for U.S. federal estate tax purposes, at the time of death, or certain lifetime transfers of an interest in common stock made by such individual will be included in the individual's gross estate for U.S. federal estate tax purposes unless an applicable estate tax or other treaty provides otherwise and, therefore, may be subject to U.S. federal estate tax. Estates of non-resident aliens are generally allowed a statutory credit that has the effect of offsetting the U.S. federal estate tax imposed on the first $60,000 of the taxable estate.
Each prospective non-U.S. holder of our common stock should consult its own tax adviser with respect to the federal, state, local and non-U.S. tax consequences to them of the acquisition, ownership and disposition of our common stock.
93
The underwriters named below have agreed to buy, subject to the terms of the purchase agreement, the number of shares listed opposite their names below. The underwriters are committed to purchase and pay for all of the shares if any are purchased.
| Underwriters | Number of Shares | ||
|---|---|---|---|
| Piper Jaffray & Co. | |||
| William Blair & Company, L.L.C. | |||
| A.G. Edwards & Sons, Inc. | |||
| Wedbush Morgan Securities Inc. | |||
| Total | |||
The underwriters have advised us that they propose to offer the shares of our common stock to the public at $ per share. The underwriters propose to offer the shares to certain dealers at the same price less a concession of not more than $ per share. The underwriters may allow and the dealers may reallow a concession of not more than $ per share on sales to certain other brokers and dealers. After the offering, these figures may be changed by the underwriters.
The selling shareholders have also granted to the underwriters an option to purchase up to an additional shares of our common stock from them on a pro rata basis, at the same price to the public, and with the same underwriting discount, as set forth on the cover hereof. The underwriters may exercise this option any time during the 30-day period after the date of this prospectus, but only to cover over-allotments, if any. To the extent the underwriters exercise the option, each underwriter will become obligated, subject to the terms of the purchase agreement, to purchase approximately the same percentage of additional shares as it was obligated to purchase under the purchase agreement.
The following table shows the underwriting fees to be paid to the underwriters in connection with this offering. These amounts are shown assuming both no exercise and full exercise of the over-allotment option.
| | No Exercise | Full Exercise | ||||
|---|---|---|---|---|---|---|
| Per share | $ | $ | ||||
| Total | $ | $ | ||||
We and the selling shareholders have agreed to indemnify the underwriters against certain liabilities, including civil liabilities under the Securities Act, or to contribute to payments that the underwriters may be required to make in respect of those liabilities.
We, our directors, our officers and the holders of shares of our preferred stock, have agreed that we will not offer, sell, contract to sell, pledge or otherwise dispose of, directly or indirectly, or, in the case of the company, file with the SEC a registration statement under the Securities Act relating to, any shares of our common stock or securities convertible into or exchangeable or exercisable for any shares of our common stock, enter into a transaction that would have the same effect, or enter into any swap, hedge or other arrangement that transfers, in whole or in part, any of the economic consequences of ownership of our common stock, whether any of these transactions is to be settled by delivery of our common stock or other securities, in cash or otherwise, or publicly disclose the intention to make any offer, sale, pledge or disposition, or to enter into any transaction, swap, hedge or other arrangement, without, in each case, the prior written consent of Piper Jaffray, for a period of 180 days after the date of this prospectus. However, in the event that either (1) during the last 17 days
94
of the "lock-up" period, we release earnings results or material news or a material event relating to us occurs or (2) prior to the expiration of the "lock-up" period, we announce that we will release earnings results during the 16-day period beginning on the last day of the "lock-up" period, then in either case the expiration of the "lock-up" will be extended until the expiration of the 18-day period beginning on the date of the release of the earnings results or the occurrence of the material news or event, as applicable.
The restrictions described in the immediately preceding paragraph do not apply to (i) the sale of shares to the underwriters; (ii) the conversion of any shares of our preferred stock into shares of our common stock; (iii) sales by us in connection with the exercise of options granted and authorized to be granted under our stock incentive plans; (iv) the grant of options or stock awards to purchase up to an additional shares under our stock incentive plans; (v) any securities acquired in the open market; (vi) the transfer of securities by means of a bona fide gift; (vii) the transfer of securities on death by will or intestacy; (viii) the transfer of securities to certain affiliates of our directors, officers and the holders of shares of our preferred stock; and (ix) the transfer of securities to a family member or trust. In the case of any transfer described in clauses (vi), (vii), (viii) or (ix), however, the transferee must agree to be bound in writing by the terms of the lock-up agreement prior to the transfer.
Prior to the offering, there has been no established trading market for our common stock. The initial public offering price for the shares of common stock offered by this prospectus was negotiated by us and the underwriters. The factors considered in determining the initial public offering price include the history of and the prospects for the industry in which we compete, our past and present operations, our historical results of operations, our prospects for future earnings, the recent market prices of securities of generally comparable companies and the general condition of the securities markets at the time of the offering and other relevant factors. There can be no assurance that the initial public offering price of the common stock will correspond to the price at which the common stock will trade in the public market subsequent to this offering or that an active public market for the common stock will develop and continue after this offering.
To facilitate the offering, the underwriters may engage in transactions that stabilize, maintain or otherwise affect the price of the common stock during and after the offering. Specifically, the underwriters may over-allot or otherwise create a short position in the common stock for their own account by selling more shares of common stock than have been sold to them by us. The underwriters may elect to cover any such short position by purchasing shares of common stock in the open market or by exercising the over-allotment option granted to the underwriters. In addition, the underwriters may stabilize or maintain the price of the common stock by bidding for or purchasing shares of common stock in the open market and may impose penalty bids. If penalty bids are imposed, selling concessions allowed to syndicate members or other broker-dealers participating in the offering are reclaimed if shares of common stock previously distributed in the offering are repurchased, whether in connection with stabilization transactions or otherwise. The effect of these transactions may be to stabilize or maintain the market price of the common stock at a level above that which might otherwise prevail in the open market. The imposition of a penalty bid may also affect the price of the common stock to the extent that it discourages resales of the common stock. The magnitude or effect of any stabilization or other transaction is uncertain. These transactions may be effected on the Nasdaq National Market or otherwise and, if commenced, may be discontinued at any time.
In connection with this offering, some underwriters and selling shareholders may also engage in passive market making transactions in the common stock on the Nasdaq National Market. Passive market making consists of displaying bids on the Nasdaq National Market limited by the prices of independent market makers and effecting purchases limited by those prices in response to order flow. Rule 103 of Regulation M promulgated by the SEC limits the amount of net purchases that each passive market maker may make and the displayed size of each bid. Passive market making may
95
stabilize the market price of the common stock at a level above that which might otherwise prevail in the open market and, if commenced, may be discontinued at any time.
Some of the underwriters or their affiliates have engaged in, and may in the future engage in, investment banking and other commercial dealings in the ordinary course of business with us. They have received customary fees and commissions for these transactions.
Through various private placements from 1998 through 1999, William Blair & Company beneficially owns, through its affiliate, WBCP Partnership, 50,000 shares of our Series A redeemable convertible preferred stock, 21,875 shares of our Series B redeemable convertible preferred stock and 12,500 shares of our Series C redeemable convertible preferred stock. Upon the conversion of all of our outstanding preferred stock in connection with this offering, WBCP Partnership will beneficially own 1,788,629 shares of our common stock. We intend to use $ million of the net proceeds from the offering to pay the holders of our preferred stock the accrued and unpaid dividends due upon conversion of their shares of preferred stock into shares of our common stock, including $ million to be paid to WBCP Partnership.
In addition, WBCP Partnership is a party to a shareholders' agreement with us, the holders of our preferred stock and Messrs. Zanatta and Maanum. That agreement gives WBCP Partnership a right to designate a member of our board of directors and further obligates the parties to that agreement to vote the shares of our capital stock held by them, or over which they have voting control, in favor of the election of the person designated by WBCP Partnership to our board of directors. Three of our other holders of preferred stock have similar rights under the shareholders' agreement to each designate a member of our board of directors. The number of shares of our capital stock which are subject to that agreement represent a sufficient number of shares to effect the election of the person designated by WBCP Partnership and the three other people designated by the other holders of preferred stock to our board of directors. Gregg S. Newmark, a managing director of WBCP Partnership, serves on our board of directors and was designated by WBCP Partnership to serve on our board of directors. Pursuant to the Conversion Agreement, the rights of our preferred holders, including WBCP Partnership, to designate members of our board of directors and the corresponding shareholders' agreement will terminate upon the closing of this offering.
Since William Blair beneficially owns through its affiliate, WBCP Partnership, approximately 31% of our outstanding preferred stock as of June 27, 2005, William Blair will be presumed to be our affiliate under Rule 2720 of the Conduct Rules of the National Association of Securities Dealers, Inc. (NASD). In addition, WBCP Partnership is a selling shareholder and will receive more than 10% of the net proceeds from the sale of common stock in this offering from its receipt of cash dividends on the preferred stock and its sale of common stock. Due to the foregoing, this offering will be made in compliance with the applicable provisions of Rule 2720 of the NASD Conduct Rules.
In accordance with rule 2720(c)(3) of the NASD Conduct Rules, the initial public offering price can be no higher than that recommended by a "qualified independent underwriter" meeting certain standards. Piper Jaffray has assumed the responsibilities of acting as a qualified independent underwriter and has recommended a public offering price for our common stock in compliance with the requirements of the NASD Conduct Rules. Piper Jaffray, in its role as qualified independent underwriter, has performed due diligence investigations and reviewed and participated in the preparation of this prospectus and the registration statement of which this prospectus is a part. Piper Jaffray will receive no compensation for acting in this capacity; however, we have agreed to indemnify Piper Jaffray for acting as a qualified independent underwriter against specified liabilities under the Securities Act.
At our request, the underwriters have reserved for sale to our officers, employees, friends, business associates and other related persons at the initial public offering price up to 5% of the shares being
96
offered by this prospectus. The sale of the reserved shares to these purchasers will be made by Piper Jaffray through a directed share program. The purchasers of these shares will not be subject to a lock-up except to the extent they are subject to a lock-up agreement with the underwriters as described above. We do not know if our officers, employees, friends, business associates and other related persons will choose to purchase all or any portion of the reserved shares, but any purchases they do make will reduce the number of shares available to the general public. If all of these reserved shares are not purchased, the underwriters will offer the remainder to the general public on the same terms as the other shares offered by this prospectus.
Robins, Kaplan, Miller & Ciresi L.L.P., Minneapolis, Minnesota, will pass upon the validity of the shares of common stock offered by this prospectus and other legal matters for us. The validity of the shares of common stock offered by this prospectus will be passed upon for the underwriters by Faegre & Benson LLP.
Ernst & Young LLP, independent registered public accounting firm, has audited our financial statements and schedule as of February 28, 2004 and February 26, 2005 and for each of the three years in the period ended February 26, 2005, as set forth in their reports. We have included our financial statements and schedule in the prospectus and elsewhere in the registration statement in reliance on Ernst & Young LLP's reports, given on their authority as experts in accounting and auditing.
WHERE YOU CAN FIND MORE INFORMATION
We have filed a registration statement on Form S-1 with the SEC for the stock we are offering by this prospectus. This prospectus does not include all of the information contained in the registration statement. You should refer to the registration statement and its exhibits for additional information. Whenever we make reference in this prospectus to any of our contracts, agreements or other documents, the references are not necessarily complete and you should refer to the exhibits attached to the registration statement for copies of the actual contract, agreement or other document. When we complete this offering, we will also be required to file annual, quarterly and special reports, proxy statements and other information with the SEC.
You can read our SEC filings, including the registration statement, over the Internet at the SEC's web site atwww.sec.gov. You may also read and copy any document we file with the SEC at its public reference facilities at 450 Fifth Street, NW, Washington, DC 20549. You may also obtain copies of the documents at prescribed rates by writing to the Public Reference Section of the SEC at 450 Fifth Street, NW, Washington, DC 20549. Please call the SEC at 1-800-SEC-0330 for further information on the operation of the public reference facilities.
97
GOLF GALAXY, INC.
INDEX TO FINANCIAL STATEMENTS
| Report of Independent Registered Public Accounting Firm | F-2 | |
Financial Statements | ||
Balance Sheets | F-3 | |
| Statements of Operations | F-4 | |
| Statements of Shareholders' Equity (Deficit) | F-5 | |
| Statements of Cash Flows | F-6 | |
| Notes to Financial Statements | F-7 |
F-1
REPORT OF INDEPENDENT REGISTERED PUBLIC ACCOUNTING FIRM
The Board of Directors and Shareholders
Golf Galaxy, Inc.
We have audited the accompanying balance sheets of Golf Galaxy, Inc. (the Company) as of February 26, 2005, and February 28, 2004, and the related statements of operations, shareholders' equity (deficit), and cash flows for each of three years in the period ended February 26, 2005. These financial statements are the responsibility of the Company's management. Our responsibility is to express an opinion on these financial statements based on our audits.
We conducted our audits in accordance with the standards of the Public Company Accounting Oversight Board (United States). Those standards require that we plan and perform the audit to obtain reasonable assurance about whether the financial statements are free of material misstatement. We were not engaged to perform an audit of the Company's internal control over financial reporting. Our audits included consideration of internal control over financial reporting as a basis for designing audit procedures that are appropriate in the circumstances, but not for the purpose of expressing an opinion on the effectiveness of the Company's internal control over financial reporting. Accordingly, we express no such opinion. An audit also includes examining, on a test basis, evidence supporting the amounts and disclosures in the financial statements, assessing the accounting principles used and significant estimates made by management, and evaluating the overall financial statement presentation. We believe that our audits provide a reasonable basis for our opinion.
In our opinion, the financial statements referred to above present fairly, in all material respects, the financial position of Golf Galaxy, Inc. at February 26, 2005, and February 28, 2004, and the results of its operations and its cash flows for each of the three years in the period ended February 26, 2005, in conformity with U.S. generally accepted accounting principles.
/s/ERNST & YOUNG LLP
Minneapolis, Minnesota
April 22, 2005
F-2
GOLF GALAXY, INC.
BALANCE SHEETS
(In Thousands, Except Share and Per Share Amounts)
| | February 28, 2004 | February 26, 2005 | May 28, 2005 (Unaudited) | |||||||||
|---|---|---|---|---|---|---|---|---|---|---|---|---|
| Assets | ||||||||||||
| Current assets: | ||||||||||||
| Cash and cash equivalents | $ | 4,943 | $ | 3,245 | $ | 9,159 | ||||||
| Accounts receivable, net of allowances of $50, $50 and $50, respectively | 1,705 | 3,455 | 9,523 | |||||||||
| Inventories, net | 25,564 | 30,415 | 44,492 | |||||||||
| Deferred tax assets(Note 8) | 3,574 | 2,219 | 2,219 | |||||||||
| Prepaid expenses and other | 772 | 1,291 | 1,510 | |||||||||
| Total current assets | 36,558 | 40,625 | 66,903 | |||||||||
| Property and equipment, net | 12,788 | 21,832 | 23,856 | |||||||||
| Deferred tax assets(Note 8) | 1,766 | 2,272 | 2,272 | |||||||||
| Other assets | 415 | 408 | 447 | |||||||||
| Total assets | $ | 51,527 | $ | 65,137 | $ | 93,478 | ||||||
Liabilities and shareholders' equity (deficit) | ||||||||||||
| Current liabilities: | ||||||||||||
| Accounts payable | $ | 16,568 | $ | 15,826 | $ | 39,399 | ||||||
| Accrued liabilities | 8,115 | 11,675 | 10,880 | |||||||||
| Total current liabilities | 24,683 | 27,501 | 50,279 | |||||||||
Deferred rent credits and other | 3,716 | 6,831 | 10,701 | |||||||||
Commitments and contingencies(Note 11) | ||||||||||||
Redeemable convertible preferred stock, including accumulated undeclared preferred stock dividends(Note 9): | ||||||||||||
| Preferred Series A, par value $1.00, 80,000 shares authorized, issued and outstanding | 12,986 | 14,054 | 14,338 | |||||||||
| Preferred Series B, par value $1.00, 35,000 shares authorized, issued and outstanding | 5,313 | 5,746 | 5,863 | |||||||||
| Preferred Series C, par value $1.00, 100,000 shares authorized, issued and outstanding | 14,436 | 15,623 | 15,945 | |||||||||
| Preferred Series D, par value $1.00, 150,000 shares authorized, 94,000 issued and outstanding | 12,310 | 13,318 | 13,593 | |||||||||
| 45,045 | 48,741 | 49,739 | ||||||||||
Shareholders' equity (deficit)(Notes 9 and 10): | ||||||||||||
| Common stock, par value $0.01 per share: | ||||||||||||
| Authorized shares—11,000,000, 40,000,000 and 40,000,000, respectively | ||||||||||||
| Issued and outstanding shares—1,861,945, 1,883,969 and 1,883,969, respectively | 19 | 19 | 19 | |||||||||
| Additional paid-in capital | — | — | — | |||||||||
| Accumulated deficit | (21,936 | ) | (17,955 | ) | (17,260 | ) | ||||||
| Total shareholders' equity (deficit) | (21,917 | ) | (17,936 | ) | (17,241 | ) | ||||||
| Total liabilities and shareholders' equity (deficit) | $ | 51,527 | $ | 65,137 | $ | 93,478 | ||||||
See accompanying notes.
F-3
GOLF GALAXY, INC.
STATEMENTS OF OPERATIONS
(In Thousands, Except Share and Per Share Amounts)
| | Year Ended | Three Months Ended (Unaudited) | |||||||||||||||
|---|---|---|---|---|---|---|---|---|---|---|---|---|---|---|---|---|---|
| | March 1, 2003 | February 28, 2004 | February 26, 2005 | May 29, 2004 | May 28, 2005 | ||||||||||||
| Net sales | $ | 85,213 | $ | 99,630 | $ | 133,080 | $ | 38,419 | $ | 58,570 | |||||||
| Cost of sales | 63,745 | 72,403 | 93,964 | 26,856 | 40,342 | ||||||||||||
| Gross profit | 21,468 | 27,227 | 39,116 | 11,563 | 18,228 | ||||||||||||
Operating expenses: | |||||||||||||||||
| Store operating | 15,223 | 16,677 | 24,382 | 6,972 | 10,932 | ||||||||||||
| General and administrative | 4,709 | 6,876 | 8,372 | 2,147 | 3,102 | ||||||||||||
| Preopening | 113 | 1,065 | 2,095 | 518 | 1,310 | ||||||||||||
| Total operating expenses | 20,045 | 24,618 | 34,849 | 9,637 | 15,344 | ||||||||||||
| Income from operations | 1,423 | 2,609 | 4,267 | 1,926 | 2,884 | ||||||||||||
Other income(Note 3) | — | — | 8,410 | — | — | ||||||||||||
| Interest (expense) income, net | (109 | ) | (177 | ) | (4 | ) | (36 | ) | 15 | ||||||||
| Income before income taxes | 1,314 | 2,432 | 12,673 | 1,890 | 2,899 | ||||||||||||
Income tax benefit (expense) | — | 5,145 | (5,135 | ) | (765 | ) | (1,206 | ) | |||||||||
| Net income | 1,314 | 7,577 | 7,538 | 1,125 | 1,693 | ||||||||||||
Less preferred stock dividends | (3,169 | ) | (3,430 | ) | (3,696 | ) | (901 | ) | (998 | ) | |||||||
| Net (loss) income applicable to common shareholders | $ | (1,855 | ) | $ | 4,147 | $ | 3,842 | $ | 224 | $ | 695 | ||||||
Net (loss) income per share: | |||||||||||||||||
| Basic | $ | (1.03 | ) | $ | 2.29 | $ | 2.06 | $ | 0.12 | $ | 0.37 | ||||||
| Diluted | $ | (1.03 | ) | $ | 0.99 | $ | 0.98 | $ | 0.11 | $ | 0.21 | ||||||
Weighted average number of shares outstanding: | |||||||||||||||||
| Basic | 1,799,787 | 1,814,046 | 1,865,928 | 1,861,945 | 1,883,969 | ||||||||||||
| Diluted | 1,799,787 | 7,691,169 | 7,721,333 | 1,951,045 | 8,042,819 | ||||||||||||
See accompanying notes.
F-4
GOLF GALAXY, INC.
STATEMENTS OF SHAREHOLDERS' EQUITY (DEFICIT)
(In Thousands, Except Share Amounts)
| | Common Stock | | | | |||||||||||
|---|---|---|---|---|---|---|---|---|---|---|---|---|---|---|---|
| | Shares Outstanding | Par Value | Additional Paid-In Capital | Accumulated Deficit | Total | ||||||||||
| Balance at March 2, 2002 | 1,773,148 | $ | 18 | $ | — | $ | (24,004 | ) | $ | (23,986 | ) | ||||
| Issuance of common stock | 31,118 | — | 69 | — | 69 | ||||||||||
| Accretion of redeemable preferred stock | — | — | (69 | ) | (537 | ) | (606 | ) | |||||||
| Accrual of preferred stock dividends | — | — | — | (3,169 | ) | (3,169 | ) | ||||||||
| Net income | — | — | — | 1,314 | 1,314 | ||||||||||
| Balance at March 1, 2003 | 1,804,266 | 18 | — | (26,396 | ) | (26,378 | ) | ||||||||
| Issuance of common stock | 57,679 | 1 | 313 | — | 314 | ||||||||||
| Accrual of preferred stock dividends | — | — | (313 | ) | (3,117 | ) | (3,430 | ) | |||||||
| Net income | — | — | — | 7,577 | 7,577 | ||||||||||
| Balance at February 28, 2004 | 1,861,945 | 19 | — | (21,936 | ) | (21,917 | ) | ||||||||
| Issuance of common stock | 22,024 | — | 139 | — | 139 | ||||||||||
| Accrual of preferred stock dividends | — | — | (139 | ) | (3,557 | ) | (3,696 | ) | |||||||
| Net income | — | — | — | 7,538 | 7,538 | ||||||||||
| Balance at February 26, 2005 | 1,883,969 | 19 | — | (17,955 | ) | (17,936 | ) | ||||||||
| Issuance of common stock | — | — | — | — | — | ||||||||||
| Accrual of preferred stock dividends | — | — | — | (998 | ) | (998 | ) | ||||||||
| Net income | — | — | — | 1,693 | 1,693 | ||||||||||
| Balance at May 28, 2005 (unaudited) | 1,883,969 | $ | 19 | $ | — | $ | (17,260 | ) | $ | (17,241 | ) | ||||
See accompanying notes.
F-5
GOLF GALAXY, INC.
STATEMENTS OF CASH FLOWS
(In Thousands)
| | Year Ended | Three Months Ended (Unaudited) | ||||||||||||||||
|---|---|---|---|---|---|---|---|---|---|---|---|---|---|---|---|---|---|---|
| | March 1, 2003 | February 28, 2004 | February 26, 2005 | May 29, 2004 | May 28, 2005 | |||||||||||||
| Operating activities | ||||||||||||||||||
| Net income | $ | 1,314 | $ | 7,577 | $ | 7,538 | $ | 1,125 | $ | 1,693 | ||||||||
| Adjustments to reconcile net income to net cash provided by operating activities: | ||||||||||||||||||
| Realized gain on Golf Town Canada Inc. stock | — | — | (8,410 | ) | — | — | ||||||||||||
| Depreciation and amortization | 2,398 | 2,401 | 3,229 | 707 | 1,142 | |||||||||||||
| Disposal of property and equipment | 36 | 21 | 179 | 1 | 4 | |||||||||||||
| Amortization of debt issuance costs | 29 | 29 | 20 | 7 | 3 | |||||||||||||
| Deferred income taxes | — | (5,340 | ) | 849 | — | — | ||||||||||||
| Noncash compensation | — | 198 | 1 | — | — | |||||||||||||
| Change in operating assets and liabilities: | ||||||||||||||||||
| Accounts receivable | 873 | (374 | ) | (1,750 | ) | (2,408 | ) | (6,068 | ) | |||||||||
| Inventories | 4,018 | (10,290 | ) | (4,851 | ) | (3,001 | ) | (14,077 | ) | |||||||||
| Prepaid expenses and other | 53 | (132 | ) | (519 | ) | (184 | ) | (219 | ) | |||||||||
| Accounts payable | (2,315 | ) | 8,367 | (742 | ) | 6,634 | 23,573 | |||||||||||
| Accrued liabilities and other | (1,464 | ) | 3,338 | 6,711 | 1,188 | 3,033 | ||||||||||||
| Net cash provided by operating activities | 4,942 | 5,795 | 2,255 | 4,069 | 9,084 | |||||||||||||
Investing activities | ||||||||||||||||||
| Purchases of property and equipment | (915 | ) | (5,140 | ) | (12,452 | ) | (1,405 | ) | (3,170 | ) | ||||||||
| Proceeds from sale of Golf Town Canada Inc. stock | — | — | 8,416 | — | — | |||||||||||||
| Net cash used in investing activities | (915 | ) | (5,140 | ) | (4,036 | ) | (1,405 | ) | (3,170 | ) | ||||||||
Financing activities | ||||||||||||||||||
| Short-term repayments under the credit agreement, net | (267 | ) | — | — | — | — | ||||||||||||
| Credit facility issuance costs | — | — | (55 | ) | — | — | ||||||||||||
| Proceeds from sale of common stock | 69 | 115 | 138 | — | — | |||||||||||||
| Net cash (used in) provided by financing activities | (198 | ) | 115 | 83 | — | — | ||||||||||||
| Net increase (decrease) in cash and cash equivalents | 3,829 | 770 | (1,698 | ) | 2,664 | 5,914 | ||||||||||||
| Cash and cash equivalents, beginning of year | 344 | 4,173 | 4,943 | 4,943 | 3,245 | |||||||||||||
| Cash and cash equivalents, end of year | $ | 4,173 | $ | 4,943 | $ | 3,245 | $ | 7,607 | $ | 9,159 | ||||||||
Supplemental disclosure of cash flow information | ||||||||||||||||||
| Cash paid during the year for: | ||||||||||||||||||
| Interest | $ | 77 | $ | 127 | $ | 2 | $ | 2 | $ | 2 | ||||||||
| Taxes | $ | — | $ | 131 | $ | 4,268 | $ | 170 | $ | 1,319 | ||||||||
See accompanying notes.
F-6
GOLF GALAXY, INC.
NOTES TO FINANCIAL STATEMENTS
Information as of May 28, 2005 and for the
three months ended May 29, 2004 and May 28, 2005 is unaudited.
1. Nature of Business and Background
Golf Galaxy, Inc. (the Company), a Minnesota corporation, is a retailer of golf equipment, accessories, apparel and services in a superstore format. The first Golf Galaxy store opened in April 1997 and, as of February 26, 2005, the Company owned and operated 34 stores in 16 states and an eCommerce website. The Company's initial growth was funded substantially through institutional preferred equity financing (see Note 9). The Company plans additional growth in the future, which is expected to be funded substantially through cash provided by operations, funds available under the credit facility and, if initiated, net proceeds from an equity financing.
2. Summary of Significant Accounting Policies
Fiscal Year
The Company's fiscal year ends on the Saturday closest to the end of February, resulting in fiscal years of 52 or 53 weeks in length. Fiscal 2003, 2004 and 2005 present the results of operations for the 52-week periods ended March 1, 2003, February 28, 2004, and February 26, 2005, respectively.
Cash and Cash Equivalents
Cash and cash equivalents consist primarily of balances in bank operating accounts and a highly liquid money market account.
Accounts Receivable
Accounts receivable consist primarily of vendor and credit card receivables, net of allowances for doubtful accounts. The allowance is based on historical experience and general economic and industry conditions.
Inventories
Inventories are stated at the lower of cost or estimated market value. Cost is determined by the weighted average cost method. Inventories consist of the direct cost of merchandise including freight, net of reserves for estimated shrinkage and valuation adjustments, and certain vendor allowances.
Property and Equipment
Property and equipment are recorded at cost. Depreciation is computed on a straight-line basis over the estimated useful lives. Depreciable lives range from three to ten years for fixtures and equipment and the lesser of ten years or the minimum lease term for leasehold improvements. Assets held under capital leases are included in property and equipment at the present value of the future minimum lease payments and are depreciated over the terms of the related leases. Construction in process consists of leaseholds, fixtures and equipment to be placed in service as new stores open.
The Company evaluates its long-lived assets in accordance with Statement of Financial Accounting Standards (SFAS) No. 144,Accounting for the Impairment or Disposal of Long-Lived Assets. The carrying value of long-lived assets is reviewed periodically for impairment and recoverability, including the consideration of any changes in circumstances related to the assets. The carrying value of
F-7
long-lived assets is compared to the estimated future undiscounted cash flows associated with those assets. Based on the Company's evaluation, no write-down of the carrying value of its long-lived assets was necessary as of February 26, 2005 and May 28, 2005.
Other Assets
Other assets include debt issuance costs, which are amortized over the term of the debt agreement, and deposits on leased properties. As of February 28, 2004, February 26, 2005 and May 28, 2005, other assets are presented net of accumulated amortization of $71,000, $5,000 and $8,000, respectively. In fiscal 2005, certain debt issuance costs were removed when they became fully amortized.
Financial Instruments
The carrying amounts for all financial instruments approximate fair value due to the short-term nature of these instruments.
Stock-Based Compensation
The Company has stock-based employee compensation plans, which are described more fully in Note 10. The Company has elected to apply the disclosure-only provisions of SFAS No. 123,Accounting for Stock-Based Compensation, as amended by SFAS No. 148. Accordingly, the Company accounts for stock-based compensation using the intrinsic value method prescribed in Accounting Principles Board Opinion No. 25,Accounting for Stock Issued to Employees, and related interpretations. Compensation cost for stock options is measured as the excess, if any, of the fair value of the Company's common stock at the date of grant over the stock option exercise price.
Other than the stock options granted in May 2005, all stock options granted under the plan had an exercise price equal to the estimated fair value of the common stock at the time of grant, resulting in no compensation expense recorded for the issuance of stock options.
In May 2005, the Board of Directors granted incentive stock options to purchase 138,000 shares of common stock at an exercise price of $8.00 per share based on an independently appraised value as of the most recent fiscal year-end. In addition to the Company's financial results and growth prospects, the appraisal considered other factors, including the Company's capital structure as a private company and the relative subordination of the common stock in relation to the preferred stock at the date of the appraisal.
Because the May 2005 stock options were significantly below the anticipated price range of the Company's proposed initial public stock offering (IPO), the Company will recognize compensation expense based on the difference between the mid-point of the anticipated IPO price range and the exercise price of the options, recorded ratably over the four year vesting period of the options. Such amount for the fiscal quarter ended May 28, 2005 was immaterial.
The Company recorded pretax compensation expense of $198,000 and $1,000 in connection with the disposition of certain shares related to the exercise of certain stock options in fiscal 2004 and fiscal 2005, respectively.
F-8
If the Company had elected to record compensation costs for the issuance of stock options under SFAS No. 123, the Company's net (loss) income would have been adjusted to the following pro forma amounts (in thousands, except per share amounts):
| | Year Ended | Three Months Ended (Unaudited) | |||||||||||||||
|---|---|---|---|---|---|---|---|---|---|---|---|---|---|---|---|---|---|
| | March 1, 2003 | February 28, 2004 | February 26, 2005 | May 29, 2004 | May 28, 2005 | ||||||||||||
| Net (loss) income applicable to common shareholders | $ | (1,855 | ) | $ | 4,147 | $ | 3,842 | $ | 224 | $ | 695 | ||||||
| Add stock-based compensation expense, net of tax | — | 104 | 1 | — | — | ||||||||||||
| Deduct total stock-based compensation determined under fair-value-based method for all awards | (90 | ) | (110 | ) | (140 | ) | (36 | ) | (34 | ) | |||||||
| Pro forma net (loss) income | $ | (1,945 | ) | $ | 4,141 | $ | 3,703 | $ | 188 | $ | 661 | ||||||
| Net (loss) income per share: | |||||||||||||||||
| Basic—as reported | $ | (1.03 | ) | $ | 2.29 | $ | 2.06 | $ | 0.12 | $ | 0.37 | ||||||
| Basic—pro forma | $ | (1.08 | ) | $ | 2.28 | $ | 1.98 | $ | 0.10 | $ | 0.35 | ||||||
| Diluted—as reported | $ | (1.03 | ) | $ | 0.99 | $ | 0.98 | $ | 0.11 | $ | 0.21 | ||||||
| Diluted—pro forma | $ | (1.08 | ) | $ | 0.98 | $ | 0.96 | $ | 0.10 | $ | 0.21 | ||||||
| Weighted Average Assumptions: | |||||||||||||||||
| Risk-free interest rate | 3.2 | % | 3.0 | % | 3.4 | % | 3.3 | % | 4.0 | % | |||||||
| Expected dividends | — | — | — | — | — | ||||||||||||
| Estimated average life | 6 years | 6 years | 6 years | 6 years | 5 years | ||||||||||||
| Volatility | — | — | — | — | — | ||||||||||||
The fair value of each option grant is estimated on the date of grant using the minimum value method with the weighted average assumptions provided above. Based on these assumptions, the estimated weighted average fair value of the options granted in fiscal 2003, 2004 and 2005 and the first quarters of fiscal 2005 and fiscal 2006 was $1.08, $1.02, $1.14, $1.11 and $1.43, respectively.
Revenue Recognition
The Company recognizes sales revenue at the time goods are delivered or services are provided to a customer, net of customer returns. Revenue from services comprised less than 4% of total sales for each year presented. Receipts from the sales of gift cards are deferred and recognized as revenue when redeemed by the customer. The Company's gift cards do not expire; any gift card presented in-store or on the Company's eCommerce website is honored for its full remaining value. Periodically, the Company reviews its reserve for gift card obligations considering the age, amount and activity on the outstanding cards, as well as overall redemption trends. Adjustments to the reserve are included in store operating expenses and have not been material.
F-9
Customer Incentives
The Company offers certain incentives to its customers to promote additional sales. Incentives include discounts, coupons and other offers that permit a customer to receive a reduction in the price of a product or service. The incentives are not earned by the customer on the basis of previous purchases and the reduction in revenue is recognized at the time the product or service is sold.
Cost of Sales
Cost of sales includes the cost of merchandise sold net of certain vendor allowances related to advertising, freight, inventory shrinkage, store occupancy costs, customer shipping and handling charges and the direct costs related to generating service revenues including depreciation of service equipment. Store occupancy costs include rent, real estate taxes and common area maintenance charges, and exclude store depreciation and other facility costs which are considered to be part of store operating expenses.
Vendor Allowances
The Company receives allowances from certain vendors in various forms including promotional support, rebates and volume discounts. In 2002, the Emerging Issues Task Force (EITF) reached a consensus on Issue No. 02-16,Accounting by a Customer (Including a Reseller) for Certain Consideration Received From a Vendor. Effective for agreements entered into after December 31, 2002, EITF Issue No. 02-16 directs that consideration received from a vendor is presumed to be a reduction in the cost of inventory purchased and is recognized as a reduction of cost of sales when the related inventory is sold. Vendor allowances received as a reimbursement for specific, incremental and identifiable costs incurred to promote a vendor's products are recorded as a reduction in advertising expense.
Operating Leases
The Company recognizes rent expense for its store leases on a straight-line basis over the initial lease term, excluding any lease renewal option periods. Rent expense begins on the earlier of the commencement date of the lease or the date when the Company takes possession of the property. Allowances and incentives received from the landlord, including noncash straight-line expense for free rent periods, are classified as deferred rent credits and are recorded as a reduction to rent expense over the same term as the base rent expense.
Advertising Costs
Advertising media costs are expensed as incurred. Certain third-party preparation costs related to producing the Company's direct mail pieces and television advertising are deferred and are fully expensed when the mail pieces are distributed or when the television spots are first aired. Advertising expenses were $3,698,000, $4,451,000 and $6,628,000 in fiscal 2003, 2004 and 2005, respectively. Advertising production costs of $11,000, $304,000 and $76,000 were included in prepaid expenses at February 28, 2004, February 26, 2005 and May 28, 2005, respectively. For the first quarters of fiscal 2005 and fiscal 2006, advertising expenses were $2,866,000 and $4,629,000, respectively. Vendor allowances of $398,000 were recorded as an offset to advertising expense in fiscal 2003. There were no vendor allowances recorded as an offset to advertising expense in the other reporting periods presented.See"Vendor Allowances" above.
F-10
Income Taxes
The Company provides for income taxes utilizing the liability approach. The liability approach requires recognition of deferred tax liabilities and assets for the expected future consequences of temporary differences between the financial reporting basis and the tax basis of assets and liabilities at current tax rates. A valuation allowance is recorded when it is more likely than not that some portion or all of the deferred income tax assets will not be realized.
Store Preopening Costs
The Company expenses all store preopening costs as incurred, including certain occupancy, payroll, supplies, incremental advertising and other costs incurred in the preparation and opening of new retail locations.
Store Closing Costs
The Company adopted SFAS No. 146,Accounting for Costs Associated With Exit or Disposal Activities, on January 1, 2003. The present value of costs associated with location closings, if they occur, will be charged to general and administrative expense when a location is closed. Costs associated with location closings may include lease obligations, disposals of property and equipment, employee compensation and other related closing costs.
Use of Estimates
The preparation of financial statements in conformity with accounting principles generally accepted in the United States requires management to make estimates and assumptions that affect the reported amounts of assets and liabilities and disclosure of contingent assets and liabilities at the date of the financial statements and the reported amounts of revenues and expenses during the reporting period. Ultimate results could differ from those estimates.
Net (Loss) Income Per Share
Basic earnings per share is computed based on the weighted average number of common shares outstanding. Diluted earnings per share is computed based on the weighted average number of common shares outstanding adjusted by the number of additional shares that would have been outstanding had potentially dilutive common shares been issued. Potentially dilutive shares of common stock include certain common stock options, warrants and convertible preferred stock, depending on the estimated fair market value of the common stock and amount of net (loss) income for the period measured. Net loss per diluted share for the fiscal year ended March 1, 2003 excludes the following potentially dilutive securities because they were anti-dilutive: 717,246 outstanding common stock options and warrants and 5,752,467 common shares arising from the convertible preferred stock. Net income per diluted share for the three months ended May 29, 2004 excludes 5,752,467 common shares arising from the convertible preferred stock because the net effect is anti-dilutive for that period. The excluded shares could potentially dilute basic earnings per share in future periods. The following
F-11
table presents a reconciliation of the numerators and denominators of basic and diluted earnings per common share:
| | Year Ended | Three Months Ended (Unaudited) | |||||||||||||||
|---|---|---|---|---|---|---|---|---|---|---|---|---|---|---|---|---|---|
| | March 1, 2003 | February 28, 2004 | February 26, 2005 | May 29, 2004 | May 28, 2005 | ||||||||||||
| Numerator: | |||||||||||||||||
| Net (loss) income applicable to shareholders, as reported | $ | (1,855,000 | ) | $ | 4,147,000 | $ | 3,842,000 | $ | 224,000 | $ | 695,000 | ||||||
| Add accrued preferred stock dividends | — | 3,430,000 | 3,696,000 | — | 998,000 | ||||||||||||
| Numerator for diluted earnings per share | $ | (1,855,000 | ) | $ | 7,577,000 | $ | 7,538,000 | $ | 224,000 | $ | 1,693,000 | ||||||
| Denominator: | |||||||||||||||||
| Weighted average number of common shares outstanding | 1,799,787 | 1,814,046 | 1,865,928 | 1,861,945 | 1,883,969 | ||||||||||||
| Effect of dilutive securities: | |||||||||||||||||
| Outstanding stock options and warrants | — | 124,656 | 102,938 | 89,100 | 406,383 | ||||||||||||
| Convertible preferred stock | — | 5,752,467 | 5,752,467 | — | 5,752,467 | ||||||||||||
| Denominator for diluted earnings per share | 1,799,787 | 7,691,169 | 7,721,333 | 1,951,045 | 8,042,819 | ||||||||||||
| Net (loss) income per share: | |||||||||||||||||
| Basic—as reported | $ | (1.03 | ) | $ | 2.29 | $ | 2.06 | $ | 0.12 | $ | 0.37 | ||||||
| Diluted—as reported | $ | (1.03 | ) | $ | 0.99 | $ | 0.98 | $ | 0.11 | $ | 0.21 | ||||||
Interim Financial Data
The accompanying unaudited financial statements have been prepared in accordance with accounting principles generally accepted in the United States for interim financial information. In the opinion of management, all adjustments (consisting of normal recurring adjustments) considered necessary for a fair presentation have been included. Operating results for the three months ended May 28, 2005 are not necessarily indicative of the results that may be expected for the full fiscal year ending February 25, 2006.
Recently Issued Accounting Standards
EITF Issue No. 03-10
In fiscal 2004, the Company adopted EITF Issue No. 03-10,Application of Issue 02-16 by Resellers to Sales Incentives Offered to Consumers by Manufacturers, which amends EITF Issue No. 02-16. According to the amended guidance, if certain criteria are met, consideration received by a reseller in the form of reimbursement from a vendor for honoring the vendor's sales incentives offered directly to
F-12
the consumers (e.g., manufacturer's coupons) should not be recorded as a reduction of the cost of the reseller's purchases from the vendor. The adoption of EITF Issue No. 03-10 did not have any impact on the Company's financial position or results of operations.
SFAS No. 150
In fiscal 2004, the Company adopted SFAS No. 150,Accounting for Certain Financial Instruments With Characteristics of Both Liabilities and Equity. SFAS No. 150 clarifies the classification and measurement of certain financial instruments with characteristics of both liabilities and equity and is effective for financial instruments entered into or modified after May 31, 2003, or otherwise for the first interim period beginning after June 15, 2003. The adoption of SFAS No. 150 did not have any impact on the Company's financial position or results of operations because of the contingent nature of the Company's redeemable convertible preferred stock.
FIN 46
In January 2003, the Financial Accounting Standards Board (FASB) issued Financial Interpretation No. (FIN) 46,Consolidation of Variable Interest Entities, which requires the consolidation of and disclosures about variable interest entities (VIEs). VIEs are entities for which control is achieved through means other than voting rights. FIN 46 did not have any impact on the Company's financial position or results of operations.
SFAS No. 123(R)
In December 2004, the FASB issued a revision to SFAS No. 123,Accounting for Stock-Based Compensation, which requires the calculation of the fair value of stock-based compensation, estimation of future forfeitures and income taxes and recognition of the net value as a noncash expense over the vesting period of the underlying instruments. The implementation of SFAS No. 123(R),Share-Based Payment, can be made on either a modified prospective or modified retroactive basis. Based on current guidance, the Company will be required to implement the provisions of SFAS No. 123(R) beginning in fiscal 2007. The Company is currently evaluating option valuation methodologies and assumptions. The Company expects to record substantial non-cash compensation expenses as a result of the adoption of SFAS No. 123(R), which will have a significant adverse impact on our results of operations.
3. Golf Town Canada Inc.
In 1998, the Company entered into a consulting agreement to assist in the development of Golf Town Canada Inc. (Golf Town Canada), a golf retailer based in Canada. Under the agreement, the Company received payments in certain years related to consulting services and the use of certain advertising resources. The payments have not been material to the financial results of the Company. In addition, the consulting agreement provided the Company with a minority equity interest in Golf Town Canada and a position on its Board of Directors. The equity interest was accounted for on a cost basis and was not material to the Company's financial statements.
In fiscal 2005, Golf Town Canada sold all of its assets to the newly formed Golf Town Canada Income Fund as part of its initial public offering as a Canadian income fund. As part of the
F-13
transaction, the Company surrendered its entire equity interest in Golf Town Canada for cash, resulting in a net realized gain before taxes of $8,410,000 for the fiscal year. The Company has no further service obligations with regards to Golf Town Canada and no longer holds a position on its Board of Directors. As part of an agreement between the companies, there are restrictions on the Company's ability to open retail stores in Canada until 2008 and Golf Town Canada's ability to open retail stores in the United States until 2013.
4. Store Closing
During fiscal 2003, the Company made cash payments of $1,591,000 and incurred net noncash charges of $29,000 related to the termination of the lease obligation, asset disposals and other costs associated with a store closed in fiscal 2002. At the time the store was closed, a reserve was established for the estimated future costs related to the closing. In fiscal 2003, the Company recorded an adjustment to the reserve of $315,000 as a reduction to general and administrative expense, as actual expenses to terminate the lease obligation were lower than the estimate recorded in fiscal 2002.
5. Property and Equipment
Major classes of depreciable assets are as follows (in thousands):
| | February 28, 2004 | February 26, 2005 | May 28, 2005 (Unaudited) | |||||||
|---|---|---|---|---|---|---|---|---|---|---|
| Fixtures and equipment | $ | 11,696 | $ | 16,141 | $ | 21,280 | ||||
| Leasehold improvements | 9,918 | 13,459 | 17,177 | |||||||
| Construction in process | 2,958 | 6,329 | 625 | |||||||
| 24,572 | 35,929 | 39,082 | ||||||||
| Less accumulated depreciation and amortization | (11,784 | ) | (14,097 | ) | (15,226 | ) | ||||
| Net property and equipment | $ | 12,788 | $ | 21,832 | $ | 23,856 | ||||
6. Accrued Liabilities
Accrued liabilities consisted of the following (in thousands):
| | February 28, 2004 | February 26, 2005 | May 28, 2005 (Unaudited) | ||||||
|---|---|---|---|---|---|---|---|---|---|
| Gift card and customer deposit liabilities | $ | 3,453 | $ | 4,506 | $ | 4,300 | |||
| Payroll and related benefits | 1,500 | 2,112 | 1,791 | ||||||
| Taxes, other than income taxes | 681 | 984 | 1,542 | ||||||
| Occupancy | 258 | 507 | 867 | ||||||
| Construction costs | 1,329 | 2,417 | 461 | ||||||
| Other | 894 | 1,149 | 1,919 | ||||||
| $ | 8,115 | $ | 11,675 | $ | 10,880 | ||||
F-14
7. Revolving Credit Facility
The Company's previous credit facility expired in September 2004. In October 2004, the Company entered into a new credit facility with a commercial bank. The revolving credit facility agreement (the Credit Agreement) provides borrowing capacity for working capital financing and funding for other general corporate purposes through October 2008. The commitment under the Credit Agreement provides for borrowings up to $15,000,000, including $5,000,000 in letters of credit. At the Company's option, the facility can be expanded to a borrowing capacity of $20,000,000. Borrowings under the Credit Agreement are secured by the Company's inventories, accounts receivable and financial and intangible assets.
The Credit Agreement includes reporting requirements to the lender and certain restrictions on the Company's ability to change its capital structure, incur additional debt or pay dividends. In addition, the Credit Agreement requires the Company to maintain a minimum availability of 10% of the commitment under the credit facility at all times. The Company was in compliance with all covenants related to the Credit Agreement at February 26, 2005 and May 28, 2005.
Availability under the Credit Agreement is limited to certain percentages of eligible inventory and receivables, as defined, and was $15,000,000 at February 26, 2005 and May 28, 2005. The interest rate on borrowings under the credit facility is based on the prime lending rate or an adjusted LIBOR rate as defined in the Credit Agreement. The Credit Agreement provides for administrative fees, letter of credit commitment fees and fees of 0.25% applied to the unused facility commitment. There were no borrowings outstanding at February 28, 2004, February 26, 2005 or May 28, 2005.
Interest expense and other costs related to the revolving credit facility are presented net of interest income earned on the Company's cash and cash equivalents. Net interest (expense) income is comprised of the following (in thousands):
| | Year Ended | Three Months Ended (Unaudited) | ||||||||||||||
|---|---|---|---|---|---|---|---|---|---|---|---|---|---|---|---|---|
| | March 1, 2003 | February 28, 2004 | February 26, 2005 | May 29, 2004 | May 28, 2005 | |||||||||||
| Interest (expense) | $ | (176 | ) | $ | (256 | ) | $ | (114 | ) | $ | (44 | ) | $ | (21 | ) | |
| Interest income | 67 | 79 | 110 | 8 | 36 | |||||||||||
| Interest (expense) income, net | $ | (109 | ) | $ | (177 | ) | $ | (4 | ) | $ | (36 | ) | $ | 15 | ||
F-15
8. Income Taxes
The income tax (benefit) expense provision is comprised of the following (in thousands):
| | Year Ended | |||||||||
|---|---|---|---|---|---|---|---|---|---|---|
| | March 1, 2003 | February 28, 2004 | February 26, 2005 | |||||||
| Current: | ||||||||||
| Federal | $ | — | $ | 100 | $ | 3,209 | ||||
| State | — | 95 | 1,077 | |||||||
| Deferred | 523 | 845 | 849 | |||||||
| Total | 523 | 1,040 | 5,135 | |||||||
| Change in valuation allowance | (523 | ) | (6,185 | ) | — | |||||
| Net income tax (benefit) expense | $ | — | $ | (5,145 | ) | $ | 5,135 | |||
Reconciliations of the U.S. federal statutory income tax rate to the effective tax rate are as follows:
| | Year Ended | ||||||
|---|---|---|---|---|---|---|---|
| | March 1, 2003 | February 28, 2004 | February 26, 2005 | ||||
| U.S. federal statutory income tax rate | 34.0 | % | 34.0 | % | 34.0 | % | |
| State income taxes, net of federal income tax effect | 6.0 | 6.0 | 6.8 | ||||
| Other adjustments to taxable income | 1.5 | 2.7 | (0.3 | ) | |||
| Change in valuation allowance | (41.5 | ) | (254.3 | ) | — | ||
| Effective tax rate | — | % | (211.6 | )% | 40.5 | % | |
Deferred income taxes result from the net tax effects of temporary differences between the carrying amounts of assets and liabilities for financial reporting purposes and the amounts used for income tax purposes. Significant components of the net deferred tax assets were as follows (in thousands):
| | February 28, 2004 | February 26, 2005 | ||||||
|---|---|---|---|---|---|---|---|---|
| Deferred tax assets: | ||||||||
| Deferred revenue: | ||||||||
| Gift card and customer deposit liabilities | $ | 1,286 | $ | 1,712 | ||||
| Deferred expenses: | ||||||||
| Rent expense | 1,359 | 2,355 | ||||||
| Inventory valuation | 366 | 363 | ||||||
| Other expenses | 636 | 61 | ||||||
| Net operating loss carryforwards | 1,693 | — | ||||||
| Net deferred taxes | $ | 5,340 | $ | 4,491 | ||||
F-16
During fiscal 2005, the Company utilized all of its remaining federal net operating loss carryforwards for income tax purposes. Prior to fiscal 2004, the Company had established a valuation allowance for the full value of the loss of carryforwards and other deferred tax assets because of uncertainty regarding the Company's ability to realize their value. During fiscal 2004, the Company reversed the remaining valuation allowance based on updated estimates that it was more likely than not that the full value of the deferred tax assets would be realized.
9. Redeemable Convertible Preferred Stock
The Company is authorized to issue up to 10,000,000 shares of preferred stock with a par value of $1.00 per share. Prior to fiscal 2002, the Company issued 309,000 shares of redeemable convertible preferred stock in four series (together, the Preferred Stock). Proceeds from the issuance of the Preferred Stock were used primarily to fund the opening of new stores and the funding of operating losses during the initial period of the Company's expansion. The Preferred Stock has a par value of $1.00 per share and was issued in private placements for $100.00 per share.
The Preferred Stock is convertible to common stock at the values, subject to adjustments, as follows:
| Series | Number of Shares | Conversion Price Per Share | Number of Common Shares if Converted | ||||
|---|---|---|---|---|---|---|---|
| A | 80,000 | $ | 4.35 | 1,839,079 | |||
| B | 35,000 | 5.20 | 673,076 | ||||
| C | 100,000 | 5.72 | 1,748,249 | ||||
| D | 94,000 | 6.30 | 1,492,063 | ||||
Dividends on the Preferred Stock compound quarterly at an 8% rate. The dividends are cumulative and payable when declared by the Board of Directors or in defined instances when the Preferred Stock is redeemed or converted into common stock. As of February 26, 2005 and May 28, 2005, no such dividends have been declared and the preferred shareholders may not demand such dividends prior to May 28, 2006. Upon a qualifying stock offering, as defined in the preferred stock purchase agreement, the cumulative unpaid dividends would be waived and accrual of the dividends would cease. A qualifying stock offering is defined as an initial public offering or the sale of the Company's common stock at a specified minimum rate of return to the preferred shareholders. The proposed initial public offering will not meet the requirements to be considered a qualifying stock offering.
Prior to fiscal 2002, accumulated dividends were not recorded based on management's expectation of a qualifying stock offering. In fiscal 2002, because of the uncertainty of the Company's ability to conduct a qualifying stock offering, the Company accrued the cumulative undeclared dividends related to the Preferred Stock as an offset to additional paid-in capital of the common stock and retained earnings. The accumulated preferred stock dividends have been recorded quarterly in each subsequent fiscal year. Cumulative undeclared accrued dividends included in the Preferred Stock balances were $14,145,000 at February 28, 2004, $17,841,000 at February 26, 2005 and $18,839,000 at May 28, 2005.
F-17
The Preferred Stock is redeemable at the option of the holders upon certain events, as defined, primarily related to a change in control or events of noncompliance. In addition, at any time after May 28, 2006, the holders can require redemption, subject to the terms of the stock purchase agreements. The holders can redeem each share of the stock at the redemption price, defined as the greater of the $100.00 convertible value or the fair market value of the common stock into which a share of the Preferred Stock is convertible, plus cumulative unpaid dividends. Based on a third-party valuation of the common stock of the Company as a private entity and its existing capital structure at February 26, 2005, the estimated redemption value of the preferred stock, as if redeemed at February 26, 2005, would have been approximately $62,653,000, including accumulated undeclared dividends. Based on our assumed initial public offering price of $ (the mid-point of the range set forth on the cover of this prospectus), the estimated redemption value of the preferred stock, as if redeemed at May 28, 2005, would have been approximately $ , including accumulated dividends.
The holders of the Preferred Stock can convert their shares into common stock at any time at the conversion price, as defined. The Company can mandate conversion of the Preferred Stock into common stock in the event of a qualifying stock offering, as defined, or at such time as not more than 20% of the Preferred Stock remains outstanding.
The holders of the Preferred Stock, treated as one class, may elect four directors; the holders of common stock, treated as one class and without the holders of the Preferred Stock having a right to vote, may elect two directors; and the holders of the Preferred Stock and common stock, voting together as a single class, may elect three directors. In most other voting matters, the holders of the Preferred Stock are entitled to vote as equals to the holders of the common stock, the number of shares, assuming the then-outstanding shares of Preferred Stock were converted to shares of common stock.
In connection with the issuance of the Preferred Stock, the Company must comply with certain covenants primarily related to reporting and disclosure requirements. In addition, the Company must maintain key-person life insurance on its chief executive officer and chief operating officer, each with a death benefit of $5,000,000, with the Company as sole beneficiary. The Company was in compliance with all covenants and requirements as of February 26, 2005 and May 28, 2005.
The Preferred Stock was recorded at its fair value at issuance, which was determined to be the stated value less stock issuance costs of approximately $2,062,000. The carrying amounts were adjusted to their stated redemption values through periodic accretion using the effective interest method. The accretion was recorded through a noncash entry to increase the carrying value of the Preferred Stock with a corresponding decrease to paid-in capital of the common stock or retained earnings and is not reflected on the statements of cash flows. Issuance costs were fully amortized at March 1, 2003.
On May 16, 2005, the Company entered into a conversion agreement with the holders of the Preferred Stock (the Conversion Agreement) to be effective upon the closing of the proposed initial public offering of common stock. Pursuant to the Conversion Agreement, such holders will convert all of the Preferred Stock into shares of common stock according to the defined conversion rates for each Series
F-18
of Preferred Stock. In addition, all accumulated and outstanding Preferred Stock dividends will be paid to the holders of the Preferred Stock out of the proceeds from the offering. Pursuant to the Conversion Agreement, the holders of the Preferred Stock have waived certain rights, including anti-dilution and preemptive rights, defined registration and redemption rights, and rights to designate or elect members of the Board of Directors.
10. Common Stock
In fiscal 2005, the number of common shares authorized was increased from 11,000,000 to 40,000,000 shares with a par value of $0.01. Certain shares of the Company's common stock to be issued upon the conversion of the Preferred Stock or exercise of the outstanding warrant are subject to registration rights.
Stock Options
The Company's 1996 Stock Option and Incentive Plan and 2004 Stock Incentive Plan (together, the Plans) provide for the issuance of incentive and non-qualified stock options. Options are granted at the fair market value as of the grant date, are exercisable ratably over various periods and expire up to ten years after the date of grant.
As of February 26, 2005 and May 28, 2005, 2,000,000 common shares were authorized for issuance under the Plans. Stock option activity under the Plans was as follows:
| | March 1, 2003 | Year Ended February 28, 2004 | February 26, 2005 | Three Months Ended (Unaudited) May 28, 2005 | ||||||||||||||||||||
|---|---|---|---|---|---|---|---|---|---|---|---|---|---|---|---|---|---|---|---|---|---|---|---|---|
| | Shares | Weighted Average Exercise Price | Shares | Weighted Average Exercise Price | Shares | Weighted Average Exercise Price | Shares | Weighted Average Exercise Price | ||||||||||||||||
| Outstanding, beginning of period | 599,850 | $ | 4.51 | 702,325 | $ | 4.83 | 698,100 | $ | 5.21 | 915,275 | $ | 5.47 | ||||||||||||
| Issued | 145,100 | 6.30 | 129,500 | 6.30 | 252,900 | 6.30 | 138,000 | 8.00 | ||||||||||||||||
| Forfeited | (42,575 | ) | 5.28 | (47,475 | ) | 5.78 | (32,075 | ) | 6.28 | (13,250 | ) | 6.30 | ||||||||||||
| Exercised | (50 | ) | 6.30 | (86,250 | ) | 3.43 | (3,650 | ) | 5.91 | — | — | |||||||||||||
| Outstanding, end of period | 702,325 | 4.83 | 698,100 | 5.21 | 915,275 | 5.47 | 1,040,025 | 5.80 | ||||||||||||||||
| Exercisable, end of period | 448,094 | 4.08 | 420,450 | 4.52 | 525,706 | 4.86 | 616,406 | 5.07 | ||||||||||||||||
| Weighted average fair value of options granted | $ | 1.08 | $ | 1.02 | $ | 1.14 | $ | 1.43 | ||||||||||||||||
F-19
The following table summarizes information about stock options outstanding at February 26, 2005:
| | Total Options Outstanding | Exercisable Options | ||||||||||
|---|---|---|---|---|---|---|---|---|---|---|---|---|
| Range of Exercise Prices | Number Outstanding | Weighted Average Remaining Contractural Life | Weighted Average Exercise Price | Number Outstanding | Weighted Average Exercise Price | |||||||
| $3.00 - $4.35 | 241,700 | 2.5 years | $ | 3.53 | 241,700 | $ | 3.53 | |||||
| 5.20 - 6.30 | 673,575 | 7.6 years | 6.17 | 284,006 | 5.99 | |||||||
| 3.00 - 6.30 | 915,275 | 5.47 | 525,706 | 4.86 | ||||||||
Warrant
As of February 26, 2005, there was an outstanding warrant to purchase 14,921 shares of common stock with an exercise price of $6.30 per share. The warrant was issued in connection with the private offering of Series D Preferred Stock.
11. Commitments and Contingencies
Operating Lease Commitments
The Company leases its retail store locations, office space and certain office equipment under operating leases expiring through 2019 with various renewal options. The operating leases require base monthly rents plus executory costs such as real estate taxes, insurance and maintenance. Certain retail store location leases provide for additional contingent rentals based upon a percentage of sales at the respective locations. These contingent rental costs were not significant for the periods presented.
The Company records rent expense on a straight-line basis for operating leases with increasing base rent terms. Landlord allowances and incentives are deferred and amortized over the term of the lease. Rent expenses under the operating leases, including executory costs, accrual of deferred rent credits and amortization of landlord allowance, were approximately $6,514,000, $7,553,000 and $9,891,000 in fiscal 2003, 2004 and 2005, respectively.
Future minimum operating lease payments, excluding executory costs, consist of the following as of February 26, 2005 (in thousands):
| | | |||
|---|---|---|---|---|
| Fiscal year: | ||||
| 2006 | $ | 10,970 | ||
| 2007 | 11,701 | |||
| 2008 | 11,753 | |||
| 2009 | 11,425 | |||
| 2010 | 10,274 | |||
| Thereafter | 39,807 | |||
| $ | 95,930 | |||
F-20
Litigation
The Company is not a party to any legal proceedings other than various claims and lawsuits arising in the normal course of business. Management believes that the ultimate resolution of these matters will not have a material adverse effect on the Company's financial position or results of operations.
Employment and Retention Agreements
The Company currently has employment and retention agreements with certain officers, which provide for continuation of compensation and benefits for a defined period following termination under certain circumstances.
Business Considerations
The Company purchases products from a number of distributors and manufacturers. During fiscal 2005, the Company purchased approximately 61.1% of its merchandise from its five largest suppliers, and 21.1% of the Company's accounts receivable at February 26, 2005, relate to those suppliers. The Company believes its vendor relationships are satisfactory.
12. Employee Benefit Plan
The Company has a defined contribution 401(k) profit sharing plan (the Plan) for eligible employees, which is qualified under Sections 401(a) and 401(k) of the Internal Revenue Code of 1986. Employees are entitled to make tax-deferred contributions of up to 18% of their eligible compensation. The Company may, at its discretion, make a profit sharing contribution to the Plan for each plan year. The Company's contributions vest after four years of service, at age 591/2 regardless of service or upon the death of the employee. Through February 26, 2005, the Company had not made profit sharing contributions to the Plan. Effective July 1, 2005, the Company will begin matching 50% of the first 4% of eligible compensation contributed to the Plan by each participant.
F-21
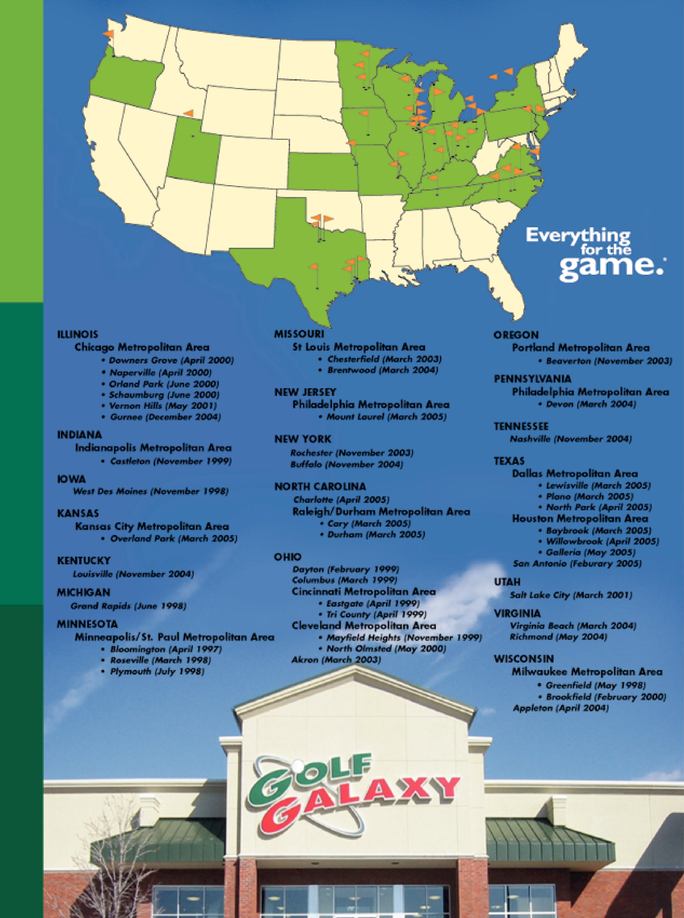
Shares
GOLF GALAXY, INC.
Common Stock
PROSPECTUS
Until , 2005, all dealers that effect transactions in these securities, whether or not participating in this offering, may be required to deliver a prospectus. This is in addition to the dealers' obligation to deliver a prospectus when acting as underwriters and with respect to their unsold allotments or subscriptions.
Piper Jaffray
William Blair & Company
A.G. Edwards
Wedbush Morgan Securities
, 2005
PART II
INFORMATION NOT REQUIRED IN PROSPECTUS
Item 13. Other Expenses of Issuance and Distribution
Expenses in connection with the issuance and distribution of the shares of our common stock being registered hereunder, other than underwriting commissions and expenses, are set forth below. All of the amounts shown are estimated except the Securities and Exchange Commission registration fee, the NASD filing fee and the Nasdaq National Market listing fee.
| SEC registration fee | $ | 5,415 | ||
| NASD filing fee | 5,100 | |||
| Nasdaq National Market listing fee | 5,000 | |||
| Legal fees and expenses | * | |||
| Accounting fees and expenses | * | |||
| Printing and engraving expenses | * | |||
| Blue sky fees and expenses | * | |||
| Transfer agent fees and expenses | * | |||
| Miscellaneous expenses | * | |||
| Total | $ | * | ||
*To be completed by amendment.
Item 15. Recent Sales of Unregistered Securities
Option Grants and Option Exercises
Since June 27, 2002, we granted options to purchase 605,400 shares of our common stock to our directors, officers and employees under our 1996 Stock Option and Incentive Plan and our 2004 Stock Incentive Plan, at exercise prices ranging from $6.30 to $8.00 per share and authorized for issuance, as of the effective date of this prospectus, options to purchase 167,500 shares at an exercise price equal to the price per share of our common stock sold in this offering. During the same period, we issued and sold 59,703 shares of our common stock pursuant to option exercises at prices ranging from $3.00 to $6.30 per share. These grants and sales were made in reliance on Rule 701 of the Securities Act. In connection with the cashless exercise of options to purchase 61,789 shares of our common stock, we repurchased 30,197 shares of common stock from former officers at $6.30 per share.
Sale of Shares
On November 9, 2004 we authorized, and on January 18, 2005 we sold, 20,000 shares of our common stock to a member of our board of directors for $6.30 per share. This sale was made in reliance on Sections 4(2) and 4(6) of the Securities Act.
II-1
Item 16. Exhibits and Financial Statement Schedules.
(a) Exhibits
| Exhibit No. | Description | |
|---|---|---|
| 1 | Form of Underwriting Agreement† | |
| 3.1 | Articles of Incorporation of the Registrant, to be effective upon completion of this offering* | |
| 3.2 | Bylaws of the Registrant, to be effective upon completion of this offering* | |
| 4.1 | Specimen of common stock certificate† | |
| 4.2 | Stock Purchase Warrant dated as of October 3, 2000 by and between Piper Jaffray & Co. (formerly, U.S. Bancorp Piper Jaffray Inc.) and the Registrant** | |
| 4.3 | Amended and Restated Registration Rights Agreement dated as of October 3, 2000 among the holders of preferred stock, Randall K. Zanatta, Gregory B. Maanum and the Registrant** | |
| 4.4 | Conversion Agreement dated May 16, 2005 by and between holders of preferred stock and the Registrant* | |
| 5 | Opinion of Robins, Kaplan, Miller & Ciresi L.L.P.† | |
| 10.1 | Retention Agreement between the Registrant and Randall K. Zanatta, dated December 31, 1997** | |
| 10.2 | Retention Agreement between the Registrant and Gregory B. Maanum, dated December 31, 1997** | |
| 10.3 | Employment Agreement between the Registrant and Randall K. Zanatta, dated December 31, 1997** | |
| 10.4 | Employment Agreement between the Registrant and Gregory B. Maanum, dated December 31, 1997** | |
| 10.5 | Employment Agreement between the Registrant and Michael W. McCormick, dated January 6, 2003** | |
| 10.6 | Employment Agreement between the Registrant and Richard C. Nordvold, dated March 15, 2004** | |
| 10.7 | Employment Agreement between the Registrant and Ronald G. Hornbaker, dated May 11, 2005** | |
| 10.8 | 1996 Stock Option and Incentive Plan, as amended and restated** | |
| 10.9 | Form of Incentive Stock Option Agreement for 1996 Stock Option and Incentive Plan** | |
| 10.10 | 2004 Stock Incentive Plan** | |
| 10.11 | Form of Incentive Stock Option Agreement for 2004 Stock Incentive Plan** | |
| 10.12 | Loan and Security Agreement dated as of October 20, 2004 by and between Wells Fargo Retail Finance, LLC and the Registrant** | |
| 10.13 | Form of Non-Qualified Stock Option Agreement for 1996 Stock Option and Incentive Plan* | |
| 10.14 | Form of Non-Qualified Stock Option Agreement for 2004 Stock Incentive Plan* | |
| 23.1 | Consent of Ernst & Young LLP* | |
| 23.2 | Consent of Robins, Kaplan, Miller & Ciresi L.L.P. (contained in its opinion filed as Exhibit 5)† | |
| 24 | Powers of Attorney** |
*Filed herewith
**Previously filed
†To be filed by amendment
II-2
- (b)
- Financial Statement Schedules
Report of Independent Registered Public Accounting Firm
Board of Directors and Shareholders
Golf Galaxy, Inc.
We have audited the financial statements of Golf Galaxy, Inc. as of February 26, 2005 and February 28, 2004, and for each of the three years in the period ended February 26, 2005, and have issued our report thereon dated April 22, 2005 (included elsewhere in this Registration Statement). Our audits also included the financial statement schedule listed in Item 16(b) of this Registration Statement. This schedule is the responsibility of the Company's management. Our responsibility is to express an opinion based on our audits.
In our opinion, the financial statement schedule referred to above, when considered in relation to the basic financial statements taken as a whole, present fairly in all material respects the information set forth therein.
/s/ERNST & YOUNG LLP
Minneapolis, Minnesota
April 22, 2005
II-3
GOLF GALAXY, INC.
Schedule II—Valuation and Qualifying Accounts
Years Ended March 1, 2003, February 28, 2004, and February 26, 2005
and Three Months Ended May 28, 2005
(In Thousands)
| | Balance at Beginning of Period | Additions— Charged to Costs and Expenses | Deductions | Balance at End of Period | |||||||||
|---|---|---|---|---|---|---|---|---|---|---|---|---|---|
| Accounts receivable reserves: | |||||||||||||
| Year ended March 1, 2003 | |||||||||||||
| Bad debt reserve | $ | 203 | $ | 148 | $ | (253 | ) | $ | 98 | ||||
Year ended February 28, 2004 | |||||||||||||
| Bad debt reserve | 98 | 34 | (82 | ) | 50 | ||||||||
Year ended February 26, 2005 | |||||||||||||
| Bad debt reserve | 50 | — | — | 50 | |||||||||
Three months ended May 28, 2005 | |||||||||||||
| Bad debt reserve | 50 | — | — | 50 | |||||||||
Inventory reserves: | |||||||||||||
| Year ended March 1, 2003 | |||||||||||||
| Inventory reserve | $ | 542 | $ | 267 | $ | (341 | ) | $ | 468 | ||||
Year ended February 28, 2004 | |||||||||||||
| Inventory reserve | 468 | 242 | (208 | ) | 502 | ||||||||
Year ended February 26, 2005 | |||||||||||||
| Inventory reserve | 502 | 124 | (63 | ) | 563 | ||||||||
Three months ended May 28, 2005 | |||||||||||||
| Inventory reserve | 563 | 68 | (42 | ) | 589 | ||||||||
Net Sale Returns Reserve: | |||||||||||||
Year ended March 1, 2003 | |||||||||||||
| Sales returns reserve | $ | 69 | $ | — | $ | (38 | ) | $ | 31 | ||||
Year ended February 28, 2004 | |||||||||||||
| Sales returns reserve | 31 | 13 | — | 44 | |||||||||
Year ended February 26, 2005 | |||||||||||||
| Sales returns reserve | 44 | 6 | — | 50 | |||||||||
Three months ended May 28, 2005 | |||||||||||||
| Sales returns reserve | 50 | 54 | — | 104 | |||||||||
All other schedules are omitted because they are not applicable or not required or because the required information is shown in the Registrant's financial statements or the notes thereto.
II-4
Pursuant to the requirements of the Securities Act of 1933, the Registrant has duly caused this Amendment No. 1 to Registration Statement to be signed on its behalf by the undersigned, thereunto duly authorized, in the City of Minneapolis, State of Minnesota, on June 28, 2005.
| GOLF GALAXY, INC. | ||||
| By | /s/ RANDALL K. ZANATTA Randall K. Zanatta President, Chief Executive Officer and Chairman | |||
Pursuant to the requirements of the Securities Act of 1933, this Amendment No. 1 to Registration Statement has been signed by the following persons in the capacities indicated on June 28, 2005.
| Signature | Title | |
|---|---|---|
/s/ RANDALL K. ZANATTA Randall K. Zanatta | President, Chief Executive Officer, Chairman and Director (Principal Executive Officer) | |
* Gregory B. Maanum | Chief Operating Officer and Director | |
/s/ RICHARD C. NORDVOLD Richard C. Nordvold | Chief Financial Officer (Principal Financial and Accounting Officer) | |
* Gregg S. Newmark | Director | |
* William C. Mulligan | Director | |
* David E. Bloom | Director | |
* David S. Gellman | Director | |
* Jack W. Eugster | Director | |
* Thomas C. Healy | Director |
*By | /s/ RANDALL K. ZANATTA | |||
| Randall K. Zanatta Attorney-In-Fact |
II-5
| Exhibit No. | Description | |
|---|---|---|
| 1 | Form of Underwriting Agreement† | |
| 3.1 | Articles of Incorporation of the Registrant, to be effective upon completion of this offering* | |
| 3.2 | Bylaws of the Registrant, to be effective upon completion of this offering* | |
| 4.1 | Specimen of common stock certificate† | |
| 4.2 | Stock Purchase Warrant dated as of October 3, 2000 by and between Piper Jaffray & Co. (formerly, U.S. Bancorp Piper Jaffray Inc.) and the Registrant** | |
| 4.3 | Amended and Restated Registration Rights Agreement dated as of October 3, 2000 among the holders of preferred stock, Randall K. Zanatta, Gregory B. Maanum and the Registrant** | |
| 4.4 | Conversion Agreement dated May 16, 2005 among the holders of preferred stock and the Registrant* | |
| 5 | Opinion of Robins, Kaplan, Miller & Ciresi L.L.P.† | |
| 10.1 | Retention Agreement between the Registrant and Randall K. Zanatta, dated December 31, 1997** | |
| 10.2 | Retention Agreement between the Registrant and Gregory B. Maanum, dated December 31, 1997** | |
| 10.3 | Employment Agreement between the Registrant and Randall K. Zanatta, dated December 31, 1997** | |
| 10.4 | Employment Agreement between the Registrant and Gregory B. Maanum, dated December 31, 1997** | |
| 10.5 | Employment Agreement between the Registrant and Michael W. McCormick, dated January 6, 2003** | |
| 10.6 | Employment Agreement between the Registrant and Richard C. Nordvold, dated March 15, 2004** | |
| 10.7 | Employment Agreement between the Registrant and Ronald G. Hornbaker, dated May 11, 2005** | |
| 10.8 | 1996 Stock Option and Incentive Plan, as amended and restated** | |
| 10.9 | Form of Incentive Stock Option Agreement for 1996 Stock Option and Incentive Plan** | |
| 10.10 | 2004 Stock Incentive Plan** | |
| 10.11 | Form of Incentive Stock Option Agreement for 2004 Stock Incentive Plan** | |
| 10.12 | Loan and Security Agreement dated as of October 20, 2004 by and between Wells Fargo Retail Finance, LLC and the Registrant** | |
| 10.13 | Form of Non-Qualified Stock Option Agreement for 1996 Stock Option and Incentive Plan* | |
| 10.14 | Form of Non-Qualified Stock Option Agreement for 2004 Stock Incentive Plan* | |
| 23.1 | Consent of Ernst & Young LLP* | |
| 23.2 | Consent of Robins, Kaplan, Miller & Ciresi L.L.P. (contained in its opinion filed as Exhibit 5)† | |
| 24 | Powers of Attorney** |
*Filed herewith
**Previously filed
†To be filed by amendment
II-6
TABLE OF CONTENTS
SUMMARY
RISK FACTORS
A SPECIAL NOTE REGARDING FORWARD-LOOKING STATEMENTS
USE OF PROCEEDS
DIVIDEND POLICY
CAPITALIZATION
DILUTION
SELECTED FINANCIAL INFORMATION
MANAGEMENT'S DISCUSSION AND ANALYSIS OF FINANCIAL CONDITION AND RESULTS OF OPERATIONS
BUSINESS
Stores Open As of June 2005
MANAGEMENT
Summary Compensation Table
Option Grants in Last Fiscal Year
Aggregated Option Exercises in Fiscal 2005 and Year-End Option Values
CERTAIN RELATIONSHIPS AND RELATED PARTY TRANSACTIONS
PRINCIPAL AND SELLING SHAREHOLDERS
DESCRIPTION OF CAPITAL STOCK
SHARES ELIGIBLE FOR FUTURE SALE
U.S. FEDERAL TAX CONSEQUENCES FOR NON-U.S. HOLDERS
UNDERWRITING
LEGAL MATTERS
EXPERTS
WHERE YOU CAN FIND MORE INFORMATION
GOLF GALAXY, INC. INDEX TO FINANCIAL STATEMENTS
Contents
REPORT OF INDEPENDENT REGISTERED PUBLIC ACCOUNTING FIRM
GOLF GALAXY, INC. BALANCE SHEETS (In Thousands, Except Share and Per Share Amounts)
GOLF GALAXY, INC. STATEMENTS OF OPERATIONS (In Thousands, Except Share and Per Share Amounts)
GOLF GALAXY, INC. STATEMENTS OF SHAREHOLDERS' EQUITY (DEFICIT) (In Thousands, Except Share Amounts)
GOLF GALAXY, INC. STATEMENTS OF CASH FLOWS (In Thousands)
GOLF GALAXY, INC. NOTES TO FINANCIAL STATEMENTS
PART II INFORMATION NOT REQUIRED IN PROSPECTUS
Report of Independent Registered Public Accounting Firm
GOLF GALAXY, INC. Schedule II—Valuation and Qualifying Accounts Years Ended March 1, 2003, February 28, 2004, and February 26, 2005 and Three Months Ended May 28, 2005 (In Thousands)
SIGNATURES
EXHIBIT INDEX