
Q4 2021 Stockholder Letter
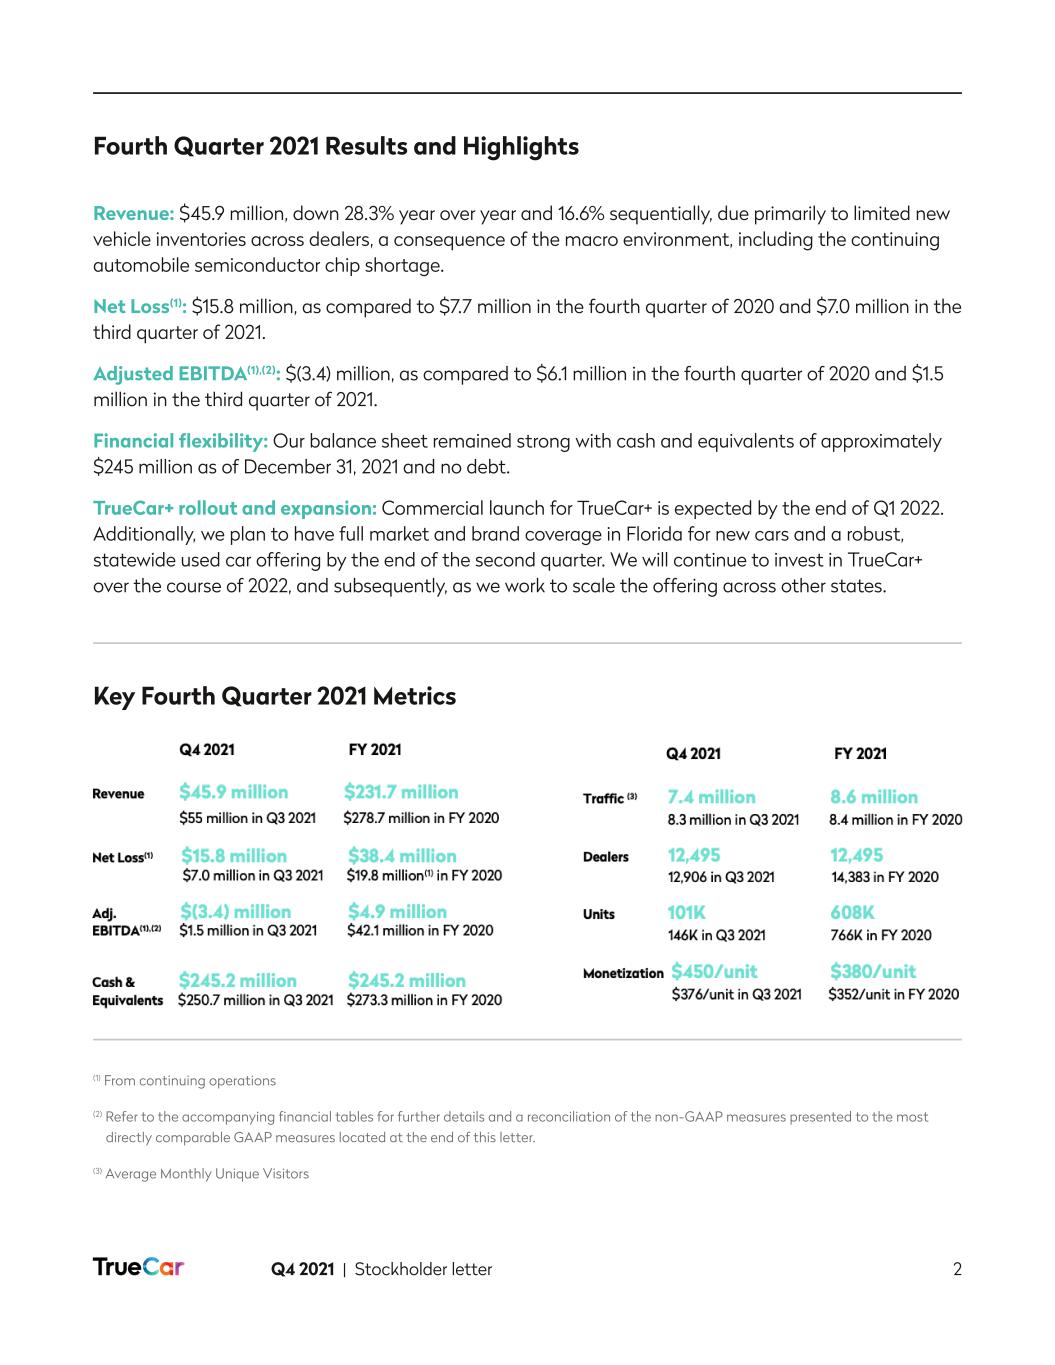
Q4 2021 | Stockholder letter 2 Fourth Quarter 2021 Results and Highlights Revenue: $45.9 million, down 28.3% year over year and 16.6% sequentially, due primarily to limited new vehicle inventories across dealers, a consequence of the macro environment, including the continuing automobile semiconductor chip shortage. Net Loss(1): $15.8 million, as compared to $7.7 million in the fourth quarter of 2020 and $7.0 million in the third quarter of 2021. Adjusted EBITDA(1),(2): $(3.4) million, as compared to $6.1 million in the fourth quarter of 2020 and $1.5 million in the third quarter of 2021. Financial flexibility: Our balance sheet remained strong with cash and equivalents of approximately $245 million as of December 31, 2021 and no debt. TrueCar+ rollout and expansion: Commercial launch for TrueCar+ is expected by the end of Q1 2022. Additionally, we plan to have full market and brand coverage in Florida for new cars and a robust, statewide used car offering by the end of the second quarter. We will continue to invest in TrueCar+ over the course of 2022, and subsequently, as we work to scale the offering across other states. (1) From continuing operations (2) Refer to the accompanying financial tables for further details and a reconciliation of the non-GAAP measures presented to the most directly comparable GAAP measures located at the end of this letter. (3) Average Monthly Unique Visitors Key Fourth Quarter 2021 Metrics
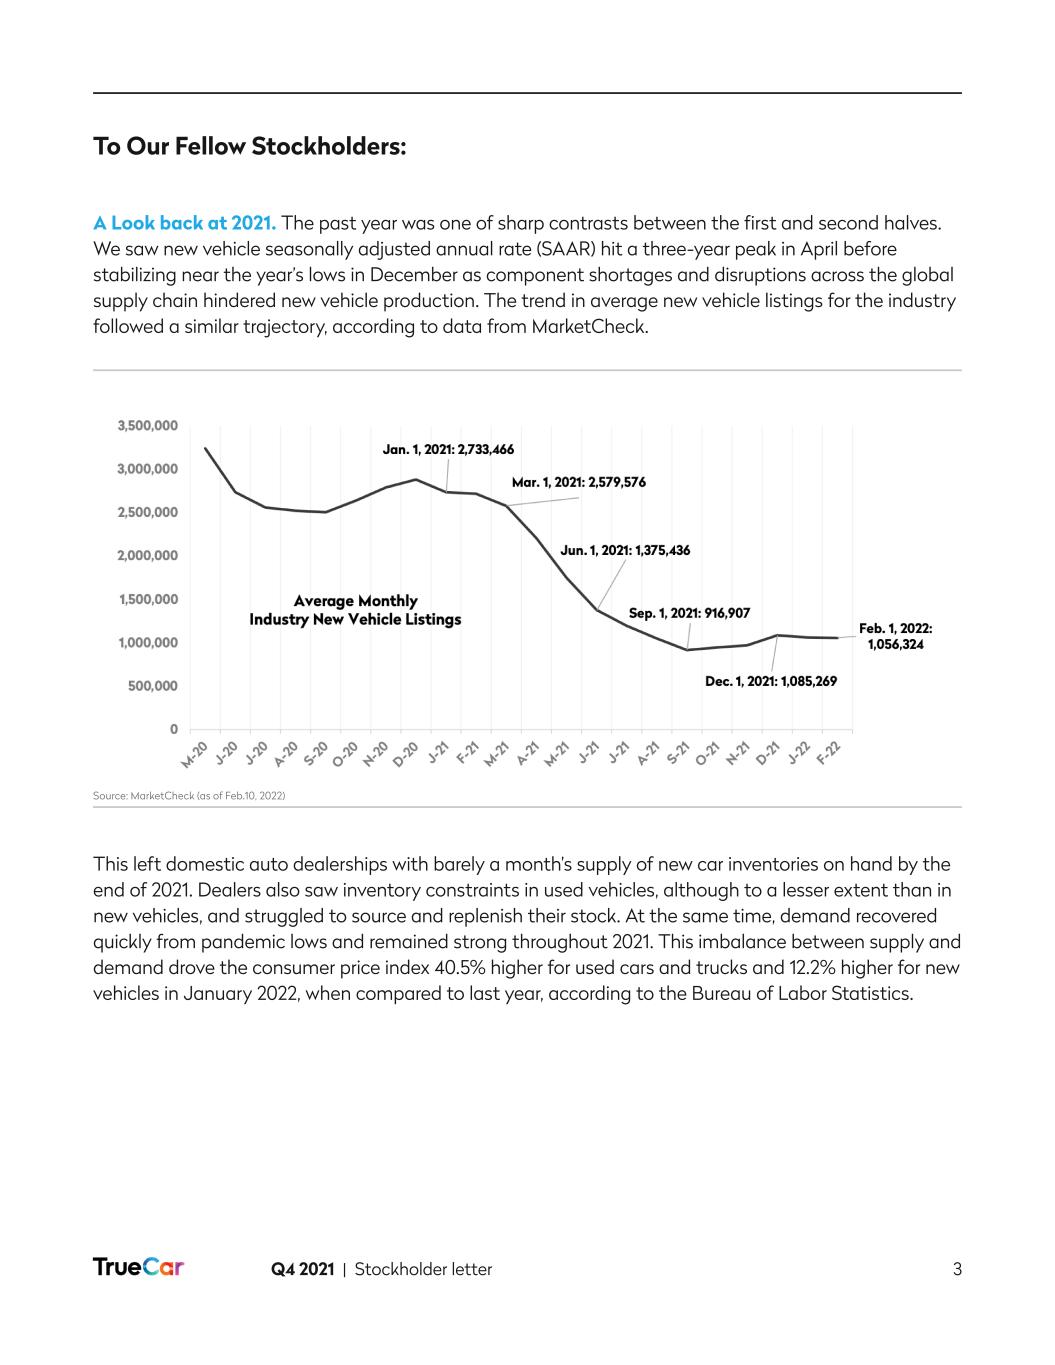
Q4 2021 | Stockholder letter 3 To Our Fellow Stockholders: A Look back at 2021. The past year was one of sharp contrasts between the first and second halves. We saw new vehicle seasonally adjusted annual rate (SAAR) hit a three-year peak in April before stabilizing near the year’s lows in December as component shortages and disruptions across the global supply chain hindered new vehicle production. The trend in average new vehicle listings for the industry followed a similar trajectory, according to data from MarketCheck. This left domestic auto dealerships with barely a month’s supply of new car inventories on hand by the end of 2021. Dealers also saw inventory constraints in used vehicles, although to a lesser extent than in new vehicles, and struggled to source and replenish their stock. At the same time, demand recovered quickly from pandemic lows and remained strong throughout 2021. This imbalance between supply and demand drove the consumer price index 40.5% higher for used cars and trucks and 12.2% higher for new vehicles in January 2022, when compared to last year, according to the Bureau of Labor Statistics. Source: MarketCheck (as of Feb.10, 2022)
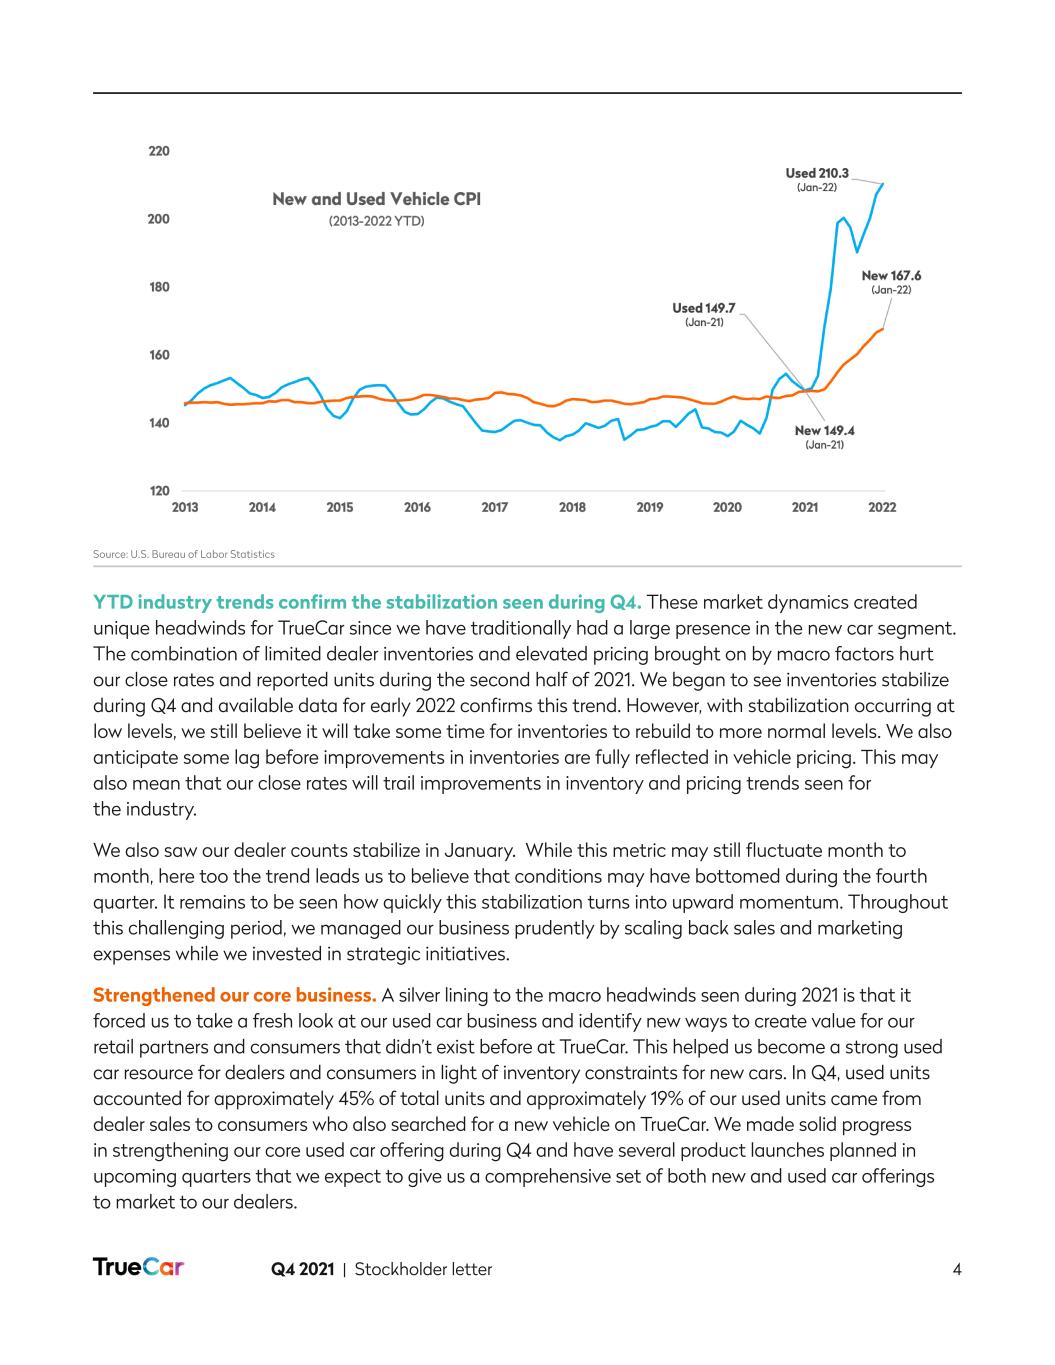
Q4 2021 | Stockholder letter 4 YTD industry trends confirm the stabilization seen during Q4. These market dynamics created unique headwinds for TrueCar since we have traditionally had a large presence in the new car segment. The combination of limited dealer inventories and elevated pricing brought on by macro factors hurt our close rates and reported units during the second half of 2021. We began to see inventories stabilize during Q4 and available data for early 2022 confirms this trend. However, with stabilization occurring at low levels, we still believe it will take some time for inventories to rebuild to more normal levels. We also anticipate some lag before improvements in inventories are fully reflected in vehicle pricing. This may also mean that our close rates will trail improvements in inventory and pricing trends seen for the industry. We also saw our dealer counts stabilize in January. While this metric may still fluctuate month to month, here too the trend leads us to believe that conditions may have bottomed during the fourth quarter. It remains to be seen how quickly this stabilization turns into upward momentum. Throughout this challenging period, we managed our business prudently by scaling back sales and marketing expenses while we invested in strategic initiatives. Strengthened our core business. A silver lining to the macro headwinds seen during 2021 is that it forced us to take a fresh look at our used car business and identify new ways to create value for our retail partners and consumers that didn’t exist before at TrueCar. This helped us become a strong used car resource for dealers and consumers in light of inventory constraints for new cars. In Q4, used units accounted for approximately 45% of total units and approximately 19% of our used units came from dealer sales to consumers who also searched for a new vehicle on TrueCar. We made solid progress in strengthening our core used car offering during Q4 and have several product launches planned in upcoming quarters that we expect to give us a comprehensive set of both new and used car offerings to market to our dealers. Source: U.S. Bureau of Labor Statistics
Q4 2021 | Stockholder letter 5 Invested in TrueCar+ pilot and added experienced product lead. In addition to strengthening our core business, we remained focused on bringing TrueCar+ to market. Since the pilot began, we have added many features including the ability for consumers to arrange for financing and finalize their deal terms online. Product development on our TrueCar+ pilot has been iterative and with each new capability, our teams have continued to refine the pilot and apply what we have learned from rigorous testing in order to ensure a great experience for consumers and dealers. Our ability to launch new products and capabilities quickly has been enhanced by our modern, state-of-the art technology platform. Alongside these great developments, we welcomed Rich DiStefano as our Head of Product in December. Rich previously helped develop multiple two-sided marketplaces at organizations such as Ticketmaster and Match.com and brings extensive digital product development and mobile commerce experience to TrueCar at a pivotal time. Dealer response and interest has been very positive. Response and interest from dealers to the TrueCar+ pilot has been very positive. As a result, we have expanded the number of dealers and brands that are currently in the pilot and are in talks to onboard multiple new dealer groups. We believe that TrueCar+ will appeal broadly to dealers ranging in size from large groups to smaller independents since it will provide instant access to a turnkey digital marketplace and reduce the need for investment in infrastructure, tools and technical expertise. Instead, dealers will be able to focus more on what they do best – engaging with their customers and expanding their business in our robust digital marketplace. In addition to these benefits, we believe TrueCar+ has the potential to significantly improve dealers’ efficiency with each deal. TrueCar+ rollout on track. As our testing, learning and expansion of the TrueCar+ pilot continues, we are on track for a commercial launch by the end of Q1. Our initial focus with TrueCar+ will be on having full market and brand coverage for new cars across Florida as well as a robust, statewide used car offering that includes both franchise and independent dealers, by the end of the second quarter. In subsequent quarters, we plan to scale TrueCar+ across the entire country, with a rapid rollout and nationwide inventory available for used vehicles and a state-by-state rollout for new vehicles that will eventually span all fifty states. We’ve spent years laying the groundwork for nationwide coverage for TrueCar+, which will be supported by our existing deal building product integration with several thousand dealers. This integration, which allows configured dealers to structure financed deals online, also supports payment integration.
Q4 2021 | Stockholder letter 6 As we scale TrueCar+, we will measure success differently. A successful two-sided auto marketplace requires a broad selection of inventory, enthusiastic dealers and satisfied consumers. The transformation of our business model will require us to have fitting success metrics for both sides of our marketplace. Given its transaction focus, helping dealers grow their new and used vehicle sales will be more relevant and impactful for TrueCar+ (and our business) than growing the number of dealers or rooftops. Our primary focus in this new model will be on having the right inventory available in our marketplace, growing revenue per dealer and ensuring a high level of satisfaction from the dealers and consumers who participate in TrueCar+. As a result, we will be tracking and measuring transaction volumes, Net Promoter Scores for dealers and consumers and overall monetization for this business, among other metrics. We anticipate many more opportunities for revenue and monetization as we develop our ecosystem of products and services in TrueCar+. It will take time to build scale and drive deal flow through TrueCar+, so we do not expect it to have a material impact on revenue in the near term. Regardless, we expect to have enough volume and insights by the second half of 2022 to articulate our growth plan for subsequent years. Strong early position in EVs. Having the right inventory across our core and TrueCar+ offerings also extends to electric vehicles (EV) and hybrids. We have already established a strong position in this growing category and are well-positioned to benefit from another secular trend that OEMs, dealers and consumers are clearly focused on. Based on TrueCar leads that can be attributed to unit sales at our dealers, consumers using TrueCar have purchased tens of thousands of new and used EVs and hybrid vehicles to date. The Biden administration recently provided a regulatory catalyst by setting the goal of having EVs make up half of cars and trucks sold in the U.S. by 2030, along with a subsequent plan to promote the deployment of charging stations. Even before this, OEMs like Ford, General Motors, Volkswagen, Nissan and others had announced plans for significant investment in EVs. We are preparing ourselves for the accelerating OEM side of this vehicle category and expect to continue to increase the selection of EVs in our marketplace. We have already created buying guides, rankings and research to help consumers identify the right EV for their needs in this growing segment.
Q4 2021 | Stockholder letter 7 In closing, TrueCar made great progress during 2021 in the midst of considerable macro headwinds that had an outsized effect on our business especially during the second half of 2021. We managed our business prudently, worked to strengthen our core business, particularly for used cars, and plan to have an expanded product portfolio to take to our dealer partners in 2022. At the same time, we are on track for the commercial launch of TrueCar+ during the first quarter in Florida and expect coverage for new and used cars across the entire state by the end of the second quarter. This will be followed with a broader rollout across the rest of the country in subsequent quarters. We see a significant opportunity ahead and will continue to invest throughout 2022. Our strong balance sheet provides us the flexibility to invest in TrueCar+ and other strategic initiatives that will put us in a stronger position to grow, particularly as market conditions recover. Michael Darrow President and CEO Jantoon Reigersman Chief Financial Officer
Q4 2021 | Stockholder letter 8 Technology and Product Updates During the fourth quarter, we continued to strengthen our core TrueCar offering and expand the capabilities offered in our TrueCar+ pilot ahead of a commercial launch planned for later in Q1. Pre-Qualification. During Q4 we expanded our TrueCar pre-qualification capability to include additional lenders that now enable more than 800,000 Vehicle Identification Numbers (VINs) to be prequalified before reaching the dealer. While expanding pre-qualification coverage was our initial goal after launching this service, we will seek to drive adoption and usage over the coming quarters. We believe that helping shoppers understand that they can get financing will help align consumer expectations with dealer financing capabilities and lead to better and more efficient outcomes. We have already seen positive early results for the approval rates and the deal terms consumers are experiencing with this offering. TrueCar+. During its ongoing pilot, we have steadily introduced new functionality within TrueCar+, taking a phased approach that allows us to carefully look at how consumers enter and exit the flow. This has given us valuable insights and feedback that has helped us identify areas of improvement. Some of the capabilities introduced thus far in TrueCar+ include vehicle discovery and online deal- building with participating dealer partners. We also added the ability for consumers to arrange for financing, add protection products and finalize their deal terms online with a dealer. At each phase, we were mindful of how the connection points between consumers and participating dealers were affected, and through an agile process, worked to deliver a great digital experience. In addition to new capabilities, we soon plan to connect relevant parts of our core TrueCar experience with TrueCar+ so that consumers browsing “TrueCar+ eligible” vehicles on our core TrueCar service will have the option to finalize the deal terms online. This is part of a wider effort to eventually bring our TrueCar+ and core TrueCar experiences into one consistent consumer experience. The technology and experiences introduced in our core TrueCar offering over the last several quarters will provide some of the underpinning for nationwide deployment of TrueCar+. As an example, in our core TrueCar offering, we have already completed rigorous payment configuration across several thousand dealers with our deal building product. Today this gives these dealers the ability to configure and structure financed deals online. As we scale TrueCar+, this base of payment configured TrueCar dealers will help us to move quickly while ensuring the deals consumers finalize online are the same as what they would see in dealers’ showrooms. We have also started to apply the insights gained from our TrueCar+ pilot back into our core solution, which, we believe, will result in a streamlined and enhanced shopping experience for consumers even if they prefer to finalize their deal at the dealership.
Q4 2021 | Stockholder letter 9 Partner Updates TrueCar’s partner channel remains a unique and strategic asset that is an important source of traffic and units. It also allows us to extend our reach to car buying audiences across a diverse set of industries and to tailor our offering to each group. Our current partnerships span the financial services, insurance, retail and publishing industries and the military community, among others, and we continue to identify ways to bring our auto-buying platform to new industries. Growth in Traffic. During the fourth quarter, traffic across our partner channel increased 17.3% from the year ago quarter. Partner channel units (new and used) declined 25.7% year over year in the fourth quarter, impacted by inventory constraints seen across the industry. For the full year 2021, traffic increased by 14.4% while units grew 3.3% from the previous year excluding USAA. Partnering With the Market Leader in Rideshare. The rideshare and delivery industry is a vertical which we believe TrueCar is uniquely positioned to provide best-in-class car buying and selling experiences. This is a large and growing industry with millions of drivers and riders logging billions of trips annually across the U.S. Given the increased use drivers place on their vehicles, relative to the average consumer, it is important for drivers to find reliable and cost-efficient vehicles at competitive prices. During Q4, we launched a partnership with Uber, the market leader in the rideshare and delivery platform industry, to provide Car Buying solutions to drivers using their platform.
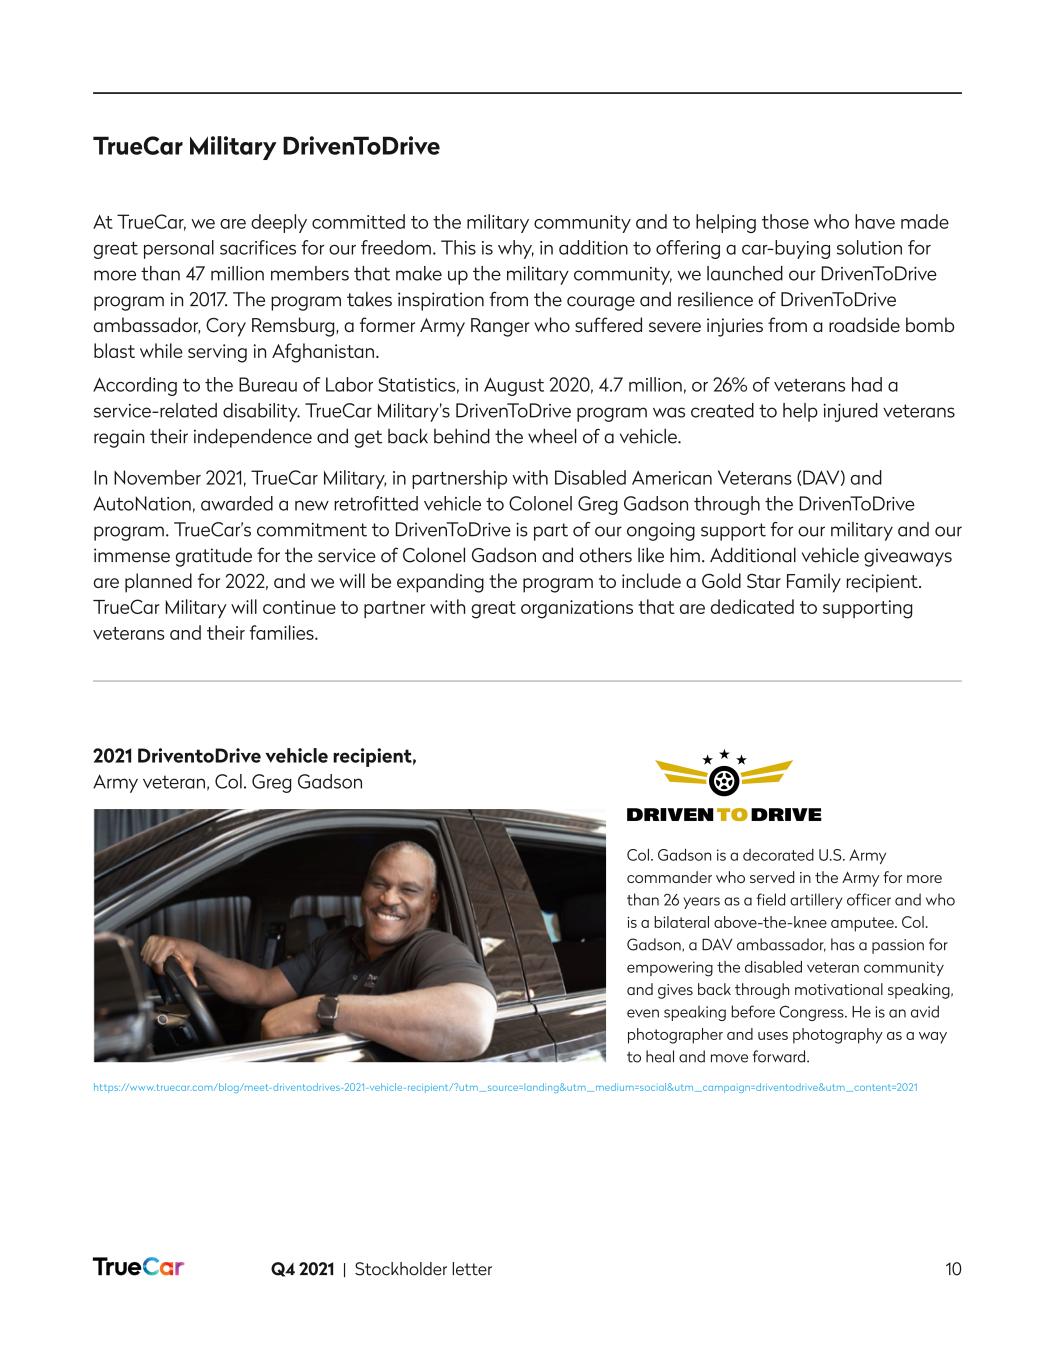
Q4 2021 | Stockholder letter 10 TrueCar Military DrivenToDrive At TrueCar, we are deeply committed to the military community and to helping those who have made great personal sacrifices for our freedom. This is why, in addition to offering a car-buying solution for more than 47 million members that make up the military community, we launched our DrivenToDrive program in 2017. The program takes inspiration from the courage and resilience of DrivenToDrive ambassador, Cory Remsburg, a former Army Ranger who suffered severe injuries from a roadside bomb blast while serving in Afghanistan. According to the Bureau of Labor Statistics, in August 2020, 4.7 million, or 26% of veterans had a service-related disability. TrueCar Military’s DrivenToDrive program was created to help injured veterans regain their independence and get back behind the wheel of a vehicle. In November 2021, TrueCar Military, in partnership with Disabled American Veterans (DAV) and AutoNation, awarded a new retrofitted vehicle to Colonel Greg Gadson through the DrivenToDrive program. TrueCar’s commitment to DrivenToDrive is part of our ongoing support for our military and our immense gratitude for the service of Colonel Gadson and others like him. Additional vehicle giveaways are planned for 2022, and we will be expanding the program to include a Gold Star Family recipient. TrueCar Military will continue to partner with great organizations that are dedicated to supporting veterans and their families. 2021 DriventoDrive vehicle recipient, Army veteran, Col. Greg Gadson Col. Gadson is a decorated U.S. Army commander who served in the Army for more than 26 years as a field artillery officer and who is a bilateral above-the-knee amputee. Col. Gadson, a DAV ambassador, has a passion for empowering the disabled veteran community and gives back through motivational speaking, even speaking before Congress. He is an avid photographer and uses photography as a way to heal and move forward. https://www.truecar.com/blog/meet-driventodrives-2021-vehicle-recipient/?utm_source=landing&utm_medium=social&utm_campaign=driventodrive&utm_content=2021
Q4 2021 | Stockholder letter 11 Diversity, Equity and Inclusion at TrueCar - a review of 2021 TrueCar is committed to cultivating diversity, equity and inclusion (“DEI”) for our employees, consumers and partners. We believe that DEI has a positive impact on how we operate as a business, on our employees and on the broader community. We believe that diversity allows us to build a deeper understanding of our consumers and partners and drives innovation in our products. Our inclusion efforts are intended to create a sense of belonging for our employees, consumers, dealers and partners. We are guided in this pursuit by our values — in particular, to be empathetic, optimistic, and empowering. We aspire to integrate DEI into our corporate strategy, so that it becomes a lens through which we make decisions. During 2021, we sought to establish a strong foundation for future DEI efforts and to provide opportunities for our employees to connect, build community and celebrate our diversity. After a thorough assessment of DEI at TrueCar with an external consulting firm, we defined several key areas through which we will elevate DEI across our company: Executive Leadership: To help our leadership team lead the way forward, we’ve launched programs to help build greater fluency in DEI topics and strengthen our executive team’s skills in discussing DEI with each other, with their teams and more broadly. People Programs: These critical programs span attracting new talent and the employee lifecycle at TrueCar. In 2021, we added a Senior DEI Program Manager to lead and manage our internal DEI programs. In addition to this, we invested in learning and development opportunities for our People team to build their fluency and capability as a function. We also evaluated our benefits plans and began a refresh of our employee handbook to ensure equity among guidelines and inclusive & safe standards that will be launched during 2022. Connection, Community and Celebration: During 2021, we encouraged our team members to celebrate our diversity by delivering internal & external experiences for: Black History Month, Women’s History Month, Asian American & Pacific Islander Month, Jewish American Heritage Month, Pride Month, and Hispanic/Latinx Heritage Month. Individuals from across TrueCar came together to make each of these months unique with a balance of celebration, deeper insight, reflection and growth. Communications: Having consistent and clear messaging on what we are doing and why we are doing it will be critical as we further integrate DEI into our corporate ecosystem. We plan to invest more in this area in 2022.
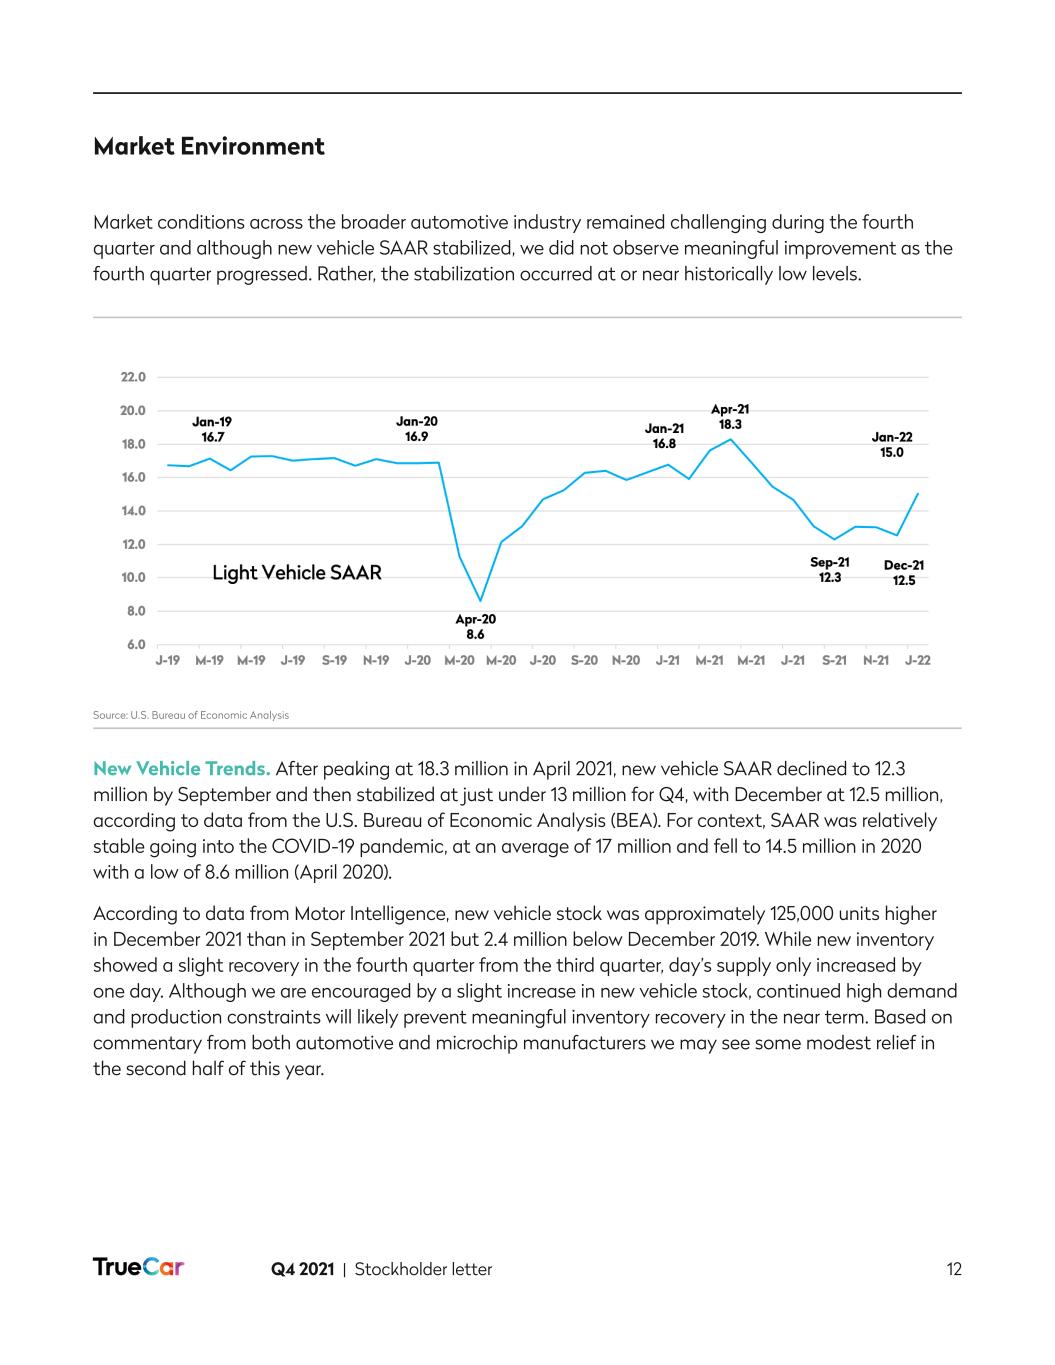
Q4 2021 | Stockholder letter 12 Market Environment Market conditions across the broader automotive industry remained challenging during the fourth quarter and although new vehicle SAAR stabilized, we did not observe meaningful improvement as the fourth quarter progressed. Rather, the stabilization occurred at or near historically low levels. New Vehicle Trends. After peaking at 18.3 million in April 2021, new vehicle SAAR declined to 12.3 million by September and then stabilized at just under 13 million for Q4, with December at 12.5 million, according to data from the U.S. Bureau of Economic Analysis (BEA). For context, SAAR was relatively stable going into the COVID-19 pandemic, at an average of 17 million and fell to 14.5 million in 2020 with a low of 8.6 million (April 2020). According to data from Motor Intelligence, new vehicle stock was approximately 125,000 units higher in December 2021 than in September 2021 but 2.4 million below December 2019. While new inventory showed a slight recovery in the fourth quarter from the third quarter, day’s supply only increased by one day. Although we are encouraged by a slight increase in new vehicle stock, continued high demand and production constraints will likely prevent meaningful inventory recovery in the near term. Based on commentary from both automotive and microchip manufacturers we may see some modest relief in the second half of this year. Source: U.S. Bureau of Economic Analysis
Q4 2021 | Stockholder letter 13 OEMs. OEMs have responded to the shortage in microchips by shifting production towards higher margin vehicles and in some cases, removing content that is deemed non-essential. For the medium to longer term, OEMs are also taking steps to better secure supplies of microchips. With continued low supply of new vehicles, OEMs have also reduced marketing. Based on our analysis, incentives in particular were down 50% in Q4 across the industry, when compared to the prior year. In addition to lower incentives, more than 60% of vehicles sold above MSRP in Q4. Pre-Owned Vehicles. Vehicle scarcity is also evident in the pre-owned market, although to a far lesser extent than for new vehicles. Short supply has resulted in a continued upward trajectory of used list prices albeit at a slower rate than we saw during the Spring and Summer of 2021. We continue to see strong demand and ongoing competition among dealers for available pre-owned stock. Demand for both new and used vehicles and corresponding supply remained at an imbalance in Q4, driving prices higher for both categories. The average new vehicle list price increased over nine thousand dollars or 25% in Q4 compared to the prior year, according to our analysis. Used prices were up slightly less in absolute dollars at over eight thousand dollars but more as a percentage, up 34%. We saw some signs of consumer demand moderating in the face of elevated pricing during Q4 in terms of slightly lower new vehicle scarcity levels as measured by the number of prospects per listing. By this measure, scarcity for new vehicles peaked in October and then declined. Aside from supporting higher pricing, the imbalance between vehicle inventories and demand continues to have a dampening effect on marketing spend by dealers. Collectively, these market trends, which we have been calling out for the past two quarters, continued to cause headwinds for our business, which is reflected in close rates and reported units as we note in the financial discussion that follows. As we began 2022, January SAAR was 15 million, according to the BEA, as compared to 12.5 million in December 2021 and 16.8 million in January 2021. TrueCar estimates full year 2022 sales at 15.4 million, reflecting little change in the macro environment in 2022, particularly during the first half, until inventories start to rebuild meaningfully. We will continue to stay connected to our dealers and OEMs and manage our business prudently as we invest for the future and help our dealers and industry partners lean into the digital channel.
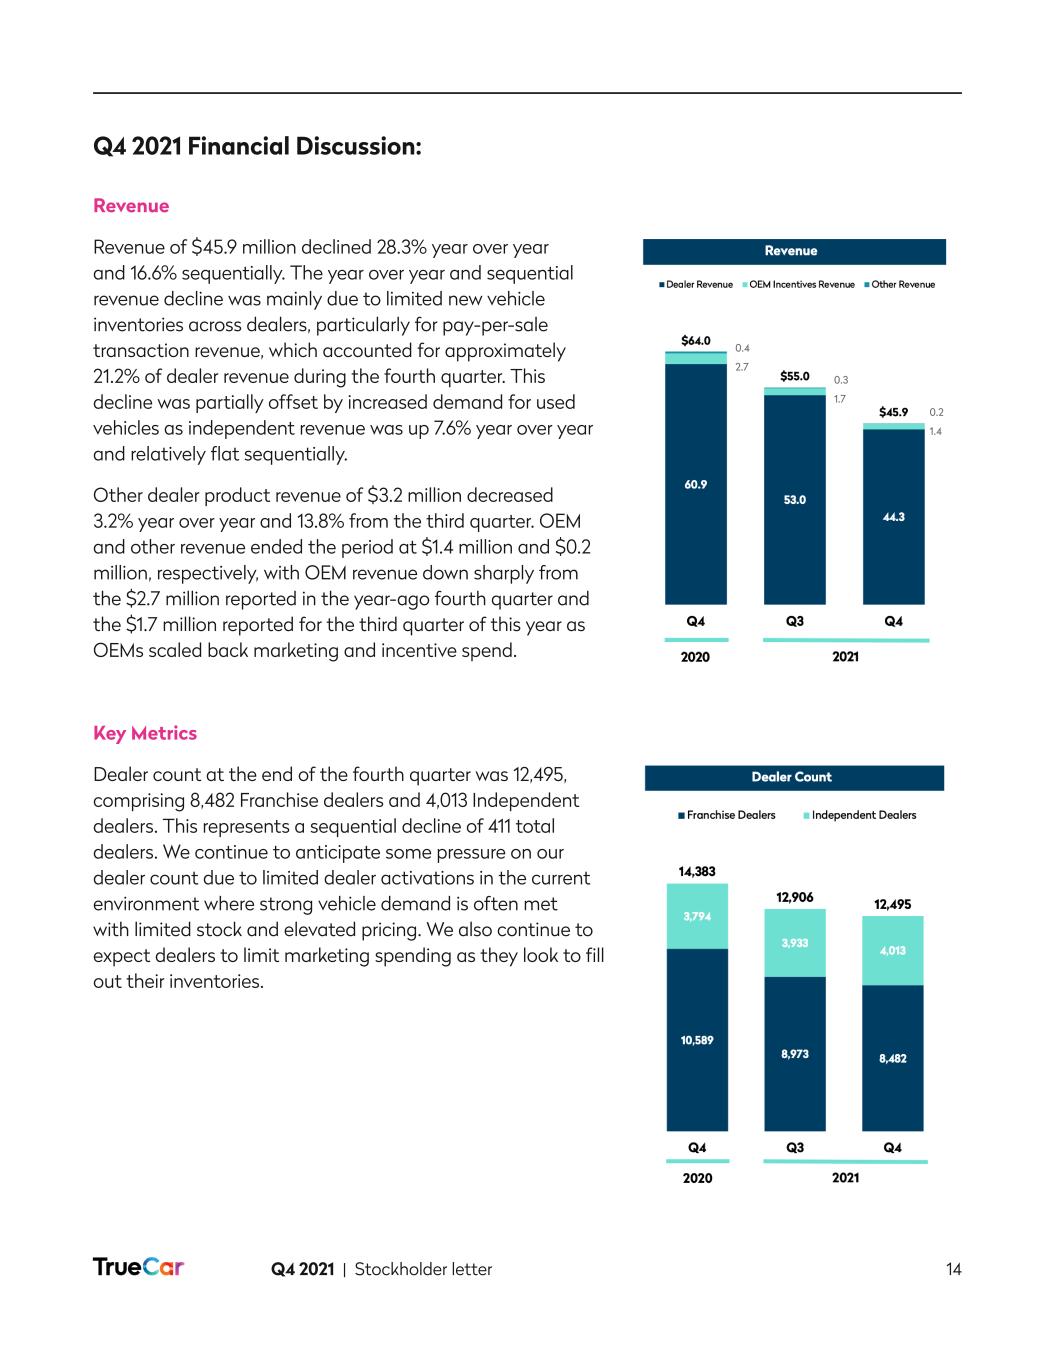
Q4 2021 | Stockholder letter 14 Q4 2021 Financial Discussion: Revenue Revenue of $45.9 million declined 28.3% year over year and 16.6% sequentially. The year over year and sequential revenue decline was mainly due to limited new vehicle inventories across dealers, particularly for pay-per-sale transaction revenue, which accounted for approximately 21.2% of dealer revenue during the fourth quarter. This decline was partially offset by increased demand for used vehicles as independent revenue was up 7.6% year over year and relatively flat sequentially. Other dealer product revenue of $3.2 million decreased 3.2% year over year and 13.8% from the third quarter. OEM and other revenue ended the period at $1.4 million and $0.2 million, respectively, with OEM revenue down sharply from the $2.7 million reported in the year-ago fourth quarter and the $1.7 million reported for the third quarter of this year as OEMs scaled back marketing and incentive spend. Key Metrics Dealer count at the end of the fourth quarter was 12,495, comprising 8,482 Franchise dealers and 4,013 Independent dealers. This represents a sequential decline of 411 total dealers. We continue to anticipate some pressure on our dealer count due to limited dealer activations in the current environment where strong vehicle demand is often met with limited stock and elevated pricing. We also continue to expect dealers to limit marketing spending as they look to fill out their inventories. 0.4 2.7 0.3 1.7 0.2 1.4
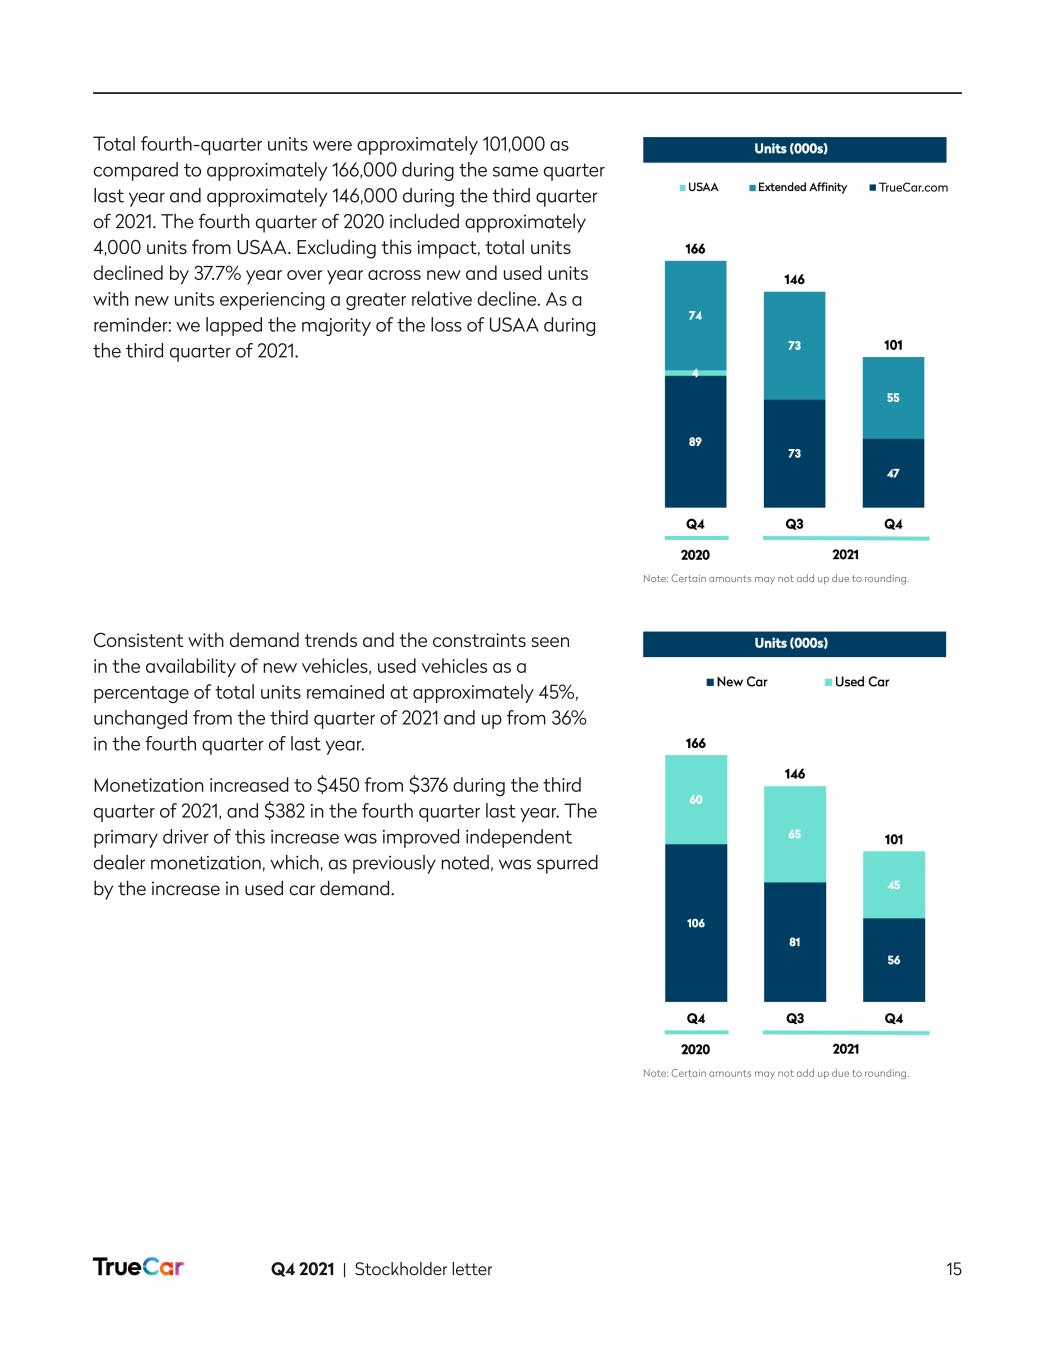
Q4 2021 | Stockholder letter 15 Total fourth-quarter units were approximately 101,000 as compared to approximately 166,000 during the same quarter last year and approximately 146,000 during the third quarter of 2021. The fourth quarter of 2020 included approximately 4,000 units from USAA. Excluding this impact, total units declined by 37.7% year over year across new and used units with new units experiencing a greater relative decline. As a reminder: we lapped the majority of the loss of USAA during the third quarter of 2021. Consistent with demand trends and the constraints seen in the availability of new vehicles, used vehicles as a percentage of total units remained at approximately 45%, unchanged from the third quarter of 2021 and up from 36% in the fourth quarter of last year. Monetization increased to $450 from $376 during the third quarter of 2021, and $382 in the fourth quarter last year. The primary driver of this increase was improved independent dealer monetization, which, as previously noted, was spurred by the increase in used car demand. Note: Certain amounts may not add up due to rounding. Note: Certain amounts may not add up due to rounding. TrueCar.com
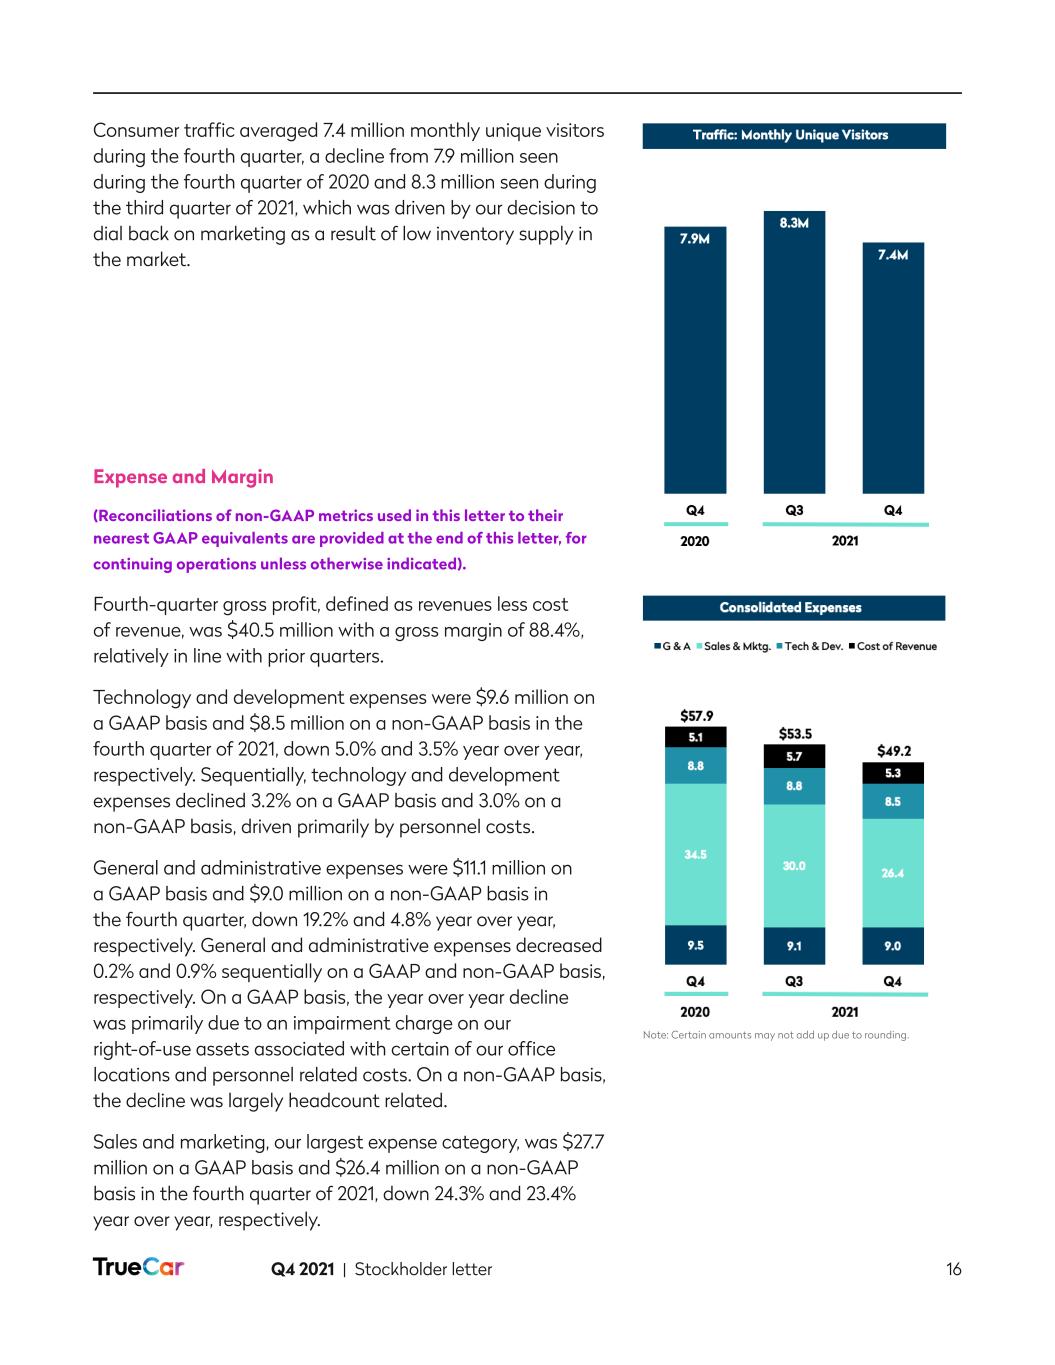
Q4 2021 | Stockholder letter 16 Consumer traffic averaged 7.4 million monthly unique visitors during the fourth quarter, a decline from 7.9 million seen during the fourth quarter of 2020 and 8.3 million seen during the third quarter of 2021, which was driven by our decision to dial back on marketing as a result of low inventory supply in the market. Expense and Margin (Reconciliations of non-GAAP metrics used in this letter to their nearest GAAP equivalents are provided at the end of this letter, for continuing operations unless otherwise indicated). Fourth-quarter gross profit, defined as revenues less cost of revenue, was $40.5 million with a gross margin of 88.4%, relatively in line with prior quarters. Technology and development expenses were $9.6 million on a GAAP basis and $8.5 million on a non-GAAP basis in the fourth quarter of 2021, down 5.0% and 3.5% year over year, respectively. Sequentially, technology and development expenses declined 3.2% on a GAAP basis and 3.0% on a non-GAAP basis, driven primarily by personnel costs. General and administrative expenses were $11.1 million on a GAAP basis and $9.0 million on a non-GAAP basis in the fourth quarter, down 19.2% and 4.8% year over year, respectively. General and administrative expenses decreased 0.2% and 0.9% sequentially on a GAAP and non-GAAP basis, respectively. On a GAAP basis, the year over year decline was primarily due to an impairment charge on our right-of-use assets associated with certain of our office locations and personnel related costs. On a non-GAAP basis, the decline was largely headcount related. Sales and marketing, our largest expense category, was $27.7 million on a GAAP basis and $26.4 million on a non-GAAP basis in the fourth quarter of 2021, down 24.3% and 23.4% year over year, respectively. Note: Certain amounts may not add up due to rounding.
Q4 2021 | Stockholder letter 17 Sequentially, sales and marketing expenses were down 11.4% and 11.7% on a GAAP and non-GAAP basis, respectively. The declines year over year and sequentially are reflective of our efforts to manage our sales and marketing expenses in response to the macro-related inventory shortages. Within sales and marketing expense, TrueCar.com acquisition expense was $7.6 million, down from $13.3 million in the year-ago fourth quarter and down approximately 22.5%, sequentially. Cost per sale for TrueCar.com units was $164, up 9.9% year over year and up 21.3% sequentially. Partner marketing spend was $8.9 million in the fourth quarter down 11.3% year over year and down 11.4% on a quarter over quarter basis. Finally, headcount and other marketing expenses were $9.9 million, down 11.8% year over year and down 1.5% sequentially, primarily due to timing of attrition and recruiting backfill. In summary, amid challenging market conditions that persisted during the fourth quarter, we managed our business prudently, by scaling back our sales and marketing spending while continuing to invest in strategic initiatives to position us to benefit as market conditions improve. Balance sheet We ended the fourth quarter and full year 2021 with approximately $245 million in cash and equivalents, as compared to $273.3 million at the end of the fourth quarter and full year 2020 and $250.7 million after the third quarter of 2021. We continue to have no debt. Outlook: There remains considerable uncertainty across the automotive market due to global supply chain issues, particularly for new vehicles. While we are starting to see slight growth in new vehicle inventories across the industry, inventory levels are still well below industry norms. As a result, we continue to expect pressure on new vehicle retail volumes until improvements become more meaningful. We also anticipate some lag before vehicle pricing starts to reflect any improvements in inventories. This likely means that our close rates and reported units will trail improvements in inventory and pricing trends for the broader auto industry. Finally, while the trend in dealer counts for January also points to stabilization, this metric may still fluctuate month to month. Due to these factors, we are not providing quarterly guidance. We will continue to invest in TrueCar+ throughout 2022 as well as other strategic initiatives that, we believe, will position us for future growth and increased monetization. As a result, we expect Adjusted EBITDA to be negative during 2022.
Q4 2021 | Stockholder letter 18 Live Call and Webcast Details TrueCar’s management will host a call to discuss fourth- quarter financial results on Wednesday, February 23, 2022 at 9:00 a.m. Eastern Time. A live webcast of the call can be accessed from the Investor Relations section of our website and by using this link. Investors and analysts can also participate in the call by dialing 1-877-870-4263 (domestic) or 1-412-317-0790 (international). An archived replay of the call will be available upon completion on the Investor Relations section of our website at ir.truecar.com. TrueCar has used and intends to continue to use its Investor Relations website (ir.truecar.com), LinkedIn (https://www.linkedin.com/company/truecar-inc-), Twitter (@TrueCar) and Facebook (www.facebook.com/TrueCar) as means of disclosing material non-public information and for complying with our disclosure obligations under Regulation FD. About TrueCar TrueCar is a leading automotive digital marketplace that enables auto buyers to connect to our nationwide network of Certified Dealers. We are building the industry’s most personalized and efficient auto buying experience as we seek to bring more of the purchasing process online. Consumers who visit our marketplace will find a suite of vehicle discovery tools, price ratings and market context on new and used cars – all with a clear view of what’s a great deal. When they are ready, TrueCar will enable them to connect with a local Certified Dealer who shares in our belief that truth, transparency and fairness are the foundation of a great auto buying experience. As part of our marketplace, TrueCar powers auto-buying programs for over 250 leading brands, including AARP, Sam’s Club, Navy Federal Credit Union and American Express. TrueCar is headquartered in Santa Monica, California, with an office in Austin, Texas. Investor relations: Zaineb Bokhari VP, Investor Relations investors@truecar.com Media: TrueCar media line: +1-844-469-8442 (US toll-free) pr@truecar.com

Q4 2021 | Stockholder letter 19 Forward-Looking Statements This document contains forward-looking statements. All statements contained herein other than statements of historical fact are forward-looking statements, including statements regarding future Adjusted EBITDA, TrueCar+ and our pre-qualification, home delivery and “Sell Your Car” experience solutions, our opportunities for revenue and monetization, or partnering arrangements, including those with Navy Federal Credit Union and OEMs, our plans to bring our core TrueCar and our TrueCar+ experiences into one consistent consumer experience, our dealer marketing spend, the expansion of the EV market, and the macro environment, including automobile inventory levels. These forward-looking statements are subject to a number of risks, uncertainties and assumptions that may prove incorrect, any of which could cause our results to differ materially from those expressed or implied by such forward-looking statements, and include, among others, those risks and uncertainties described under the heading “Risk Factors” in our Quarterly Reports on Form 10-Q for the quarters ended March 31, 2021, June 30, 2021 and September 30, 2021 filed with the Securities and Exchange Commission, or SEC, and our Annual Report on Form 10-K for the year ended December 31, 2021 to be filed with the SEC. Moreover, we operate in a very competitive and rapidly changing environment. New risks emerge from time to time. It is not possible for our management to predict all risks, nor can management assess the impact of all factors on our business or the extent to which any factor, or combination of factors, may cause actual results to differ materially from those contained in any forward- looking statements we may make. All forward-looking statements in this press release are based on information available to our management as of the date of this press release and except as required by law; management assumes no obligation to update those forward-looking statements, which speak only as of their respective dates. Use of Non-GAAP Financial Measures This document includes the following Non-GAAP financial measure: Adjusted EBITDA. We define Adjusted EBITDA as net income (loss) adjusted to exclude interest income, depreciation and amortization, stock-based compensation, loss from equity method investment including impairment charges, certain litigation costs, certain restructuring costs, changes in the fair value of contingent consideration, goodwill impairment, other expense (income), impairment of lease right-of-use assets, and income taxes. We have provided below a reconciliation of Adjusted EBITDA to net loss, the most directly comparable GAAP financial measure. Adjusted EBITDA should not be considered as an alternative to net loss or any other measure of financial performance calculated and presented in accordance with GAAP. We use Adjusted EBITDA as an operating performance measure because it is (i) an integral part of our reporting and planning processes; (ii) used by our management and board of directors to assess our operational performance, and together with operational objectives, as a measure in evaluating employee compensation and bonuses; and (iii) used by our management to make financial and strategic planning decisions regarding future operating investments. We believe that using Adjusted EBITDA facilitates operating performance comparisons on a period-to-period basis because it excludes variations primarily caused by changes in the excluded items noted above. In addition, we believe that Adjusted EBITDA and similar measures are widely used by investors, securities analysts, rating agencies and other parties in evaluating companies as measures of financial performance and debt service capabilities.
Q4 2021 | Stockholder letter 20 Our use of Adjusted EBITDA has limitations as an analytical tool, and you should not consider it in isolation or as a substitute for analysis of our results as reported under GAAP. Some of these limitations are: • Adjusted EBITDA does not reflect the payment or receipt of interest or the payment of income taxes; • Adjusted EBITDA does not reflect changes in, or cash requirements for, our working capital needs; • although depreciation and amortization are non-cash charges, the assets being depreciated and amortized may have to be replaced in the future, and Adjusted EBITDA does not reflect cash capital expenditure requirements for such replacements or for new capital expenditures or any other contractual commitments; • Adjusted EBITDA does not reflect the legal, accounting, consulting and other third-party fees and costs that we incurred in connection with the evaluation and negotiation of potential merger and acquisition transactions; • Adjusted EBITDA does not reflect the costs to advance our claims in certain litigation or the costs to defend ourselves in various complaints filed against us; • Adjusted EBITDA does not reflect the severance charges associated with restructuring plans; • Adjusted EBITDA does not reflect the impairment charges on our right-of-use assets associated with subleasing; • Adjusted EBITDA does not consider the potentially dilutive impact of shares issued or to be issued in connection with stock-based compensation; and • other companies, including companies in our own industry, may calculate Adjusted EBITDA differently than we do, limiting its usefulness as a comparative measure. Because of these limitations, you should consider Adjusted EBITDA alongside other financial performance measures, including our net loss, our other GAAP results and various cash flow metrics. In addition, in evaluating Adjusted EBITDA, you should be aware that in the future we will incur expenses such as those that are the subject of adjustments in deriving Adjusted EBITDA and you should not infer from our presentation of Adjusted EBITDA that our future results will not be affected by these expenses or any unusual or non-recurring items.
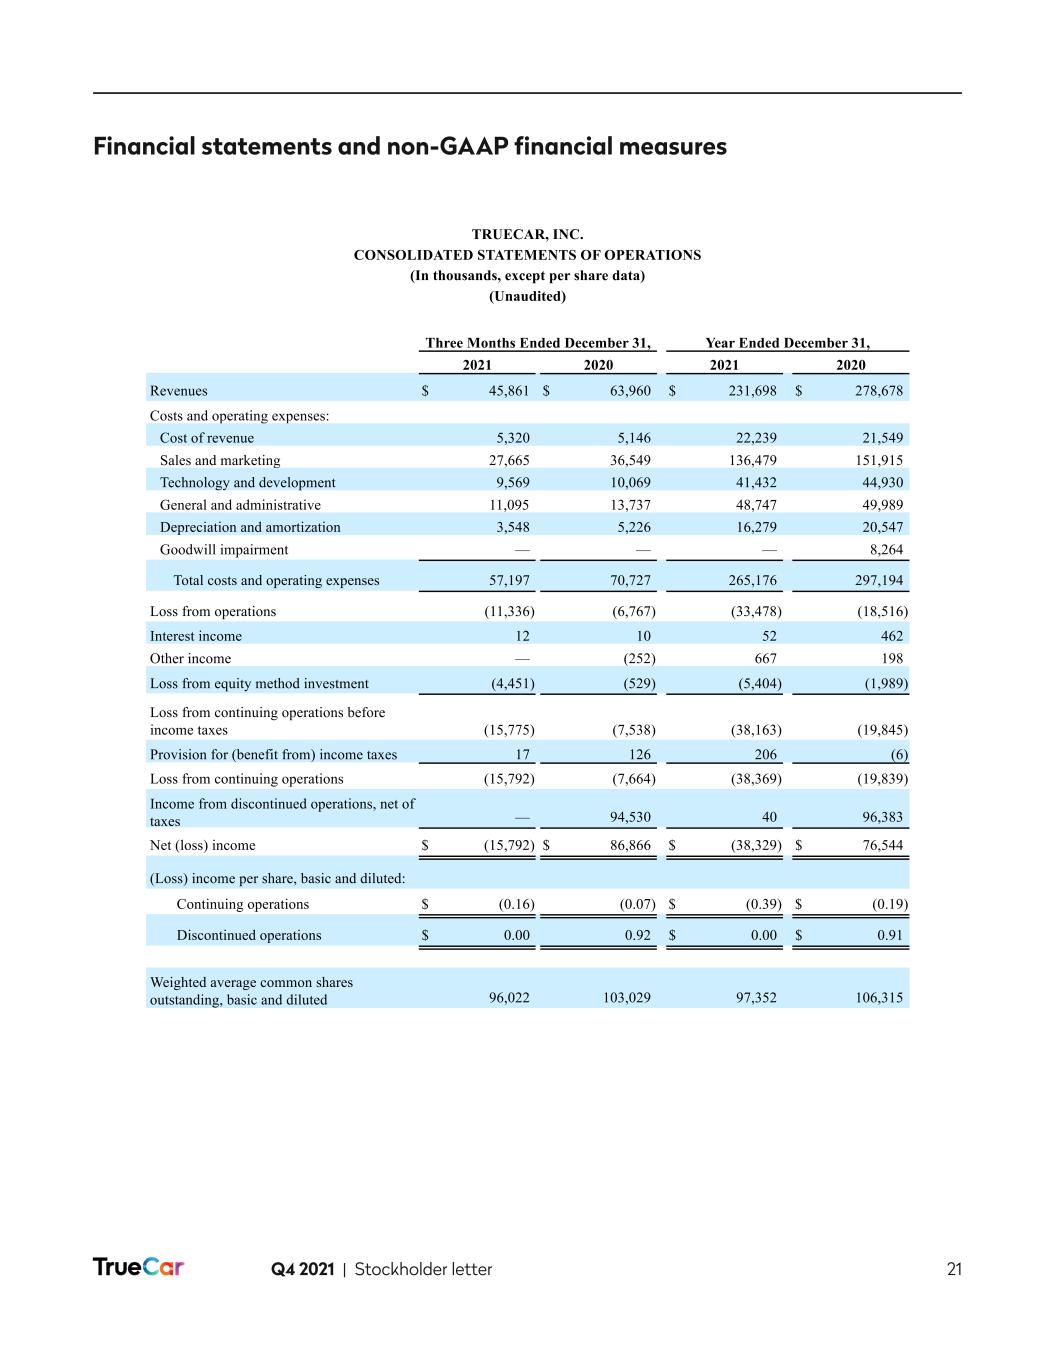
Q4 2021 | Stockholder letter 21 Financial statements and non-GAAP financial measures 1 TRUECAR, INC. CONSOLIDATED STATEMENTS OF OPERATIONS (In thousands, except per share data) (Unaudited) Three Months Ended December 31, Year Ended December 31, 2021 2020 2021 2020 Revenues $ 45,861 $ 63,960 $ 231,698 $ 278,678 Costs and operating expenses: Cost of revenue 5,320 5,146 22,239 21,549 Sales and marketing 27,665 36,549 136,479 151,915 Technology and development 9,569 10,069 41,432 44,930 General and administrative 11,095 13,737 48,747 49,989 Depreciation and amortization 3,548 5,226 16,279 20,547 Goodwill impairment — — — 8,264 Total costs and operating expenses 57,197 70,727 265,176 297,194 Loss from operations (11,336) (6,767) (33,478) (18,516) Interest income 12 10 52 462 Other income — (252) 667 198 Loss from equity method investment (4,451) (529) (5,404) (1,989) Loss from continuing operations before income taxes (15,775) (7,538) (38,163) (19,845) Provision for (benefit from) income taxes 17 126 206 (6) Loss from continuing operations (15,792) (7,664) (38,369) (19,839) Income from discontinued operations, net of taxes — 94,530 40 96,383 Net (loss) income $ (15,792) $ 86,866 $ (38,329) $ 76,544 (Loss) income per share, basic and diluted: Continuing operations $ (0.16) (0.07) $ (0.39) $ (0.19) Discontinued operations $ 0.00 0.92 $ 0.00 $ 0.91 Weighted average common shares outstanding, basic and diluted 96,022 103,029 97,352 106,315
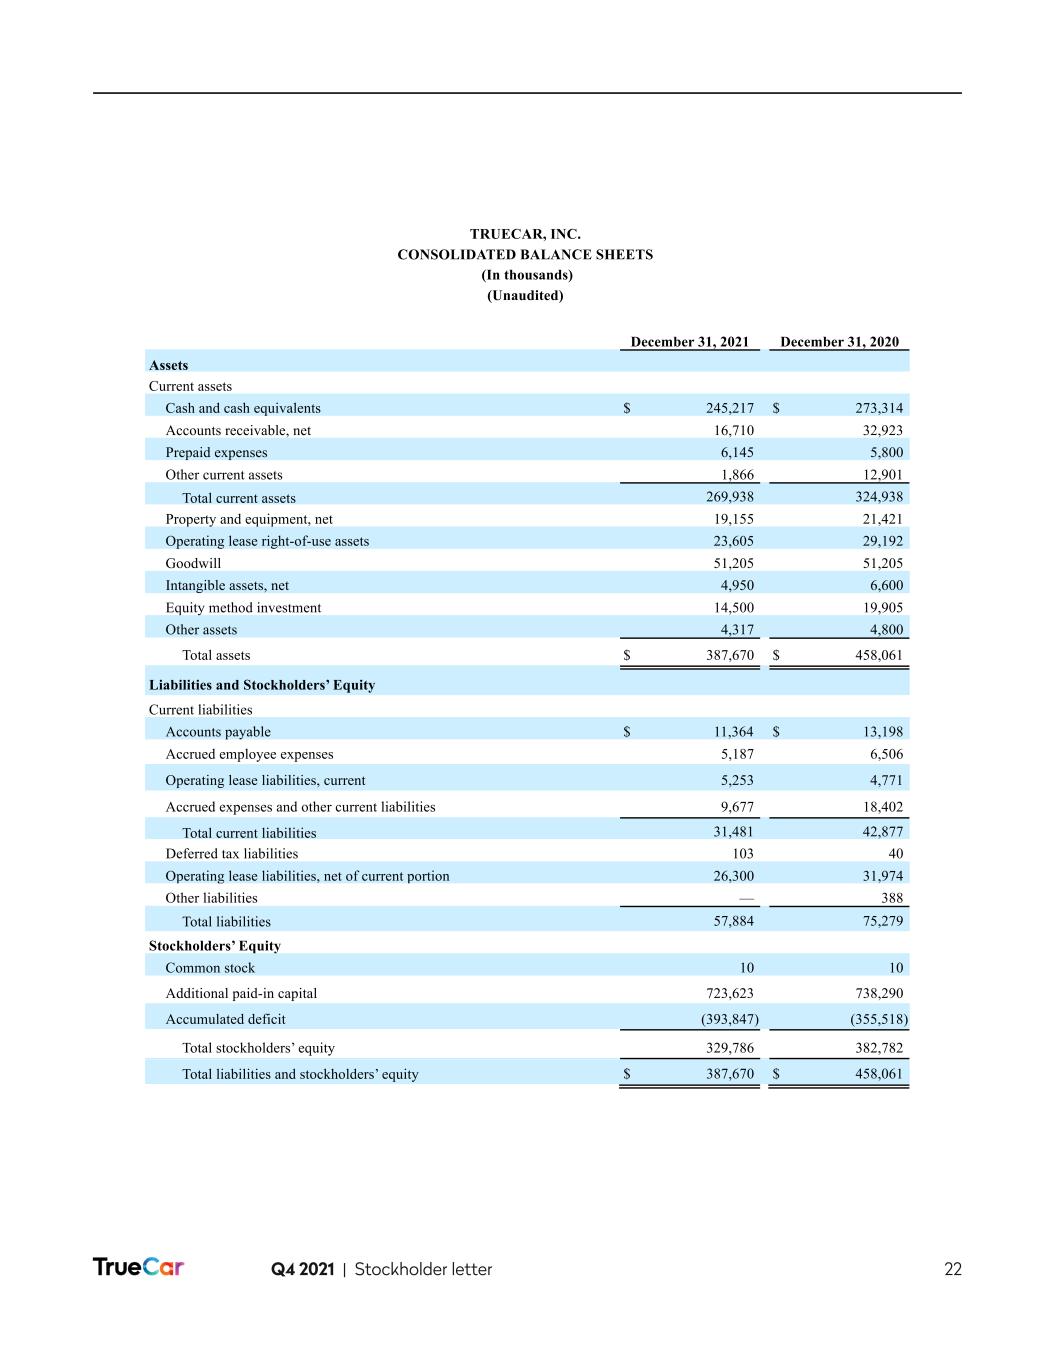
Q4 2021 | Stockholder letter 22 2 TRUECAR, INC. CONSOLIDATED BALANCE SHEETS (In thousands) (Unaudited) December 31, 2021 December 31, 2020 Assets Current assets Cash and cash equivalents $ 245,217 $ 273,314 Accounts receivable, net 16,710 32,923 Prepaid expenses 6,145 5,800 Other current assets 1,866 12,901 Total current assets 269,938 324,938 Property and equipment, net 19,155 21,421 Operating lease right-of-use assets 23,605 29,192 Goodwill 51,205 51,205 Intangible assets, net 4,950 6,600 Equity method investment 14,500 19,905 Other assets 4,317 4,800 Total assets $ 387,670 $ 458,061 Liabilities and Stockholders’ Equity Current liabilities Accounts payable $ 11,364 $ 13,198 Accrued employee expenses 5,187 6,506 Operating lease liabilities, current 5,253 4,771 Accrued expenses and other current liabilities 9,677 18,402 Total current liabilities 31,481 42,877 Deferred tax liabilities 103 40 Operating lease liabilities, net of current portion 26,300 31,974 Other liabilities — 388 Total liabilities 57,884 75,279 Stockholders’ Equity Common stock 10 10 Additional paid-in capital 723,623 738,290 Accumulated deficit (393,847) (355,518) Total stockholders’ equity 329,786 382,782 Total liabilities and stockholders’ equity $ 387,670 $ 458,061
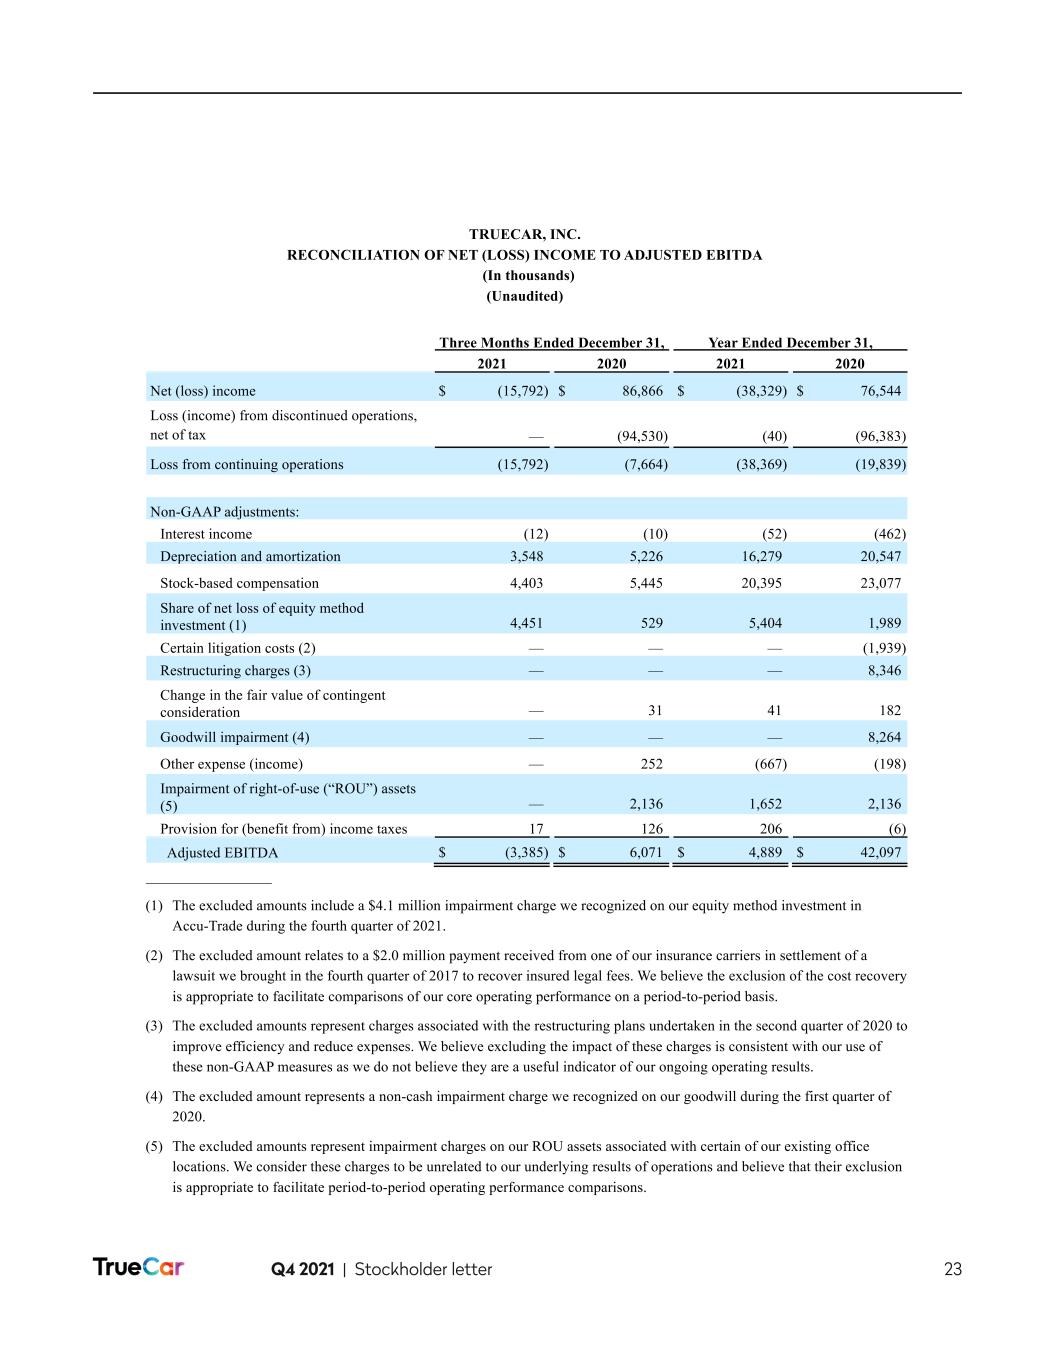
Q4 2021 | Stockholder letter 23 3 TRUECAR, INC. RECONCILIATION OF NET (LOSS) INCOME TO ADJUSTED EBITDA (In thousands) (Unaudited) Three Months Ended December 31, Year Ended December 31, 2021 2020 2021 2020 Net (loss) income $ (15,792) $ 86,866 $ (38,329) $ 76,544 Loss (income) from discontinued operations, net of tax — (94,530) (40) (96,383) Loss from continuing operations (15,792) (7,664) (38,369) (19,839) Non-GAAP adjustments: Interest income (12) (10) (52) (462) Depreciation and amortization 3,548 5,226 16,279 20,547 Stock-based compensation 4,403 5,445 20,395 23,077 Share of net loss of equity method investment (1) 4,451 529 5,404 1,989 Certain litigation costs (2) — — — (1,939) Restructuring charges (3) — — — 8,346 Change in the fair value of contingent consideration — 31 41 182 Goodwill impairment (4) — — — 8,264 Other expense (income) — 252 (667) (198) Impairment of right-of-use (“ROU”) assets (5) — 2,136 1,652 2,136 Provision for (benefit from) income taxes 17 126 206 (6) Adjusted EBITDA $ (3,385) $ 6,071 $ 4,889 $ 42,097 _________________ (1) The excluded amounts include a $4.1 million impairment charge we recognized on our equity method investment in Accu-Trade during the fourth quarter of 2021. (2) The excluded amount relates to a $2.0 million payment received from one of our insurance carriers in settlement of a lawsuit we brought in the fourth quarter of 2017 to recover insured legal fees. We believe the exclusion of the cost recovery is appropriate to facilitate comparisons of our core operating performance on a period-to-period basis. (3) The excluded amounts represent charges associated with the restructuring plans undertaken in the second quarter of 2020 to improve efficiency and reduce expenses. We believe excluding the impact of these charges is consistent with our use of these non-GAAP measures as we do not believe they are a useful indicator of our ongoing operating results. (4) The excluded amount represents a non-cash impairment charge we recognized on our goodwill during the first quarter of 2020. (5) The excluded amounts represent impairment charges on our ROU assets associated with certain of our existing office locations. We consider these charges to be unrelated to our underlying results of operations and believe that their exclusion is appropriate to facilitate period-to-period operating performance comparisons.

Q4 2021 | Stockholder letter 24 4 TRUECAR, INC. RECONCILIATION OF GAAP EXPENSES TO NON-GAAP EXPENSES (In thousands) (Unaudited) Three Months Ended December 31, 2021 September 30, 2021 December 31, 2020 Cost of revenue, as reported $ 5,320 $ 5,715 $ 5,146 Stock-based compensation 46 44 93 Non-GAAP cost of revenue $ 5,274 $ 5,671 $ 5,053 Sales and marketing, as reported $ 27,665 $ 31,239 $ 36,549 Stock-based compensation 1,216 1,271 2,002 Non-GAAP sales and marketing $ 26,449 $ 29,968 $ 34,547 Technology and development, as reported $ 9,569 $ 9,890 $ 10,069 Stock-based compensation 1,044 1,098 1,236 Non-GAAP technology and development $ 8,525 $ 8,792 $ 8,833 General and administrative, as reported $ 11,095 $ 11,121 $ 13,737 Stock-based compensation 2,097 2,037 2,114 Impairment of ROU assets (1) — — 2,136 Change in the fair value of contingent consideration — — 31 Non-GAAP general and administrative $ 8,998 $ 9,084 $ 9,456 _________________ (1) The excluded amount represents an impairment charge on our ROU assets associated with certain of our existing office locations. We consider this charge to be unrelated to our underlying results of operations and believe that its exclusion is appropriate to facilitate period-to-period operating performance comparisons. 4 TRUECAR, INC. RECONCILIATION OF GAAP EXPENSES TO NON-GAAP EXPENSES (In thousands) (Unaudited) Three Months Ended December 31, 2021 September 30, 2021 December 31, 2020 Cost of revenue, as reported $ 5,320 $ 5,715 $ 5,146 Stock-based compensation 46 44 93 Non-GAAP cost of revenue 5,274 5,671 5,053 Sales and marketing, as reported $ 27,665 31,239 $ 36,549 Stock-based compensation 1,216 1,271 2,002 Non-GAAP sales and marketing 26,449 29,968 34,547 Technology and development, as reported $ 9,569 $ 9,890 $ 10,069 Stock-based compensation 1,044 1,098 1,236 Non-GAAP technology and development $ 8,525 $ 8,792 $ 8,833 General and administrative, as reported $ 11,095 $ 11,121 $ 13,737 Stock-based compensation 2,097 2,037 2,114 Impairment of ROU assets (1) — — 2,136 Change in the fair value of contingent consideration — — 31 Non-GAAP general and administrative $ 8,998 $ 9,084 $ 9,456 _________________ (1) The excluded amount represents an impairment charge on our ROU assets associated with certain of our existing office locations. We consider this charge to be unrelated to our underlying results of operations and believe that its exclusion is appropriate to facilitate period-to-period operating performance comparisons.

Thank You


