
Third Quarter 2024 Conference Call

Safe Harbor 2 Statements in this presentation regarding our expectations and beliefs about our future financial performance and financial condition, as well as trends in our business and markets are “forward-looking statements” as defined in the Private Securities Litigation Reform Act of 1995. Forward- looking statements often include words such as “believe,” “expect,” “anticipate,” “intend,” “plan,” “estimate,” “project,” “position,” “outlook,” or words of similar meaning, or future or conditional verbs such as “will,” “would,” “should,” “opportunity,” “could,” or “may.” The forward-looking statements in this presentation are based on current information and on assumptions that we make about future events and circumstances that are subject to a number of risks and uncertainties that are often difficult to predict and beyond our control. As a result of those risks and uncertainties, our actual financial results in the future could differ, possibly materially, from those expressed in or implied by the forward-looking statements contained in this presentation and could cause us to make changes to our future plans. Those risks and uncertainties include, without limitation, the lack of soundness of other financial institutions or financial market utilities may adversely affect the Company; the Company’s ability to engage in routine funding and other transactions could be adversely affected by the actions and commercial soundness of other financial institutions; financial institutions are interrelated because of trading, clearing, counterparty or other relationships; defaults by, or even rumors or questions about, one or more financial institutions or financial market utilities, or the financial services industry generally, may lead to market-wide liquidity problems and losses of client, creditor and counterparty confidence and could lead to losses or defaults by other financial institutions, or the Company; integration risks and projected cost savings in connection with acquisitions; the risk of geographic concentration in Colorado, Arizona, Wyoming, California, and Montana; the risk of changes in the economy affecting real estate values and liquidity; the risk in our ability to continue to originate residential real estate loans and sell such loans; risks specific to commercial loans and borrowers; the risk of claims and litigation pertaining to our fiduciary responsibilities; the risk of competition for investment managers and professionals; the risk of fluctuation in the value of our investment securities; the risk of changes in interest rates; and the risk of the adequacy of our allowance for credit losses and the risk in our ability to maintain a strong core deposit base or other low-cost funding sources. Additional information regarding these and other risks and uncertainties to which our business and future financial performance are subject is contained in our Annual Report on Form 10-K filed with the U.S. Securities and Exchange Commission (“SEC”) on March 15, 2024 (“Form 10-K”), and other documents we file with the SEC from time to time. We urge readers of this presentation to review the “Risk Factors” section our Form 10-K and any updates to those risk factors set forth in our subsequent Quarterly Reports on Form 10-Q, Current Reports on Form 8-K, and our other filings with the SEC. Also, our actual financial results in the future may differ from those currently expected due to additional risks and uncertainties of which we are not currently aware or which we do not currently view as, but in the future may become, material to our business or operating results. Due to these and other possible uncertainties and risks, readers are cautioned not to place undue reliance on the forward-looking statements contained in this presentation, which speak only as of today’s date, or to make predictions based solely on historical financial performance. Any forward-looking statement speaks only as of the date on which it is made, and we do not undertake any obligation to update or review any forward-looking statement, whether as a result of new information, future developments or otherwise, except as required by law.

157 180 196 164 166 168 62 94 111 154 161 132 122 125 129 76 78 86 255 255 255 Chart color Table color Special Headlines Slide Headlines / Text on light background Primary Colors Secondary Colors Primary Background / Call Out Boxes / Text on dark background Chart color Table Color Tertiary Colors Chart color Table Color Chart Color Chart Color Approved Fonts AaBbCc 123 Lora (bold) Slide Headlines / Special Headlines AaBbCc 123 Lato(regular, bold, italics) Body Copy / Subheadings / Small Text Descriptions Overview of 3Q24 3Q24 Earnings • Net income available to common shareholders of $2.1 million or $0.22 per diluted share • Net interest income after provision for credit losses improved to $15.1 million compared to prior quarter of $13.4 million • Positive trends in a number of key areas resulted in improvement in profitability from prior quarter Continued Execution on Strategic Priorities • Continued priority on prudent risk management and conservative approach to new loan production • Maintaining disciplined expense control while continuing to make investments in the business that will support profitable growth in the future • Continued success in deposit gathering efforts with strong growth in noninterest-bearing deposits during 3Q24 • Positive trends in asset quality with declines in non-performing and classified loans Positive Trends in Key Metrics • Continued improvements in loan-to-deposit ratio • Continued progress on resolving problem loans • Further increase in tangible book value per share • Improvement in spot NIM from prior quarter and expectation of continued improvement due primarily to improved cost of funds • September Net gain on mortgage loans and production was the highest level in 2.5 years 3

157 180 196 164 166 168 62 94 111 154 161 132 122 125 129 76 78 86 255 255 255 Chart color Table color Special Headlines Slide Headlines / Text on light background Primary Colors Secondary Colors Primary Background / Call Out Boxes / Text on dark background Chart color Table Color Tertiary Colors Chart color Table Color Chart Color Chart Color Approved Fonts AaBbCc 123 Lora (bold) Slide Headlines / Special Headlines AaBbCc 123 Lato(regular, bold, italics) Body Copy / Subheadings / Small Text Descriptions 4 Net Income Available to Common Shareholders and Earnings per Share • Net income of $2.1 million, or $0.22 diluted earnings per share, in 3Q24 • Provision for credit losses decreased $1.8 million in 3Q24 • Tangible book value per share(1) increased approximately 0.9% to $22.47 Net Income Available to Common Shareholders Diluted Earnings per Share $3,118 $(3,219) $2,515 $1,076 $2,134 Q3 2023 Q4 2023 Q1 2024 Q2 2024 Q3 2024 -$5,000 -$4,000 -$3,000 -$2,000 -$1,000 $0 $1,000 $2,000 $3,000 $4,000 $5,000 $0.32 $(0.34) $0.26 $0.11 $0.22 Q3 2023 Q4 2023 Q1 2024 Q2 2024 Q3 2024 $(0.50) $(0.25) $— $0.25 $0.50 (1) See Non-GAAP reconciliation within the appendix

157 180 196 164 166 168 62 94 111 154 161 132 122 125 129 76 78 86 255 255 255 Chart color Table color Special Headlines Slide Headlines / Text on light background Primary Colors Secondary Colors Primary Background / Call Out Boxes / Text on dark background Chart color Table Color Tertiary Colors Chart color Table Color Chart Color Chart Color Approved Fonts AaBbCc 123 Lora (bold) Slide Headlines / Special Headlines AaBbCc 123 Lato (regular, bold, italics) Body Copy / Subheadings / Small Text Descriptions 5 Loan Portfolio • Total loans held for investment decreased $73.4 million from prior quarter • Decrease due to new production more than offset by payoffs and decline in NPLs • New loan production improved in 3Q24 to $82.8 million with focus primarily on lending to clients that also bring deposits to the bank • Average rate on new loan production of 7.49% was higher than average rate of loans paying off and accretive to NIM 3Q23 2Q24 3Q24 Cash, Securities and Other $ 148,669 $ 143,720 $ 116,856 Consumer and Other 23,975 15,645 14,978 Construction and Development 349,436 309,146 301,542 1-4 Family Residential 913,085 904,569 920,709 Non-Owner Occupied CRE 527,377 609,790 608,494 Owner Occupied CRE 208,341 189,353 176,165 Commercial and Industrial 349,515 277,973 239,660 Total $ 2,520,398 $ 2,450,196 $ 2,378,404 Loans accounted for at fair value(2) 16,105 10,494 8,884 Total Loans HFI $ 2,536,503 $ 2,460,690 $ 2,387,288 Mortgage loans held for sale 12,105 26,856 12,324 Loans held for sale — — 473 Total Loans $ 2,548,608 $ 2,487,546 $ 2,400,085 (1) Represents unpaid principal balance. Excludes deferred (fees) costs, and amortized premium/ (unaccreted discount). (2) Excludes fair value adjustments on loans accounted for under the fair value option. ($ in thousands, as of quarter end) Loan Portfolio Composition(1) Loan Portfolio Details Loan Production & Loan Payoffs Total Loans(1) $2,515 $2,546 $2,510 $2,476 $2,458 $2,488 $2,400 3Q23 4Q23 1Q24 2Q24 3Q24 2Q24 3Q24 $0 $400 $800 $1,200 $1,600 $2,000 $2,400 $2,800 $3,200 Average Period End $101.0 $51.5 $30.6 $49.5 $82.8 $122.3 $102.2 $100.0 $100.3 $153.8 Production Loan Payoffs 3Q23 4Q23 1Q24 2Q24 3Q24 $0 $50 $100 $150 $200 ($ in millions) ($ in millions, as of quarter end)

157 180 196 164 166 168 62 94 111 154 161 132 122 125 129 76 78 86 255 255 255 Chart color Table color Special Headlines Slide Headlines / Text on light background Primary Colors Secondary Colors Primary Background / Call Out Boxes / Text on dark background Chart color Table Color Tertiary Colors Chart color Table Color Chart Color Chart Color Approved Fonts AaBbCc 123 Lora (bold) Slide Headlines / Special Headlines AaBbCc 123 Lato (regular, bold, italics) Body Copy / Subheadings / Small Text Descriptions 6 Total Deposits • Total deposits increased 3.7% from $2.41 billion in 2Q24 to $2.50 billion in 3Q24 • Noninterest-bearing deposits increased 19% from $397 million in 2Q24 to $474 million in 3Q24 • Interest-bearing deposits increased 0.8% from $2.01 billion in 2Q24 to $2.03 billion in 3Q24 primarily driven by increases in time deposits and money market deposit accounts 3Q23 2Q24 3Q24 Money market deposit accounts $ 1,388,726 $ 1,342,753 $ 1,350,619 Time deposits 373,459 519,597 533,452 Interest checking accounts 164,000 135,759 130,255 Savings accounts 17,503 16,081 15,152 Noninterest-bearing accounts 476,308 396,702 473,576 Total Deposits $ 2,419,996 $ 2,410,892 $ 2,503,054 Deposit Portfolio Composition Total Deposits $2,359 $2,372 $2,455 $2,414 $2,403 $2,411 $2,503 3Q23 4Q23 1Q24 2Q24 3Q24 2Q24 3Q24 $— $500 $1,000 $1,500 $2,000 $2,500 $3,000 Average Period End ($ in millions, as of quarter end)($ in thousands, as of quarter end)

157 180 196 164 166 168 62 94 111 154 161 132 122 125 129 76 78 86 255 255 255 Chart color Table color Special Headlines Slide Headlines / Text on light background Primary Colors Secondary Colors Primary Background / Call Out Boxes / Text on dark background Chart color Table Color Tertiary Colors Chart color Table Color Chart Color Chart Color Approved Fonts AaBbCc 123 Lora (bold) Slide Headlines / Special Headlines AaBbCc 123 Lato (regular, bold, italics) Body Copy / Subheadings / Small Text Descriptions 7 Trust and Investment Management • Total assets under management increased 6.5% during the quarter to $7.5 billion and increased 16.7% from 3Q23 • The increase in AUM during the quarter and from 3Q24 was primarily attributed to improving market conditions resulting in an increase in the value of AUM ($ in millions, as of quarter end) Total Assets Under Management $6,396 $6,753 $7,141 $7,012 $7,466 Investment Agency Managed Trust 401(k)/Retirement Directed Trust Custody Q3 2023 Q4 2023 Q1 2024 Q2 2024 Q3 2024 $— $1,000 $2,000 $3,000 $4,000 $5,000 $6,000 $7,000 $8,000
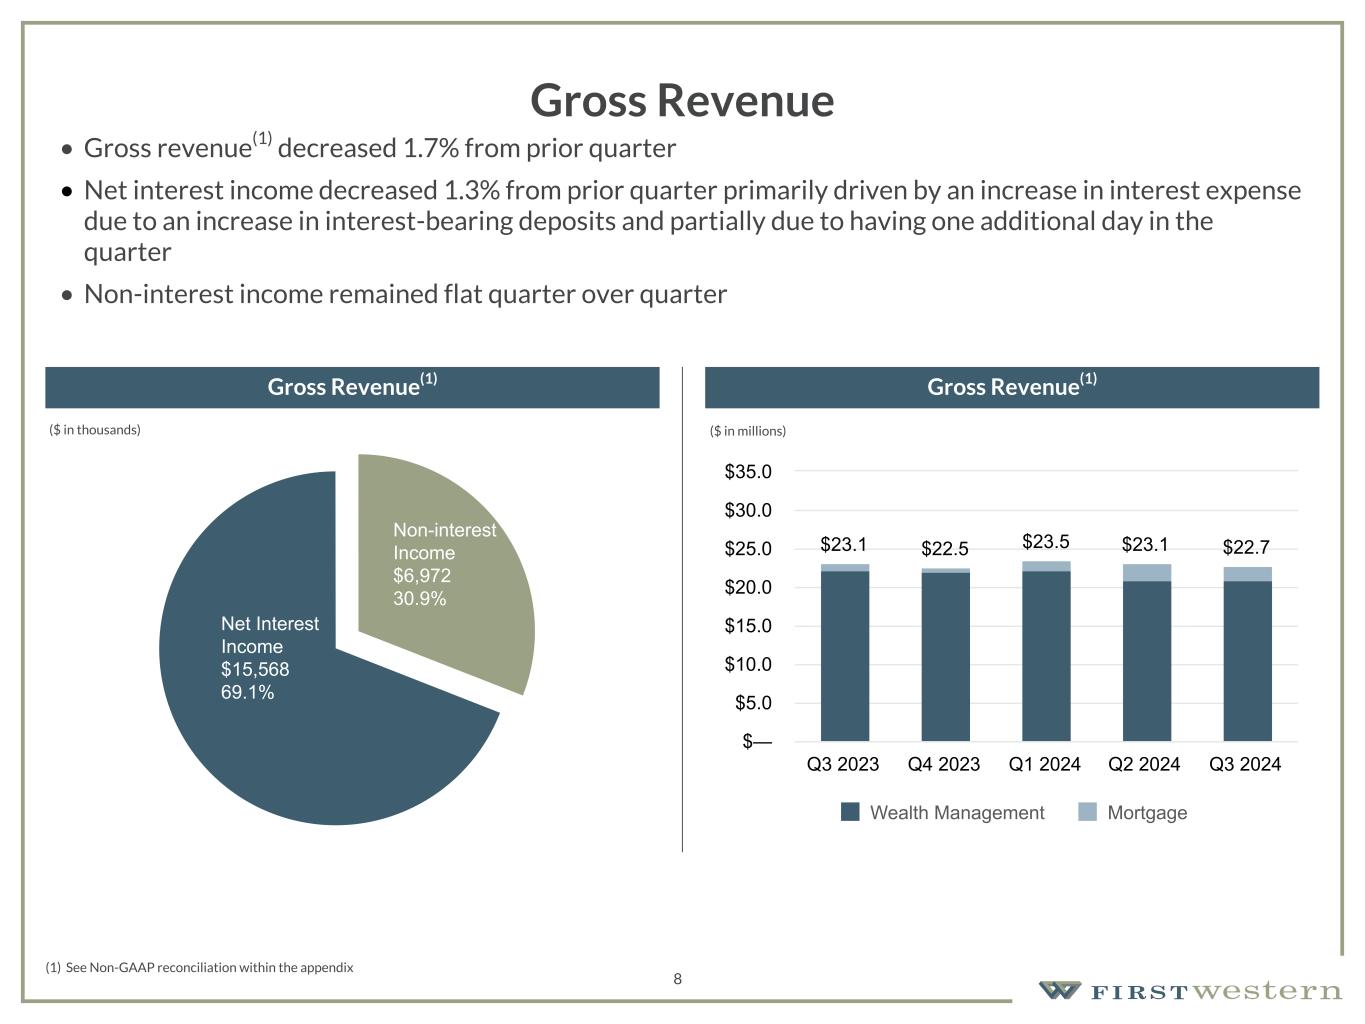
157 180 196 164 166 168 62 94 111 154 161 132 122 125 129 76 78 86 255 255 255 Chart color Table color Special Headlines Slide Headlines / Text on light background Primary Colors Secondary Colors Primary Background / Call Out Boxes / Text on dark background Chart color Table Color Tertiary Colors Chart color Table Color Chart Color Chart Color Approved Fonts AaBbCc 123 Lora (bold) Slide Headlines / Special Headlines AaBbCc 123 Lato (regular, bold, italics) Body Copy / Subheadings / Small Text Descriptions (1) See Non-GAAP reconciliation within the appendix Gross Revenue Gross Revenue(1) Gross Revenue(1) 8 $23.1 $22.5 $23.5 $23.1 $22.7 Wealth Management Mortgage Q3 2023 Q4 2023 Q1 2024 Q2 2024 Q3 2024 $— $5.0 $10.0 $15.0 $20.0 $25.0 $30.0 $35.0 • Gross revenue(1) decreased 1.7% from prior quarter • Net interest income decreased 1.3% from prior quarter primarily driven by an increase in interest expense due to an increase in interest-bearing deposits and partially due to having one additional day in the quarter • Non-interest income remained flat quarter over quarter Non-interest Income $6,972 30.9% Net Interest Income $15,568 69.1% ($ in thousands) ($ in millions)

157 180 196 164 166 168 62 94 111 154 161 132 122 125 129 76 78 86 255 255 255 Chart color Table color Special Headlines Slide Headlines / Text on light background Primary Colors Secondary Colors Primary Background / Call Out Boxes / Text on dark background Chart color Table Color Tertiary Colors Chart color Table Color Chart Color Chart Color Approved Fonts AaBbCc 123 Lora (bold) Slide Headlines / Special Headlines AaBbCc 123 Lato (regular, bold, italics) Body Copy / Subheadings / Small Text Descriptions 9 Net Interest Income and Net Interest Margin • Net interest income of $15.6 million decreased $0.2 million, or 1.3%, from $15.8 million in 2Q24, primarily driven by an increase in interest expense due to an increase in interest-bearing deposits and partially due to having one additional day in the quarter • Net interest margin decreased 3 basis points from 2.35% in 2Q24 to 2.32% in 3Q24 • Net interest income and Net interest margin was negatively impacted by $0.4 million and 6 bps, respectively, in the quarter due to the addition of a non-performing loan • End of quarter spot NIM of 2.40% expected to further expand as short-term interest rates decrease • Increase in core deposits utilized to reduce wholesale borrowings Net Interest Income Net Interest Margin $16,766 $16,331 $16,070 $15,778 $15,568 Q3 2023 Q4 2023 Q1 2024 Q2 2024 Q3 2024 $— $5,000 $10,000 $15,000 $20,000 $25,000 2.46% 2.37% 2.34% 2.35% 2.32% Q3 2023 Q4 2023 Q1 2024 Q2 2024 Q3 2024 —% 0.50% 1.00% 1.50% 2.00% 2.50% 3.00% 3.50% 4.00% ($ in thousands)
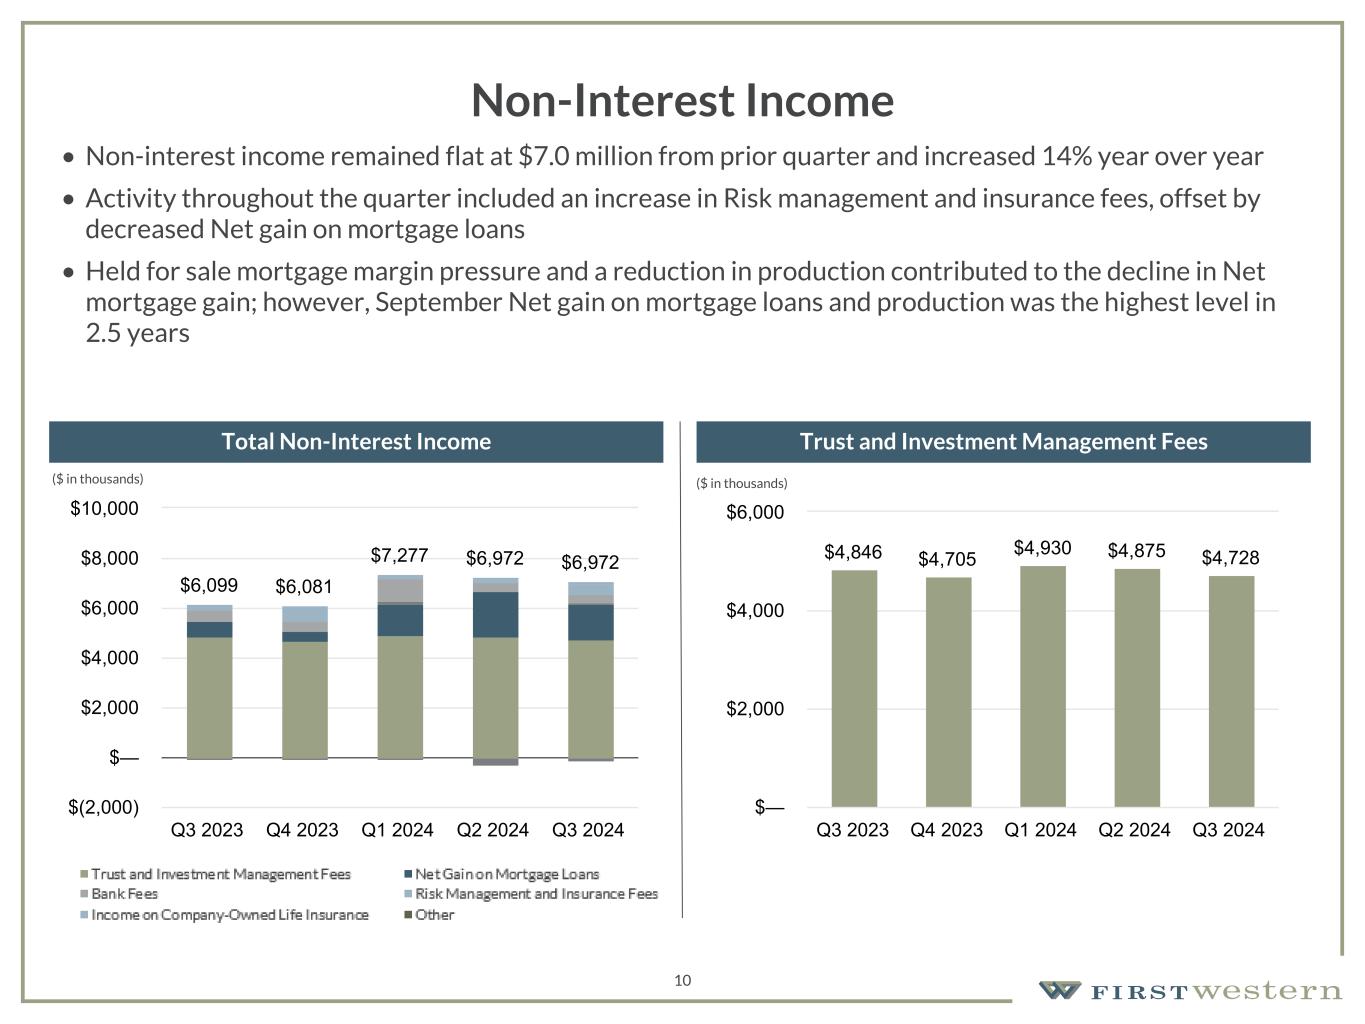
157 180 196 164 166 168 62 94 111 154 161 132 122 125 129 76 78 86 255 255 255 Chart color Table color Special Headlines Slide Headlines / Text on light background Primary Colors Secondary Colors Primary Background / Call Out Boxes / Text on dark background Chart color Table Color Tertiary Colors Chart color Table Color Chart Color Chart Color Approved Fonts AaBbCc 123 Lora (bold) Slide Headlines / Special Headlines AaBbCc 123 Lato (regular, bold, italics) Body Copy / Subheadings / Small Text Descriptions 10 Non-Interest Income • Non-interest income remained flat at $7.0 million from prior quarter and increased 14% year over year • Activity throughout the quarter included an increase in Risk management and insurance fees, offset by decreased Net gain on mortgage loans • Held for sale mortgage margin pressure and a reduction in production contributed to the decline in Net mortgage gain; however, September Net gain on mortgage loans and production was the highest level in 2.5 years Total Non-Interest Income Trust and Investment Management Fees $6,099 $6,081 $7,277 $6,972 $6,972 Q3 2023 Q4 2023 Q1 2024 Q2 2024 Q3 2024 $(2,000) $— $2,000 $4,000 $6,000 $8,000 $10,000 $4,846 $4,705 $4,930 $4,875 $4,728 Q3 2023 Q4 2023 Q1 2024 Q2 2024 Q3 2024 $— $2,000 $4,000 $6,000 ($ in thousands) ($ in thousands)
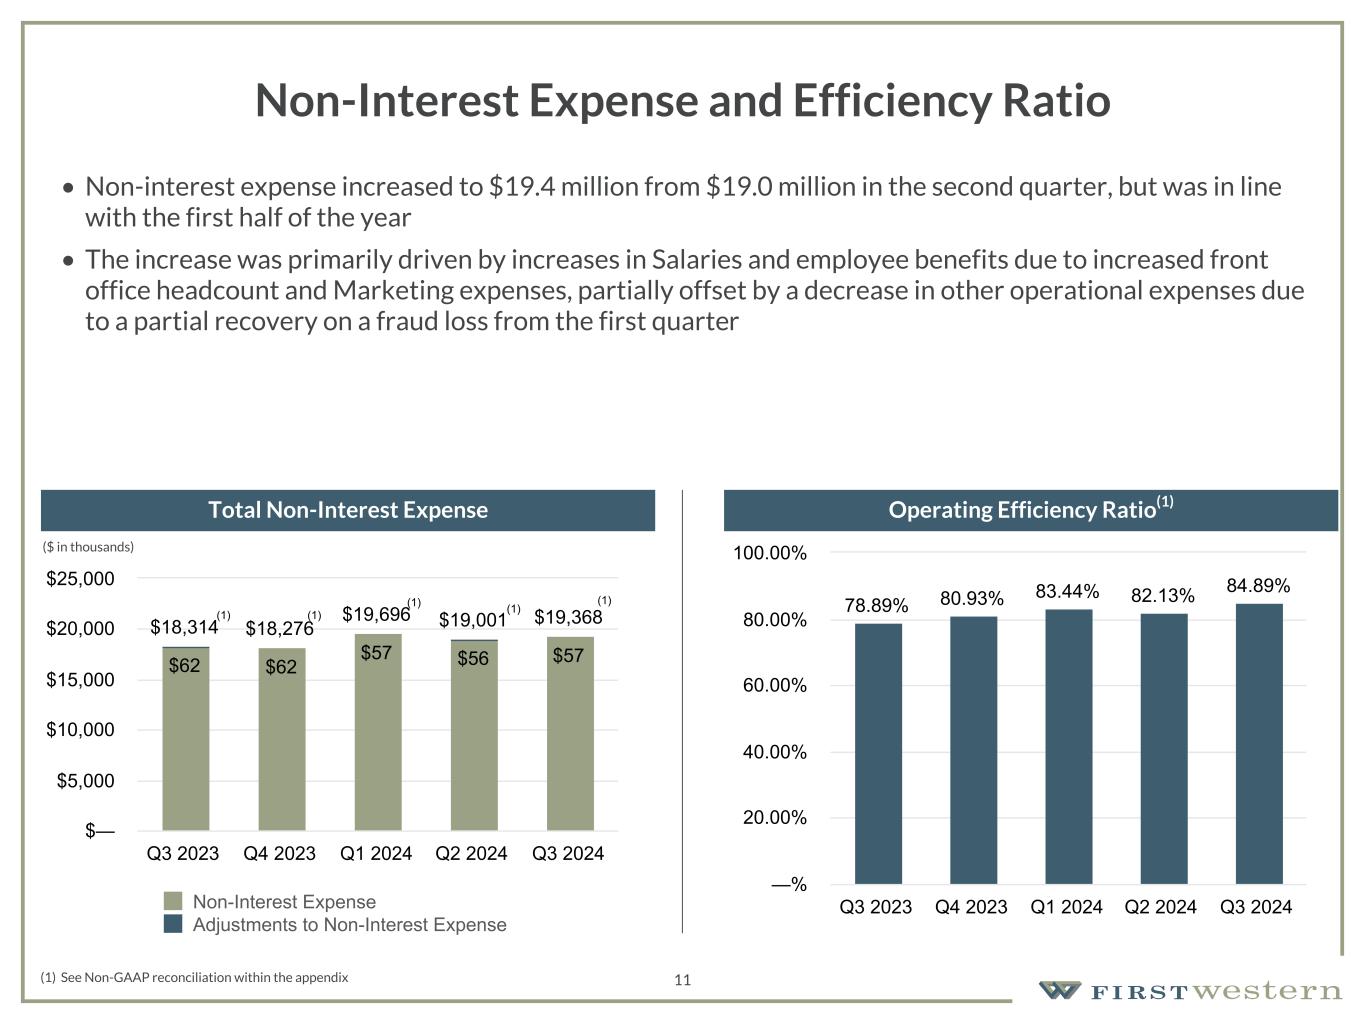
157 180 196 164 166 168 62 94 111 154 161 132 122 125 129 76 78 86 255 255 255 Chart color Table color Special Headlines Slide Headlines / Text on light background Primary Colors Secondary Colors Primary Background / Call Out Boxes / Text on dark background Chart color Table Color Tertiary Colors Chart color Table Color Chart Color Chart Color Approved Fonts AaBbCc 123 Lora (bold) Slide Headlines / Special Headlines AaBbCc 123 Lato (regular, bold, italics) Body Copy / Subheadings / Small Text Descriptions 11 Non-Interest Expense and Efficiency Ratio • Non-interest expense increased to $19.4 million from $19.0 million in the second quarter, but was in line with the first half of the year • The increase was primarily driven by increases in Salaries and employee benefits due to increased front office headcount and Marketing expenses, partially offset by a decrease in other operational expenses due to a partial recovery on a fraud loss from the first quarter (1) See Non-GAAP reconciliation within the appendix Total Non-Interest Expense Operating Efficiency Ratio(1) (1) (1) (1) $18,314 $18,276 $19,696 $19,001 $19,368 $62 $62 $57 $56 $57 Non-Interest Expense Adjustments to Non-Interest Expense Q3 2023 Q4 2023 Q1 2024 Q2 2024 Q3 2024 $— $5,000 $10,000 $15,000 $20,000 $25,000 78.89% 80.93% 83.44% 82.13% 84.89% Q3 2023 Q4 2023 Q1 2024 Q2 2024 Q3 2024 —% 20.00% 40.00% 60.00% 80.00% 100.00% (1) (1)(1) (1) (1) ($ in thousands)
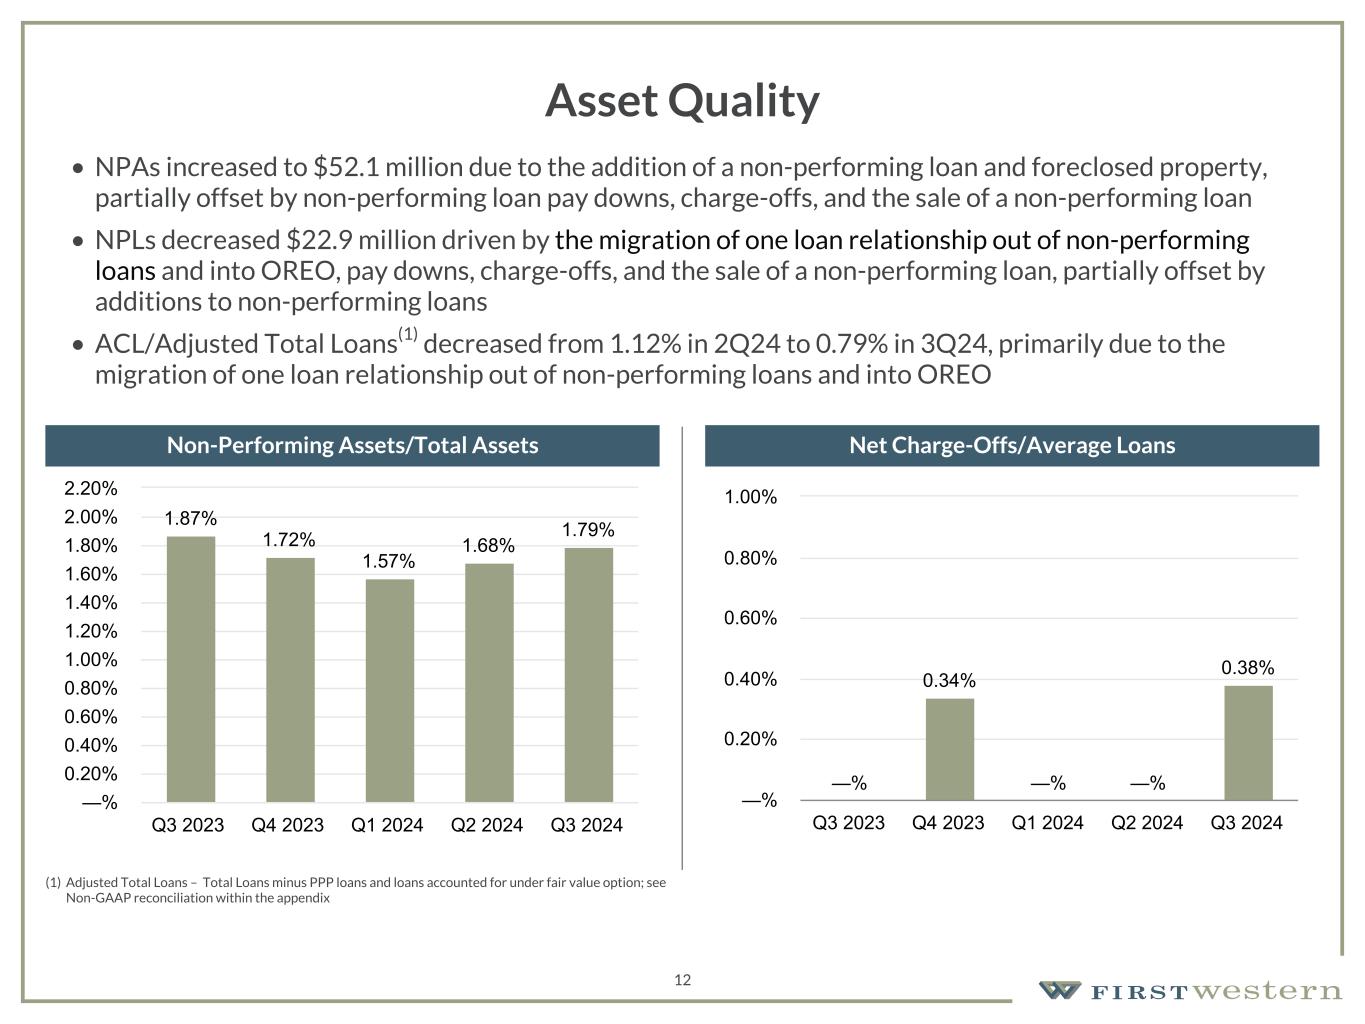
157 180 196 164 166 168 62 94 111 154 161 132 122 125 129 76 78 86 255 255 255 Chart color Table color Special Headlines Slide Headlines / Text on light background Primary Colors Secondary Colors Primary Background / Call Out Boxes / Text on dark background Chart color Table Color Tertiary Colors Chart color Table Color Chart Color Chart Color Approved Fonts AaBbCc 123 Lora (bold) Slide Headlines / Special Headlines AaBbCc 123 Lato (regular, bold, italics) Body Copy / Subheadings / Small Text Descriptions 12 Asset Quality • NPAs increased to $52.1 million due to the addition of a non-performing loan and foreclosed property, partially offset by non-performing loan pay downs, charge-offs, and the sale of a non-performing loan • NPLs decreased $22.9 million driven by the migration of one loan relationship out of non-performing loans and into OREO, pay downs, charge-offs, and the sale of a non-performing loan, partially offset by additions to non-performing loans • ACL/Adjusted Total Loans(1) decreased from 1.12% in 2Q24 to 0.79% in 3Q24, primarily due to the migration of one loan relationship out of non-performing loans and into OREO Non-Performing Assets/Total Assets Net Charge-Offs/Average Loans (1) Adjusted Total Loans – Total Loans minus PPP loans and loans accounted for under fair value option; see Non-GAAP reconciliation within the appendix 1.87% 1.72% 1.57% 1.68% 1.79% Q3 2023 Q4 2023 Q1 2024 Q2 2024 Q3 2024 —% 0.20% 0.40% 0.60% 0.80% 1.00% 1.20% 1.40% 1.60% 1.80% 2.00% 2.20% —% 0.34% —% —% 0.38% Q3 2023 Q4 2023 Q1 2024 Q2 2024 Q3 2024 —% 0.20% 0.40% 0.60% 0.80% 1.00%
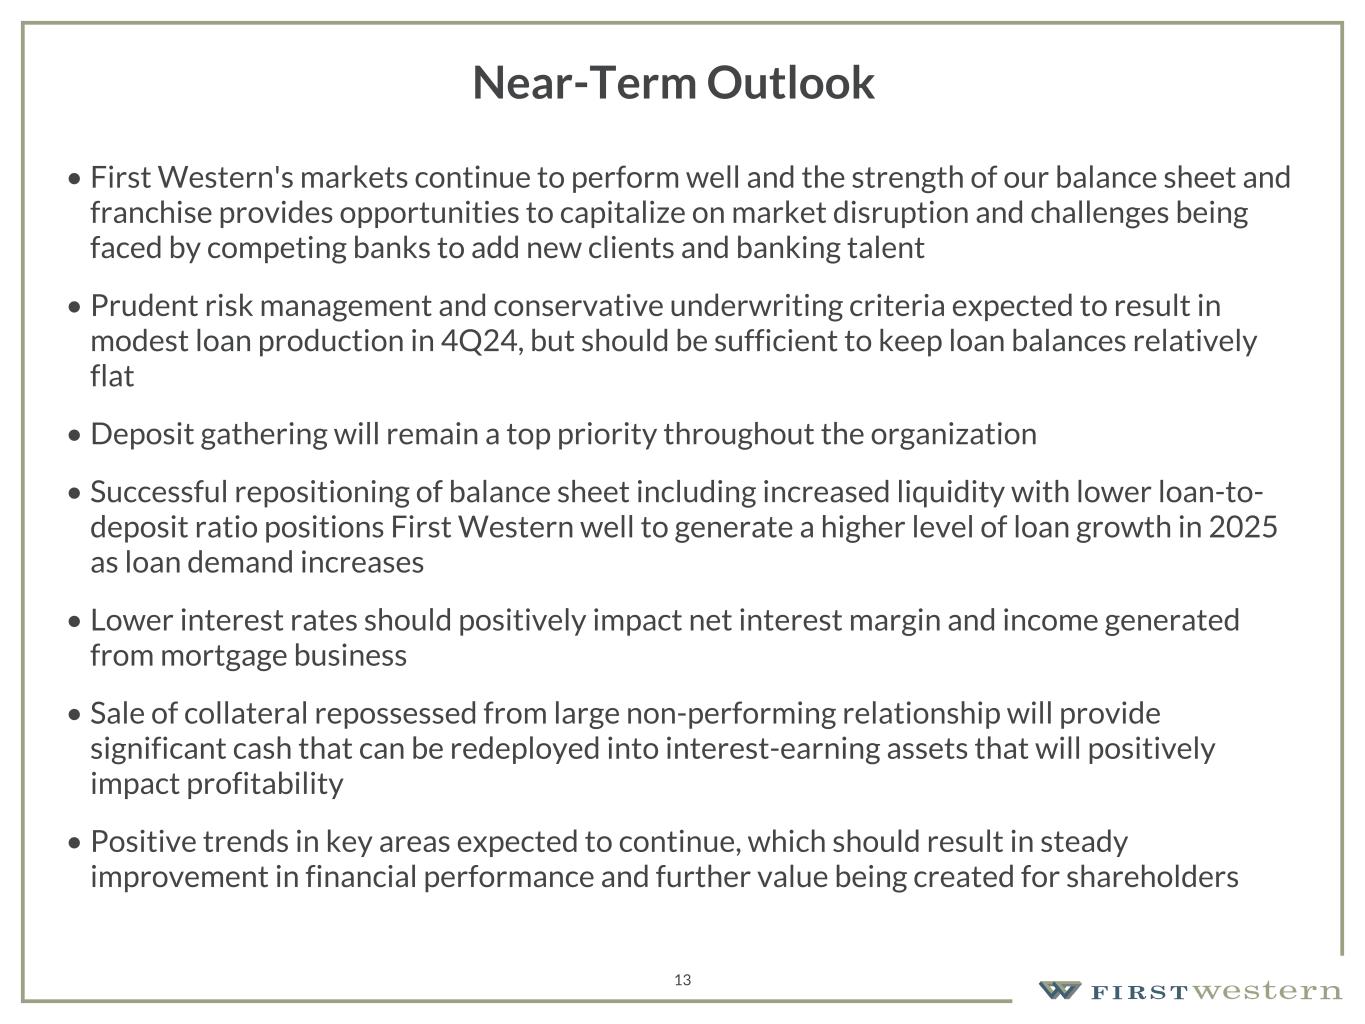
157 180 196 164 166 168 62 94 111 154 161 132 122 125 129 76 78 86 255 255 255 Chart color Table color Special Headlines Slide Headlines / Text on light background Primary Colors Secondary Colors Primary Background / Call Out Boxes / Text on dark background Chart color Table Color Tertiary Colors Chart color Table Color Chart Color Chart Color Approved Fonts AaBbCc 123 Lora (bold) Slide Headlines / Special Headlines AaBbCc 123 Lato (regular, bold, italics) Body Copy / Subheadings / Small Text Descriptions 13 Near-Term Outlook • First Western's markets continue to perform well and the strength of our balance sheet and franchise provides opportunities to capitalize on market disruption and challenges being faced by competing banks to add new clients and banking talent • Prudent risk management and conservative underwriting criteria expected to result in modest loan production in 4Q24, but should be sufficient to keep loan balances relatively flat • Deposit gathering will remain a top priority throughout the organization • Successful repositioning of balance sheet including increased liquidity with lower loan-to- deposit ratio positions First Western well to generate a higher level of loan growth in 2025 as loan demand increases • Lower interest rates should positively impact net interest margin and income generated from mortgage business • Sale of collateral repossessed from large non-performing relationship will provide significant cash that can be redeployed into interest-earning assets that will positively impact profitability • Positive trends in key areas expected to continue, which should result in steady improvement in financial performance and further value being created for shareholders

Appendix 14
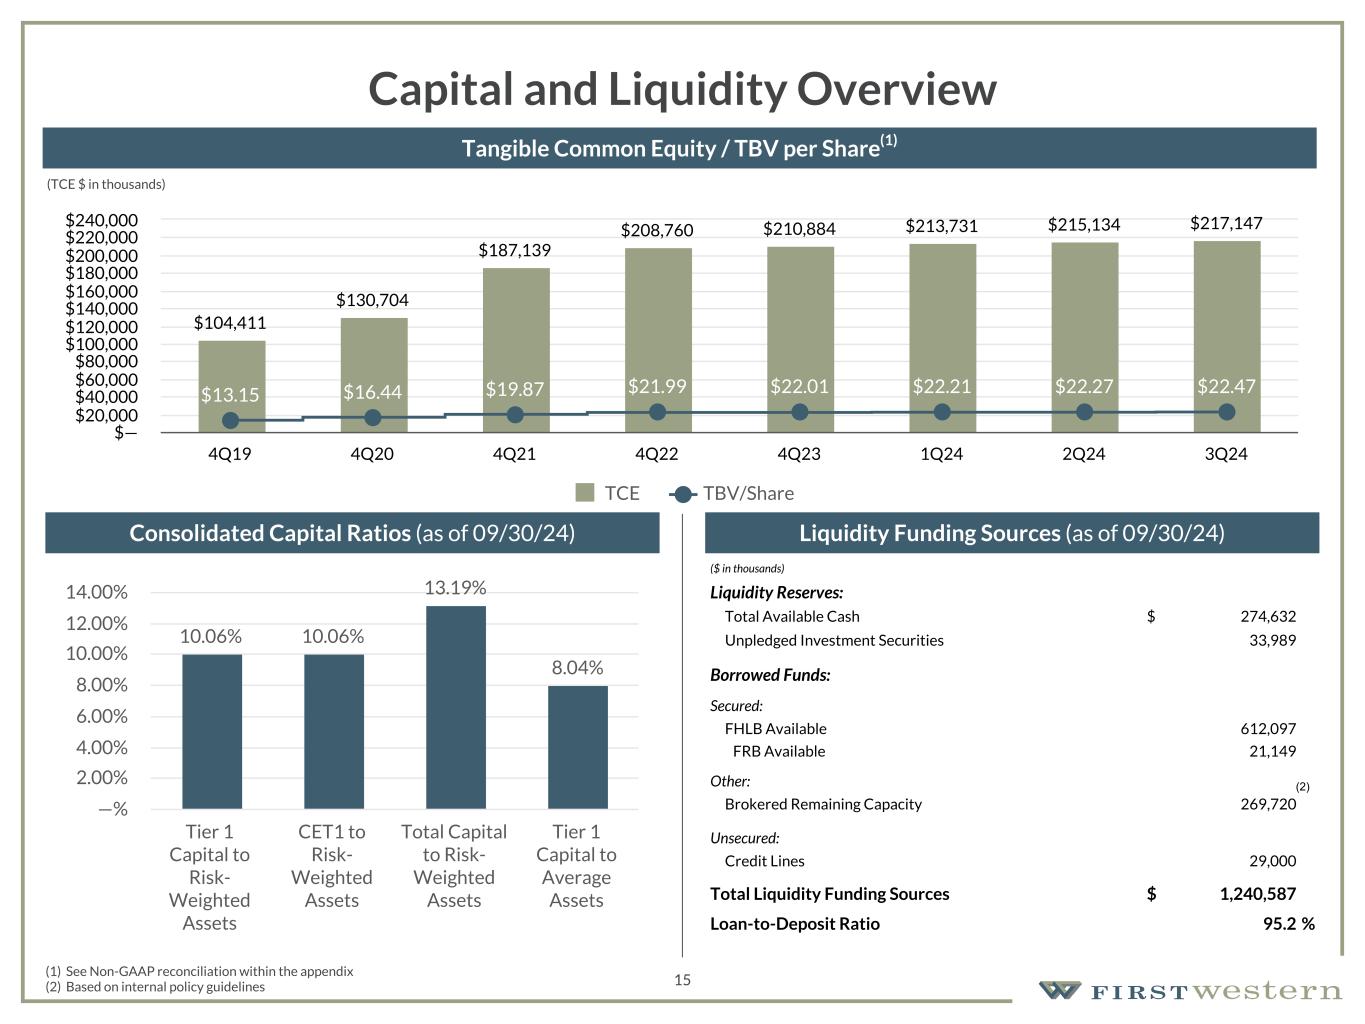
157 180 196 164 166 168 62 94 111 154 161 132 122 125 129 76 78 86 255 255 255 Chart color Table color Special Headlines Slide Headlines / Text on light background Primary Colors Secondary Colors Primary Background / Call Out Boxes / Text on dark background Chart color Table Color Tertiary Colors Chart color Table Color Chart Color Chart Color Approved Fonts AaBbCc 123 Lora (bold) Slide Headlines / Special Headlines AaBbCc 123 Lato (regular, bold, italics) Body Copy / Subheadings / Small Text Descriptions 15 Capital and Liquidity Overview Liquidity Funding Sources (as of 09/30/24) (1) See Non-GAAP reconciliation within the appendix (2) Based on internal policy guidelines Consolidated Capital Ratios (as of 09/30/24) Tangible Common Equity / TBV per Share(1) ($ in thousands) Liquidity Reserves: Total Available Cash $ 274,632 Unpledged Investment Securities 33,989 Borrowed Funds: Secured: FHLB Available 612,097 FRB Available 21,149 Other: Brokered Remaining Capacity 269,720 Unsecured: Credit Lines 29,000 Total Liquidity Funding Sources $ 1,240,587 Loan-to-Deposit Ratio 95.2 % 10.06% 10.06% 13.19% 8.04% Tier 1 Capital to Risk- Weighted Assets CET1 to Risk- Weighted Assets Total Capital to Risk- Weighted Assets Tier 1 Capital to Average Assets —% 2.00% 4.00% 6.00% 8.00% 10.00% 12.00% 14.00% $104,411 $130,704 $187,139 $208,760 $210,884 $213,731 $215,134 $217,147 $13.15 $16.44 $19.87 $21.99 $22.01 $22.21 $22.27 $22.47 TCE TBV/Share 4Q19 4Q20 4Q21 4Q22 4Q23 1Q24 2Q24 3Q24 $— $20,000 $40,000 $60,000 $80,000 $100,000 $120,000 $140,000 $160,000 $180,000 $200,000 $220,000 $240,000 (2) (TCE $ in thousands)

157 180 196 164 166 168 62 94 111 154 161 132 122 125 129 76 78 86 255 255 255 Chart color Table color Special Headlines Slide Headlines / Text on light background Primary Colors Secondary Colors Primary Background / Call Out Boxes / Text on dark background Chart color Table Color Tertiary Colors Chart color Table Color Chart Color Chart Color Approved Fonts AaBbCc 123 Lora (bold) Slide Headlines / Special Headlines AaBbCc 123 Lato (regular, bold, italics) Body Copy / Subheadings / Small Text Descriptions 16 Non-GAAP Reconciliation Consolidated Tangible Common Book Value Per Share As of, (Dollars in thousands) Dec. 31, 2019 Dec. 31, 2020 Dec. 31, 2021 Dec. 31, 2022 Dec. 31, 2023 March 31, 2024 June 30, 2024 September 30, 2024 Total shareholders' equity $ 127,678 $ 154,962 $ 219,041 $ 240,864 $ 242,738 $ 245,528 $ 246,875 $ 248,831 Less: Goodwill and other intangibles, net 19,714 24,258 31,902 32,104 31,854 31,797 31,741 31,684 Intangibles held for sale(1) 3,553 — — — — — — — Tangible common equity $ 104,411 $ 130,704 $ 187,139 $ 208,760 $ 210,884 $ 213,731 $ 215,134 $ 217,147 Common shares outstanding, end of period 7,940,168 7,951,773 9,419,271 9,495,440 9,581,183 9,621,309 9,660,548 9,664,101 Tangible common book value per share $ 13.15 $ 16.44 $ 19.87 $ 21.99 $ 22.01 $ 22.21 $ 22.27 $ 22.47 Net income available to common shareholders $ 2,134 Return on tangible common equity (annualized) 3.93 % (1) Represents the intangible portion of assets held for sale Consolidated Efficiency Ratio For the Three Months Ended, (Dollars in thousands) September 30, 2023 December 31, 2023 March 31, 2024 June 30, 2024 September 30, 2024 Non-interest expense $ 18,314 $ 18,276 $ 19,696 $ 19,001 $ 19,368 Less: amortization 62 62 57 56 57 Adjusted non-interest expense $ 18,252 $ 18,214 $ 19,639 $ 18,945 $ 19,311 Net interest income $ 16,766 $ 16,331 $ 16,070 $ 15,778 $ 15,568 Non-interest income 6,099 6,081 7,277 6,972 6,972 Less: unrealized gains/(losses) recognized on equity securities (19) (2) (6) (2) 24 Less: net gain/(loss) on loans accounted for under the fair value option (252) (91) (302) (315) (233) Less: net (loss)/gain on loans held for sale at fair value — — 117 — — Adjusted non-interest income $ 6,370 $ 6,174 $ 7,468 $ 7,289 $ 7,181 Adjusted total income $ 23,136 $ 22,505 $ 23,538 $ 23,067 $ 22,749 Efficiency ratio 78.89 % 80.93 % 83.44 % 82.13 % 84.89 %
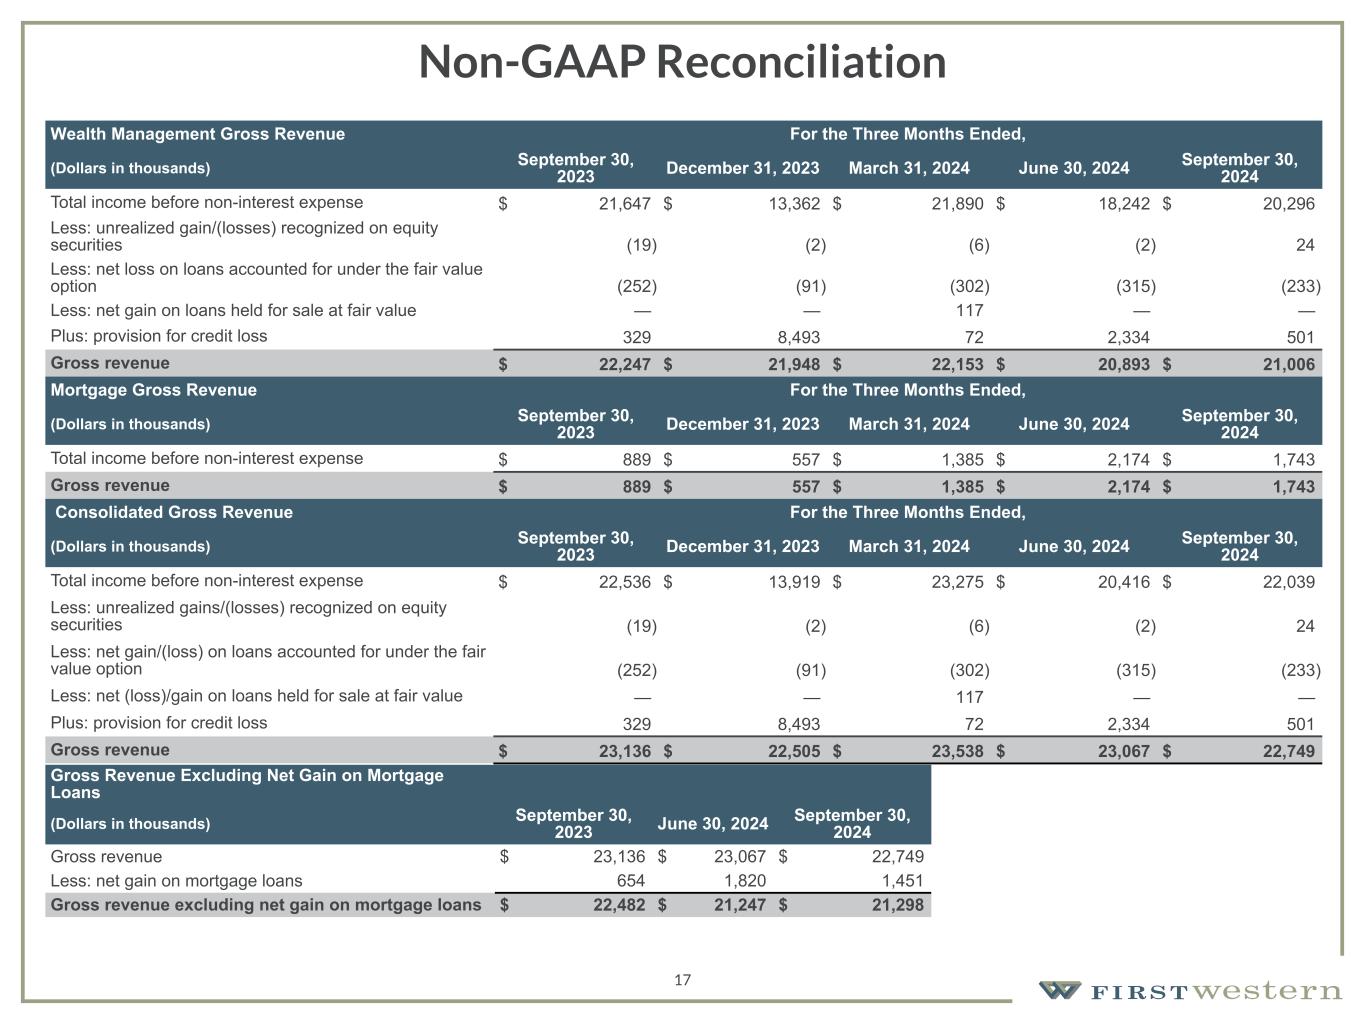
157 180 196 164 166 168 62 94 111 154 161 132 122 125 129 76 78 86 255 255 255 Chart color Table color Special Headlines Slide Headlines / Text on light background Primary Colors Secondary Colors Primary Background / Call Out Boxes / Text on dark background Chart color Table Color Tertiary Colors Chart color Table Color Chart Color Chart Color Approved Fonts AaBbCc 123 Lora (bold) Slide Headlines / Special Headlines AaBbCc 123 Lato (regular, bold, italics) Body Copy / Subheadings / Small Text Descriptions 17 Non-GAAP Reconciliation Wealth Management Gross Revenue For the Three Months Ended, (Dollars in thousands) September 30, 2023 December 31, 2023 March 31, 2024 June 30, 2024 September 30, 2024 Total income before non-interest expense $ 21,647 $ 13,362 $ 21,890 $ 18,242 $ 20,296 Less: unrealized gain/(losses) recognized on equity securities (19) (2) (6) (2) 24 Less: net loss on loans accounted for under the fair value option (252) (91) (302) (315) (233) Less: net gain on loans held for sale at fair value — — 117 — — Plus: provision for credit loss 329 8,493 72 2,334 501 Gross revenue $ 22,247 $ 21,948 $ 22,153 $ 20,893 $ 21,006 Mortgage Gross Revenue For the Three Months Ended, (Dollars in thousands) September 30, 2023 December 31, 2023 March 31, 2024 June 30, 2024 September 30, 2024 Total income before non-interest expense $ 889 $ 557 $ 1,385 $ 2,174 $ 1,743 Gross revenue $ 889 $ 557 $ 1,385 $ 2,174 $ 1,743 Consolidated Gross Revenue For the Three Months Ended, (Dollars in thousands) September 30, 2023 December 31, 2023 March 31, 2024 June 30, 2024 September 30, 2024 Total income before non-interest expense $ 22,536 $ 13,919 $ 23,275 $ 20,416 $ 22,039 Less: unrealized gains/(losses) recognized on equity securities (19) (2) (6) (2) 24 Less: net gain/(loss) on loans accounted for under the fair value option (252) (91) (302) (315) (233) Less: net (loss)/gain on loans held for sale at fair value — — 117 — — Plus: provision for credit loss 329 8,493 72 2,334 501 Gross revenue $ 23,136 $ 22,505 $ 23,538 $ 23,067 $ 22,749 Gross Revenue Excluding Net Gain on Mortgage Loans (Dollars in thousands) September 30, 2023 June 30, 2024 September 30, 2024 Gross revenue $ 23,136 $ 23,067 $ 22,749 Less: net gain on mortgage loans 654 1,820 1,451 Gross revenue excluding net gain on mortgage loans $ 22,482 $ 21,247 $ 21,298
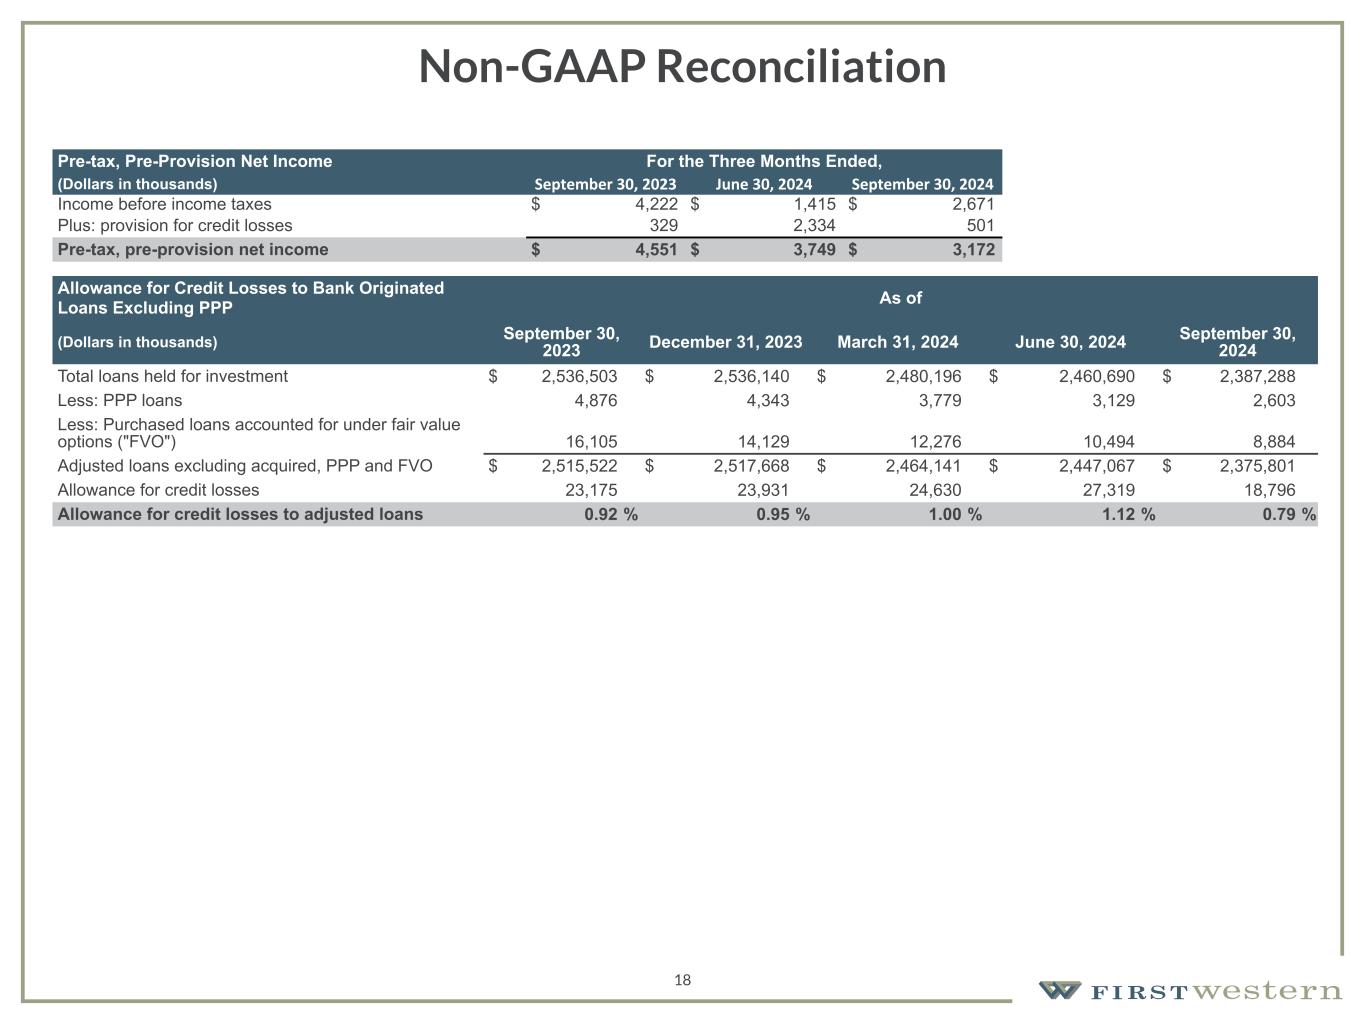
157 180 196 164 166 168 62 94 111 154 161 132 122 125 129 76 78 86 255 255 255 Chart color Table color Special Headlines Slide Headlines / Text on light background Primary Colors Secondary Colors Primary Background / Call Out Boxes / Text on dark background Chart color Table Color Tertiary Colors Chart color Table Color Chart Color Chart Color Approved Fonts AaBbCc 123 Lora (bold) Slide Headlines / Special Headlines AaBbCc 123 Lato (regular, bold, italics) Body Copy / Subheadings / Small Text Descriptions 18 Non-GAAP Reconciliation Allowance for Credit Losses to Bank Originated Loans Excluding PPP As of (Dollars in thousands) September 30, 2023 December 31, 2023 March 31, 2024 June 30, 2024 September 30, 2024 Total loans held for investment $ 2,536,503 $ 2,536,140 $ 2,480,196 $ 2,460,690 $ 2,387,288 Less: PPP loans 4,876 4,343 3,779 3,129 2,603 Less: Purchased loans accounted for under fair value options ("FVO") 16,105 14,129 12,276 10,494 8,884 Adjusted loans excluding acquired, PPP and FVO $ 2,515,522 $ 2,517,668 $ 2,464,141 $ 2,447,067 $ 2,375,801 Allowance for credit losses 23,175 23,931 24,630 27,319 18,796 Allowance for credit losses to adjusted loans 0.92 % 0.95 % 1.00 % 1.12 % 0.79 % Pre-tax, Pre-Provision Net Income For the Three Months Ended, (Dollars in thousands) September 30, 2023 June 30, 2024 September 30, 2024 Income before income taxes $ 4,222 $ 1,415 $ 2,671 Plus: provision for credit losses 329 2,334 501 Pre-tax, pre-provision net income $ 4,551 $ 3,749 $ 3,172


