Exhibit 99.2
| First Western Financial, Inc. The First, Western-Based Private Trust Bank KBW Conference Presentation July 2019 |
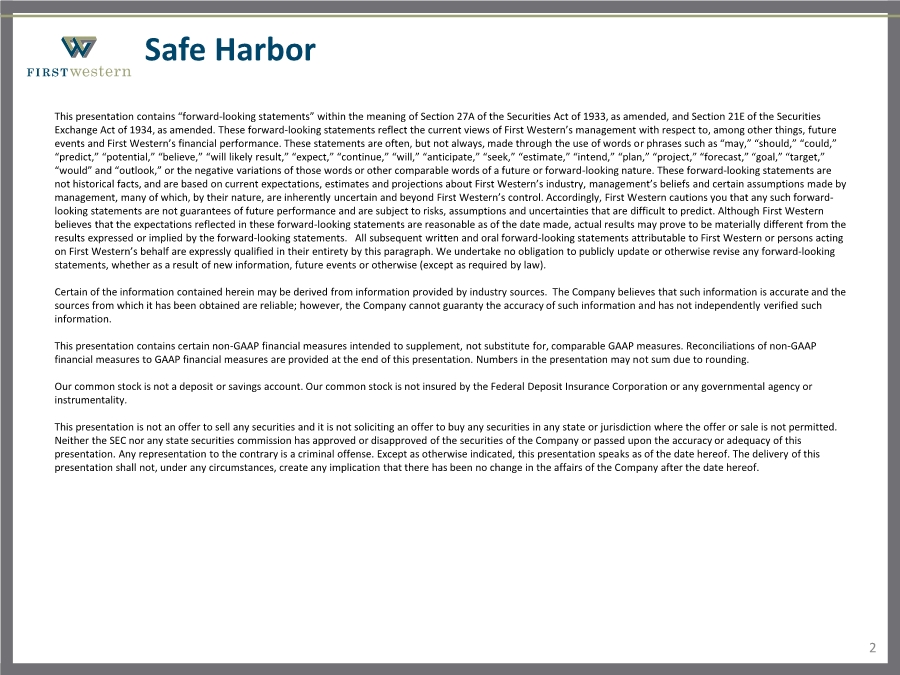
| Safe Harbor 2 This presentation contains “forward-looking statements” within the meaning of Section 27A of the Securities Act of 1933, as amended, and Section 21E of the Securities Exchange Act of 1934, as amended. These forward-looking statements reflect the current views of First Western’s management with respect to, among other things, future events and First Western’s financial performance. These statements are often, but not always, made through the use of words or phrases such as “may,” “should,” “could,” “predict,” “potential,” “believe,” “will likely result,” “expect,” “continue,” “will,” “anticipate,” “seek,” “estimate,” “intend,” “plan,” “project,” “forecast,” “goal,” “target,” “would” and “outlook,” or the negative variations of those words or other comparable words of a future or forward-looking nature. These forward-looking statements are not historical facts, and are based on current expectations, estimates and projections about First Western’s industry, management’s beliefs and certain assumptions made by management, many of which, by their nature, are inherently uncertain and beyond First Western’s control. Accordingly, First Western cautions you that any such forward- looking statements are not guarantees of future performance and are subject to risks, assumptions and uncertainties that are difficult to predict. Although First Western believes that the expectations reflected in these forward-looking statements are reasonable as of the date made, actual results may prove to be materially different from the results expressed or implied by the forward-looking statements. All subsequent written and oral forward-looking statements attributable to First Western or persons acting on First Western’s behalf are expressly qualified in their entirety by this paragraph. We undertake no obligation to publicly update or otherwise revise any forward-looking statements, whether as a result of new information, future events or otherwise (except as required by law). Certain of the information contained herein may be derived from information provided by industry sources. The Company believes that such information is accurate and the sources from which it has been obtained are reliable; however, the Company cannot guaranty the accuracy of such information and has not independently verified such information. This presentation contains certain non-GAAP financial measures intended to supplement, not substitute for, comparable GAAP measures. Reconciliations of non-GAAP financial measures to GAAP financial measures are provided at the end of this presentation. Numbers in the presentation may not sum due to rounding. Our common stock is not a deposit or savings account. Our common stock is not insured by the Federal Deposit Insurance Corporation or any governmental agency or instrumentality. This presentation is not an offer to sell any securities and it is not soliciting an offer to buy any securities in any state or jurisdiction where the offer or sale is not permitted. Neither the SEC nor any state securities commission has approved or disapproved of the securities of the Company or passed upon the accuracy or adequacy of this presentation. Any representation to the contrary is a criminal offense. Except as otherwise indicated, this presentation speaks as of the date hereof. The delivery of this presentation shall not, under any circumstances, create any implication that there has been no change in the affairs of the Company after the date hereof. |
| First Western’s core strengths provide the foundation for driving shareholder value MYFW: Our Five Core Strengths Experienced, Tested Team ▪ Niche-focused franchise headquartered in Denver, Colorado ▪ Well-positioned in many attractive markets in Arizona, California, Colorado and Wyoming ▪ Specialized central expertise to compete with siloed national, regional firms ▪ Delivered through local, boutique trust banking teams so clients “owned” by MYFW, not associates Built in Operating Leverage ▪ Strong profit center margins at maturity, growth opportunities in current and new markets ▪ Revenue growth in both fee income and net interest income, with liability sensitive balance sheet ▪ Scalable, leverageable high fixed cost Product and Support Centers ▪ Operating expense investment already in place for growth and expansion Highly Desirable Recurring Fee Income ▪ ~50% fee income, consistently through MYFW history ▪ Primarily recurring trust and investment management (“TIM”) fees ▪ Low risk, “sticky” wealth/trust business with comprehensive product offering ▪ Multiple entry points with ConnectView® – proprietary review process to service, cross-sell Differentiated, Proven in the Marketplace ▪ At critical mass but small market share, many current and new market opportunities ▪ Proven ability to expand: (1) Organically, (2) By expansion and (3) By acquisition ▪ Few large Colorado bank alternatives for investors and clients, creating lift-out opportunities ▪ MYFW was capital constrained: IPO provided growth capital, paid off high cost capital, debt Unique Opportunity for Investors ▪ Executives are major bank/professional firm trained, with deep relationships in communities ▪ Achieved growth through business and economic cycles, capital constraints ▪ Healthy relationship with all regulators with strong risk management culture ▪ CEO with proven track record for creating value in previous bank ownership 3 |

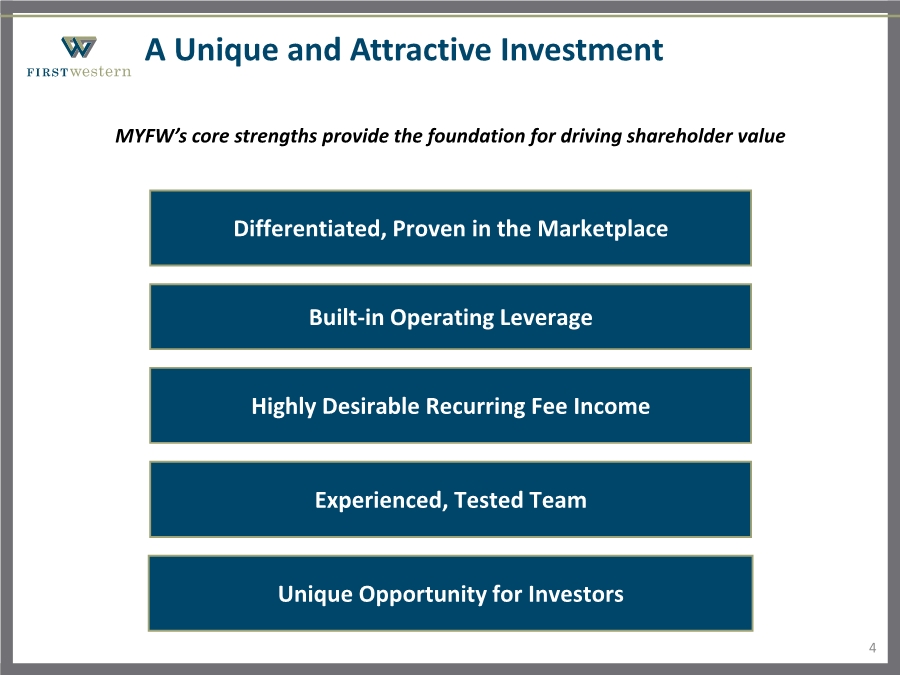
| Experienced, Tested Team Built-in Operating Leverage Highly Desirable Recurring Fee Income Differentiated, Proven in the Marketplace Unique Opportunity for Investors MYFW’s core strengths provide the foundation for driving shareholder value A Unique and Attractive Investment 4 |
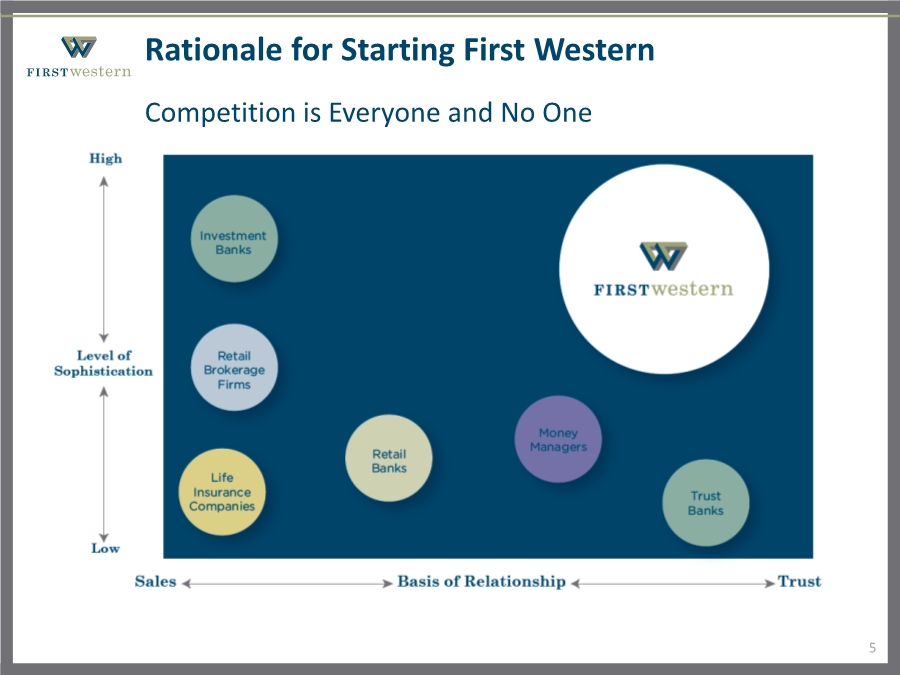
| 5 Rationale for Starting First Western Competition is Everyone and No One |
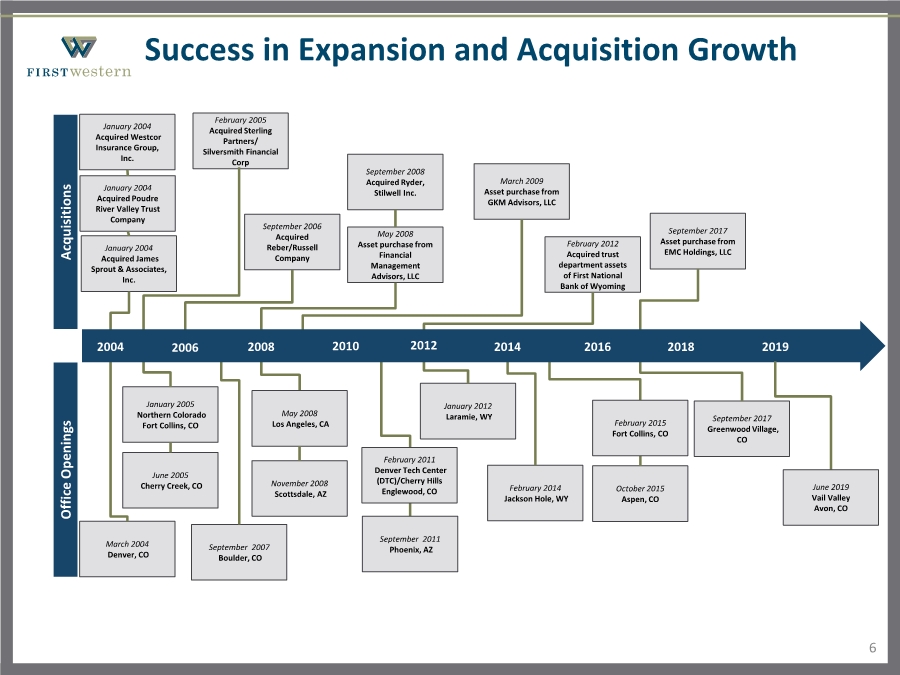
| Success in Expansion and Acquisition Growth January 2004 Acquired Westcor Insurance Group, Inc. January 2004 Acquired James Sprout & Associates, Inc. January 2004 Acquired Poudre River Valley Trust Company February 2005 Acquired Sterling Partners/ Silversmith Financial Corp September 2006 Acquired Reber/Russell Company May 2008 Asset purchase from Financial Management Advisors, LLC September 2008 Acquired Ryder, Stilwell Inc. March 2009 Asset purchase from GKM Advisors, LLC February 2012 Acquired trust department assets of First National Bank of Wyoming September 2017 Asset purchase from EMC Holdings, LLC Acquisitions Office Openings February 2011 Denver Tech Center (DTC)/Cherry Hills Englewood, CO February 2014 Jackson Hole, WY June 2005 Cherry Creek, CO September 2007 Boulder, CO January 2005 Northern Colorado Fort Collins, CO March 2004 Denver, CO January 2012 Laramie, WY September 2017 Greenwood Village, CO September 2011 Phoenix, AZ October 2015 Aspen, CO 2004 2006 2008 2010 2012 2014 2016 2018 November 2008 Scottsdale, AZ May 2008 Los Angeles, CA 6 February 2015 Fort Collins, CO 2019 June 2019 Vail Valley Avon, CO |
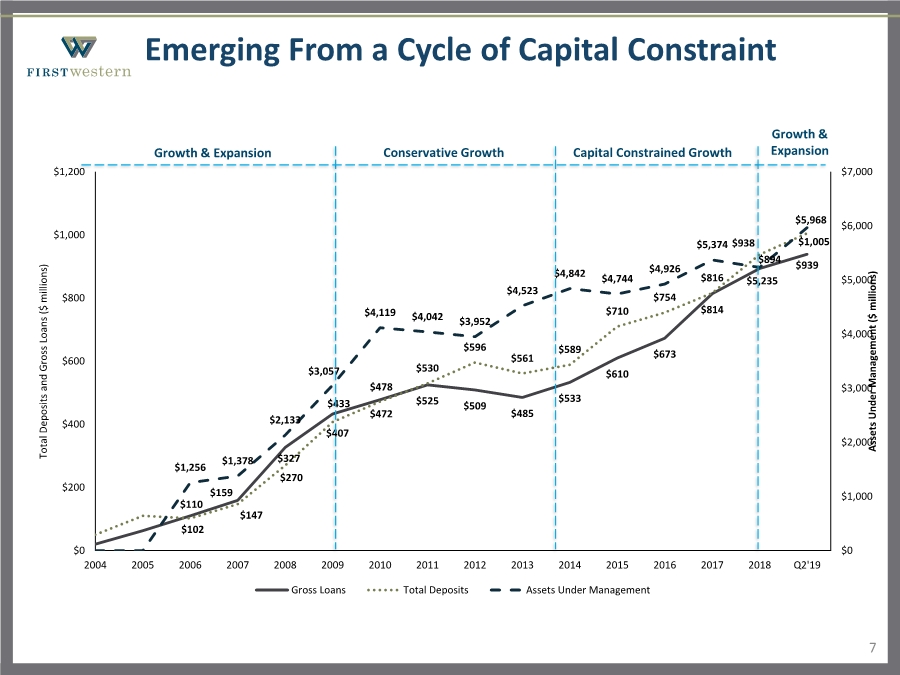
| $110 $159 $327 $433 $478 $525 $509 $485 $533 $610 $673 $814 $894 $939 $102 $147 $270 $407 $472 $530 $596 $561 $589 $710 $754 $816 $938 $1,005 $1,256 $1,378 $2,133 $3,057 $4,119 $4,042 $3,952 $4,523 $4,842 $4,744 $4,926 $5,374 $5,235 $5,968 $0 $1,000 $2,000 $3,000 $4,000 $5,000 $6,000 $7,000 $0 $200 $400 $600 $800 $1,000 $1,200 2004 2005 2006 2007 2008 2009 2010 2011 2012 2013 2014 2015 2016 2017 2018 Q2'19 Assets Under Management ($ millions) Total Deposits and Gross Loans ($ millions) Gross Loans Total Deposits Assets Under Management 7 Emerging From a Cycle of Capital Constraint Growth & Expansion Conservative Growth Capital Constrained Growth Growth & Expansion |
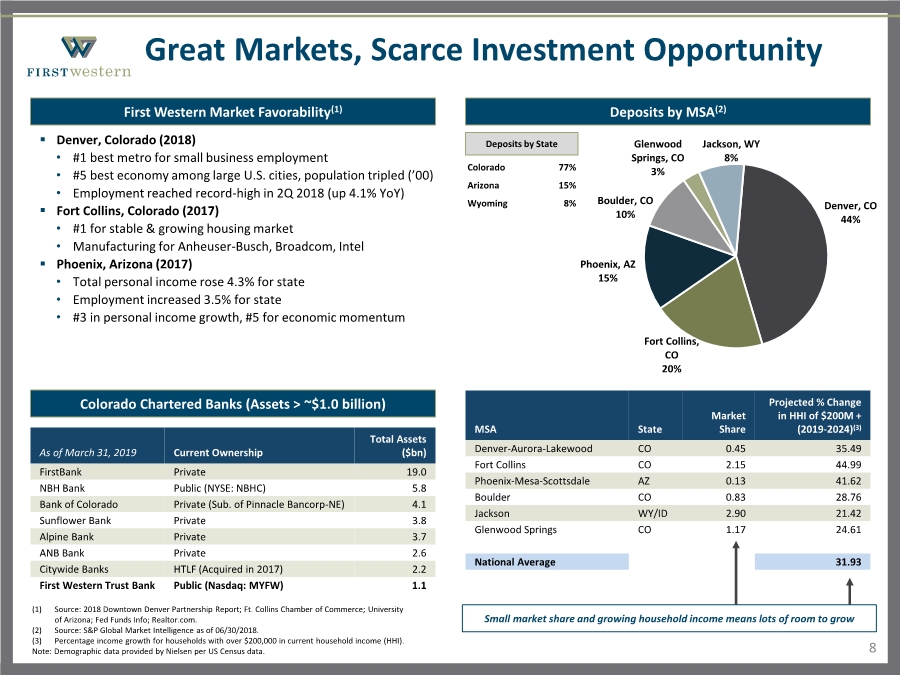
| MSA State Market Share Projected % Change in HHI of $200M + (2019-2024)(3) Denver-Aurora-Lakewood CO 0.45 35.49 Fort Collins CO 2.15 44.99 Phoenix-Mesa-Scottsdale AZ 0.13 41.62 Boulder CO 0.83 28.76 Jackson WY/ID 2.90 21.42 Glenwood Springs CO 1.17 24.61 National Average 31.93 8 (1) Source: 2018 Downtown Denver Partnership Report; Ft. Collins Chamber of Commerce; University of Arizona; Fed Funds Info; Realtor.com. (2) Source: S&P Global Market Intelligence as of 06/30/2018. (3) Percentage income growth for households with over $200,000 in current household income (HHI). Note: Demographic data provided by Nielsen per US Census data. Small market share and growing household income means lots of room to grow Deposits by MSA(2) First Western Market Favorability(1) Great Markets, Scarce Investment Opportunity ▪ Denver, Colorado (2018) •#1 best metro for small business employment •#5 best economy among large U.S. cities, population tripled (’00) • Employment reached record-high in 2Q 2018 (up 4.1% YoY) ▪ Fort Collins, Colorado (2017) •#1 for stable & growing housing market • Manufacturing for Anheuser-Busch, Broadcom, Intel ▪ Phoenix, Arizona (2017) • Total personal income rose 4.3% for state • Employment increased 3.5% for state •#3 in personal income growth, #5 for economic momentum Deposits by State Colorado 77% Arizona 15% Wyoming 8% Colorado Chartered Banks (Assets > ~$1.0 billion) Denver, CO 44% Fort Collins, CO 20% Phoenix, AZ 15% Boulder, CO 10% Glenwood Springs, CO 3% Jackson, WY 8% As of March 31, 2019 Current Ownership Total Assets ($bn) FirstBank Private 19.0 NBH Bank Public (NYSE: NBHC) 5.8 Bank of Colorado Private (Sub. of Pinnacle Bancorp-NE) 4.1 Sunflower Bank Private 3.8 Alpine Bank Private 3.7 ANB Bank Private 2.6 Citywide Banks HTLF (Acquired in 2017) 2.2 First Western Trust Bank Public (Nasdaq: MYFW) 1.1 |
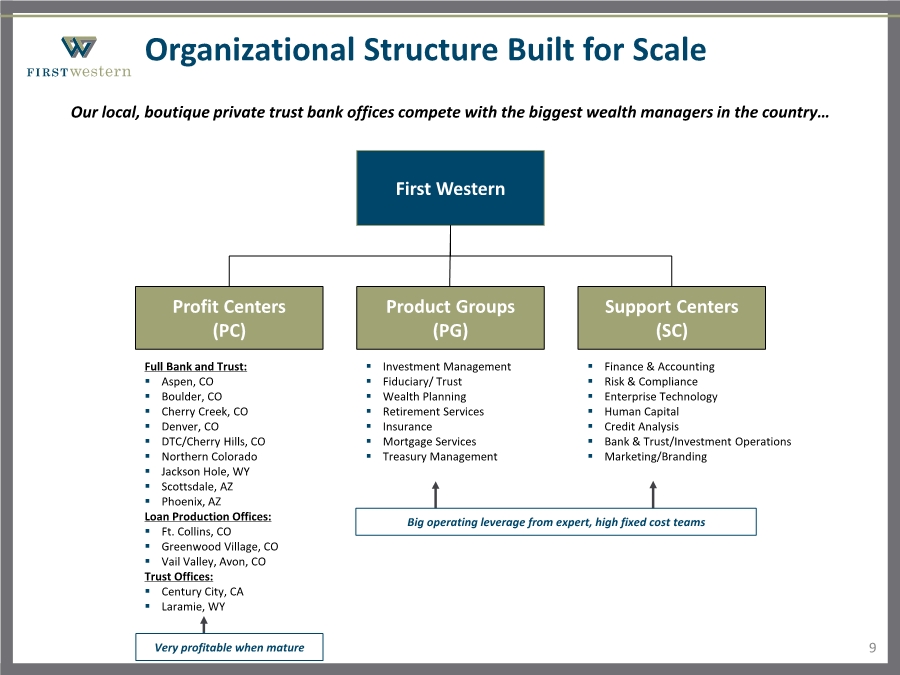
| ▪ Finance & Accounting ▪ Risk & Compliance ▪ Enterprise Technology ▪ Human Capital ▪ Credit Analysis ▪ Bank & Trust/Investment Operations ▪ Marketing/Branding Our local, boutique private trust bank offices compete with the biggest wealth managers in the country… First Western Product Groups (PG) Support Centers (SC) Profit Centers (PC) Organizational Structure Built for Scale ▪ Investment Management ▪ Fiduciary/ Trust ▪ Wealth Planning ▪ Retirement Services ▪ Insurance ▪ Mortgage Services ▪ Treasury Management Full Bank and Trust: ▪ Aspen, CO ▪ Boulder, CO ▪ Cherry Creek, CO ▪ Denver, CO ▪ DTC/Cherry Hills, CO ▪ Northern Colorado ▪ Jackson Hole, WY ▪ Scottsdale, AZ ▪ Phoenix, AZ Loan Production Offices: ▪ Ft. Collins, CO ▪ Greenwood Village, CO ▪ Vail Valley, Avon, CO Trust Offices: ▪ Century City, CA ▪ Laramie, WY 9 Big operating leverage from expert, high fixed cost teams Very profitable when mature |
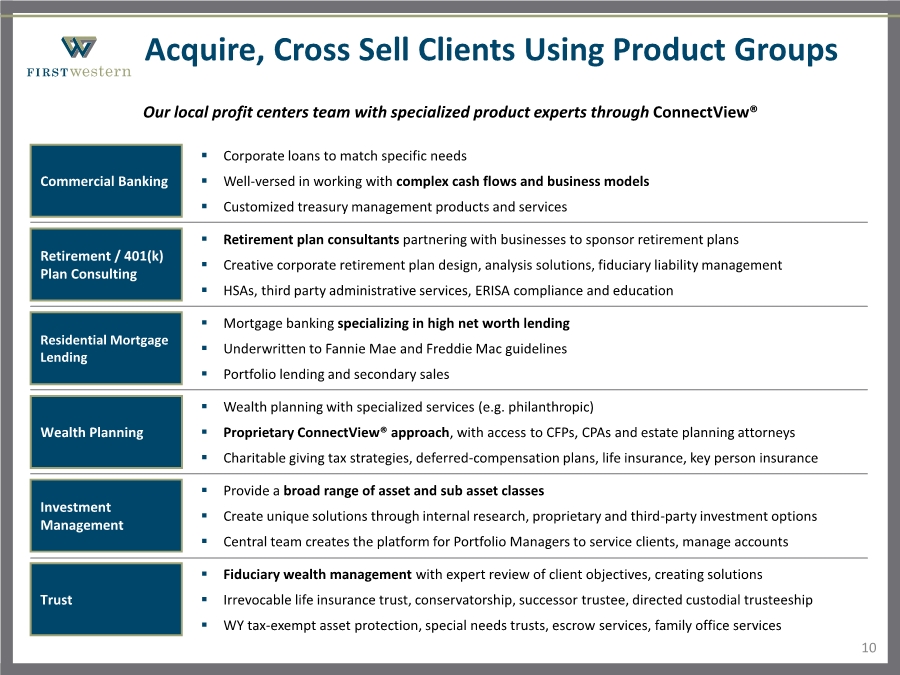
| Acquire, Cross Sell Clients Using Product Groups 10 Wealth Planning Commercial Banking Investment Management Residential Mortgage Lending Retirement / 401(k) Plan Consulting Trust ▪ Wealth planning with specialized services (e.g. philanthropic) ▪ Proprietary ConnectView® approach, with access to CFPs, CPAs and estate planning attorneys ▪ Charitable giving tax strategies, deferred-compensation plans, life insurance, key person insurance ▪ Corporate loans to match specific needs ▪ Well-versed in working with complex cash flows and business models ▪ Customized treasury management products and services ▪ Provide a broad range of asset and sub asset classes ▪ Create unique solutions through internal research, proprietary and third-party investment options ▪ Central team creates the platform for Portfolio Managers to service clients, manage accounts ▪ Mortgage banking specializing in high net worth lending ▪ Underwritten to Fannie Mae and Freddie Mac guidelines ▪ Portfolio lending and secondary sales ▪ Retirement plan consultants partnering with businesses to sponsor retirement plans ▪ Creative corporate retirement plan design, analysis solutions, fiduciary liability management ▪ HSAs, third party administrative services, ERISA compliance and education ▪ Fiduciary wealth management with expert review of client objectives, creating solutions ▪ Irrevocable life insurance trust, conservatorship, successor trustee, directed custodial trusteeship ▪ WY tax-exempt asset protection, special needs trusts, escrow services, family office services Our local profit centers team with specialized product experts through ConnectView® |
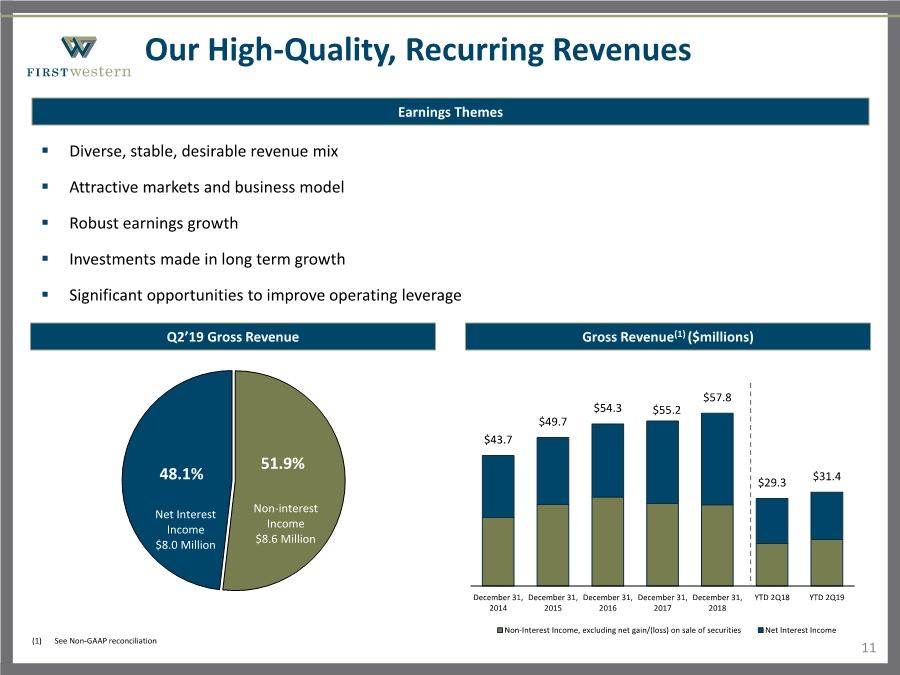
| $43.7 $49.7 $54.3 $55.2 $57.8 $29.3 $31.4 December 31, 2014 December 31, 2015 December 31, 2016 December 31, 2017 December 31, 2018 YTD 2Q18 YTD 2Q19 Non-Interest Income, excluding net gain/(loss) on sale of securities Net Interest Income Our High-Quality, Recurring Revenues 11 (1) See Non-GAAP reconciliation Earnings Themes ▪ Diverse, stable, desirable revenue mix ▪ Attractive markets and business model ▪ Robust earnings growth ▪ Investments made in long term growth ▪ Significant opportunities to improve operating leverage Gross Revenue(1) ($millions) Non-interest Income $8.6 Million Net Interest Income $8.0 Million 48.1% 51.9% Q2’19 Gross Revenue |
| $43.5 $45.6 $49.8 $49.5 $50.2 $27.3 December 31, 2014 December 31, 2015 December 31, 2016 December 31, 2017 December 31, 2018 YTD 2Q19 $43.7 $49.7 $54.3 $55.2 $57.8 $31.3 December 31, 2014 December 31, 2015 December 31, 2016 December 31, 2017 December 31, 2018 YTD 2Q19 Revenue Growth Exceeding Expense Growth 12 Gross Revenue(1) ($millions) Total Non-Interest Expenses ($millions) (1) See Non-GAAP reconciliation $486 $4,774 $4,556 $5,795 $7,602 December 31, 2014 December 31, 2015 December 31, 2016 December 31, 2017 December 31, 2018 2014-2018 Pre-Tax, Pre-Provision Income(1) ($000s) Earnings Per Share $0.18 $0.15 $0.08 $0.19 $0.22 $0.21 $0.33 Q2 2018 Q3 2018 Q4 2018 Q1 2019 Q2 2019 EPS Adjustment for Goodwill Impairment (1) |

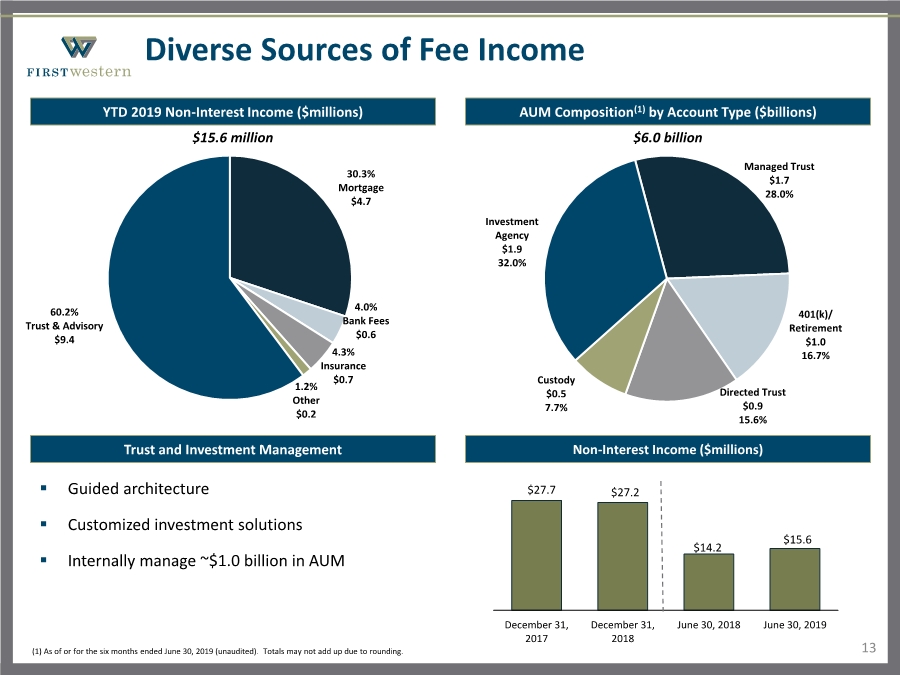
| Managed Trust $1.7 28.0% 401(k)/ Retirement $1.0 16.7% Directed Trust $0.9 15.6% Custody $0.5 7.7% Investment Agency $1.9 32.0% $27.7 $27.2 $14.2 $15.6 December 31, 2017 December 31, 2018 June 30, 2018 June 30, 2019 Diverse Sources of Fee Income 13 (1) As of or for the six months ended June 30, 2019 (unaudited). Totals may not add up due to rounding. AUM Composition(1) by Account Type ($billions) YTD 2019 Non-Interest Income ($millions) Trust and Investment Management ▪ Guided architecture ▪ Customized investment solutions ▪ Internally manage ~$1.0 billion in AUM $6.0 billion Non-Interest Income ($millions) $15.6 million 30.3% Mortgage $4.7 4.0% Bank Fees $0.6 4.3% Insurance $0.7 1.2% Other $0.2 60.2% Trust & Advisory $9.4 |
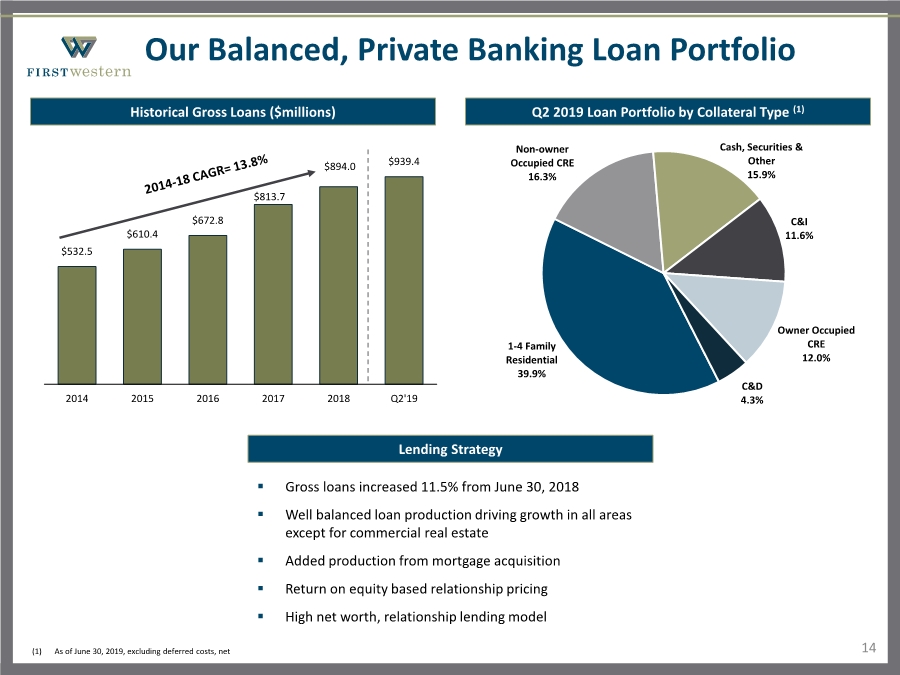
| $532.5 $610.4 $672.8 $813.7 $894.0 $939.4 2014 2015 2016 2017 2018 Q2'19 Our Balanced, Private Banking Loan Portfolio 14 Historical Gross Loans ($millions) Q2 2019 Loan Portfolio by Collateral Type (1) Lending Strategy (1) As of June 30, 2019, excluding deferred costs, net ▪ Gross loans increased 11.5% from June 30, 2018 ▪ Well balanced loan production driving growth in all areas except for commercial real estate ▪ Added production from mortgage acquisition ▪ Return on equity based relationship pricing ▪ High net worth, relationship lending model 1-4 Family Residential 39.9% Non-owner Occupied CRE 16.3% Cash, Securities & Other 15.9% C&I 11.6% Owner Occupied CRE 12.0% C&D 4.3% |
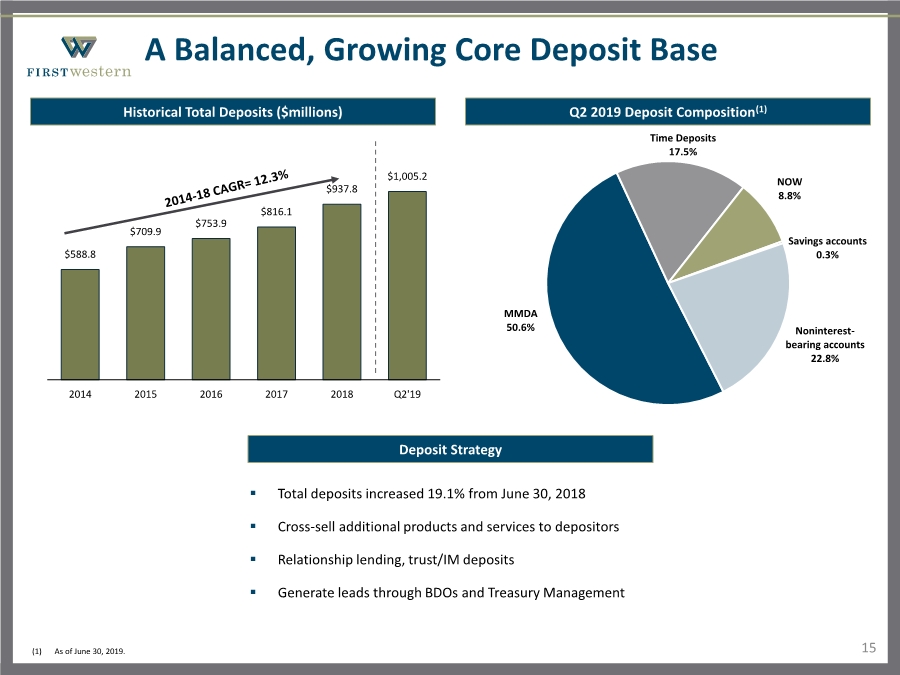
| $588.8 $709.9 $753.9 $816.1 $937.8 $1,005.2 2014 2015 2016 2017 2018 Q2'19 A Balanced, Growing Core Deposit Base 15 Historical Total Deposits ($millions) Q2 2019 Deposit Composition(1) Deposit Strategy (1) As of June 30, 2019. ▪ Total deposits increased 19.1% from June 30, 2018 ▪ Cross-sell additional products and services to depositors ▪ Relationship lending, trust/IM deposits ▪ Generate leads through BDOs and Treasury Management MMDA 50.6% Time Deposits 17.5% NOW 8.8% Savings accounts 0.3% Noninterest- bearing accounts 22.8% |
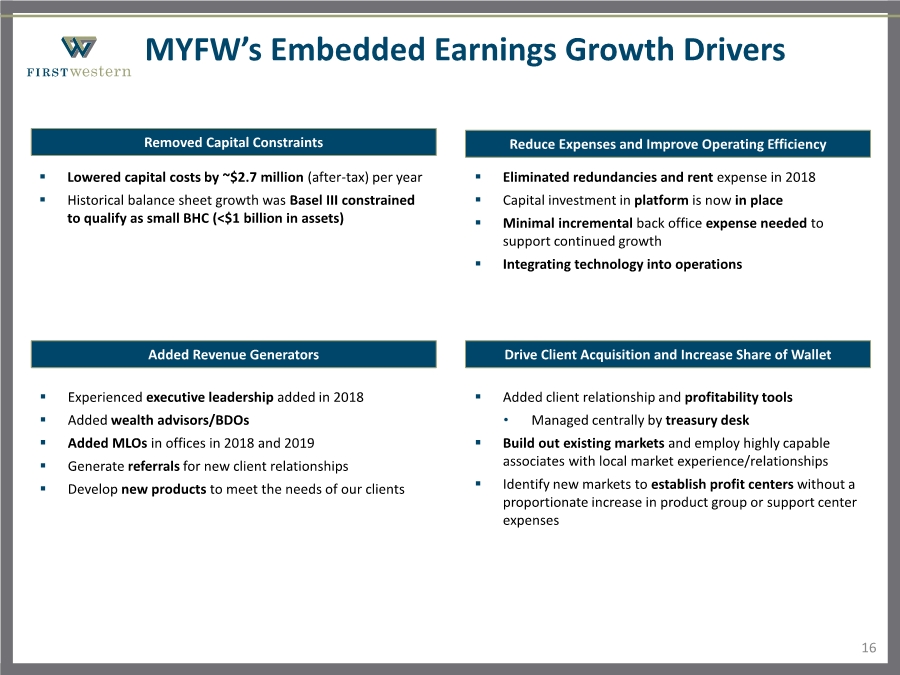
| 16 MYFW’s Embedded Earnings Growth Drivers Removed Capital Constraints Reduce Expenses and Improve Operating Efficiency Added Revenue Generators Drive Client Acquisition and Increase Share of Wallet ▪ Lowered capital costs by ~$2.7 million (after-tax) per year ▪ Historical balance sheet growth was Basel III constrained to qualify as small BHC (<$1 billion in assets) ▪ Eliminated redundancies and rent expense in 2018 ▪ Capital investment in platform is now in place ▪ Minimal incremental back office expense needed to support continued growth ▪ Integrating technology into operations ▪ Experienced executive leadership added in 2018 ▪ Added wealth advisors/BDOs ▪ Added MLOs in offices in 2018 and 2019 ▪ Generate referrals for new client relationships ▪ Develop new products to meet the needs of our clients ▪ Added client relationship and profitability tools • Managed centrally by treasury desk ▪ Build out existing markets and employ highly capable associates with local market experience/relationships ▪ Identify new markets to establish profit centers without a proportionate increase in product group or support center expenses |
| Outlook 17 ▪ Business development platform expected to continue to gain traction and drive further increases in gross revenue ▪ Second half of 2019 expected to be as strong as the first half ▪ Mortgage activity expected to remain strong ▪ Continued improvement in operating efficiencies despite further investment in revenue generating positions ▪ Expansion into Vail Valley market enhances new business development opportunities ▪ Share repurchase program supports attractive investment opportunity |
| Appendix |
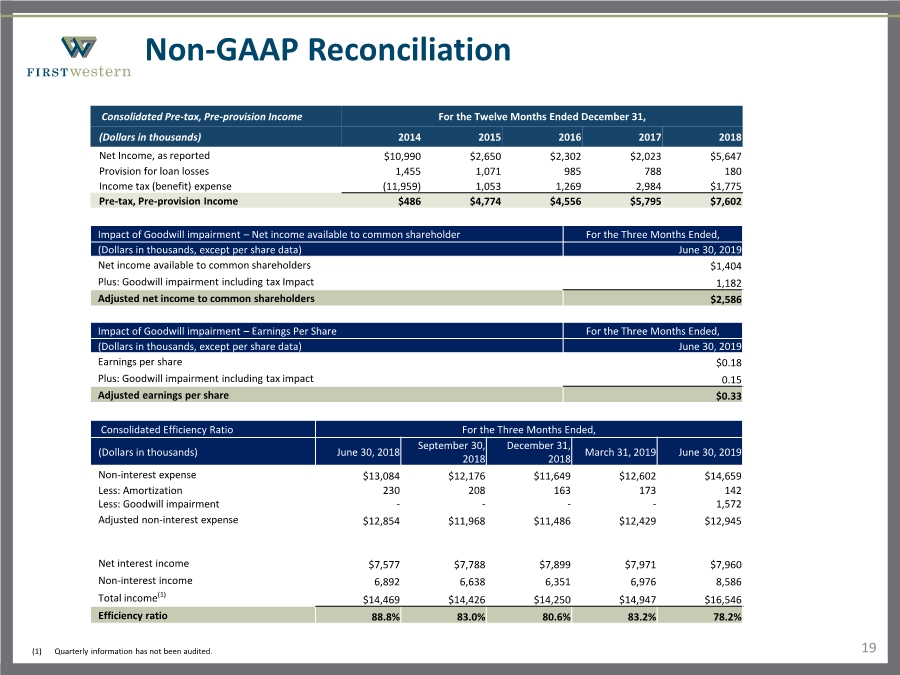
| 19 Non-GAAP Reconciliation Consolidated Pre-tax, Pre-provision Income For the Twelve Months Ended December 31, (Dollars in thousands) 2014 2015 2016 2017 2018 Net Income, as reported $10,990 $2,650 $2,302 $2,023 $5,647 Provision for loan losses 1,455 1,071 985 788 180 Income tax (benefit) expense (11,959) 1,053 1,269 2,984 $1,775 Pre-tax, Pre-provision Income $486 $4,774 $4,556 $5,795 $7,602 (1) Quarterly information has not been audited. Impact of Goodwill impairment – Net income available to common shareholder For the Three Months Ended, (Dollars in thousands, except per share data) June 30, 2019 Net income available to common shareholders $1,404 Plus: Goodwill impairment including tax Impact 1,182 Adjusted net income to common shareholders $2,586 Impact of Goodwill impairment – Earnings Per Share For the Three Months Ended, (Dollars in thousands, except per share data) June 30, 2019 Earnings per share $0.18 Plus: Goodwill impairment including tax impact 0.15 Adjusted earnings per share $0.33 Consolidated Efficiency Ratio For the Three Months Ended, (Dollars in thousands) June 30, 2018 September 30, 2018 December 31, 2018 March 31, 2019 June 30, 2019 Non-interest expense $13,084 $12,176 $11,649 $12,602 $14,659 Less: Amortization Less: Goodwill impairment 230 - 208 - 163 - 173 - 142 1,572 Adjusted non-interest expense $12,854 $11,968 $11,486 $12,429 $12,945 Net interest income $7,577 $7,788 $7,899 $7,971 $7,960 Non-interest income 6,892 6,638 6,351 6,976 8,586 Total income(1) $14,469 $14,426 $14,250 $14,947 $16,546 Efficiency ratio 88.8% 83.0% 80.6% 83.2% 78.2% |
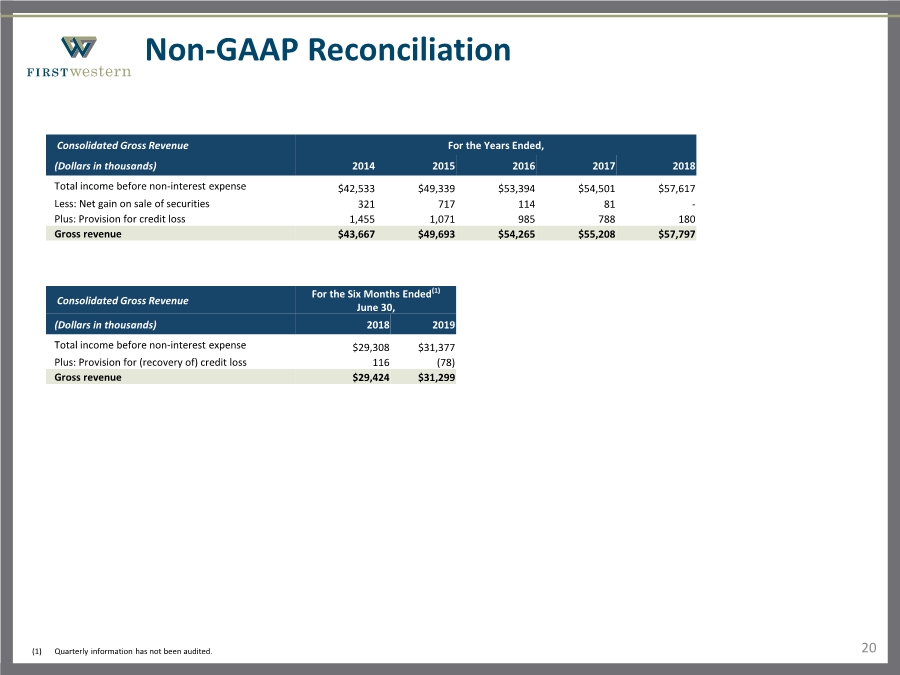
| 20 Non-GAAP Reconciliation Consolidated Gross Revenue For the Years Ended, (Dollars in thousands) 2014 2015 2016 2017 2018 Total income before non-interest expense $42,533 $49,339 $53,394 $54,501 $57,617 Less: Net gain on sale of securities 321 717 114 81 - Plus: Provision for credit loss 1,455 1,071 985 788 180 Gross revenue $43,667 $49,693 $54,265 $55,208 $57,797 Consolidated Gross Revenue For the Six Months Ended(1) June 30, (Dollars in thousands) 2018 2019 Total income before non-interest expense $29,308 $31,377 Plus: Provision for (recovery of) credit loss 116 (78) Gross revenue $29,424 $31,299 (1) Quarterly information has not been audited. |