Exhibit 99.2
| First Western Financial, Inc. The First, Western-Based Private Trust Bank Fourth Quarter 2019 Financial Results |

| Safe Harbor 2 This presentation contains “forward-looking statements” within the meaning of Section 27A of the Securities Act of 1933, as amended, and Section 21E of the Securities Exchange Act of 1934, as amended. These forward-looking statements reflect the current views of First Western Financial, Inc.’s (“First Western”) management with respect to, among other things, future events and First Western’s financial performance. These statements are often, but not always, made through the use of words or phrases such as “may,” “should,” “could,” “predict,” “potential,” “believe,” “will likely result,” “expect,” “continue,” “will,” “anticipate,” “seek,” “estimate,” “intend,” “plan,” “project,” “future” “forecast,” “goal,” “target,” “would” and “outlook,” or the negative variations of those words or other comparable words of a future or forward-looking nature. These forward-looking statements are not historical facts, and are based on current expectations, estimates and projections about First Western’s industry, management’s beliefs and certain assumptions made by management, many of which, by their nature, are inherently uncertain and beyond First Western’s control. Accordingly, First Western cautions you that any such forward-looking statements are not guarantees of future performance and are subject to risks, assumptions and uncertainties that are difficult to predict. Although First Western believes that the expectations reflected in these forward-looking statements are reasonable as of the date made, actual results may prove to be materially different from the results expressed or implied by the forward-looking statements. All subsequent written and oral forward-looking statements attributable to First Western or persons acting on First Western’s behalf are expressly qualified in their entirety by this paragraph. Forward-looking statements speak only as of the date of this presentation. First Western undertakes no obligation to publicly update or otherwise revise any forward-looking statements, whether as a result of new information, future events or otherwise (except as required by law). Certain of the information contained herein may be derived from information provided by industry sources. The Company believes that such information is accurate and the sources from which it has been obtained are reliable; however, the Company cannot guaranty the accuracy of such information and has not independently verified such information. This presentation contains certain non-GAAP financial measures intended to supplement, not substitute for, comparable GAAP measures. Reconciliations of non-GAAP financial measures to GAAP financial measures are provided at the end of this presentation. Numbers in the presentation may not sum due to rounding. |
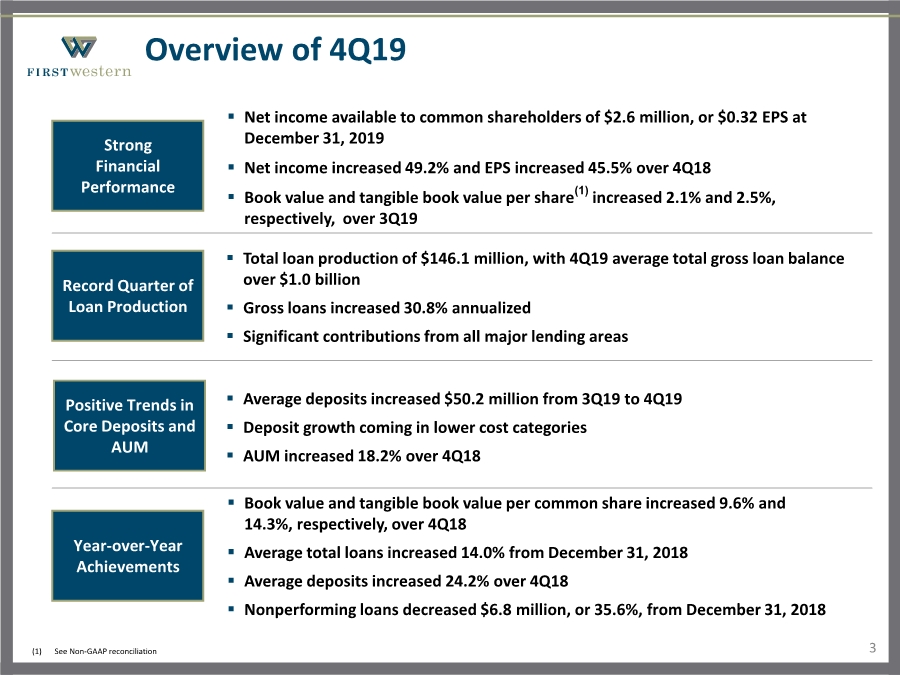
| Overview of 4Q19 Positive Trends in Core Deposits and AUM Strong Financial Performance Record Quarter of Loan Production .. Total loan production of $146.1 million, with 4Q19 average total gross loan balance over $1.0 billion ..Gross loans increased 30.8% annualized .. Significant contributions from all major lending areas .. Book value and tangible book value per common share increased 9.6% and 14.3%, respectively, over 4Q18 .. Average total loans increased 14.0% from December 31, 2018 .. Average deposits increased 24.2% over 4Q18 .. Nonperforming loans decreased $6.8 million, or 35.6%, from December 31, 2018 Year-over-Year Achievements .. Average deposits increased $50.2 million from 3Q19 to 4Q19 .. Deposit growth coming in lower cost categories .. AUM increased 18.2% over 4Q18 3 .. Net income available to common shareholders of $2.6 million, or $0.32 EPS at December 31, 2019 .. Net income increased 49.2% and EPS increased 45.5% over 4Q18 .. Book value and tangible book value per share(1) increased 2.1% and 2.5%, respectively, over 3Q19 (1) See Non-GAAP reconciliation |
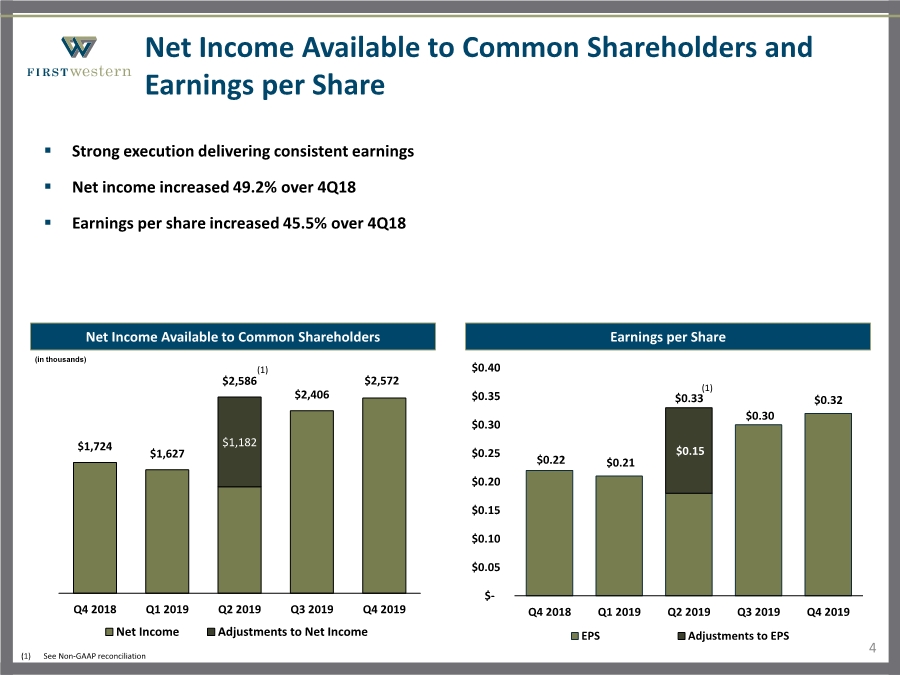
| $0.22 $0.21 $0.30 $0.32 $0.15 $0.33 $- $0.05 $0.10 $0.15 $0.20 $0.25 $0.30 $0.35 $0.40 Q4 2018 Q1 2019 Q2 2019 Q3 2019 Q4 2019 EPS Adjustments to EPS (1) Net Income Available to Common Shareholders and Earnings per Share 4 Net Income Available to Common Shareholders .. Strong execution delivering consistent earnings .. Net income increased 49.2% over 4Q18 .. Earnings per share increased 45.5% over 4Q18 Earnings per Share (in thousands) $1,182 $1,724 $1,627 $2,586 $2,406 $2,572 Q4 2018 Q1 2019 Q2 2019 Q3 2019 Q4 2019 Net Income Adjustments to Net Income (1) (1) See Non-GAAP reconciliation |
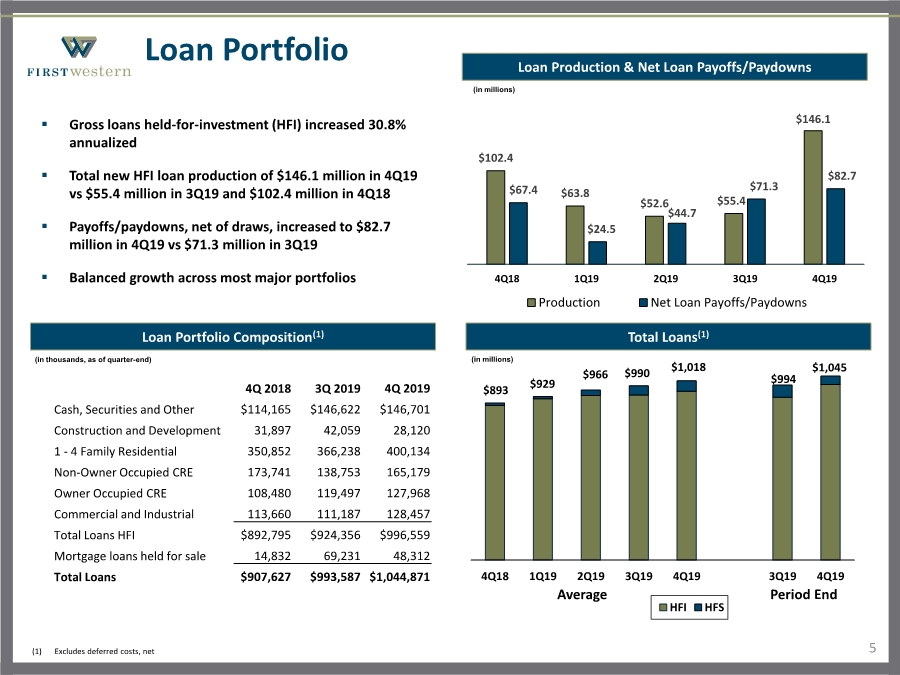
| $893 $929 $966 $990 $1,018 $994 $1,045 4Q18 1Q19 2Q19 3Q19 4Q19 3Q19 4Q19 HFI HFS Average Period End Loan Portfolio 5 Loan Portfolio Composition(1) .. Gross loans held-for-investment (HFI) increased 30.8% annualized .. Total new HFI loan production of $146.1 million in 4Q19 vs $55.4 million in 3Q19 and $102.4 million in 4Q18 .. Payoffs/paydowns, net of draws, increased to $82.7 million in 4Q19 vs $71.3 million in 3Q19 .. Balanced growth across most major portfolios (in thousands, as of quarter-end) Total Loans(1) (in millions) (1) Excludes deferred costs, net 4Q 2018 3Q 2019 4Q 2019 Cash, Securities and Other $114,165 $146,622 $146,701 Construction and Development 31,897 42,059 28,120 1 - 4 Family Residential 350,852 366,238 400,134 Non-Owner Occupied CRE 173,741 138,753 165,179 Owner Occupied CRE 108,480 119,497 127,968 Commercial and Industrial 113,660 111,187 128,457 Total Loans HFI $892,795 $924,356 $996,559 Mortgage loans held for sale 14,832 69,231 48,312 Total Loans $907,627 $993,587 $1,044,871 Loan Production & Net Loan Payoffs/Paydowns $102.4 $63.8 $52.6 $55.4 $146.1 $67.4 $24.5 $44.7 $71.3 $82.7 4Q18 1Q19 2Q19 3Q19 4Q19 Production Net Loan Payoffs/Paydowns (in millions) |
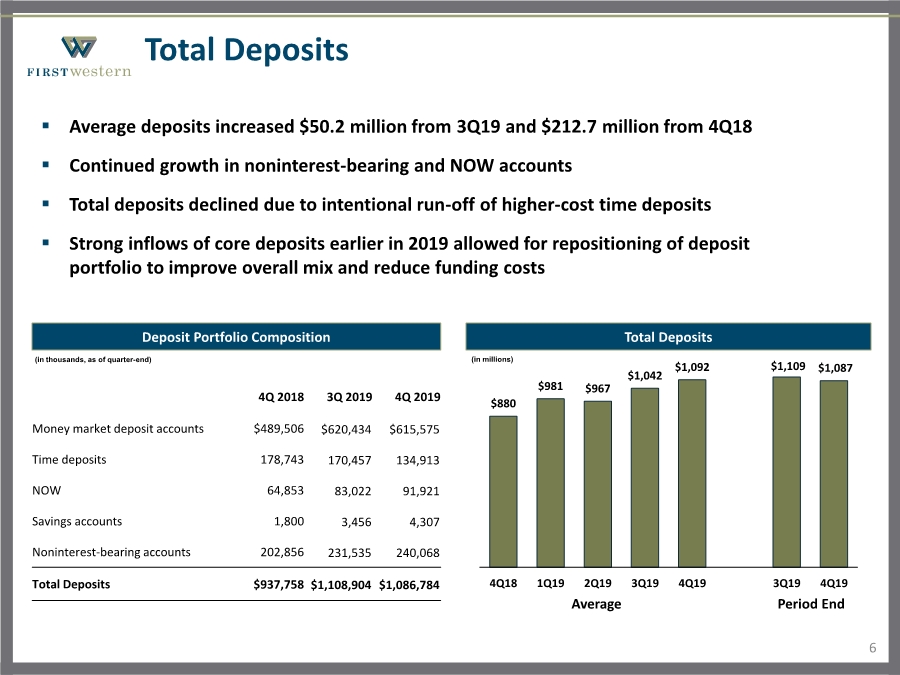
| $880 $981 $967 $1,042 $1,092 $1,109 $1,087 4Q18 1Q19 2Q19 3Q19 4Q19 3Q19 4Q19 Average Period End Total Deposits 6 Deposit Portfolio Composition .. Average deposits increased $50.2 million from 3Q19 and $212.7 million from 4Q18 .. Continued growth in noninterest-bearing and NOW accounts .. Total deposits declined due to intentional run-off of higher-cost time deposits .. Strong inflows of core deposits earlier in 2019 allowed for repositioning of deposit portfolio to improve overall mix and reduce funding costs 4Q 2018 3Q 2019 4Q 2019 Money market deposit accounts $489,506 $620,434 $615,575 Time deposits 178,743 170,457 134,913 NOW 64,853 83,022 91,921 Savings accounts 1,800 3,456 4,307 Noninterest-bearing accounts 202,856 231,535 240,068 Total Deposits $937,758 $1,108,904 $1,086,784 (in thousands, as of quarter-end) Total Deposits (in millions) |
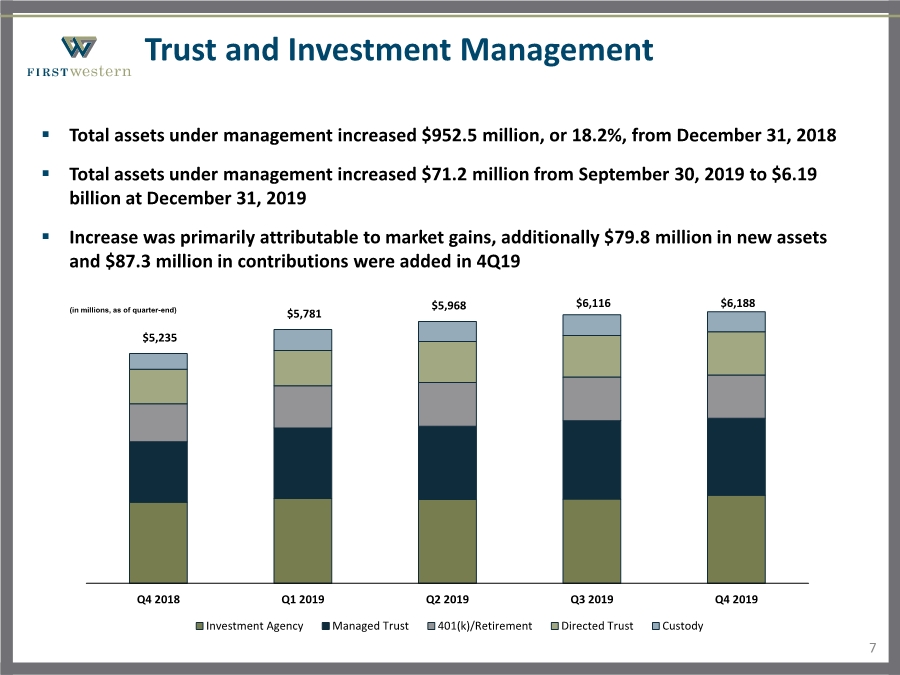
| Trust and Investment Management .. Total assets under management increased $952.5 million, or 18.2%, from December 31, 2018 .. Total assets under management increased $71.2 million from September 30, 2019 to $6.19 billion at December 31, 2019 .. Increase was primarily attributable to market gains, additionally $79.8 million in new assets and $87.3 million in contributions were added in 4Q19 $5,235 $5,781 $5,968 $6,116 $6,188 Q4 2018 Q1 2019 Q2 2019 Q3 2019 Q4 2019 Investment Agency Managed Trust 401(k)/Retirement Directed Trust Custody (in millions, as of quarter-end) 7 |
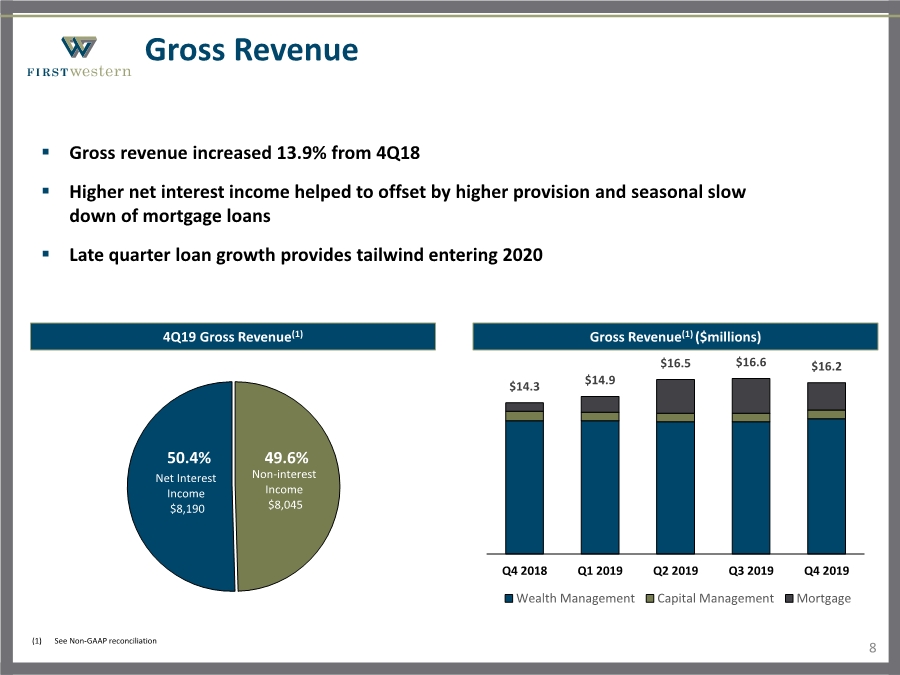
| Non-interest Income $8,045 Net Interest Income $8,190 50.4% 49.6% Gross Revenue 8 (1) See Non-GAAP reconciliation 4Q19 Gross Revenue(1) .. Gross revenue increased 13.9% from 4Q18 .. Higher net interest income helped to offset by higher provision and seasonal slow down of mortgage loans .. Late quarter loan growth provides tailwind entering 2020 Gross Revenue(1) ($millions) $14.3 $14.9 $16.5 $16.6 $16.2 Q4 2018 Q1 2019 Q2 2019 Q3 2019 Q4 2019 Wealth Management Capital Management Mortgage |
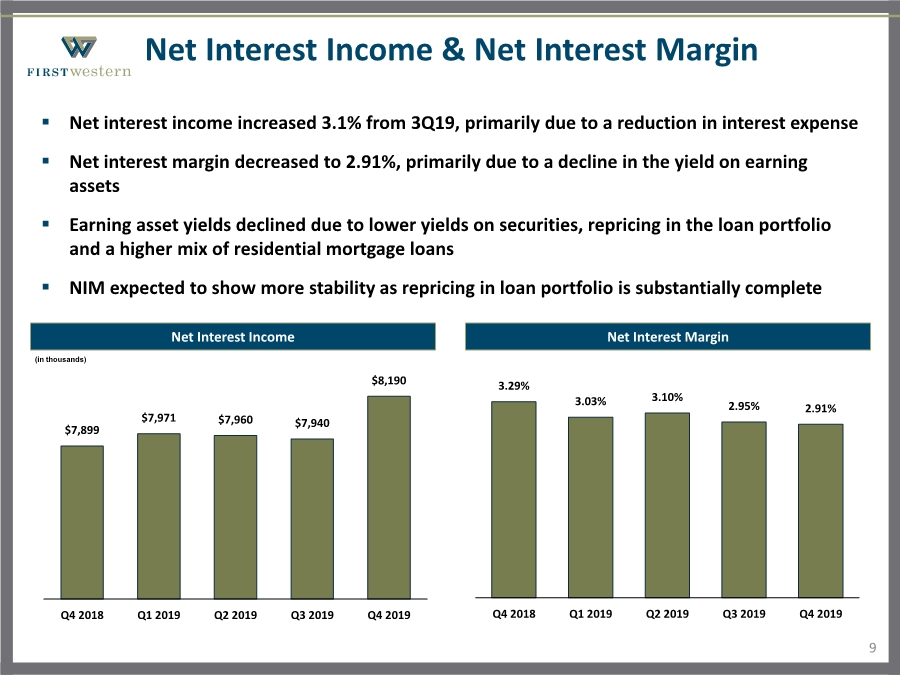
| Net Interest Income & Net Interest Margin 9 Net Interest Income .. Net interest income increased 3.1% from 3Q19, primarily due to a reduction in interest expense .. Net interest margin decreased to 2.91%, primarily due to a decline in the yield on earning assets .. Earning asset yields declined due to lower yields on securities, repricing in the loan portfolio and a higher mix of residential mortgage loans .. NIM expected to show more stability as repricing in loan portfolio is substantially complete Net Interest Margin 3.29% 3.03% 3.10% 2.95% 2.91% Q4 2018 Q1 2019 Q2 2019 Q3 2019 Q4 2019 $7,899 $7,971 $7,960 $7,940 $8,190 Q4 2018 Q1 2019 Q2 2019 Q3 2019 Q4 2019 (in thousands) |
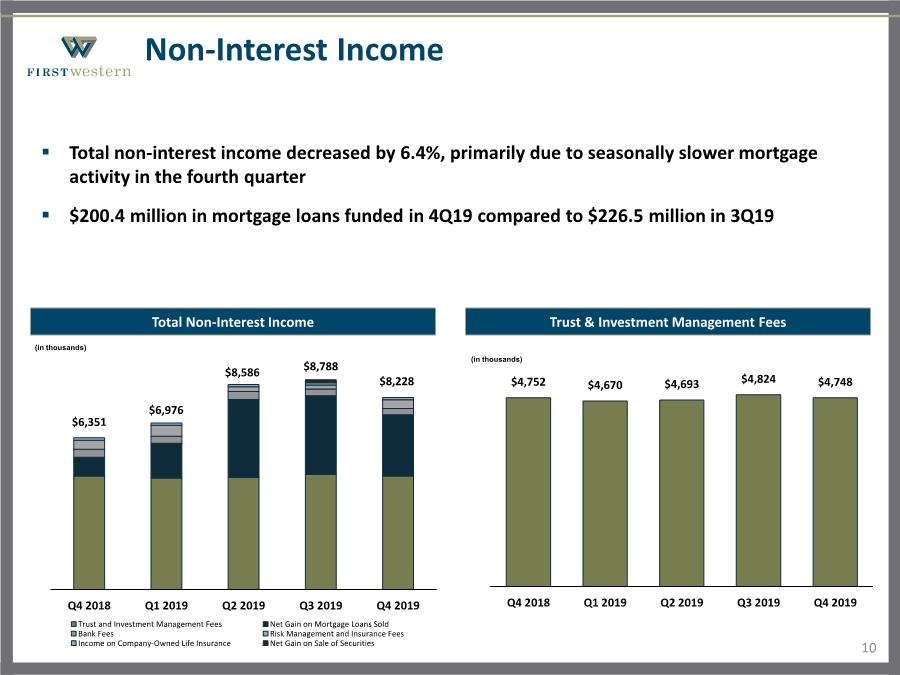
| Non-Interest Income 10 Total Non-Interest Income .. Total non-interest income decreased by 6.4%, primarily due to seasonally slower mortgage activity in the fourth quarter .. $200.4 million in mortgage loans funded in 4Q19 compared to $226.5 million in 3Q19 Trust & Investment Management Fees $6,351 $6,976 $8,586 $8,788 $8,228 Q4 2018 Q1 2019 Q2 2019 Q3 2019 Q4 2019 Trust and Investment Management Fees Net Gain on Mortgage Loans Sold Bank Fees Risk Management and Insurance Fees Income on Company-Owned Life Insurance Net Gain on Sale of Securities (in thousands) (in thousands) $4,752 $4,670 $4,693 $4,824 $4,748 Q4 2018 Q1 2019 Q2 2019 Q3 2019 Q4 2019 |
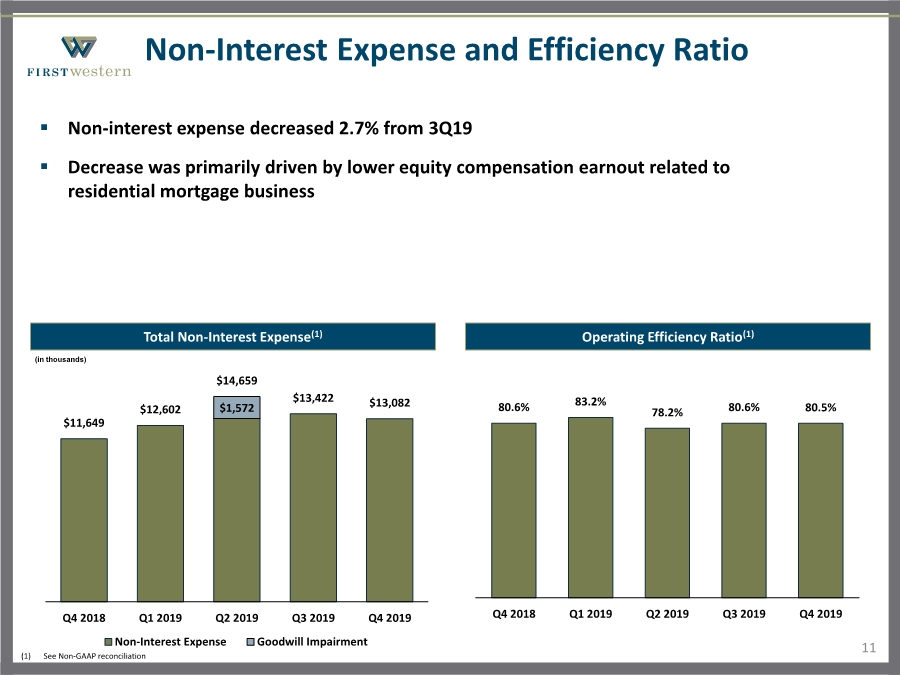
| Non-Interest Expense and Efficiency Ratio 11 Total Non-Interest Expense(1) .. Non-interest expense decreased 2.7% from 3Q19 .. Decrease was primarily driven by lower equity compensation earnout related to residential mortgage business Operating Efficiency Ratio(1) 80.6% 83.2% 78.2% 80.6% 80.5% Q4 2018 Q1 2019 Q2 2019 Q3 2019 Q4 2019 $1,572 $11,649 $12,602 $14,659 $13,422 $13,082 Q4 2018 Q1 2019 Q2 2019 Q3 2019 Q4 2019 Non-Interest Expense Goodwill Impairment (in thousands) (1) See Non-GAAP reconciliation |
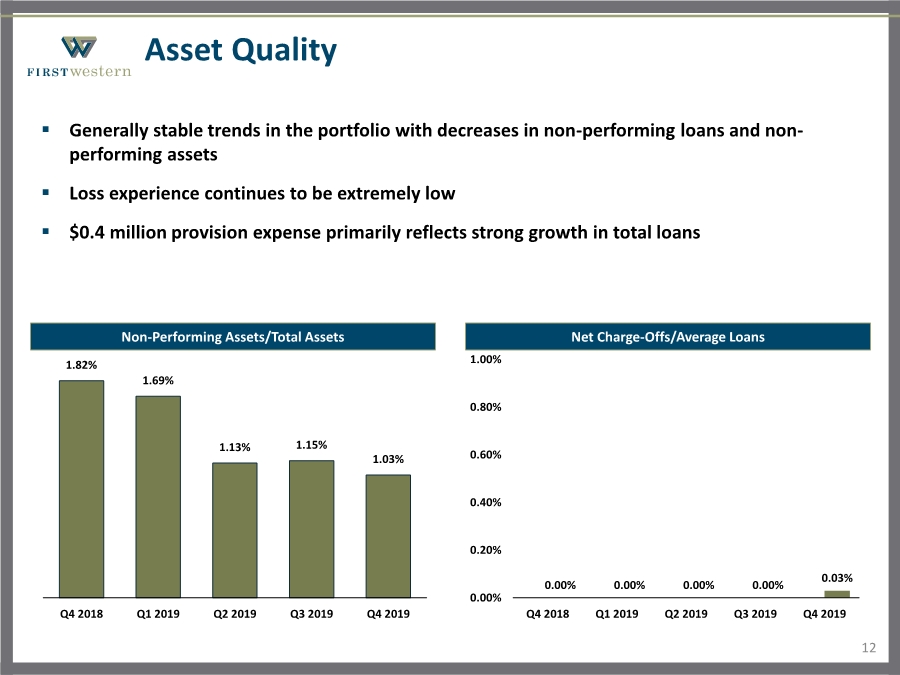
| Asset Quality 12 Non-Performing Assets/Total Assets .. Generally stable trends in the portfolio with decreases in non-performing loans and non- performing assets .. Loss experience continues to be extremely low .. $0.4 million provision expense primarily reflects strong growth in total loans Net Charge-Offs/Average Loans 0.00% 0.00% 0.00% 0.00% 0.03% 0.00% 0.20% 0.40% 0.60% 0.80% 1.00% Q4 2018 Q1 2019 Q2 2019 Q3 2019 Q4 2019 1.82% 1.69% 1.13% 1.15% 1.03% Q4 2018 Q1 2019 Q2 2019 Q3 2019 Q4 2019 |
| Outlook 13 .. Increased focus on asset generation expected to complement success in growing total deposits and AUM .. Commercial banking initiative focused on building expertise in specific vertical markets 1Q20 launch of first vertical market: medical and dental practices .. Continued growth in newer markets such as Vail Valley and Broomfield .. Mortgage activity expected to be consistent with 2019 .. Continued revenue growth is expected to drive further operating leverage .. 2020 expected to be another year of strong earnings growth and improved profitability |
| Appendix |
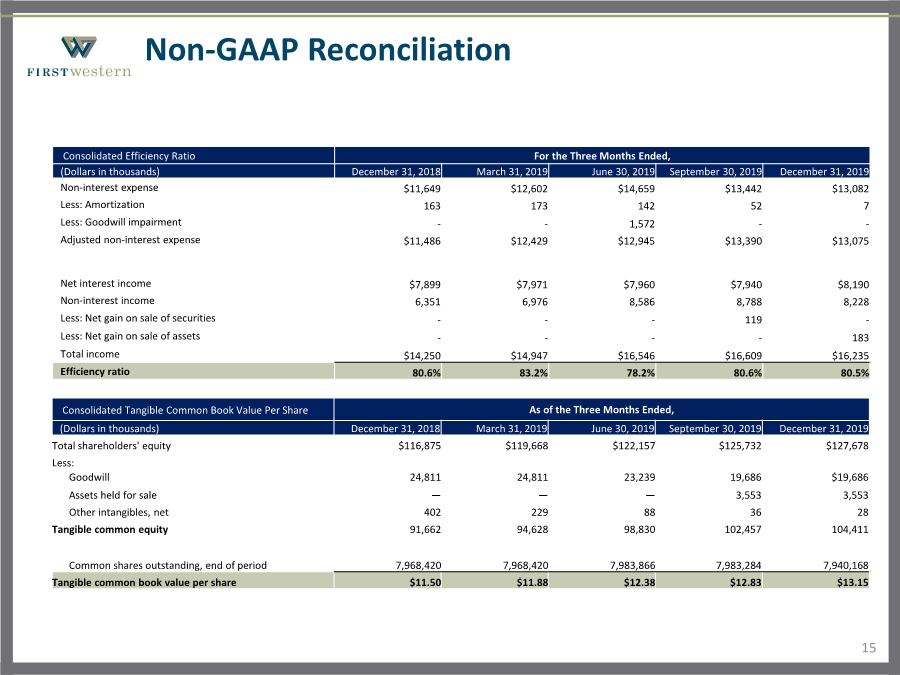
| 15 Non-GAAP Reconciliation Consolidated Efficiency Ratio For the Three Months Ended, (Dollars in thousands) December 31, 2018 March 31, 2019 June 30, 2019 September 30, 2019 December 31, 2019 Non-interest expense $11,649 $12,602 $14,659 $13,442 $13,082 Less: Amortization 163 173 142 52 7 Less: Goodwill impairment -- 1,572 -- Adjusted non-interest expense $11,486 $12,429 $12,945 $13,390 $13,075 Net interest income $7,899 $7,971 $7,960 $7,940 $8,190 Non-interest income 6,351 6,976 8,586 8,788 8,228 Less: Net gain on sale of securities --- 119 - Less: Net gain on sale of assets ---- 183 Total income $14,250 $14,947 $16,546 $16,609 $16,235 Efficiency ratio 80.6% 83.2% 78.2% 80.6% 80.5% Consolidated Tangible Common Book Value Per Share As of the Three Months Ended, (Dollars in thousands) December 31, 2018 March 31, 2019 June 30, 2019 September 30, 2019 December 31, 2019 Total shareholders' equity $116,875 $119,668 $122,157 $125,732 $127,678 Less: Goodwill 24,811 24,811 23,239 19,686 $19,686 Assets held for sale ——— 3,553 3,553 Other intangibles, net 402 229 88 36 28 Tangible common equity 91,662 94,628 98,830 102,457 104,411 Common shares outstanding, end of period 7,968,420 7,968,420 7,983,866 7,983,284 7,940,168 Tangible common book value per share $11.50 $11.88 $12.38 $12.83 $13.15 |
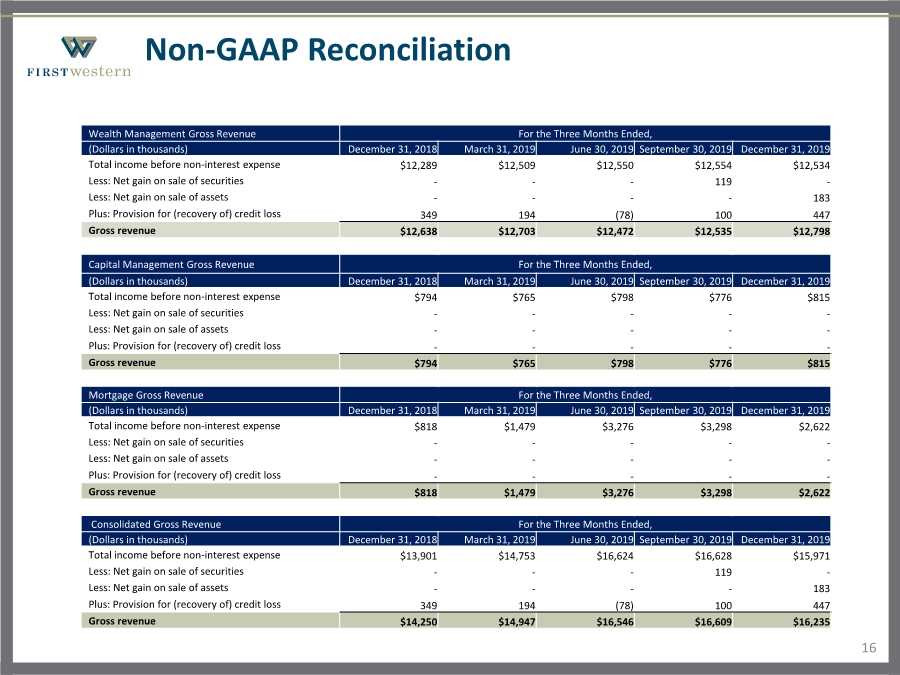
| 16 Non-GAAP Reconciliation Wealth Management Gross Revenue For the Three Months Ended, (Dollars in thousands) December 31, 2018 March 31, 2019 June 30, 2019 September 30, 2019 December 31, 2019 Total income before non-interest expense $12,289 $12,509 $12,550 $12,554 $12,534 Less: Net gain on sale of securities --- 119 - Less: Net gain on sale of assets ---- 183 Plus: Provision for (recovery of) credit loss 349 194 (78) 100 447 Gross revenue $12,638 $12,703 $12,472 $12,535 $12,798 Capital Management Gross Revenue For the Three Months Ended, (Dollars in thousands) December 31, 2018 March 31, 2019 June 30, 2019 September 30, 2019 December 31, 2019 Total income before non-interest expense $794 $765 $798 $776 $815 Less: Net gain on sale of securities ----- Less: Net gain on sale of assets ----- Plus: Provision for (recovery of) credit loss ----- Gross revenue $794 $765 $798 $776 $815 Mortgage Gross Revenue For the Three Months Ended, (Dollars in thousands) December 31, 2018 March 31, 2019 June 30, 2019 September 30, 2019 December 31, 2019 Total income before non-interest expense $818 $1,479 $3,276 $3,298 $2,622 Less: Net gain on sale of securities ----- Less: Net gain on sale of assets ----- Plus: Provision for (recovery of) credit loss ----- Gross revenue $818 $1,479 $3,276 $3,298 $2,622 Consolidated Gross Revenue For the Three Months Ended, (Dollars in thousands) December 31, 2018 March 31, 2019 June 30, 2019 September 30, 2019 December 31, 2019 Total income before non-interest expense $13,901 $14,753 $16,624 $16,628 $15,971 Less: Net gain on sale of securities --- 119 - Less: Net gain on sale of assets ---- 183 Plus: Provision for (recovery of) credit loss 349 194 (78) 100 447 Gross revenue $14,250 $14,947 $16,546 $16,609 $16,235 |
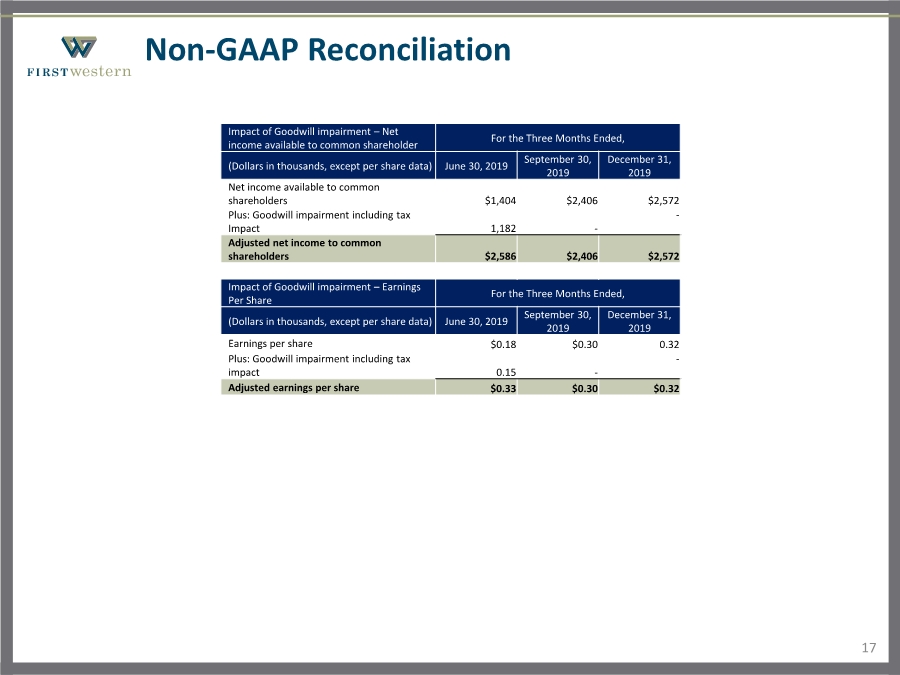
| 17 Non-GAAP Reconciliation Impact of Goodwill impairment – Net income available to common shareholder For the Three Months Ended, (Dollars in thousands, except per share data) June 30, 2019 September 30, 2019 December 31, 2019 Net income available to common shareholders $1,404 $2,406 $2,572 Plus: Goodwill impairment including tax Impact 1,182 - - Adjusted net income to common shareholders $2,586 $2,406 $2,572 Impact of Goodwill impairment – Earnings Per Share For the Three Months Ended, (Dollars in thousands, except per share data) June 30, 2019 September 30, 2019 December 31, 2019 Earnings per share $0.18 $0.30 0.32 Plus: Goodwill impairment including tax impact 0.15 - - Adjusted earnings per share $0.33 $0.30 $0.32 |