Exhibit 99.1
| First Western Financial, Inc. The First, Western-Based Private Trust Bank 2020 Annual Meeting of Shareholders |
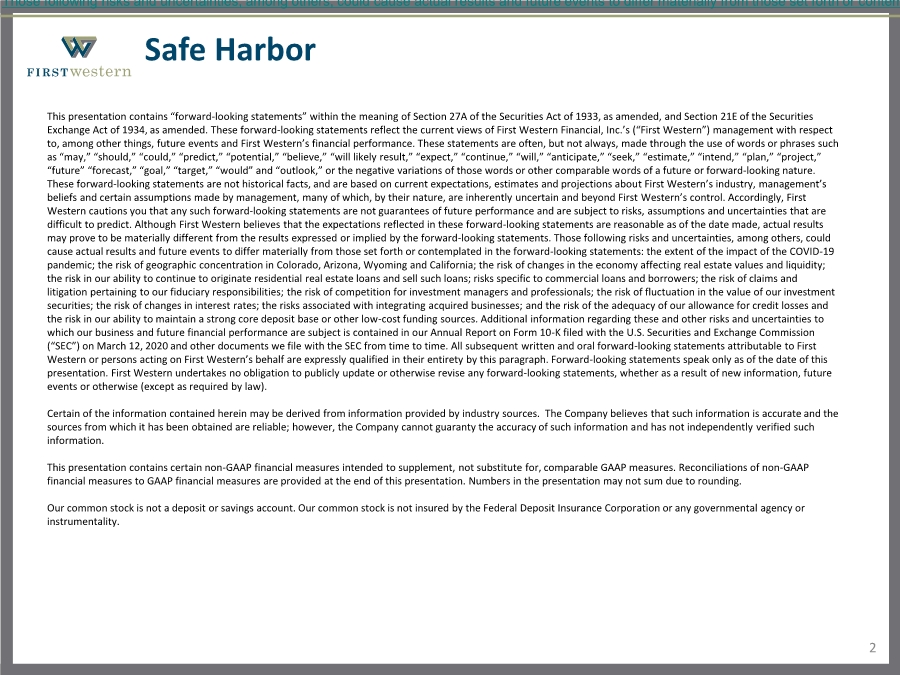
| Safe Harbor 2 This presentation contains “forward-looking statements” within the meaning of Section 27A of the Securities Act of 1933, as amended, and Section 21E of the Securities Exchange Act of 1934, as amended. These forward-looking statements reflect the current views of First Western Financial, Inc.’s (“First Western”) management with respect to, among other things, future events and First Western’s financial performance. These statements are often, but not always, made through the use of words or phrases such as “may,” “should,” “could,” “predict,” “potential,” “believe,” “will likely result,” “expect,” “continue,” “will,” “anticipate,” “seek,” “estimate,” “intend,” “plan,” “project,” “future” “forecast,” “goal,” “target,” “would” and “outlook,” or the negative variations of those words or other comparable words of a future or forward-looking nature. These forward-looking statements are not historical facts, and are based on current expectations, estimates and projections about First Western’s industry, management’s beliefs and certain assumptions made by management, many of which, by their nature, are inherently uncertain and beyond First Western’s control. Accordingly, First Western cautions you that any such forward-looking statements are not guarantees of future performance and are subject to risks, assumptions and uncertainties that are difficult to predict. Although First Western believes that the expectations reflected in these forward-looking statements are reasonable as of the date made, actual results may prove to be materially different from the results expressed or implied by the forward-looking statements. Those following risks and uncertainties, among others, could cause actual results and future events to differ materially from those set forth or contemplated in the forward-looking statements: the extent of the impact of the COVID-19 pandemic; the risk of geographic concentration in Colorado, Arizona, Wyoming and California; the risk of changes in the economy affecting real estate values and liquidity; the risk in our ability to continue to originate residential real estate loans and sell such loans; risks specific to commercial loans and borrowers; the risk of claims and litigation pertaining to our fiduciary responsibilities; the risk of competition for investment managers and professionals; the risk of fluctuation in the value of our investment securities; the risk of changes in interest rates; the risks associated with integrating acquired businesses; and the risk of the adequacy of our allowance for credit losses and the risk in our ability to maintain a strong core deposit base or other low-cost funding sources. Additional information regarding these and other risks and uncertainties to which our business and future financial performance are subject is contained in our Annual Report on Form 10-K filed with the U.S. Securities and Exchange Commission (“SEC”) on March 12, 2020 and other documents we file with the SEC from time to time. All subsequent written and oral forward-looking statements attributable to First Western or persons acting on First Western’s behalf are expressly qualified in their entirety by this paragraph. Forward-looking statements speak only as of the date of this presentation. First Western undertakes no obligation to publicly update or otherwise revise any forward-looking statements, whether as a result of new information, future events or otherwise (except as required by law). Certain of the information contained herein may be derived from information provided by industry sources. The Company believes that such information is accurate and the sources from which it has been obtained are reliable; however, the Company cannot guaranty the accuracy of such information and has not independently verified such information. This presentation contains certain non-GAAP financial measures intended to supplement, not substitute for, comparable GAAP measures. Reconciliations of non-GAAP financial measures to GAAP financial measures are provided at the end of this presentation. Numbers in the presentation may not sum due to rounding. Our common stock is not a deposit or savings account. Our common stock is not insured by the Federal Deposit Insurance Corporation or any governmental agency or instrumentality. Those following risks and uncertainties, among others, could cause actual results and future events to differ materially from those set forth or contemplated in the forward |
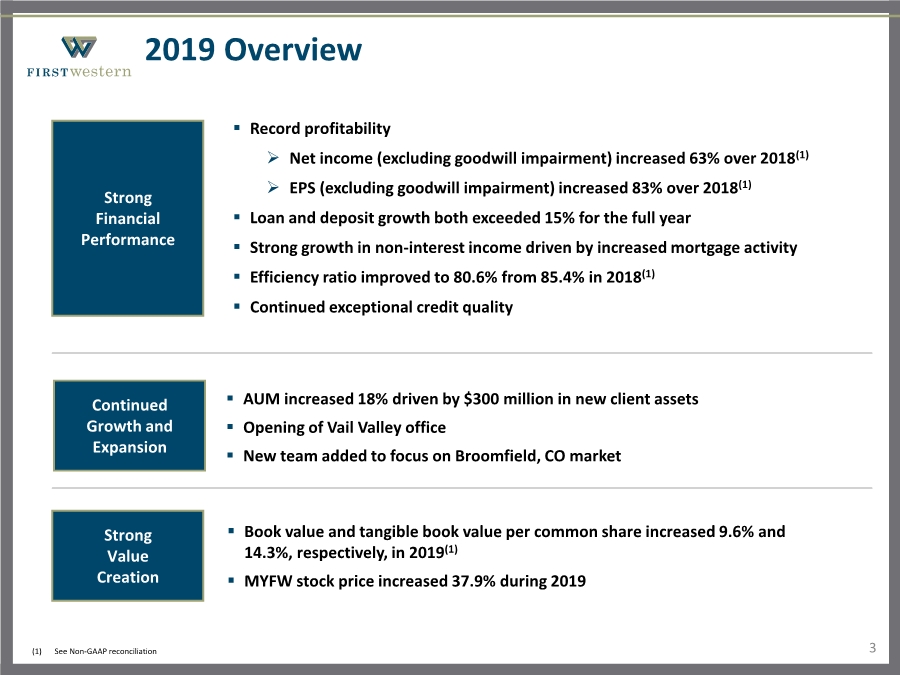
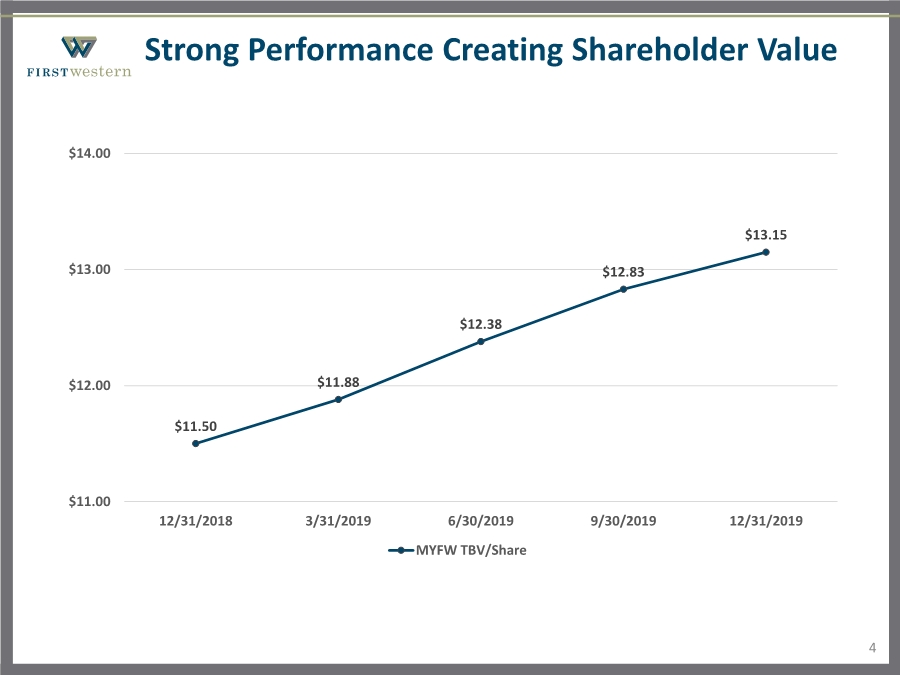
| 2019 Overview Continued Growth and Expansion Strong Financial Performance .. Book value and tangible book value per common share increased 9.6% and 14.3%, respectively, in 2019(1) .. MYFW stock price increased 37.9% during 2019 Strong Value Creation .. AUM increased 18% driven by $300 million in new client assets .. Opening of Vail Valley office .. New team added to focus on Broomfield, CO market 3 .. Record profitability Net income (excluding goodwill impairment) increased 63% over 2018(1) EPS (excluding goodwill impairment) increased 83% over 2018(1) .. Loan and deposit growth both exceeded 15% for the full year .. Strong growth in non-interest income driven by increased mortgage activity .. Efficiency ratio improved to 80.6% from 85.4% in 2018(1) .. Continued exceptional credit quality (1) See Non-GAAP reconciliation |
| Strong Performance Creating Shareholder Value 4 $11.50 $11.88 $12.38 $12.83 $13.15 $11.00 $12.00 $13.00 $14.00 12/31/2018 3/31/2019 6/30/2019 9/30/2019 12/31/2019 MYFW TBV/Share |
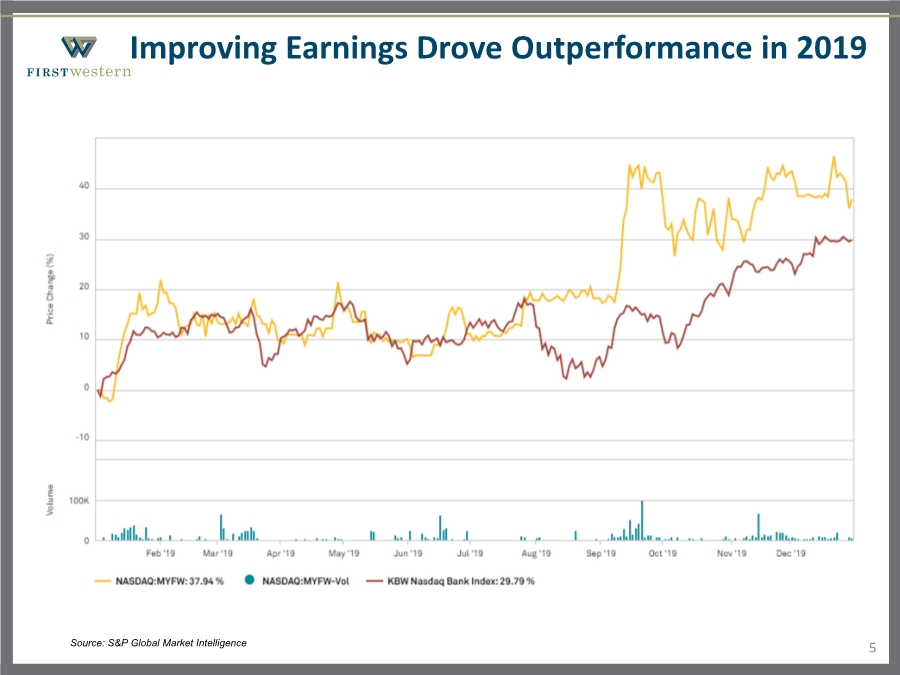
| Improving Earnings Drove Outperformance in 2019 5 Source: S&P Global Market Intelligence |
| Key Financial Trends |

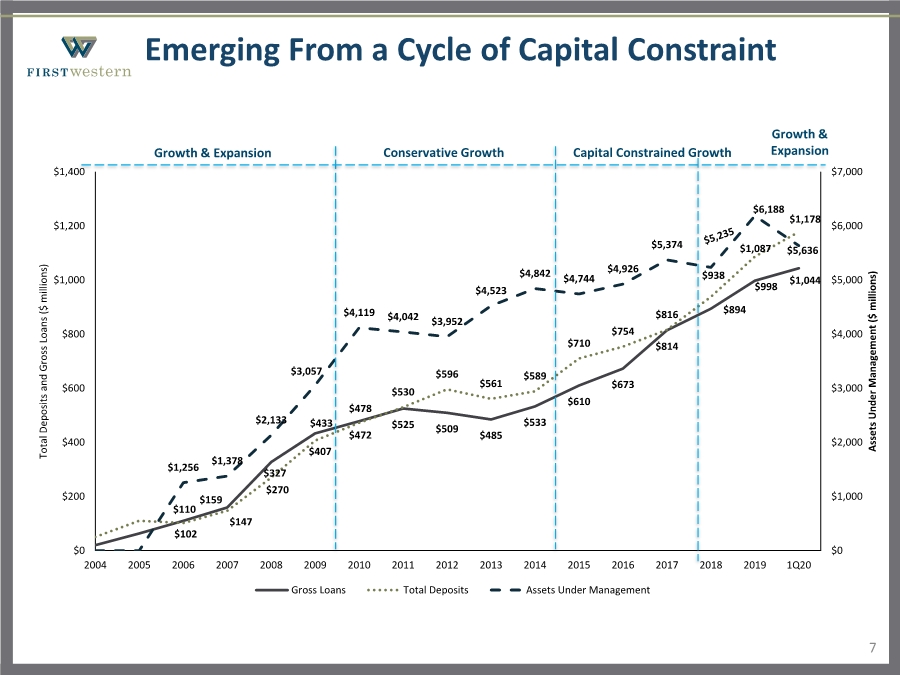
| $110 $159 $327 $433 $478 $525 $509 $485 $533 $610 $673 $814 $894 $998 $1,044 $102 $147 $270 $407 $472 $530 $596 $561 $589 $710 $754 $816 $938 $1,087 $1,178 $1,256 $1,378 $2,133 $3,057 $4,119 $4,042 $3,952 $4,523 $4,842 $4,744 $4,926 $5,374 $6,188 $5,636 $0 $1,000 $2,000 $3,000 $4,000 $5,000 $6,000 $7,000 $0 $200 $400 $600 $800 $1,000 $1,200 $1,400 2004 2005 2006 2007 2008 2009 2010 2011 2012 2013 2014 2015 2016 2017 2018 2019 1Q20 Assets Under Management ($ millions) Total Deposits and Gross Loans ($ millions) Gross Loans Total Deposits Assets Under Management 7 Emerging From a Cycle of Capital Constraint Growth & Expansion Conservative Growth Capital Constrained Growth Growth & Expansion |
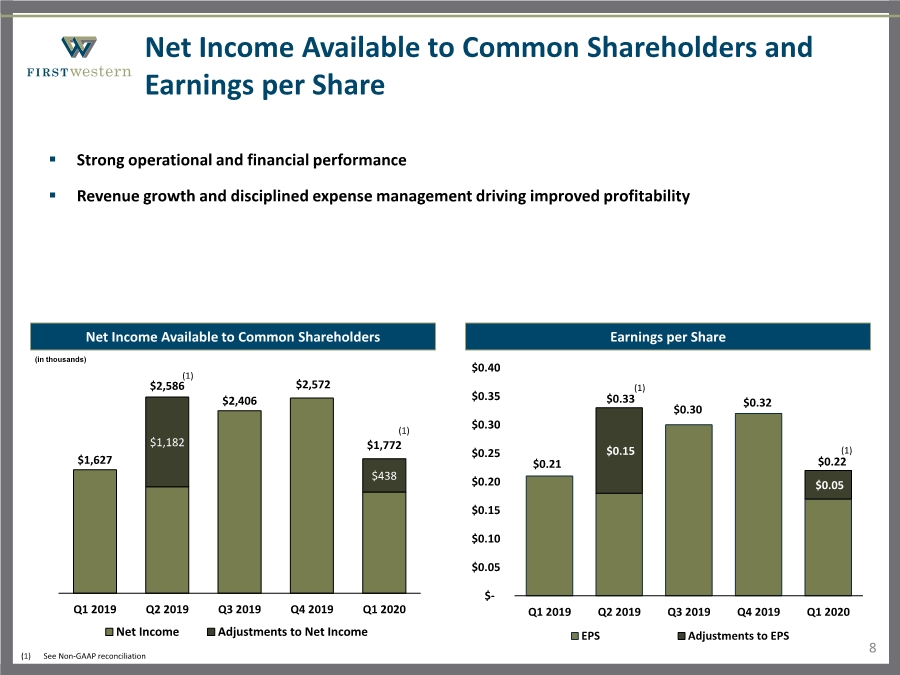
| $0.21 $0.33 $0.30 $0.32 $0.22 $0.15 $0.05 $- $0.05 $0.10 $0.15 $0.20 $0.25 $0.30 $0.35 $0.40 Q1 2019 Q2 2019 Q3 2019 Q4 2019 Q1 2020 EPS Adjustments to EPS (1) (1) Net Income Available to Common Shareholders and Earnings per Share 8 Net Income Available to Common Shareholders .. Strong operational and financial performance .. Revenue growth and disciplined expense management driving improved profitability Earnings per Share (in thousands) $1,182 $438 $1,627 $2,586 $2,406 $2,572 $1,772 Q1 2019 Q2 2019 Q3 2019 Q4 2019 Q1 2020 Net Income Adjustments to Net Income (1) (1) See Non-GAAP reconciliation (1) |
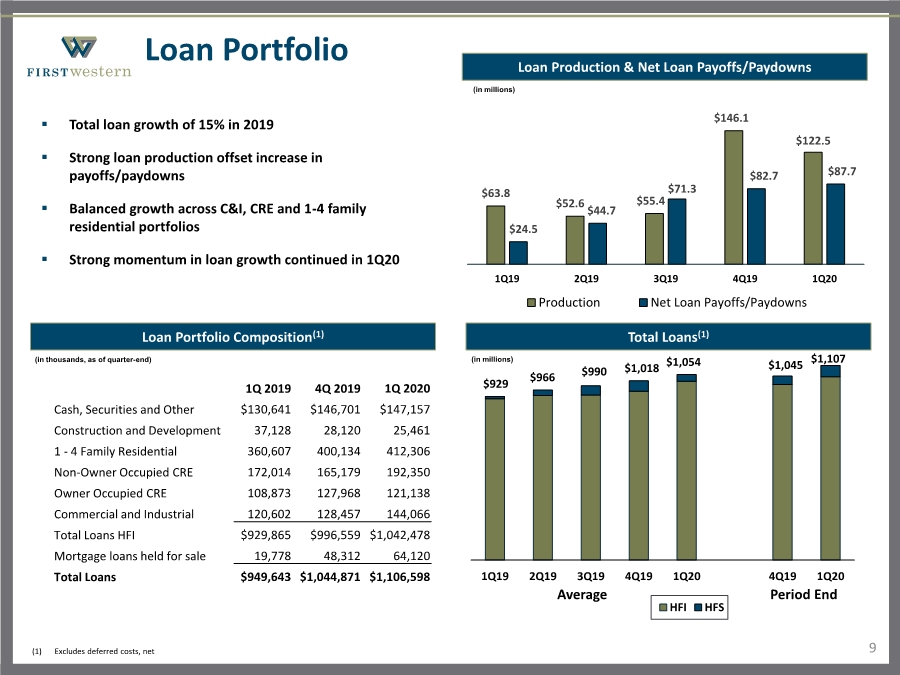
| $929 $966 $990 $1,018 $1,054 $1,045 $1,107 1Q19 2Q19 3Q19 4Q19 1Q20 4Q19 1Q20 HFI HFS Average Period End Loan Portfolio 9 Loan Portfolio Composition(1) .. Total loan growth of 15% in 2019 .. Strong loan production offset increase in payoffs/paydowns .. Balanced growth across C&I, CRE and 1-4 family residential portfolios .. Strong momentum in loan growth continued in 1Q20 (in thousands, as of quarter-end) Total Loans(1) (in millions) (1) Excludes deferred costs, net 1Q 2019 4Q 2019 1Q 2020 Cash, Securities and Other $130,641 $146,701 $147,157 Construction and Development 37,128 28,120 25,461 1 - 4 Family Residential 360,607 400,134 412,306 Non-Owner Occupied CRE 172,014 165,179 192,350 Owner Occupied CRE 108,873 127,968 121,138 Commercial and Industrial 120,602 128,457 144,066 Total Loans HFI $929,865 $996,559 $1,042,478 Mortgage loans held for sale 19,778 48,312 64,120 Total Loans $949,643 $1,044,871 $1,106,598 Loan Production & Net Loan Payoffs/Paydowns $63.8 $52.6 $55.4 $146.1 $122.5 $24.5 $44.7 $71.3 $82.7 $87.7 1Q19 2Q19 3Q19 4Q19 1Q20 Production Net Loan Payoffs/Paydowns (in millions) |
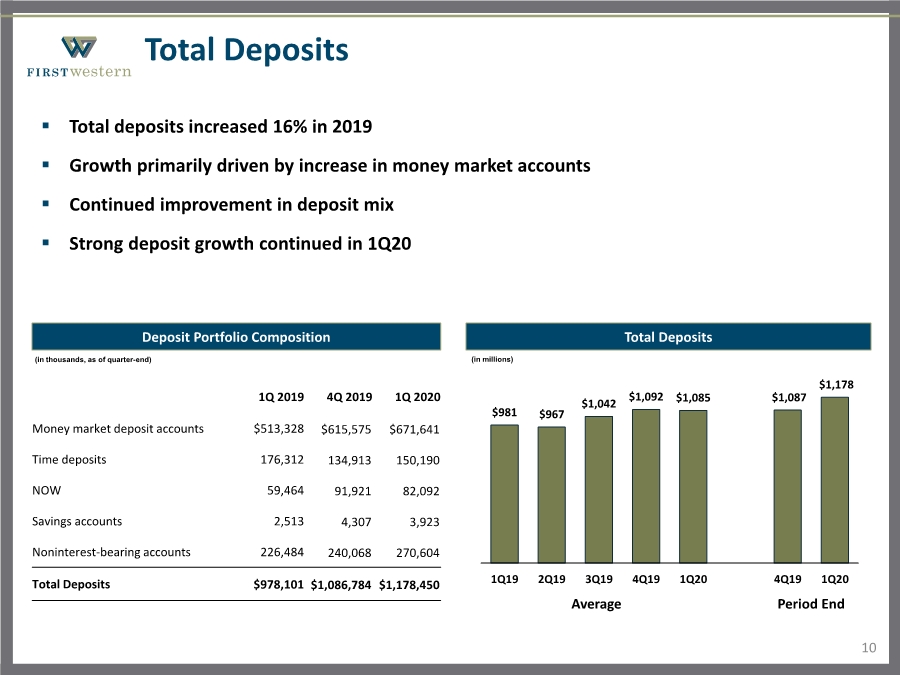
| $981 $967 $1,042 $1,092 $1,085 $1,087 $1,178 1Q19 2Q19 3Q19 4Q19 1Q20 4Q19 1Q20 Average Period End Total Deposits 10 Deposit Portfolio Composition .. Total deposits increased 16% in 2019 .. Growth primarily driven by increase in money market accounts .. Continued improvement in deposit mix .. Strong deposit growth continued in 1Q20 1Q 2019 4Q 2019 1Q 2020 Money market deposit accounts $513,328 $615,575 $671,641 Time deposits 176,312 134,913 150,190 NOW 59,464 91,921 82,092 Savings accounts 2,513 4,307 3,923 Noninterest-bearing accounts 226,484 240,068 270,604 Total Deposits $978,101 $1,086,784 $1,178,450 (in thousands, as of quarter-end) Total Deposits (in millions) |
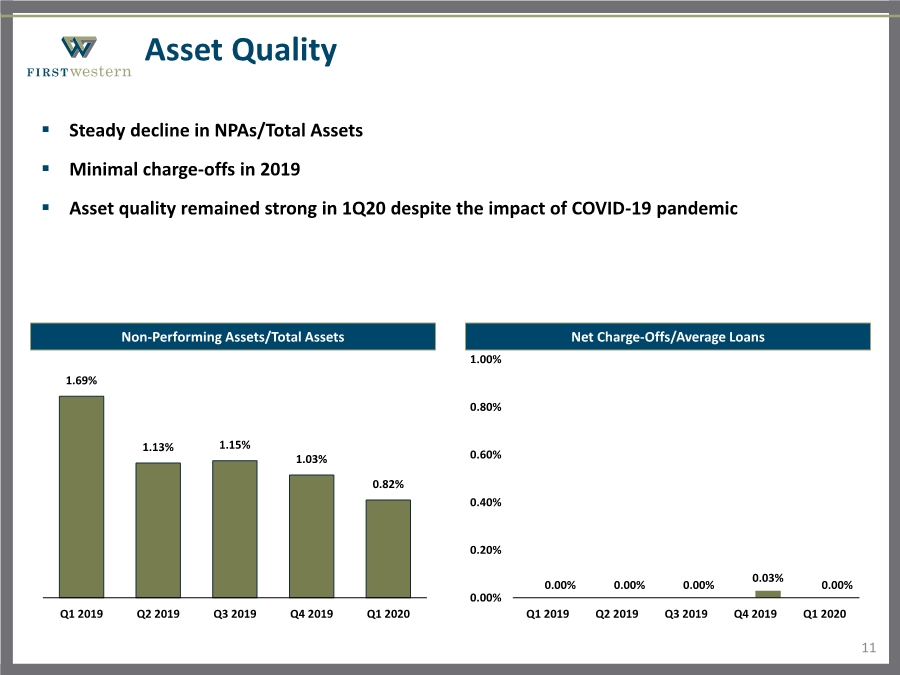
| Asset Quality 11 Non-Performing Assets/Total Assets .. Steady decline in NPAs/Total Assets .. Minimal charge-offs in 2019 .. Asset quality remained strong in 1Q20 despite the impact of COVID-19 pandemic Net Charge-Offs/Average Loans 0.00% 0.00% 0.00% 0.03% 0.00% 0.00% 0.20% 0.40% 0.60% 0.80% 1.00% Q1 2019 Q2 2019 Q3 2019 Q4 2019 Q1 2020 1.69% 1.13% 1.15% 1.03% 0.82% Q1 2019 Q2 2019 Q3 2019 Q4 2019 Q1 2020 |
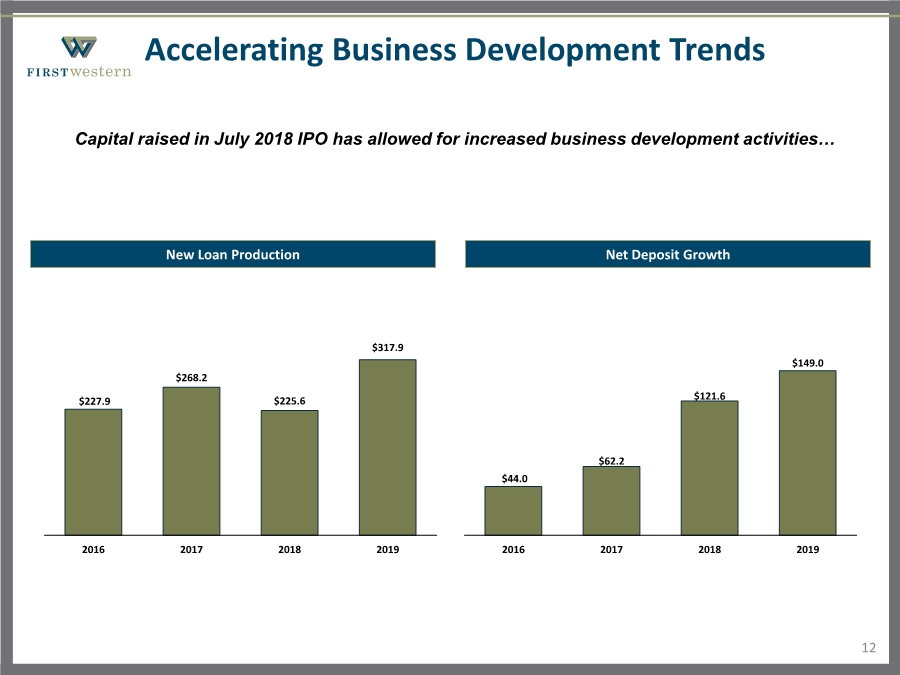
| Accelerating Business Development Trends 12 New Loan Production Net Deposit Growth Capital raised in July 2018 IPO has allowed for increased business development activities… $227.9 $268.2 $225.6 $317.9 2016 2017 2018 2019 $44.0 $62.2 $121.6 $149.0 2016 2017 2018 2019 |
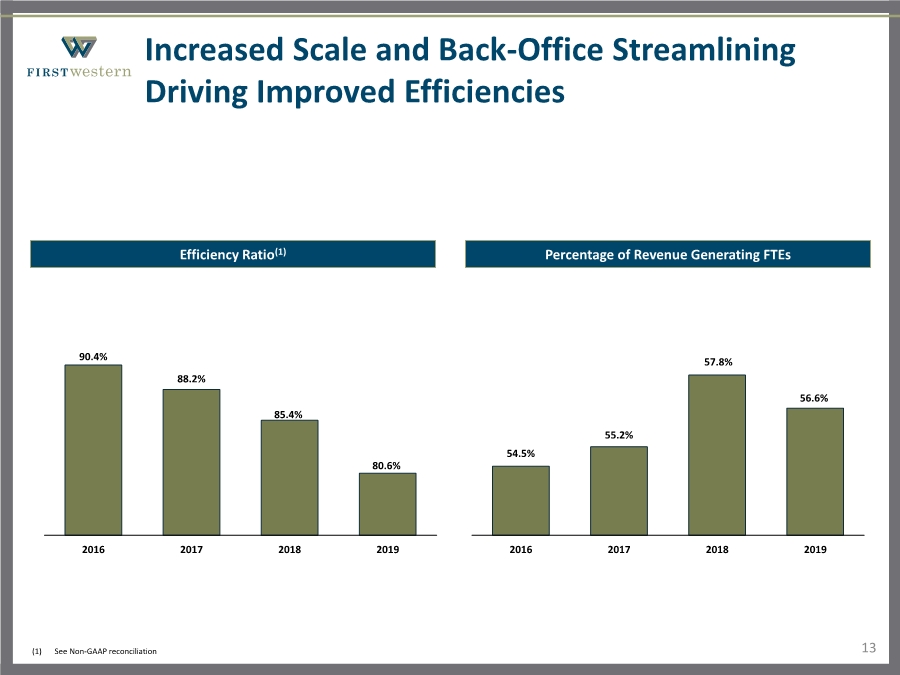
| Increased Scale and Back-Office Streamlining Driving Improved Efficiencies 13 90.4% 88.2% 85.4% 80.6% 2016 2017 2018 2019 Efficiency Ratio(1) 54.5% 55.2% 57.8% 56.6% 2016 2017 2018 2019 Percentage of Revenue Generating FTEs (1) See Non-GAAP reconciliation |
| COVID-19 Impact Overview |
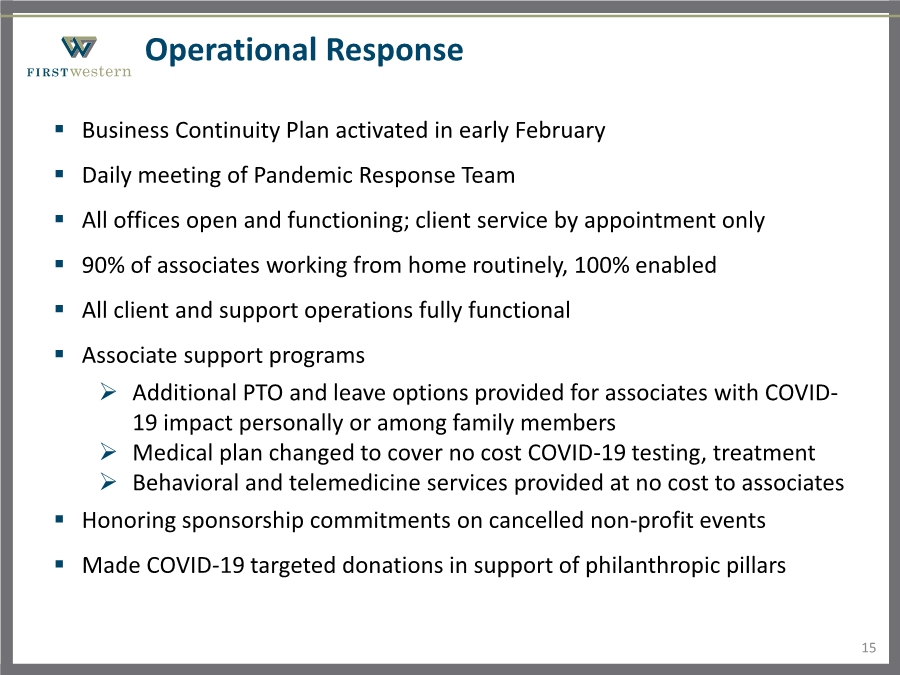
| Operational Response 15 .. Business Continuity Plan activated in early February .. Daily meeting of Pandemic Response Team .. All offices open and functioning; client service by appointment only .. 90% of associates working from home routinely, 100% enabled .. All client and support operations fully functional .. Associate support programs Additional PTO and leave options provided for associates with COVID- 19 impact personally or among family members Medical plan changed to cover no cost COVID-19 testing, treatment Behavioral and telemedicine services provided at no cost to associates .. Honoring sponsorship commitments on cancelled non-profit events .. Made COVID-19 targeted donations in support of philanthropic pillars |
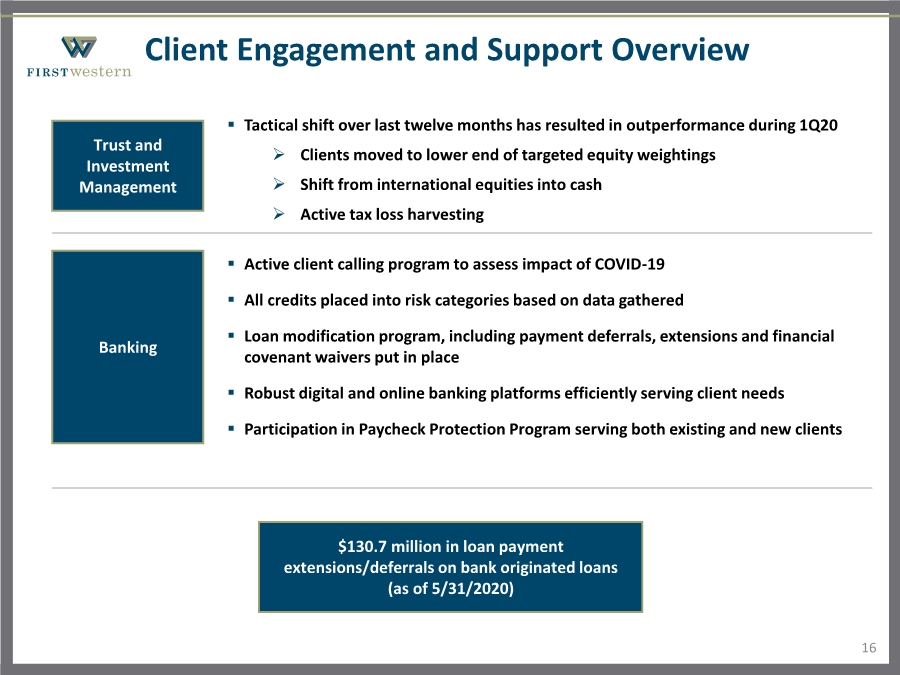
| Client Engagement and Support Overview Trust and Investment Management Banking .. Active client calling program to assess impact of COVID-19 .. All credits placed into risk categories based on data gathered .. Loan modification program, including payment deferrals, extensions and financial covenant waivers put in place .. Robust digital and online banking platforms efficiently serving client needs .. Participation in Paycheck Protection Program serving both existing and new clients $130.7 million in loan payment extensions/deferrals on bank originated loans (as of 5/31/2020) 16 .. Tactical shift over last twelve months has resulted in outperformance during 1Q20 Clients moved to lower end of targeted equity weightings Shift from international equities into cash Active tax loss harvesting |
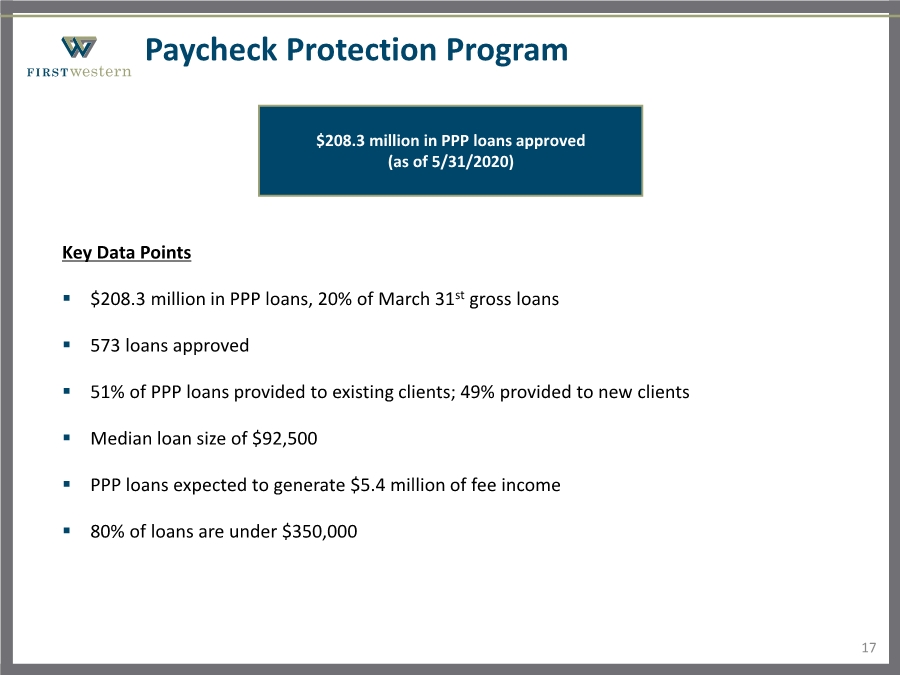
| Paycheck Protection Program 17 Key Data Points .. $208.3 million in PPP loans, 20% of March 31st gross loans .. 573 loans approved .. 51% of PPP loans provided to existing clients; 49% provided to new clients .. Median loan size of $92,500 .. PPP loans expected to generate $5.4 million of fee income .. 80% of loans are under $350,000 $208.3 million in PPP loans approved (as of 5/31/2020) |
| Creating Additional Shareholder Value |
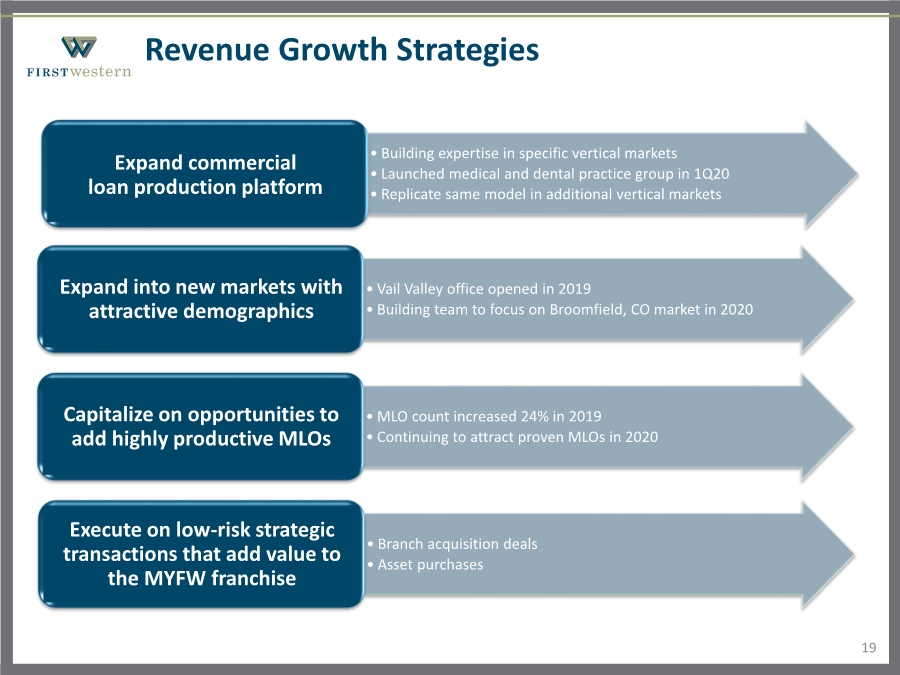
| 19 Revenue Growth Strategies • Building expertise in specific vertical markets • Launched medical and dental practice group in 1Q20 • Replicate same model in additional vertical markets Expand commercial loan production platform • Vail Valley office opened in 2019 • Building team to focus on Broomfield, CO market in 2020 Expand into new markets with attractive demographics • MLO count increased 24% in 2019 • Continuing to attract proven MLOs in 2020 Capitalize on opportunities to add highly productive MLOs • Branch acquisition deals • Asset purchases Execute on low-risk strategic transactions that add value to the MYFW franchise |
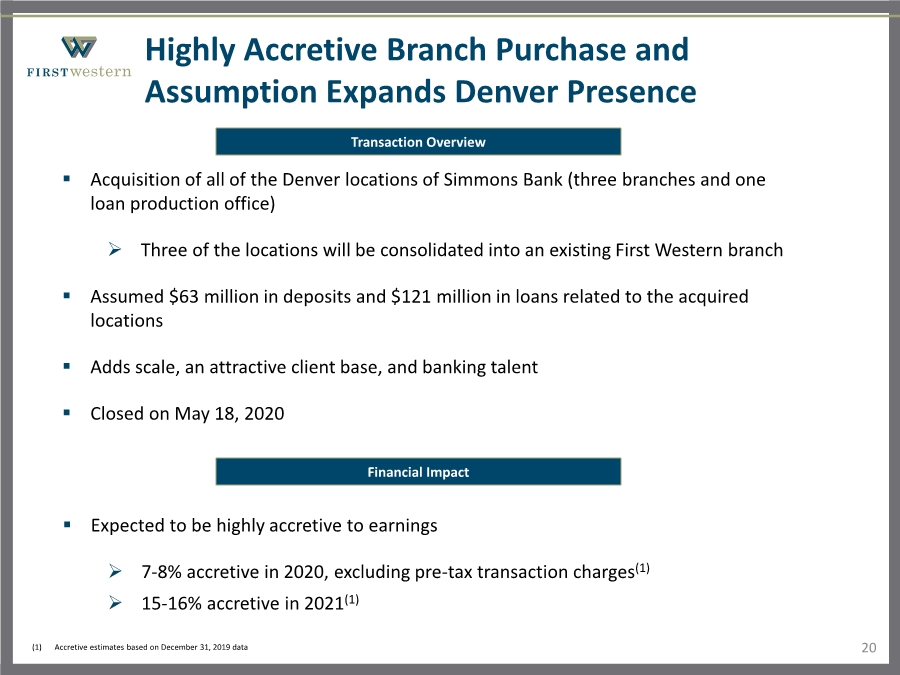
| Highly Accretive Branch Purchase and Assumption Expands Denver Presence 20 .. Acquisition of all of the Denver locations of Simmons Bank (three branches and one loan production office) Three of the locations will be consolidated into an existing First Western branch .. Assumed $63 million in deposits and $121 million in loans related to the acquired locations .. Adds scale, an attractive client base, and banking talent .. Closed on May 18, 2020 Transaction Overview .. Expected to be highly accretive to earnings 7-8% accretive in 2020, excluding pre-tax transaction charges(1) 15-16% accretive in 2021(1) Financial Impact (1) Accretive estimates based on December 31, 2019 data |
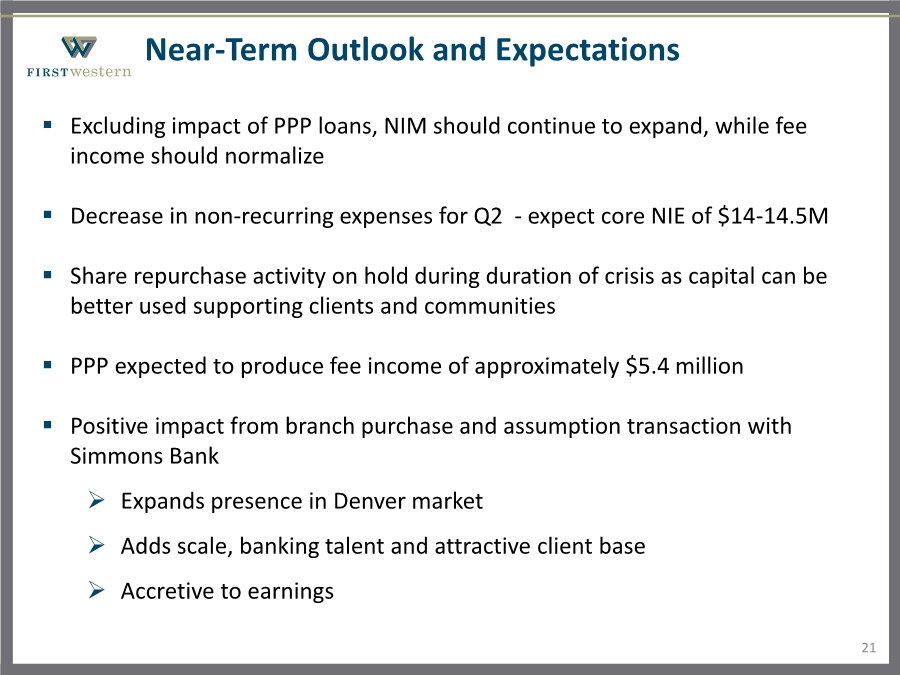
| Near-Term Outlook and Expectations 21 .. Excluding impact of PPP loans, NIM should continue to expand, while fee income should normalize .. Decrease in non-recurring expenses for Q2 - expect core NIE of $14-14.5M .. Share repurchase activity on hold during duration of crisis as capital can be better used supporting clients and communities .. PPP expected to produce fee income of approximately $5.4 million .. Positive impact from branch purchase and assumption transaction with Simmons Bank Expands presence in Denver market Adds scale, banking talent and attractive client base Accretive to earnings |
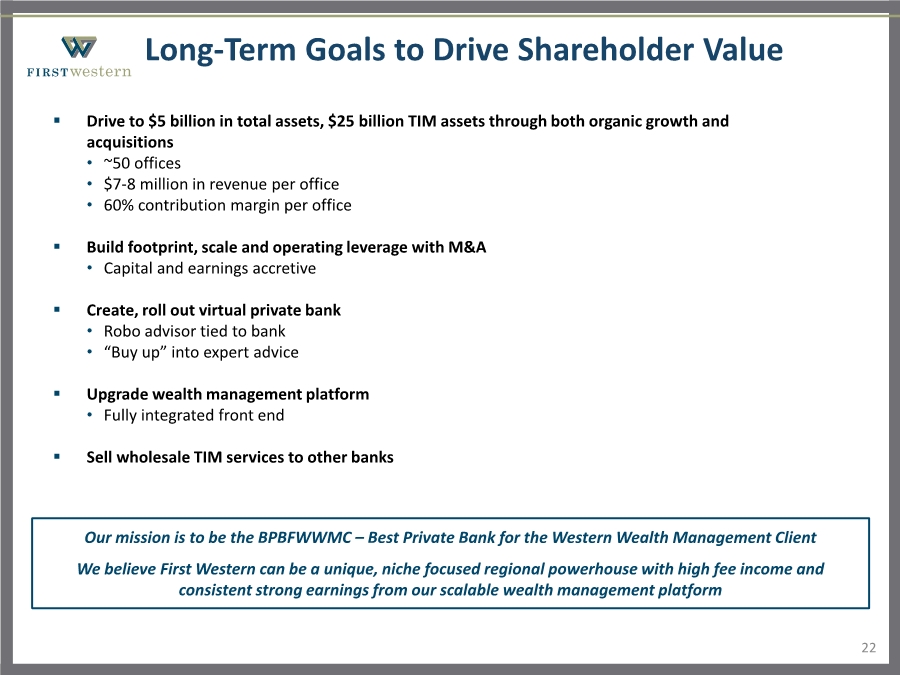
| 22 Long-Term Goals to Drive Shareholder Value Our mission is to be the BPBFWWMC – Best Private Bank for the Western Wealth Management Client We believe First Western can be a unique, niche focused regional powerhouse with high fee income and consistent strong earnings from our scalable wealth management platform .. Drive to $5 billion in total assets, $25 billion TIM assets through both organic growth and acquisitions • ~50 offices • $7-8 million in revenue per office • 60% contribution margin per office .. Build footprint, scale and operating leverage with M&A • Capital and earnings accretive .. Create, roll out virtual private bank • Robo advisor tied to bank •“Buy up” into expert advice .. Upgrade wealth management platform • Fully integrated front end .. Sell wholesale TIM services to other banks |
| Non-GAAP Reconciliations |
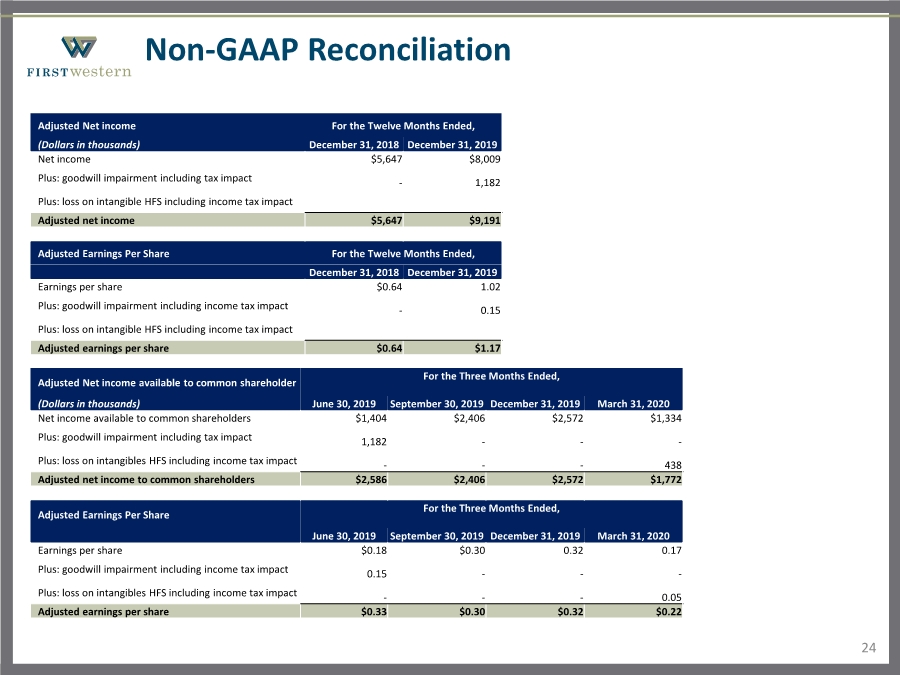
| 24 Non-GAAP Reconciliation Adjusted Net income For the Twelve Months Ended, (Dollars in thousands) December 31, 2018 December 31, 2019 Net income $5,647 $8,009 Plus: goodwill impairment including tax impact - 1,182 Plus: loss on intangible HFS including income tax impact Adjusted net income $5,647 $9,191 Adjusted Earnings Per Share For the Twelve Months Ended, December 31, 2018 December 31, 2019 Earnings per share $0.64 1.02 Plus: goodwill impairment including income tax impact - 0.15 Plus: loss on intangible HFS including income tax impact Adjusted earnings per share $0.64 $1.17 Adjusted Net income available to common shareholder For the Three Months Ended, (Dollars in thousands) June 30, 2019 September 30, 2019 December 31, 2019 March 31, 2020 Net income available to common shareholders $1,404 $2,406 $2,572 $1,334 Plus: goodwill impairment including tax impact 1,182 --- Plus: loss on intangibles HFS including income tax impact --- 438 Adjusted net income to common shareholders $2,586 $2,406 $2,572 $1,772 Adjusted Earnings Per Share For the Three Months Ended, June 30, 2019 September 30, 2019 December 31, 2019 March 31, 2020 Earnings per share $0.18 $0.30 0.32 0.17 Plus: goodwill impairment including income tax impact 0.15 --- Plus: loss on intangibles HFS including income tax impact --- 0.05 Adjusted earnings per share $0.33 $0.30 $0.32 $0.22 |
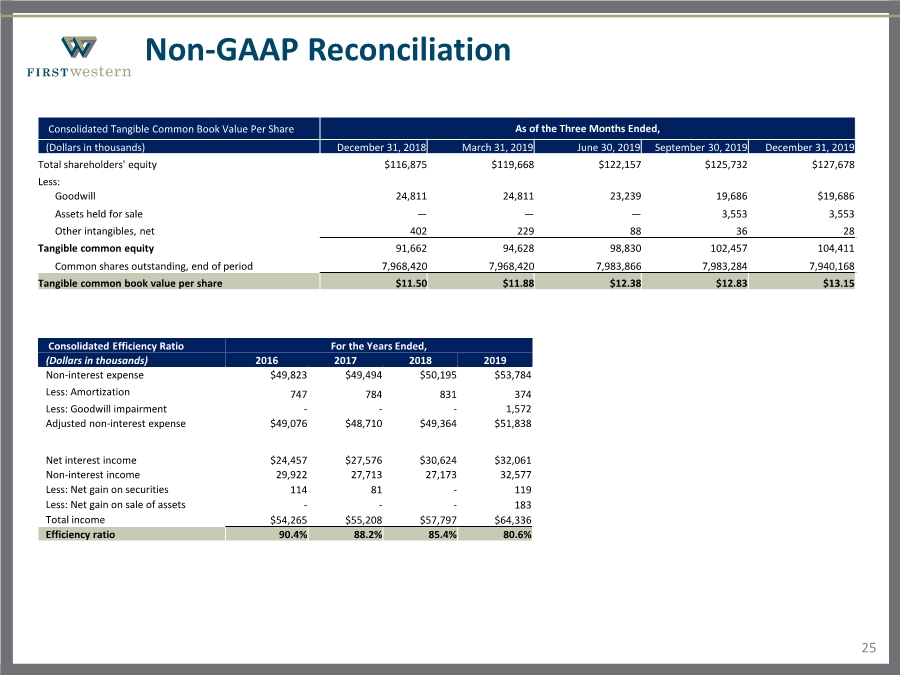
| 25 Non-GAAP Reconciliation Consolidated Tangible Common Book Value Per Share As of the Three Months Ended, (Dollars in thousands) December 31, 2018 March 31, 2019 June 30, 2019 September 30, 2019 December 31, 2019 Total shareholders' equity $116,875 $119,668 $122,157 $125,732 $127,678 Less: Goodwill 24,811 24,811 23,239 19,686 $19,686 Assets held for sale ——— 3,553 3,553 Other intangibles, net 402 229 88 36 28 Tangible common equity 91,662 94,628 98,830 102,457 104,411 Common shares outstanding, end of period 7,968,420 7,968,420 7,983,866 7,983,284 7,940,168 Tangible common book value per share $11.50 $11.88 $12.38 $12.83 $13.15 Consolidated Efficiency Ratio For the Years Ended, (Dollars in thousands) 2016 2017 2018 2019 Non-interest expense $49,823 $49,494 $50,195 $53,784 Less: Amortization 747 784 831 374 Less: Goodwill impairment --- 1,572 Adjusted non-interest expense $49,076 $48,710 $49,364 $51,838 Net interest income $24,457 $27,576 $30,624 $32,061 Non-interest income 29,922 27,713 27,173 32,577 Less: Net gain on securities 114 81 - 119 Less: Net gain on sale of assets --- 183 Total income $54,265 $55,208 $57,797 $64,336 Efficiency ratio 90.4% 88.2% 85.4% 80.6% |