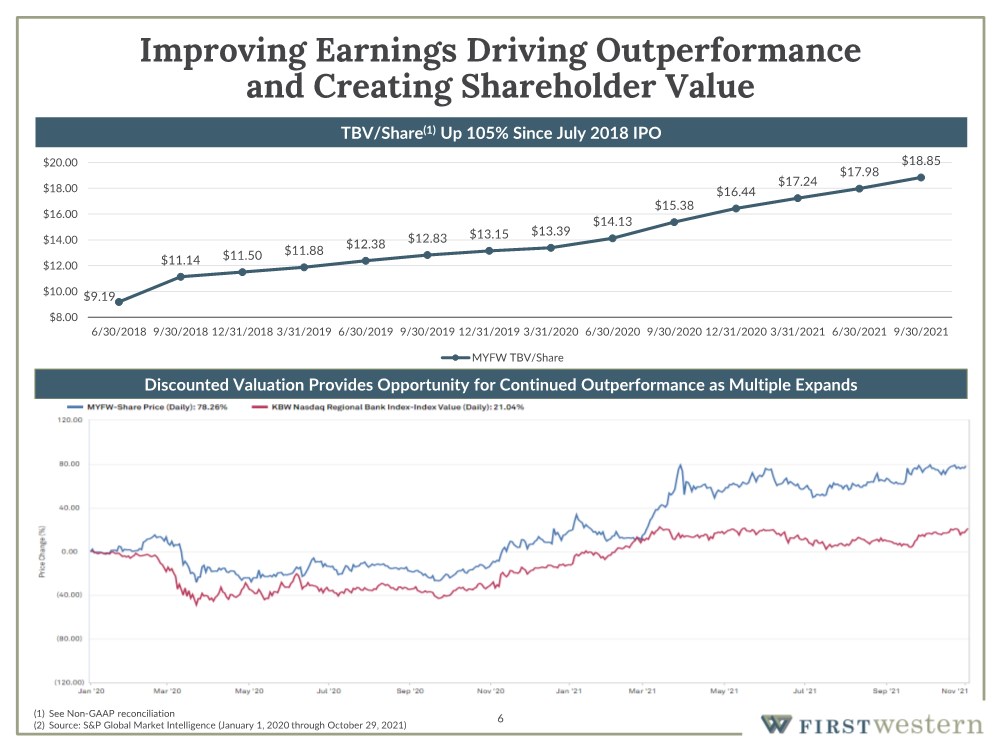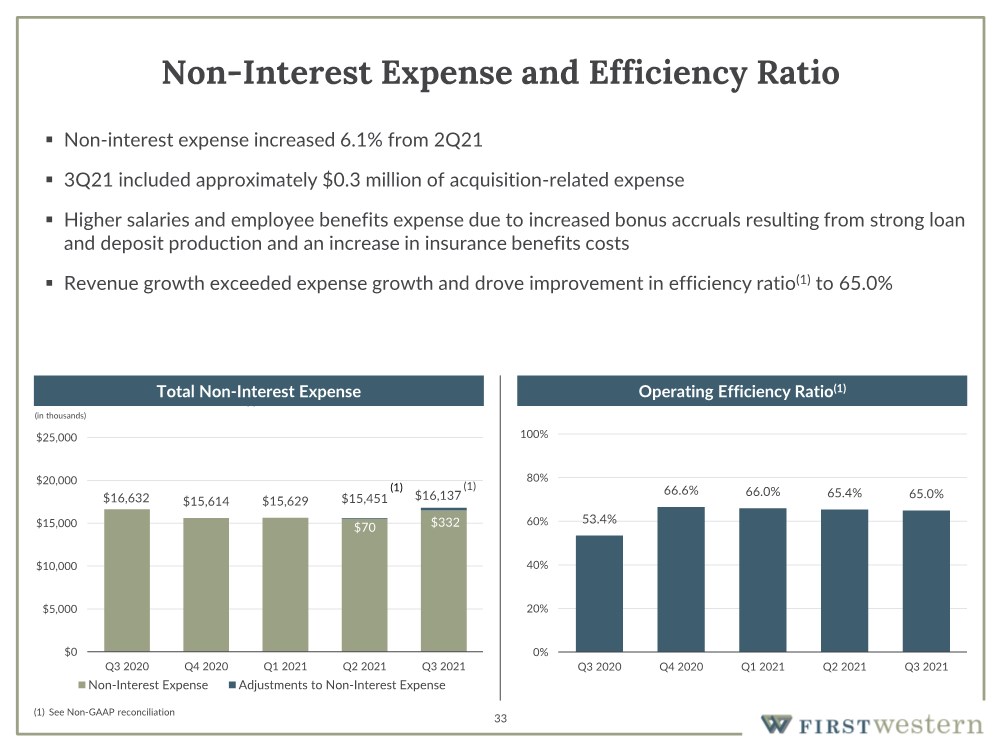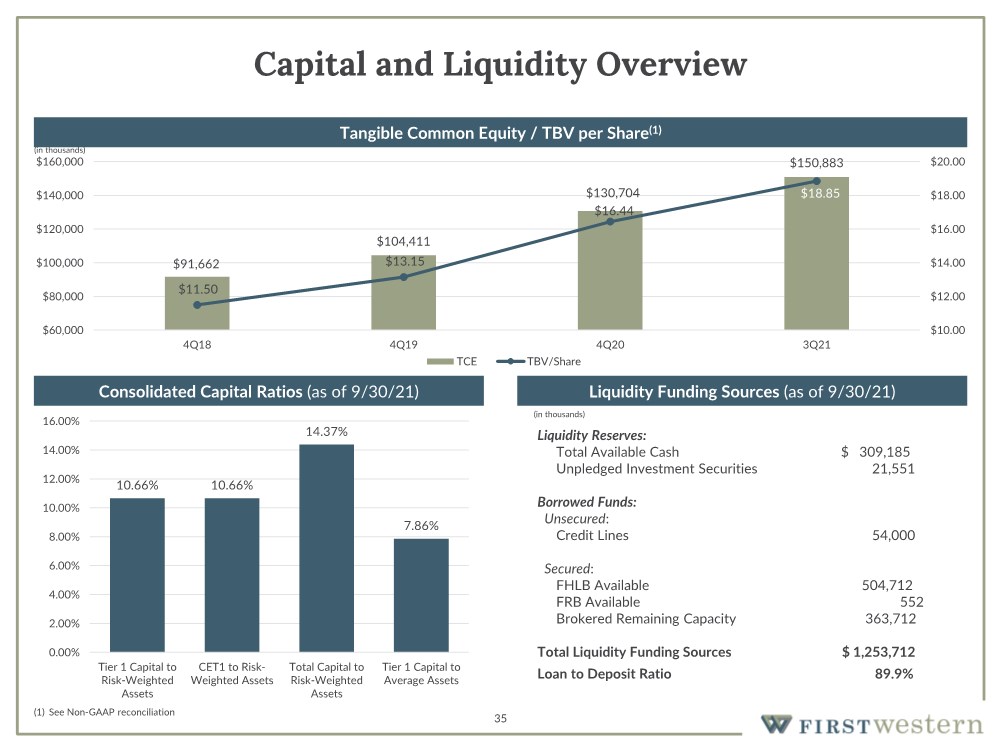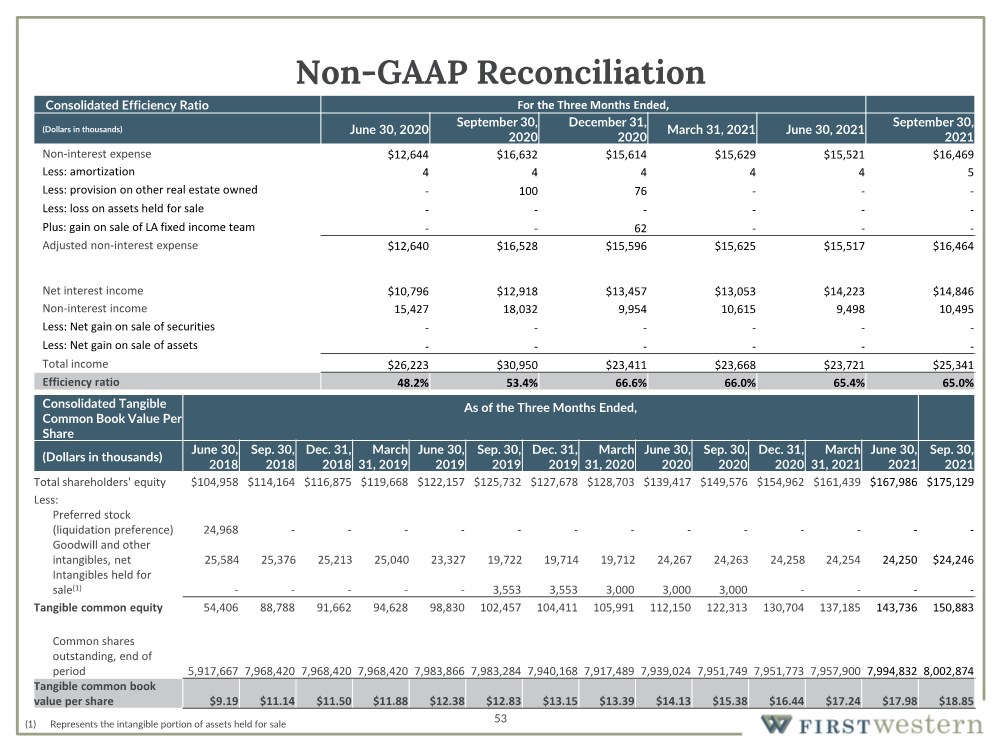
| 53 Non-GAAP Reconciliation Consolidated Tangible Common Book Value Per Share As of the Three Months Ended, (Dollars in thousands) June 30, 2018 Sep. 30, 2018 Dec. 31, 2018 March 31, 2019 June 30, 2019 Sep. 30, 2019 Dec. 31, 2019 March 31, 2020 June 30, 2020 Sep. 30, 2020 Dec. 31, 2020 March 31, 2021 June 30, 2021 Sep. 30, 2021 Total shareholders' equity $104,958 $114,164 $116,875 $119,668 $122,157 $125,732 $127,678 $128,703 $139,417 $149,576 $154,962 $161,439 $167,986 $175,129 Less: Preferred stock (liquidation preference) 24,968 ------------- Goodwill and other intangibles, net 25,584 25,376 25,213 25,040 23,327 19,722 19,714 19,712 24,267 24,263 24,258 24,254 24,250 $24,246 Intangibles held for sale(1) ----- 3,553 3,553 3,000 3,000 3,000 ---- Tangible common equity 54,406 88,788 91,662 94,628 98,830 102,457 104,411 105,991 112,150 122,313 130,704 137,185 143,736 150,883 Common shares outstanding, end of period 5,917,667 7,968,420 7,968,420 7,968,420 7,983,866 7,983,284 7,940,168 7,917,489 7,939,024 7,951,749 7,951,773 7,957,900 7,994,832 8,002,874 Tangible common book value per share $9.19 $11.14 $11.50 $11.88 $12.38 $12.83 $13.15 $13.39 $14.13 $15.38 $16.44 $17.24 $17.98 $18.85 (1) Represents the intangible portion of assets held for sale Consolidated Efficiency Ratio For the Three Months Ended, (Dollars in thousands) June 30, 2020 September 30, 2020 December 31, 2020 March 31, 2021 June 30, 2021 September 30, 2021 Non-interest expense $12,644 $16,632 $15,614 $15,629 $15,521 $16,469 Less: amortization 4 4 4 4 4 5 Less: provision on other real estate owned - 100 76 --- Less: loss on assets held for sale ------ Plus: gain on sale of LA fixed income team -- 62 --- Adjusted non-interest expense $12,640 $16,528 $15,596 $15,625 $15,517 $16,464 Net interest income $10,796 $12,918 $13,457 $13,053 $14,223 $14,846 Non-interest income 15,427 18,032 9,954 10,615 9,498 10,495 Less: Net gain on sale of securities ------ Less: Net gain on sale of assets ------ Total income $26,223 $30,950 $23,411 $23,668 $23,721 $25,341 Efficiency ratio 48.2% 53.4% 66.6% 66.0% 65.4% 65.0% |