| Third Quarter 2022 Conference Call |
| Safe Harbor 2 This presentation contains “forward - looking statements” within the meaning of Section 27 A of the Securities Act of 1933 , as amended, and Section 21 E of the Securities Exchange Act of 1934 , as amended .. These forward - looking statements reflect the current views of First Western Financial, Inc .. ’s (“First Western”) management with respect to, among other things, future events and First Western’s financial performance .. These statements are often, but not always, made through the use of words or phrases such as “may,” “should,” “could,” “predict,” “potential,” “believe,” “will likely result,” “expect,” “continue,” “will,” “anticipate,” “seek,” “estimate,” “intend,” “plan,” “position,” “project,” “future” “forecast,” “goal,” “target,” “would” and “outlook,” or the negative variations of those words or other comparable words of a future or forward - looking nature .. These forward - looking statements are not historical facts, and are based on current expectations, estimates and projections about First Western’s industry, management’s beliefs and certain assumptions made by management, many of which, by their nature, are inherently uncertain and beyond First Western’s control .. Accordingly, First Western cautions you that any such forward - looking statements are not guarantees of future performance and are subject to risks, assumptions and uncertainties that are difficult to predict .. Although First Western believes that the expectations reflected in these forward - looking statements are reasonable as of the date made, actual results may prove to be materially different from the results expressed or implied by the forward - looking statements .. Those following risks and uncertainties, among others, could cause actual results and future events to differ materially from those set forth or contemplated in the forward - looking statements : the COVID - 19 pandemic and its effects ; integration risks in connection with acquisitions ; the risk of geographic concentration in Colorado, Arizona, Wyoming, California, and Montana ; the risk of changes in the economy affecting real estate values and liquidity ; the risk in our ability to continue to originate residential real estate loans and sell such loans ; risks specific to commercial loans and borrowers ; the risk of claims and litigation pertaining to our fiduciary responsibilities ; the risk of competition for investment managers and professionals ; the risk of fluctuation in the value of our investment securities ; the risk of changes in interest rates ; and the risk of the adequacy of our allowance for credit losses and the risk in our ability to maintain a strong core deposit base or other low - cost funding sources .. Additional information regarding these and other risks and uncertainties to which our business and future financial performance are subject is contained in our Annual Report on Form 10 - K filed with the U .. S .. Securities and Exchange Commission (“SEC”) on March 15 , 2022 and other documents we file with the SEC from time to time .. All subsequent written and oral forward - looking statements attributable to First Western or persons acting on First Western’s behalf are expressly qualified in their entirety by this paragraph .. Forward - looking statements speak only as of the date of this presentation .. First Western undertakes no obligation to publicly update or otherwise revise any forward - looking statements, whether as a result of new information, future events or otherwise (except as required by law) .. Certain of the information contained herein may be derived from information provided by industry sources .. The Company believes that such information is accurate and the sources from which it has been obtained are reliable ; however, the Company cannot guaranty the accuracy of such information and has not independently verified such information .. This presentation contains certain non - GAAP financial measures intended to supplement, not substitute for, comparable GAAP measures .. Reconciliations of non - GAAP financial measures to GAAP financial measures are provided at the end of this presentation .. Numbers in the presentation may not sum due to rounding .. Our common stock is not a deposit or savings account .. Our common stock is not insured by the Federal Deposit Insurance Corporation or any governmental agency or instrumentality .. This presentation is not an offer to sell any securities and it is not soliciting an offer to buy any securities in any state or jurisdiction where the offer or sale is not permitted .. Neither the SEC nor any state securities commission has approved or disapproved of the securities of the Company or passed upon the accuracy or adequacy of this presentation .. Any representation to the contrary is a criminal offense .. Except as otherwise indicated, this presentation speaks as of the date hereof .. The delivery of this presentation shall not, under any circumstances, create any implication that there has been no change in the affairs of the Company after the date hereof .. |
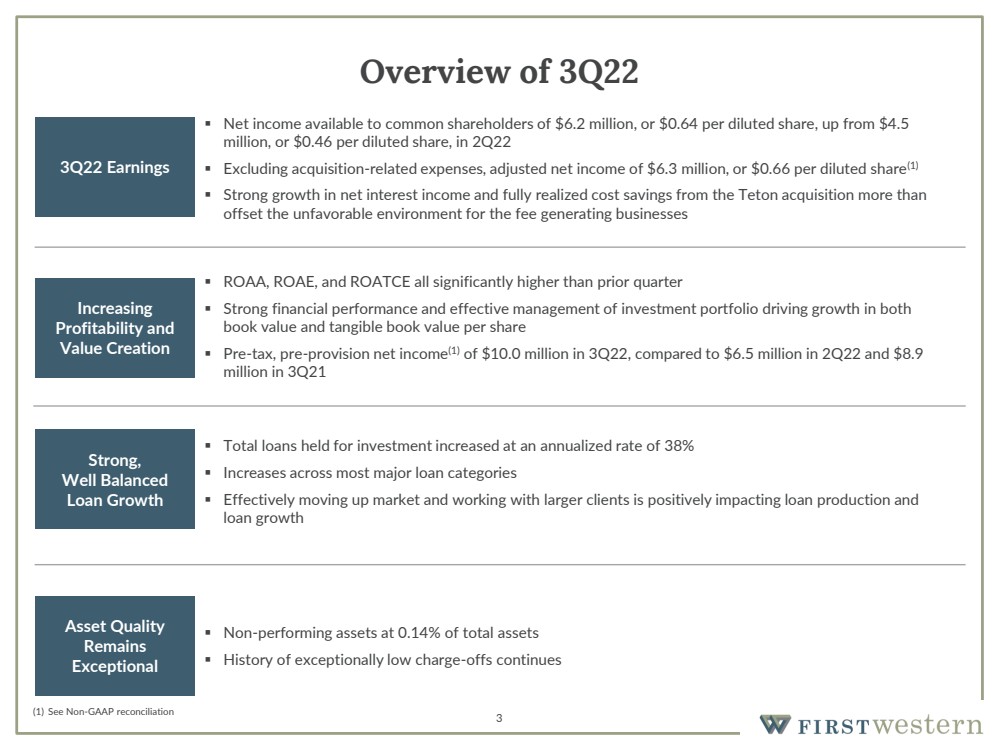
| 3 Overview of 3Q22 Strong, Well Balanced Loan Growth 3Q22 Earnings Increasing Profitability and Value Creation ▪ ROAA, ROAE, and ROATCE all significantly higher than prior quarter ▪ Strong financial performance and effective management of investment portfolio driving growth in both book value and tangible book value per share ▪ Pre - tax, pre - provision net income (1) of $10.0 million in 3Q22, compared to $6.5 million in 2Q22 and $8.9 million in 3Q21 ▪ Non - performing assets at 0.14% of total assets ▪ History of exceptionally low charge - offs continues Asset Quality Remains Exceptional ▪ Total loans held for investment increased at an annualized rate of 38% ▪ Increases across most major loan categories ▪ Effectively moving up market and working with larger clients is positively impacting loan production and loan growth ▪ Net income available to common shareholders of $6.2 million, or $0.64 per diluted share, up from $4.5 million, or $0.46 per diluted share, in 2Q22 ▪ Excluding acquisition - related expenses, adjusted net income of $6.3 million, or $0.66 per diluted share (1) ▪ Strong growth in net interest income and fully realized cost savings from the Teton acquisition more than offset the unfavorable environment for the fee generating businesses (1) See Non - GAAP reconciliation |
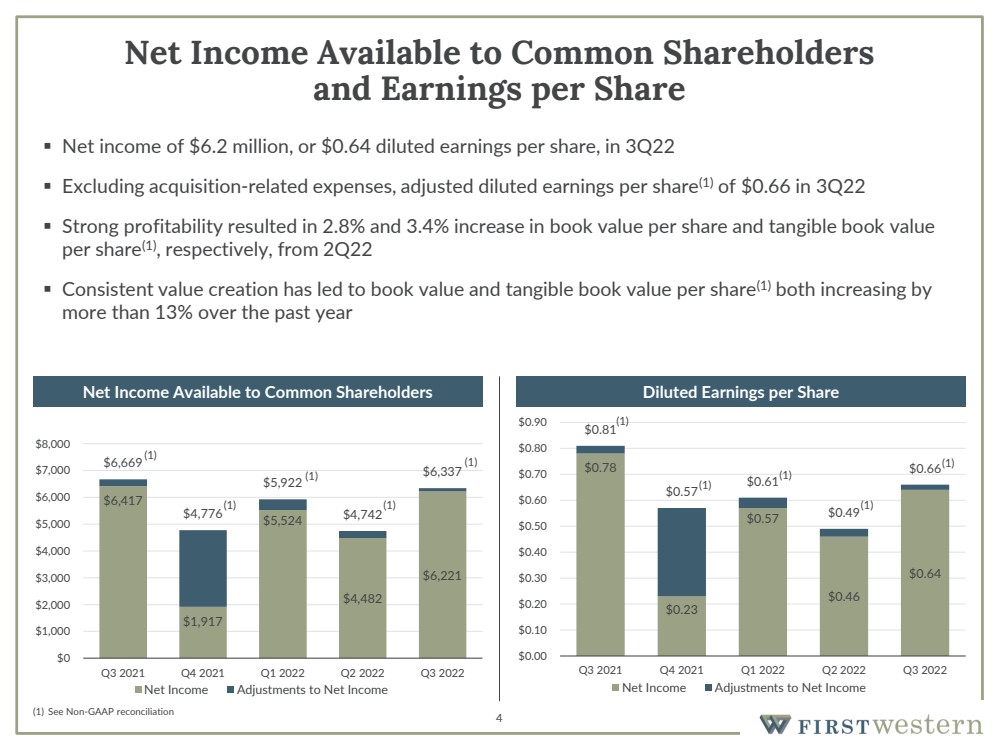
| 4 Net Income Available to Common Shareholders and Earnings per Share ▪ Net income of $6.2 million, or $0.64 diluted earnings per share, in 3Q22 ▪ Excluding acquisition - related expenses, adjusted diluted earnings per share (1) of $0.66 in 3Q22 ▪ Strong profitability resulted in 2.8% and 3.4% increase in book value per share and tangible book value per share (1) , respectively, from 2Q22 ▪ Consistent value creation has led to book value and tangible book value per share (1) both increasing by more than 13% over the past year $6,417 $1,917 $5,524 $4,482 $6,221 $6,669 $4,776 $5,922 $4,742 $6,337 $0 $1,000 $2,000 $3,000 $4,000 $5,000 $6,000 $7,000 $8,000 Q3 2021 Q4 2021 Q1 2022 Q2 2022 Q3 2022 Net Income Adjustments to Net Income $0.78 $0.23 $0.57 $0.46 $0.64 $0.81 $0.57 $0.61 $0.49 $0.66 $0.00 $0.10 $0.20 $0.30 $0.40 $0.50 $0.60 $0.70 $0.80 $0.90 Q3 2021 Q4 2021 Q1 2022 Q2 2022 Q3 2022 Net Income Adjustments to Net Income Net Income Available to Common Shareholders Diluted Earnings per Share (1) See Non - GAAP reconciliation (1) (1) (1) (1) (1) (1) (1) (1) (1) (1) |
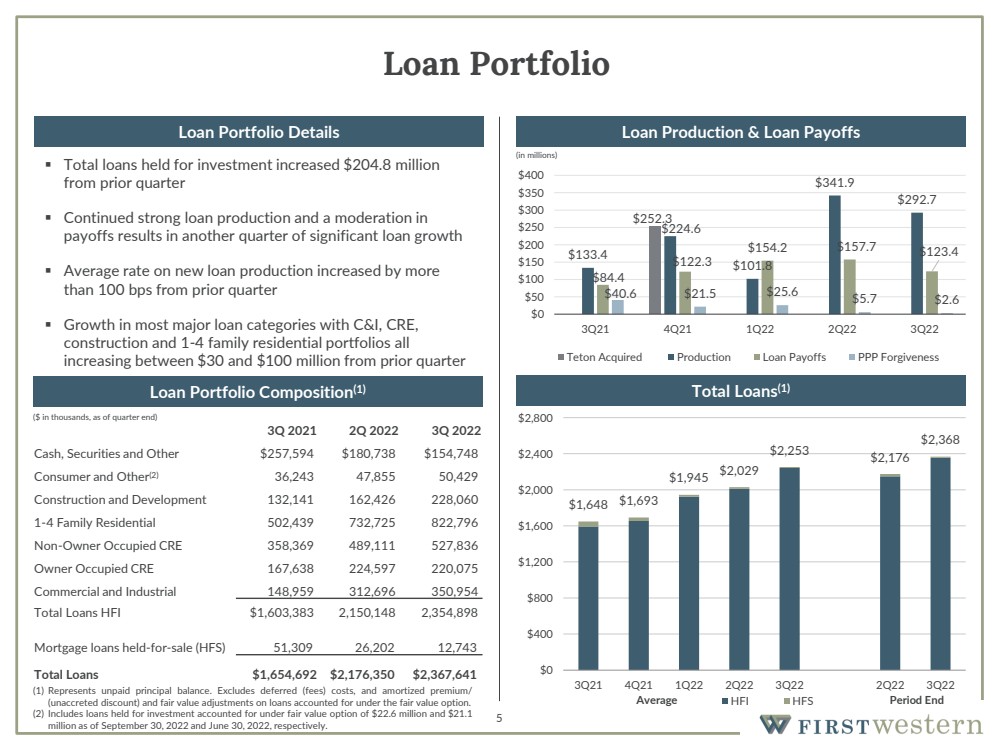
| 5 Loan Portfolio ▪ Total loans held for investment increased $204.8 million from prior quarter ▪ Continued strong loan production and a moderation in payoffs results in another quarter of significant loan growth ▪ Average rate on new loan production increased by more than 100 bps from prior quarter ▪ Growth in most major loan categories with C&I, CRE, construction and 1 - 4 family residential portfolios all increasing between $30 and $100 million from prior quarter 3Q 2021 2Q 2022 3Q 2022 Cash, Securities and Other $257,594 $180,738 $154,748 Consumer and Other (2) 36,243 47,855 50,429 Construction and Development 132,141 162,426 228,060 1 - 4 Family Residential 502,439 732,725 822,796 Non - Owner Occupied CRE 358,369 489,111 527,836 Owner Occupied CRE 167,638 224,597 220,075 Commercial and Industrial 148,959 312,696 350,954 Total Loans HFI $1,603,383 2,150,148 2,354,898 Mortgage loans held - for - sale (HFS) 51,309 26,202 12,743 Total Loans $1,654,692 $2,176,350 $2,367,641 $252.3 $133.4 $224.6 $101.8 $341.9 $292.7 $84.4 $122.3 $154.2 $157.7 $123.4 $40.6 $21.5 $25.6 $5.7 $2.6 $0 $50 $100 $150 $200 $250 $300 $350 $400 3Q21 4Q21 1Q22 2Q22 3Q22 Teton Acquired Production Loan Payoffs PPP Forgiveness (in millions) $1,648 $1,693 $1,945 $2,029 $2,253 $2,176 $2,368 $0 $400 $800 $1,200 $1,600 $2,000 $2,400 $2,800 3Q21 4Q21 1Q22 2Q22 3Q22 2Q22 3Q22 HFI HFS (1) Represents unpaid principal balance .. Excludes deferred (fees) costs, and amortized premium/ (unaccreted discount) and fair value adjustments on loans accounted for under the fair value option .. (2) Includes loans held for investment accounted for under fair value option of $ 22 .. 6 million and $ 21 .. 1 million as of September 30 , 2022 and June 30 , 2022 , respectively .. ($ in thousands, as of quarter end) Loan Portfolio Composition (1) Loan Portfolio Details Loan Production & Loan Payoffs Total Loans (1) Average Period End |
| 6 Total Deposits ▪ Total deposits essentially unchanged from end of prior quarter ▪ Minor fluctuations in each deposit category ▪ Interest bearing deposit costs increased 44 bps due to the higher interest rate environment and increased competition for deposits 3Q 2021 2Q 2022 3Q 2022 Money market deposit accounts $905,196 $1,033,739 $1,010,846 Time deposits 137,015 147,623 186,680 NOW 137,833 287,195 277,225 Savings accounts 5,620 33,099 30,641 Noninterest - bearing accounts 596,635 668,342 662,055 Total Deposits $1,782,299 $2,169,998 $2,167,447 $1,723 $1,805 $2,274 $2,227 $2,154 $2,170 $2,167 $0 $500 $1,000 $1,500 $2,000 $2,500 3Q21 4Q21 1Q22 2Q22 3Q22 2Q22 3Q22 Average Period End ($ in millions) Deposit Portfolio Composition Total Deposits |
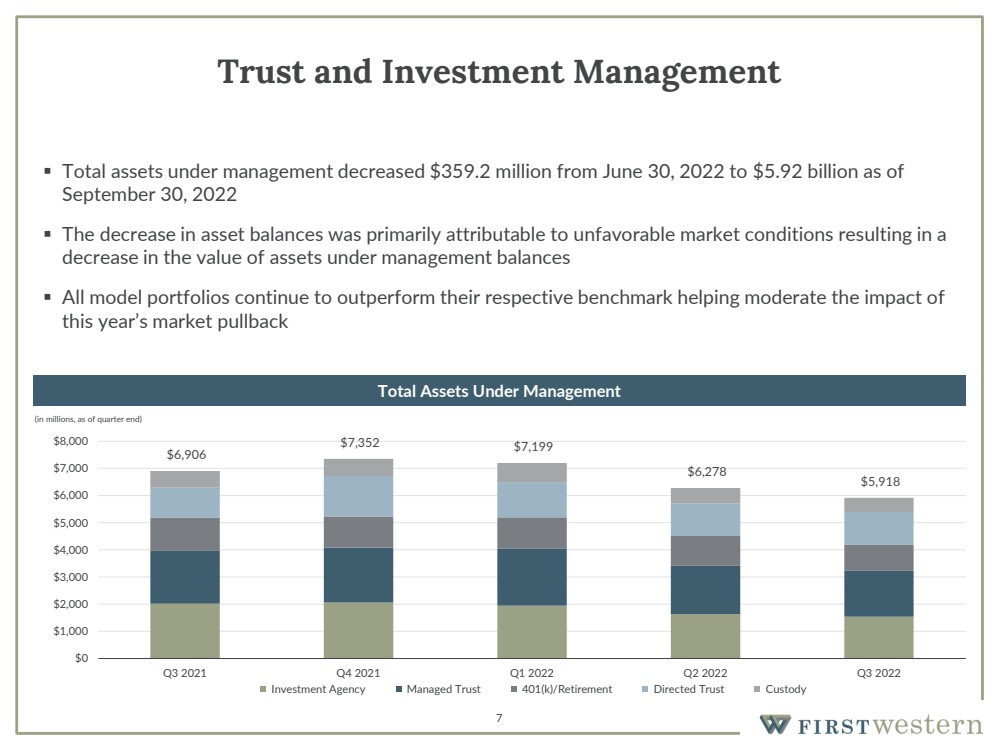
| 7 Trust and Investment Management ▪ Total assets under management decreased $359.2 million from June 30, 2022 to $5.92 billion as of September 30, 2022 ▪ The decrease in asset balances was primarily attributable to unfavorable market conditions resulting in a decrease in the value of assets under management balances ▪ All model portfolios continue to outperform their respective benchmark helping moderate the impact of this year’s market pullback $6,906 $7,352 $7,199 $6,278 $5,918 $0 $1,000 $2,000 $3,000 $4,000 $5,000 $6,000 $7,000 $8,000 Q3 2021 Q4 2021 Q1 2022 Q2 2022 Q3 2022 Investment Agency Managed Trust 401(k)/Retirement Directed Trust Custody (in millions, as of quarter end) Total Assets Under Management |
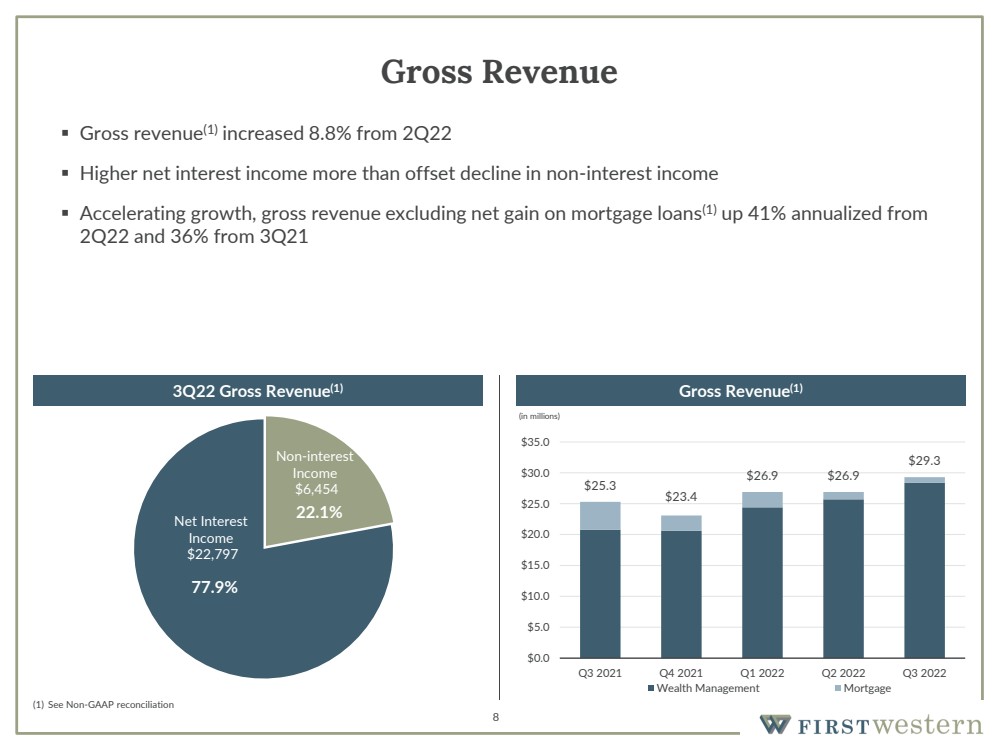
| (1) See Non - GAAP reconciliation Gross Revenue ▪ Gross revenue (1) increased 8.8% from 2Q22 ▪ Higher net interest income more than offset decline in non - interest income ▪ Accelerating growth, gross revenue excluding net gain on mortgage loans (1) up 41% annualized from 2Q22 and 36% from 3Q21 Non - interest Income $6,454 Net Interest Income $22,797 22.1% 77.9% $25.3 $23.4 $26.9 $26.9 $29.3 $0.0 $5.0 $10.0 $15.0 $20.0 $25.0 $30.0 $35.0 Q3 2021 Q4 2021 Q1 2022 Q2 2022 Q3 2022 Wealth Management Mortgage (in millions) 3Q22 Gross Revenue (1) Gross Revenue (1) 8 |
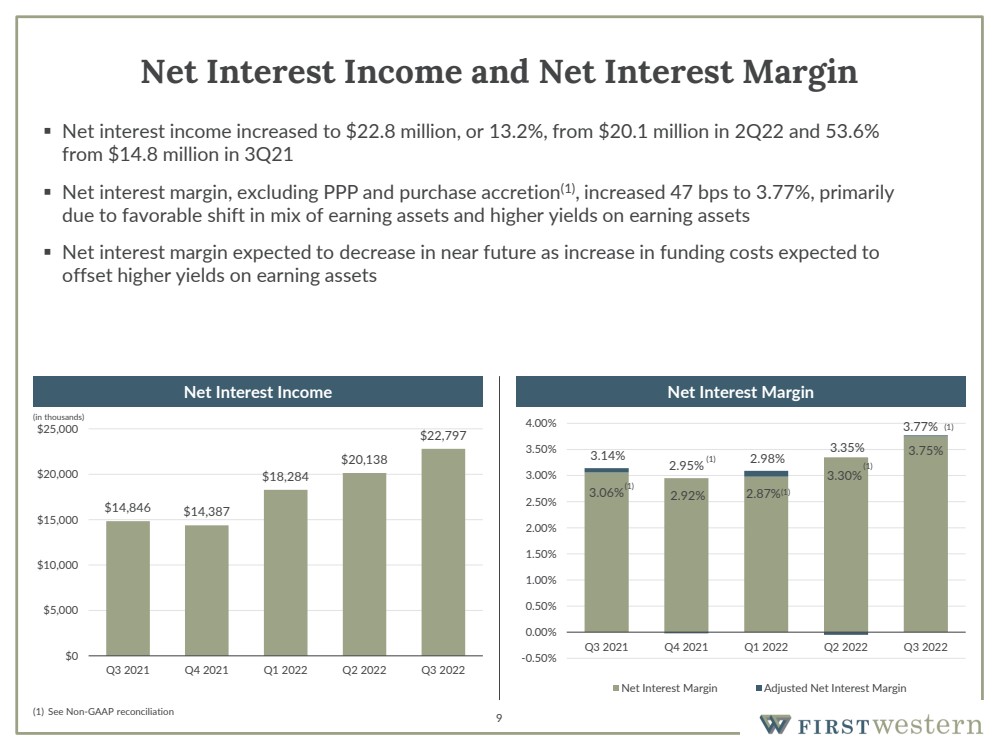
| 9 Net Interest Income and Net Interest Margin ▪ Net interest income increased to $22.8 million, or 13.2%, from $20.1 million in 2Q22 and 53.6% from $14.8 million in 3Q21 ▪ Net interest margin, excluding PPP and purchase accretion (1) , increased 47 bps to 3.77%, primarily due to favorable shift in mix of earning assets and higher yields on earning assets ▪ Net interest margin expected to decrease in near future as increase in funding costs expected to offset higher yields on earning assets $14,846 $14,387 $18,284 $20,138 $22,797 $0 $5,000 $10,000 $15,000 $20,000 $25,000 Q3 2021 Q4 2021 Q1 2022 Q2 2022 Q3 2022 3.06% 2.95% 2.98% 3.35% 3.75% 3.14% 2.92% 2.87% (1) 3.30% 3.77% -0.50% 0.00% 0.50% 1.00% 1.50% 2.00% 2.50% 3.00% 3.50% 4.00% Q3 2021 Q4 2021 Q1 2022 Q2 2022 Q3 2022 Net Interest Margin Adjusted Net Interest Margin (1) (1) (1) (1) (in thousands) (1) See Non - GAAP reconciliation Net Interest Income Net Interest Margin |
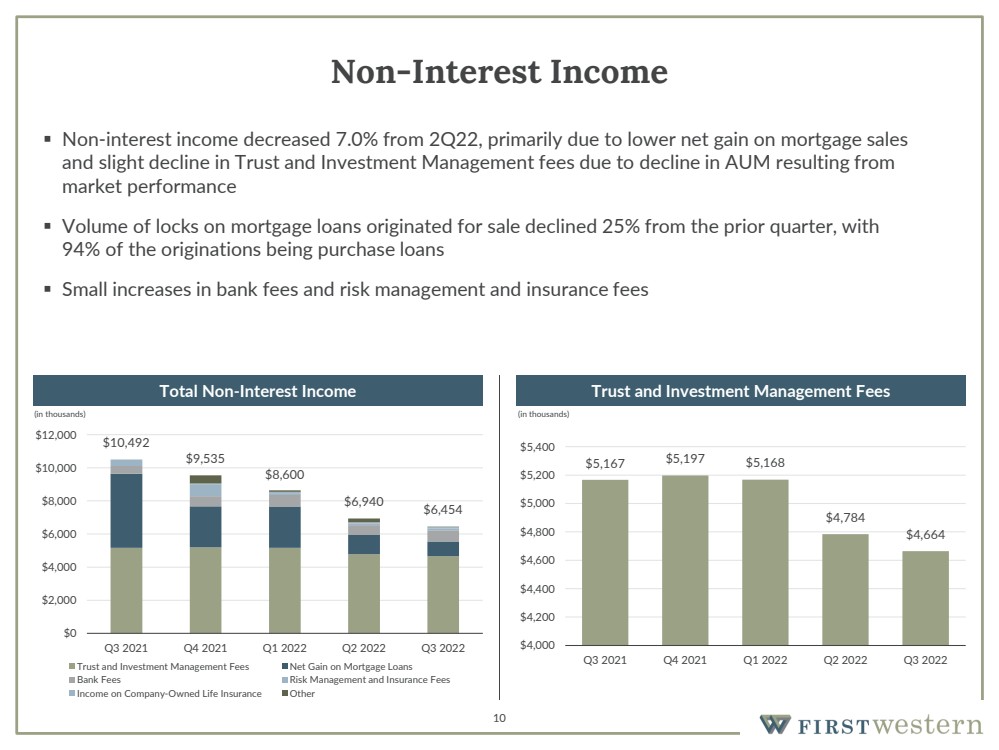
| 10 Non - Interest Income ▪ Non - interest income decreased 7.0% from 2Q22, primarily due to lower net gain on mortgage sales and slight decline in Trust and Investment Management fees due to decline in AUM resulting from market performance ▪ Volume of locks on mortgage loans originated for sale declined 25% from the prior quarter, with 94% of the originations being purchase loans ▪ Small increases in bank fees and risk management and insurance fees $10,492 $9,535 $8,600 $6,940 $6,454 $0 $2,000 $4,000 $6,000 $8,000 $10,000 $12,000 Q3 2021 Q4 2021 Q1 2022 Q2 2022 Q3 2022 Trust and Investment Management Fees Net Gain on Mortgage Loans Bank Fees Risk Management and Insurance Fees Income on Company-Owned Life Insurance Other $5,167 $5,197 $5,168 $4,784 $4,664 $4,000 $4,200 $4,400 $4,600 $4,800 $5,000 $5,200 $5,400 Q3 2021 Q4 2021 Q1 2022 Q2 2022 Q3 2022 (in thousands) (in thousands) Total Non - Interest Income Trust and Investment Management Fees |
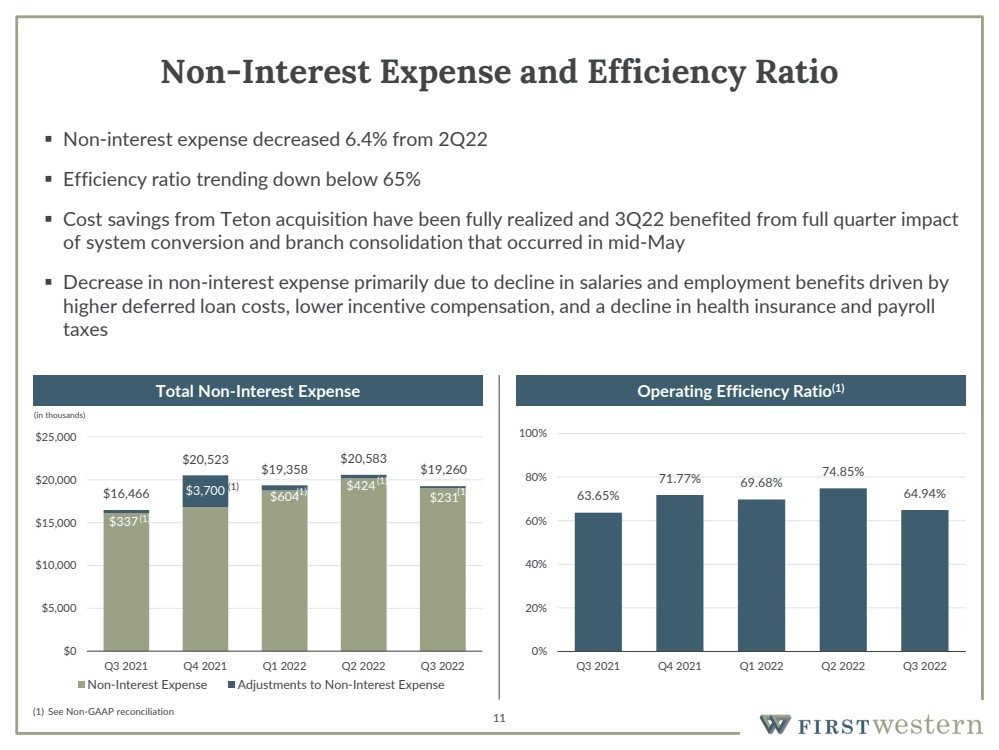
| 11 Non - Interest Expense and Efficiency Ratio ▪ Non - interest expense decreased 6.4% from 2Q22 ▪ Efficiency ratio trending down below 65% ▪ Cost savings from Teton acquisition have been fully realized and 3Q22 benefited from full quarter impact of system conversion and branch consolidation that occurred in mid - May ▪ Decrease in non - interest expense primarily due to decline in salaries and employment benefits driven by higher deferred loan costs, lower incentive compensation, and a decline in health insurance and payroll taxes $337 $3,700 $604 $424 $231 $16,466 $20,523 $19,358 $20,583 $19,260 $0 $5,000 $10,000 $15,000 $20,000 $25,000 Q3 2021 Q4 2021 Q1 2022 Q2 2022 Q3 2022 Non-Interest Expense Adjustments to Non-Interest Expense (1) 63.65% 71.77% 69.68% 74.85% 64.94% 0% 20% 40% 60% 80% 100% Q3 2021 Q4 2021 Q1 2022 Q2 2022 Q3 2022 (1) See Non - GAAP reconciliation Total Non - Interest Expense Operating Efficiency Ratio (1) (in thousands) (1) (1) (1) (1) (1) |
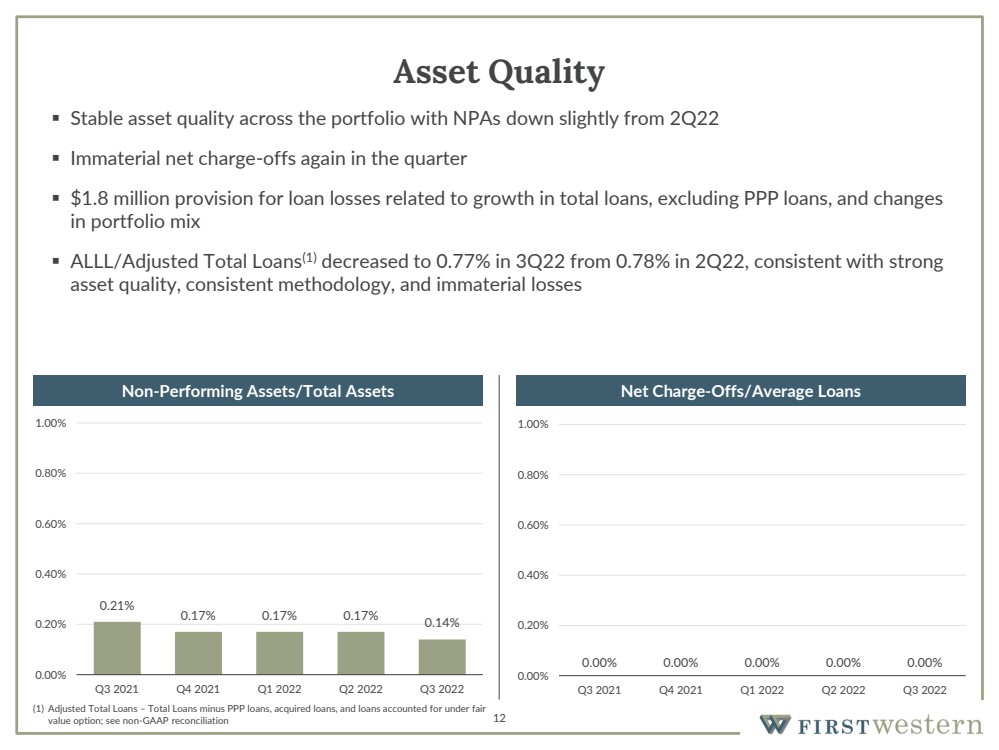
| 12 Asset Quality ▪ Stable asset quality across the portfolio with NPAs down slightly from 2Q22 ▪ Immaterial net charge - offs again in the quarter ▪ $1.8 million provision for loan losses related to growth in total loans, excluding PPP loans, and changes in portfolio mix ▪ ALLL/Adjusted Total Loans (1) decreased to 0.77% in 3Q22 from 0.78% in 2Q22, consistent with strong asset quality, consistent methodology, and immaterial losses 0.21% 0.17% 0.17% 0.17% 0.14% 0.00% 0.20% 0.40% 0.60% 0.80% 1.00% Q3 2021 Q4 2021 Q1 2022 Q2 2022 Q3 2022 0.00% 0.00% 0.00% 0.00% 0.00% 0.00% 0.20% 0.40% 0.60% 0.80% 1.00% Q3 2021 Q4 2021 Q1 2022 Q2 2022 Q3 2022 Non - Performing Assets/Total Assets Net Charge - Offs/Average Loans (1) Adjusted Total Loans – Total Loans minus PPP loans, acquired loans, and loans accounted for under fair value option; see non - GAAP reconciliation |
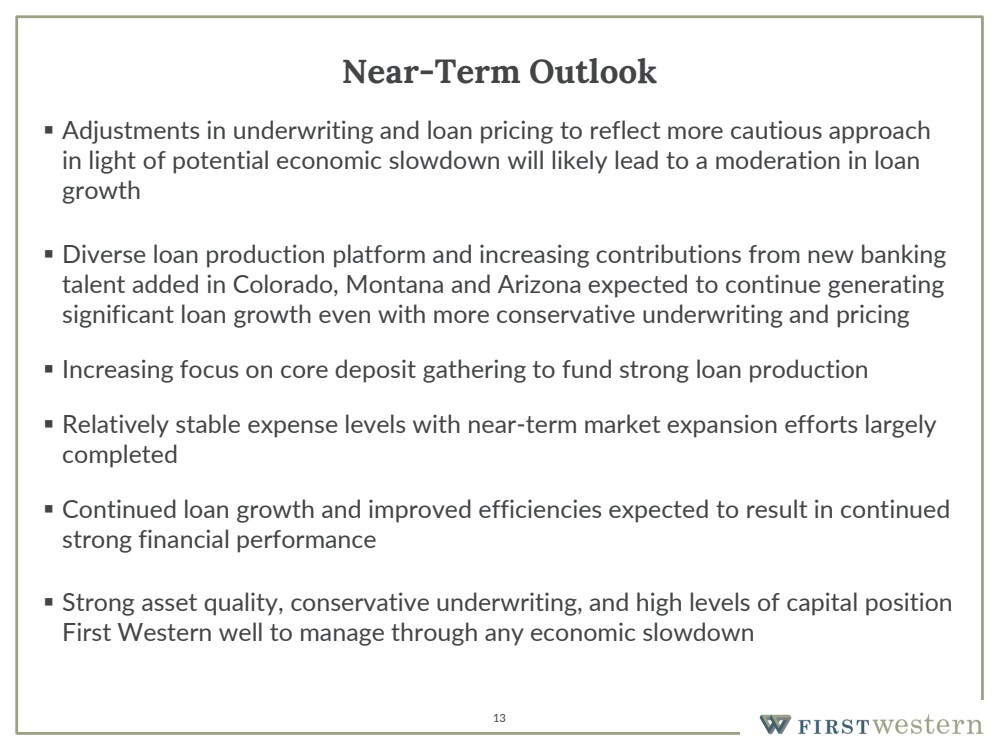
| 13 Near - Term Outlook ▪ Adjustments in underwriting and loan pricing to reflect more cautious approach in light of potential economic slowdown will likely lead to a moderation in loan growth ▪ Diverse loan production platform and increasing contributions from new banking talent added in Colorado, Montana and Arizona expected to continue generating significant loan growth even with more conservative underwriting and pricing ▪ Increasing focus on core deposit gathering to fund strong loan production ▪ Relatively stable expense levels with near - term market expansion efforts largely completed ▪ Continued loan growth and improved efficiencies expected to result in continued strong financial performance ▪ Strong asset quality, conservative underwriting, and high levels of capital position First Western well to manage through any economic slowdown |
| Appendix 14 |
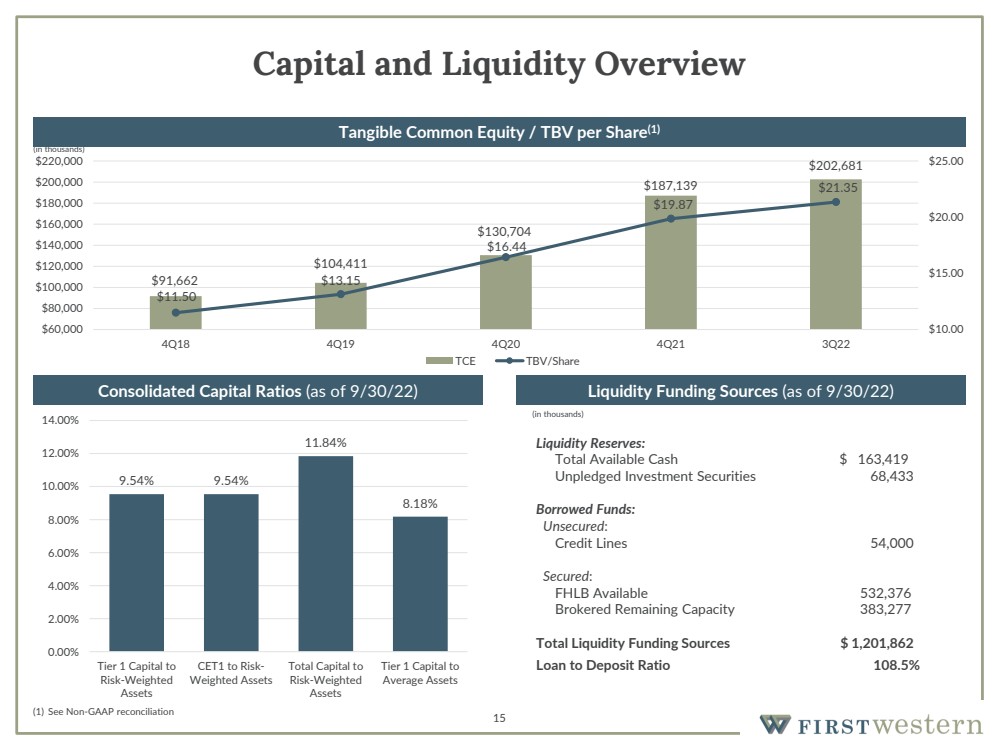
| 15 Capital and Liquidity Overview 9.54% 9.54% 11.84% 8.18% 0.00% 2.00% 4.00% 6.00% 8.00% 10.00% 12.00% 14.00% Tier 1 Capital to Risk-Weighted Assets CET1 to Risk- Weighted Assets Total Capital to Risk-Weighted Assets Tier 1 Capital to Average Assets Liquidity Funding Sources (as of 9/30/22) Liquidity Reserves: Total Available Cash $ 163,419 Unpledged Investment Securities 68,433 Borrowed Funds: Unsecured : Credit Lines 54,000 Secured : FHLB Available 532,376 Brokered Remaining Capacity 383,277 Total Liquidity Funding Sources $ 1,201,862 Loan to Deposit Ratio 108.5% $91,662 $104,411 $130,704 $187,139 $202,681 $11.50 $13.15 $16.44 $19.87 $21.35 $10.00 $15.00 $20.00 $25.00 $60,000 $80,000 $100,000 $120,000 $140,000 $160,000 $180,000 $200,000 $220,000 4Q18 4Q19 4Q20 4Q21 3Q22 TCE TBV/Share (in thousands) (1) See Non - GAAP reconciliation Consolidated Capital Ratios (as of 9/30/22) Tangible Common Equity / TBV per Share (1) (in thousands) |
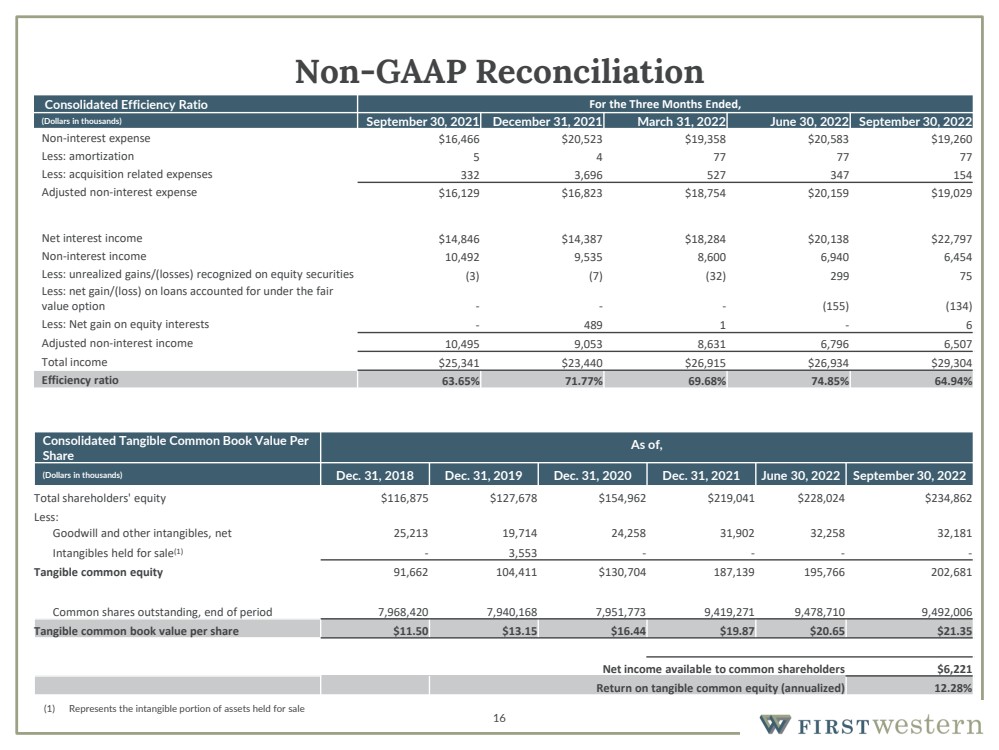
| 16 Non - GAAP Reconciliation Consolidated Tangible Common Book Value Per Share As of , (Dollars in thousands) Dec. 31, 2018 Dec. 31, 2019 Dec. 31, 2020 Dec. 31 , 2021 June 30 , 2022 September 30 , 2022 Total shareholders' equity $116,875 $127,678 $154,962 $219,041 $228,024 $234,862 Less: Goodwill and other intangibles, net 25,213 19,714 24,258 31,902 32,258 32,181 Intangibles held for sale (1) - 3,553 - - - - Tangible common equity 91,662 104,411 $130,704 187,139 195,766 202,681 Common shares outstanding, end of period 7,968,420 7,940,168 7,951,773 9,419,271 9,478,710 9,492,006 Tangible common book value per share $11.50 $13.15 $16.44 $19.87 $20.65 $21.35 Net income available to common shareholders $6,221 Return on tangible common equity (annualized) 12.28% (1) Represents the intangible portion of assets held for sale Consolidated Efficiency Ratio For the Three Months Ended, (Dollars in thousands) September 30, 2021 December 31, 2021 March 31, 2022 June 30, 2022 September 30, 2022 Non - interest expense $16,466 $20,523 $19,358 $20,583 $19,260 Less: amortization 5 4 77 77 77 Less: acquisition related expenses 332 3,696 527 347 154 Adjusted non - interest expense $16,129 $16,823 $18,754 $20,159 $19,029 Net interest income $14,846 $14,387 $18,284 $20,138 $22,797 Non - interest income 10,492 9,535 8,600 6,940 6,454 Less: unrealized gains/(losses) recognized on equity securities (3) (7) (32) 299 75 Less: net gain/(loss) on loans accounted for under the fair value option - - - (155) (134) Less: Net gain on equity interests - 489 1 - 6 Adjusted non - interest income 10,495 9,053 8,631 6,796 6,507 Total income $25,341 $23,440 $26,915 $26,934 $29,304 Efficiency ratio 63.65% 71.77% 69.68% 74.85% 64.94% |
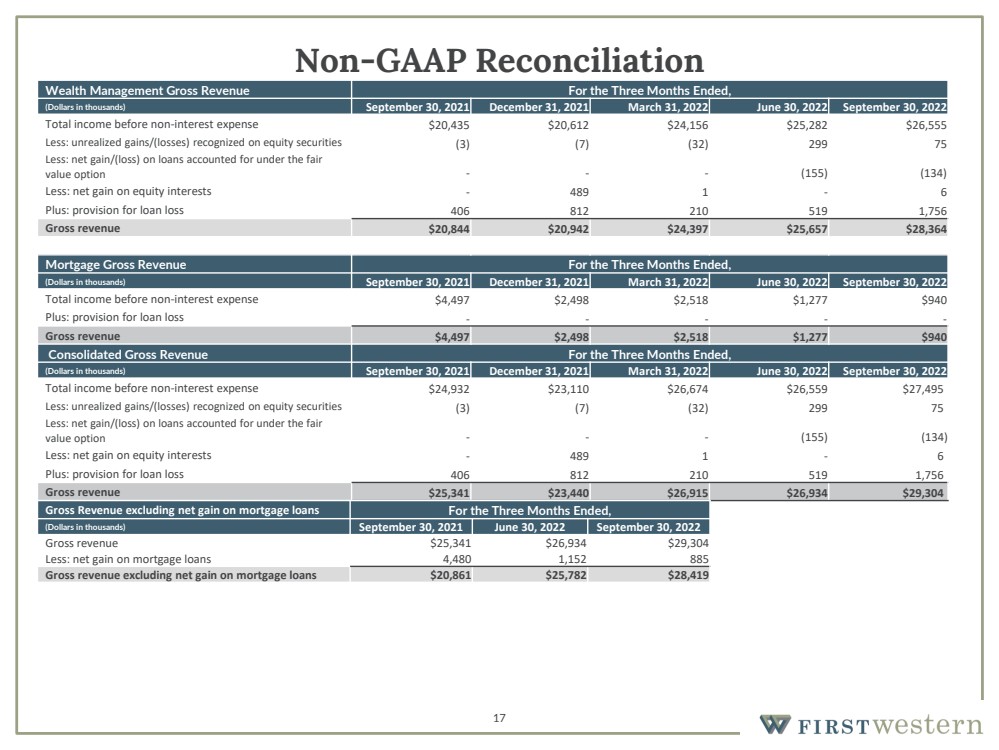
| 17 Non - GAAP Reconciliation Wealth Management Gross Revenue For the Three Months Ended, (Dollars in thousands) September 30, 2021 December 31, 2021 March 31, 2022 June 30, 2022 September 30, 2022 Total income before non - interest expense $20,435 $20,612 $24,156 $25,282 $26,555 Less: unrealized gains/(losses) recognized on equity securities (3) (7) (32) 299 75 Less: net gain/(loss) on loans accounted for under the fair value option - - - (155) (134) Less: net gain on equity interests - 489 1 - 6 Plus: provision for loan loss 406 812 210 519 1,756 Gross revenue $20,844 $20,942 $24,397 $25,657 $28,364 Mortgage Gross Revenue For the Three Months Ended, (Dollars in thousands) September 30, 2021 December 31, 2021 March 31, 2022 June 30, 2022 September 30, 2022 Total income before non - interest expense $4,497 $2,498 $2,518 $1,277 $940 Plus: provision for loan loss - - - - - Gross revenue $4,497 $2,498 $2,518 $1,277 $940 Consolidated Gross Revenue For the Three Months Ended, (Dollars in thousands) September 30, 2021 December 31, 2021 March 31, 2022 June 30, 2022 September 30, 2022 Total income before non - interest expense $24,932 $23,110 $26,674 $26,559 $27,495 Less: unrealized gains/(losses) recognized on equity securities (3) (7) (32) 299 75 Less: net gain/(loss) on loans accounted for under the fair value option - - - (155) (134) Less: net gain on equity interests - 489 1 - 6 Plus: provision for loan loss 406 812 210 519 1,756 Gross revenue $25,341 $23,440 $26,915 $26,934 $29,304 Gross Revenue excluding net gain on mortgage loans For the Three Months Ended, (Dollars in thousands) September 30, 2021 June 30, 2022 September 30, 2022 Gross revenue $25,341 $26,934 $29,304 Less: net gain on mortgage loans 4,480 1,152 885 Gross revenue excluding net gain on mortgage loans $20,861 $25,782 $28,419 |
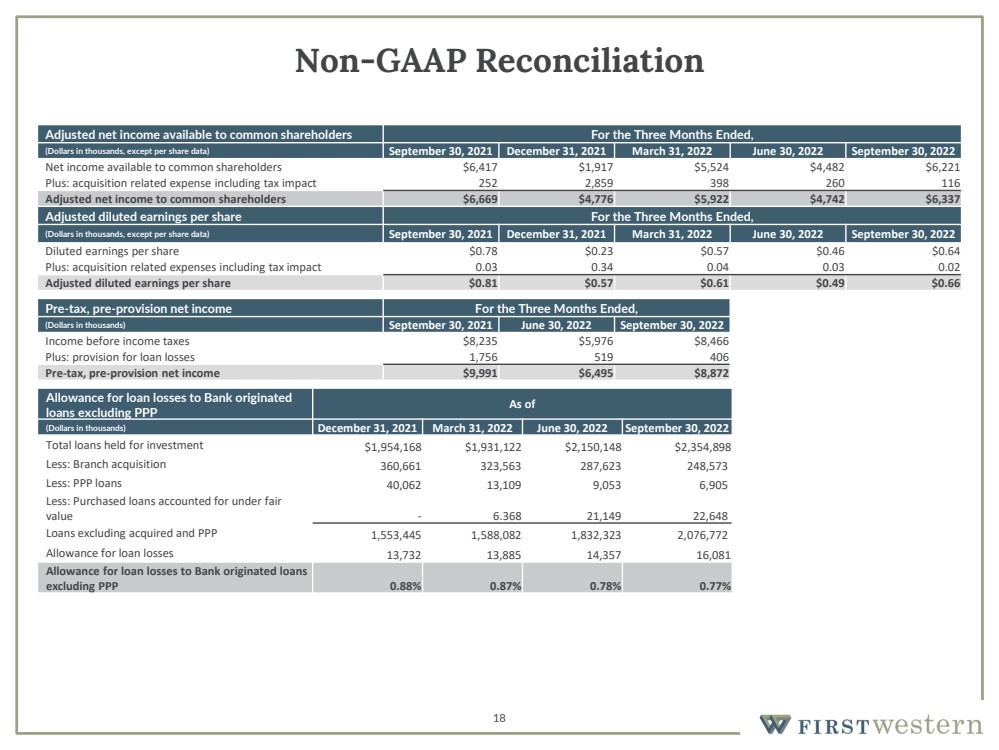
| 18 Non - GAAP Reconciliation Adjusted net income available to common shareholders For the Three Months Ended, (Dollars in thousands, except per share data) September 30, 2021 December 31, 2021 March 31, 2022 June 30, 2022 September 30, 2022 Net income available to common shareholders $6,417 $1,917 $5,524 $4,482 $6,221 Plus: acquisition related expense including tax impact 252 2,859 398 260 116 Adjusted net income to common shareholders $6,669 $4,776 $5,922 $4,742 $6,337 Adjusted diluted earnings per share For the Three Months Ended, (Dollars in thousands, except per share data) September 30, 2021 December 31, 2021 March 31, 2022 June 30, 2022 September 30, 2022 Diluted earnings per share $0.78 $0.23 $0.57 $0.46 $0.64 Plus: acquisition related expenses including tax impact 0.03 0.34 0.04 0.03 0.02 Adjusted diluted earnings per share $0.81 $0.57 $0.61 $0.49 $0.66 Allowance for loan losses to Bank originated loans excluding PPP As of (Dollars in thousands) December 31, 2021 March 31, 2022 June 30, 2022 September 30, 2022 Total loans held for investment $1,954,168 $1,931,122 $2,150,148 $2,354,898 Less: Branch acquisition 360,661 323,563 287,623 248,573 Less: PPP loans 40,062 13,109 9,053 6,905 Less: Purchased loans accounted for under fair value - 6.368 21,149 22,648 Loans excluding acquired and PPP 1,553,445 1,588,082 1,832,323 2,076,772 Allowance for loan losses 13,732 13,885 14,357 16,081 Allowance for loan losses to Bank originated loans excluding PPP 0.88% 0.87% 0.78% 0.77% Pre - tax, pre - provision net income For the Three Months Ended, (Dollars in thousands) September 30, 2021 June 30, 2022 September 30, 2022 Income before income taxes $8,235 $5,976 $8,466 Plus: provision for loan losses 1,756 519 406 Pre - tax, pre - provision net income $9,991 $6,495 $8,872 |
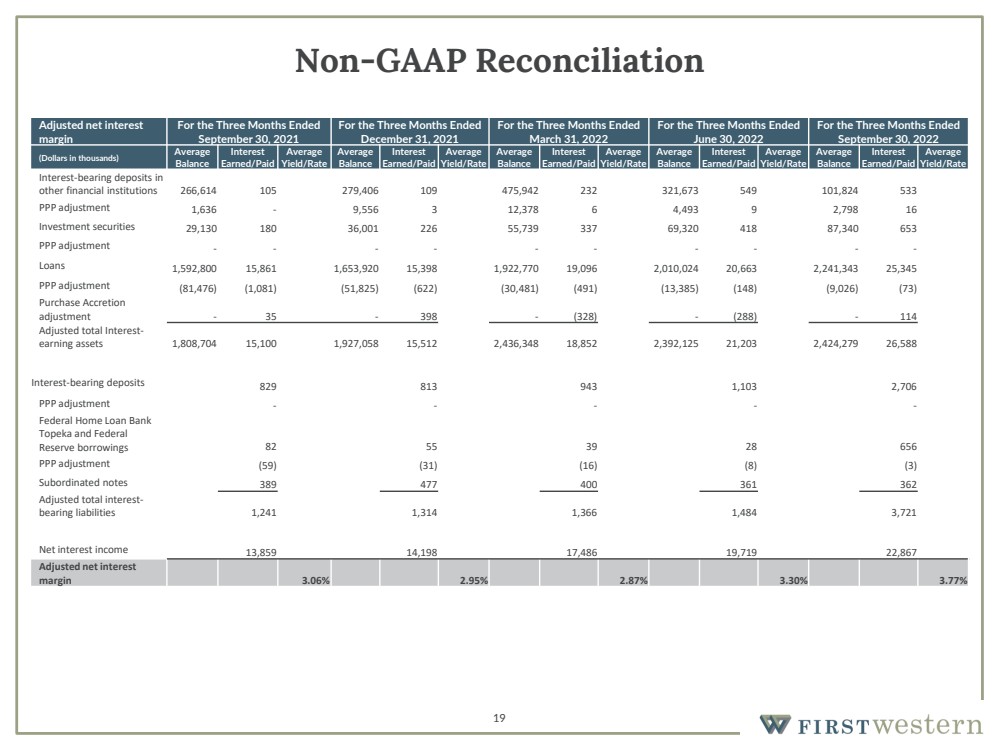
| 19 Non - GAAP Reconciliation Adjusted net interest margin For the Three Months Ended September 30, 2021 For the Three Months Ended December 31, 2021 For the Three Months Ended March 31, 2022 For the Three Months Ended June 30, 2022 For the Three Months Ended September 30, 2022 (Dollars in thousands) Average Balance Interest Earned/Paid Average Yield/Rate Average Balance Interest Earned/Paid Average Yield/Rate Average Balance Interest Earned/Paid Average Yield/Rate Average Balance Interest Earned/Paid Average Yield/Rate Average Balance Interest Earned/Paid Average Yield/Rate Interest - bearing deposits in other financial institutions 266,614 105 279,406 109 475,942 232 321,673 549 101,824 533 PPP adjustment 1,636 - 9,556 3 12,378 6 4,493 9 2,798 16 Investment securities 29,130 180 36,001 226 55,739 337 69,320 418 87,340 653 PPP adjustment - - - - - - - - - - Loans 1,592,800 15,861 1,653,920 15,398 1,922,770 19,096 2,010,024 20,663 2,241,343 25,345 PPP adjustment (81,476) (1,081) (51,825) (622) (30,481) (491) (13,385) (148) (9,026) (73) Purchase Accretion adjustment - 35 - 398 - (328) - (288) - 114 Adjusted total Interest - earning assets 1,808,704 15,100 1,927,058 15,512 2,436,348 18,852 2,392,125 21,203 2,424,279 26,588 Interest - bearing deposits 829 813 943 1,103 2,706 PPP adjustment - - - - - Federal Home Loan Bank Topeka and Federal Reserve borrowings 82 55 39 28 656 PPP adjustment (59) (31) (16) (8) (3) Subordinated notes 389 477 400 361 362 Adjusted total interest - bearing liabilities 1,241 1,314 1,366 1,484 3,721 Net interest income 13,859 14,198 17,486 19,719 22,867 Adjusted net interest margin 3.06% 2.95% 2.87% 3.30% 3.77% |

