UNITED STATES
SECURITIES AND EXCHANGE COMMISSION
WASHINGTON, D.C. 20549
FORM 10-K
| x | ANNUAL REPORT PURSUANT TO SECTION 13 OR 15(d) OF THE SECURITIES EXCHANGE ACT OF 1934 |
FOR THE FISCAL YEAR ENDED DECEMBER 31, 2008
OR
| ¨ | TRANSITION REPORT PURSUANT TO SECTION 13 OR 15(d) OF THE SECURITIES EXCHANGE ACT OF 1934 |
Commission file number: 000-52596
Dividend Capital Total Realty Trust Inc.
(Exact name of registrant as specified in its charter)
| | |
| Maryland | | 30-0309068 |
(State or other jurisdiction of
incorporation or organization) | | (I.R.S. Employer
Identification No.) |
| |
| 518 Seventeenth Street, 17th Floor, Denver, CO | | 80202 |
| (Address of principal executive offices) | | (Zip Code) |
(303) 228-2200
(Registrant’s telephone number, including area code)
Securities registered pursuant to Section 12(b) of the Act:
Title of each class
Common Stock, $0.01 par value
Name of each exchange on which registered
None
Securities registered pursuant to Section 12(g) of the Act:
None
Indicate by check mark if the registrant is a well-known seasoned issuer, as defined in Rule 405 of the Securities Act. Yes ¨ No x
Indicate by check mark if the registrant is not required to file reports pursuant to Section 13 or Section 15(d) of the Act. Yes ¨ No x
Indicate by check mark whether the Registrant: (1) has filed all reports required to be filed by Section 13 or 15(d) of the Securities Exchange Act of 1934 during the preceding 12 months (or for such shorter period that the registrant was required to file such reports), and (2) has been subject to such filing requirements for the past 90 days. Yes x No ¨
Indicate by check mark if disclosure of delinquent filers pursuant to Item 405 of Regulation S-K (§229.405 of this chapter) is not contained herein, and will not be contained, to the best of Registrant’s knowledge, in definitive proxy or information statements incorporated by reference in Part III of this Form 10-K or any amendment to this Form 10-K. ¨
Indicate by check mark whether the Registrant is a large accelerated filer, an accelerated filer, a non-accelerated filer, or a smaller reporting company. See the definitions of “large accelerated filer”, “accelerated filer” and “smaller reporting company” in Rule 12b-2 of the Exchange Act. (Check one):
| | | | | | |
| Large accelerated filer ¨ | | Accelerated filer ¨ | | Non-accelerated filer x | | Smaller reporting company ¨ |
| | | | (Do not check if a smaller reporting company) | | |
Indicate by check mark whether the registrant is a shell company (as defined in Rule 12b-2 of the Exchange Act). Yes ¨ No x
Since there was no established market for the voting and non-voting common stock as of June 30, 2008, there was no market value for the shares of such stock held by non-affiliates of the registrant as of such date. As of March 23, 2009, there were 165,651,490 shares of common stock outstanding.
DOCUMENTS INCORPORATED BY REFERENCE: Portions of the Registrant’s Proxy Statement for the 2008 Annual Meeting of Stockholders, which we anticipate to be held in June 2009, are incorporated by reference in Part III.
DIVIDEND CAPITAL TOTAL REALTY TRUST INC.
FORM 10-K
December 31, 2008
TABLE OF CONTENTS
Forward-Looking Statements
This Annual Report on Form 10-K includes certain statements that may be deemed to be “forward-looking statements” within the meaning of Section 27A of the Securities Act of 1933, as amended, or the Act, and Section 21E of the Securities Exchange Act of 1934, as amended, or the Exchange Act. Such forward- looking statements relate to, without limitation, our future capital expenditures, distributions and acquisitions (including the amount and nature thereof), other development trends of the real estate industry, business strategies, and the expansion and growth of our operations. These statements are based on certain assumptions and analyses made by us in light of our experience and our perception of historical trends, current conditions, expected future developments and other factors we believe are appropriate. We intend such forward-looking statements to be covered by the safe harbor provisions for forward-looking statements contained in Section 27A of the Act and Section 21E of the Exchange Act. Such statements are subject to a number of assumptions, risks and uncertainties which may cause our actual results, performance or achievements to be materially different from future results, performance or achievements expressed or implied by these forward-looking statements. Forward-looking statements are generally identifiable by the use of the words “may,” “will,” “should,” “expect,” “anticipate,” “estimate,” “believe,” “intend,” “project,” “continue,” or the negative of these words, or other similar words or terms. Readers are cautioned not to place undue reliance on these forward-looking statements. Among the factors that may cause our results to vary are general economic and business (particularly real estate and capital market) conditions being less favorable than expected, the business opportunities that may be presented to and pursued by us, changes in laws or regulations (including changes to laws governing the taxation of REITs), risk of acquisitions, availability and creditworthiness of prospective customers, availability of capital (debt and equity), interest rate fluctuations, competition, supply and demand for properties in our current and any proposed market areas, customers’ ability to pay rent at current or increased levels, accounting principles, policies and guidelines applicable to REITs, environmental, regulatory and/or safety requirements, customer bankruptcies and defaults, the availability and cost of comprehensive insurance, including coverage for terrorist acts, and other factors, many of which are beyond our control. For further discussion of these factors see “Item 1A. Risk Factors” in this Annual Report on Form 10-K. We undertake no obligation to publicly update or revise any forward-looking statements, whether as a result of future events, new information or otherwise.
3
PART I
Overview
Dividend Capital Total Realty Trust Inc. is a Maryland corporation formed on April 11, 2005 to invest in a diverse portfolio of real property and real estate related investments. As used herein, “the Company,” “we,” “our” and “us” refer to Dividend Capital Total Realty Trust Inc. and its consolidated subsidiaries and partnerships except where the context otherwise requires.
We operate in a manner intended to qualify as a real estate investment trust (“REIT”) for federal income tax purposes, commencing with the taxable year ended December 31, 2006, when we first elected REIT status. We utilize an Umbrella Partnership Real Estate Investment Trust (“UPREIT”) organizational structure to hold all or substantially all of our assets through our operating partnership, Dividend Capital Total Realty Operating Partnership, L.P. (the “Operating Partnership”). Furthermore, our Operating Partnership wholly owns a taxable REIT subsidiary, DCTRT Leasing Corp. (the “TRS”), through which we execute certain business transactions that might otherwise have an adverse impact on our status as a REIT if such business transactions were to occur directly or indirectly through the Operating Partnership.
Our day-to-day activities are managed by Dividend Capital Total Advisors LLC (the “Advisor”), an affiliate, under the terms and conditions of an advisory agreement (the “Advisory Agreement”). In addition, under the terms of certain dealer manager agreements, Dividend Capital Securities LLC (the “Dealer Manager”), an affiliate, serves as the dealer manager of our public and private offerings. The Advisor and its affiliates, including the Dealer Manager, receive various forms of compensation, reimbursements and fees for services relating to our public and private offerings, and for the investment and management of our real estate assets.
We raise equity capital to finance our investments through (i) selling shares of our common stock through our public offerings, (ii) reinvestment of dividends by our stockholders through our distribution reinvestment plan and (iii) our Operating Partnership’s private placements (see Note 8 in our consolidated financial statements in “Item 8. Financial Statements and Supplementary Data” of this Annual Report on Form 10-K). As of December 31, 2008, we had raised approximately $1.8 billion in gross proceeds, comprised of the following: (i) selling approximately 150.5 million shares of our common stock, net of redemptions, for gross proceeds of approximately $1.5 billion, (ii) issuing approximately 8.5 million shares of our common stock for gross proceeds of approximately $80.8 million pursuant to our distribution reinvestment plan and (iii) raising approximately $170.8 million pursuant to our Operating Partnership’s private placements.
Investment Objectives
As stated in our articles of incorporation, our primary investment objectives are:
| | • | | providing portfolio diversification; |
| | • | | providing current income to our stockholders in the form of consistent quarterly cash distributions; |
| | • | | preserving and protecting our stockholders’ capital investments; and |
| | • | | realizing capital appreciation upon the potential sale of our assets. |
There is no assurance that we will attain our investment objectives. Our charter places numerous limitations on us with respect to the manner in which we may invest our funds. In most cases these limitations cannot be changed unless our charter is amended, which may require the approval of our stockholders.
Investment Strategy
We believe that we can achieve the investment objectives stated above by executing an investment strategy that provides investors seeking a general real estate allocation with a broadly diversified portfolio of real property and other real estate related investments. Our Advisor has primary responsibility for implementing our investment strategy and for actively monitoring and managing our overall portfolio to achieve diversification across multiple dimensions including:
| | • | | investment types, including real properties, real estate securities and debt related investments; |
4
| | • | | real property types (such as office, industrial, retail, multifamily, hospitality and others); |
| | • | | various geographic markets; and |
| | • | | diversified tenant profiles and lease terms. |
We believe that a diversified investment portfolio may potentially offer investors significant benefits for a given level of risk relative to a more concentrated investment portfolio. We also believe that most real estate markets are cyclical in nature, and therefore we believe that a diversified investment strategy may allow us to more effectively deploy capital into sectors and geographies where the underlying investment fundamentals are relatively strong and away from sectors where such fundamentals are relatively weak. In addition, we believe that a diversified tenant base, achieved by investing in multiple real property sectors, may mitigate the economic impacts associated with a single tenant or type of tenant potentially defaulting under its lease, such leases being the primary source of revenue for most real property investments.
Furthermore, we believe that an investment strategy that combines real property investments with investments in real estate securities and debt related assets may offer investors additional diversification and current income benefits. However, there is no assurance that we will be successful in creating a diversified portfolio or that such a portfolio will provide greater benefits to stockholders than a portfolio that is more concentrated in any particular individual real estate investment sector.
Diversification Across Real Estate Investment Types
Over the long term, we intend to invest on average 70% to 80%, but in any event no less than 60%, of our total assets in real properties, and we intend to invest on average 20% to 30%, but in any event no more than 40%, of our total assets in a combination of real estate securities and debt related investments. These relative proportions are subject to change based upon market conditions and other potential factors.
The chart below describes the diversification of our investment portfolio across real estate investment type. Percentages in the chart correspond to investments as reported on our consolidated balance sheet as of December 31, 2008, which, for our real property and debt related investments, is based on our gross investment amount and, for our real estate securities investments, is based on fair value. Debt related investments, as presented in the below chart, include our investment in an unconsolidated joint venture with a total investment amount of approximately $17.5 million.
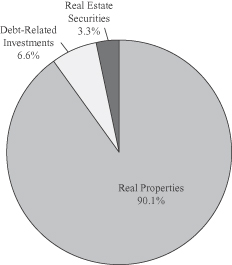
Real Property
We generally utilize a long-term buy and hold strategy for investments within our portfolio of real property assets. The majority of our current portfolio consists of primarily “core” or “core-plus” properties that have significant operating histories and existing leases whereby the majority of the total investment return is expected to be derived from current income. In addition, we have invested in a relatively smaller proportion of “value added” opportunities that have arisen in circumstances where we have determined that a real property may be situationally undervalued or where product re-positioning, capital expenditures and/or improved property management may increase cash flows, and where the total investment return is generally expected to have a relatively larger component derived from capital appreciation. As of December 31, 2008, we had invested in a total of 73 operating properties located in 24 geographic markets throughout the United States at a total gross investment amount of approximately $1.4 billion comprising approximately 12.1 million net rentable square feet.
5
We are not specifically limited in the number or size of real properties we may acquire, or on the percentage of the net proceeds from our public and private offerings that we may invest in a single real property or real property type. However, we may not invest in excess of 10% of the aggregate cost of our real property assets within our portfolio in unimproved land or real properties that are not expected to produce income within two years of their acquisition. The specific number and mix of real properties we acquire in the future will depend upon real estate market conditions, other circumstances existing at the time we make an acquisition and the amount of proceeds we raise in our offerings.
Real Estate Securities
To date, our primary targeted real estate securities have included a combination of (i) perpetual preferred securities of publicly traded real estate investment trusts and (ii) debt securities such as commercial mortgage backed securities (“CMBS”) and various forms of commercial real estate collateralized debt obligations (“CRE-CDOs”). As of December 31, 2008, we had invested in various real estate securities with a total market value of approximately $52.4 million.
Debt Related Investments
To date, our debt related investments have consisted primarily of (i) originations and participations in mortgage loans secured by real estate, (ii) junior portions of first mortgages on commercial properties (“B-notes”) and (iii) mezzanine debt and other related investments secured by equity interests in entities that indirectly own real properties. As of December 31, 2008, we had debt related investments with a total gross investment amount of approximately $106.4 million, which includes our investment in an unconsolidated joint venture.
We are not specifically limited in the number or size of our securities or debt related investments, or on the percentage of the net proceeds from our public and private offerings that we may invest in a single real estate security, debt related investment or pool of real estate related securities. However, we will not make any such investment if it would cause us to exceed our intended allocation of overall securities and debt related investments. In the future, the specific number and mix of real estate securities and debt related investments in which we invest will depend upon real estate market conditions, other circumstances existing at the time we make an investment and the amount of proceeds we raise in our offerings. We will not invest in securities of other issuers for the purpose of exercising control and the first or second mortgages in which we intend to invest will likely not be insured by the Federal Housing Administration or guaranteed by the Veterans Administration or otherwise guaranteed or insured.
Diversification Across Real Property Types
We seek to invest in multiple real property types, consisting primarily of office, industrial, retail, multifamily, hospitality and other real property types. We believe that most real property types are cyclical in nature, and therefore we believe that diversifying our targeted real property types may allow us to deploy capital into real property types where the underlying investment fundamentals are relatively stronger, improving our ability to optimize investment returns.
The chart below describes the diversification of our investment portfolio across real property type. Percentages in the chart correspond to investments as reported on our consolidated balance sheet as of December 31, 2008, which, for our real property and debt related investments, is based on our gross investment amount and, for our real estate securities investments, is based on fair value.
6
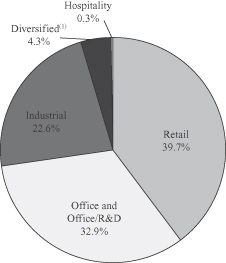
| (1) | Certain of our investments in real estate securities are classified as “diversified” due to the fact that the underlying assets consist of multiple investments that are inherently diversified across various property types. |
Diversification Across Geographic Regions
Through our investments in real property and debt related investments, we also seek diversification across multiple geographic regions located in the United States. The chart below describes our current allocations across geographic regions located within the continental United States, as defined by the National Council of Real Estate Investment Fiduciaries (“NCREIF”), for our operating real property and debt related investments. Percentages in the chart correspond to investments as reported on our consolidated balance sheet as of December 31, 2008, which, for our real property and debt related investments, is based on our gross investment amount. As of December 31, 2008, our real property investments were geographically diversified across 24 markets throughout eight regions. Our debt related investments are located in an additional two markets resulting in a combined portfolio allocation across 26 markets and eight regions.
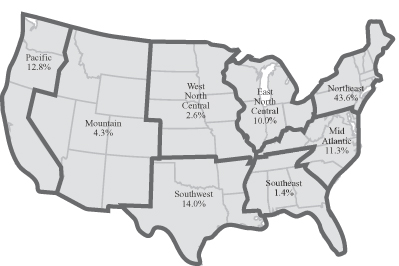
We anticipate that the majority of our real property investments will be made in the United States, although we may also invest in Canada and Mexico, and potentially elsewhere on a limited basis, to the extent opportunities exist that may help us meet our investment objectives.
7
Diversification Across Tenant Profiles and Lease Terms
We believe that the tenant base that occupies our real property assets is generally stable and well-diversified. As of December 31, 2008, our consolidated operating real properties had leases with approximately 380 tenants. We intend to maintain a well-diversified mix of tenants to limit our exposure to any single tenant or industry. Our diversified investment strategy inherently provides for tenant diversity and we continue to monitor our exposure relative to our larger tenant industry sectors. The following table describes our top ten tenant industry sectors as of December 31, 2008. Other tenant industry sectors include 22 additional industry sectors, none of which comprised more than 3.6% of our annualized base rent as of December 31, 2008.
| | | | | | | | | | | | | |
Industry Sector | | Number of
Leases | | Annualized
Base Rent (1) | | % of
Annualized
Base Rent | | | Occupied
Square Feet | | % of
Occupied
Square Feet | |
Grocery Stores | | 22 | | $ | 19,393 | | 19.5 | % | | 1,309 | | 11.4 | % |
Electronics | | 18 | | | 8,109 | | 8.1 | % | | 1,057 | | 9.2 | % |
Financial/Professional Services | | 83 | | | 7,887 | | 7.9 | % | | 383 | | 3.3 | % |
Consumer/General Retail | | 68 | | | 7,253 | | 7.3 | % | | 952 | | 8.3 | % |
Telecommunications | | 15 | | | 7,134 | | 7.2 | % | | 553 | | 4.8 | % |
Healthcare/Medical | | 27 | | | 6,729 | | 6.8 | % | | 762 | | 6.6 | % |
Information Technology | | 17 | | | 5,557 | | 5.6 | % | | 279 | | 2.4 | % |
Restaurant | | 47 | | | 4,094 | | 4.1 | % | | 156 | | 1.4 | % |
Clothing/Apparel | | 28 | | | 4,060 | | 4.1 | % | | 417 | | 3.6 | % |
Drug Stores/Pharmacies | | 8 | | | 3,631 | | 3.6 | % | | 571 | | 5.0 | % |
| | | | | | | | | | | | | |
Total | | 333 | | | 73,847 | | 74.1 | % | | 6,439 | | 56.1 | % |
| | | | | | | | | | | | | |
| (1) | Average annual rent based on commenced leases as of December 31, 2008. |
Current Business Environment
During 2008 and early 2009, significant and widespread concerns about the availability and cost of credit, combined with a deepening recession and increased unemployment, have dramatically lowered growth expectations for both the national and global economy. In addition, the recent failure or near failure of several large financial institutions, together with government interventions in the financial system, have led to increased market uncertainty and instability, as well as to increased risk of geopolitical, trade and other potential conflicts. These conditions, combined with generally declining business activity levels and consumer confidence, have contributed to an unprecedented and challenging macro environment for conducting our business operations.
As a result of the decline in general economic conditions, the U.S. commercial real estate industry has also begun to experience deteriorating fundamentals across most major property types and geographic markets. Tenant bankruptcies are on the rise, while demand for commercial real estate space is simultaneously contracting, creating a highly competitive leasing environment with downward pressure on both occupancy and rental rates, resulting in leasing incentives becoming more common. Mortgage delinquencies and defaults have also began to trend upward, with many industry analysts predicting significant credit defaults, foreclosures and principal losses, in particular for below investment grade securitized debt instruments.
From a financing perspective, the severe dislocations and liquidity disruptions in the credit markets have impacted both the cost and availability of commercial real estate debt. The CMBS market, formerly a significant source of debt capital, has become inactive
and has left a void in the market for long-term, fixed-rate debt, which is only partially filled by existing portfolio lenders such as insurance companies. These remaining lenders have generally increased credit spreads, lowered the amount of available proceeds, and otherwise tightened underwriting standards considerably, while simultaneously generally limiting lending to existing relationships with borrowers that invest in high quality assets in top tier markets.
Additionally, overall transaction volume for real property acquisitions has declined dramatically across the industry. Lack of available credit and poor investor confidence have translated into generally declining real estate values and a corresponding rise in expected investment yields and capitalization rates. Although many owners of real estate prefer not to be sellers in a declining market, the tight credit conditions and increased refinancing risk have begun to force an increasing number of real property owners into distressed sales, or to otherwise consider liquidating their holdings in an effort to enhance liquidity on their own balance sheet. Following a prolonged period of inactivity, however, transaction volumes are slowly beginning to increase.
8
This aforementioned economic turmoil has had, and will likely continue to have, a material impact on our investment portfolio and has also created additional risks to our future operating performance. In the section titled “Management’s Discussion and Analysis,” we analyze in more detail the impact that the current economic environment has had on our existing portfolio, specifically the markedly reduced valuations and increased other-than-temporary impairment charges that have been taken to the preferred equity and debt securities portions of our portfolio.
Current Investment Focus and Opportunities
Despite the challenging economic conditions described above, we believe that significant opportunities will exist to deploy equity capital to acquire high quality, real properties leased to credit worthy tenants in premier locations throughout the U.S., with the intention of owning and operating these properties over the long term. Many of these opportunities are expected to become available as a result of debt refinancings coming due or other liquidity concerns for many industry participants, and the current market environment favors real estate investors with significant amounts of available cash who can provide no financing contingencies and more certainty of closing. Furthermore, the current credit market conditions may also create an opportunity to make debt related investments by lending money to experienced real estate owners at attractive rates and terms secured by high quality collateral.
Tenant Concentration
As of December 31, 2008, Stop & Shop Supermarket Company (“Stop & Shop”), which represents 13.1% of our annualized rental revenue, was our only tenant whose annualized rental revenue exceeded 10.0% of our total annualized rental revenue. Stop & Shop occupies 14 of our retail properties and each location is leased under separate leasing agreements. Stop & Shop operates over 375 grocery stores throughout seven states primarily located in the Northeast region of the United States. Stop & Shop is a consolidated subsidiary of Koninklijke Ahold N.V. (“Ahold”). Ahold is one of the largest food retailers in the world, based in Amsterdam, the Netherlands.
Competition
We believe that the current market for investing in real property, real estate securities and debt related investments is extremely competitive. We compete with many different types of companies engaged in real estate investment activities, including other REITs, pension funds and their advisors, bank and insurance company investment accounts, real estate limited partnerships, various forms of banks and specialty finance companies, mutual funds, private equity funds, hedge funds, individuals and other entities. Some of these competitors, including larger REITs, have substantially greater financial and other resources than we do and generally may be able to accept more risk and leverage. They may also possess significant competitive advantages that result from, among other things, a lower cost of capital and enhanced operating efficiencies. As a result, we may have to provide free rent, incur charges for tenant improvements or offer other inducements in order to compete, all of which may have an adverse impact on our results of operations.
Conflicts of Interest
We are subject to various conflicts of interest arising out of our relationship with the Advisor and other affiliates, including: (i) conflicts related to the compensation arrangements between the Advisor, certain affiliates and us, (ii) conflicts with respect to the allocation of the time of the Advisor and its key personnel and (iii) conflicts with respect to the allocation of investment opportunities. The independent directors have an obligation to function on our behalf in all situations in which a conflict of interest may arise and will have a fiduciary obligation to act on behalf of our stockholders. See “Item 13. Certain Relationships and Related Transactions, and Director Independence” for a description of the conflicts of interest that arise as a result of our relationships with the Advisor and its affiliates.
Compliance with Federal, State and Local Environmental Laws
Properties that we may acquire, and the properties underlying our investments, are subject to various federal, state and local environmental laws, ordinances and regulations. Under these laws, ordinances and regulations, a current or previous owner of real estate (including, in certain circumstances, a secured lender that succeeds to ownership or control of a property) may become liable for the costs of removal or remediation of certain hazardous or toxic substances or petroleum product releases at, on, under or in its property. These laws typically impose cleanup responsibility and liability without regard to whether the owner or control party knew of or was responsible for the release or presence of the hazardous or toxic substances. The costs of investigation, remediation or removal of these substances may be substantial and could exceed the value of the property. An owner or control party of a site may be subject to common law claims by third parties based on damages and costs resulting from environmental contamination emanating from a site. Certain environmental laws also impose liability in connection with the handling of or exposure to materials containing asbestos. These laws allow third parties to seek recovery from owners of real properties for personal injuries associated with materials containing asbestos. Our operating costs and the values of these assets may be adversely affected by the obligation to pay for the cost of complying with existing environmental laws, ordinances and regulations, as well as the cost of complying with future legislation, and our income and ability to make distributions to our stockholders could be affected adversely by the existence of an environmental liability with respect to our properties. We will endeavor to ensure our properties are in compliance in all material respects with all federal, state and local laws, ordinances and regulations regarding hazardous or toxic substances or petroleum products.
9
Employees
The Advisory Agreement provides that our Advisor will assume principal responsibility for managing our affairs. Therefore, our executive officers, in their capacities as such, do not receive compensation directly from us, and as a result we have no employees. See “Item 10. Directors, Executive Officers and Corporate Governance” for additional discussion regarding our directors and executive officers.
Available Information
This Annual Report on Form 10-K, our Quarterly Reports on Form 10-Q, our Current Reports on Form 8-K, as well as any amendments to those reports, and our prospectus and amendments to such prospectus that we file with the Securities and Exchange Commission (the “Commission”) are available free of charge as soon as reasonably practicable through our website at http://www.dividendcapital.com. The information contained on our website is not incorporated into this Annual Report on Form 10-K.
RISKS RELATED TO ADVERSE CHANGES IN GENERAL ECONOMIC CONDITIONS
Recent adverse and severe changes in global economic and capital market conditions, exacerbated by generally deteriorating real estate industry fundamentals, may significantly affect our results of operations and returns to our stockholders.
We are subject to risks generally incident to the ownership of real estate related assets, including changes in global, national, regional or local economic, demographic and real estate market conditions, as well as other factors particular to the locations of the respective real property investments. A prolonged recession could negatively impact our real property investments as a result of, among other items, increased tenant defaults under our leases, generally lower demand for rentable space, as well as potential oversupply of rentable space which could lead to increased concessions, tenant improvement expenditures or reduced rental rates to maintain occupancies. These conditions could also negatively impact the financial condition of the tenants that occupy our real properties and, as a result, their ability to pay us rents.
In addition, we believe the risks associated with our business are more severe during periods of economic slowdown or recession if these periods are accompanied by deteriorating fundamentals and declining values in the real estate industry. Because many of our real estate securities and debt related investments consist of mortgages or pooled mortgages secured by real property, these same impacts could also negatively affect the underlying borrowers and collateral of assets that we own. Declining values and deteriorating real estate fundamentals would also likely reduce the level of new mortgage loan originations, since borrowers often use increases in the value of their existing properties to support the purchase of or investment in additional properties. As a result of these conditions and if the economy continues to weaken, borrowers may not be able to pay principal and interest on our loans. Further, declining real estate values significantly increases the likelihood that we will incur losses on our debt investments in the event of a default because the value of our collateral may be insufficient to cover our basis in the investment.
To date, our results from operations have been negatively impacted primarily through lower fair values and other-than-temporary impairment charges related to our real estate securities holdings, costs incurred as a result of cash settling certain financial hedging instruments obtained to manage interest rate volatility, as well as the dilutive impact of carrying a large cash balance for an extended period of time. To the extent that a general economic downturn resulting from the current credit crisis is further prolonged or becomes even more severe, it would likely have a significant and adverse impact on our revenues, results from operations, financial condition, liquidity, overall business prospects and ultimately our ability to make distributions to our stockholders.
10
Recent market conditions and the risk of continued market deterioration have caused and may continue to cause the value of our CMBS and CRE-CDO investments to be reduced.
It has been well publicized that the U.S. and global credit markets and the sub-prime residential mortgage market have experienced severe dislocations and liquidity disruptions. Sub-prime mortgage loans have experienced increased rates of delinquency, foreclosure and loss. These and other related events have had a significant impact on the capital markets associated not only with residential sub-prime mortgage-backed securities (“MBS”) and asset-backed securities (“ABS”) and CRE-CDOs, but also with U.S. and global credit and financial markets as a whole.
We have not invested in any CMBS or CRE-CDOs that contain assets that could be classified as sub-prime residential. However, the values of many of the securities that we hold are sensitive to the volatility of the credit markets, and many of our securities have been adversely affected and may continue to be adversely affected by future developments. Although we currently have the intention to hold our CMBS and CRE-CDO investments to maturity, if we were forced to liquidate this portfolio into the current market, we would realize significant losses on these investments. In addition to the fair value of these securities being adversely impacted, the interest payments that we receive are also subject to adverse changes, either in timing or amounts, as a result of the economic environment. Some of the securities that we hold have certain collateral requirements and if the fair value of the underlying collateral decreases substantially, then our interest payments may be suspended and used to payoff more senior positions until the collateral requirements are met.
In addition, the general inactivity, illiquidity and volatility of the credit markets have made the process of estimating the fair value of our CMBS and CRE-CDO investments significantly more difficult and subjective. Prior to the current credit crisis, active trading of these types of securities provided visibility and an objective means of determining fair value. In today’s environment, which is substantially limited in any new issuances or significant active trading within the secondary market, management’s estimate of the fair value must consider alternative sources of market information and utilize a combination of independent pricing agency valuations and other observable and unobservable market inputs. Our current valuation methodology utilizes a variety of estimates and assumptions specific to the particular securities that require significant judgment and therefore, the actual amount that could be realized upon a sale of such securities may be materially different from management’s estimate.
As of December 31, 2008, in aggregate, we had made investments, net of principal repayments, totaling approximately $143.8 million in CMBS and CRE-CDO securities and as of that date these securities were estimated to have a fair value of approximately $20.8 million. Many of our CMBS and CRE-CDO investments are subject to rapid changes in value caused by sudden developments which affect the observable and unobservable market inputs that provide key assumptions used by both management and independent valuation sources.
For the year ended December 31, 2008, we recorded an other-than-temporary impairment charge totaling approximately $123.0 million related to our CMBS and CRE-CDO investments, which is reflected in our consolidated statements of operations in Item 8. The other-than-temporary impairment charge related to our CMBS and CRE-CDO investments considered management’s judgment as to the extent by which either the timing or amounts of the underlying cash flows for these investments had been adversely affected. As of December 31, 2008, we had an unrealized loss of approximately $1.3 million reported in accumulated other comprehensive income (loss) related to our CMBS and CRE-CDO investments.
We cannot assure our stockholders that we will not have to realize or record additional impairment charges, or experience disruptions in cash flows and/or permanent losses related to our CMBS and CRE-CDO investments in future periods. In addition, to the extent that the current volatile market conditions persist and/or deteriorate further, it would continue to negatively impact our ability to potentially sell these securities holdings at a price and with terms acceptable to us or at all.
Our investments in real estate preferred equity securities have been significantly impacted by recent adverse economic and real estate industry conditions and generally involve a greater risk of loss than traditional debt financing of the issuer.
We have invested in real estate preferred equity securities of various publicly-traded real estate investment trusts, which involve a higher degree of risk than traditional debt financing of the issuer due to a variety of factors, including that such investments are subordinate to traditional loans and are not secured by property underlying the investment. Additionally, unlike traditional debt financings, issuers of preferred equity securities generally are not obligated to redeem the principal investment at any time and may indefinitely suspend the payment of preferred dividends without causing an event of default.
As of December 31, 2008, in aggregate, we had made investments in preferred equity securities totaling $102.7 million and as of that date these securities had a fair value of approximately $31.6 million. Many of our preferred equity securities investments are subject to rapid changes in fair value caused by sudden developments in market conditions that may affect the liquidity, business and credit conditions of the underlying issuer.
11
For the year ended December 31, 2008, we recorded an other-than-temporary impairment charge of approximately $69.7 million related to our preferred equity securities. The other-than-temporary impairment charged to our preferred equity securities was determined primarily based upon the credit condition of the issuer, together with consideration of the length of time over which these securities had experienced a decline in market value, as well as the severity of such decline. As of December 31, 2008, we had an unrealized loss of approximately $1.4 million reported in accumulated other comprehensive income (loss) related to our preferred equity securities investments. We cannot assure our stockholders that we will not have to realize or record additional impairment charges, or experience disruptions in cash flow and/or permanent losses related to our preferred equity securities investments in future periods.
In addition, as of the date of this Report on Form 10-K, the issuers of three of our preferred securities holdings have indefinitely suspended their preferred dividend payments to us. Even though these dividend payments are cumulative and perpetual in nature, and we may eventually recover the dividend payments either in their entirety or in part, there is no guarantee that we will be able to do so and any such lost income could permanently reduce both the value of these investments and distributions available to our stockholders.
Continued uncertainty and volatility in the credit markets could affect our ability to obtain debt financing on reasonable terms, which could reduce the number of properties we may be able to acquire and the amount of cash distributions we can make to our stockholders.
The U.S. and global credit markets have recently experienced severe dislocations and liquidity disruptions which have caused the credit spreads on prospective debt financings to widen considerably. The uncertainty in the credit markets may negatively impact our ability to access additional debt financing at reasonable terms, which may negatively affect investment returns on future acquisitions or our ability to make acquisitions.
If mortgage debt is unavailable on reasonable terms as a result of increased interest rates, increased credit spreads, decreased liquidity or other factors, we may not be able to finance the initial purchase of properties. In addition, when we incur mortgage debt on properties, we run the risk of being unable to refinance such debt upon maturity, or of being unable to refinance on favorable terms. As of December 31, 2008, we had approximately $719.0 million in aggregate outstanding mortgage notes, which had maturity dates ranging from June 2009 through September 2036. In 2009 and 2010, mortgage notes in the amount of approximately $41.8 million and $19.7 million, respectively, will mature unless we qualify and elect to exercise certain extension options.
If interest rates are higher or other financing terms, such as principal amortization, corporate guaranty, or other terms are not as favorable when we refinance debt or issue new debt, our income could be reduced. To the extent we are unable to refinance debt on reasonable terms, or at appropriate times or at all, we may be required to sell properties on terms that are not advantageous to us, or could result in the foreclosure of such properties. If any of these events occur, our cash flow would be reduced. This, in turn, would reduce cash available for distribution to our stockholders and may hinder our ability to raise more capital by issuing securities or by borrowing more money.
In addition, due to the recent market disruptions, many of our securities investments which we may use in the future as collateral for prospective borrowings have experienced significant losses and are subject to rapid changes in value caused by sudden developments, which could further lower their fair values. This reduction in value could subsequently result in the potential reduced ability or the inability to leverage these assets, as well as potential margin calls on facilities that utilize affected assets as collateral.
12
The failure of any banking institution in which we deposit our funds could have a material adverse effect on our results of operations, financial condition and ability to pay distributions to our stockholders.
Currently, the Federal Deposit Insurance Corporation, or FDIC, generally, only insures amounts up to $250,000 per depositor per insured bank, which amount is scheduled to be reduced to $100,000 after December 31, 2009. Through its Transaction Account Guarantee Program, or TAGP, the FDIC also provides full deposit insurance coverage for non-interest bearing transaction accounts with participating institutions, regardless of dollar amount, through December 31, 2009.
A small portion of our cash and cash equivalents, primarily those used to fund property-level working capital needs, is currently held in a combination of FDIC-insured and TAGP-insured bank accounts. The significant majority of our cash on hand is currently invested in a combination of AAA-rated money market mutual funds, which in turn are primarily invested in short-term, high credit quality commercial paper, U.S. government funds and Treasury funds. If any of the financial institutions in which we have deposited funds ultimately fails, we would lose the amount of our deposits over the then current FDIC and TAGP insurance limits. The loss of our deposits could substantially reduce the amount of cash we have available to distribute or invest and would likely result in a decline in the value of our stockholders’ investment.
ADDITIONAL RISKS RELATED TO INVESTMENTS IN REAL PROPERTY
Real properties are illiquid investments, and we may be unable to adjust our portfolio in response to changes in economic or other conditions or sell a property if or when we decide to do so.
Real properties are illiquid investments and we may be unable to adjust our portfolio in response to changes in economic or other conditions. In addition, the real estate market is affected by many factors, such as general economic conditions, availability of financing, interest rates and other factors, including supply and demand, that are beyond our control. We cannot predict whether we will be able to sell any real property for the price or on the terms set by us, or whether any price or other terms offered by a prospective purchaser would be acceptable to us. We cannot predict the length of time needed to find a willing purchaser and to close the sale of a real property. In addition, we may acquire real properties that are subject to contractual “lock-out” provisions that could restrict our ability to dispose of the real property for a period of time.
We may also be required to expend funds to correct defects or to make improvements before a property can be sold. We cannot assure our stockholders that we will have funds available to correct such defects or to make such improvements.
In acquiring a real property, we may agree to restrictions that prohibit the sale of that real property for a period of time or impose other restrictions, such as a limitation on the amount of debt that can be placed or repaid on that real property. Our real properties may also be subject to resale restrictions. All of these provisions would restrict our ability to sell a property.
We are dependent on tenants for revenue, and our inability to lease our real properties or to collect rent from our tenants may adversely affect our results of operations and returns to our stockholders.
Our revenues from our real property investments are dependent on the creditworthiness of our tenants and would be adversely affected by the loss of or default by significant lessees. As of December 31, 2008, 33 of our 73 operating real properties, or approximately 39.6% of our total gross investment amount in real properties, were occupied by single tenants. In addition, as of December 31, 2008, Stop & Shop Supermarket Company (“Stop & Shop”) represented 13.1% of our annualized rental revenue. Stop & Shop was our only tenant whose annualized rental revenue exceeded 10.0% of our total annualized rental revenue as of December 31, 2008, occupying 14 of our retail properties, each location under separate leasing agreements. The success of those real properties depends on the financial stability of that tenant. Lease payment defaults by tenants could cause us to reduce the amount of distributions to our stockholders and could force us to find an alternative source of revenue to pay any mortgage loan on the real property. In the event of a tenant default, we may also experience delays in enforcing our rights as landlord and may incur substantial costs in protecting our investment and re-leasing our real property. If a lease is terminated, we may be unable to lease the real property for the rent previously received or sell the real property without incurring a loss.
13
Delays in the acquisition, development and construction of real properties may have adverse effects on portfolio diversification, results of operations and returns to our stockholders.
Delays we encounter in the selection, acquisition and development of real properties could adversely affect our stockholders returns. In particular, the current state of the credit markets has resulted in generally lower transaction volume in the broader real estate market and for us, in part due to pricing and valuation uncertainties. To the extent that such disruptions and uncertainties continue, we may be delayed in our ability to invest our capital in real property investments that meet our acquisition criteria. Such delays have resulted in our maintaining a relatively higher cash balance than expected, which has had and may continue to have a negative effect on our stockholders returns until the capital is invested. Moreover, delays in acquiring properties may also hinder our ability to reach our portfolio diversification objectives.
In addition, where properties are acquired prior to the start of construction or during the early stages of construction, it will typically take several months to complete construction and rent available space. Therefore, we may not receive any income from these properties and distributions to our stockholders could suffer. Delays in the completion of construction could give tenants the right to terminate preconstruction leases for space at a newly developed project. We may incur additional risks when we make periodic progress payments or other advances to builders prior to completion of construction. Each of those factors could result in increased costs of a project or loss of our investment. In addition, we will be subject to normal lease-up risks relating to newly constructed projects. Furthermore, the price we agree to for a real property will be based on our projections of rental income and expenses and estimates of the fair market value of the real property upon completion of construction. If our projections are inaccurate, we may pay too much for a property.
A real property that incurs a vacancy could be difficult to sell or re-lease.
A real property may incur a vacancy either by the continued default of a tenant under its lease or the expiration of one of our leases. In addition, certain of the real properties we acquire may have some level of vacancy at the time of closing. Certain other real properties may be specifically suited to the particular needs of a tenant and our real property may become vacant. Therefore, we may have difficulty obtaining a new tenant for any vacant space we have in our real properties. If the vacancy continues for a long period of time, we would suffer reduced revenues resulting in lower cash distributions to our stockholders. In addition, the resale value of the real property could be diminished because the market value may depend principally upon the value of the leases of such real property.
General economic conditions and other events or occurrences that affect areas in which our properties are geographically concentrated in may have a significant adverse impact on our financial results.
The economy of any state or region in which our properties are located may be adversely affected to a greater degree than that of other areas of the country as a result of negative developments affecting industries concentrated in such state or region. For example, our properties in Massachusetts, California and Texas accounted for approximately 26%, 12% and 10%, respectively, of our total gross investments of our real property portfolio as of December 31, 2008. A deterioration of general economic or other relevant conditions in any of those regions could result in the loss of a tenant, a decrease in the demand for our properties and a decrease in our revenues from those markets, which in turn may have a disproportionate and material adverse effect on our results of operations and financial condition.
Changes in supply of or demand for similar real properties in a particular area may increase the price of real property assets we seek to purchase.
The real estate industry is subject to market forces and we are unable to predict certain market changes including changes in supply of or demand for similar real properties in a particular area. For example, if demand for the types of real property assets in which we seek to invest were to sharply increase or supply of those assets were to sharply decrease, the prices of those assets could rise or fall significantly. Any potential purchase of an overpriced asset could decrease our rate of return on these investments and result in lower operating results and overall returns to our stockholders.
Actions of our joint venture partners could negatively impact our performance.
We have entered into and may continue to enter into joint ventures with third parties, including entities that are affiliated with the Advisor. We have purchased and developed and may also continue to purchase and develop properties in joint ventures or in partnerships, co-tenancies or other co-ownership arrangements with the sellers of the properties, affiliates of the sellers, developers or other persons. Such investments may involve risks not otherwise present with a direct investment in real estate, including, for example:
| | • | | The possibility that our venture partner, co-tenant or partner in an investment might become bankrupt; |
| | • | | That such venture partner, co-tenant or partner may at any time have economic or business interests or goals which are or which become inconsistent with our business interests or goals; or |
| | • | | That such venture partner, co-tenant or partner may be in a position to take action contrary to our instructions or requests or contrary to our policies or objectives. |
Actions by such a joint venture partner or co-tenant might have the result of subjecting the property to liabilities in excess of those contemplated and may have the effect of reducing our stockholders’ returns.
Under certain joint venture arrangements, neither venture partner may have the power to control the venture, and an impasse could be reached, which might have a negative influence on the joint venture and decrease potential returns to our stockholders. In the event that a venture partner has a right of first refusal to buy out the other partner, it may be unable to finance such a buy-out at that time. It may also be difficult for us to sell our interest in any such joint venture or partnership or as a co-tenant in a particular property. In addition, to the extent that our venture partner or co-tenant is an affiliate of the Advisor, certain conflicts of interest will exist. See “Item 13. Certain Relationships and Related Transactions, and Director Independence” in this Annual Report on Form 10-K.
Our operating expenses may increase in the future and to the extent such increases cannot be passed on to our tenants, our cash flow and our operating results would decrease.
Operating expenses, such as expenses for fuel, utilities, labor, building materials and insurance are not fixed and may increase in the future. There is no guarantee that we will be able to pass such increases on to our tenants. To the extent such increases cannot be passed on to our tenants, any such increases would cause our cash flow and our operating results to decrease.
14
We compete with numerous other parties or entities for real property investments and tenants, and we may not compete successfully.
We compete with numerous other persons or entities seeking to buy real property assets or to attract tenants to real properties we already own. These persons or entities may have greater experience and financial strength. There is no assurance that we will be able to acquire real property assets or attract tenants on favorable terms, if at all. For example, our competitors may be willing to offer space at rental rates below our rates, causing us to lose existing or potential tenants and pressuring us to reduce our rental rates to retain existing tenants or convince new tenants to lease space at our properties. Each of these factors could adversely affect our results of operations, financial condition, value of our investments and ability to pay distributions to our stockholders.
Our real properties are subject to property taxes that may increase in the future, which could adversely affect our cash flow.
Our real properties are subject to real and personal property taxes that may increase as tax rates change and as the real properties are assessed or reassessed by taxing authorities. Certain of our leases provide that the property taxes, or increases therein, are charged to the lessees as an expense related to the real properties that they occupy while other leases will generally provide that we are responsible for such taxes. In any case, as the owner of the properties, we are ultimately responsible for payment of the taxes to the applicable governmental authorities. If real property taxes increase, our tenants may be unable to make the required tax payments, ultimately requiring us to pay the taxes even if otherwise stated under the terms of the lease. If we fail to pay any such taxes, the applicable taxing authorities may place a lien on the real property and the real property may be subject to a tax sale. In addition, we will generally be responsible for real property taxes related to any vacant space.
Uninsured losses or premiums for insurance coverage relating to real property may adversely affect our returns.
We attempt to adequately insure all of our real properties against casualty losses. There are types of losses, generally catastrophic in nature, such as losses due to wars, acts of terrorism, earthquakes, floods, hurricanes, pollution or environmental matters that are uninsurable or not economically insurable, or may be insured subject to limitations, such as large deductibles or co-payments. Risks associated with potential terrorism acts could sharply increase the premiums we pay for coverage against property and casualty claims. Additionally, mortgage lenders sometimes require commercial property owners to purchase specific coverage against terrorism as a condition for providing mortgage loans. These policies may not be available at a reasonable cost, if at all, which could inhibit our ability to finance or refinance our real properties. In such instances, we may be required to provide other financial support, either through financial assurances or self-insurance, to cover potential losses. Changes in the cost or availability of insurance could expose us to uninsured casualty losses. In the event that any of our real properties incurs a casualty loss which is not fully covered by insurance, the value of our assets will be reduced by any such uninsured loss. In addition, we cannot assure our stockholders that funding will be available to us for repair or reconstruction of damaged real property in the future.
Costs of complying with governmental laws and regulations related to environmental protection and human health and safety may be high.
All real property investments and the operations conducted in connection with such investments are subject to federal, state and local laws and regulations relating to environmental protection and human health and safety. Some of these laws and regulations may impose joint and several liability on customers, owners or operators for the costs to investigate or remediate contaminated properties, regardless of fault or whether the acts causing the contamination were legal.
Under various federal, state and local environmental laws, a current or previous owner or operator of real property may be liable for the cost of removing or remediating hazardous or toxic substances on such real property. Such laws often impose liability whether or not the owner or operator knew of, or was responsible for, the presence of such hazardous or toxic substances. In addition, the presence of hazardous substances, or the failure to properly remediate these substances, may adversely affect our ability to sell, rent or pledge such real property as collateral for future borrowings. Environmental laws also may impose restrictions on the manner in which real property may be used or businesses may be operated. Some of these laws and regulations have been amended so as to require compliance with new or more stringent standards as of future dates. Compliance with new or more stringent laws or regulations or stricter interpretation of existing laws may require us to incur material expenditures. Future laws, ordinances or regulations may impose material environmental liability. Additionally, our tenants’ operations, the existing condition of land when we buy it, operations in the vicinity of our real properties, such as the presence of underground storage tanks, or activities of unrelated third parties may affect our real properties. In addition, there are various local, state and federal fire, health, life-safety and similar regulations with which we may be required to comply, and which may subject us to liability in the form of fines or damages for noncompliance. In connection with the acquisition and ownership of our real properties, we may be exposed to such costs in connection with such regulations. The cost of defending against environmental claims, of any damages or fines we must pay, of
15
compliance with environmental regulatory requirements or of remediating any contaminated real property could materially and adversely affect our business, lower the value of our assets or results of operations and, consequently, lower the amounts available for distribution to our stockholders.
The costs associated with complying with the Americans with Disabilities Act may reduce the amount of cash available for distribution to our stockholders.
Investment in real properties may also be subject to the Americans with Disabilities Act of 1990, as amended. Under this act, all places of public accommodation are required to comply with federal requirements related to access and use by disabled persons. The act has separate compliance requirements for “public accommodations” and “commercial facilities” that generally require that buildings and services be made accessible and available to people with disabilities. The act’s requirements could require us to remove access barriers and could result in the imposition of injunctive relief, monetary penalties or, in some cases, an award of damages. We will attempt to acquire properties that comply with the act or place the burden on the seller or other third party, such as a tenant, to ensure compliance with the act. We cannot assure our stockholders that we will be able to acquire properties or allocate responsibilities in this manner. Any monies we use to comply with the act will reduce the amount of cash available for distribution to our stockholders.
We may not have funding for future tenant improvements which may adversely affect the value of our assets, our results of operations and returns to our stockholders.
When a tenant at one of our real properties does not renew its lease or otherwise vacates its space in one of our buildings, it is likely that, in order to attract one or more new tenants, we will be required to expend substantial funds to construct new tenant improvements in the vacated space. Substantially all of the net proceeds from our initial public offerings have been and will continue to be invested in real properties, real estate securities and debt related investments, and we do not anticipate that we will maintain permanent working capital reserves. We do not currently have an identified funding source to provide funds which may be required in the future for tenant improvements and tenant refurbishments in order to attract new tenants. If we do not establish sufficient reserves for working capital or obtain adequate secured financing to supply necessary funds for capital improvements or similar expenses, we may be required to defer necessary or desirable improvements to our real properties. If we defer such improvements, the applicable real properties may decline in value, and it may be more difficult for us to attract or retain tenants to such real properties or the amount of rent we can charge at such real properties may decrease. We cannot assure our stockholders that we will have any sources of funding available to us for repair or reconstruction of damaged real property in the future.
Real property investments made outside of the United States will be subject to currency rate exposure and risks associated with the uncertainty of foreign laws and markets.
We may invest in Canada and Mexico, and potentially elsewhere on a limited basis, to the extent that opportunities exist that may help us meet our investment objectives. To the extent that we invest in real property located outside of the United States, in addition to risks inherent in the investment in real estate generally discussed in this Annual Report on Form 10-K, we will also be subject to fluctuations in foreign currency exchange rates and the uncertainty of foreign laws and markets including, but not limited to, unexpected changes in regulatory requirements, political and economic instability in certain geographic locations, difficulties in managing international operations, currency exchange controls, potentially adverse tax consequences, additional accounting and control expenses and the administrative burden associated with complying with a wide variety of foreign laws. Changes in foreign currency exchange rates may adversely impact the fair values and earnings streams of our international holdings and therefore the returns on our non-dollar denominated investments. To the extent that we make real property investments outside of the United States, our principal currency exposures are expected to be the Canadian Dollar and the Mexican Peso, although to the extent that we make investments in other foreign countries we would be subject to additional currency exposure. Although we may hedge our foreign currency risk subject to the REIT income qualification tests, we may not be able to do so successfully and may incur losses on these investments as a result of exchange rate fluctuations.
ADDITIONAL RISKS RELATED TO INVESTMENTS IN REAL ESTATE SECURITIES AND DEBT RELATED INVESTMENTS
The CMBS and CRE-CDOs in which we invest are subject to several types of general risks.
CMBS are bonds which evidence interests in, or are secured by, a single commercial mortgage loan or a pool of commercial mortgage loans. CRE-CDOs are a type of collateralized debt obligation that is backed by commercial real estate assets, such as CMBS, commercial mortgage loans, B-notes, or mezzanine loans. Accordingly, the mortgage backed securities we invest in are subject to all of the risks of the underlying mortgage loans.
16
In a rising interest rate environment, the value of CMBS and CRE-CDOs may be adversely affected when payments on underlying mortgages do not occur as anticipated, resulting in the extension of the security’s effective maturity and the related increase in interest rate sensitivity of a longer-term instrument. In a falling interest rate environment, securities whose investment yield is tied to a floating rate index, such as LIBOR, will distribute less dividend income than when originally purchased. The value of CMBS and CRE-CDOs may also change due to shifts in the market’s perception of issuers and regulatory or tax changes adversely affecting the mortgage securities markets as a whole. In addition, CMBS and CRE-CDOs are subject to the credit risk associated with the performance of the underlying mortgage properties. In certain instances, third party guarantees or other forms of credit support can reduce the credit risk.
CMBS and CRE-CDOs are also subject to several risks created through the securitization process. Subordinate CMBS and CRE-CDOs are paid interest only to the extent that there are funds available to make payments. To the extent the collateral pool includes a large percentage of delinquent loans, there is a risk that interest payments on subordinate CMBS and CRE-CDOs will not be fully paid. Subordinate securities of CMBS and CRE-CDOs are also subject to greater credit risk than those CMBS and CRE-CDOs that are more highly rated.
Interest rate and related risks may cause the value of our real estate securities investments to be reduced.
Interest rate risk is the risk that fixed income securities such as preferred and debt securities, and to a lesser extent dividend paying common stocks, will decline in value because of changes in market interest rates. Generally, when market interest rates rise, the market value of such securities will decline, and vice versa. Our investment in such securities means that the net asset value and market price of the common shares may tend to decline if market interest rates rise.
During periods of rising interest rates, the average life of certain types of securities may be extended because of slower than expected principal payments. This may lock in a below-market interest rate, increase the security’s duration and reduce the value of the security. This is known as extension risk. During periods of declining interest rates, an issuer may be able to exercise an option to prepay principal earlier than scheduled, which is generally known as call or prepayment risk. If this occurs, we may be forced to reinvest in lower yielding securities. This is known as reinvestment risk. Preferred and debt securities frequently have call features that allow the issuer to repurchase the security prior to its stated maturity. An issuer may redeem an obligation if the issuer can refinance the debt at a lower cost due to declining interest rates or an improvement in the credit standing of the issuer. These risks may reduce the value of our real estate securities investments.
The mortgage loans in which we invest and the mortgage loans underlying the mortgage backed securities in which we invest will be subject to delinquency, foreclosure and loss, which could result in losses to us.
Commercial mortgage loans are secured by multifamily or other types of commercial property and are subject to risks of delinquency and foreclosure and risks of loss. The ability of a borrower to repay a loan secured by a property typically is dependent primarily upon the successful operation of such property rather than upon the existence of independent income or assets of the borrower. If the net operating income of the property is reduced, the borrower’s ability to repay the loan may be impaired. Net operating income of an income producing property can be affected by, among other things: tenant mix, success of tenant businesses, property management decisions, property location and condition, competition from comparable types of properties, changes in laws that increase operating expense or limit rents that may be charged, any need to address environmental contamination at the property, the occurrence of any uninsured casualty at the property, changes in national, regional or local economic conditions and/or specific industry segments, current and potential future capital markets uncertainty, declines in regional or local real estate values, declines in regional or local rental or occupancy rates, increases in interest rates, real estate tax rates and other operating expenses, changes in governmental rules, regulations and fiscal policies, including environmental legislation, acts of God, terrorism, social unrest and civil disturbances.
In the event of any default under a mortgage loan held directly by us, we will bear a risk of loss of principal to the extent of any deficiency between the value of the collateral and the principal and accrued interest of the mortgage loan, which could have a material adverse effect on our cash flow from operations and limit amounts available for distribution to our stockholders. In the event of the bankruptcy of a mortgage loan borrower, the mortgage loan to such borrower will be deemed to be secured only to the extent of the value of the underlying collateral at the time of bankruptcy (as determined by the bankruptcy court), and the lien securing the mortgage loan will be subject to the avoidance powers of the bankruptcy trustee or debtor-in-possession to the extent the lien is unenforceable under state law. Foreclosure of a mortgage loan can be an expensive and lengthy process which could have a substantial negative effect on our anticipated return on the foreclosed mortgage loan.
17
The mezzanine loans and B-notes in which we invest involve greater risks of loss than senior loans secured by income-producing real properties.
We invest in mezzanine loans and B-notes that substantially take the form of subordinated loans secured by second mortgages on the underlying real property or loans secured by a pledge of the ownership interests of either the entity owning the real property or the entity that owns the interest in the entity owning the real property. These types of investments involve a higher degree of risk than long-term senior mortgage lending secured by income producing real property because the investment may become unsecured as a result of foreclosure by the senior lender. In the event of a bankruptcy of the entity providing the pledge of its ownership interests as security, we may not have full recourse to the assets of such entity, or the assets of the entity may not be sufficient to satisfy our mezzanine loan. If a borrower defaults on our mezzanine loan or debt senior to our loan, or in the event of a borrower bankruptcy, our mezzanine loan will be satisfied only after the senior debt. As a result, we may not recover some or all of our investment. In addition, mezzanine loans may have higher loan-to-value ratios than conventional mortgage loans, resulting in less equity in the real property and increasing the risk of loss of principal.
A portion of our real estate securities and debt related investments may be considered illiquid, and we may not be able to adjust our portfolio in response to changes in economic and other conditions.
Certain of the real estate securities and debt related investments that we have purchased or may purchase in the future in connection with privately negotiated transactions are not or may not be registered under the relevant securities laws, resulting in a prohibition against their transfer, sale, pledge or other disposition except in a transaction that is exempt from the registration requirements of, or is otherwise effected in accordance with, those laws. As a result, our ability to vary our portfolio in response to changes in economic and other conditions may be relatively limited. The mezzanine, B-note and bridge loans that we have purchased or may purchase in the future are or will be particularly illiquid investments due to their short life, their unsuitability for securitization and the greater difficulty of recoupment in the event of a borrower’s default. In addition, due to current credit market conditions, certain of our registered securities may not be as liquid as when originally purchased.
Our investments in real estate common equity securities will be subject to specific risks relating to the particular issuer of the securities and may be subject to the general risks of investing in subordinated real estate securities.
We may invest in real estate common equity securities of both publicly traded and private real estate companies. Investments in real estate related common equity securities will involve special risks relating to the particular issuer of the equity securities, including the financial condition and business outlook of the issuer. Issuers of real estate related common equity securities generally invest in real estate or real estate related assets and are subject to the inherent risks associated with real estate related investments discussed in this Form 10-K, including risks relating to rising interest rates.
Real estate common equity securities are generally unsecured and may also be subordinated to other obligations of the issuer. As a result, investments in real estate common equity securities are subject to risks of (i) limited liquidity in the secondary trading market, (ii) substantial market price volatility resulting from changes in prevailing interest rates, (iii) subordination to the prior claims of banks and other senior lenders to the issuer, (iv) the operation of mandatory sinking fund or call/redemption provisions during periods of declining interest rates that could cause the issuer to reinvest redemption proceeds in lower yielding assets, (v) the possibility that earnings of the issuer may be insufficient to meet its debt service and distribution obligations and (vi) the declining creditworthiness and potential for insolvency of the issuer during periods of rising interest rates and economic downturn. These risks may adversely affect the value of outstanding real estate common equity securities and the ability of the issuers thereof to repay principal and interest or make distribution payments.
We may make investments in non-U.S. dollar denominated securities, which will be subject to currency rate exposure and risks associated with the uncertainty of foreign laws and markets.
Some of our real estate securities investments may be denominated in foreign currencies and, therefore, we expect to have currency risk exposure to any such foreign currencies. A change in foreign currency exchange rates may have an adverse impact on returns on our non-U.S. dollar denominated investments. Although we may hedge our foreign currency risk subject to the REIT income qualification tests, we may not be able to do so successfully and may incur losses on these investments as a result of exchange rate fluctuations. To the extent that we invest in non-U.S. dollar denominated securities, in addition to risks inherent in the investment in securities generally discussed in this Form 10-K, we will also be subject to risks associated with the uncertainty of foreign laws and markets including, but not limited to, unexpected changes in regulatory requirements, political and economic instability in certain geographic locations, difficulties in managing international operations, currency exchange controls, potentially adverse tax consequences, additional accounting and control expenses and the administrative burden of complying with a wide variety of foreign laws.
18
RISKS ASSOCIATED WITH DEBT FINANCING
We incur mortgage indebtedness and other borrowings, which may increase our business risks, and could hinder our ability to make distributions to our stockholders.
We have financed and may continue to finance a portion of the purchase price of certain of our investments in real properties, real estate securities and debt related investments by borrowing funds. Under our charter, we have a limitation on borrowing which precludes us from borrowing in excess of 300% of the value of our net assets unless approved by a majority of independent directors and disclosed to stockholders in our next quarterly report along with justification for the excess. Net assets for purposes of this calculation are defined to be our total assets (other than intangibles), valued at cost prior to deducting depreciation or other non-cash reserves, less total liabilities. Generally speaking, the preceding calculation is expected to approximate 75% of the sum of (a) the aggregate cost of our real property assets before non-cash reserves and depreciation and (b) the aggregate cost of our securities assets. In addition, we have incurred and may continue to incur mortgage debt and pledged some or all of our real properties as security for that debt to obtain funds to acquire additional real properties or for working capital. We may also borrow funds to satisfy the REIT tax qualification requirement that we distribute at least 90% of our annual REIT taxable income to our stockholders. Furthermore, we may borrow funds if we otherwise deem it necessary or advisable to ensure that we maintain our qualification as a REIT for federal income tax purposes.
High debt levels would cause us to incur higher interest charges, which would result in higher debt service payments and could be accompanied by restrictive covenants. If there is a shortfall between the cash flow from a property and the cash flow needed to service mortgage debt on that property, then the amount available for distributions to our stockholders may be reduced. In addition, incurring mortgage debt increases the risk of loss since defaults on indebtedness secured by a property may result in lenders initiating foreclosure actions. In that case, we could lose the property securing the loan that is in default, thus reducing the value of our investments. For tax purposes, a foreclosure on any of our properties will be treated as a sale of the property for a purchase price equal to the outstanding balance of the debt secured by the mortgage. If the outstanding balance of the debt secured by the mortgage exceeds our tax basis in the property, we will recognize taxable income on foreclosure, but we would not receive any cash proceeds. We have historically given certain full or partial guarantees, and may continue to give full or partial guarantees in the future, to lenders of mortgage debt to the entities that own our properties. When we give a guaranty on behalf of an entity that owns one of our properties, we are responsible to the lender for satisfaction of the debt if it is not paid by such entity. If any mortgage contains cross collateralization or cross default provisions, a default on a single property could affect multiple properties. If any of our properties are foreclosed upon due to a default, our ability to pay cash distributions to our stockholders will be adversely affected.
Increases in interest rates could increase the amount of our debt payments and therefore negatively impact our operating results.
Interest we pay on our debt obligations will reduce cash available for distributions. As of December 31, 2008, we had approximately $58.0 million of variable rate debt outstanding, net of repayments, for which increases in interest rates would increase our interest costs, which would reduce our cash flows and our ability to make distributions to our stockholders. If we need to repay existing debt during periods of rising interest rates, we could be required to liquidate one or more of our investments in properties and/or securities at times which may not permit realization of the maximum return on such investments.
Our derivative instruments that we use to hedge against interest rate fluctuations may not be successful in mitigating our risks associated with interest rates and could reduce the overall returns on our investments.
We have utilized derivative instruments to hedge exposure to changes in interest rates on certain of our loans secured by our real properties, but no hedging strategy can protect us completely. For example, in the third quarter of 2007 we entered into four, LIBOR-based, forward-starting swaps with a notional value of $350 million to hedge our exposure to variability in the cash outflows resulting from prospective interest payments on expected future fixed-rate debt issuances due to fluctuations in the USD-LIBOR swap rate. We have cash settled the first, second and third forward-starting swaps, which had a combined notional value of $300 million, by paying approximately $36.5 million. In addition, our fourth forward-starting swap having a notional amount of $50 million was in a loss position of approximately $13.7 million as of December 31, 2008, and is due to be cash settled no later than August 1, 2009.
We cannot assure our stockholders that our hedging strategy and the derivatives that we use will adequately offset all of our risk related to interest rate volatility or that our hedging of these risks will not result in losses. These derivative instruments may also generate income that may not be treated as qualifying REIT income for purposes of the 75% or 95% REIT income tests.
Lenders may require us to enter into restrictive covenants relating to our operations, which could limit our ability to make distributions to our stockholders.
When providing financing, a lender may impose restrictions on us that affect our distribution and operating policies and our ability to incur additional debt. Loan documents we enter into may contain covenants that limit our ability to further mortgage the property, discontinue insurance coverage, or replace the Advisor as our advisor. In addition, loan documents may limit our ability to replace the property manager or terminate certain operating or lease agreements related to the property. These or other limitations may adversely affect our flexibility and our ability to achieve our investment objectives.
19
When we enter into financing arrangements involving balloon payment obligations, it may adversely affect our ability to refinance or sell properties on favorable terms, and to make distributions to our stockholders.
Most of our current mortgage financing arrangements require us to make a lump-sum or “balloon” payment at maturity. Our ability to make a balloon payment at maturity will be uncertain and may depend upon our ability to obtain additional financing or our ability to sell the particular property. At the time the balloon payment is due, we may or may not be able to refinance the balloon payment on terms as favorable as the original loan or sell the particular property at a price sufficient to make the balloon payment. The effect of a refinancing or sale could affect the rate of return to our stockholders and the projected time of disposition of our assets. In an environment of increasing mortgage rates, if we place mortgage debt on properties, we run the risk of being unable to refinance such debt if mortgage rates are higher at a time a balloon payment is due. In addition, payments of principal and interest made to service our debts, including balloon payments, may leave us with insufficient cash to pay the distributions that we are required to pay to maintain our qualification as a REIT.
RISKS RELATED TO THE ADVISOR AND AFFILIATES
We depend on the Advisor and its key personnel; if any of such key personnel were to cease employment with the Advisor, our business could suffer.
Our ability to make distributions and achieve our investment objectives is dependent upon the performance of the Advisor in the acquisition, disposition and management of real properties, real estate securities and debt related investments, the selection of tenants for our real properties, the determination of any financing arrangements and other factors. In addition, our success depends to a significant degree upon the continued contributions of certain of the Advisor’s key personnel, including Guy M. Arnold, Jonathan S. Asarch, John E. Biallas, Troy J. Bloom, John A. Blumberg, John R. Chambers, Andrea L. Karp, Lainie P. Minnick, Gregory M. Moran, Glenn R. Mueller, Ph.D., James R. Mulvihill, Todd W. Poppert, Gary M. Reiff, M. Kirk Scott, Joshua J. Widoff, and Evan H. Zucker, each of whom would be difficult to replace. We currently do not have, nor do we expect to obtain key man life insurance on any of the Advisor’s key personnel. If the Advisor were to lose the benefit of the experience, efforts and abilities of one or more of these individuals, our operating results could suffer.
Our Advisor’s product specialists may recommend that we enter into transactions with entities that have a relationship or affiliation with them, and our stockholders will not be able to assess the Advisor’s product specialists’ qualifications when deciding whether to make an investment in shares of our common stock.
The Advisor utilizes third party product specialists to assist the Advisor in fulfilling its responsibilities. The strategic alliances between the Advisor and the product specialists provide, in accordance with industry standards, that the product specialists must adhere to a standard of care of commercial reasonableness when performing services on our behalf. The Advisor’s product specialists generally do not owe fiduciary duties to us and may have time constraints and other conflicts of interest due to relationships or affiliations they have with other entities. As a result, these product specialists may recommend that we enter into transactions with such entities, in which case we will not have the benefit of arm’s length negotiations of the type normally conducted between unrelated parties. Our stockholders will not be able to assess the qualifications of the Advisor’s product specialists when deciding whether to make an investment in shares of our common stock. Therefore, our stockholders may not be able to determine whether the Advisor’s product specialists are sufficiently qualified or otherwise desirable to work with.
Our Advisor’s management personnel and product specialists face conflicts of interest relating to time management and there can be no assurance that the Advisor’s management personnel and product specialists will devote adequate time to our business activities or that the Advisor will be able to hire adequate additional employees.
Certain of the Advisor’s management personnel and product specialists may also provide services to other Dividend Capital affiliated entities and, in the case of the product specialists, to unrelated third parties. We are not able to estimate the amount of time that such management personnel and product specialists will devote to our business. As a result, certain of the Advisor’s management personnel and product specialists may have conflicts of interest in allocating their time between our business and their other activities. During times of significant activity in other programs and ventures, the time they devote to our business may decline and be less than we would require. We expect that as our investment activities expand, in addition to the product specialists it will retain, the Advisor will attempt to hire additional employees who would devote substantially all of their time to our business. However, there can be no assurance that the Advisor’s affiliates will devote adequate time to our business activities or that the Advisor will be able to hire adequate additional employees.
20
The Advisor and its affiliates, including our officers and some of our directors, face conflicts of interest caused by compensation arrangements with us and other Dividend Capital affiliated entities, which could result in actions that are not in our stockholders’ best interests.
The Advisor and its affiliates receive substantial fees from us in return for their services and these fees could influence the Advisor’s advice to us. Among other matters, the compensation arrangements could affect their judgment with respect to:
| | • | | Public offerings of equity by us, which allow the Dealer Manager to earn additional dealer manager fees and the Advisor to earn increased acquisition fees and asset management fees; |
| | • | | Property sales, which allow the Advisor to earn additional asset management fees, disposition fees and possibly additional real estate sales commissions; and |
| | • | | Property acquisitions from other Dividend Capital affiliated entities, which may allow the Advisor or its affiliates to earn additional acquisition fees and asset management fees. |
Further, our Advisor may recommend that we invest in a particular asset or pay a higher purchase price for the asset than it would otherwise recommend if it did not receive an acquisition fee. Certain potential acquisition fees and asset management fees paid to the Advisor and management and leasing fees paid to the Property Manager would be paid irrespective of the quality of the underlying real estate or property management services during the term of the related agreement. As a component of the asset management fee, our Advisor is also entitled to a monthly net operating income-based fee and a fee equal to a percentage of the sales price of a property upon its sale. These fees may incentivize the Advisor to recommend the sale of a property or properties that may not be in our best interests at the time. Investments with higher net operating income growth potential are generally riskier or more speculative. In addition, the premature sale of an asset may add concentration risk to the portfolio or may be at a price lower than if we held the property. Moreover, the Advisor has considerable discretion with respect to the terms and timing of acquisition, disposition and leasing transactions. In evaluating investments and other management strategies, the opportunity to earn these fees may lead the Advisor to place undue emphasis on criteria relating to its compensation at the expense of other criteria, such as preservation of capital, in order to achieve higher short-term compensation. Considerations relating to our affiliates’ compensation from us and other Dividend Capital affiliated entities could result in decisions that are not in our stockholders’ best interests, which could hurt our ability to pay our stockholders distributions or result in a decline in the value of our stockholders’ investment. Conflicts of interest such as those described above have contributed to stockholder litigation against certain other externally managed REITs that are not affiliated with us.
The time and resources that Dividend Capital affiliated entities devote to us may be diverted and we may face additional competition due to the fact that Dividend Capital affiliated entities are not prohibited from raising money for another entity that makes the same types of investments that we target.
Dividend Capital affiliated entities are not prohibited from raising money for another investment entity that makes the same types of investments as those we target. As a result, the time and resources they could devote to us may be diverted. For example, the Dealer Manager is currently involved in public offerings for other Dividend Capital affiliated entities. In addition, we may compete with any such investment entity for the same investors and investment opportunities. We may also co-invest with any such investment entity. Even though all such co-investments will be subject to approval by our independent directors, they could be on terms not as favorable to us as those we could achieve co-investing with a third party.
The Advisor may have conflicting fiduciary obligations if we acquire properties with its affiliates or other related entities; as a result, in any such transaction we may not have the benefit of arm’s length negotiations of the type normally conducted between unrelated parties.
The Advisor may cause us to acquire an interest in a property from its affiliates or DCT Industrial Trust or through a joint venture with its affiliates or DCT Industrial Trust or to dispose of an interest in a property to its affiliates or DCT Industrial Trust. In these circumstances, the Advisor will have a conflict of interest when fulfilling its fiduciary obligation to us. In any such transaction we may not have the benefit of arm’s length negotiations of the type normally conducted between unrelated parties.
The fees we pay to affiliates in connection with our public and private offerings and in connection with the acquisition and management of our investments were not determined on an arm’s length basis and therefore we do not have the benefit of arm’s length negotiations of the type normally conducted between unrelated parties.
As of December 31, 2008, the Advisor, the Dealer Manager and other affiliates had earned approximately $195.8 million in fees, commissions and offering expense reimbursements, and acquisition and asset management fees for our investments. Of these fees, approximately $84.7 million represents commissions that have been reallowed to third-party broker dealers participating in our
21
public offerings. In addition, assuming we raise $2,000,000,000 in gross offering proceeds from the sale of shares of our common stock in connection with our public offerings (consisting of $1,500,000,000 pursuant to the primary offering and $500,000,000 pursuant to the distribution reinvestment plan), we will pay an aggregate of up to approximately 7.5% of the gross offering proceeds (approximately $150,000,000) in fees, commissions and offering expense reimbursements to the Advisor, the Dealer Manager and other affiliates in exchange for their services and to reimburse funds advanced on our behalf. Substantially all of the sales commissions (up to $90,000,000) are expected to be reallowed to third party broker dealers participating in our public offerings. The fees paid and to be paid to the Advisor, the Dealer Manager and other affiliates for services they provide us were not determined on an arm’s length basis. As a result, the fees have been determined without the benefit of arm’s length negotiations of the type normally conducted between unrelated parties.
We may compete with other Dividend Capital affiliated entities and DCT Industrial Trust for opportunities to acquire or sell investments, which may have an adverse impact on our operations.
We may compete with other Dividend Capital affiliated entities and DCT Industrial Trust for opportunities to acquire or sell certain types of real properties. We may also buy or sell real properties at the same time as other Dividend Capital affiliated entities and DCT Industrial Trust are buying or selling properties. In this regard, there is a risk that the Advisor will purchase a real property that provides lower returns to us than a real property purchased by another Dividend Capital affiliated entity or DCT Industrial Trust. Certain of our affiliates own and/or manage real properties in geographical areas in which we expect to own real properties. Therefore, our real properties may compete for tenants with other real properties owned and/or managed by other Dividend Capital affiliated entities or DCT Industrial Trust. The Advisor may face conflicts of interest when evaluating tenant leasing opportunities for our real properties and other real properties owned and/or managed by Dividend Capital affiliated entities or DCT Industrial Trust and these conflicts of interest may have a negative impact on our ability to attract and retain tenants.
We may also compete with other Dividend Capital affiliated entities for opportunities to acquire or sell certain types of real estate securities. Dividend Capital Investments acts as one of the Advisor’s product specialists with respect to our investments in real estate securities. Dividend Capital Investments is also the investment manager for three additional Dividend Capital affiliated entities, and certain non-affiliated entities, which invest in the same type of securities as those in which we invest.
As a result of our potential competition with other Dividend Capital affiliated entities or DCT Industrial Trust, certain investment opportunities that would otherwise be available to us may not in fact be available. This competition may also result in conflicts of interest that are not resolved in our favor. See “Item 13. Certain Relationships and Related Transactions, and Director Independence” for a description of the conflicts of interest that arise as a result of our relationship with the Advisor and its Affiliates.
We may purchase real estate assets from third parties who have existing or previous business relationships with affiliates or other related entities of the Advisor; as a result, in any such transaction, we may not have the benefit of arm’s length negotiations of the type normally conducted between unrelated parties.
We may purchase assets from third parties that have existing or previous business relationships with affiliates of the Advisor. DCT Industrial Trust, Dividend Capital Investments, the officers, directors or employees of such entities and the principals of the Advisor who also perform services for other Dividend Capital affiliated entities or DCT Industrial Trust may have a conflict in representing our interests in these transactions on the one hand and the interests of such affiliates in preserving or furthering their respective relationships on the other hand. In any such transaction, we will not have the benefit of arm’s length negotiations of the type normally conducted between unrelated parties.
RISKS RELATED TO OUR GENERAL BUSINESS OPERATIONS AND OUR CORPORATE STRUCTURE
The availability and timing of cash distributions to our stockholders is uncertain and we may have difficulty funding our distributions with funds provided by our operations.
We currently make and expect to continue to make quarterly distributions to our stockholders. However, we bear all expenses incurred in our operations, which are deducted from cash funds generated by operations prior to computing the amount of cash distributions to our stockholders. In addition, our board of directors, in its discretion, may retain any portion of such funds for working capital. We cannot assure our stockholders that sufficient cash will be available to make distributions to them or that the amount of distributions will not either decrease or fail to increase over time. Should we fail for any reason to distribute at least 90% of our REIT taxable income, we would not qualify for the favorable tax treatment accorded to REITs.
To date, all of our distributions have been funded through a combination of both our operations and borrowings and we expect that over the near-term our distributions will be funded in the same manner. Our long-term strategy is to fund the payment of quarterly distributions to our stockholders entirely from our operations. However, if we are unsuccessful in investing the capital we raise on an effective and efficient basis, we may be required to continue to fund our quarterly distributions to our stockholders from a combination of our operations and borrowings. To the extent we are required to borrow money to fund distributions, this could result in higher interest expense, reduce our ability to incur additional indebtedness and otherwise impact our
business and results of operations. In addition, we would be more likely to decrease the amount of our distributions to our stockholders or cease making them altogether.
Our board of directors determines our major policies and operations which increases the uncertainties faced by our stockholders.
Our board of directors determines our major policies, including our policies regarding acquisitions, dispositions, financing, growth, debt capitalization, REIT qualification, redemptions and distributions. Our board of directors may amend or revise these and other policies without a vote of the stockholders. Under the Maryland General Corporation Law and our charter, our stockholders have a right to vote only on limited matters. Our board of directors’ broad discretion in setting policies and our stockholders’ inability to exert control over those policies increases the uncertainty and risks our stockholders face, especially if our board of directors and our stockholders disagree as to what course of action is in our stockholders’ best interests.
22
Our stockholders are limited in their ability to sell our shares of common stock pursuant to our share redemption program, our stockholders may not be able to sell any of their shares of our common stock back to us and, if our stockholders do sell their shares, they may not receive the price they paid.
Our share redemption program may provide our stockholders with only a limited opportunity to have their shares of common stock redeemed by us at a price equal to or at a discount from the purchase price of the shares of our common stock being redeemed after our stockholders have held them for a minimum of one year. Our common stock may be redeemed on a quarterly basis. However, our share redemption program contains certain restrictions and limitations, including those relating to the number of shares of our common stock that we can redeem at any given time and limiting the redemption price. Specifically, we presently intend to limit the number of shares to be redeemed during any consecutive twelve month period to no more than five percent of the number of shares of common stock outstanding at the beginning of such twelve month period. Our board of directors may also determine to further limit redemptions of our common stock where funds are needed for other business purposes.Our redemption of OP Units for cash pursuant to the Operating Partnership Agreement will further limit the funds we have available to redeem shares of our common stock pursuant to our share redemption program. In addition, the board of directors reserves the right to reject any redemption request for any reason or no reason or to amend or terminate the share redemption program at any time. Therefore, our stockholders may not have the opportunity to make a redemption request prior to a potential termination of the share redemption program and/or our stockholders may not be able to sell any of their shares of common stock back to us pursuant to our share redemption program. Any amendment, suspension or termination of our share redemption program will not affect the rights of holders of OP Units to cause us to redeem their OP Units for, at our sole discretion, shares of our common stock, cash, or a combination of both pursuant to the Operating Partnership Agreement. Moreover, if our stockholders do sell their shares of our common stock back to us pursuant to the share redemption program, our stockholders may not receive the same price they paid for any shares of our common stock being redeemed.
The board of directors may also increase the limitation above five percent but, in any event, the number of shares of our common stock that we may redeem will be limited by the funds available from purchases pursuant to our distribution reinvestment plan, cash on hand, cash available from borrowings and cash from liquidations of securities investments as of the end of the applicable quarter. On December 19, 2008, our board of directors authorized redemptions for the fourth quarter of 2008 for an amount that exceeded the five percent limitation. The total shares requested for redemption exceeded the five percent limitation by approximately 253,000 shares, resulting in a redemption percentage of 5.2% of our common stock outstanding at the beginning of the applicable twelve month period. While the board of directors authorized the redemption of the excess shares for the fourth quarter of 2008, future redemptions are subject to the five percent limitation and there can be no assurance that redemption requests in any future quarter in excess of the five percent limitation will be fully honored. During the first quarter of 2009, we had received requests to redeem approximately 6.1 million shares of common stock, which exceeds our first quarter 2009 five percent limitation of approximately 853,000 shares of commons stock by approximately 5.3 million shares of common stock. Based on application of the five percent limitation applicable to the first quarter of 2009, we expect to redeem requesting stockholders on a pro rata basis, which we expect will result in redemptions of approximately 13.9% of the shares that each shareholder requested to be redeemed for the first quarter of 2009.
The “best efforts” nature of our public offering may result in delays or uncertainties in finding suitable investments, which may inhibit our ability to achieve our investment objectives and make distributions to our stockholders.
Because we are conducting our public offering on a “best efforts” basis over time, our ability to commit to purchase specific assets will also depend, in part, on the amount of proceeds we have received at a given time. If we are delayed or unable to find suitable investments at any time, we may not be able to achieve our investment objectives or make distributions to our stockholders.
Our UPREIT structure may result in potential conflicts of interest with limited partners in the Operating Partnership whose interests may not be aligned with those of our stockholders.
Limited partners in the Operating Partnership have the right to vote on certain amendments to the Operating Partnership Agreement, as well as on certain other matters. Persons holding such voting rights may exercise them in a manner that conflicts with our stockholders’ interests. As general partner of the Operating Partnership, we are obligated to act in a manner that is in the best interests of all partners of the Operating Partnership. Circumstances may arise in the future when the interests of limited partners in the Operating Partnership may conflict with the interests of our stockholders. These conflicts may be resolved in a manner stockholders believe are not in their best interests.
We may acquire co-ownership interests in real property that are subject to certain co-ownership agreements which may have an adverse effect on our results of operations, relative to if the co-ownership agreements did not exist.
We may acquire co-ownership interests, especially in connection with the Operating Partnership’s private placements, such as tenancy-in-common interests in real property and beneficial interests in specific Delaware statutory trusts, that are subject to certain co-ownership agreements. The co-ownership agreements may limit our ability to encumber, lease, or dispose of our co-ownership interests. Such agreements could affect our ability to turn our investments into cash and could affect cash available for distributions to our stockholders. The co-ownership agreements could also impair our ability to take actions that would otherwise be in the best interests of our stockholders and, therefore, may have an adverse effect on our results of operations, relative to if the co-ownership agreements did not exist.
The Operating Partnership’s private placements of tenancy-in-common interests in real properties and beneficial interests in specific Delaware statutory trusts could subject us to liabilities from litigation or otherwise.
The Operating Partnership, through DCTRT Leasing Corp., a wholly owned subsidiary, offers undivided tenancy-in-common interests in real properties and beneficial interests in specific Delaware statutory trusts (collectively referred to as “fractional interests”), respectively, to accredited investors in private placements exempt from registration under the Securities Act of 1933, as amended (the “Securities Act”). We anticipate that these fractional interests may serve as replacement properties for investors seeking to complete like-kind exchange transactions under Section 1031 of the Internal Revenue Code of 1986, as amended (the “Code”). Any fractional interests sold to investors pursuant to such private placements are 100% master leased by the Operating Partnership or a wholly-owned subsidiary thereof, as applicable. Additionally, the Operating Partnership is given a purchase option giving it the right, but not the obligation, to acquire these fractional interests from the investors at a later time in exchange for operating partnership units (“OP Units”) (under a prior program administered by the Operating Partnership, such options were granted in the lease itself, and the Operating Partnership continues to hold these options as well). Investors who acquire fractional interests pursuant to such private placements may do so seeking certain tax benefits that depend on the interpretation of, and compliance with, extremely technical tax laws and regulations. As the general partner of the Operating Partnership, we may become subject to liability, from litigation or otherwise, as a result of such transactions, including in the event an investor fails to qualify for any desired tax benefits.
Payments to the holder of the Special Units or cash redemptions to holders of OP Units will reduce cash available for distribution to our stockholders or to honor their redemption requests under our share redemption program.
Dividend Capital Total Advisors Group LLC, the holder of the Special Units, may be entitled to receive a cash payment upon dispositions of the Operating Partnership’s assets and/or redemption of the Special Units upon the earliest to occur of specified events, including, among other events, termination or non-renewal of the Advisory Agreement upon a merger or sale of assets. Payments to the holder of the Special Units upon dispositions of the Operating Partnership’s assets and redemptions of the Special Units will reduce cash available for distribution to our stockholders.
23
The holders of OP Units (other than us, the Advisor and the holder of the Special Units) generally have the right to cause the Operating Partnership to redeem all or a portion of their OP Units for, at our sole discretion, shares of our common stock, cash, or a combination of both. Our election to redeem OP Units for cash will reduce funds available to honor our stockholders’ redemption requests under our share redemption program.
Maryland law and our organizational documents limit our stockholders’ right to bring claims against our officers and directors.
Maryland law provides that a director will not have any liability as a director so long as he or she performs his or her duties in good faith, in a manner he or she reasonably believes to be in our best interests, and with the care that an ordinarily prudent person in a like position would use under similar circumstances. In addition, our charter provides that, subject to the applicable limitations set forth therein or under Maryland law, no director or officer will be liable to us or our stockholders for monetary damages. Our charter also provides that we will generally indemnify our directors, our officers, our Advisor and its affiliates for losses they may incur by reason of their service in those capacities unless their act or omission was material to the matter giving rise to the proceeding and was committed in bad faith or was the result of active and deliberate dishonesty, they actually received an improper personal benefit in money, property or services or, in the case of any criminal proceeding, they had reasonable cause to believe the act or omission was unlawful. Moreover, we have entered into separate indemnification agreements with each of our independent directors. As a result, we and our stockholders have more limited rights against these persons than might otherwise exist under common law. In addition, we are obligated to fund the defense costs incurred by these persons in some cases. However, our charter does provide that we may not indemnify our directors, our Advisor and its affiliates for any liability or loss suffered by them unless they have determined that the course of conduct that caused the loss or liability was in our best interests, they were acting on our behalf or performing services for us, the liability or loss was not the result of negligence or misconduct by our non-independent directors, our Advisors and its affiliates or gross negligence or willful misconduct by our independent directors, and the indemnification is recoverable only out of our net assets or the proceeds of insurance and not from the stockholders.
We may issue preferred stock or other classes of common stock, which issuance could adversely affect the holders of our common stock issued pursuant to our public offerings.
Holders of our common stock do not have preemptive rights to any shares issued by us in the future. We may issue, without stockholder approval, preferred stock or other classes of common stock with rights that could dilute the value of our stockholders’ shares of common stock. This would increase the number of stockholders entitled to distributions without simultaneously increasing the size of our asset base. Our charter authorizes us to issue 1,200,000,000 shares of capital stock, of which 1,000,000,000 shares of capital stock are designated as common stock and 200,000,000 shares of capital stock are designated as preferred stock. Our board of directors may amend our charter to increase the aggregate number of authorized shares of capital stock or the number of authorized shares of capital stock of any class or series without stockholder approval. If we ever created and issued preferred stock with a distribution preference over common stock, payment of any distribution preferences of outstanding preferred stock would reduce the amount of funds available for the payment of distributions on our common stock. Further, holders of preferred stock are normally entitled to receive a preference payment in the event we liquidate, dissolve or wind up before any payment is made to our common
24
stockholders, likely reducing the amount common stockholders would otherwise receive upon such an occurrence. In addition, under certain circumstances, the issuance of preferred stock or a separate class or series of common stock may render more difficult or tend to discourage:
| | • | | A merger, offer or proxy contest; |
| | • | | The assumption of control by a holder of a large block of our securities; and/or |
| | • | | The removal of incumbent management. |
The limit on the percentage of shares of our common stock that any person may own may discourage a takeover or business combination that may have benefited our stockholders.
Our charter restricts the direct or indirect ownership by one person or entity to no more than 9.8% of the value of our then outstanding capital stock (which includes common stock and any preferred stock we may issue) and no more than 9.8% of the value or number of shares, whichever is more restrictive, of our then outstanding common stock. This restriction may discourage a change of control of us and may deter individuals or entities from making tender offers for shares of our common stock on terms that might be financially attractive to stockholders or which may cause a change in our management. This ownership restriction may also prohibit business combinations that would have otherwise been approved by our board of directors and our stockholders. In addition to deterring potential transactions that may be favorable to our stockholders, these provisions may also decrease our stockholders’ ability to sell their shares of our common stock.
RISKS RELATED TO OUR TAXATION AS A REIT
Failure to qualify as a REIT could adversely affect our operations and our ability to make distributions.
We are organized and operate in a manner intended to qualify as a REIT for U.S. federal income tax purposes. We first elected REIT status for our taxable year ended December 31, 2006. Although we have not requested a ruling from the Internal Revenue Service (“IRS”) as to our REIT status, we have received the opinions of our special U.S. federal income tax counsel, Skadden, Arps, Slate, Meagher & Flom LLP, with respect to our qualification as a REIT. Such opinions have been issued in connection with our initial public offering and follow on public offering. Investors should be aware, however, that opinions of counsel are not binding on the IRS or on any court. The opinion of Skadden, Arps, Slate, Meagher & Flom LLP represent only the view of our counsel based on our counsel’s review and analysis of existing law and on certain representations as to factual matters and covenants made by us, including representations relating to the values of our assets and the sources of our income. Skadden, Arps, Slate Meagher & Flom LLP has no obligation to advise us or the holders of our common stock of any subsequent change in the matters stated, represented or assumed in its opinions or of any subsequent change in applicable law. Furthermore, both the validity of the opinions of Skadden, Arps, Slate, Meagher & Flom LLP and our qualification as a REIT will depend on our satisfaction of numerous requirements (some on an annual and quarterly basis) established under highly technical and complex provisions of the Code, for which there are only limited judicial or administrative interpretations, and involves the determination of various factual matters and circumstances not entirely within our control. The complexity of these provisions and of the applicable income tax regulations that have been promulgated under the Code is greater in the case of a REIT that holds its assets through a partnership, as we do. Moreover, no assurance can be given that legislation, new regulations, administrative interpretations or court decisions will not change the tax laws with respect to qualification as a REIT or the U.S. federal income tax consequences of that qualification. See “Federal Income Tax Considerations” in our Registration Statement on Form S-11 filed with the Commission on January 9, 2009.
If we were to fail to qualify as a REIT for any taxable year, we would be subject to U.S. federal income tax on our taxable income at corporate rates. In addition, we would generally be disqualified from treatment as a REIT for the four taxable years following the year in which we lose our REIT status. Losing our REIT status would reduce our net earnings available for investment or distribution to stockholders because of the additional tax liability. In addition, distributions to stockholders would no longer be deductible in computing our taxable income and we would no longer be required to make distributions. To the extent that distributions had been made in anticipation of our qualifying as a REIT, we might be required to borrow funds or liquidate some investments in order to pay the applicable corporate income tax. In addition, although we intend to operate in a manner to qualify as a REIT, it is possible that future economic, market, legal, tax or other considerations may cause our board of directors to recommend that we revoke our REIT election.
We believe that the Operating Partnership will continue to be treated for federal income tax purposes as a partnership and not as an association or as a publicly traded partnership taxable as a corporation. If the Internal Revenue Service were successfully to determine that the Operating Partnership were properly treated as a corporation, the Operating Partnership would be required to pay
25
U.S. federal income tax at corporate rates on its net income, its partners would be treated as stockholders of the Operating Partnership and distributions to partners would constitute distributions that would not be deductible in computing the Operating Partnership’s taxable income. In addition, we could fail to qualify as a REIT, with the resulting consequences described above. See “Federal Income Tax Considerations” in our Registration Statement on Form S-11 filed with the Commission on January 9, 2009.
To continue to qualify as a REIT, we must meet annual distribution requirements, which may result in us distributing amounts that may otherwise be used for our operations.
To maintain the favorable tax treatment accorded to REITs, we normally will be required each year to distribute to our stockholders at least 90% of our real estate investment trust taxable income, determined without regard to the deduction for distributions paid and by excluding net capital gains. We are subject to U.S. federal income tax on our undistributed taxable income and net capital gain and to a 4% nondeductible excise tax on any amount by which distributions we pay with respect to any calendar year are less than the sum of (i) 85% of our ordinary income, (ii) 95% of our capital gain net income and (iii) 100% of our undistributed income from prior years. These requirements could cause us to distribute amounts that otherwise would be spent on acquisitions of properties and it is possible that we might be required to borrow funds or sell assets to fund these distributions. Although we intend to make distributions sufficient to meet the annual distribution requirements and to avoid corporate income taxation on the earnings that we distribute, it is possible that we might not always be able to do so.
From time to time, we may generate taxable income greater than our taxable income for financial reporting purposes, or differences in timing between the recognition of taxable income and the actual receipt of cash may occur. If we do not have other funds available in these situations, we could be required to borrow funds on unfavorable terms, sell investments at disadvantageous prices or distribute amounts that would otherwise be invested in future acquisitions to make distributions sufficient to enable us to pay out enough of our taxable income to satisfy the REIT distribution requirement and to avoid corporate income tax and the 4% excise tax in a particular year. These alternatives could increase our costs or reduce our equity. Thus, compliance with the REIT requirements may hinder our ability to grow, which could adversely affect the value of our common stock.
Recharacterization of sale-leaseback transactions may cause us to lose our REIT status.
We may purchase real properties and lease them back to the sellers of such properties. While we will use our best efforts to structure any such sale-leaseback transaction such that the lease will be characterized as a “true lease,” thereby allowing us to be treated as the owner of the property for federal income tax purposes, we cannot assure our stockholders that the IRS will not challenge such characterization. In the event that any such sale-leaseback transaction is challenged and recharacterized as a financing transaction or loan for U.S. federal income tax purposes, deductions for depreciation and cost recovery relating to such property would be disallowed. If a sale-leaseback transaction were so recharacterized, we might fail to satisfy the REIT qualification “asset tests” or the “income tests” and, consequently, lose our REIT status effective with the year of recharacterization. Alternatively, the amount of our REIT taxable income could be recalculated which might also cause us to fail to meet the distribution requirement for a taxable year.
Our stockholders may have current tax liability on distributions if our stockholders elect to reinvest in shares of our common stock.
Even if our stockholders participate in our distribution reinvestment plan, our stockholders will be deemed to have received, and for U.S. federal income tax purposes will be taxed on, the amount reinvested in shares of our common stock to the extent the amount reinvested was not a tax-free return of capital. As a result, our stockholders that are not tax-exempt entities may have to use funds from other sources to pay their tax liability on the value of the common stock received.
Distributions payable by REITs do not qualify for the reduced tax rates that apply to other corporate distributions.
Tax legislation enacted in 2003, as amended, generally reduces the maximum U.S. federal income tax rate for distributions payable by corporations to domestic stockholders that are individuals, trusts or estates to 15% through 2010. Distributions payable by REITs, however, generally continue to be taxed at the normal rate applicable to the individual recipient, rather than the 15% preferential rate. Although this legislation does not adversely affect the taxation of REITs or distributions paid by REITs, the more favorable rates applicable to regular corporate distributions could cause investors who are individuals to perceive investments in REITs to be relatively less attractive than investments in the stocks of non-REIT corporations that pay distributions, which could adversely affect the value of the stock of REITs, including our common stock. See “Federal Income Tax Considerations” in our Registration Statement on Form S-11 filed with the Commission on January 9, 2009.
26
In certain circumstances, we may be subject to federal and state income taxes as a REIT, which would reduce our cash available for distribution to our stockholders.
Even if we maintain our status as a REIT, we may be subject to U.S. federal income taxes or state taxes. For example, net income from a “prohibited transaction” will be subject to a 100% tax. We may not be able to make sufficient distributions to avoid excise taxes applicable to REITs. We may also decide to retain income we earn from the sale or other disposition of our property and pay income tax directly on such income. In that event, our stockholders would be treated as if they earned that income and paid the tax on it directly. However, stockholders that are tax-exempt, such as charities or qualified pension plans, would have no benefit from their deemed payment of such tax liability. We may also be subject to state and local taxes on our income or property, either directly or at the level of the companies through which we indirectly own our assets. Any U.S. federal or state taxes we pay will reduce our cash available for distribution to our stockholders.
Distributions to tax-exempt investors may be classified as unrelated business taxable income.
Neither ordinary nor capital gain distributions with respect to our common stock nor gain from the sale of common stock should generally constitute unrelated business taxable income to a tax-exempt investor. However, there are certain exceptions to this rule. In particular:
| | • | | Part of the income and gain recognized by certain qualified employee pension trusts with respect to our common stock may be treated as unrelated business taxable income if shares of our common stock are predominately held by qualified employee pension trusts, and we are required to rely on a special look-through rule for purposes of meeting one of the REIT share ownership tests, and we are not operated in a manner to avoid treatment of such income or gain as unrelated business taxable income; |
| | • | | Part of the income and gain recognized by a tax-exempt investor with respect to our common stock would constitute unrelated business taxable income if the investor incurs debt in order to acquire the common stock; and |
| | • | | Part or all of the income or gain recognized with respect to our common stock by social clubs, voluntary employee benefit associations, supplemental unemployment benefit trusts and qualified group legal services plans which are exempt from federal income taxation under Sections 501(c)(7), (9), (17), or (20) of the Code may be treated as unrelated business taxable income. |
See “Federal Income Tax Considerations” in our Registration Statement on Form S-11 filed with the Commission on January 9, 2009.
Our investments in other REITs and real estate partnerships subject us to the tax risks associated with the tax status of such entities.
We intend to invest in the securities of other REITs and real estate partnerships. Such investments are subject to the risk that any such REIT or partnership may fail to satisfy the requirements to qualify as a REIT or a partnership, as the case may be, in any given taxable year. In the case of a REIT, such failure would subject such entity to taxation as a corporation, may require such REIT to incur indebtedness to pay its tax liabilities, may reduce its ability to make distributions to us, and may render it ineligible to elect REIT status prior to the fifth taxable year following the year in which it fails to so qualify. In the case of a partnership, such failure could subject such partnership to an entity level tax and reduce the entity’s ability to make distributions to us. In addition, such failures could, depending on the circumstances, jeopardize our ability to qualify as a REIT.
Complying with the REIT requirements may cause us to forego otherwise attractive opportunities.
To maintain our status as a REIT for U.S. federal income tax purposes, we must continually satisfy tests concerning, among other things, the sources of our income, the nature and diversification of our assets, the amounts we distribute to our stockholders and the ownership of shares of our common stock. We may be required to make distributions to stockholders at disadvantageous times or when we do not have funds readily available for distribution. Thus, compliance with the REIT requirements may hinder our ability to operate solely on the basis of maximizing profits.
27
Complying with the REIT requirements may force us to liquidate otherwise attractive investments.
To maintain our status as a REIT, we must ensure that at the end of each calendar quarter, at least 75% of the value of our assets consists of cash, cash items, government securities and qualified REIT real estate assets, including shares of stock in other REITs, certain mortgage loans, and mortgage backed securities. The remainder of our investments in securities (other than governmental securities and qualified real estate assets) generally cannot include more than 10% of the outstanding voting securities of any one issuer or more than 10% of the total value of the outstanding securities of any one issuer. In addition, in general, no more than 5% of the value of our assets (other than government securities and qualified real estate assets) can consist of the securities of any one issuer, and no more than 25% (20% prior to July 30, 2008) of the value of our total securities can be represented by securities of one or more taxable REIT subsidiaries. See “Federal Income Tax Considerations” in our Registration Statement on Form S-11 filed with the Commission on January 9, 2009. If we fail to comply with these requirements at the end of any calendar quarter, we must correct such failure within 30 days after the end of the calendar quarter to avoid losing our REIT status and suffering adverse tax consequences. As a result, we may be required to liquidate otherwise attractive investments.
The stock ownership limit imposed by the Internal Revenue Code for REITs and our charter may restrict our business combination opportunities.
To maintain our status as a REIT under the Internal Revenue Code, not more than 50% in value of our outstanding stock may be owned, directly or indirectly, by five or fewer individuals (as defined in the Internal Revenue Code to include certain entities) at any time during the last half of each taxable year after our first year in which we qualify as a REIT. Our charter, with certain exceptions, authorizes our board of directors to take the actions that are necessary and desirable to preserve our qualification as a REIT. Unless an exemption is granted by our board of directors, no person (as defined to include entities) may own more than 9.8% in value of our capital stock or more than 9.8% in value or in number of shares, whichever is more restrictive, of our common stock following the completion of our public offerings. In addition, our charter will generally prohibit beneficial or constructive ownership of shares of our capital stock by any person that owns, actually or constructively, an interest in any of our tenants that would cause us to own, actually or constructively, more than a 9.9% interest in any of our tenants. Our board of directors may grant an exemption in its sole discretion, subject to such conditions, representations and undertakings as it may determine. These ownership limitations in our charter are common in REIT charters and are intended, among other purposes, to assist us in complying with the tax law requirements and to minimize administrative burdens. However, these ownership limits might also delay or prevent a transaction or a change in our control that might involve a premium price for our common stock or otherwise be in the best interests of our stockholders.
The tax on prohibited transactions will limit our ability to engage in transactions, including certain methods of syndicating and securitizing mortgage loans, that would be treated as sales for federal income tax purposes.
A REIT’s net income from prohibited transactions is subject to a 100% tax. In general, prohibited transactions are sales or other dispositions of property, other than foreclosure property, but including mortgage loans that are held primarily for sale to customers in the ordinary course of business. We might be subject to this tax if we were to syndicate, dispose of, or securitize loans in a manner that was treated as a sale of the loans for U.S. federal income tax purposes. Therefore, to avoid the prohibited transactions tax, we may choose not to engage in certain sales of loans at the REIT level and may limit the structures we utilize for our securitization transactions, even though the sales or structures otherwise might be beneficial to us.
The failure of a mezzanine loan to qualify as a real estate asset could adversely affect our ability to qualify as a REIT.
The IRS has issued Revenue Procedure 2003-65, which provides a safe harbor pursuant to which a mezzanine loan that is secured by interests in a pass-through entity will be treated by the IRS as a real estate asset for purposes of the REIT tests, and interest derived from such loan will be treated as qualifying mortgage interest for purposes of the REIT 75% income test. Although the Revenue Procedure provides a safe harbor on which taxpayers may rely, it does not prescribe rules of substantive tax law. We intend to make investments in loans secured by interests in pass-through entities in a manner that complies with the various requirements applicable to our qualification as a REIT. To the extent, however, that any such loans do not satisfy all of the requirements for reliance on the safe harbor set forth in the Revenue Procedure, there can be no assurance that the IRS will not challenge the tax treatment of such loans, which could jeopardize our ability to qualify as a REIT.
Liquidation of assets may jeopardize our REIT status.
To maintain our status as a REIT, we must comply with requirements regarding our assets and our sources of income. If we are compelled to liquidate our investments to satisfy our obligations to our lenders, we may be unable to comply with these requirements, ultimately jeopardizing our status as a REIT, or we may be subject to a 100% tax on any resultant gain if we sell assets that are treated as dealer property or inventory.
28
Legislative or regulatory action could adversely affect investors.
In recent years, numerous legislative, judicial and administrative changes have been made to the U.S. federal income tax laws applicable to investments in REITs and similar entities. Additional changes to tax laws are likely to continue to occur in the future, and we cannot assure our stockholders that any such changes will not adversely affect the taxation of a stockholder. Any such changes could have an adverse effect on an investment in shares of our common stock. We urge our stockholders to consult with their own tax advisor with respect to the status of legislative, regulatory or administrative developments and proposals and their potential effect on an investment in shares of our common stock.
Recharacterization of transactions under the Operating Partnership’s private placements could result in a 100% tax on income from prohibited transactions, which would diminish our cash distributions to our stockholders.
The Internal Revenue Service could recharacterize transactions under the Operating Partnership’s private placements such that the Operating Partnership could be treated as the bona fide owner, for tax purposes, of properties acquired and resold by the entity established to facilitate the transaction. Such recharacterization could result in the income realized on these transactions by the Operating Partnership being treated as gain on the sale of property that is held as inventory or otherwise held primarily for the sale to customers in the ordinary course of business. In such event, such gain would constitute income from a prohibited transaction and would be subject to a 100% tax. If this occurs, our ability to pay cash distributions to our stockholders will be adversely affected.
Qualifying as a REIT involves highly technical and complex provisions of the Code.
Qualification as a REIT involves the application of highly technical and complex Code provisions for which only limited judicial and administrative authorities exist. Even a technical or inadvertent violation could jeopardize our REIT qualification. Our continued qualification as a REIT will depend on our satisfaction of certain asset, income, organizational, distribution, stockholder ownership and other requirements on a continuing basis. In addition, our ability to satisfy the requirements to qualify as a REIT depends in part on the actions of third parties over which we have no control or only limited influence, including in cases where we own an equity interest in an entity that is classified as a partnership for U.S. federal income tax purposes.
Foreign investors may be subject to FIRPTA on the sale of common shares if we are unable to qualify as a “domestically controlled” REIT.
A foreign person disposing of a U.S. real property interest, including shares of a U.S. corporation whose assets consist principally of U.S. real property interests, is generally subject to a tax, known as FIRPTA, on the gain recognized on the disposition. FIRPTA does not apply, however, to the disposition of stock in a REIT if the REIT is a “domestically controlled REIT.” A domestically controlled REIT is a REIT in which, at all times during a specified testing period, less than 50% in value of its shares is held directly or indirectly by non-U.S. holders. We cannot assure our stockholders that we will qualify as a domestically controlled REIT. If we were to fail to so qualify, gain realized by a foreign investor on a sale of our common stock would be subject to FIRPTA unless our common stock was traded on an established securities market and the foreign investor did not at any time during a specified testing period directly or indirectly own more than 5% of the value of our outstanding common stock. See “Federal Income Tax Considerations” in our Registration Statement on Form S-11 filed with the Commission on January 9, 2009.
INVESTMENT COMPANY RISKS
Maintenance of our Investment Company Act exemption imposes limits on our operations.
We conduct our operations so as not to become regulated as an investment company under the Investment Company Act of 1940, as amended, which we refer to as the “Investment Company Act.” We rely on the exclusion provided by Section 3(c)(5)(C) of the Investment Company Act (and potentially Section 3(c)(6) if, from time to time, we engage in our real estate business through one or more majority owned subsidiaries) and/or any other exclusions available to us. We may rely in the future on any other exemption or exception under the Investment Company Act, including Sections 3(c)(6) or 3(a)(1), or the rules promulgated thereunder.
29
However, if we were obligated to register as an investment company, we would be required to comply with a variety of substantive requirements under the Investment Company Act that impose, among other things:
| | • | | Limitations on capital structure; |
| | • | | Restrictions on specified investments; |
| | • | | Prohibitions on transactions with affiliates; and |
| | • | | Compliance with reporting, record keeping, voting, proxy disclosure and other rules and regulations that would significantly increase our operating expenses. |
The assets that we may acquire, therefore, are limited by the provisions of the Investment Company Act and the rules and regulations promulgated under the Investment Company Act. If we fail to own a sufficient amount of qualifying real estate assets or real estate related assets to satisfy the requirements of Section 3(c)(5)(C) and cannot rely on any other exemption or exclusion under the Investment Company Act, we could be characterized as an investment company.
To maintain compliance with the Investment Company Act exclusion, we may be unable to sell assets we would otherwise want to sell and may need to sell assets we would otherwise wish to retain. In addition, we may have to acquire additional assets that we might not otherwise have acquired or may have to forego opportunities to acquire assets that we would otherwise want to acquire and would be important to our investment strategy. If we were required to register as an investment company but failed to do so, we would be prohibited from engaging in our business, and criminal and civil actions could be brought against us. In addition, our contracts would be unenforceable unless a court required enforcement, and a court could appoint a receiver to take control of us and liquidate our business.
In order not to be deemed an investment company under the Investment Company Act, we must be engaged primarily in a business other than that of owning, holding, trading or investing in securities. We believe that we will not be so engaged, but there is uncertainty with respect to the characterization of some types of assets in which we plan to invest as real estate under the Investment Company Act. As a result, it is possible that some of the assets in which we invest could be determined to be securities, rather than interests in, or liens upon, real estate. If a sufficient amount of such assets are determined to be securities rather than interests in or liens upon real estate for purposes of the Investment Company Act, it is possible that we could be characterized as an investment company, which would likely have a material adverse effect on our business and operations. Such a characterization would require us to either (i) change the manner in which we conduct our operations to avoid being required to register as an investment company or (ii) to register as an investment company, either of which could have an adverse effect on us and the market price for our common stock.
Specifically, the CMBS and CRE-CDOs we have acquired are collateralized by pools of first mortgage loans where we can monitor the performance of the underlying mortgage loans through loan management and servicing rights and we will have appropriate workout/foreclosure rights with respect to the underlying mortgage loans. We believe that our CMBS and CRE-CDOs investments will be treated as investments in real estate for purposes of the Investment Company Act. If the Commission or its staff take a different position with respect to the characterization of the CMBS and CRE-CDOs in which we invest, in order to avoid registration as an investment company, we may need to dispose of a significant portion of our CMBS and CRE-CDOs or acquire significant other additional assets, or we may need to modify our business plan to register as an investment company, which would result in significantly increased operating expenses and would likely entail significantly reducing our indebtedness which could also require us to sell a significant portion of our assets. No assurances can be given that any such dispositions or acquisitions of assets, or deleveraging, could be accomplished on favorable terms. Consequently, any such modification of our business plan could have a material adverse effect on us. Further, if it were established that we were an unregistered investment company, there would be a risk that we would be subject to monetary penalties and injunctive relief in an action brought by the Commission, that we would be unable to enforce contracts with third parties, and that third parties could seek to obtain rescission of transactions undertaken during the period it was established that we were an unregistered investment company. Any such results would be likely to have a material adverse effect on us.
| ITEM 1B. | UNRESOLVED STAFF COMMENTS |
None.
30
As of December 31, 2008, we had invested in 74 real properties, 73 of which were operating properties and one of which was held for sale. The operating properties are located in 24 distinct markets throughout the United States and comprise approximately 12.1 million net rentable square feet. As of December 31, 2008, our operating properties were subject to mortgage notes with an aggregate principal amount outstanding of approximately $719.0 million. See Note 6 to our consolidated financial statements in “Item 8. Financial Statements and Supplementary Data” of this Annual Report on Form 10-K.
Geographic Distribution
The following table describes our 73 operating properties, by market, which are presented on a consolidated basis for purposes of financial reporting as of December 31, 2008 (amounts in thousands).
| | | | | | | | | | | | | | | | | | | |
Market | | Number of
Properties | | Gross
Investment
Amount (1) | | Net Rentable
Square Feet | | Mortgage Note
Indebtedness | | % of Gross
Investment
Amount of
Portfolio | | | % of Total Net
Rentable
Square Feet of
Portfolio | | | Occupancy (2) | |
Office and Office/R&D Properties: | | | | | | | | | | | | | | | | | | | |
Silicon Valley, CA | | 5 | | $ | 150,612 | | 854 | | $ | 96,493 | | 10.4 | % | | 7.1 | % | | 78.8 | % |
Denver, CO | | 1 | | | 52,567 | | 134 | | | 33,760 | | 3.6 | % | | 1.1 | % | | 97.8 | % |
Austin, TX | | 1 | | | 44,974 | | 156 | | | 22,700 | | 3.1 | % | | 1.3 | % | | 100.0 | % |
Chicago, IL | | 2 | | | 41,873 | | 304 | | | 31,000 | | 2.9 | % | | 2.5 | % | | 84.2 | % |
Philadelphia, PA | | 1 | | | 37,547 | | 173 | | | 24,000 | | 2.6 | % | | 1.4 | % | | 89.6 | % |
Dallas, TX | | 1 | | | 35,362 | | 437 | | | 22,700 | | 2.4 | % | | 3.6 | % | | 100.0 | % |
Minneapolis/St Paul, MN | | 1 | | | 29,430 | | 107 | | | 15,100 | | 2.0 | % | | 0.9 | % | | 100.0 | % |
Little Rock, AR | | 1 | | | 21,720 | | 102 | | | 13,650 | | 1.5 | % | | 0.8 | % | | 100.0 | % |
Fayetteville, AR | | 1 | | | 11,695 | | 63 | | | — | | 0.8 | % | | 0.5 | % | | 100.0 | % |
| | | | | | | | | | | | | | | | | | | |
Total/Weighted Average | | 14 | | | 425,780 | | 2,330 | | | 259,403 | | 29.5 | % | | 19.3 | % | | 89.3 | % |
Industrial Properties: | | | | | | | | | | | | | | | | | | | |
Central PA | | 3 | | | 70,515 | | 1,110 | | | 41,270 | | 4.9 | % | | 9.2 | % | | 96.4 | % |
Cincinnati, OH | | 3 | | | 51,148 | | 952 | | | 25,474 | | 3.5 | % | | 7.9 | % | | 100.0 | % |
Minneapolis/St Paul, MN | | 3 | | | 34,271 | | 472 | | | 16,447 | | 2.4 | % | | 3.9 | % | | 100.0 | % |
Dallas, TX | | 2 | | | 33,051 | | 646 | | | 23,000 | | 2.3 | % | | 5.3 | % | | 78.2 | % |
Louisville, KY | | 5 | | | 31,229 | | 900 | | | — | | 2.2 | % | | 7.4 | % | | 96.9 | % |
Atlanta, GA | | 2 | | | 29,636 | | 616 | | | 5,280 | | 2.0 | % | | 5.1 | % | | 100.0 | % |
Silicon Valley, CA | | 1 | | | 25,416 | | 396 | | | 19,150 | | 1.8 | % | | 3.3 | % | | 100.0 | % |
Indianapolis, IN | | 1 | | | 21,639 | | 475 | | | 12,000 | | 1.5 | % | | 3.9 | % | | 100.0 | % |
Columbus, OH | | 2 | | | 21,459 | | 451 | | | 12,191 | | 1.5 | % | | 3.7 | % | | 100.0 | % |
Charlotte, NC | | 1 | | | 21,119 | | 472 | | | 14,800 | | 1.5 | % | | 3.9 | % | | 100.0 | % |
Chicago, IL | | 1 | | | 13,144 | | 189 | | | 9,200 | | 0.9 | % | | 1.6 | % | | 100.0 | % |
Kansas City, KS | | 1 | | | 10,271 | | 180 | | | 5,366 | | 0.7 | % | | 1.5 | % | | 100.0 | % |
Philadelphia, PA | | 1 | | | 7,990 | | 129 | | | 6,050 | | 0.6 | % | | 1.1 | % | | 100.0 | % |
| | | | | | | | | | | | | | | | | | | |
Total/Weighted Average | | 26 | | | 370,888 | | 6,988 | | | 190,228 | | 25.7 | % | | 57.7 | % | | 97.0 | % |
Retail Properties: | | | | | | | | | | | | | | | | | | | |
New England | | 25 | | | 415,826 | | 1,852 | | | 131,490 | | 28.8 | % | | 15.3 | % | | 97.3 | % |
Philadelphia, PA | | 1 | | | 103,300 | | 428 | | | 67,800 | | 7.1 | % | | 3.5 | % | | 99.3 | % |
Raleigh, NC | | 1 | | | 44,507 | | 144 | | | 26,200 | | 3.1 | % | | 1.2 | % | | 77.1 | % |
San Antonio, TX | | 1 | | | 31,774 | | 160 | | | 21,500 | | 2.2 | % | | 1.3 | % | | 100.0 | % |
Pittsburgh, PA | | 1 | | | 24,570 | | 103 | | | 16,000 | | 1.7 | % | | 0.9 | % | | 80.6 | % |
Jacksonville, FL | | 1 | | | 19,445 | | 73 | | | — | | 1.3 | % | | 0.6 | % | | 100.0 | % |
New Orleans, LA | | 1 | | | 3,483 | | 7 | | | 2,286 | | 0.2 | % | | 0.1 | % | | 100.0 | % |
Columbus, OH | | 1 | | | 3,212 | | 7 | | | 2,094 | | 0.2 | % | | 0.1 | % | | 100.0 | % |
Tampa Bay, FL | | 1 | | | 2,978 | | 9 | | | 2,018 | | 0.2 | % | | 0.1 | % | | 100.0 | % |
| | | | | | | | | | | | | | | | | | | |
Total/Weighted Average | | 33 | | | 649,095 | | 2,783 | | | 269,388 | | 44.9 | % | | 23.0 | % | | 96.2 | % |
Grand Total/Weighted Average (3) | | 73 | | $ | 1,445,763 | | 12,101 | | $ | 719,019 | | 100.0 | % | | 100.0 | % | | 95.3 | % |
| | | | | | | | | | | | | | | | | | | |
| (1) | Gross investment amount represents our accounting basis as reported on the face of our consolidated balance sheets as of December 31, 2008. |
31
| (2) | Occupancy rates are based on commenced leases as of December 31, 2008. |
| (3) | Excludes one held-for-sale property located in the Palm Beach market with a gross investment amount of approximately $3.3 million as of December 31, 2008. |
Lease Expirations
Our properties are typically leased to tenants for terms ranging from three to 20 years. As of December 31, 2008, the weighted average remaining term of our leases was approximately 9.5 years, based on annualized base rent, and 5.9 years, based on leased square footage. Following is a schedule of expiring leases for our consolidated operating properties by annual minimum rents as of December 31, 2008 and assuming no exercise of lease renewal options (amounts in thousands).
| | | | | | | | | | | |
| | | Lease Expirations | |
Year | | Annualized
Base
Rent (1) | | % | | | Net Rentable
Square Feet | | % | |
2009 (2) | | $ | 6,579 | | 6.6 | % | | 666 | | 5.8 | % |
2010 | | | 8,027 | | 8.1 | % | | 1,282 | | 11.2 | % |
2011 | | | 15,685 | | 15.7 | % | | 2,225 | | 19.4 | % |
2012 | | | 8,978 | | 9.0 | % | | 1,025 | | 8.9 | % |
2013 | | | 6,130 | | 6.2 | % | | 704 | | 6.1 | % |
2014 | | | 5,441 | | 5.5 | % | | 594 | | 5.2 | % |
2015 | | | 7,160 | | 7.2 | % | | 601 | | 5.2 | % |
2016 | | | 5,423 | | 5.4 | % | | 873 | | 7.6 | % |
2017 | | | 7,681 | | 7.7 | % | | 1,603 | | 14.0 | % |
2018 | | | 1,881 | | 1.9 | % | | 449 | | 3.9 | % |
Thereafter | | | 26,615 | | 26.8 | % | | 1,461 | | 12.8 | % |
| | | | | | | | | | | |
Total | | $ | 99,600 | | 100.0 | % | | 11,483 | | 100.0 | % |
| | | | | | | | | | | |
| (1) | Annualized base rent represents the average annual rent of leases in place as of December 31, 2008, based on their respective non-cancellable terms, as of December 31, 2008. |
| (2) | Includes leases that are on a month-to-month basis. |
32
None.
| ITEM 4. | SUBMISSION OF MATTERS TO A VOTE OF SECURITY HOLDERS |
None.
33
PART II
| ITEM 5. | MARKET FOR REGISTRANT’S COMMON EQUITY, RELATED STOCKHOLDER MATTERS AND ISSUER PURCHASES OF EQUITY SECURITIES |
There is no public market for shares of our common stock and we currently have no obligation or plans to apply for listing on any public trading market. In the future we may consider various forms of liquidity events including but not limited to (i) listing our common stock on a national securities exchange (or the receipt by our stockholders of securities that are listed on a national securities exchange in exchange for our common stock); (ii) our sale or merger in a transaction that provides our stockholders with a combination of cash and/or securities of a publicly traded company; and (iii) sale of all or substantially all of our real property, real estate securities assets and debt related investments for cash or other consideration. We presently intend to effect a liquidity event within 10 years from the date we commenced formal operations on April 3, 2006. However, there can be no assurance that we will effect a Liquidity Event within such time or at all. However, on a limited basis, stockholders may be able to redeem shares through our share redemption program described below in more detail.
Market Information
We commenced our initial public offering on January 27, 2006. Pursuant to the registration statement, we offered on a continuous basis up to $2.0 billion in shares of our common stock, 75% of which were offered to the public at a price of $10.00 per share, and 25% of which were offered pursuant to our distribution reinvestment plan at a price of $9.50 per share. Our initial public offering terminated as of the close of business on January 21, 2008, and as of such date approximately 118.2 million shares of our common stock were outstanding and held by a total of approximately 21,200 stockholders. Approximately 3.4 million shares were issued pursuant to our distribution reinvestment plan in connection with our initial public offering.
On June 11, 2007, we filed a registration statement for our follow-on public offering, which was declared effective on January 22, 2008. Pursuant to the registration statement, we are offering on a continuous basis up to $2.0 billion in shares of our common stock, 75% of which are offered to the public at a price of $10.00 per share, and 25% of which are offered pursuant to our distribution reinvestment plan at a price of $9.50 per share. As of March 23, 2009, we had sold approximately 47.5 million shares of our common stock to a total of approximately 8,100 stockholders in connection with our follow-on public offering.
As of March 23, 2009, we had sold in aggregate approximately 165.7 million shares of our common stock to a total of approximately 29,300 stockholders in connection with both of our public offerings. In each of our offerings, the offering price was arbitrarily determined by our board of directors. We reserve the right to reallocate the shares of common stock we are currently offering between the primary offering and our distribution reinvestment plan.
In order for Financial Industry Regulatory Authority (“FINRA”) members and their associated persons to have participated in the offering and sale of shares of common stock pursuant to our public offerings or to participate in any future offering of our shares, we are required pursuant to FINRA Rule 2710 (f) (2) (m) to disclose in each annual report distributed to stockholders a per share estimated value of the shares, the method by which it was developed and the date of the data used to develop the estimated value.
In addition, we must prepare annual statements of estimated share values to assist fiduciaries of retirement plans subject to the annual reporting requirements of the Employee Retirement Income Security Act of 1974 (“ERISA”) in the preparation of their reports relating to an investment in our shares. For these purposes, the estimated value of the shares was deemed to be $10.00 per share as of December 31, 2008. The basis for this valuation is the fact that, as of December 31, 2008, we were conducting a public offering of our shares at the price of $10.00 per share to third-party investors through arm’s length transactions.
However, there is no public trading market for our shares at this time and, if such a market did exist, there is no assurance that stockholders would be able to receive $10.00 per share for their shares of our common stock. Moreover, we have not performed an appraisal of our investments, principally our generally illiquid real property and debt related investments, which comprise substantially all of our net investment portfolio. As such, any estimated value of our shares at this time is not based upon an appraised value of our investments, nor does it reflect the impact of the recent adverse and severe changes in global economic and capital market conditions or the amount stockholders would receive if our assets were sold and the proceeds were distributed in a liquidation. In the normal course and in the absence of other factors affecting current and future values of our existing and prospective investments, our aggregate net asset value would generally be expected to be less than the proceeds of our public offerings due to the payment of fees and expenses related to the distribution of our shares and the acquisitions of assets and, therefore, our $10.00 per share public offering price may not be the best indicator of the value of shares purchased as a long-term, income-producing investment. In addition, we may conduct additional public offerings of our common stock. Prior to providing a liquidity event for our stockholders, our board of directors will determine the public offering price of our shares of common stock for future public offerings, which may or may not be the same as our current public offering price.
34
Distribution Reinvestment Plan
We maintain a distribution reinvestment plan for our stockholders to help facilitate investments in our shares of common stock. Our distribution reinvestment plan allows our stockholders to have cash otherwise distributable to them invested in additional shares of our common stock at a price equal to $9.50 per share. We may terminate the distribution reinvestment plan for any reason at any time upon 10 days’ prior written notice to participants. Participation in the plan may also be terminated with respect to any person to the extent that a reinvestment of distributions in shares of our common stock would cause the share ownership limitations contained in our charter to be violated.
Participants may acquire shares of our common stock pursuant to our distribution reinvestment plan until the earliest date upon which (i) all the common stock registered in our follow-on public offering or future offerings to be offered under our distribution reinvestment plan is issued, (ii) our follow-on public offering and any future offering pursuant to our distribution reinvestment plan terminates and we elect to deregister with the Commission the unsold amount of our common stock registered to be offered under our distribution reinvestment plan, or (iii) there is more than ade minimis amount of trading in shares of our common stock, at which time any registered shares of our common stock then available under our distribution reinvestment plan will be sold at a price equal to the fair value of the shares of our common stock, as determined by our board of directors by reference to the applicable sales price with respect to the most recent trades occurring on or prior to the relevant distribution date. In any case, the price per share will be equal to the then-prevailing market price, which shall equal the price on the national securities exchange on which such shares of common stock are listed at the date of purchase.
Share Redemption Program
We have established a share redemption program that provides our stockholders with limited interim liquidity. The share redemption program will be immediately terminated if our shares of common stock are listed on a national securities exchange, or if a secondary market is otherwise established.
After our stockholders have held shares of our common stock for a minimum of one year, our share redemption program may provide a limited opportunity for our stockholders to have their shares of common stock redeemed, subject to certain restrictions and limitations, at a price equal to or at a discount from the purchase price of the shares of our common stock being redeemed and the amount of the discount will vary based upon the length of time that our stockholders have held their shares of our common stock subject to redemption, as described in the following table.
| | | |
Share Purchase Anniversary | | Redemption Price as a
Percentage of Purchase Price | |
Less than 1 year | | No Redemption Allowed | |
1 year | | 92.5 | % |
2 years | | 95.0 | % |
3 years | | 97.5 | % |
4 years and longer | | 100.0 | % |
In the event that a stockholder seeks to redeem all of its shares of our common stock, shares of our common stock purchased pursuant to our distribution reinvestment plan may be excluded from the foregoing one-year holding period requirement at the discretion of the board of directors. In addition, for purposes of the one-year holding period, holders of OP Units who exchange their OP Units for shares of our common stock shall be deemed to have owned their shares as of the date they were issued their OP Units. The board of directors reserves the right in its sole discretion at any time and from time to time to (i) waive the one-year holding period in the event of the death or disability (as such term is defined in the Code) of a stockholder, as well as the annual limitation discussed below, (ii) reject any request for redemption for any reason or no reason, or (iii) reduce the number of shares of our common stock allowed to be purchased under the share redemption program. At any time we are engaged in an offering of shares of our common stock, the per share price for shares of our common stock redeemed under our redemption program will never be greater than the then-current offering price of our shares of our common stock sold in the primary offering.
35
We are not obligated to redeem shares of our common stock under the share redemption program. We presently limit the number of shares to be redeemed during any consecutive twelve month period to no more than five percent of the number of shares of common stock outstanding at the beginning of such twelve month period. The aggregate amount of redemptions under our share redemption program is not expected to exceed the aggregate proceeds received from the sale of shares pursuant to our distribution reinvestment plan. During the fourth quarter of the year ended December 31, 2008, we received redemption requests which, if fully honored, would have exceeded five percent of the number of shares of common stock outstanding at the beginning of the prior twelve month period. In response, our board of directors authorized the redemption of all shares requested for the fourth quarter of 2008. The total amount of shares redeemed in the fourth quarter of 2008 was approximately 3.9 million shares, which exceeded our five percent threshold by approximately 253,000 shares resulting in a redemption percentage of 5.2% of our common stock outstanding at the beginning of the applicable twelve month period. Notwithstanding the foregoing, the five percent limitation remains in effect. As of March 16, 2009, the last day for first quarter 2009 redemption requests to be submitted under our share redemption program, we had received requests to redeem approximately 6.1 million shares of common stock. Based on application of the five percent limitation, we are limited to redeeming approximately 853,000 shares. We, therefore, expect to redeem, on a pro rata basis, approximately 13.9% of the shares each shareholder requested to be redeemed on or before March 16, 2009 subject to the terms and conditions of our share redemption program.
To the extent that the aggregate proceeds received from the sale of shares pursuant to our distribution reinvestment plan are not sufficient to fund redemption requests pursuant to the five percent limitation outlined above, the board of directors may, in its sole discretion, choose to use other sources of funds to redeem shares of our common stock. Such sources of funds could include cash on hand, cash available from borrowings and cash from liquidations of securities investments as of the end of the applicable quarter, to the extent that such funds are not otherwise dedicated to a particular use, such as working capital, cash distributions to stockholders, purchases of real property, real estate securities or debt related investments, or redemption of OP Units. The board of directors may also increase the annual limit above five percent but, in any event, the number of shares of our common stock that we may redeem will be limited by the funds available from purchases pursuant to our distribution reinvestment plan, cash on hand, cash available from borrowings and cash from liquidations of securities investments as of the end of the applicable quarter.
The board of directors may, in its sole discretion, amend, suspend, or terminate the share redemption program at any time if it determines that the funds available to fund the share redemption program are needed for other business or operational purposes or that amendment, suspension or termination of the share redemption program is in the best interest of our stockholders. In addition, the board of directors may modify the share redemption program to redeem shares at the then-current net asset value per share (provided that any offering will then also be conducted at net asset value per share), as calculated in accordance with policies and procedures developed by our board of directors. If the board of directors decides to amend, suspend or terminate the share redemption program, we will provide stockholders with no less than 30 days’ prior written notice. Therefore, our stockholders may not have the opportunity to make a redemption request prior to any potential termination of our share redemption program.
36
In aggregate, as of December 31, 2008, we had redeemed approximately 6.2 million shares of common stock pursuant to our share redemption program for approximately $57.5 million, as described further in the table below.
| | | | | | | | | |
Month Ended, | | Total Number of
Shares Redeemed | | Average Price
of Share | | Total Number of
Shares Purchased as
Part of Publicly
Announced Plans or
Programs | | Maximum Number of
Shares that May Yet
Be Purchased Under
the Plan’s
Program (1) |
January 31, 2008 | | — | | $ | — | | — | | — |
February 29, 2008 | | — | | | — | | — | | — |
March 31, 2008 | | 473,762 | | | 9.22 | | 473,762 | | — |
April 30, 2008 | | — | | | — | | — | | |
May 31, 2008 | | — | | | — | | — | | |
June 30, 2008 | | 716,925 | | | 9.18 | | 716,925 | | — |
July 31, 2008 | | — | | | — | | — | | |
August 31, 2008 | | — | | | — | | — | | |
September 30, 2008 | | 971,374 | | | 9.28 | | 971,374 | | — |
October 31, 2008 | | — | | | — | | — | | — |
November 30, 2008 | | — | | | — | | — | | — |
December 31, 2008 | | 3,856,118 | | | 9.24 | | 3,856,118 | | — |
| | | | | | | | | |
Total | | 6,018,179 | | $ | 9.24 | | 6,018,179 | | 852,598 |
| | | | | | | | | |
| (1) | This represents the number of shares that could be redeemed for the three months ended March 31, 2009 without exceeding our five percent limitation discussed above. |
Holders
As of March 23, 2009, we had approximately 165.7 million shares of our common stock outstanding held by a total of approximately 29,300 stockholders in connection with our public offerings. As of March 23, 2009, we had approximately 7.2 million OP Units outstanding in connection with our Operating Partnership’s private placements.
Distributions
We have made and will continue to make distributions on a quarterly basis following the end of each calendar quarter. In connection with a distribution to our stockholders, our board of directors authorizes a quarterly distribution for a certain dollar amount per share of our common stock before or on the first day of each quarter. We then calculate each stockholder’s specific distribution amount for the quarter using daily record and declaration dates, and distributions begin to accrue on the date we mail a confirmation of subscription to our stockholders for shares of our common stock, subject to our acceptance of the stockholder’s subscription.
We are required to make distributions sufficient to satisfy the requirements for qualification as a REIT for federal income tax purposes. Generally, income distributed will not be taxable to us under the Code if we distribute at least 90% of our taxable income each year (computed without regard to the dividends paid deduction and our net capital gain). In addition, if we fail to distribute during each calendar year at least the sum of (a) 85% of our ordinary income for such year, (b) 95% of our capital gain net income for such year, and (c) any undistributed taxable income from prior periods, we will be subject to a 4% excise tax on the excess of the required distribution over the sum of (i) the amounts actually distributed by us, plus (ii) retained amounts on which we pay income tax at the corporate level. Distributions will be authorized at the discretion of the board of directors, in accordance with our earnings, cash flow and general financial condition. The board’s discretion will be directed, in substantial part, by its obligation to cause us to comply with the REIT requirements. Because we may receive income from interest or rents at various times during our fiscal year, distributions may not reflect our income earned in that particular distribution period and may be made in advance of actual receipt of funds in an attempt to make distributions relatively uniform. We are authorized to borrow money, issue new securities or sell assets in order to make distributions. There are no restrictions on the ability of the Operating Partnership to transfer funds to us.
37
The following table sets forth the distributions that had been paid and/or declared by us as of March 23, 2009.
| | | | | | | | |
Quarter | | Amount Declared
Per
Share/Unit(1) | | Annualized Amount
Per
Share/Unit(1) | | Payment Date |
2006 | | | | | | | | |
2nd Quarter 2006 | | $ | 0.1326 | | $ | 0.55 | | July 17, 2006 |
3rd Quarter 2006 | | $ | 0.1386 | | $ | 0.55 | | October 13, 2006 |
4th Quarter 2006 | | $ | 0.1512 | | $ | 0.60 | | January 12, 2007 |
2007 | | | | | | | | |
1st Quarter 2007 | | $ | 0.1479 | | $ | 0.60 | | April 16, 2007 |
2nd Quarter 2007 | | $ | 0.1496 | | $ | 0.60 | | July 16, 2007 |
3rd Quarter 2007 | | $ | 0.1512 | | $ | 0.60 | | October 11, 2007 |
4th Quarter 2007 | | $ | 0.1513 | | $ | 0.60 | | January 15, 2008 |
2008 | | | | | | | | |
1st Quarter 2008 | | $ | 0.1500 | | $ | 0.60 | | April 15, 2008 |
2nd Quarter 2008 | | $ | 0.1500 | | $ | 0.60 | | July 15, 2008 |
3rd Quarter 2008 | | $ | 0.1500 | | $ | 0.60 | | October 15, 2008 |
4th Quarter 2008 | | $ | 0.1500 | | $ | 0.60 | | January 15, 2009 |
2009 | | | | | | | | |
1st Quarter 2009 | | $ | 0.1500 | | $ | 0.60 | | April 15, 2009 (2) |
2nd Quarter 2009 | | $ | 0.1500 | | $ | 0.60 | | July 15, 2009 (2) |
| (1) | Assumes share of common stock was owned for the entire quarter. |
| (2) | Our board of directors authorized first quarter 2009 and second quarter 2009 distributions of $0.15 per share of common stock which will be payable to stockholders of record as of the close of business on each day during the periods, from January 1, 2009 through and including March 31, 2009 and from April 1, 2009 through and including June 30, 2009, respectively, prorated for the period of ownership. The payment dates for such distributions are expected to be April 15, 2009 and July 15, 2009, respectively. |
Equity Incentive Plan Information
We have adopted an equity incentive plan which we use to attract and retain qualified independent directors, employees, advisors and consultants providing services to us who are considered essential to our long-range success by offering these individuals an opportunity to participate in our growth through awards in the form of, or based on, our common stock. See “Item 10. Directors, Executive Officers and Corporate Governance” of this Annual Report on Form 10-K for additional details regarding our equity incentive plan.
| ITEM 6. | SELECTED FINANCIAL DATA |
The following table sets forth selected financial data relating to our historical financial condition and results of operations for the years ended December 31, 2008, 2007 and 2006, and for the period from April 11, 2005 (inception) through December 31, 2005. The financial data in the table is qualified in its entirety by, and should be read in conjunction with, “Item 7. Management’s Discussion and Analysis of Financial Condition and Results of Operations” and our consolidated financial statements and related notes in “Item 8. Financial Statements and Supplementary Data” of this Annual Report on Form 10-K. The amounts in the table are in thousands except per share and footnote information.
38
| | | | | | | | | | | | | | | |
| | | For the Year Ended December 31, | | | For the Period from
April 11, 2005
(Inception) through
December 31, 2005 |
| | | 2008 | | | 2007 | | | 2006 | | |
Operating Data: | | | | | | | | | | | | | | | |
Total revenue | | $ | 141,613 | | | $ | 95,066 | | | $ | 6,504 | | | $ | — |
Total operating expenses | | | (97,766 | ) | | | (62,639 | ) | | | (5,804 | ) | | | — |
Equity in earnings | | | 586 | | | | — | | | | — | | | | — |
Interest income | | | 11,751 | | | | 11,927 | | | | 1,259 | | | | * |
Interest expense | | | (45,112 | ) | | | (33,600 | ) | | | (2,076 | ) | | | — |
Gain (loss) on derivatives | | | (11,673 | ) | | | (557 | ) | | | — | | | | — |
Gain on extinguishment of debt | | | 9,309 | | | | — | | | | — | | | | — |
Other-than-temporary impairment on securities | | | (192,724 | ) | | | — | | | | — | | | | — |
Minority interests | | | 7,395 | | | | 868 | | | | 65 | | | | * |
| | | | | | | | | | | | | | | |
Net income (loss) from continuing operations | | | (176,621 | ) | | | 11,065 | | | | (52 | ) | | | * |
Income from discontinued operations, net of minority interest | | | 66 | | | | — | | | | — | | | | — |
Gain on dispositions of real estate interests, net of minority interest | | | 169 | | | | — | | | | — | | | | — |
| | | | | | | | | | | | | | | |
Net income (loss) | | $ | (176,386 | ) | | $ | 11,065 | | | $ | (52 | ) | | $ | — |
| | | | | | | | | | | | | | | |
| | | | | | | | | | | | | | | |
Common Stock Distributions | | | | | | | | | | | | | | | |
Common stock distributions declared | | $ | 84,023 | | | $ | 51,175 | | | $ | 4,090 | | | $ | — |
Common stock distributions declared per share | | $ | 0.60 | | | $ | 0.60 | | | $ | 0.42 | | | $ | — |
| | | | | | | | | | | | | | | |
Per Share Data: | | | | | | | | | | | | | | | |
Net income (loss) per common share: | | | | | | | | | | | | | | | |
Basic | | $ | (1.26 | ) | | $ | 0.13 | | | $ | (0.01 | ) | | $ | 0.01 |
Diluted | | $ | (1.26 | ) | | $ | 0.13 | | | $ | (0.02 | ) | | $ | 0.01 |
| | | | | | | | | | | | | | | |
Other Information: | | | | | | | | | | | | | | | |
Weighted average number of common shares outstanding: | | | | | | | | | | | | | | | |
Basic | | $ | 140,106 | | | $ | 85,473 | | | $ | 7,087 | | | | ** |
Diluted | | $ | 144,533 | | | $ | 85,493 | | | $ | 7,107 | | | | ** |
Balance Sheet Data: | | | | | | | | | | | | | | | |
Total assets | | $ | 2,123,578 | | | $ | 1,811,784 | | | $ | 452,971 | | | $ | 203 |
Total debt obligations | | $ | 734,880 | | | $ | 698,983 | | | $ | 84,450 | | | | — |
Total liabilities | | $ | 963,712 | | | $ | 891,969 | | | $ | 159,177 | | | | — |
Cash Flow Data: | | | | | | | | | | | | | | | |
Net cash provided by operating activities | | $ | 60,345 | | | $ | 31,772 | | | $ | 2,694 | | | | * |
Net cash used in investing activities | | $ | (127,225 | ) | | $ | (1,165,338 | ) | | $ | (320,426 | ) | | | — |
Net cash provided by financing activities | | $ | 315,567 | | | $ | 1,357,883 | | | $ | 385,047 | | | | — |
| ** | 200 shares outstanding. |
39
| ITEM 7. | MANAGEMENT’S DISCUSSION AND ANALYSIS OF FINANCIAL CONDITION AND RESULTS OF OPERATIONS |
This section of our Annual Report on Form 10-K provides an overview of what management believes to be the key elements for understanding (i) our company and how we manage our business, (ii) how we measure our performance and our operating results, (iii) our liquidity and capital resources, and (iv) the financial statements that follow in “Item 8. Financial Statements and Supplementary Data” of this Annual Report on Form 10-K.
Overview
Dividend Capital Total Realty Trust Inc. is a Maryland corporation formed on April 11, 2005 to invest in a diverse portfolio of real property and real estate related investments. As used herein, “the Company,” “we,” “our” and “us” refer to Dividend Capital Total Realty Trust Inc. and its consolidated subsidiaries and partnerships except where the context otherwise requires.
We operate in a manner intended to qualify as a real estate investment trust (“REIT”) for federal income tax purposes, commencing with the taxable year ended December 31, 2006, when we first elected REIT status. We utilize an Umbrella Partnership Real Estate Investment Trust (“UPREIT”) organizational structure to hold all or substantially all of our assets through our operating partnership, Dividend Capital Total Realty Operating Partnership, L.P. (the “Operating Partnership”). Furthermore, our Operating Partnership wholly owns a taxable REIT subsidiary, DCTRT Leasing Corp. (the “TRS”), through which we execute certain business transactions that might otherwise have an adverse impact on our status as a REIT if such business transactions were to occur directly or indirectly through the Operating Partnership.
The primary source of our revenue and earnings is comprised of (i) rent received from customers under long-term (generally three to ten years) operating leases at our properties, including reimbursements from customers for certain operating costs, (ii) interest and dividend payments from our investments in real estate securities and (iii) interest payments from our debt related investments. Our primary expenses include (i) rental expenses, (ii) depreciation and amortization expenses, (iii) general and administrative expenses, (iv) asset management fees and (v) interest expense.
We are an externally managed REIT and have no employees. Our day-to-day activities are managed by Dividend Capital Total Advisors LLC (the “Advisor”), an affiliate, under the terms and conditions of an advisory agreement (the “Advisory Agreement”). In addition, under the terms of certain dealer manager agreements, Dividend Capital Securities LLC (the “Dealer Manager”), an affiliate, serves as the dealer manager of our public and private offerings. The Advisor and its affiliates, including the Dealer Manager, receive various forms of compensation, reimbursements and fees for services relating to our public and private offerings and for the investment and management of our real estate assets.
The cornerstone of our investment strategy is to provide investors seeking a general real estate allocation with a broadly diversified portfolio of assets. Our targeted investments include:
| | 1. | Direct investments in real properties, consisting of office and office/R&D, industrial, retail, multifamily, hospitality and other properties, primarily located in North America; |
| | 2. | Investments in real estate securities, including securities issued by other real estate companies, CMBS and CRE-CDOs and similar investments; and |
| | 3. | Certain debt related investments, including originating and participating in whole mortgage loans secured by commercial real estate, B-notes, mezzanine debt and other related investments. |
40
As of December 31, 2008, we had total gross investments of approximately $1.6 billion (before accumulated depreciation of approximately $87.8 million), comprised of:
| | (1) | 73 operating properties located in 24 geographic markets in the United States, aggregating approximately 12.1 million net rentable square feet. Our operating real property portfolio includes an aggregate gross investment amount of approximately $1.4 billion and consists of: |
| | • | | 14 office and office/R&D properties located in nine geographic markets, aggregating approximately 2.3 million net rentable square feet, with an aggregate gross investment amount of approximately $425.8 million; |
| | • | | 26 industrial properties located in 13 geographic markets, aggregating approximately 7.0 million net rentable square feet, with an aggregate gross investment amount of approximately $370.9 million; and |
| | • | | 33 retail properties located in nine geographic markets, aggregating approximately 2.8 million net rentable square feet, with an aggregate gross investment amount of approximately $649.1 million. |
| | (2) | Approximately $52.4 million in real estate securities, including (a) preferred equity securities of various real estate operating companies and REITs with an aggregate fair value of approximately $31.6 million, and (b) CMBS and CRE-CDOs with an aggregate fair value of approximately $20.8 million. |
| | (3) | Approximately $106.4 million in debt related investments, including (a) investments in B-notes of approximately $51.9 million (b) investments in mezzanine debt of approximately $36.9 million and (c) an investment in an unconsolidated joint venture of approximately $17.5 million. |
Consistent with our investment strategy, we have three business segments: (i) real property, (ii) real estate securities and (iii) debt related investments. For a discussion of our business segments and the associated revenue and net operating income by segment, see Note 15 to our consolidated financial statements included in “Item 8. Financial Statements and Supplementary Data” of this Annual Report on Form 10-K.
Historically and for the near-term we expect to fund our investment activity through (i) proceeds from our public and private offerings, (ii) minority interest contributions, (iii) the issuance and assumption of debt obligations and (iv) cash on hand.
| | • | | Public and private offerings— Since our inception on April 11, 2005, we have raised equity capital through (i) selling shares of our common stock through our public offerings, (ii) reinvestment of dividends by our stockholders through our distribution reinvestment plan and (iii) through our Operating Partnership’s private placements. As of December 31, 2008, approximately 159.0 million shares of common stock were issued and outstanding for which we had received net proceeds of approximately $1.6 billion. As of December 31, 2008, our Operating Partnership had raised approximately $170.8 million of gross proceeds from the sale of fractional interests in certain properties. |
| | • | | Minority interest contributions— A component of our investment strategy includes entering into joint venture agreements with partners in connection with certain property acquisitions. With respect to these agreements, we generally contribute at least 75% of the required equity contribution for any given venture, and the respective joint venture partner contributes the remaining equity. As of December 31, 2008, joint venture partners had made gross equity contributions to certain of our consolidated joint ventures of approximately $35.3 million. |
| | • | | The issuance and assumption of debt obligations— As of December 31, 2008, we had approximately $719.0 million of mortgage notes and $15.9 million of other secured borrowings outstanding. |
| | • | | Cash on hand— As of December 31, 2008, we had approximately $540.3 million of cash on hand. |
Current Investment Focus and Opportunities
Despite the challenging economic conditions, we believe that significant opportunities will exist to deploy capital to acquire quality real properties in premier locations throughout the U.S., with the intention of owning and operating these properties over the long term. Many of these opportunities may become available as a result of debt refinancings coming due or other liquidity concerns for many industry participants, and the current market environment favors real estate investors with significant amounts of available cash who can provide no financing contingencies and more certainty of closing. Furthermore, the current credit market conditions may also create an opportunity to make debt related investments by lending money to experienced real estate owners at attractive rates and terms secured by quality collateral.
Principal Business Risks
In our view, there are several principal near-term business risks we face in achieving our business objectives.
41
| | • | | The first principal business risk is the impact that the current prolonged economic slowdown and severe recession could have on our operations. A continued recession and a severe deflationary environment could have a materially negative impact on our real property and debt related investments as a result of increased tenant bankruptcies and tenant defaults under their leases, generally lower demand for rentable space, as well as a potential oversupply of rentable space which could lead to no demand for rentable space or increased concessions, tenant improvement expenditures or reduced rental rates to maintain occupancies. |
| | • | | A second principal business risk is the possible continued impact that ongoing or intensified uncertainty and disruptions in the capital markets could have on the value of our real estate securities investments. To date, we have recorded significant other-than-temporary impairment charges related to our investment in real estate securities due to the disruptions and uncertainties in the capital markets, deterioration in credit and liquidity of issuers, and a variety of other factors, and if such conditions persist or worsen, we may be required to record additional other-than-temporary impairment charges in the future and/or potentially suffer further unrealized or realized losses with respect to these investments. In addition, the amount and timing of our cash flows from our real estate securities investments and our ability to sell such investments have been and may be further impacted by the uncertainty and disruptions in the capital markets. |
| | • | | A third principal business risk is our future ability to access additional debt financing at reasonable terms. The U.S. credit markets have experienced severe dislocations and liquidity disruptions which have caused credit spreads on prospective debt financings to widen considerably. The uncertainty in the credit markets could negatively impact our ability to access additional debt financing at reasonable terms, which may negatively affect investment returns on future acquisitions or our ability to make additional acquisitions consistent with our overall investment objectives. |
| | • | | A fourth principal business risk is our ability to continue to identify additional real property and debt related investments to maintain portfolio diversification across multiple dimensions and to provide consistent quarterly distributions to our stockholders that, in the future, we expect to be funded entirely by our operations. The number and type of real properties we may acquire and debt related investments we may invest in will depend upon real estate market conditions, the amount of proceeds we raise in our public and private offerings, conditions in the capital markets and other circumstances existing at the time of acquisition. The volatile and uncertain state of the current capital markets has resulted in generally lower transaction volume in the broader real estate market, as well as corresponding pricing and valuation uncertainties. To the extent that such disruptions and uncertainties continue, we may be delayed in our ability to deploy capital into investments that meet our investment criteria, which could have a dilutive effect on our results from operations as a result of higher cash balances that earn less than potential returns on investments in real properties and real estate related assets. |
| | • | | A fifth principal business risk is our ability to continue raising substantial funds in our public and private offerings. The volatile and uncertain state of the current capital markets and the economic recession has slowed our ability to raise funds in our public and private offerings. Continued or worsening capital market conditions could further impair our ability to raise funds in our public and private offerings. In addition, the current capital market conditions have caused and could continue to cause an increase in the amount of redemption requests that we receive, which may have a detrimental impact on our ability to raise additional funds from new investors due to potential concerns about the liquidity of a prospective investment in our shares. |
Significant Transactions During the Year Ended December 31, 2008
Investment Activity
Real Property Acquisitions
The following table describes our real property acquisitions made during the year ended December 31, 2008 (dollar and square footage amounts in thousands).
42
| | | | | | | | | | | | | | | | |
Property | | Market | | Property
Type | | Number of
Properties | | Date of
Acquisition | | Gross
Investment
Amount (1) | | Net Rentable
Square Feet | | Occupancy
(2) | |
2008 real property acquisitions | | | | | | | | | | | | | | | | |
Austin-Mueller Healthcare | | Austin, TX | | Office | | 1 | | 12/23/08 | | $ | 44,974 | | 156 | | 100.0 | % |
Eden Prairie Office Center | | Minneapolis, MN | | Office | | 1 | | 10/03/08 | | | 29,430 | | 107 | | 100.0 | % |
Millennium Financial Center | | Denver, CO | | Office | | 1 | | 10/01/08 | | | 52,567 | | 134 | | 97.9 | % |
National Restaurant Portfolio I | | Various (3) | | Retail | | 4 | | 09/17/08 | | | 13,019 | | 31 | | 100.0 | % |
Riverport Industrial Portfolio | | Louisville, KY | | Industrial | | 5 | | 09/17/08 | | | 31,229 | | 900 | | 96.9 | % |
Westport | | Central, PA | | Industrial | | 1 | | 01/09/08 | | | 29,457 | | 502 | | 100.0 | % |
| | | | | | | | | | | | | | | | |
Total 2008 real property acquisitions | | | | | | 13 | | | | $ | 200,676 | | 1,830 | | 98.3 | % |
| (1) | Gross investment amount represents our accounting basis as reported on the face of our consolidated financial statements as of December 31, 2008. |
| (2) | Occupancy rates are based on commenced leases as of December 31, 2008. |
| (3) | Includes properties located throughout the United States, including (i) New Orleans, Louisiana, (ii) Columbus, Ohio, (iii) Tampa Bay, Florida and (iv) Palm Beach, Florida. This amount does not include one property acquired by us as part of the National Restaurant Portfolio I on September, 17, 2008 that was disposed of on December 24, 2008. This property had a gross investment amount of approximately $5.1 million at disposition. In addition, the above amount includes one asset, located in Palm Beach, Florida, which is currently held for sale. |
Real Property Disposition
On December 24, 2008, we disposed of one retail property located in the Palm Springs, California market to a third-party buyer for gross proceeds of approximately $5.7 million, which had a gross investment value of approximately $5.1 million at disposition. We recorded a gain of approximately $169,000 on this disposition. The total cash proceeds from the disposition were used to simultaneously repay the outstanding principal balance of a mortgage loan related to the disposed property and to repay the majority of the outstanding principal balance of a related loan that is secured by a retail property located in Palm Beach, Florida that is currently held for sale. Our Advisor received an asset management fee associated with the sale of this property of approximately $51,000.
Debt Related Investments
Greensboro Park Mezzanine Loan—On May 20, 2008, we acquired the Greensboro Park Mezzanine Loan for a gross investment amount of approximately $16.7 million, which includes an approximate $165,000 acquisition fee payable to our Advisor. The Greensboro Park Mezzanine Loan is secured by an equity interest held by the owner of an office property located in the Washington, D.C. market. We acquired the loan at a $1.8 million discount to par value. The Greensboro Park Mezzanine Loan matures in June 2012. We paid for the Greensboro Park Mezzanine Loan through a combination of net proceeds from our public and private offerings and debt financing (see Note 6 in Item 8 of this Annual Report on Form 10-K for discussion of this debt financing).
Liberty Avenue Debt Investment—On September 25, 2008, we acquired the Liberty Avenue Debt Investment, an indirect debt investment structured as a redeemable preferred equity investment through a joint venture arrangement. We acquired the Liberty Avenue Debt Investment for a gross investment amount of approximately $17.3 million, which represents an 80% interest in the joint venture. Our investment amount includes an acquisition fee paid to our Advisor of approximately $170,000 based on our proportional interest. The Liberty Avenue Debt Investment relates to an office property located in Pittsburgh, Pennsylvania and matures in May 2010. We have an option to purchase the underlying property in 2010.
Mortgage Note and Mezzanine Loan Repayment—During the year ended December 31, 2008, we received full repayment of one of our debt related investments, which included both a mortgage note portion and a mezzanine loan portion associated with a real estate development project located in the New York City market. At the time of repayment, the mortgage note and the mezzanine loan had an outstanding balance of $28.0 million and $7.3 million, respectively.
43
Financing Activity
Loan Extinguishment
During the year ended December 31, 2008, we fully repaid floating-rate debt that had been previously secured by 17 retail properties that had been acquired as part of our New England Retail Portfolio purchased in August and October 2007. We repaid the total outstanding aggregate principal balance of approximately $121.9 million for an amount of approximately $111.5 million, representing an approximate $10.4 million discount to par, resulting in a net gain of approximately $9.3 million, after $1.1 million in unamortized deferred loan costs.
Mortgage Debt Financing
During the year ended December 31, 2008, we obtained or assumed approximately $184.8 million in mortgage debt financing, which was comprised of ten separate collateralized mortgages loans secured by 21 of our real properties. As of December 31, 2008, we had made principal repayments on these mortgage loans in the amount of approximately $5.8 million. The weighted average stated interest rate on these financings was approximately 6.4%. (See Note 6 in Item 8 of this Annual Report on Form 10-K for additional details of these mortgage loans).
Other Secured Borrowings
To partially finance the acquisition of the Greensboro Park Mezzanine Loan, we obtained a floating-rate loan with an outstanding principal balance as of December 31, 2008 of approximately $10.2 million that bears interest based on a spread at 1.50% over the one-month LIBOR rate. The loan was used to acquire the Greensboro Park Mezzanine Loan debt related investment and has a maturity date that is coterminous with the maturity of the Greensboro Park Mezzanine Loan, which occurs in 2012. In addition, we repaid approximately $31.6 million of our other secured borrowings during the year ended December 31, 2008.
Equity Capital Raise from Public and Private Offerings
During the year ended December 31, 2008, we issued approximately 43.7 million shares of our common stock in connection with our two public offerings, for net proceeds of approximately $394.5 million. In addition, during the year ended December 31, 2008, our Operating Partnership raised approximately $64.9 million from the sale of fractional interests in five properties.
Acquisition of Fractional Interests
During the year ended December 31, 2008, the Operating Partnership exercised its option to acquire, at fair value, approximately $65.9 million of fractional interests in six properties for a combination of (i) approximately 6.5 million OP Units, issued at a price of $10.00 per OP Unit, representing $64.9 million of the aggregate purchase price of such properties and (ii) approximately $1.1 million in cash.
How We Measure Our Performance
Funds From Operations
We believe that net income, as defined by GAAP, is the most appropriate earnings measure. However, we consider funds from operations (“FFO”) to be a useful supplemental measure of our operating performance. Our discussion and calculation of our FFO reconciled from net income (loss) for the three months and years ended December 31, 2008 and 2007 will be separately presented in our announcement of fourth quarter 2008 financial and operating results prior to our fourth quarter 2008 earnings conference call.
Net Operating Income (“NOI”)
We use NOI as a supplemental financial performance measure because NOI reflects the specific operating performance of our real properties, real estate securities, and debt related investments and excludes certain items that are not considered to be controllable in connection with the management of each property, such as interest income, depreciation and amortization, general and administrative expenses, asset management fees, interest expense and minority interests. However, NOI should not be viewed as an alternative measure of our financial performance as a whole, since it does exclude such items which could materially impact our results of operations. Further, our NOI may not be comparable to that of other real estate companies, as they may use different methodologies for calculating NOI. Therefore, we believe net income, as defined by GAAP, to be the most appropriate measure to evaluate our overall financial performance.
Our Operating Results
For the years ended December 31, 2008 and 2007, we had a net loss of $176.4 million and net income of $11.1 million, respectively. The results of our operations for the year ended December 31, 2008 was substantially different than our results for the same period in 2007, primarily as a result of more investing and financing activities and as a result of the following transactions that were recorded in 2008: (i) an other-than-temporary impairment charge of $192.7 million related to our investments in real estate securities, (ii) a loss of $11.7 million on derivatives related to our hedging activities and (iii) a gain of $9.3 million related to the extinguishment of debt. The following series of tables and discussions describe in detail our results of operations, including those items specifically mentioned above, for the years ended December 31, 2008 and 2007.
44
Year Ended December 31, 2008 Compared to the Year Ended December 31, 2007
The following table illustrates the changes in rental revenues, rental expenses, net operating income, other income and other expenses for the year ended December 31, 2008 compared to the same period in 2007. Our same store portfolio includes all operating properties that we owned for the entirety of both the current and prior year reporting periods. The same store portfolio includes 14 properties acquired prior to December 31, 2006, comprising approximately 3.2 million square feet. A discussion of these changes follows the table (in thousands).
| | | | | | | | | | | | |
| | | For the Year Ended December 31, | |
| | | 2008 | | | 2007 | | | $ Change | |
Revenues | | | | | | | | | | | | |
Rental revenue - same store | | $ | 25,582 | | | $ | 25,670 | | | $ | (88 | ) |
Rental revenue - 2008/2007 acquisitions | | | 89,088 | | | | 44,754 | | | | 44,334 | |
| | | | | | | | | | | | |
Total rental revenue | | | 114,670 | | | | 70,424 | | | | 44,246 | |
Securities income | | | 17,567 | | | | 15,691 | | | | 1,876 | |
Debt related income (1) | | | 9,962 | | | | 8,951 | | | | 1,011 | |
| | | | | | | | | | | | |
Total revenues | | | 142,199 | | | | 95,066 | | | | 47,133 | |
Rental Expenses | | | | | | | | | | | | |
Same store | | | 6,574 | | | | 6,522 | | | | 52 | |
2008/2007 acquisitions | | | 23,048 | | | | 12,268 | | | | 10,780 | |
| | | | | | | | | | | | |
Total rental expenses | | | 29,622 | | | | 18,790 | | | | 10,832 | |
Net Operating Income (2) | | | | | | | | | | | | |
Real property - same store | | | 19,008 | | | | 19,148 | | | | (140 | ) |
Real property - 2008/2007 acquisitions | | | 66,040 | | | | 32,486 | | | | 33,554 | |
| | | | | | | | | | | | |
Total real property | | | 85,048 | | | | 51,634 | | | | 33,414 | |
Securities income | | | 17,567 | | | | 15,691 | | | | 1,876 | |
Debt related income (1) | | | 9,962 | | | | 8,951 | | | | 1,011 | |
| | | | | | | | | | | | |
Total net operating income | | | 112,577 | | | | 76,276 | | | | 36,301 | |
Other Operating Expenses | | | | | | | | | | | | |
Depreciation and amortization expense | | | 52,313 | | | | 31,358 | | | | 20,955 | |
General and administrative expenses | | | 4,232 | | | | 3,784 | | | | 448 | |
Asset management fees, related party | | | 11,599 | | | | 8,707 | | | | 2,892 | |
| | | | | | | | | | | | |
Total other operating expenses | | | 68,144 | | | | 43,849 | | | | 24,295 | |
Other Income (Expenses) | | | | | | | | | | | | |
Interest income | | | 11,751 | | | | 11,927 | | | | (176 | ) |
Interest expense | | | (45,112 | ) | | | (33,600 | ) | | | (11,512 | ) |
Loss on derivatives | | | (11,673 | ) | | | (557 | ) | | | (11,116 | ) |
Gain on extinguishment of debt | | | 9,309 | | | | — | | | | 9,309 | |
Other-than-temporary impairment on securities | | | (192,724 | ) | | | — | | | | (192,724 | ) |
| | | | | | | | | | | | |
Total other income (expenses) | | | (228,449 | ) | | | (22,230 | ) | | | (206,219 | ) |
Minority Interests | | | 7,395 | | | | 868 | | | | 6,527 | |
| | | | | | | | | | | | |
Net Income (Loss) From Continuing Operations | | $ | (176,621 | ) | | $ | 11,065 | | | $ | (187,686 | ) |
| | | | | | | | | | | | |
| (1) | Includes equity-in-earnings from an unconsolidated joint venture of approximately $586,000 for the year ended December 31, 2008. We did not have any equity-in-earnings from unconsolidated joint ventures during the year ended December 31, 2007. |
| (2) | For a discussion as to why we view net operating income to be an appropriate supplemental performance measure, and a reconciliation of our net operating income for the years ended December 31, 2008 and 2007 to our reported “Net income (loss)” for the years ended December 31, 2008 and 2007, see Note 15 to our consolidated financial statements included in “Item 8. Financial Statements” of this Annual Report on Form 10-K. |
Rental Revenue
Rental revenue increased approximately $44.2 million to approximately $114.7 million for the year ended December 31, 2008, compared to approximately $70.4 million for the same period in 2007. This increase is primarily attributable to our acquisition of 59 additional operating real properties subsequent to December 31, 2006. Same store rental revenues decreased by approximately $88,000, or 0.3%, for the year ended December 31, 2008 compared to the same period in 2007 primarily due to a decline in rental recovery revenue of approximately $377,000 partially offset by an increase in base rental revenue of approximately 1.2%, or $227,000, and other revenue items.
45
Securities Income
Securities income increased $1.9 million to $17.6 million for year ended December 31, 2008, compared to $15.7 million for the same period in 2007. This increase is primarily attributable to our acquisition of additional real estate securities with an investment amount of $207.8 million subsequent to December 31, 2006. The increase in securities income due to increased investments was partially offset by an average decline in the one-month LIBOR rate over the periods, which impacts interest income on floating-rate securities investments. As of December 31, 2008 and 2007 the one-month LIBOR rate was approximately 0.44% and 4.60%, respectively. For both December 31, 2008 and 2007, approximately 45.7% of our real estate securities, based on amounts invested, were floating rate securities. Furthermore, issuers of two of our preferred equity securities issuers indefinitely suspended their respective preferred dividends during the three months ended December 31, 2008, resulting in a decrease in securities income of approximately $628,000 compared to the year ended December 31, 2007.
Debt Related Income
Debt related income increased $1.0 million, to $10.0 million for the year ended December 31, 2008, compared to $9.0 million for the same period in 2007. The increase is primarily attributable to our investment of $78.1 million in debt related investments, net of principal repayments and amortization, subsequent to December 31, 2006. The increase in debt related income due to investments was offset by a general decline in the one-month LIBOR rate, which impacts interest income on floating-rate debt related investments. Approximately 28.6% and 83.0% of our debt related investments earned interest based on a floating-rate as of December 31, 2008 and 2007, respectively.
Rental Expenses
Rental expenses increased approximately $10.8 million to approximately $29.6 million for the year ended December 31, 2008, from approximately $18.8 million for the same period in 2007. This increase is primarily attributable to our acquisition of 59 additional operating real properties subsequent to December 31, 2006. Same store rental expenses increased by approximately $52,000, or 0.8%, for the year ended December 31, 2008 as compared to the same period in 2007, due primarily to increases in bad debt expense of approximately $226,000 partially offset by a decrease in repair and maintenance and insurance expenses of approximately $191,000.
Other Operating Expenses
Depreciation and Amortization Expense
Depreciation and amortization expense increased $21.0 million to $52.3 million for the year ended December 31, 2008, compared to approximately $31.4 million for the same period in 2007. This increase is primarily attributable to our acquisition of 59 additional operating real properties subsequent to December 31, 2006.
General and Administrative Expenses
General and administrative expenses increased approximately $448,000 to $4.2 million for the year ended December 31, 2008, from $3.8 million for the same period in 2007. This increase is primarily attributable to growth in assets and stockholders, including increased state and local taxes, organizational costs, terminated acquisition costs, audit fees, and other general overhead expenses.
Asset Management Fees, Related Party
Asset management fees paid to our Advisor increased as a result of additional investments held during the year ending December 31, 2008 compared to the same period in 2007. During the year ended December 31, 2008, our Advisor earned $11.6 million in asset management fees, which was comprised of (i) real property asset management fees of $9.0 million associated with 75 real properties (including one disposed property and one property held for sale), (ii) real estate securities asset management fees of $1.5 million and (iii) debt related asset management fees of $1.1 million. During the same period in 2007, our Advisor earned $8.7 million in asset management fees, which was comprised of (i) real property asset management fees of $5.9 million associated with 61 real properties, (ii) real estate securities asset management fees of $1.9 million and (iii) debt related asset management fees of $933,000.
46
Other Income (Expenses)
Interest Income
Interest income decreased $176,000 to $11.8 million for the year ended December 31, 2008, from $11.9 million for the same period in 2007. This decrease is attributable to lower average yields on our floating-rate interest bearing bank accounts and money market mutual fund investments, which were partially offset by increased cash balances.
Interest Expense
Interest expense increased $11.5 million to $45.1 million for the year ended December 31, 2008, from $33.6 million for the same period in 2007. During the year ended December 31, 2008, interest expense resulted primarily as follows: (i) $37.1 million related to 33 mortgage notes secured by real properties, (ii) $6.8 million of interest expense on our financing obligations associated with our Operating Partnership’s private placement and (iii) $1.2 million for other secured borrowings, including our securities margin account and loan secured by the Greensboro Park Mezzanine Loan. During the same period in 2007, interest expense resulted primarily as follows: (i) $26.5 million related to 23 mortgage notes secured by real properties, (ii) $5.2 million of interest expense on our financing obligations associated with our Operating Partnership’s private placement, (iii) $1.0 million for borrowings on our REPO facility, which was terminated in August 2007 and (iv) $963,000 related to borrowings on our securities margin account. Our total weighted average borrowings, including financing obligations, increased by 46.8% to $767.2 million in 2008 from $522.5 million for the same period in 2007.
Loss on Derivatives
Loss on derivatives increased $11.1 million to $11.7 million for the year ended December 31, 2008, from $557,000 for the same period in December 31, 2007. Approximately $9.5 million was reclassified from other accumulated comprehensive income (loss) to loss on derivatives based on our determination that it was no longer probable that previously forecasted issuances of fixed-rate debt related to a $111.6 million portion of our LIBOR-based forward starting swaps would be issued within the timeframe specified in its corresponding hedge designation memorandum. In addition to this charge, hedge ineffectiveness on cash flow hedges of approximately $2.1 million was recorded primarily due to a change in the forecasted dates for debt issuances hedged by our forward starting swaps. During the same period in 2007, we incurred approximately $557,000 in losses related to derivative instrument activity primarily due to a change in the forecasted dates for debt issuances hedged by forward starting swaps and due to the impact that movements in the one-month LIBOR rate had on our undesignated zero cost collar.
Gain on Extinguishment of Debt
During the year ended December 31, 2008, we fully repaid floating-rate debt that had been previously secured by 17 retail properties that had been acquired as part of our New England Retail Portfolio purchased in August and October of 2007. We repaid the total outstanding aggregate principal balance of approximately $121.9 million in the amount of approximately $111.5 million, representing an approximate $10.4 million discount to par, resulting in a gain of approximately $9.3 million, net of $1.1 million in unamortized deferred loan costs.
Other-than-Temporary Impairment on Securities
During the year ended December 31, 2008, we recorded other-than-temporary impairment charges totaling approximately $192.7 million, comprised of an impairment charge of $69.7 million related to our preferred equity securities and $123.0 million related to our CRE-CDO and CMBS securities, which is reflected in the accompanying consolidated statement of operations. See Note 4 to our consolidated financial statements included in “Item 8. Financial Statements” of this Annual Report on Form 10-K for further discussion of this charge.
Year Ended December 31, 2007 Compared to the Year Ended December 31, 2006
We did not own any properties as of January 1, 2006. As a result, we did not have a same store portfolio for the year ended December 31, 2006 that would be comparable to the year ended December 31, 2007. The analysis below discusses fluctuations in our results from operations for the year ended December 31, 2007 versus the same period in 2006. In addition, as a result of the acquisition of real properties, real estate securities and debt related investments discussed previously, and based upon the fact that we did not formally commence business operations until June 2006, the results of our operations for the year ended December 31, 2007, reflect significant increases as compared to the results of our operations for the year ended December 31, 2006.
47
| | | | | | | | | | | | |
| | | For the Year Ended December 31, | |
| | | 2007 | | | 2006 | | | $ Change | |
Revenues | | | | | | | | | | | | |
Rental revenue - same store | | $ | — | | | $ | — | | | $ | — | |
Rental revenue - 2007/2006 acquisitions | | | 70,424 | | | | 5,385 | | | | 65,039 | |
| | | | | | | | | | | | |
Total rental revenue | | | 70,424 | | | | 5,385 | | | | 65,039 | |
Securities income | | | 15,691 | | | | 853 | | | | 14,838 | |
Debt related income | | | 8,951 | | | | 238 | | | | 8,713 | |
Gain on sale of securities | | | — | | | | 28 | | | | (28 | ) |
| | | | | | | | | | | | |
Total revenues | | | 95,066 | | | | 6,504 | | | | 88,562 | |
Rental Expenses | | | | | | | | | | | | |
Same store | | | — | | | | — | | | | — | |
2007/2006 acquisitions | | | 18,790 | | | | 1,456 | | | | 17,334 | |
| | | | | | | | | | | | |
Total rental expenses | | | 18,790 | | | | 1,456 | | | | 17,334 | |
Net Operating Income (1) | | | | | | | | | | | | |
Real property - same store | | | — | | | | — | | | | — | |
Real property - 2007/2006 acquisitions | | | 51,634 | | | | 3,929 | | | | 47,705 | |
| | | | | | | | | | | | |
Total real property | | | 51,634 | | | | 3,929 | | | | 47,705 | |
Securities income | | | 15,691 | | | | 881 | | | | 14,810 | |
Debt related income | | | 8,951 | | | | 238 | | | | 8,713 | |
| | | | | | | | | | | | |
Total net operating income | | | 76,276 | | | | 5,048 | | | | 71,228 | |
Other Operating Expenses | | | | | | | | | | | | |
Depreciation and amortization expense | | | 31,358 | | | | 2,321 | | | | 29,037 | |
General and administrative expenses | | | 3,784 | | | | 1,305 | | | | 2,479 | |
Asset management fees, related party | | | 8,707 | | | | 722 | | | | 7,985 | |
| | | | | | | | | | | | |
Total other operating expenses | | | 43,849 | | | | 4,348 | | | | 39,501 | |
Other Income (Expenses) | | | | | | | | | | | | |
Interest income | | | 11,927 | | | | 1,259 | | | | 10,668 | |
Interest expense | | | (33,600 | ) | | | (2,076 | ) | | | (31,524 | ) |
Loss on derivatives | | | (557 | ) | | | — | | | | (557 | ) |
| | | | | | | | | | | | |
Total other income (expenses) | | | (22,230 | ) | | | (817 | ) | | | (21,413 | ) |
Minority Interests | | | 868 | | | | 65 | | | | 803 | |
| | | | | | | | | | | | |
Net Income (Loss) From Continuing Operations | | $ | 11,065 | | | $ | (52 | ) | | $ | 11,117 | |
| | | | | | | | | | | | |
| (1) | For a discussion as to why we view net operating income to be an appropriate supplemental performance measure, and a reconciliation of our net operating income for the years ended December 31, 2008 and 2007 to our reported “Net income (loss)” for the years ended December 31, 2008 and 2007, see Note 15 to our consolidated financial statements included in “Item 8. Financial Statements” of this Annual Report on Form 10-K. |
Rental Revenue
Rental revenue increased $65.0 million to $70.4 million for the year ended December 31, 2007, from $5.4 million for the same period in December 31, 2006. This increase was primarily attributable to our acquisition of 47 operating real properties during 2007 and 14 operating real properties during the period from June 2006 through December 2006.
Securities Income
Securities income increased $14.8 million to $15.7 million for the year ended December 31, 2007, from $881,000 for the same period in December 31, 2006. This increase was primarily attributable to our acquisition of approximately $199.6 million and $47.2 million in various preferred equity securities and CMBS and CRE-CDO investments during 2007 and 2006, respectively.
48
Debt Related Income
Debt related income increased $8.7 million to $9.0 million for the year ended December 31, 2007, from $238,000 for the same period in December 31, 2006. This increase was primarily attributable to our acquisition of approximately $88.5 million and $28.3 million in various real estate-secured mortgage notes, participations in mortgage loans, B-notes and mezzanine debt investments during 2007 and 2006, respectively.
Rental Expenses
Rental expenses increased $17.3 million to $18.8 million for the year ended December 31, 2007, from $1.5 million for the same period in December 31, 2006. This increase was primarily attributable to our acquisition of 47 operating real properties during 2007 and 14 operating real properties during the period from June 2006 through December 2006.
Other Operating Expenses
Depreciation and Amortization Expense
Depreciation and amortization expense increased $29.0 million to $31.4 million for the year ended December 31, 2007, from $2.3 million for the same period in December 31, 2006. This increase was primarily attributable to our acquisition of 47 operating real properties during 2007 and 14 operating real properties during the period from June 2006 through December 2006.
General and Administrative Expenses
General and administrative expenses increased $2.5 million to $3.8 million for the year ended December 31, 2007, from $1.3 million for the year ended December 31, 2006. This increase was primarily attributable to increased general corporate expenses primarily as a result of our growth in assets and stockholders.
Asset Management Fees, Related Party
Asset management fees paid to related parties increased $8.0 million to $8.7 million for the year ended December 31, 2007, from $722,000 for the same period in December 31, 2006. During the year ended December 31, 2007, our Advisor earned approximately $8.7 million in asset management fees, which was comprised of (i) real property asset management fees of approximately $5.9 million associated with 61 real properties, (ii) real estate securities asset management fees of approximately $1.9 million and (iii) debt related asset management fees of approximately $933,000. During the year ended December 31, 2006, our Advisor earned approximately $722,000 in asset management fees, which was comprised of (i) real property asset management fees of approximately $542,000 associated with 14 real properties, (ii) real estate securities asset management fees of approximately $139,000 and (iii) debt related asset management fees of approximately $41,000.
For a detailed discussion of the asset management fees we pay to our Advisor, see Note 13 to our consolidated financial statements included in “Item 8. Financial Statements and Supplementary Data” of this Annual Report on Form 10-K.
Other Income (Expenses)
Interest Income
Interest income increased $10.7 million to $11.9 million for the year ended December 31, 2007, from $1.3 million for the same period in December 31, 2006. This increase was attributable to increased cash balances being held in interest bearing bank accounts and money market mutual funds investments.
Interest Expense
Interest expense increased $31.5 million to $33.6 million for the year ended December 31, 2007, from $2.1 million for the same period in December 31, 2006. Interest expense during the year ended December 31, 2007 resulted primarily from (i) $26.5 million related to 23 mortgage notes secured by real properties, (ii) $5.2 million of interest expense on our financing obligations associated with our Operating Partnership’s private placement, (iii) $1.0 million for borrowings on our REPO facility, which was terminated in August 2007 and (iv) $963,000 related to borrowings on our securities margin account. Interest expense during the year ended December 31, 2006 resulted from the issuance of mortgage notes associated with the acquisition of four real properties during the period from June 2006 through December 2006. Our total weighted average borrowings, including financing obligations, increased to $522.5 million in 2007 from $40.2 million for the same period in 2006.
49
Loss on Derivatives
During the year ended December 31, 2007, we incurred approximately $557,000 in losses related to derivative instrument activity primarily due to a change in the forecasted dates for debt issuances hedged by forward starting swaps and due to the impact that movements in the one-month LIBOR rate had on our undesignated zero cost collar. We did not record any losses related to derivative instrument activity during the year ended December 31, 2006.
Liquidity and Capital Resources
Liquidity Outlook
Although the credit markets continue to be extremely constrained in the real estate sector as a result of the liquidity constraints of major lending institutions and other traditional sources of debt capital, we believe that our sources of capital are adequate to meet our short-term and long-term liquidity requirements. We believe that our existing cash balances, prospective additional net proceeds from our public and private offerings, prospective debt incurrences and assumptions, and cash flows from operations will be sufficient to satisfy our liquidity and capital requirements for the next twelve months. Our capital requirements over the next twelve months include, but are not limited to, operating expenses, distribution payments, redemption payments, acquisitions of real property, real estate securities and debt related investments, settlements of derivative instruments and debt service payments, including debt maturities of approximately $41.8 million, all of which is subject to certain extension options.
Recent global market and economic conditions have been unprecedented, challenging and unpredictable with significantly tighter credit and declining economic growth through the fourth quarter of 2008. These conditions have resulted in significant declines in the liquidity and value of our investments in real estate securities. Currently, the market for CMBS and CRE-CDO securities is generally illiquid and inactive. While we have the ability and intent to hold our investments in CMBS and CRE-CDO securities until their respective maturity dates, the currently illiquid nature of this market could inhibit our ability to potentially utilize these investments as a source of liquidity either through the sale of these securities or as collateral for a potential borrowing facility. Further, the significant decline in the values of our investments in preferred equity securities has caused and may continue to cause us to post cash collateral to satisfy margin requirements on our securities margin account. As of December 31, 2008, we had repaid approximately $34.3 million to satisfy these margin requirements, resulting in an outstanding balance as of December 31, 2008 on our securities margin account of approximately $5.7 million.
As of December 31, 2008, we had approximately $540.3 million of cash compared to $291.6 million as of December 31, 2007. The following discussion summarizes the sources and uses of our cash during the year ended December 31, 2008 that resulted in the net cash increase of approximately $248.7 million.
Operating Activities
Net cash provided by operating activities was approximately $60.3 million for the year ended December 31, 2008, which represents an increase of approximately $28.6 million compared to net cash provided by operating activities of approximately $31.8 million for the same period in 2007. This was primarily due to increased cash flow from our investments as a result of investment activity from January 2007 through December 2008. This was partially offset by increased rental expense, asset management fees and interest expense as a result of our investment and financing activity from January 2007 through December 2008.
Investing Activities
Net cash used in investing activities decreased approximately $1.0 billion to approximately $127.2 million for the year ended December 31, 2008 from approximately $1.2 billion for the same period in 2007. This decrease was primarily due to significant decreases in investment activity in real property, real estate securities and debt related investments. Cash used for investing in real properties decreased approximately $746.9 million to approximately $136.1 million for the year ended December 31, 2008 from approximately $883.0 million used during the same period in 2007. In addition, cash used for investing in real estate securities decreased approximately $207.9 million for the year ended December 31, 2008 from approximately $207.9 million for the same period in 2007 since we did not invest in any real estate securities in 2008. Further, cash used for investing in debt related investments decreased approximately $79.4 million to approximately $9.1 million for the year ended December 31, 2008 from approximately $88.5 million during the same period in 2007.
50
Real Property Acquisitions
During the year ended December 31, 2008, we acquired 13 real properties for a total gross investment amount of approximately $200.7 million. These properties were acquired using a combination of (i) net proceeds from our public and private offerings, (ii) debt financing, (iii) minority interest contributions, and (iv) available cash. For additional detail regarding these acquisitions see our section above entitled “Significant Transactions During the Year Ended December 31, 2008.”
Debt Related Investments
During the year ended December 31, 2008, we acquired two debt related investments with a total gross investment amount of approximately $34.3 million. This use of cash was offset by the full and complete repayment of one of our debt related investments for approximately $35.3 million. For additional detail regarding these debt investments see our above section entitled “Significant Transactions During the Year Ended December 31, 2008.”
Financing Activities
Net cash provided by financing activities decreased approximately $1.0 billion to approximately $315.6 million for the year ended December 31, 2008 from approximately $1.4 billion for the same period in 2007. This decrease was primarily due to (i) decreased proceeds raised from our public offerings, (ii) decreased debt financings (net of the repayment of outstanding borrowings), (iii) increased distributions (iv) increased redemptions of our common shares, and (v) increased settlements of cash flow derivatives.
Public Offerings
Common shares issued pursuant to our public offerings declined by approximately 33.4 million shares to approximately 49.8 million shares for the year ended December 31, 2008 from 83.2 million shares for the same period in 2007. This decrease resulted in a decline in net proceeds of approximately $304.1 million to approximately $450.1 million for the year ended December 31, 2008 from $754.2 million for the same period in 2007.
The Operating Partnership’s Private Placements
Our Operating Partnership, through the TRS, is currently offering fractional interests in real property. The properties owned through such fractional interests sold to accredited investors are 100% leased by our Operating Partnership. Additionally, our Operating Partnership has a purchase option giving it the right, but not the obligation, to acquire the fractional interests from the investors at a later point in time in exchange for OP Units. After a period of one year, holders of OP Units may request the Operating Partnership to redeem their OP Units. We have the option, in our sole discretion, of redeeming the OP Units with cash, shares of our common stock or with a combination of cash and shares of our common stock.
The right of the holders of OP Units to cause us to redeem their OP Units is not subject to an annual percentage limitation on the number or dollar value of OP Units redeemed for cash or our common stock. If we elect to redeem OP Units for shares of our common stock, we will generally deliver one share of our common stock for each OP Unit redeemed and such common stock may, subsequently, only be redeemed for cash in accordance with the terms of our share redemption program. If we elect to redeem OP Units for cash, the cash delivered will generally equal the amount the limited partner would have received if his or her OP Units were redeemed for shares of our common stock and then such shares were subsequently redeemed pursuant to our share redemption program (without application of the annual percentage limitation), which amount may be at a discount to the purchase price paid by the limited partner for a fractional interest. The amount paid will vary based upon the length of time that the OP Units subject to redemption have been held, as described in the table applicable to the redemption of our common stock.
During the year ended December 31, 2008, we raised approximately $64.2 million from the sale of fractional interests in five properties. Furthermore, during 2008 we exercised our option to acquire, at fair value, approximately $65.9 million of previously sold fractional interests in six properties for a combination of (i) approximately 6.5 million OP Units issued at a price of $10.00 per OP Unit, representing approximately $64.8 million of the aggregate purchase and (ii) approximately $1.1 million in cash. The result of this 2008 activity was a net decrease in our financing obligations of approximately $1.7 million for the year ended December 31, 2008.
The following table sets forth certain details regarding the acquisition of the fractional interests in 2008 for which our Operating Partnership issued OP Units (amounts in thousands).
| | | | | | | | | |
Exercise Date | | Property | | Market | | OP Units
Issued | | Total Value (1) |
| January 18, 2008 | | Rickenbacker, IV | | Columbus, OH | | 1,441 | | $ | 14,406 |
| February 6, 2008 | | Park West Q | | Cincinnati, OH | | 957 | | | 9,572 |
| May 13, 2008 | | Eagle Creek East | | Minneapolis, MN | | 882 | | | 8,823 |
| May 28, 2008 | | Minnesota Valley III | | Minneapolis, MN | | 1,396 | | | 13,961 |
| June 26, 2008 | | Park West L | | Cincinnati, OH | | 804 | | | 8,044 |
| August 22, 2008 | | Eagle Creek West | | Minneapolis, MN | | 1,001 | | | 10,006 |
| | | | | | | | | |
| | | | | | 6,481 | | $ | 64,812 |
| | | | | | | | | |
| (1) | Reflects the value of OP Units issued in connection with the exercise of purchase options to acquire the undivided tenancy-in-common interests based on the most recent selling price of our common stock ($10.00 per OP Unit as of December 31, 2008). |
51
During the years ended December 31, 2008, 2007 and 2006, we incurred rent obligations of approximately $6.1 million, $4.4 million, and $303,000, respectively, under our lease agreements with the investors who have participated in our private placements. The various lease agreements in place as of December 31, 2008 contained expiration dates ranging from April 2018 to January 2037. The following table sets forth the future minimum rental payments due to investors under the various lease agreements associated with our private placements (amounts in thousands).
| | | |
For years ended December 31, | | Future
Minimum
Rental
Payments |
2009 | | $ | 9,283 |
2010 | | | 9,451 |
2011 | | | 9,605 |
2012 | | | 9,652 |
2013 | | | 9,932 |
Thereafter | | | 106,030 |
| | | |
Total | | $ | 153,953 |
| | | |
Debt Financings
Mortgage Notes—Debt financing activity declined by approximately $438.0 million to approximately $184.8 million for the year ended December 31, 2008 from $622.8 million for the same period in 2007. During the year ended December 31, 2008 we obtained or assumed mortgage debt financing of approximately $184.8 million in connection with 21 properties, including mortgage notes related to properties held for sale. During May 2008, we fully repaid the floating-rate debt on 17 properties in the amount of approximately $121.9 million. For additional detail regarding these financing activities see our section entitled “Significant Transactions During the Year Ended December 31, 2008” above.
The following table describes our mortgage notes related to our operating properties in more detail as of December 31, 2008 and 2007 (dollar amounts in thousands).
| | | | | | | | | | | | | | | | | | |
| | | Weighted Average Stated
Interest Rate | | | Outstanding Balance (1) | | Gross Investment Amount of
Properties Securing
Mortgage Notes |
| | | 2008 | | | 2007 | | | 2008 | | 2007 | | 2008 | | 2007 |
Fixed rate mortgages | | 6.0 | % | | 5.9 | % | | $ | 661,031 | | $ | 490,797 | | $ | 1,131,051 | | $ | 769,261 |
Floating rate mortgages (2) | | 2.2 | % | | 6.0 | % | | | 57,988 | | | 170,886 | | | 82,320 | | | 262,224 |
| | | | | | | | | | | | | | | | | | |
Total / weighted average | | 5.7 | % | | 5.9 | % | | $ | 719,019 | | $ | 661,683 | | $ | 1,213,371 | | $ | 1,031,485 |
| | | | | | | | | | | | | | | | | | |
| (1) | Amounts presented are net of unamortized discounts to the face value of our outstanding fixed-rate mortgages of $221,000 as of December 31, 2008 and net of unamortized premiums of $590,000 as of December 31, 2007. |
| (2) | As of December 31, 2008 and 2007, floating-rate mortgage notes were subject to interest rates at spreads of 1.40% to 3.50% and 0.95% to 1.60%, respectively, over one-month LIBOR. |
As of December 31, 2008, 18 mortgage notes were interest only and 15 mortgage notes were fully amortizing with outstanding balances of approximately $534.2 million and $184.8 million, respectively. Mortgage notes outstanding as of December 31, 2008 had maturity dates ranging from June 2009 through September 2036. One of our mortgage notes in the amount of $41.8 million will mature in 2009 and this mortgage note has three extension options. Three of our mortgage notes for a total amount of $19.7 million will mature in 2010 and two of these notes in the amount of approximately $16.1 million have extension options. Certain mortgage notes require us to maintain limited financial covenants, all of which were met as of December 31, 2008.
52
The following table sets forth contractual scheduled maturities of our mortgage debt as of December 31, 2008 (amounts in thousands).
| | | | | | | |
Year | | Mortgage
Notes | | | % of Total
Borrowings | |
2009 | | $ | 41,890 | | | 5.8 | % |
2010 | | | 19,605 | | | 2.7 | % |
2011 | | | 3,713 | | | 0.5 | % |
2012 | | | 21,300 | | | 3.0 | % |
2013 | | | — | | | 0.0 | % |
2014 | | | 55,767 | | | 7.8 | % |
2015 | | | 79,296 | | | 11.0 | % |
2016 | | | 167,953 | | | 23.4 | % |
2017 | | | 280,949 | | | 39.1 | % |
2018 | | | — | | | 0.0 | % |
| Thereafter | | | 48,767 | | | 6.8 | % |
| | | | | | | |
Total | | $ | 719,240 | | | 100.0 | % |
| Discounts, net of amortization (1) | | | (221 | ) | | | |
| | | | | | | |
Total carrying value of mortgage notes | | $ | 719,019 | | | | |
| | | | | | | |
| (1) | Certain mortgages were assumed in conjunction with the acquisition of properties and, pursuant to SFAS No. 141 (see Note 2 to our consolidated financial statements included in “Item 8. Financial Statements and Supplementary Date” of this Annual Report on Form 10-K), the difference between the fair value and the face value of these notes at the date of acquisition is reflected as a premium or discount which will be amortized to interest expense over the remaining life of the underlying note. |
Other Secured Borrowings— Net proceeds from other secured borrowings declined by approximately $58.7 million to a net repayment amount of approximately $21.4 million for the year ended December 31, 2008 from net proceeds of approximately $37.3 million for the same period in 2007. During the year ended December 31, 2008, to partially finance the acquisition of the Greensboro Park Mezzanine Loan, we obtained a floating-rate loan with an outstanding principal balance of approximately $10.8 million that bears interest based on a spread of 1.50% over the one-month LIBOR rate. The loan was used to acquire the Greensboro Park Mezzanine Loan debt related investment and has a maturity date that is coterminous with the maturity of the Greensboro Park Mezzanine Loan, which occurs in 2012. As of December 31, 2008, we made a principal repayment on this loan of approximately $592,000. In addition, we repaid approximately $31.6 million on our securities margin account during the year ended December 31, 2008.
Distributions
To obtain the favorable tax treatment accorded to REITs, we normally will be required each year to distribute to our stockholders at least 90% of our real estate investment trust taxable income, determined without regard to the deduction for distributions paid and by excluding net capital gains. The payment of distributions is determined by our board of directors and may be adjusted at its discretion at any time. Distribution levels are set by our board of directors at a level it believes to be appropriate and sustainable based upon a review of a variety of factors including, but not limited to, REIT requirements, the evaluation of existing assets within our portfolio, anticipated acquisitions, projected levels of additional capital to be raised, debt to be incurred in the future and the anticipated results of operations.
Distributions declared payable to common stockholders increased approximately $32.8 million to approximately $84.0 million for the year ended December 31, 2008 from approximately $51.2 million for the same period in 2007. Distributions were paid during the year declared or shortly thereafter. Of our 2008 and 2007 distributions, approximately $60.3 million and approximately $31.8 million, respectively, were funded from our operations, and the remaining amounts of approximately $23.7 million and approximately $19.4 million, respectively, were funded from our borrowings. Our long-term strategy is to fund the payment of quarterly distributions to investors entirely from our operations. There can be no assurance that we will achieve this strategy.
Redemptions
During the years ended December 31, 2008 and 2007, we redeemed approximately 6.0 million and approximately 208,000 shares of common stock, respectively, pursuant to our share redemption program. As a result, proceeds redeemed increased approximately $53.7 million to $55.6 million during the year ended December 31, 2008 from $1.9 million for the same period in 2007. See “Item 5. Market for Registrants Common Equity Related Stockholder Matters and Issuer Purchases of Equity Securities-Share Redemption Program.”
Settlement of Cash Flow Derivatives
During the years ended December 31, 2008 and 2007, we paid $24.0 million and $241,000, respectively, to settle certain cash flow derivative instruments.
53
Off-Balance Sheet Arrangements
As of December 31, 2008, we had no material off-balance sheet arrangements that had or are reasonably likely to have a current or future effect on our financial condition, results of operations, liquidity or capital resources. There are no lines of credit, side agreements, or any other derivative financial instruments related to or between our unconsolidated joint venture and us, and we believe we have no material exposure to financial guarantees.
Contractual Obligations
The following table reflects our contractual obligations as of December 31, 2008, specifically our obligations under mortgage note agreements and operating lease agreements (amounts in thousands).
| | | | | | | | | |
| | | Contractual Obligations |
Year | | Mortgage
Notes (1) | | Operating
Leases (2) | | Total |
2009 | | $ | 86,025 | | $ | 9,283 | | $ | 95,308 |
2010 | | | 62,765 | | | 9,451 | | | 72,216 |
2011 | | | 45,845 | | | 9,605 | | | 55,450 |
2012 | | | 62,617 | | | 9,652 | | | 72,269 |
2013 | | | 41,135 | | | 9,932 | | | 51,067 |
Thereafter | | | 754,527 | | | 106,030 | | | 860,557 |
| | | | | | | | | |
Total | | $ | 1,052,914 | | $ | 153,953 | | $ | 1,206,867 |
| | | | | | | | | |
| (1) | Includes principal and interest payments due for our mortgage notes. Amounts do not include principal and interest payments due for our other secured borrowing obligations. |
| (2) | As of December 31, 2008, we had operating master lease obligations relating to ten properties, all of which were in connection with our Operating Partnership’s private placement of fractional interests. |
We have contractual obligations to related parties for asset management. Fees for these services are based upon assets owned and revenues received during future periods and, as a result, future amounts cannot be determined at this time.
Assets and Liabilities Measured at Fair Value
Fair Value Estimates of Investments in Real Estate Securities
As of December 31, 2008, our real estate securities were valued in two categories, comprised of (i) preferred equity securities and (ii) CMBS and CRE-CDOs. Our valuation procedures for each of the two categories are applied to each specific investment within their respective categories.
Preferred Equity Securities
The valuation of our investments in preferred equity securities is determined using exchange listed prices in an active market. As such, preferred equity securities fall within Level 1 of the fair value hierarchy. Our investments in preferred equity securities had a fair value of $31.6 million and $75.5 million which represented approximately 2.0% and 5.0% of total investments as of December 31, 2008 and 2007, respectively. For the year ended December 31, 2008, we recorded an other-than-temporary impairment charge of $69.7 million related to our preferred equity securities. For additional detail regarding this impairment see Note 4 to our consolidated financial statements included in “Item 8. Financial Statements and Supplementary Data” of this Annual Report on Form 10-K.
CMBS and CRE-CDOs
We estimate the fair value of our CMBS and CRE-CDO securities using a combination of observable market information and unobservable market assumptions. Observable market information used in these fair market valuations include benchmark interest rates, interest rate curves, credit market indexes (such as the Commercial Mortgage Back Securities Index (“CMBX”) index) and swap curves. Unobservable market assumptions used in the determination of the fair market valuations of our CMBS and CRE-CDO investments include market assumptions related to discount rates, default rates, prepayment rates, reviews of trustee or investor
54
reports and sample broker quotes in what is currently an inactive market. Additionally, we consider security-specific characteristics in determining the fair values of our CMBS and CRE-CDO investments, which include consideration of the underlying collateral’s average default rates, the average delinquency rate and loan-to-value, among several other characteristics. As a result, both Level 2 and Level 3 inputs are used in arriving at the valuation of our investments in CMBS and CRE-CDOs. We consider the Level 3 inputs used in determining the fair value of our investments in CMBS and CRE-CDO securities to be significant. As such, all investments in CMBS and CRE-CDO securities fall under the Level 3 category of the fair value hierarchy as of December 31, 3008. No investments in CMBS and CRE-CDO securities were transferred in or out of the Level 3 category of the fair value hierarchy during the year ended December 31, 2008.
Our investments in CMBS and CRE-CDO investments had a fair value of $20.8 million and $105.2 million which represented approximately 1.3% and 7.0% of our total investments as of December 31, 2008 and 2007, respectively. For the year ending December 31, 2008 we recorded an other-than-temporary impairment charge of $123.0 million related to our CMBS and CRE-CDO securities. For additional detail regarding this other-than-temporary impairment charge see Note 4 to our consolidated financial statements included in “Item 8. Financial Statements and Supplementary Data” of this Annual Report on Form 10-K.
Fair Value Estimates of Derivative Instruments
Currently, we use forward starting swaps, zero cost collars and interest rate caps to manage our interest rate risk. The valuation of these instruments is determined using widely accepted valuation techniques, including discounted cash flow analysis on the expected cash flows of each derivative. This analysis reflects the contractual terms of the derivatives, including the period to maturity, and uses observable market-based inputs, including interest rate curves and implied volatilities. The valuation methodologies are segregated into two categories of derivatives: (i) forward starting swaps and (ii) zero cost collars/interest rate caps.
Although we have determined that the majority of the inputs used to value our derivative instruments fall within Level 2 of the fair value hierarchy, credit valuation adjustments associated with our derivative instruments utilize Level 3 inputs, such as estimates of current credit spreads, to evaluate the likelihood of default by us and our counterparties. However, as of December 31, 2008, we have assessed the significance of the impact of the credit valuation adjustments on the overall valuation of our derivative positions and have determined that the credit valuation adjustments are not significant to the overall valuation of our derivative instruments. As a result, we have determined that all of our derivative valuations are classified in Level 2 of the fair value hierarchy.
Our derivative instrument liability had a fair value of $27.2 million and $27.9 million which represented approximately 2.8% and 3.1% of total liabilities as of December 31, 2008 and 2007, respectively. For the year ended December 31, 2008, we recorded a net loss on derivatives of approximately $11.7 million.
Subsequent Events
The following discussion represents significant events related to our business activity for the period from January 1, 2009 through March 30, 2009.
Acquisition of Connecticut Avenue Office Center
On March 10, 2009, we acquired an office property located in the Washington, DC market (the “Connecticut Avenue Office Center”) from a third-party seller. We acquired the Connecticut Avenue Office Center using proceeds from our public and private offerings. Additionally, we subsequently financed the Connecticut Avenue Office Center as described in more detail below. The total estimated investment amount for the Connecticut Avenue Office Center is approximately $63.6 million. The Connecticut Avenue Office Center consists of approximately 126,000 net rentable square feet that is currently approximately 98% occupied. The Connecticut Avenue Office Center is subject to leases with twelve tenants with lease expiration dates ranging from 2010 through 2019.
The debt financing of the Connecticut Avenue Office Center consists of a fixed-rate, amortizing mortgage note with an outstanding principal balance of approximately $36.5 million that bears interest at 7.25%. The loan has an expected term of seven years and amortizes over a 30 year life.
55
As discussed further below, we adopted SFAS No. 141 (revised 2007), Business Combinations (“SFAS No. 141(R)” on January 1, 2009. Pursuant to SFAS No. 141(R), certain transaction costs that have historically been capitalized as part of the basis in the property will be expensed as incurred. Such acquisition costs include closing and due diligence costs and acquisition fees payable to our Advisor. As a result, we expect to incur acquisition-related expenses of approximately $1.2 million related to the acquisition of the Connecticut Avenue Office Center. These expenses are comprised of estimated legal, closing and due diligence costs of approximately $566,000 and an acquisition fee payable to our Advisor of approximately $636,000.
Probable Acquisition of Greater DC Retail Center
On January 12, 2009, we entered into a purchase and sale agreement with a third-party seller in connection with the intended acquisition of a retail property located in the Washington, DC market (the “Greater DC Retail Center”). On February 27, 2009, our deposit of approximately $1.3 million, which had been placed in escrow in connection with the intended acquisition of the Greater DC Retail Center, became non-refundable subject to certain terms and conditions of the purchase and sale agreement. We expect to acquire the Greater DC Retail Center in April of 2009. We intend to use proceeds from our public and private offerings and the assumption of a mortgage loan to finance the acquisition of the Greater DC Retail Center. The Greater DC Retail Center consists of approximately 233,000 net rentable square feet that is currently 100% occupied. The Greater DC Retail Center is subject to leases with seven tenants with lease expirations dates ranging from 2010 through 2018.
The mortgage note that we expect to assume in connection with our acquisition of the Greater DC Retail Center has an outstanding principal balance of approximately $42.0 million and is an interest only loan until July 2009, at which point it begins to amortize over a 30-year life. This loan matures in July 2014, subject to a one-year extension option, and bears interest at a stated fixed interest rate of 4.82%.
We expect the total estimated investment amount for the Greater DC Retail Center to be approximately $65.5 million. In addition, we expect to incur acquisition-related expenses of approximately $1.2 million. These expenses are comprised of estimated legal, closing and due diligence costs of approximately $542,000 and an estimated acquisition fee payable to our Advisor of approximately $655,000.
Proceeds from Public Offering
For the period from January 1, 2009 to March 23, 2009, we issued approximately 6.7 million shares of our common stock pursuant to our follow-on public offering to a total of approximately 700 stockholders for net proceeds of approximately $65.0 million, which includes proceeds from our distribution reinvestment plan of approximately $13.0 million.
Redemptions of Common Stock
Under our share redemption program, we presently limit the number of shares to be redeemed during any consecutive twelve month period to no more than five percent of the number of shares of common stock outstanding at the beginning of such twelve month period (the “Redemption Cap”). The Redemption Cap applicable to redemption requests in the first quarter of 2009 is approximately 853,000 shares of common stock (the “First Quarter Redemption Cap”). As of March 16, 2009 (the “Deadline”), the last day for first quarter 2009 redemption requests to be submitted under our share redemption program, we had received requests to redeem approximately 6.1 million shares of common stock (the “Total First Quarter Redemption Requests”). Based on application of the First Quarter Redemption Cap, we expect that requesting stockholders whose requests were received on or before the Deadline will be redeemed pro rata. As a result, we expect to redeem approximately 13.9% (the “Pro Rata Percentage”) of the shares that each shareholder requested to be redeemed on or before the Deadline subject to the terms and conditions of our share redemption program.
The Total First Quarter Redemption Requests and Pro Rata Percentage are preliminary figures that are subject to change. Under our share redemption program, redemption requests may be withdrawn at any time up to three business days prior to the end of the applicable quarter.
Cash Settlement of Derivative Instrument
On January 28, 2009, we cash settled one of our outstanding forward starting swaps with a notional value of $50 million by paying approximately $12.7 million.
56
Inflation
Substantially all of our leases provide for separate real estate tax and operating expense escalations over a base amount. In addition, many of our leases provide for fixed base rent increases or indexed rent increases. We believe that inflationary increases in costs may be at least partially offset by the contractual rent increases and operating expense escalations in our leases.
Critical Accounting Policies
Principles of Consolidation
Due to our control of the Operating Partnership through our sole general partnership interest and the limited rights of the limited partners, we consolidate the Operating Partnership and limited partner interests not held by us are reflected as minority interests in the accompanying consolidated financial statements. All significant intercompany accounts and transactions have been eliminated in consolidation.
Our consolidated financial statements also include the accounts of our consolidated subsidiaries and joint ventures through which we are the primary beneficiary under Financial Accounting Standards Board (“FASB”) Interpretation No. 46(R),Consolidation of Variable Interest Entities—an Interpretation of ARB No. 51 (“FIN No. 46(R)”), or through which we have a controlling interest. In determining whether we have a controlling interest in a joint venture and the requirement to consolidate the accounts of that entity, management considers factors such as ownership interest, board representation, management representation, authority to make decisions, and contractual and substantive participating rights of the partners/members as well as whether the entity is a variable interest entity in which it will absorb the majority of the entity’s expected losses, if they occur, or receive the majority of the expected residual returns, if they occur, or both.
Judgments made by management with respect to our level of influence or control of an entity and whether we are the primary beneficiary of a variable interest entity as defined by FIN No. 46(R) involve consideration of various factors including the form of our ownership interest, the size of our investment (including loans) and our ability to participate in major policy making decisions. Management’s ability to correctly assess its influence or control over an entity affects the presentation of these investments in our consolidated financial statements and, consequently, our financial position and specific items in our results of operations that are used by our stockholders, lenders and others in their evaluation of us.
Generally, we consolidate real estate partnerships and other entities that are not variable interest entities (as defined by FIN No. 46(R)) when we own, directly or indirectly, a majority voting interest in the entity. Our analysis of whether we consolidate real estate partnerships and other entities that are not variable interest entities is performed pursuant to several accounting pronouncements including: (i) Emerging Issues Task Force (“EITF”) Issue No. 04-5,Determining Whether a General Partner, or the General Partners as a Group, Controls a Limited Partnership or Similar Entity When the Limited Partners Have Certain Rights, (ii) ARB No. 51,Consolidated Financial Statements (“ARB No. 51”) and (iii) AICPA Statement of Position 78-9,Accounting for Investments in Real Estate Ventures.
Investments
Real Property
Historically, we have capitalized direct costs associated with the acquisition, development or improvement of real property, including acquisition fees paid to the Advisor. Costs associated with the pursuit of acquisitions or developments were capitalized as incurred and, if the pursuit was abandoned, these costs were expensed in the period in which the pursuit was abandoned. Costs associated with the improvement of our real property assets were also capitalized as incurred. Costs incurred in making repairs and maintaining real estate assets were expensed as incurred. The results of operations for acquired real property are included in our accompanying consolidated statements of operations from their respective acquisition dates.
For periods prior to January 1, 2009, upon acquisition, the total cost of a property is allocated to land, building, building and land improvements, tenant improvements and intangible lease assets and liabilities pursuant to Statement of Financial Accounting Standards (“SFAS”) No. 141,Business Combinations (“SFAS No. 141”). The allocation of the total cost to land, building, building improvements and tenant improvements is based on our estimate of the property’s as-if vacant fair value. The as-if vacant fair value is calculated by using all available information such as the replacement cost of such asset, appraisals, property condition reports, market data and other related information. Pursuant to SFAS No. 141, the difference between the fair value and the face value of debt assumed in an acquisition is recorded as a premium or discount and amortized to interest expense over the life of the debt assumed. The allocation of the total cost of a property to an intangible lease asset includes the value associated with the in-place leases which may include lost rent, leasing commissions, legal and other costs.
57
We record acquired “above” and “below-market” leases at their fair value equal to the difference between the contractual amounts to be paid pursuant to each in-place lease and management’s estimate of fair market lease rates for each corresponding in-place lease, measured over a period equal to the remaining term of the lease for above-market leases and the remaining term of the lease plus the term of any below-market fixed-rate renewal option periods for below-market leases. In addition, we allocate a portion of the purchase price of an acquired property to the estimated value of customer relationships, if any. As of December 31, 2008, we had not recorded any estimated value to customer relationships.
Intangible in-place lease assets are amortized over the corresponding lease term. Above market lease assets are amortized as a reduction in rental revenue over the corresponding lease term. Below market lease liabilities are amortized as an increase in rental revenue over the corresponding lease term, plus any applicable fixed-rate renewal option periods. We expense any unamortized intangible lease asset or record an adjustment to rental revenue for any unamortized above market lease asset or below market lease liability when a tenant terminates a lease before the stated lease expiration date.
Real property assets, including land, building, building and land improvements, tenant improvements, lease commissions, and intangible lease assets and liabilities are stated at historical cost less accumulated depreciation and amortization. Depreciation and amortization are computed on a straight-line basis over the estimated useful lives as described in the following table.
| | |
Description | | Depreciable Life |
Land | | Not depreciated |
Building | | 40 years |
Building and land improvements | | 20 years |
Tenant improvements | | Lesser of useful life or lease term |
Lease commissions | | Over lease term |
Intangible in-place lease assets | | Over lease term |
Above market lease assets | | Over lease term |
Below market lease liabilities | | Over lease term, including below market
fixed-rate renewal options |
58
Real Estate Securities
As of December 31, 2008 and 2007, investments in real estate securities consisted of preferred equity securities, CMBS and CRE-CDOs. SFAS No. 115,Accounting for Certain Investments in Debt and Equity Securities (“SFAS No. 115”), requires us to classify our investments in real estate securities as either trading investments, available-for-sale investments or held-to-maturity investments. Although we generally intend to hold most of our investments in real estate securities for the long term or until maturity, we may from time to time sell any of these assets as part of the overall management of our portfolio. As of December 31, 2008 and 2007, all of our real estate securities were classified as available-for-sale. All assets classified as available-for-sale are reported based on management’s best estimate of fair value. In determining management’s best estimate of fair value, we consider various factors including, but not limited to, current market prices if available, current interest rates, relevant market indices, broker quotes, expected cash flows and other relevant market and security-specific data as appropriate. Temporary unrealized gains and losses are excluded from earnings and reported as a separate component within stockholders’ equity referred to as other comprehensive income (loss).
Debt Related Investments
The following discussion pertains only to our mortgage, mezzanine, and B-note investments. Debt related investments are considered to be held-to-maturity, as we have both the intent and ability to hold these investments until maturity. Accordingly, these assets are carried at cost, net of unamortized loan origination costs and fees, discounts, repayments, sales of partial interests in loans, and unfunded commitments unless such loans or investments are deemed to be impaired.
Revenue Recognition
Revenue Recognition – Real Property
We record rental revenue for the full term of each lease on a straight-line basis. Certain properties have leases that offer the tenant a period of time where no rent is due or where rent payments increase during the term of the lease. Accordingly, we record a receivable from tenants for rent that we expect to collect over the remaining lease term rather than currently, which is recorded as straight-line rents receivable. When we acquire a property, the term of existing leases is considered to commence as of the acquisition date for purposes of this calculation.
Tenant recovery income includes payments from tenants for real estate taxes, insurance and other property operating expenses and is recognized as rental revenue.
Revenue Recognition – Real Estate Securities
Interest income on CMBS and CRE-CDO investments is recognized using the effective interest method in accordance with SFAS 115 and Emerging Issues Task Force (“EITF”) No. 99-20,Recognition of Interest Income and Impairment on Purchased and Retained Beneficial Interests in Securitized Financial Assets, as amended by FASB Position No. EITF 99-20-1,Amendments to the Impairment Guidance of EITF Issue No. 99-20(“EITF No. 99-20-1”). EITF No. 99-20 as so amended by FSP EITF No. 99-20-1, is herein after collectively referred to as “EITF No. 99-20”). Under EITF No. 99-20, at the time of purchase, our management estimates the future expected cash flows and determines the amount of accretable yield based on these estimated cash flows and the purchase price. As appropriate, we update these estimated cash flows to compute a revised yield based on the current amortized cost of the investment. In estimating these cash flows, there are a number of assumptions that are subject to uncertainties and contingencies, including the rate and timing of principal payments (including prepayments, repurchases, defaults and liquidations), the pass-through or coupon rate, interest rate fluctuations, interest payment shortfalls and the timing and the magnitude of credit losses on the mortgage loans underlying the securities. These uncertainties and contingencies are difficult to predict and are subject to future events that may impact management’s estimates and our securities income.
59
As discussed below in more detail, if management determines there has been an other-than-temporary impairment of our CMBS and CRE-CDOs, then we account for such securities based on their fair value and determine an accretion value based on our estimate of cash flows as described above. This accretion value is amortized to income over the expected life of the investment.
Dividend income on preferred securities is recognized on the date the dividend is earned (referred to commonly as the “ex-dividend date”). Upon settlement of securities, the excess (or deficiency) of net proceeds over the net carrying value of such security or loan is recognized as a gain (or loss) in the period of settlement. All of our preferred securities investments are cumulative preferred securities. In the event that an issuer of one of our investments in preferred securities suspends the payment of the dividend, we do not recognize dividend income until payments are resumed and the related ex-dividend date is declared. In the event that payments are resumed for what was a previously suspended payment, we would anticipate repayments that would compensate us for payments that the issuer previously suspended due to the cumulative nature of our investments.
Revenue Recognition — Debt Related Investments
Interest income on debt related investments is recognized over the life of the investment using the effective interest method and recognized on an accrual basis. Fees received in connection with loan commitments are deferred until the loan is funded and are then recognized over the term of the loan. Anticipated exit fees, where collection is expected, are also recognized over the term of the debt related investment.
Impairment
Impairment — Real Property
We review our investments in real property individually on a quarterly basis, and more frequently when such an evaluation is warranted, to determine their appropriate classification, as well as whether there are indicators of impairment in accordance with SFAS No. 144,Accounting for the Impairment or Disposal of Long-Lived Assets (“SFAS No. 144”). The investments in real property are either classified as held for sale or held and used based on outlined criteria in SFAS No. 144. These held and used assets are reviewed for indicators of impairment which may include, among others, each tenant’s inability to make rent payments, operating losses or negative operating trends at the property level, notification by a tenant that it will not renew its lease, a decision to dispose of a property or adverse changes in the fair value of any of our properties. If indicators of impairment exist on a held and used asset, we compare the future estimated undiscounted cash flows from the expected use of the property to its net book value to determine if impairment exists. If the sum of the future estimated undiscounted cash flows is greater than the current net book value, in accordance with SFAS No. 144, we conclude no impairment exists. If the sum of the future estimated undiscounted cash flows is less than its current net book value, we recognize an impairment loss for the difference between the net book value of the property and its estimated fair value. If a property is classified as held for sale, we recognize an impairment loss if the current net book value of the property exceeds its fair value less selling costs. If our assumptions, projections or estimates regarding a property change in the future, we may have to record an impairment charge to reduce or further reduce the net book value of the property.
Impairment — Real Estate Securities
In accordance with FASB Staff Position No. 115-1/124-1,The Meaning of Other-Than-Temporary Impairment and Its Application to Certain Investments (“FSP FAS No. 115-1/124-1”) and EITF No. 99-20, as applicable, we evaluate our real estate securities for other-than-temporary impairment on a quarterly basis, and more frequently when economic or market concerns warrant such evaluation. When management’s estimate of fair value of a real estate security is less than its amortized cost for an extended period, we consider whether there is an other-than-temporary impairment in the value of the security. The evaluation of other-than-temporary impairment differs between our investments in (i) preferred equity securities and (ii) CMBS and CRE-CDO securities, as described further below.
60
Preferred Equity Securities Impairment -On October 14, 2008, the staff in the Office of the Chief Accountant of the Commission noted in a letter (the “SEC Letter”) to the FASB, that after consulting with the FASB, the staff would not object to the application of an impairment model for perpetual preferred securities similar to debt securities since SFAS No. 115 does not specifically address the impact of the debt-like characteristics on the assessment of other-than-temporary impairment. The assessment of the anticipated recovery period differs significantly between equity securities and debt securities. For equity securities, other-than-temporary impairment is recognized unless it is expected that the value of the security will recover in the near term. However, for debt securities, impairment is considered temporary if the investor has the ability and intent to hold the security until recovery. Such an evaluation should be based on our ability and intent to hold the security to maturity and the underlying credit of the issuers. We adopted this impairment model for our investments in perpetual preferred securities during the year ended December 31, 2008. The letter noted that the views of the staff were an intermediate step in the process of addressing the impairment of perpetual preferred securities and asked the FASB to expeditiously address the issue. As of December 31, 2008, all of our preferred securities investments were perpetual preferred securities. In applying the impairment model for perpetual preferred securities, we apply a debt security impairment model for our preferred equity securities investments that are of investment grade quality credit. Preferred equity securities that are of below investment grade quality are analyzed for other-than-temporary impairment under an equity security model.
We reviewed our preferred equity security investments for indicators of other-than-temporary impairment. This review included analysis of (i) the length of time and the extent to which the fair value has been lower than carrying value, (ii) the financial condition and near-term prospects of the issuer and (iii) our intent and ability to hold our investment for a reasonable period of time sufficient to allow for a forecasted recovery of fair value.
CMBS and CRE-CDO Securities Impairment - On January 12, 2009, the FASB issued EITF No. 99-20-1. Prior to EITF No. 99-20-1, we were required to estimate cash flows from our CMBS and CRE-CDO securities using current information and events that a “market participant” would use. EITF No. 99-20-1 amends EITF No. 99-20 by removing the concept of a market participant’s expectation of cash flows and instead requires management to determine whether it believes that it is probable that there has been an adverse change in the estimated timing and amount of cash flows from its securities based on all relevant, available information, including information about past events, current conditions and reasonable and supportable forecasts. In estimating cash flows of our securities, we specifically consider and analyze factors such as remaining payment terms, prepayments, financial condition of the issuer, expected defaults, analyst reports and forecasts, credit ratings, the value of the underlying collateral and other market data that are relevant to the collectability of the contractual cash flows from the security, which requires significant judgment. In determining whether an other-than-temporary impairment has occurred, we considered both the timing and amount of cash flows and our intent and ability to hold an investment for a reasonable period of time sufficient to allow for a forecasted recovery of fair value. If, in our judgment, an other-than-temporary impairment exists, the cost basis of the security is written down to its fair value as of the respective balance sheet date, and the respective unrealized loss is reclassified from accumulated other comprehensive loss and recorded as a reduction to earnings.
Impairment — Debt Related Investments
We review our debt related investments on a quarterly basis, and more frequently when such an evaluation is warranted, to determine if impairment exists in accordance with SFAS No. 114,Accounting by Creditors for Impairment of a Loan (“SFAS No. 114”). A debt related investment is impaired when, based on current information and events, it is probable that we will be unable to collect all amounts due, both principal and interest, according to the contractual terms of the agreement. When a loan is deemed impaired, the impairment is measured based on the present value of expected future cash flows discounted at the loan’s effective interest rate or, at the loan’s observable market price or the fair value of the collateral if the loan is collateral dependent.
61
Derivative Instruments and Hedging Activities
SFAS No. 133,Accounting for Derivative Instruments and Hedging Activities (“SFAS No. 133”), as amended and interpreted, establishes accounting and reporting standards for derivative instruments, including certain derivative instruments embedded in other contracts, and for hedging activities. As required by SFAS No. 133, we record all derivative instruments in the accompanying consolidated balance sheets at fair value. Accounting for changes in the fair value of a derivative instrument depends on the intended use of the derivative instrument and the designation of the derivative instrument. Derivative instruments used to hedge exposure to changes in the fair value of an asset, liability, or firm commitments attributable to a particular risk, such as interest rate risk, are considered “fair value” hedges. Derivative instruments used to hedge exposure to variability in expected future cash flows, such as future interest payments, or other types of forecasted transactions, are considered “cash flow” hedges.
For derivative instruments designated as cash flow hedges, the changes in the fair value of the derivative instrument that represents changes in expected future cash flows which are effectively hedged by the derivative instrument are initially reported as other comprehensive income (loss) in the consolidated statement of stockholders’ equity until the derivative instrument is settled. Upon settlement, the effective portion of the hedge is recognized as other comprehensive income (loss) and amortized over the term of the designated cash flow or transaction the derivative instrument was intended to hedge. The change in value of any derivative instrument that is deemed to be ineffective is charged directly to earnings when the determination of ineffectiveness is made. We assess the effectiveness of each hedging relationship by comparing the changes in fair value or cash flows of the derivative instrument with the changes in fair value or cash flows of the designated hedged item or transaction. For purposes of determining hedge ineffectiveness, management estimates the timing and amount of future fixed-rate debt issuances each quarter in order to estimate the cash flows of the designated hedged item or transaction. Management considers the likelihood of the timing and amount of entering into such forecasted transactions when determining the expected future fixed-rate debt issuances. We do not use derivative instruments for trading or speculative purposes. Additionally, we have an interest rate collar and an interest rate cap that are not designated as hedges pursuant to the requirements of SFAS No. 133. These derivatives are not speculative and are used to manage exposure to interest rate volatility.
New Accounting Pronouncements
In December 2007, the FASB issued SFAS No. 141(R), which retains the fundamental requirements in SFAS No. 141 that the acquisition method of accounting be used for all business combinations and for an acquirer to be identified for each business combination. SFAS No. 141(R) establishes principles and requirements for how the acquirer recognizes and measures in its financial statements the identifiable assets acquired, the liabilities assumed and any noncontrolling interest in the acquiree. Under SFAS No. 141(R), certain transaction costs that have historically been capitalized as acquisition costs will be expensed. SFAS No. 141(R) applies prospectively to business combinations for which the acquisition date is on or after the beginning of the first annual reporting period beginning on or after December 15, 2008. An entity may not apply the provisions of SFAS No. 141(R) prior to that date. We will adopt the provisions of SFAS No. 141(R) on January 1, 2009.
In December 2007, the FASB issued SFAS No. 160,Noncontrolling Interests in Consolidated Financial Statements—an amendment of ARB No. 51 (“SFAS No. 160”), which clarifies that a noncontrolling interest in a subsidiary is an ownership interest in the consolidated entity that should be reported as equity in the consolidated financial statements. SFAS No. 160 changes the way the consolidated income statement is presented, thus requiring consolidated net income to be reported at amounts that include the amounts attributable to both the parent and the noncontrolling interest. SFAS No. 160 is effective January 1, 2009, and early adoption is not permitted. We are currently evaluating the impact the adoption of SFAS No. 160 will have on our results of operations and financial position.
In March 2008, the FASB issued SFAS No. 161,Disclosures about Derivative Instruments and Hedging Activities — an amendment of FASB Statement No. 133 (“SFAS No. 161”), which amends SFAS No. 133 to provide additional information about how derivative and hedging activities affect an entity’s financial position, financial performance, and cash flows. SFAS No. 161 requires enhanced disclosures about an entity’s derivatives and hedging activities. SFAS No. 161 is effective for financial statements issued for fiscal years beginning after November 15, 2008. We anticipate that it will not have an effect on our results of operations or financial position since it only provides for new disclosure requirements.
| ITEM 7A. | QUANTITATIVE AND QUALITATIVE DISCLOSURES ABOUT MARKET RISK |
Market risk is the adverse effect on the value of assets and liabilities that results from a change in the applicable market resulting from a variety of factors such as perceived risk, interest rate changes, inflation and overall general economic changes. Our outstanding mortgage note borrowing and derivative instruments are our financial instruments that are most significantly and directly impacted by changes in their respective market conditions.
62
Debt Obligations
As of December 31, 2008, we had total outstanding debt and short-term borrowings of approximately $734.9 million. As of December 31, 2008, we had approximately $73.9 million of variable rate mortgage note debt and short term borrowings outstanding indexed to LIBOR rates. If the prevailing market interest rates relevant to our remaining variable rate debt and short term borrowings were to increase 10%, we estimate that interest expense would increase by approximately $292,000, based on our outstanding floating-rate debt as of December 31, 2008.
Derivative Instruments
We are currently exposed to interest rate changes primarily as a result of our hedging positions and our variable rate debt used to maintain liquidity, fund capital expenditures and expand our investment portfolio and operations. We generally seek to limit the impact of interest rate changes on earnings and cash flows and to lower our overall borrowing costs by selectively utilizing derivative instruments to hedge exposures to changes in interest rates on loans secured by our assets.
We maintain risk management control systems to monitor interest rate cash flow risk attributable to both our outstanding and forecasted debt obligations as well as our potential offsetting hedge positions. While this hedging strategy is designed to minimize the impact on our net income (loss) and funds from operations from changes in interest rates, the overall returns on our investments may be reduced. Our board of directors has established policies and procedures regarding our use of derivative instruments for hedging or other purposes. As of December 31, 2008, we held five unsettled hedging instruments with a combined notional amount of approximately $350.2 million that were in a loss position equal to approximately $27.8 million. We classify our hedging instruments as either (i) forward starting swaps or (ii) interest rate caps and collars.
Forward Starting Swaps
As of December 31, 2008, we had entered into four forward starting swap hedges with a total notional value of $350.0 million. As of December 31, 2008, we had cash settled the first two forward starting swap hedges with a total notional value of $250.0 million by paying approximately $23.8 million. On February 1, 2009, we cash settled the third forward starting swap with a notional value of $50.0 million by paying approximately $12.7 million. The fourth and final forward starting swap has a notional amount of $50.0 million and has a cash settlement date of August 1, 2009. As of December 31, 2008, the fair value of this swap was a net loss of approximately $13.7 million. If interest rates were to increase by 0.1% (relative to interest rates as of December 31, 2008), this would result in an approximate $512,000 decrease in our loss position for this forward starting swap.
Interest Rate Caps and Collars
As of December 31, 2008, we had three active interest rate cap and collar hedges with a total notional amount of $250.2 million and a fair value resulting in a net loss of approximately $423,000. If interest rates were to increase by 10 basis points (relative to interest rates as of December 31, 2008), this would result in an approximate $10,000 decrease in our loss position for these cap and collar hedges. Two of our cap and collar hedges were not designated as cash flow hedges pursuant to SFAS No. 133. As a result, unrealized gains and losses in the fair value of these hedges are reflected in our consolidated statement of operations as gains or losses on derivatives.
Credit Risk of Derivative Instruments
Credit risk is the failure of the counterparty to perform under the terms of an agreement. We could potentially have exposure to credit risk with the counterparties to our remaining hedging contracts. If the fair value of a derivative contract were positive, the counterparty would owe us, which would create a potential credit risk for us in connection with collection of the amount owed. We seek to minimize the credit risk within our investments and with our derivative instruments by entering into transactions with what we deem to be high-quality counterparties. However, we cannot mitigate all of our credit risk exposure and therefore our operating results may be adversely impacted by the failure of a counterparty to perform under the terms of an agreement. As of December 31, 2008, we did not have any derivative instrument with a positive fair value and therefore we did not have any significant credit risk associated with our derivative instruments as of December 31, 2008.
| ITEM 8. | FINANCIAL STATEMENTS AND SUPPLEMENTARY DATA |
The report of the independent registered public accounting firm and the consolidated financial statements listed in the accompanying index are included in “Item 15. Exhibits and Financial Statement Schedules” of this Annual Report on Form 10-K. See Index to Financial Statements on page F-1.
63
| ITEM 9. | CHANGES IN AND DISAGREEMENTS WITH ACCOUNTANTS ON ACCOUNTING AND FINANCIAL DISCLOSURE |
None.
| ITEM 9A(T). | CONTROLS AND PROCEDURES |
Disclosure Controls and Procedures
As of December 31, 2008, the end of the period covered by this Annual Report on Form 10-K, we conducted an evaluation of the effectiveness of our disclosure controls and procedures, under the supervision and with the participation of our President (principal executive officer) and our Chief Financial Officer (principal financial officer). Based upon this evaluation, our President and our Chief Financial Officer concluded that our disclosure controls and procedures were effective as of December 31, 2008, to provide reasonable assurance that information required to be disclosed by us in the reports filed or submitted by us under the Exchange Act is recorded, processed, summarized and reported within the time periods specified in the Commission’s rules and forms and is accumulated and communicated to management, including our President and our Chief Financial Officer as appropriate to allow timely decisions regarding required disclosures.
Management’s Annual Report on Internal Control over Financial Reporting
Management is responsible for establishing and maintaining adequate internal control over financial reporting, as defined in Exchange Act Rules 13a-15(f) and 15d-15(f).
Our internal control over financial reporting is a process designed under the supervision and with the participation of our President and our Chief Financial Officer. During 2008, management conducted an evaluation of the effectiveness of our internal control over financial reporting, based upon criteria established in the “Internal Control—Integrated Framework” issued by the Committee of Sponsoring Organizations of the Treadway Commission. This evaluation included a review of the documentation of controls, evaluation of the design effectiveness of controls, testing of the operating effectiveness of controls and a conclusion on this evaluation. Based upon this evaluation, management has concluded that our internal control over financial reporting is effective as of December 31, 2008.
This annual report does not include an attestation report by our independent registered public accounting firm regarding internal control over financial reporting. Management’s report was not subject to attestation by our independent registered public accounting firm pursuant to temporary rules of the Commission that permit the company to provide only management’s report in this annual report.
Limitation of the Effectiveness of Internal Control over Financial Reporting
Internal control over financial reporting is a process to provide reasonable assurance regarding the reliability of our financial reporting for external purposes in accordance with GAAP. Because of its inherent limitations, internal control over financial reporting may not prevent or detect misstatements. Therefore, even those processes determined to be effective can provide only reasonable assurance with respect to financial statement preparation and presentation.
Changes in Internal Control over Financial Reporting
During the year ended December 31, 2008, in connection with our evaluation of internal control over financial reporting in accordance with Section 404 of the Sarbanes-Oxley Act of 2002, we concluded there were no changes in our internal control procedures that materially affected, or are reasonably likely to materially affect, our internal control over financial reporting.
| ITEM 9B. | OTHER INFORMATION |
None.
64
PART III
| ITEM 10. | DIRECTORS, EXECUTIVE OFFICERS AND CORPORATE GOVERNANCE |
As of the date of the filing of this Annual Report on Form 10-K, our directors and executive officers, their ages and their positions and offices are as follows:
| | | | |
Name | | Age | | Position |
| John A. Blumberg | | 49 | | Chairman of the Board of Directors |
| Charles B. Duke | | 51 | | Director* |
| Daniel J. Sullivan | | 43 | | Director* |
| John P. Woodberry | | 46 | | Director* |
| Guy M. Arnold | | 41 | | President |
| John E. Biallas | | 47 | | Chief Financial Officer and Treasurer |
| Joshua J. Widoff | | 38 | | Senior Vice President, General Counsel and Secretary |
| * | Denotes an Independent Director. |
John A. Blumberg, age 49, serves as our Chairman of the Board of Directors. Mr. Blumberg is a principal of our Advisor, Dividend Capital Group LLC and Black Creek Capital LLC, a Denver based real estate investment firm which he co-founded in 1993. He is also a co-founder of Mexico Retail Properties and has been its Chief Executive Officer since 2002. Mexico Retail Properties is a fully integrated retail real estate company that acquires, develops and manages retail properties throughout Mexico. Mr. Blumberg has been active in real estate acquisition, development and redevelopment activities since 1993 and, as of December 31, 2008, with certain other principals of our Advisor, has overseen directly, or indirectly through affiliated entities, the acquisition, development, redevelopment, financing and sale of real estate related assets having combined value of approximately $6.4 billion. Prior to co-founding Black Creek Capital LLC, Mr. Blumberg was President of JJM Investments, which owned over 100 shopping center properties in Texas. During the 12 years prior to joining JJM Investments, Mr. Blumberg served in various positions with Manufacturer’s Hanover Real Estate, Inc., Chemical Bank and Chemical Real Estate, Inc., most recently as President of Chemical Real Estate, Inc. and its predecessor company, Manufacturer’s Hanover Real Estate, Inc. In this capacity Mr. Blumberg oversaw real estate investment banking, merchant banking and loan syndications and was involved in originating over $1 billion worth of participating mortgage and conventional loans during his tenure. Mr. Blumberg holds a Bachelor’s Degree from the University of North Carolina at Chapel Hill.
Charles B. Duke, age 51, is an independent director of Dividend Capital Total Realty Trust Inc. Mr. Duke was founder and has been President and Chief Executive Officer of Legacy Imaging, Inc., a manufacturer of aftermarket printer supplies, since 1996. Mr. Duke has been active in entrepreneurial and general business activities since 1980 and has held several executive and management roles throughout his career, including founder, president and owner of Careyes Corporation, a private bank, registered investment advisor and FINRA-member company based in Denver, Colorado, Chief Financial Officer at Particle Measuring Systems based in Boulder, Colorado, and Vice President of Commercial Loans at Colorado National Bank. Mr. Duke also spent four years with Kirkpatrick Pettis, the investment banking subsidiary of Mutual of Omaha, as Vice President of Corporate Finance, involved in primarily mergers and acquisitions, financing and valuation activities. Mr. Duke graduated from Hamilton College in 1980 with a Bachelor’s Degree in Economics and English.
Daniel J. Sullivan, age 43, is an independent director of Dividend Capital Total Realty Trust Inc. Mr. Sullivan is assistant editor of Humanitas, an academic journal published by the National Humanities Institute, and a doctoral degree candidate at The Catholic University of America in Washington, DC. Prior to that, from 2002 to 2003, Mr. Sullivan was a private consultant and from 1998 to 2002, he was Director of Business Development at Jordan Industries Inc. Mr. Sullivan has seventeen years of international business, consulting, and private equity investment experience, including over four years, from 1987 through 1991, in the real estate industry as an appraiser, property analyst, and investment banker with Manufacturer’s Hanover Real Estate Investment Banking Group in New York. During that time, Mr. Sullivan participated in the structuring and private placement of over $1 billion in long term, fixed rate, multi property mortgage financings for the bank’s corporate clients. Mr. Sullivan holds a Master of Arts in political theory from The Catholic University of America in Washington, D.C. and a Bachelor of Arts in history from Boston College in Chestnut Hill, Massachusetts.
John P. Woodberry, age 46, is an independent director of Dividend Capital Total Realty Trust Inc. and has been active in finance and investing since 1991. In 2007, Mr. Woodberry joined Passport Capital, LLC, a San Francisco based hedge fund, and serves as the Portfolio Manager for the Capital Markets Group. From 2004 to 2007, Mr. Woodberry was the President and Portfolio Manager
65
of Independence Capital Asset Partners, LLC. Previously, from 2001 to 2004, Mr. Woodberry was a Senior Research Analyst at Cobalt Capital, LLC, a New York City based hedge fund. From 1998 to 2001, Mr. Woodberry worked for Minute Man Capital Management, LLC and Trident Investment Management, LLC, each a New York City based hedge fund. From 1995 to 1998, Mr. Woodberry worked at Templeton Investment Council Ltd. Mr. Woodberry has an MBA from Harvard Business School and an AB degree from Stanford University.
Guy M. Arnold, age 41, has been the President of Dividend Capital Total Realty Trust Inc. since January 2008. From March 1999 until November 2007, Mr. Arnold served as Partner and Managing Director of Cherokee Investment Partners, LLC. At the time of Mr. Arnold’s departure, Cherokee was a $1.8 billion multi-asset class private equity real estate fund that focused on the acquisition, redevelopment and asset management of urban infill properties throughout the U.S., Canada and Western Europe. In this capacity, Mr. Arnold directed and structured numerous transactions with various sellers and buyers including Fortune 500 companies, development and investment companies, as well as local and federal governmental agencies. In addition, Mr. Arnold co-managed Cherokee’s Denver office, presented regularly to Cherokee’s investors which include state pension funds and university endowments, and served as a member of Cherokee’s Investment and Asset Management Committees. Prior to joining Cherokee, Mr. Arnold served as Vice President of Colorado & Santa Fe Real Estate (“Colorado & Santa Fe”), a Denver commercial real estate holding company, from September 1990 to February 1999. At Colorado & Santa Fe, he co-managed the acquisition, asset management, and leasing for their portfolio of value-added office, industrial and retail properties. Mr. Arnold is a member of Urban Land Institute and serves on the Board of Directors of the Colorado chapter of the National Association of Industrial and Office Properties. Mr. Arnold earned a Bachelor’s degree from the University of Virginia.
John E. Biallas, age 47, is the Chief Financial Officer and Treasurer of Dividend Capital Total Realty Trust Inc. From June 2006 until December 2007, Mr. Biallas served as Chief Operating Officer of Dividend Capital Total Realty Trust Inc. From January 2006 until June 2006, Mr. Biallas served as Chief Financial Officer and Treasurer of Dividend Capital Total Realty Trust Inc. From its inception until January 2006, Mr. Biallas served as President, Secretary and a director of Dividend Capital Total Realty Trust Inc. Mr. Biallas has been active in finance, investment and operational activities in the real estate and technology industries since 1988. Mr. Biallas joined Dividend Capital Group in February 2005, where he currently serves as Vice President of Finance and Operations. From September 2003 until January 2005, Mr. Biallas was engaged in private consulting activities, and from February 2002 until August 2003, he was Senior Financial Officer at Ameriton Properties Incorporated, a multifamily real estate investment subsidiary of Archstone Smith, where he had overall responsibility for Ameriton’s financial operations, including debt financing activities, investor relations, accounting and financial reporting. From 2000 to 2002, Mr. Biallas was a Senior Director in the corporate finance group at Level 3 Communications, a public telecommunications company based in Denver, Colorado. From 1995 to 1999, Mr. Biallas served as Vice President for Security Capital Group, a real estate investment firm, formerly based in Santa Fe, New Mexico, which was acquired by GE Capital in 2003. During his tenure with Security Capital Group, Mr. Biallas was responsible for various investment research, financial operations, strategic planning, capital markets and investment acquisition related activities for its real estate affiliates, which included ProLogis, Archstone Smith, Regency Centers, Homestead Village, Belmont Corp., Security Capital European Realty, and various other real estate investment and operating companies. In addition, from 1988 to 1991, Mr. Biallas was a financial analyst with the real estate investment banking group at Goldman Sachs, located in New York, New York. Mr. Biallas received his Bachelor’s Degree in Computer Engineering Magna Cum Laude from the University of Michigan and his MBA from the Stanford University Graduate School of Business.
Joshua J. Widoff, age 38, is the Senior Vice President, General Counsel and Secretary of Dividend Capital Total Realty Trust Inc. He also serves as a Managing Director of Black Creek Group, a Denver based private equity real estate firm. Prior to joining Dividend Capital Total Realty Trust Inc. and Black Creek Group in September 2007, Mr. Widoff was a partner since 2002 at the law firm of Brownstein Hyatt Farber Schreck, P.C., where he was active in the management of the firm, serving as chairman of both the firm’s Associate and Recruiting Committees and overseeing an integrated team of attorneys and paralegals servicing clients primarily in the commercial real estate business. During more than a dozen years of private practice, he managed transactions involving the acquisition, development, leasing, financing, and disposition of various real estate assets, including vacant land, apartment and office buildings, hotels, casinos, industrial/warehouse facilities, and shopping centers. He also participated in asset and stock acquisition transactions, convertible debt financings, private offerings, and complex joint venture negotiations. Mr. Widoff served as general business counsel on a variety of contract and operational issues to a wide range of clients in diverse businesses. Mr. Widoff received his undergraduate degree from Trinity University in Texas and his law degree from the University of Colorado School of Law.
Messrs. Arnold, Biallas and Widoff are employed by the Advisor. Mr. Blumberg is a principal of the Advisor. Our directors and executive officers will serve until their successors are elected and qualified.
66
Code of Ethics
Our board of directors has adopted a Code of Business Conduct and Ethics, which applies to all employees, officers and directors, including our President and our Chief Financial Officer. Additionally, our board of directors has adopted a Code of Ethics for our President and our Senior Financial Officers, including our Chief Financial Officer. A copy of the Code of Ethics for our President and Senior Financial Officers may be found on our website athttp://www.dividendcapital.com. Our board of directors must approve any amendment to or waiver of the Code of Business Conduct and Ethics as well as the Code of Ethics for our President and our Senior Financial Officers. We presently intend to disclose amendments and waivers, if any, of the Code of Ethics for our President and Senior Financial Officers on our website; however, if we change our intention, we will file any amendments or waivers with a current report on Form 8-K.
Equity Incentive Plan
We have adopted an equity incentive plan which we use to attract and retain qualified independent directors, employees, advisors and consultants providing services to us who are considered essential to our long-range success by offering these individuals an opportunity to participate in our growth through awards in the form of, or based on, our common stock. See the discussion below under “Compensation of Directors” for further details of the option granted under our equity incentive plan as of December 31, 2008.
The equity incentive plan provides that no more than 5 million shares of our common stock will be available for issuance under the equity incentive plan. No more than 200,000 shares may be made subject to stock options and stock appreciation rights under the equity incentive plan to any individual in any calendar year, and no more than 200,000 may be made subject to awards other than stock options and stock appreciation rights under the equity incentive plan to any individual in any single calendar year. The term of these options shall not exceed the earlier of ten years from the date of grant, the date of removal for cause, or three months from the director’s resignation. The exercise price for options to be issued under the equity incentive plan shall be the greater of (1) $11.00 per share or (2) the fair value of the shares on the date they are granted.
For additional information about our equity incentive plan see “Compensation of Directors and Executive Officers—Equity Incentive Plan” in our definitive proxy statement to be filed in connection with our 2009 Annual Meeting of Stockholders which is incorporated herein by reference.
Compensation of Directors
We pay each of our independent directors $7,500 per quarter plus $1,000 for each Board or Committee meeting attended. All directors receive reimbursement of reasonable out-of-pocket expenses incurred in connection with attending meetings of the board. If a director is also one of our officers, we do not pay additional compensation for services rendered as a director. In addition, we grant stock based awards to each of our independent directors then in office on the date of each annual stockholders’ meeting, which awards will be granted under the equity incentive plan and will be subject to the conditions and restrictions thereof. The following table describes options to purchase common stock that have been granted to our independent directors pursuant to our equity incentive plan as of December 31, 2008.
| | | | | | | | | | | | | | | |
| | | | | | | | | Options Granted |
Grant Date | | Exercise
Price per
Share | | Maximum
Term | | Vesting
Period | | Charles B.
Duke | | John P.
Woodberry | | Daniel J.
Sullivan | | Total |
4/3/2006 | | $ | 11.00 | | 10 years | | 5 years | | 10,000 | | 10,000 | | 10,000 | | 30,000 |
8/27/2007 | | $ | 11.00 | | 10 years | | 2 years | | 5,000 | | 5,000 | | 5,000 | | 15,000 |
8/21/2008 | | $ | 11.00 | | 10 years | | 2 years | | 5,000 | | 5,000 | | 5,000 | | 15,000 |
| | | | | | | | | | | | | | | |
Total | | | | | | | | | 20,000 | | 20,000 | | 20,000 | | 60,000 |
Additional information required for this Item is incorporated by reference from our definitive Proxy Statement to be filed in connection with our 2009 Annual Meeting of Stockholders, which we expect to hold in June 2009.
| ITEM 11. | EXECUTIVE COMPENSATION |
The information required for this Item is incorporated by reference from our definitive Proxy Statement to be filed in connection with our 2009 Annual Meeting of Stockholders, which we expect to hold in June 2009.
67
| ITEM 12. | SECURITY OWNERSHIP OF CERTAIN BENEFICIAL OWNERS AND MANAGEMENT AND RELATED STOCKHOLDER MATTERS |
Montecito Investments, LLC, an affiliate of the Advisor, currently owns 200 shares of our common stock. The Advisor and the parent of the Advisor have also contributed $201,000 to the Operating Partnership in exchange for OP Units and are currently its sole limited partners. For so long as the Advisor serves as our advisor, neither the Advisor nor the parent of the Advisor may sell these OP Units.
The following table presents information regarding the beneficial ownership of our common stock as of December 31, 2008, with respect to our affiliates, each of our directors and officers, and all of our directors and officers as a group. Unless otherwise indicated below, each person or entity has an address in care of our principal executive offices at 518 Seventeenth Street, 17th Floor, Denver, Colorado 80202.
Shares of Our Common Stock and OP Units
| | | | | |
Name and Address of Beneficial Owner(1) | | Amount and
Nature of
Beneficial Ownership | | | Percent of
Common Stock |
Montecito Investments, LLC (2) | | 200 Shares | | | * |
Dividend Capital Total Advisors LLC (3) | | 20,000 OP Units | (4) | | * |
Dividend Capital Total Advisors Group LLC (3) | | 100 Special Units | (5) | | * |
John A. Blumberg(3) (Chairman and Director) | | 20,000 OP Units | (4) | | * |
Charles B. Duke (Independent Director) | | 6,000 | (6) | | * |
Daniel J. Sullivan (Independent Director) | | 6,000 | (6) | | * |
John P. Woodberry (Independent Director) | | 6,000 | (6) | | * |
Guy M. Arnold (President) | | — | | | * |
John E. Biallas (Chief Financial Officer and Treasurer) | | — | | | * |
Michael J. Kelly (Former Chief Acquisitions Officer) | | — | (7) | | * |
Sonya J. Rosenbach (Former Chief Accounting Officer and Treasurer) | | — | (8) | | * |
Joshua J. Widoff (Senior Vice President, General Counsel and Secretary) | | — | | | * |
Beneficial ownership of common stock and OP Units by all directors and executive officers as a group (7 persons)(3) | | 38,300 | (9) | | — |
| (1) | Except as otherwise indicated below, each beneficial owner has the sole power to vote and dispose of all common stock held by that beneficial owner. Beneficial ownership is determined in accordance with Rule 13d-3 under the Exchange Act. Common stock issuable pursuant to options, to the extent such options are exercisable within 60 days, are treated as beneficially owned and outstanding for the purpose of computing the percentage ownership of the person holding the option, but are not treated as outstanding for the purpose of computing the percentage ownership of any other person. |
| (2) | Montecito Investments, LLC is presently directly or indirectly controlled by Evan H. Zucker. |
| (3) | The Advisor and the parent of the Advisor are presently each directly or indirectly controlled by one or more of the following and/or their affiliates: John A. Blumberg, Thomas I. Florence, James R. Mulvihill and Evan H. Zucker. With respect to Mr. Blumberg, his beneficial ownership consists solely of 20,000 OP Units held by the Advisor. Mr. Blumberg disclaims beneficial ownership of the OP Units held by the Advisor except to the extent of his pecuniary interest therein. |
| (4) | Represents OP Units that are redeemable for shares of our common stock under certain circumstances. No OP Units have been redeemed for shares of our common stock as of December 31, 2008. For purposes of the percentages on this table, we have assumed full redemption of OP Units for shares of our common stock. |
| (5) | Represents Special Units that are entitled to distributions from the Operating Partnership under certain circumstances. See Note 12 to our consolidated financial statements in “Item 8. Financial Statements and Supplementary Data” of this Annual Report on Form 10-K. |
68
| (6) | Amounts represent vested options as of December 31, 2008. On April 3, 2006, pursuant to the terms of our equity incentive plan, each of our independent directors, Charles B. Duke, John P. Woodberry and Daniel J. Sullivan, was automatically granted a non-qualified option to purchase 10,000 shares of our common stock. Each such option has a maximum term of ten years and will vest according to the following schedule: 20% of the covered shares on the date of grant, and an additional 20% of such shares on each of the first four anniversaries of the date of grant, subject in each case to the director continuing to serve on our board as of such vesting date. On August 27, 2007, each of our independent directors, Charles B. Duke, John P. Woodberry and Daniel J. Sullivan, was granted an option to purchase 5,000 shares of our common stock. These options vest 100% two years after the grant date. On August 21, 2008, each of our independent directors, Charles B. Duke, John P. Woodberry and Daniel J. Sullivan, was granted an option to purchase 5,000 shares of our common stock pursuant to our equity incentive plan with an exercise price equal to $11.00 per share, in connection with our 2008 Annual Meeting of Stockholders. These options fully vest two years after the grant date. |
| (7) | Michael J. Kelly served as our Chief Acquisitions Officer from August 2007 through June 2008. |
| (8) | Sonya J. Rosenbach served as our Chief Accounting Officer and Treasurer from March 2007 through June 2008. |
| (9) | Includes 20,000 of OP Units and options to purchase 12,000 shares of our common stock. |
The following table further describes our equity incentive plan as of December 31, 2008.
| | | | | | | |
| | | Equity Compensation Plan Information |
Plan Category | | Number of securities to be
issued upon exercise of
outstanding options,
warrants and rights | | Weighted-average exercise
price of outstanding
options, warrants and
rights | | Number of securities
remaining available for
future issuance under
equity compensation plans |
Equity compensation plans approved by security holders | | 60,000 | | $ | 11.00 | | 140,000 |
Equity compensation plans not approved by security holders | | — | | $ | — | | — |
| | | | | | | |
Total | | 60,000 | | $ | 11.00 | | 140,000 |
| | | | | | | |
| ITEM 13. | CERTAIN RELATIONSHIPS AND RELATED TRANSACTIONS, AND DIRECTOR INDEPENDENCE |
The Advisory Agreement
The Advisor is an affiliate of ours. We rely on the Advisor to manage our day-to-day activities and to implement our investment strategy. We, the Operating Partnership and the Advisor are party to an Advisory Agreement, dated January 9, 2006, as amended. The term of the Advisory Agreement is for one year and expires in January of each calendar year, subject to renewals by our board of directors for an unlimited number of successive one-year periods. We renewed the Advisory Agreement in January 2009. The Advisor performs its duties and responsibilities under the Advisory Agreement as our fiduciary. Our officers and our affiliated director are all employees or principals of the Advisor. See “Item 10. Directors, Executive Officers and Corporate Governance” for names and biographical information of our directors and officers.
Under the terms of the Advisory Agreement, the Advisor will use its best efforts, subject to the oversight, review and approval of the board of directors, to perform the following:
| | • | | Participate in formulating an investment strategy and asset allocation framework consistent with achieving our investment objectives; |
| | • | | Research, identify, review and recommend to our board of directors for approval real property, real estate securities and debt related acquisitions and dispositions consistent with our investment policies and objectives; |
| | • | | Structure the terms and conditions of transactions pursuant to which acquisitions and dispositions of real properties, securities and debt related assets will be made; |
69
| | • | | Actively oversee and manage our real property, securities and debt related investment portfolios for purposes of meeting our investment objectives; |
| | • | | Manage our day-to-day affairs, including financial accounting and reporting, investor relations, marketing, informational systems and other administrative services on our behalf; |
| | • | | Select joint venture partners and product specialists, structure corresponding agreements and oversee and monitor these relationships; |
| | • | | Arrange for financing and refinancing of our assets; and |
| | • | | Recommend various Liquidity Events to our board of directors, when appropriate. |
The independent directors will evaluate the performance of the Advisor before renewing the Advisory Agreement. The Advisory Agreement may be terminated:
| | • | | Immediately by us for “cause,” or upon the bankruptcy of the Advisor, or upon a material breach of the Advisory Agreement by the Advisor; |
| | • | | Without cause by a majority of our independent directors upon 60 days’ written notice; or |
| | • | | With “good reason” by the Advisor upon 60 days’ written notice. |
“Good reason” is defined in the Advisory Agreement to mean either any failure by us to obtain a satisfactory agreement from any successor to assume and agree to perform our obligations under the Advisory Agreement or any material breach of the Advisory Agreement of any nature whatsoever by us. “Cause” is defined in the Advisory Agreement to mean fraud, criminal conduct, willful misconduct or willful or negligent breach of fiduciary duty by the Advisor or a material breach of the Advisory Agreement by the Advisor.
In the event of the termination of the Advisory Agreement, the Advisor will cooperate with us and take all reasonable steps requested to assist the board of directors in making an orderly transition of the advisory function. Before selecting a successor advisor, the board of directors must determine that any successor advisor possesses sufficient qualifications to perform the advisory function and to justify the compensation it would receive from us.
Compensation to the Advisor and Affiliates
The Advisor and other affiliates receive compensation and fees for services related to our public offerings and for the investment and management of our assets, subject to review and approval of our independent directors. These include sales commissions, dealer manager fees, acquisition fees, asset management fees, disposition fees, property management fees, real estate commissions and potential other fees. See Note 13 to our consolidated financial statements in “Item 8. Financial Statements and Supplementary Data” of this Annual Report on Form 10-K for a detailed discussion of each of these fees, commissions and other forms of compensation.
In addition, Dividend Capital Total Advisors Group LLC, the parent of the Advisor, has been issued and owns partnership units in the Operating Partnership constituting a separate series of partnership interests with special distribution rights, which we refer to as the “Special Units.” See Note 11 to our consolidated financial statements in “Item 8. Financial Statements and Supplementary Data” of this Annual Report on Form 10-K for a detailed discussion of the Special Units.
Dealer Manager Agreement
We have entered into a dealer manager agreement dated January 22, 2008, or the “Dealer Manager Agreement,” with Dividend Capital Securities LLC, or the “Dealer Manager,” in connection with our public offerings. The Dealer Manager is an affiliate of ours and a member firm of the FINRA. The Dealer Manager was organized in December 2001 for the purpose of participating in and facilitating the distribution of securities of Dividend Capital affiliated entities. Under the Dealer Manager Agreement, the Dealer Manager provides certain sales, promotional and marketing services to us in connection with the distribution of the shares of common stock offered pursuant to our prospectus. We pay the Dealer Manager a sales commission of up to 6.0% of the gross proceeds from the sale of shares of our common stock sold in our offerings and a dealer manager fee of up to 2.5% of the gross proceeds from the sale of shares of our common stock sold in our offerings. In addition, we will also reimburse the expenses of participating dealers up to a maximum of 0.5% of the aggregate gross offering proceeds from the sale of shares of our common stock sold in the primary offering for bona fide due diligence expenses.
70
Property Management Agreement
We have entered into a property management agreement dated January 9, 2006, or the “Property Management Agreement,” with the Property Manager. The Property Manager may perform certain property management services for us and the Operating Partnership. The Property Manager is an affiliate of the Advisor and was organized in April 2002 to lease and manage real properties acquired by Dividend Capital affiliated entities or other third parties. We will pay the Property Manager a property management fee equal to a market based percentage of the annual gross revenues of each of our real properties managed by the Property Manager. The actual percentage will be variable and is dependent upon geographic location and product type (such as office, industrial, retail, multifamily, hospitality and other property types). In addition, we may pay the Property Manager a separate fee for the one-time initial lease-up of newly constructed real properties it manages for us in an amount not to exceed the fee customarily charged in arm’s length transactions by others rendering similar services in the same geographic area for similar real properties as determined by a survey of brokers and agents in such area. In the event that the Property Manager assists a tenant with tenant improvements, a separate fee may be charged to the tenant and paid by the tenant. This fee will not exceed 5% of the cost of the tenant improvements. The Property Manager will only provide these services if the provision of the services does not cause any of our income from the applicable real property to be treated as other than rents from real property for purposes of the applicable REIT requirements.
Conflicts of Interest
The Advisor and certain of our other affiliates are subject to conflicts of interest in connection with the management of our business affairs, including the following:
| | • | | The directors, officers and other employees of the Advisor must allocate their time between advising us and managing other real estate projects and business activities in which they may be involved; |
| | • | | The compensation payable by us to the Advisor and other affiliates may not be on terms that would result from arm’s length negotiations between unaffiliated parties and is payable, in most cases, whether or not our stockholders receive distributions; |
| | • | | We cannot guarantee that the terms of any joint venture entered into with affiliated entities proposed by the Advisor will be equally beneficial to us as those that would result from arm’s length negotiations between unaffiliated parties; |
| | • | | We may compete with certain affiliates for investments, subjecting the Advisor and its affiliates to certain conflicts of interest in evaluating the suitability of investment opportunities and making or recommending acquisitions on our behalf; |
| | • | | Regardless of the quality of the assets acquired, the services provided to us or whether we make distributions to our stockholders, the Advisor and its affiliates will receive certain fees in connection with transactions involving the purchase, management and sale of our investments; and |
| | • | | The Property Manager and the Dealer Manager are affiliates of ours. As a result, (i) we may not always have the benefit of independent property management, (ii) we do not have the benefit of an independent dealer manager and (iii) stockholders do not have the benefit of an independent third party review of our public offerings to the same extent as if we and the Dealer Manager were unaffiliated. |
| | • | | We may enter into joint ventures or other arrangements with affiliates of the Advisor to acquire, develop and/or manage real properties. Our affiliated joint venture partners may have economic or business interests or goals which are or that may become inconsistent with our business interests or goals. In addition, should any such joint venture be consummated, the Advisor may face a conflict in structuring the terms of the relationship between our interests and the interest of the affiliated joint venture partner and in managing the joint venture. As of December 31, 2008, our Advisor had entered into joint venture and/or product specialist arrangements with one current affiliate (Dividend Capital Investments LLC) and one former affiliate (DCT Industrial Trust Inc.), as discussed below in more detail. |
Dividend Capital Investments LLC
On June 12, 2006, our Advisor entered into a product specialist agreement with Dividend Capital Investments LLC (“DCI”), an affiliate of ours, in connection with investment management services related to our investments in real estate securities assets. Pursuant to this agreement, a portion of the asset management fee that our Advisor receives from us related to securities investments is reallowed to DCI in exchange for services provided.
DCT Industrial Trust Inc.
On September 1, 2006, our Advisor entered into a product specialist agreement with DCT Industrial Trust Inc. (“DCT”), a former affiliate of ours, in connection with acquisition and asset management services related to our industrial real property investments. Pursuant to this agreement, a portion of the acquisition and asset management fees that our Advisor receives from us related to specific industrial real property investments is reallowed to DCT in exchange for services provided. In addition, we hade entered into three separate joint venture agreements with DCT as of December 31, 2009. See Note 13 to Item. 8 “Financial Statements and Supplementary Data” to this Annual Report on Form 10-K for additional discussion of the terms of these joint ventures.
71
Conflict Resolution Procedures
We are subject to potential conflicts of interest arising out of our relationship with the Advisor and its affiliates. These conflicts may relate to compensation arrangements, the allocation of investment opportunities, the terms and conditions on which various transactions might be entered into by us and the Advisor or its affiliates and other situations in which our interests may differ from those of the Advisor or its affiliates. On January 9, 2006, our board of directors adopted a conflicts of interest resolutions and procedures policy.
Our independent directors, acting as a group, will resolve potential conflicts of interest whenever they determine that the exercise of independent judgment by the board of directors or the Advisor or its affiliates could reasonably be compromised. However, the independent directors may not take any action which, under Maryland law, must be taken by the entire board or which is otherwise not within their authority. The independent directors, as a group, are authorized to retain their own legal and financial advisors. Those conflict of interest matters that cannot be delegated to the independent directors, as a group, under Maryland law must be acted upon by both the board of directors and the independent directors. Our Board of Directors consists of John A. Blumberg, Charles B. Duke, Daniel J. Sullivan, and John P. Woodberry. The Board has determined that all of our directors except Mr. Blumberg are independent.
| ITEM 14. | PRINCIPAL ACCOUNTING FEES AND SERVICES |
During the year ended December 31, 2008, we engaged KPMG LLP to provide us with audit services. Services provided included the examination of annual financial statements, review of unaudited quarterly financial information, review and consultation regarding filings with the Commission, services related to management’s evaluation of internal accounting controls and consultation on financial accounting and reporting matters.
The audit committee of our board of directors has considered all services provided by the independent registered public accounting firm to us and concluded this involvement is compatible with maintaining the auditors’ independence.
The audit committee of our board of directors is responsible for appointing our independent registered public accounting firm and approving the terms of the independent registered public accounting firm’s services. All services were pre-approved by the audit committee of our board of directors.
The audit committee of our board of directors is currently developing a policy for the pre-approval of all audit and permissible non-audit services to be provided by the independent registered public accounting firm. This policy would be subject to certain guidelines and pre-approved services that, in the judgment of management and the auditor, would not violate the auditor’s independence. At the end of each quarter, or at any time cumulative fees not previously reported to the audit committee of our board of directors exceed $500,000, management intends to create a schedule of the services performed which would then be subject to review and approval by the audit committee.
Fees
Total fees for the years ended December 31, 2008, 2007 and 2006, were approximately $816,000, $537,000 and $417,000, respectively. All fees were determined to be Audit Fees. Audit Fees are fees incurred for the audits and quarterly reviews of the consolidated financial statements; consultation on audit related matters and required review of the Commission filings. This category also includes review of, and consents for, filings with the Commission related to our public offerings.
PART IV
| ITEM 15. | EXHIBITS AND FINANCIAL STATEMENT SCHEDULES |
| (a) | Financial Statements and Schedules. |
Reference is made to the “Index to Consolidated Financial Statements” on page F-1 of this Annual Report on Form 10-K and the consolidated financial statements included therein, beginning on page F-2.
All other financial statement schedules are not required under the related instructions, or they have been omitted either because they are not significant or the required information has been disclosed in the consolidated financial statements and the notes related thereto.
72
The following exhibits are filed as part of this Annual Report on Form 10-K:
| | |
| |
| 1.1 | | Dealer Manager Agreement.† |
| |
| 3.1 | | Dividend Capital Total Realty Trust Inc. Fifth Articles of Amendment and Restatement.† |
| |
| 3.2 | | Dividend Capital Total Realty Trust Inc. Second Amended and Restated Bylaws. † |
| |
| 4.2 | | Second Amended and Restated Distribution Reinvestment Plan. † |
| |
| 10.1 | | Fifth Amended and Restated Advisory Agreement among Dividend Capital Total Realty Trust Inc., Dividend Capital Total Realty Operating Partnership L.P. and Dividend Capital Total Advisors LLC. † |
| |
| 10.2 | | Property Management Agreement between Dividend Capital Total Realty Trust Inc. and Dividend Capital Property Management LLC.† |
| |
| 10.3 | | Form of Indemnification Agreement between Dividend Capital Total Realty Trust Inc. and the officers and directors of Dividend Capital Total Realty Trust Inc.† |
| |
| 10.4 | | Third Amended and Restated Operating Partnership Agreement of Dividend Capital Total Realty Operating Partnership LP.† |
| |
| 10.5 | | Dividend Capital Total Realty Trust Inc. Equity Incentive Plan.† |
| |
| 10.6 | | Form of Director Option Agreement.† |
| |
| 10.7 | | First Amendment to Partnership Agreement between TRT Industrial Fund I LLC and DCT Industrial Fund II LLC.† |
| |
| 10.8 | | Partnership Agreement between TRT Industrial Fund II LLC and DCT Industrial Fund III LLC.† |
| |
| 10.9 | | Partnership Agreement of TRT DDR Venture I General Partnership between DDR TRT GP LLC and TRT-DDR Joint Venture I Owner LLC.† |
| |
| 10.10 | | Contribution and Sale Agreement between JDN Real Estate-Apex L.P., JDN Development Company, Inc., Developers Diversified Realty Corporation, Mt. Nebo Pointe LLC, Centerton Square LLC, as contributors, and a joint venture between an affiliate of Developers Diversified Realty Corporation and Dividend Capital Total Realty Trust Inc. (DDR Portfolio).† |
| |
| 10.11 | | Promissory note secured by a deed of trust between a joint venture between an affiliate of Developers Diversified Realty Corporation and Dividend Capital Total Realty Trust Inc. and Wachovia Bank, National Association (DDR Portfolio).† |
| |
| 10.12 | | Purchase and Sale Agreement between Tedeschi Realty Corporation and various entities affiliated with Tedeschi Realty Corporation, as sellers, and an affiliate of Dividend Capital Total Realty Trust Inc., as buyer (New England Retail Portfolio).† |
| |
| 10.13 | | Promissory note secured by deeds of trust between Dividend Capital Total Realty Trust Inc. and LaSalle Bank National Association (New England Retail Portfolio).† |
| |
| 10.14 | | Form of Management Agreement between various affiliates of Dividend Capital Total Realty Trust Inc. and KeyPoint Partners LLC, as property manager (New England Retail Portfolio).† |
| |
| 10.15 | | Acknowledgement and Post-Closing Agreement between various affiliates of Dividend Capital Total Realty Trust Inc. and LaSalle Bank National Association (New England Retail Portfolio).† |
| |
| 10.16 | | TRT-DCT Joint Venture III Agreement.† |
| |
| 31.1 | | Rule 13a-14(a) Certification of Principal Executive Officer* |
| |
| 31.2 | | Rule 13a-14(a) Certification of Chief Financial Officer* |
| |
| 32.1 | | Section 1350 Certification of Principal Executive Officer* |
| |
| 32.2 | | Section 1350 Certification of Chief Financial Officer* |
73
INDEX TO CONSOLIDATED FINANCIAL STATEMENTS
F-1
Report of Independent Registered Public Accounting Firm
The Board of Directors and Stockholders
Dividend Capital Total Realty Trust Inc.:
We have audited the accompanying consolidated balance sheets of Dividend Capital Total Realty Trust Inc. (the Company) and subsidiaries as of December 31, 2008 and 2007, and the related consolidated statements of operations, stockholders’ equity, and cash flows for each of the years in the three-year period ended December 31, 2008. These consolidated financial statements are the responsibility of the Company’s management. Our responsibility is to express an opinion on these consolidated financial statements based on our audits.
We conducted our audits in accordance with the standards of the Public Company Accounting Oversight Board (United States). Those standards require that we plan and perform the audit to obtain reasonable assurance about whether the financial statements are free of material misstatement. An audit includes examining, on a test basis, evidence supporting the amounts and disclosures in the financial statements. An audit also includes assessing the accounting principles used and significant estimates made by management, as well as evaluating the overall financial statement presentation. We believe that our audits provide a reasonable basis for our opinion.
In our opinion, the consolidated financial statements referred to above present fairly, in all material respects, the financial position of Dividend Capital Total Realty Trust Inc. and subsidiaries as of December 31, 2008 and 2007, and the results of their operations and their cash flows for each of the years in the three-year period ended December 31, 2008, in conformity with U.S. generally accepted accounting principles.
Denver, Colorado
March 27, 2009
F-2
DIVIDEND CAPITAL TOTAL REALTY TRUST INC.
CONSOLIDATED BALANCE SHEETS
(In thousands, except share information)
| | | | | | | | |
| | | As of December 31, | |
| | | 2008 | | | 2007 | |
ASSETS | | | | | | | | |
Investments in real property: | | | | | | | | |
Land | | $ | 334,304 | | | $ | 312,191 | |
Building and improvements | | | 939,829 | | | | 755,425 | |
Intangible lease assets | | | 171,630 | | | | 147,675 | |
Accumulated depreciation and amortization | | | (87,808 | ) | | | (35,616 | ) |
| | | | | | | | |
Total net investments in real property | | | 1,357,955 | | | | 1,179,675 | |
Investment in unconsolidated joint venture | | | 17,532 | | | | — | |
Investments in real estate securities | | | 52,368 | | | | 180,663 | |
Debt related investments, net | | | 88,849 | | | | 104,091 | |
| | | | | | | | |
Total net investments | | | 1,516,704 | | | | 1,464,429 | |
Cash and cash equivalents | | | 540,321 | | | | 291,634 | |
Restricted cash | | | 18,152 | | | | 7,084 | |
Subscriptions receivable | | | 13,004 | | | | 18,361 | |
Other assets, net | | | 32,131 | | | | 30,276 | |
Assets held for sale | | | 3,266 | | | | — | |
| | | | | | | | |
Total Assets | | $ | 2,123,578 | | | $ | 1,811,784 | |
| | | | | | | | |
LIABILITIES AND STOCKHOLDERS’ EQUITY | | | | | | | | |
Liabilities: | | | | | | | | |
Accounts payable and accrued expenses (including $721 and $1,189 due to related parties as of December 31, 2008 and December 31, 2007, respectively) | | $ | 10,529 | | | $ | 10,400 | |
Dividends payable | | | 24,716 | | | | 16,359 | |
Mortgage notes | | | 719,019 | | | | 661,683 | |
Other secured borrowings | | | 15,861 | | | | 37,300 | |
Financing obligations | | | 105,068 | | | | 106,571 | |
Intangible lease liabilities, net | | | 53,969 | | | | 24,089 | |
Derivative instruments | | | 27,213 | | | | 27,949 | |
Other liabilities | | | 7,197 | | | | 7,618 | |
Liabilities related to assets held for sale | | | 140 | | | | — | |
| | | | | | | | |
Total Liabilities | | | 963,712 | | | | 891,969 | |
Minority Interests | | | 73,186 | | | | 18,840 | |
Stockholders’ Equity: | | | | | | | | |
Preferred stock, $0.01 par value; 200,000,000 shares authorized; none outstanding | | | — | | | | — | |
Common stock, $0.01 par value; 1,000,000,000 shares authorized; 159,029,225 and 115,295,632 shares issued and outstanding, as of December 31, 2008 and December 31, 2007, respectively | | | 1,590 | | | | 1,152 | |
Additional paid-in capital | | | 1,431,989 | | | | 1,037,902 | |
Distributions in excess of earnings | | | (304,661 | ) | | | (44,252 | ) |
Accumulated other comprehensive income (loss) | | | (42,238 | ) | | | (93,827 | ) |
| | | | | | | | |
Total Stockholders’ Equity | | | 1,086,680 | | | | 900,975 | |
| | | | | | | | |
Total Liabilities and Stockholders’ Equity | | $ | 2,123,578 | | | $ | 1,811,784 | |
| | | | | | | | |
The accompanying notes are an integral part of these consolidated financial statements.
F-3
DIVIDEND CAPITAL TOTAL REALTY TRUST INC.
CONSOLIDATED STATEMENTS OF OPERATIONS
(In thousands, except per share information)
| | | | | | | | | | | | |
| | | For the Year Ended December 31, | |
| | | 2008 | | | 2007 | | | 2006 | |
REVENUE: | | | | | | | | | | | | |
Rental revenue | | $ | 114,670 | | | $ | 70,424 | | | $ | 5,385 | |
Securities income | | | 17,567 | | | | 15,691 | | | | 881 | |
Debt related income | | | 9,376 | | | | 8,951 | | | | 238 | |
| | | | | | | | | | | | |
Total Revenue | | | 141,613 | | | | 95,066 | | | | 6,504 | |
EXPENSES: | | | | | | | | | | | | |
Rental expense | | | 29,622 | | | | 18,790 | | | | 1,456 | |
Depreciation and amortization expense | | | 52,313 | | | | 31,358 | | | | 2,321 | |
General and administrative expenses | | | 4,232 | | | | 3,784 | | | | 1,305 | |
Asset management fees, related party | | | 11,599 | | | | 8,707 | | | | 722 | |
| | | | | | | | | | | | |
Total Operating Expenses | | | 97,766 | | | | 62,639 | | | | 5,804 | |
Operating Income | | | 43,847 | | | | 32,427 | | | | 700 | |
Other Income (Expenses): | | | | | | | | | | | | |
Equity in earnings of unconsolidated joint venture | | | 586 | | | | — | | | | — | |
Interest income | | | 11,751 | | | | 11,927 | | | | 1,259 | |
Interest expense | | | (45,112 | ) | | | (33,600 | ) | | | (2,076 | ) |
Loss on derivatives | | | (11,673 | ) | | | (557 | ) | | | — | |
Gain on extinguishment of debt | | | 9,309 | | | | — | | | | — | |
Other-than-temporary impairment on securities | | | (192,724 | ) | | | — | | | | — | |
| | | | | | | | | | | | |
Net Income (Loss) Before Minority Interests | | | (184,016 | ) | | | 10,197 | | | | (117 | ) |
Minority Interests | | | 7,395 | | | | 868 | | | | 65 | |
| | | | | | | | | | | | |
Net Income (Loss) From Continuing Operations | | | (176,621 | ) | | | 11,065 | | | | (52 | ) |
Discontinued operations: | | | | | | | | | | | | |
Income from discontinued operations, net of minority interest | | | 66 | | | | — | | | | — | |
Gain on dispositions of real estate interests, net of minority interest | | | 169 | | | | — | | | | — | |
| | | | | | | | | | | | |
NET INCOME (LOSS) | | $ | (176,386 | ) | | $ | 11,065 | | | $ | (52 | ) |
| | | | | | | | | | | | |
NET INCOME (LOSS) PER COMMON SHARE-BASIC | | | | | | | | | | | | |
Net income (loss) from continuing operations | | $ | (1.26 | ) | | $ | 0.13 | | | $ | (0.01 | ) |
Net income (loss) from discontinued operations, net of minority interest | | | (0.00 | ) | | | — | | | | — | |
| | | | | | | | | | | | |
Net income (loss) | | $ | (1.26 | ) | | $ | 0.13 | | | $ | (0.01 | ) |
| | | | | | | | | | | | |
NET INCOME (LOSS) PER COMMON SHARE-DILUTED | | | | | | | | | | | | |
Net income (loss) from continuing operations | | $ | (1.26 | ) | | $ | 0.13 | | | $ | (0.02 | ) |
Net income (loss) from discontinued operations, net of minority interest | | | (0.00 | ) | | | — | | | | — | |
| | | | | | | | | | | | |
Net income (loss) | | $ | (1.26 | ) | | $ | 0.13 | | | $ | (0.02 | ) |
| | | | | | | | | | | | |
WEIGHTED AVERAGE NUMBER OF COMMON SHARES OUTSTANDING | | | | | | | | | | | | |
Basic | | | 140,106 | | | | 85,473 | | | | 7,087 | |
| | | | | | | | | | | | |
Diluted | | | 144,533 | | | | 85,493 | | | | 7,107 | |
| | | | | | | | | | | | |
The accompanying notes are an integral part of these consolidated financial statements.
F-4
DIVIDEND CAPITAL TOTAL REALTY TRUST INC.
CONSOLIDATED STATEMENTS OF STOCKHOLDERS’ EQUITY
(In thousands)
| | | | | | | | | | | | | | | | | | | | | | | |
| | | Common Stock | | | Additional
Paid-in
Capital | | | Distributions in
Excess of
Earnings | | | Accumulated
Other
Comprehensive
Income (Loss) | | | Total
Stockholders’
Equity | |
| | | Shares | | | Amount | | | | | |
Balances, December 31, 2005 | | — | | | $ | — | | | $ | 2 | | | $ | — | | | $ | — | | | $ | 2 | |
Comprehensive loss: | | | | | | | | | | | | | | | | | | | | | | | |
Net loss | | — | | | | — | | | | — | | | | (52 | ) | | | — | | | | (52 | ) |
Net unrealized change from available-for-sale securities | | — | | | | — | | | | — | | | | — | | | | 973 | | | | 973 | |
| | | | | | | | | | | | | | | | | | | | | | | |
Comprehensive loss | | | | | | | | | | | | | | | | | | | | | | 921 | |
Issuance of common stock, net of offering costs | | 32,305 | | | | 323 | | | | 286,384 | | | | — | | | | — | | | | 286,707 | |
Amortization of stock based compensation | | — | | | | — | | | | 5 | | | | — | | | | — | | | | 5 | |
Distributions on common stock | | — | | | | — | | | | — | | | | (4,090 | ) | | | — | | | | (4,090 | ) |
| | | | | | | | | | | | | | | | | | | | | | | |
Balances, December 31, 2006 | | 32,305 | | | | 323 | | | | 286,391 | | | | (4,142 | ) | | | 973 | | | | 283,545 | |
| | | | | | | | | | | | | | | | | | | | | | | |
Comprehensive loss: | | | | | | | | | | | | | | | | | | | | | | | |
Net income | | — | | | | — | | | | — | | | | 11,065 | | | | — | | | | 11,065 | |
Net unrealized change from available-for-sale securities | | — | | | | — | | | | — | | | | — | | | | (67,132 | ) | | | (67,132 | ) |
Cash flow hedging derivatives | | — | | | | — | | | | — | | | | — | | | | (27,668 | ) | | | (27,668 | ) |
| | | | | | | | | | | | | | | | | | | | | | | |
Comprehensive loss | | | | | | | | | | | | | | | | | | | | | | (83,735 | ) |
Issuance of common stock, net of offering costs | | 83,199 | | | | 831 | | | | 753,394 | | | | — | | | | — | | | | 754,225 | |
Redemptions of common stock | | (208 | ) | | | (2 | ) | | | (1,893 | ) | | | — | | | | — | | | | (1,895 | ) |
Amortization of stock based compensation | | — | | | | — | | | | 10 | | | | — | | | | — | | | | 10 | |
Distributions on common stock | | — | | | | — | | | | — | | | | (51,175 | ) | | | — | | | | (51,175 | ) |
| | | | | | | | | | | | | | | | | | | | | | | |
Balances, December 31, 2007 | | 115,296 | | | | 1,152 | | | | 1,037,902 | | | | (44,252 | ) | | | (93,827 | ) | | | 900,975 | |
| | | | | | | | | | | | | | | | | | | | | | | |
Comprehensive loss: | | | | | | | | | | | | | | | | | | | | | | | |
Net loss | | — | | | | — | | | | — | | | | (176,386 | ) | | | — | | | | (176,386 | ) |
Net unrealized change from available-for-sale securities | | — | | | | — | | | | — | | | | — | | | | 63,411 | | | | — 63,411 | |
Cash flow hedging derivatives | | — | | | | — | | | | — | | | | — | | | | (11,822 | ) | | | (11,822 | ) |
| | | | | | | | | | | | | | | | | | | | | | | |
Comprehensive loss | | | | | | | | | | | | | | | | | | | | | | (124,797 | ) |
Issuance of common stock, net of offering costs | | 49,751 | | | | 498 | | | | 449,612 | | | | — | | | | — | | | | 450,110 | |
Redemptions of common stock | | (6,018 | ) | | | (60 | ) | | | (55,537 | ) | | | — | | | | — | | | | (55,597 | ) |
Amortization of stock based compensation | | — | | | | — | | | | 12 | | | | — | | | | — | | | | 12 | |
Distributions on common stock | | — | | | | — | | | | — | | | | (84,023 | ) | | | — | | | | (84,023 | ) |
| | | | | | | | | | | | | | | | | | | | | | | |
Balances, December 31, 2008 | | 159,029 | | | $ | 1,590 | | | $ | 1,431,989 | | | $ | (304,661 | ) | | $ | (42,238 | ) | | $ | 1,086,680 | |
| | | | | | | | | | | | | | | | | | | | | | | |
The accompanying notes are an integral part of these consolidated financial statements.
F-5
DIVIDEND CAPITAL TOTAL REALTY TRUST INC.
CONSOLIDATED STATEMENTS OF CASH FLOWS
(In thousands)
| | | | | | | | | | | | |
| | | For the Year Ended December 31, | |
| | | 2008 | | | 2007 | | | 2006 | |
OPERATING ACTIVITIES: | | | | | | | | | | | | |
Net income (loss) | | $ | (176,386 | ) | | $ | 11,065 | | | $ | (52 | ) |
Adjustments to reconcile net income (loss) to net cash provided by operating activities: | | | | | | | | | | | | |
Minority interests | | | (7,395 | ) | | | (868 | ) | | | (65 | ) |
Equity in earnings of unconsolidated joint venture | | | (187 | ) | | | — | | | | — | |
Real estate depreciation and amortization expense | | | 52,313 | | | | 31,358 | | | | 2,321 | |
Net accretion of real estate securities discount and premiums | | | (1,114 | ) | | | — | | | | — | |
Other depreciation and amortization | | | (2,856 | ) | | | 56 | | | | 111 | |
Loss on derivatives | | | 11,673 | | | | 557 | | | | — | |
Gain on the sale of real estate | | | (203 | ) | | | — | | | | — | |
Gain on extinguishment of debt | | | (9,309 | ) | | | — | | | | — | |
Impairment of available-for-sale securities, net | | | 192,724 | | | | — | | | | — | |
Changes in operating assets and liabilities: | | | | | | | | | | | | |
(Increase) decrease in restricted cash | | | 735 | | | | (6,422 | ) | | | (657 | ) |
Decrease in other assets | | | (1,183 | ) | | | (13,844 | ) | | | (1,361 | ) |
Increase in accounts payable and accrued expenses | | | 87 | | | | 7,008 | | | | 1,722 | |
Increase in other liabilities | | | 1,446 | | | | 2,862 | | | | 675 | |
| | | | | | | | | | | | |
Net cash provided by operating activities | | | 60,345 | | | | 31,772 | | | | 2,694 | |
INVESTING ACTIVITIES: | | | | | | | | | | | | |
Investment in real property | | | (136,147 | ) | | | (881,631 | ) | | | (253,238 | ) |
Investment in unconsolidated joint venture | | | (17,345 | ) | | | — | | | | — | |
Investment in real estate securities | | | — | | | | (207,862 | ) | | | (38,932 | ) |
Principal collections on real estate securities | | | 96 | | | | — | | | | — | |
Investment in debt related investments | | | (9,062 | ) | | | (88,510 | ) | | | (28,256 | ) |
Principal collections on debt related investments | | | 35,233 | | | | 12,665 | | | | — | |
| | | | | | | | | | | | |
Net cash used in investing activities | | | (127,225 | ) | | | (1,165,338 | ) | | | (320,426 | ) |
FINANCING ACTIVITIES: | | | | | | | | | | | | |
Mortgage note proceeds | | | 118,294 | | | | 574,624 | | | | 84,450 | |
Mortgage note principal repayments | | | (113,386 | ) | | | (46,137 | ) | | | — | |
Proceeds from other secured borrowings | | | — | | | | 40,000 | | | | — | |
Repayment of other secured borrowings | | | (32,192 | ) | | | (2,700 | ) | | | — | |
Proceeds (repayment) of master repurchase facility | | | — | | | | (10,919 | ) | | | 10,919 | |
Financing obligation proceeds | | | 64,190 | | | | 67,554 | | | | 39,017 | |
Settlement of cash flow hedging derivatives | | | (23,966 | ) | | | (241 | ) | | | — | |
Proceeds from minority interest contributions | | | 8,323 | | | | 24,351 | | | | 11,537 | |
Proceeds from sale of common stock | | | 449,063 | | | | 829,591 | | | | 271,360 | |
Offering costs for issuance of common stock, related party | | | (38,850 | ) | | | (76,033 | ) | | | (24,244 | ) |
Redemption of common shares | | | (55,597 | ) | | | (1,895 | ) | | | — | |
Distributions to minority interest holders | | | (5,566 | ) | | | (14,880 | ) | | | (1,415 | ) |
Distributions to common stockholders | | | (30,995 | ) | | | (15,261 | ) | | | (604 | ) |
Purchases of undivided tenancy in common interests | | | (997 | ) | | | — | | | | — | |
(Increase) decrease in restricted cash | | | (14,072 | ) | | | 1,120 | | | | (1,125 | ) |
(Increase) decrease in deferred financing costs | | | (8,682 | ) | | | (11,291 | ) | | | (4,848 | ) |
| | | | | | | | | | | | |
Net cash provided by financing activities | | | 315,567 | | | | 1,357,883 | | | | 385,047 | |
NET INCREASE IN CASH AND CASH EQUIVALENTS | | | 248,687 | | | | 224,317 | | | | 67,315 | |
CASH AND CASH EQUIVALENTS, beginning of year | | | 291,634 | | | | 67,317 | | | | 2 | |
CASH AND CASH EQUIVALENTS, end of year | | $ | 540,321 | | | $ | 291,634 | | | $ | 67,317 | |
| | | | | | | | | | | | |
Supplemental Disclosure of Cash Flow Information: | | | | | | | | | | | | |
Assumed mortgages | | $ | 57,200 | | | $ | 48,156 | | | $ | — | |
Amount issued pursuant to the distribution reinvestment plan | | $ | 44,788 | | | $ | 22,296 | | | $ | 767 | |
Cash paid for interest | | $ | 44,321 | | | $ | 29,987 | | | $ | 1,474 | |
Issuances of OP Units for fractional interests | | $ | 64,893 | | | $ | — | | | $ | — | |
Non-cash financing for debt related investment | | $ | 10,753 | | | $ | — | | | $ | — | |
The accompanying notes are an integral part of these consolidated financial statements.
F-6
DIVIDEND CAPITAL TOTAL REALTY TRUST INC.
NOTES TO CONSOLIDATED FINANCIAL STATEMENTS
December 31, 2008
Dividend Capital Total Realty Trust Inc. is a Maryland corporation formed on April 11, 2005 to invest in a diverse portfolio of real property and real estate related investments. As used herein, “the Company,” “we,” “our” and “us” refer to Dividend Capital Total Realty Trust Inc. and its consolidated subsidiaries and partnerships except where the context otherwise requires.
We operate in a manner intended to qualify as a real estate investment trust (“REIT”) for federal income tax purposes, commencing with the taxable year ended December 31, 2006, when we first elected REIT status. We utilize an Umbrella Partnership Real Estate Investment Trust (“UPREIT”) organizational structure to hold all or substantially all of our assets through our operating partnership, Dividend Capital Total Realty Operating Partnership, L.P. (the “Operating Partnership”). Furthermore, our Operating Partnership wholly owns a taxable REIT subsidiary, DCTRT Leasing Corp. (the “TRS”), through which we execute certain business transactions that might otherwise have an adverse impact on our status as a REIT if such business transactions were to occur directly or indirectly through the Operating Partnership.
Our day-to-day activities are managed by Dividend Capital Total Advisors LLC (the “Advisor”), an affiliate, under the terms and conditions of an advisory agreement (the “Advisory Agreement”). In addition, under the terms of certain dealer manager agreements, Dividend Capital Securities LLC (the “Dealer Manager”), an affiliate, serves as the dealer manager of our public and private offerings. The Advisor and its affiliates, including the Dealer Manager, receive various forms of compensation, reimbursements and fees for services relating to our public and private offerings and for the investment and management of our real estate assets.
We raise equity capital through (i) selling shares of our common stock through our public offerings, (ii) reinvestment of dividends by our stockholders through our distribution reinvestment plan and (iii) our Operating Partnership’s private placements (see Note 8). As of December 31, 2008, we had raised approximately $1.8 billion in gross proceeds, comprised of the following: (i) selling approximately 150.5 million shares of our common stock, net of redemptions, for gross proceeds of approximately $1.5 billion, (ii) issuing approximately 8.5 million shares of our common stock for gross proceeds of approximately $80.8 million pursuant to our distribution reinvestment plan and (iii) raising approximately $170.8 million pursuant to our Operating Partnership’s private placements.
We have invested in a diverse portfolio of real properties, real estate securities, and debt related investments. We primarily invest in real property, consisting of office, industrial, retail, multifamily, hospitality and other properties, primarily located in North America. Additionally, we invest in real estate securities, including securities issued by other real estate companies, commercial mortgage backed securities (“CMBS”), commercial real estate collateralized debt obligations (“CRE-CDOs”) and similar investments and certain debt related investments, including originating and participating in mortgage loans secured by real estate, junior portions of first mortgages on commercial properties (“B-notes”), mezzanine debt and other related investments.
As of December 31, 2008, we had gross investments of approximately $1.6 billion, comprised of approximately (i) $1.4 billion in real property, (ii) $52.4 million in real estate securities and (iii) $106.4 million in debt related investments, including a $17.5 million investment in an unconsolidated joint venture.
| 2. | SUMMARY OF SIGNIFICANT ACCOUNTING POLICIES |
Principles of Consolidation
Due to our control of the Operating Partnership through our sole general partnership interest and the limited rights of the limited partners, we consolidate the Operating Partnership and limited partner interests not held by us are reflected as minority interests in the accompanying consolidated financial statements. All significant intercompany accounts and transactions have been eliminated in consolidation.
Our consolidated financial statements also include the accounts of our consolidated subsidiaries and joint ventures through which we are the primary beneficiary under Financial Accounting Standards Board (“FASB”) Interpretation No. 46(R),Consolidation of Variable Interest Entities—an Interpretation of ARB No. 51 (“FIN No. 46(R)”), or through which we have a controlling interest.
F-7
In determining whether we have a controlling interest in a joint venture and the requirement to consolidate the accounts of that entity, management considers factors such as ownership interest, board representation, management representation, authority to make decisions, and contractual and substantive participating rights of the partners/members as well as whether the entity is a variable interest entity in which it will absorb the majority of the entity’s expected losses, if they occur, or receive the majority of the expected residual returns, if they occur, or both.
Judgments made by management with respect to our level of influence or control of an entity and whether we are the primary beneficiary of a variable interest entity as defined by FIN No. 46(R) involve consideration of various factors including the form of our ownership interest, the size of our investment (including loans) and our ability to participate in major policy making decisions. Management’s ability to correctly assess its influence or control over an entity affects the presentation of these investments in our consolidated financial statements and, consequently, our financial position and specific items in our results of operations that are used by our stockholders, lenders and others in their evaluation of us.
Generally, we consolidate real estate partnerships and other entities that are not variable interest entities (as defined by FIN No. 46(R)) when we own, directly or indirectly, a majority voting interest in the entity. Our analysis of whether we consolidate real estate partnerships and other entities that are not variable interest entities is performed pursuant to several accounting pronouncements including: (i) Emerging Issues Task Force (“EITF”) Issue No. 04-5,Determining Whether a General Partner, or the General Partners as a Group, Controls a Limited Partnership or Similar Entity When the Limited Partners Have Certain Rights, (ii) ARB No. 51,Consolidated Financial Statements (“ARB No. 51”) and (iii) AICPA Statement of Position 78-9,Accounting for Investments in Real Estate Ventures.
Investments
Real Property
Historically, we have capitalized direct costs associated with the acquisition, development or improvement of real property, including acquisition fees paid to the Advisor. Costs associated with the pursuit of acquisitions or developments are capitalized as incurred and, if the pursuit has abandoned, these costs were expensed in the period in which the pursuit was abandoned. Costs associated with the improvement of our real property assets were also capitalized as incurred. Costs incurred in making repairs and maintaining real estate assets were expensed as incurred. The results of operations for acquired real property are included in our accompanying consolidated statements of operations from their respective acquisition dates.
For periods prior to January 1, 2009, upon acquisition, the total cost of a property is allocated to land, building, building and land improvements, tenant improvements and intangible lease assets and liabilities pursuant to Statement of Financial Accounting Standards (“SFAS”) No. 141,Business Combinations (“SFAS No. 141”). The allocation of the total cost to land, building, building improvements and tenant improvements was based on our estimate of the property’s as-if vacant fair value. The as-if vacant fair value is calculated by using all available information such as the replacement cost of such asset, appraisals, property condition reports, market data and other related information. Pursuant to SFAS No. 141, the difference between the fair value and the face value of debt assumed in an acquisition is recorded as a premium or discount and amortized to interest expense over the life of the debt assumed. The allocation of the total cost of a property to an intangible lease asset includes the value associated with the in-place leases which may include lost rent, leasing commissions, legal and other costs.
We record acquired “above” and “below-market” leases at their fair value equal to the difference between the contractual amounts to be paid pursuant to each in-place lease and management’s estimate of fair market lease rates for each corresponding in-place lease, measured over a period equal to the remaining term of the lease for above-market leases and the remaining term of the lease plus the term of any below-market fixed-rate renewal option periods for below-market leases. In addition, we allocate a portion of the purchase price of an acquired property to the estimated value of customer relationships, if any. As of December 31, 2008, we had not recorded any estimated value to customer relationships.
Intangible in-place lease assets are amortized over the corresponding lease term. Above market lease assets are amortized as a reduction in rental revenue over the corresponding lease term. Below market lease liabilities are amortized as an increase in rental revenue over the corresponding lease term, plus any applicable fixed-rate renewal option periods. The following table summarizes the amounts that we have incurred in amortization expense for intangible lease assets and adjustments to rental revenue for above market lease assets and below market lease liabilities for the years ending December 31, 2008, 2007 and 2006 related to intangible lease assets and liabilities (amounts in thousands).
F-8
| | | | | | | | | | | | |
| | | 2008 | | | 2007 | | | 2006 | |
Intangible lease assets | | $ | 28,542 | | | $ | 17,400 | | | $ | 1,262 | |
Above market lease assets | | | 2,955 | | | | 1,983 | | | | 270 | |
Below market lease assets | | | (4,893 | ) | | | (2,801 | ) | | | (225 | ) |
| | | | | | | | | | | | |
Total amortization | | $ | 26,604 | | | $ | 16,582 | | | $ | 1,307 | |
| | | | | | | | | | | | |
We expense any unamortized intangible lease asset or record an adjustment to rental revenue for any unamortized above market lease asset or below market lease liability when a tenant terminates a lease before the stated lease expiration date. The following table summarizes lease asset and liabilities that we wrote off during the years ended December 31, 2008, 2007 and 2006 as a result of early lease terminations (amounts in thousands).
| | | | | | | | | | | |
| | | 2008 | | | 2007 | | | 2006 |
Intangible lease assets | | $ | 2,947 | | | $ | 303 | | | $ | — |
Above market lease assets | | | 128 | | | | 14 | | | | — |
Below market lease assets | | | (1,106 | ) | | | (25 | ) | | | — |
| | | | | | | | | | | |
Total | | $ | 1,969 | | | $ | 292 | | | $ | — |
| | | | | | | | | | | |
Real property assets, including land, building, building and land improvements, tenant improvements, lease commissions, and intangible lease assets and liabilities are stated at historical cost less accumulated depreciation and amortization. Depreciation and amortization are computed on a straight-line basis over the estimated useful lives as described in the following table.
| | |
Description | | Depreciable Life |
Land | | Not depreciated |
Building | | 40 years |
Building and land improvements | | 20 years |
Tenant improvements | | Lesser of useful life or lease term |
Lease commissions | | Over lease term |
Intangible in-place lease assets | | Over lease term |
Above market lease assets | | Over lease term |
Below market lease liabilities | | Over lease term, including below market fixed-rate renewal options |
The following table presents expected amortization during the next five years and thereafter related to the acquired above market lease assets, below market lease liabilities and acquired in-place lease intangibles, for properties owned at December 31, 2008 (amounts in thousands):
| | | | | | | | | | | | | | | | | | | | | | | | |
Amortization | | 2009 | | | 2010 | | | 2011 | | | 2012 | | | 2013 | | | Thereafter | |
Acquired above market lease assets | | $ | (2,187 | ) | | $ | (1,624 | ) | | $ | (784 | ) | | $ | (360 | ) | | $ | (204 | ) | | $ | (617 | ) |
Acquired below market lease liabilities | | | 4,766 | | | | 4,376 | | | | 3,962 | | | | 3,665 | | | | 3,003 | | | | 34,197 | |
| | | | | | | | | | | | | | | | | | | | | | | | |
Net rental revenue increase | | | 2,579 | | | | 2,752 | | | | 3,178 | | | | 3,305 | | | | 2,799 | | | | 33,580 | |
Acquired in-place lease intangibles | | $ | 22,315 | | | $ | 18,166 | | | $ | 14,489 | | | $ | 11,259 | | | $ | 8,650 | | | $ | 41,954 | |
During the second quarter of 2008, we identified a misstatement related to our accounting treatment of below market lease liabilities. Prior to the three months ended June 30, 2008, we valued below market leases using the non-cancelable lease terms and amortized such amounts over the same term to rental revenue. During the three months ended June 30, 2008, we corrected this error with respect to below market leases whereby the valuation and the subsequent amortization period now considers fixed-rate renewal option periods to conform to the interpretive guidance of SFAS No. 141. This misstatement resulted in a net understatement of the total amount recorded to building and improvements in our historic consolidated balance sheet by approximately $25.1 million as of December 31, 2007. Furthermore, this misstatement resulted in a net understatement of our intangible lease liabilities in our historic consolidated balance sheet by approximately $25.8 million as of December 31, 2007. The impact of the misstatement to our consolidated statement of operations for the year ended December 31, 2007 was (i) an overstatement of rental revenue of approximately $481,000, (ii) an understatement of depreciation and amortization of approximately $214,000, and (iii) an overstatement of net income by approximately $695,000 for the year ended December 31, 2007. We believe neither the origination nor the correction of the misstatement was material quantitatively or qualitatively to our financial statements for the prior periods affected or for the year ended December 31, 2008, the period in which we made our cumulative adjustment to correct the misstatement.
Real Estate Securities
As of December 31, 2008 and 2007, investments in real estate securities consisted of preferred equity securities, CMBS and CRE-CDOs. SFAS No. 115,Accounting for Certain Investments in Debt and Equity Securities (“SFAS No. 115”), requires us to classify our investments in real estate securities as either trading investments, available-for-sale investments or held-to-maturity investments. Although we generally intend to hold most of our investments in real estate securities for the long term or until maturity, we may from time to time sell any of these assets as part of the overall management of our portfolio. As of December 31, 2008 and 2007, all of our real estate securities were classified as available-for-sale. All assets classified as available-for-sale are reported based on management’s best estimate of fair value. In determining management’s best estimate of fair value, we consider various factors including, but not limited to, current market prices if available, current interest rates, relevant market indices, broker quotes, expected cash flows and other relevant market and security-specific data as appropriate. Temporary unrealized gains and losses are excluded from earnings and reported as a separate component within stockholders’ equity referred to as other comprehensive income (loss).
F-9
Debt Related Investments
The following discussion pertains only to our mortgage, mezzanine, and B-note investments. Debt related investments are considered to be held-to-maturity, as we have both the intent and ability to hold these investments until maturity. Accordingly, these assets are carried at cost, net of unamortized loan origination costs and fees, discounts, repayments, sales of partial interests in loans, and unfunded commitments unless such loans or investments are deemed to be impaired.
Revenue Recognition
Revenue Recognition – Real Property
We record rental revenue for the full term of each lease on a straight-line basis. Certain properties have leases that offer the tenant a period of time where no rent is due or where rent payments increase during the term of the lease. Accordingly, we record a receivable from tenants for rent that we expect to collect over the remaining lease term rather than currently, which is recorded as straight-line rents receivable. When we acquire a property, the term of existing leases is considered to commence as of the acquisition date for purposes of this calculation. For the years ended December 31, 2008, 2007 and 2006 the total increase to rental revenue due to straight-line rent adjustments was approximately $5.4 million, $2.5 million and $212,000, respectively.
Tenant recovery income includes payments from tenants for real estate taxes, insurance and other property operating expenses and is recognized as rental revenue. Tenant recovery income recognized as rental revenue for the years ended December 31, 2008, 2007 and 2006 was approximately $21.6 million, $14.0 million and $934,000, respectively.
Revenue Recognition – Real Estate Securities
Interest income on CMBS and CRE-CDO investments is recognized using the effective interest method in accordance with SFAS 115 and Emerging Issues Task Force (“EITF”) No. 99-20,Recognition of Interest Income and Impairment on Purchased and Retained Beneficial Interests in Securitized Financial Assets, as amended by FASB Position No. EITF 99-20-1,Amendments to the Impairment Guidance of EITF Issue No. 99-20(“EITF No. 99-20-1”). EITF No. 99-20 as so amended by FSP EITF No. 99-20-1, is herein after collectively referred to as “EITF No. 99-20”). Under EITF No. 99-20, at the time of purchase, our management estimates the future expected cash flows and determines the amount of accretable yield based on these estimated cash flows and the purchase price. As appropriate, we update these estimated cash flows to compute a revised yield based on the current amortized cost of the investment. In estimating these cash flows, there are a number of assumptions that are subject to uncertainties and contingencies, including the rate and timing of principal payments (including prepayments, repurchases, defaults and liquidations), the pass-through or coupon rate, interest rate fluctuations, interest payment shortfalls and the timing and the magnitude of credit losses on the mortgage loans underlying the securities. These uncertainties and contingencies are difficult to predict and are subject to future events that may impact management’s estimates and our securities income.
As discussed below in more detail, if management determines there has been an other-than-temporary impairment of our CMBS and CRE-CDOs, then we account for such securities based on their fair value and determine an accretion value based on our estimate of cash flows as described above. This accretion value is amortized to income over the expected life of the investment. For the year ended December 31, 2008, we recorded $933,000 to securities income for certain CRE-CDOs for which we recorded an other-than-temporary impairment. There were no other-than-temporary impairment charges during the years ended December 31, 2007 or 2006. See Note 4 for additional discussion of impairment of real estate securities.
Dividend income on preferred securities is recognized on the date the dividend is earned (referred to commonly as the “ex-dividend date”). Upon settlement of securities, the excess (or deficiency) of net proceeds over the net carrying value of such security or loan is recognized as a gain (or loss) in the period of settlement. All of our preferred securities investments are cumulative preferred securities. In the event that an issuer of one our investments in preferred securities suspends the payment of the dividend, we do not recognize dividend income until payments are resumed and the related ex-dividend date is declared. In the event that payments are resumed for what was a previously suspended payment, we would anticipate repayments that would compensate us for payments that the issuer previously suspended due to the cumulative nature of our investments.
F-10
Revenue Recognition — Debt Related Investments
Interest income on debt related investments is recognized over the life of the investment using the effective interest method and recognized on an accrual basis. Fees received in connection with loan commitments are deferred until the loan is funded and are then recognized over the term of the loan. Anticipated exit fees, where collection is expected, are also recognized over the term of the debt related investment.
Impairment
Impairment — Real Property
We review our investments in real property individually on a quarterly basis, and more frequently when such an evaluation is warranted, to determine their appropriate classification, as well as whether there are indicators of impairment in accordance with SFAS No. 144,Accounting for the Impairment or Disposal of Long-Lived Assets (“SFAS No. 144”). The investments in real property are either classified as held for sale or held and used based on outlined criteria in SFAS No. 144. As of December 31, 2008, one of our properties had been analyzed and classified as held for sale. All of our remaining properties are classified as held and used. As of December 31, 2007, all of our investments in real property had been analyzed and classified as held and used. These held and used assets are reviewed for indicators of impairment which may include, among others, each tenant’s inability to make rent payments, operating losses or negative operating trends at the property level, notification by a tenant that it will not renew its lease, a decision to dispose of a property or adverse changes in the fair value of any of our properties. If indicators of impairment exist on a held and used asset, we compare the future estimated undiscounted cash flows from the expected use of the property to its net book value to determine if impairment exists. If the sum of the future estimated undiscounted cash flows is greater than the current net book value, in accordance with SFAS No. 144, we conclude no impairment exists. If the sum of the future estimated undiscounted cash flows is less than its current net book value, we recognize an impairment loss for the difference between the net book value of the property and its estimated fair value. If a property is classified as held for sale, we recognize an impairment loss if the current net book value of the property exceeds its fair value less selling costs. If our assumptions, projections or estimates regarding a property change in the future, we may have to record an impairment charge to reduce or further reduce the net book value of the property. As of December 31, 2008 and 2007, we had not recorded any impairment charges to our real properties.
Impairment — Real Estate Securities
In accordance with FASB Staff Position No. 115-1/124-1,The Meaning of Other-Than-Temporary Impairment and Its Application to Certain Investments (“FSP FAS No. 115-1/124-1”) and EITF No. 99-20, as applicable, we evaluate our real estate securities for other-than-temporary impairment on a quarterly basis, and more frequently when economic or market concerns warrant such evaluation. When management’s estimate of fair value of a real estate security is less than its amortized cost, we consider whether there is an other-than-temporary impairment in the value of the security. The evaluation of other-than-temporary impairment differs between our investments in (i) preferred equity securities and (ii) CMBS and CRE-CDO securities, as described further below.
Preferred Equity Securities Impairment
On October 14, 2008, the staff in the Office of the Chief Accountant of the Commission noted in a letter (the “SEC Letter”) to the FASB, that after consulting with the FASB, the staff would not object to the application of an impairment model for perpetual preferred securities similar to debt securities since SFAS No. 115 does not specifically address the impact of the debt-like characteristics on the assessment of other-than-temporary impairment. The assessment of other-than-temporary impairment differs significantly between equity securities and debt securities. For equity securities, other-than-temporary impairment is recognized unless it is expected that the value of the security will recover in the near term and the investor has the intent and ability to hold the securities until recovery. However, for debt securities, impairment is considered other-than-temporary only if the investor does not have the ability and intent to hold the security until recovery or it has been determined that there has been an adverse change, either in timing or amount, of the cash flows underlying the investment. Such an evaluation should be based on our ability and intent to hold the security to recovery and the underlying credit of the issuers. We adopted this impairment model for our investments in perpetual preferred securities during the year ended December 31, 2008. The SEC Letter noted that the views of the staff were an intermediate step in the process of addressing the impairment of perpetual preferred securities and asked the FASB to expeditiously address the issue. As of December 31, 2008, all of our preferred securities investments were perpetual preferred securities. In applying the impairment model for perpetual preferred securities, we apply a debt security impairment model for our preferred equity securities investments that are of investment grade quality credit. Preferred equity securities that are of below investment grade quality are analyzed for other-than-temporary impairment under an equity security model. If, in our judgment, an other-than-temporary impairment exists, the cost basis of the security is written down to its fair value as of the respective balance sheet date, and the respective unrealized loss is reclassified from accumulated other comprehensive loss and recorded as a reduction to earnings.
F-11
We reviewed our preferred equity security investments for indicators of other-than-temporary impairment. This review included analysis of (i) the length of time and the extent to which the fair value has been lower than carrying value, (ii) the financial condition and near-term prospects of the issuer including consideration of any credit deterioration and (iii) our intent and ability to hold our investment for a reasonable period of time sufficient to allow for a forecasted recovery of fair value. Based on the results of this review, we recorded other-than-temporary impairment charges of approximately $69.7 million related to our preferred equity securities during the year ended December 31, 2008. There were no other-than-temporary impairment charges related to our preferred equity securities during the same periods in 2007 or 2006.
CMBS and CRE-CDO Securities Impairment
On January 12, 2009, the FASB issued EITF No. 99-20-1. Prior to EITF No. 99-20-1, we were required to estimate cash flows from our CMBS and CRE-CDO securities using current information and events that a “market participant” would use in determining the fair value of the securities. EITF No. 99-20-1 amends EITF No. 99-20 by removing the concept of a market participant’s expectation of cash flows and instead requires management to determine whether it believes that it is probable that there has been an adverse change in the estimated timing and amount of cash flows from its securities based on all relevant, available information, including information about past events, current conditions and reasonable and supportable forecasts. In estimating cash flows of our securities, we specifically consider and analyze factors such as remaining payment terms, prepayments, financial condition of the issuer, expected defaults, analyst reports and forecasts, credit ratings, the value of the underlying collateral and other market data that are relevant to the collectability of the contractual cash flows from the security, which requires significant judgment. In determining whether an other-than-temporary impairment has occurred, we considered both the timing and amount of cash flows and our intent and ability to hold an investment for a reasonable period of time sufficient to allow for a forecasted recovery of fair value. If, in our judgment, an other-than-temporary impairment exists, the cost basis of the security is written down to its fair value as of the respective balance sheet date, and the respective unrealized loss is reclassified from accumulated other comprehensive loss and recorded as a reduction to earnings. Based on the results of this review, we recorded other-than-temporary impairment charges related to our CMBS and CRE-CDO investments during the year ended December 31, 2008 of approximately $123.0 million. There were no other-than-temporary impairment charges related to our CMBS and CRE-CDO investments during the same periods in 2007 or 2006.
Impairment — Debt Related Investments
We review our debt related investments on a quarterly basis, and more frequently when such an evaluation is warranted, to determine if impairment exists in accordance with SFAS No. 114,Accounting by Creditors for Impairment of a Loan (“SFAS No. 114”). A debt related investment is impaired when, based on current information and events, it is probable that we will be unable to collect all amounts due, both principal and interest, according to the contractual terms of the agreement. When a loan is deemed impaired, the impairment is measured based on the present value of expected future cash flows discounted at the loan’s effective interest rate or, at the loan’s observable market price or the fair value of the collateral if the loan is collateral dependent. There were no impairment losses recognized for our debt related investments in the accompanying consolidated statements of operations during the years ended December 31, 2008, 2007 and 2006.
Derivative Instruments and Hedging Activities
SFAS No. 133,Accounting for Derivative Instruments and Hedging Activities (“SFAS No. 133”), as amended and interpreted, establishes accounting and reporting standards for derivative instruments, including certain derivative instruments embedded in other contracts, and for hedging activities. As required by SFAS No. 133, we record all derivative instruments in the accompanying consolidated balance sheets at fair value. Accounting for changes in the fair value of a derivative instrument depends on the intended use of the derivative instrument and the designation of the derivative instrument. Derivative instruments used to hedge exposure to changes in the fair value of an asset, liability, or firm commitments attributable to a particular risk, such as interest rate risk, are considered “fair value” hedges. Derivative instruments used to hedge exposure to variability in expected future cash flows, such as future interest payments, or other types of forecasted transactions, are considered “cash flow” hedges. We do not have any fair value hedges.
For derivative instruments designated as cash flow hedges, the changes in the fair value of the derivative instrument that represents changes in expected future cash flows which are effectively hedged by the derivative instrument are initially reported as other comprehensive income (loss) in the consolidated statement of stockholders’ equity until the derivative instrument is settled. Upon settlement, the effective portion of the hedge is recognized as other comprehensive income (loss) and amortized over the term of the designated cash flow or transaction the derivative instrument was intended to hedge. The change in value of any derivative
F-12
instrument that is deemed to be ineffective is charged directly to earnings when the determination of ineffectiveness is made. We assess the effectiveness of each hedging relationship by comparing the changes in fair value or cash flows of the derivative instrument with the changes in fair value or cash flows of the designated hedged item or transaction. For purposes of determining hedge ineffectiveness, management estimates the timing and potential amount of future fixed-rate debt issuances each quarter in order to estimate the cash flows of the designated hedged item or transaction. Management considers the likelihood of the timing and amount of entering into such forecasted transactions when determining the expected future fixed-rate debt issuances. We do not use derivative instruments for trading or speculative purposes. Additionally, we have an interest rate collar and an interest rate cap that are not designated as hedges pursuant to the requirements of SFAS No. 133. These derivatives are not speculative and are used to manage exposure to interest rate volatility. We classify cash paid to settle our forward starting swaps as financing activities in our consolidated statements of cash flows.
Investment in Unconsolidated Joint Venture
During 2008, we indirectly acquired a debt related investment structured as a redeemable preferred equity interest through a joint venture arrangement (the “Liberty Avenue Debt Investment”). We account for the Liberty Avenue Debt Investment under the equity method of accounting since we own more than a minor interest in the fund, but do not unilaterally control the fund and were not considered to be the primary beneficiary under FIN No. 46(R). The investment was recorded initially at cost, and is subsequently adjusted for equity in net income (loss) and cash contributions and distributions to reflect the investment at its book value assuming hypothetical liquidation. When circumstances indicate there may have been a loss in value of an equity investment, we evaluate the investment for impairment by estimating our ability to recover our investment from future expected cash flows. If we determine the loss in value is other than temporary, we recognize an impairment charge to reflect the investment at fair value.
Discontinued Operations
In accordance with SFAS No. 144, we classify certain properties and related assets and liabilities as held for sale when certain criteria are met. At such time, the respective assets and liabilities are presented separately on our consolidated balance sheets. Assets held for sale are reported at the lower of carrying value or estimated fair value less estimated costs to sell. The operating results of such properties are presented in “Income from discontinued operations, net of minority interest” for all periods presented. Depreciation is not recorded once a property is classified as held for sale. We recognize any gain on sales of our real estate assets in accordance with SFAS No. 66,Accounting for Sales of Real Estate (“SFAS No. 66”) if the recognition criteria have been met. The net gain on sale are presented in “Gain on dispositions of real estate interests, net of minority interest” when recognized.
Cash and Cash Equivalents
Cash and cash equivalents consist of cash on hand and highly liquid investments with original maturities of three months or less such as money market mutual funds. As of December 31, 2008 and 2007, we have not realized any losses in such cash accounts or investments related to, and believe that we are not exposed to, any significant credit risk.
Restricted Cash
Restricted cash consists primarily of lender and property-related escrow accounts and deposits related to potential future financing activities. As of December 31, 2008 and 2007, we have not realized any losses in such restricted cash accounts or investments related to, and believe that we are not exposed to, any significant credit risk.
Subscriptions Receivable
Subscriptions receivable consists of subscriptions to purchase shares of our common stock through our public offerings for which we had not yet received the cash proceeds as of the balance sheet dates. We record subscriptions receivable in accordance with Emerging Issues Task Force Issue No. 85-1,Classifying Notes Received for Capital Stock. All cash proceeds not collected as of December 31, 2008 and 2007 were collected in the respective subsequent period.
Collectability of Receivables
We evaluate the collectability of our rent and other receivables on a regular basis based on factors including, among others, payment history, the financial strength of the tenant or borrower and any guarantors, the value of the underlying collateral, the operations and operating trends of the underlying collateral, if any, the asset type and current economic conditions. If our evaluation of these factors indicates we may not recover the full amount of the receivable, we provide a reserve against the portion of the
F-13
receivable that we estimate may not be recovered. This analysis requires us to determine whether there are factors indicating a receivable may not be fully collectible and to estimate the amount of the receivable that may not be collected. As of December 31, 2008 and 2007, we had allowances included in the caption other assets, net, of approximately $618,000 and $103,000, respectively. If our assumptions or estimates regarding the collectability of a receivable change in the future, we may have to record allowances to reduce or further reduce the carrying value of the receivable.
Deferred Loan Costs
Deferred loan costs include fees and costs incurred to obtain long-term financing. These fees and costs are amortized over the terms of the related loans. As of December 31, 2008 and 2007, we had outstanding deferred loan costs of $14.8 million and $14.9 million, net of accumulated amortization of approximately $1.7 million and $1.3 million, respectively. Unamortized deferred loan costs are included in the gain or loss on debt extinguishment if debt is retired before the maturity date.
Stock-Based Compensation
As of December 31, 2008 and 2007, we had granted 60,000 and 45,000 options, respectively, to our independent directors pursuant to the equity incentive plan. We account for our equity incentive plan under the provisions of SFAS No. 123(R),Share-Based Payment (“SFAS No. 123(R)”) and its related interpretations. Options granted under our equity incentive plan are valued using the Black-Scholes option-pricing model and are amortized to salary expense on a straight-line basis over the benefit period. Such expense is included in general and administrative expenses in the accompanying consolidated statements of operations. For the years ended December 31, 2008, 2007 and 2006, we recorded expense related to the equity incentive plan of approximately $12,000, $10,000 and $5,000, respectively. The following table describes options to purchase common stock that have been granted to our independent directors pursuant to our equity incentive plan as of December 31, 2008.
| | | | | | | | | |
Grant Date | | Exercise
Price per
Share | | Maximum
Term | | Vesting
Period | | Options
Granted |
4/3/2006 | | $ | 11.00 | | 10 years | | 5 years | | 30,000 |
8/27/2007 | | $ | 11.00 | | 10 years | | 2 years | | 15,000 |
8/21/2008 | | $ | 11.00 | | 10 years | | 2 years | | 15,000 |
| | | | | | | | | |
Total | | | | | | | | | 60,000 |
Accumulated Other Comprehensive Income (Loss)
Accumulated other comprehensive income (loss) as reported in the accompanying consolidated statements of stockholders’ equity primarily consists of changes in the fair value of available-for-sale real estate securities and changes in the fair value of cash flow hedges.
Basic and Diluted Net Income (Loss) per Common Share
Basic net income (loss) per common share is determined by dividing net income (loss) attributable to common stockholders by the weighted average number of common shares outstanding during the period. Diluted net income (loss) per common share includes the effects of potentially issuable common stock, but only if dilutive, including the presumed exchange of OP Units.
Income Taxes
We operate in a manner intended to qualify as a REIT for U.S. federal income tax purposes. We first elected REIT status for our taxable year ended December 31, 2006. As a REIT, we generally will not be subject to federal income taxes on net income that we distribute to our stockholders. We intend to make timely distributions sufficient to satisfy the annual distribution requirements. We believe we are organized and operate in such a manner and intend to operate in the foreseeable future in such a manner to qualify as a REIT for federal income tax purposes. We are, however, subject to certain state and local taxes. Our taxable REIT subsidiary, DCTRT Leasing Corporation, is also subject to federal, state, and local taxes.
F-14
Use of Estimates
The preparation of the consolidated financial statements in conformity with GAAP requires management to make estimates and assumptions relating to the reported amounts of assets and liabilities and the disclosure of contingent assets and liabilities at the date of the consolidated financial statements, and the reported amounts of revenues and expenses during the reporting periods. Actual results could differ materially from those estimates. Estimates and assumptions are reviewed periodically and the effects of revisions are reflected in the periods they are determined to be necessary.
Reclassifications
Certain items in prior period consolidated financial statements have been reclassified to conform to current year presentation.
Concentration of Credit Risk and Other Risks and Uncertainties
All of our investments are subject to various risks inherent in the economic environment but certain of our investments, particularly our real estate securities investments, have been significantly impacted. Our investments in securities rely heavily on an active and orderly credit market and therefore the value of these securities is highly sensitive to changes in the credit market as well as the overall economic environment. In the summer of 2007, the domestic credit market began to deteriorate led by increasing defaults on sub-prime residential mortgages and continued across all forms of mortgage lending including commercial real estate and the general credit market as a whole. These changes have significantly and adversely affected the value and the liquidity of our real estate securities. If the existing state of the economy continues or worsens, it will likely continue to adversely impact the value and liquidity of our securities and could adversely impact the ability for these securities to generate current income. Continued market volatility and uncertainty may also cause certain market indicators of impairment to persist, leading to further potential other-than-temporary impairment charges and/or permanent losses in our real estate security investments.
We do not know with any level of certainty the full extent to which the current economic environment will continue to affect us. If we were forced to liquidate our securities portfolio into the current market, we would experience significant and permanent losses on these investments. However, based upon our available cash balances and other sources of capital, we believe that we currently have sufficient liquidity to hold our real estate securities on a long-term basis and we are not dependent upon selling these investments in order to fund our operations or any of our other near term commitments.
While the current credit quality of the underlying loans that comprise our CMBS and CRE-CDO investments reflect modest levels of deterioration, we remain cautious about the future prospects of these investments and acknowledge that the effects to the underlying credit quality may be delayed relative to the current economic situation. Furthermore, while the credit quality may reflect only modest levels of deterioration, the change in value of the underlying loans may also negatively impact the performance of our investment in these securities.
The lack of liquidity in the market has also made the valuation process pertaining to our CMBS and CRE-CDO investments difficult and subjective. Historically, our estimate of the value of these investments was primarily based on active issuances and the secondary trading market of such securities as compiled and reported by independent pricing agencies. The current market environment is absent new issuances and there has been very limited, if any, secondary trading of CMBS and CRE-CDOs. Therefore, our estimate of fair value requires significant judgment by management and consideration of other indicators of value such as pricing services, broker quotes, current interest rates, relevant market indices, expected cash flows and other relevant market and security-specific data as appropriate. While we have used all available evidence to determine our best estimate of fair value, in accordance with SFAS No. 157, the amount that we could obtain if we were forced to liquidate these securities in the current market may be significantly different than our estimate of fair value.
New Accounting Pronouncements
In December 2007, the FASB issued SFAS No. 141(R), which retains the fundamental requirements in SFAS No. 141 that the acquisition method of accounting be used for all business combinations and for an acquirer to be identified for each business combination. SFAS No. 141(R) establishes principles and requirements for how the acquirer recognizes and measures in its financial statements the identifiable assets acquired, the liabilities assumed and any noncontrolling interest in the acquiree. Under SFAS No. 141(R), certain transaction costs that have historically been capitalized as acquisition costs will be expensed. SFAS No. 141(R) applies prospectively to business combinations for which the acquisition date is on or after the beginning of the first annual reporting period beginning on or after December 15, 2008. An entity may not apply the provisions of SFAS No. 141(R) prior to that date. We will adopt the provisions of SFAS No. 141(R) on January 1, 2009.
F-15
In December 2007, the FASB issued SFAS No. 160,Noncontrolling Interests in Consolidated Financial Statements—an amendment of ARB No. 51 (“SFAS No. 160”), which clarifies that a noncontrolling interest in a subsidiary is an ownership interest in the consolidated entity that should be reported as equity in the consolidated financial statements. SFAS No. 160 changes the way the consolidated income statement is presented, thus requiring consolidated net income to be reported at amounts that include the amounts attributable to both the parent and the noncontrolling interest. SFAS No. 160 is effective January 1, 2009, and early adoption is not permitted. We are currently evaluating the impact the adoption of SFAS No. 160 will have on our results of operations and financial position.
In March 2008, the FASB issued SFAS No. 161,Disclosures about Derivative Instruments and Hedging Activities — an amendment of FASB Statement No. 133 (“SFAS No. 161”), which amends SFAS No. 133 to provide additional information about how derivative and hedging activities affect an entity’s financial position, financial performance, and cash flows. SFAS No. 161 requires enhanced disclosures about an entity’s derivatives and hedging activities. SFAS No. 161 is effective for financial statements issued for fiscal years beginning after November 15, 2008. We anticipate that it will not have an effect on our results of operations or financial position as it only provides for new disclosure requirements.
| 3. | INVESTMENTS IN REAL PROPERTY |
Our consolidated investments in real property consist of investments in office and office/R&D, industrial and retail properties. The following tables summarize our consolidated investments in real property as of December 31, 2008 and 2007. The following table does not include one real property asset that is classified as held for sale (amounts in thousands).
| | | | | | | | | | | | | | | | | | | | | | | |
Real Property | | Land | | Building and
Improvements | | | Intangible
Lease Assets | | | Gross
Investment
Amount | | | Intangible
Lease
Liabilities | | | Total
Investment
Amount | |
As of December 31, 2008: | | | | | | | | | | | | | | | | | | | | | | | |
Office and office/R&D properties | | $ | 85,434 | | $ | 271,880 | | | $ | 68,466 | | | $ | 425,780 | | | $ | (7,883 | ) | | $ | 417,897 | |
Industrial properties | | | 50,136 | | | 283,965 | | | | 36,788 | | | | 370,889 | | | | (8,952 | ) | | | 361,937 | |
Retail properties | | | 198,734 | | | 383,984 | | | | 66,376 | | | | 649,094 | | | | (43,922 | ) | | | 605,172 | |
| | | | | | | | | | | | | | | | | | | | | | | |
Total gross book value | | | 334,304 | | | 939,829 | | | | 171,630 | | | | 1,445,763 | | | | (60,757 | ) | | | 1,385,006 | |
Accumulated depreciation/amortization | | | — | | | (38,787 | ) | | | (49,021 | ) | | | (87,808 | ) | | | 6,788 | | | | (81,020 | ) |
| | | | | | | | | | | | | | | | | | | | | | | |
Total net book value | | $ | 334,304 | | $ | 901,042 | | | $ | 122,609 | | | $ | 1,357,955 | | | $ | (53,969 | ) | | $ | 1,303,986 | |
| | | | | | | | | | | | | | | | | | | | | | | |
As of December 31, 2007: | | | | | | | | | | | | | | | | | | | | | | | |
Office and office/R&D properties | | $ | 78,228 | | $ | 164,592 | | | $ | 47,393 | | | $ | 290,213 | | | $ | (2,826 | ) | | $ | 287,387 | |
Industrial properties | | | 43,328 | | | 230,335 | | | | 32,666 | | | | 306,329 | | | | (3,211 | ) | | | 303,118 | |
Retail properties | | | 190,635 | | | 360,498 | | | | 67,616 | | | | 618,749 | | | | (21,052 | ) | | | 597,697 | |
| | | | | | | | | | | | | | | | | | | | | | | |
Total gross book value | | | 312,191 | | | 755,425 | | | | 147,675 | | | | 1,215,291 | | | | (27,089 | ) | | | 1,188,202 | |
Accumulated depreciation/amortization | | | — | | | (15,472 | ) | | | (20,144 | ) | | | (35,616 | ) | | | 3,000 | | | | (32,616 | ) |
| | | | | | | | | | | | | | | | | | | | | | | |
Total net book value | | $ | 312,191 | | $ | 739,953 | | | $ | 127,531 | | | $ | 1,179,675 | | | $ | (24,089 | ) | | $ | 1,155,586 | |
| | | | | | | | | | | | | | | | | | | | | | | |
Acquisitions
During the year ended December 31, 2008, we acquired 13 real properties with a gross investment amount of approximately $200.7 million, comprising approximately 1.8 million net rentable square feet (including one retail property that was acquired and disposed of during the year ended December 31, 2008 and one retail property that was classified as held for sale as of December 31, 2008). During the year ended December 31, 2007, we acquired 47 real properties with a gross investment amount of approximately $987.4 million, comprising approximately 7.1 million net rentable square feet. All of our properties were acquired using a combination of (i) net proceeds from our public and private offerings, (ii) debt financings and (iii) minority interest equity contributions. The results of operations for the acquired properties are included in our consolidated statements of operations from the respective dates of acquisition.
Property Disposition
On December 24, 2008, we disposed of one retail property located in the Palm Springs, California market to a third-party buyer for gross proceeds of approximately $5.7 million, which had a gross investment value of approximately $5.1 million at disposition. We recorded an after-tax gain of approximately $169,000. The total cash proceeds from the disposition were used to simultaneously repay the outstanding principal balance of a
F-16
mortgage loan related to the disposed property and to repay the majority of the outstanding principal balance of a related loan that is secured by a retail property located in Palm Beach, Florida that is currently held for sale. Our Advisor received an asset management fee associated with the sale of this property of approximately $51,000. We acquired this property during 2008.
Assets Held for Sale
As of December 31, 2008, we had one retail property with a net investment amount of approximately $3.1 million located in the Palm Beach, Florida market which was classified as held for sale in accordance with SFAS No. 144. The related results of operations of this asset are presented as discontinued operations in the accompanying financial statements.
Future Minimum Rentals
Future minimum rentals to be received under non-cancelable operating and ground leases in effect as of December 31, 2008, are as follows (amounts in thousands).
| | | |
For years ended December 31, | | Future Minimum
Rentals |
2009 | | $ | 95,634 |
2010 | | | 89,538 |
2011 | | | 76,701 |
2012 | | | 68,039 |
2013 | | | 59,444 |
Thereafter | | | 330,005 |
| | | |
Total | | $ | 719,361 |
| | | |
The table above does not reflect future rental revenues from the potential renewal or replacement of existing and future leases and excludes property operating expense reimbursements and assumes no early termination of leases.
Tenant Concentration
As of December 31, 2008, the Stop & Shop Supermarket Company (“Stop & Shop”), which represents 13.1% of our annualized rental revenue, was our only tenant whose annualized rental revenue exceeded 10.0% of our total annualized rental revenue. Stop & Shop occupies 14 of our retail properties and each location is leased under separate leasing agreements. Stop & Shop operates over 375 grocery stores throughout seven states primarily located in the Northeast region of the United States. Stop & Shop is a consolidated subsidiary of Koninklijke Ahold N.V. (“Ahold”). Ahold is one of the largest food retailers in the world, based in Amsterdam, the Netherlands.
| 4. | INVESTMENT IN REAL ESTATE SECURITIES |
As of December 31, 2008, the estimated fair value of our real estate securities investments was approximately $52.4 million, consisting of $31.6 million for our investments in preferred equity securities and $20.8 million for our investments in CMBS and CRE-CDOs. As of December 31, 2007, the fair value of our real estate securities was approximately $180.7 million, consisting of $75.5 million for our investments in preferred equity securities and $105.2 million for our investments in CMBS and CRE-CDOs. As of December 31, 2008 the weighted average term remaining until expected maturity of our CMBS and CRE-CDO investments was approximately 7.3 years, based on amounts invested. As of December 31, 2008 the weighted average publicly available rating, as provided by Standard and Poor’s, of our CMBS and CRE-CDO securities were approximately BB and BB+, respectively. Our preferred equity securities are perpetual in nature and therefore do not have expected maturity dates and approximately 84% of preferred equity securities, based on amount invested, do not have credit ratings. The following table describes our investments in real estate securities as of December 31, 2008 and 2007 (dollar amounts in thousands).
F-17
| | | | | | | | | | | | | | | | |
| | | 2008 | |
| | | Preferred
Equity | | | CRE-CDOs | | | CMBS | | | Total | |
Amount invested | | $ | 102,725 | | | $ | 139,821 | | | $ | 4,019 | | | $ | 246,565 | |
Other-than-temporary impairment | | | (69,694 | ) | | | (119,481 | ) | | | (3,549 | ) | | | (192,724 | ) |
Net accretion of discounts and premiums | | | — | | | | 1,167 | | | | 109 | | | | 1,276 | |
| | | | | | | | | | | | | | | | |
Amortized cost | | | 33,031 | | | | 21,507 | | | | 579 | | | | 55,117 | |
Gross unrealized loss | | | (1,439 | ) | | | (1,310 | ) | | | — | | | | (2,749 | ) |
| | | | | | | | | | | | | | | | |
Fair value | | $ | 31,592 | | | $ | 20,197 | | | $ | 579 | | | $ | 52,368 | |
| | | | | | | | | | | | | | | | |
| |
| | | 2007 | |
| | | Preferred
Equity | | | CRE-CDOs | | | CMBS | | | Total | |
Amount invested | | $ | 102,725 | | | $ | 139,917 | | | $ | 4,019 | | | $ | 246,661 | |
Other-than-temporary impairment | | | — | | | | — | | | | — | | | | — | |
Net accretion of discounts and premiums | | | — | | | | 102 | | | | 58 | | | | 160 | |
| | | | | | | | | | | | | | | | |
Amortized cost | | | 102,725 | | | | 140,019 | | | | 4,077 | | | | 246,821 | |
Gross unrealized loss | | | (27,236 | ) | | | (37,760 | ) | | | (1,162 | ) | | | (66,158 | ) |
| | | | | | | | | | | | | | | | |
Fair value | | $ | 75,489 | | | $ | 102,260 | | | $ | 2,914 | | | $ | 180,663 | |
| | | | | | | | | | | | | | | | |
The following table describes our income from real estate securities investments for the years ended December 31, 2008, 2007 and 2006 (dollar amounts in thousands).
| | | | | | | | | | | | |
Security Type | | 2008 | | 2007 | | 2006 | | Weighted
Average
Yield (1) | |
Preferred Equity | | $ | 7,611 | | $ | 6,245 | | $ | 668 | | 5.6 | % |
CRE-CDO (2) | | | 9,671 | | | 9,152 | | | 165 | | 5.8 | % |
CMBS | | | 285 | | | 294 | | | 48 | | 5.0 | % |
| | | | | | | | | | | | |
Total | | $ | 17,567 | | $ | 15,691 | | $ | 881 | | 5.7 | % |
| | | | | | | | | | | | |
| (1) | Weighted average yield is calculated on an unlevered basis using the amount invested, current interest rates and accretion of premiums and discounts realized upon the initial investment for each security type. For purposes of this table yields for LIBOR-based, floating-rate investments have been calculated using the one-month LIBOR rate as of December 31, 2008. For purposes of this table, we have also assumed 0.0% yields on our preferred equity securities investments for which the preferred dividend payment has been indefinitely suspended. |
| (2) | Incremental accretion associated with impairment charges totaled approximately $933,000 for the year ended December 31, 2008. |
Other-than-Temporary Impairment
During the year ended December 31, 2008, we recorded impairment charges totaling approximately $192.7 million, related to other-than-temporary impairment of our real estate securities. This impairment charge was comprised of (i) impairment charges of approximately $69.7 million related to our preferred equity securities and (ii) impairment charges of approximately $123.0 million related to our CMBS and CRE-CDO securities. These impairment charges are reflected in the accompanying consolidated statements of operations. During the same periods in 2007 and 2006 we did not record any impairment charges to our real estate securities.
Pursuant to EITF No. 99-20, if we determine that the underlying cash flows of a security have been adversely affected we recognize an other-than-temporary impairment. For subsequent income recognition, the amount of accretable yield should be recalculated using revised estimated cash flows. For the year ended December 31, 2008, we recorded approximately $933,000 in securities income as a result of accretable yield associated with previously impaired CRE-CDOs. No accretion was recorded for the same periods in 2007 and 2006 as a result of other-than-temporary impairment charges and/or a change in estimated cash flows.
F-18
Unrealized Losses
As of December 31, 2008, the balance in other comprehensive income (loss) specific to our real estate securities reflects a loss of approximately $2.7 million.
The following table presents the unrealized losses and estimated fair values of our real estate securities investments by length of time that such securities have been in a continuous unrealized loss position at December 31, 2008 and 2007. For purposes of the following table, for securities which we have previously recorded an other-than-temporary impairment charge, the unrealized loss amount (if any) is determined based on comparing the fair value as of December 31, 2008 to the fair value recorded as of the most recent impairment date. Securities for which we recorded an other-than-temporary impairment charge as of December 31, 2008 have been excluded from the below table (dollar amounts in thousands).
| | | | | | | | | | | | | | | | | | | | | | | | |
| | | Less Than 12 Months | | 12 Months or Greater | | Total |
Type of Security | | Number of
Holdings | | Fair Value | | Gross
Unrealized
Loss | | Number of
Holdings | | Fair
Value | | Gross
Unrealized
Loss | | Number of
Holdings | | Fair Value | | Gross
Unrealized
Loss |
As of December 31, 2008: | | | | | | | | | | | | | | | | | | | | | | | | |
Preferred Equity | | 3 | | $ | 3,658 | | $ | 755 | | 2 | | $ | 1,139 | | $ | 684 | | 5 | | $ | 4,797 | | $ | 1,439 |
CMBS and CRE-CDOs | | 2 | | | 1,935 | | | 1,310 | | 0 | | | — | | | — | | 2 | | | 1,935 | | | 1,310 |
| | | | | | | | | | | | | | | | | | | | | | | | |
Total | | 5 | | $ | 5,593 | | $ | 2,065 | | 2 | | $ | 1,139 | | $ | 684 | | 7 | | $ | 6,732 | | $ | 2,749 |
| | | | | | | | | | | | | | | | | | | | | | | | |
As of December 31, 2007: | | | | | | | | | | | | | | | | | | | | | | | | |
Preferred Equity | | 23 | | $ | 74,948 | | $ | 27,033 | | 1 | | $ | 541 | | $ | 204 | | 24 | | $ | 75,489 | | $ | 27,237 |
CMBS and CRE-CDOs | | 15 | | | 98,073 | | | 35,971 | | 2 | | | 7,101 | | | 2,951 | | 17 | | | 105,174 | | | 38,922 |
| | | | | | | | | | | | | | | | | | | | | | | | |
Total | | 38 | | $ | 173,021 | | $ | 63,004 | | 3 | | $ | 7,642 | | $ | 3,155 | | 41 | | $ | 180,663 | | $ | 66,159 |
| | | | | | | | | | | | | | | | | | | | | | | | |
Based upon our intent and ability to hold these real estate securities for a period of time sufficient to allow for a forecasted recovery of fair value, the continued performance of the issuer or the underlying collateral, as well as our assessment, based on all available evidence considered, that the underlying cash flows will continue to perform in the future, the gross unrealized loss of approximately $2.7 million is considered to be temporary as of December 31, 2008, and, as a result, no additional impairment losses related to the real estate securities in the above table have been recognized. See Note 2 for discussion of the impairment models applicable to our investments in real estate securities.
The extreme volatility and disruption to global capital markets and the onset of a recession in the world’s major economies have exerted significant downward pressure on prices of equity securities markets and resulted in severely constrained credit and capital markets, particularly for financial institutions, and an overall loss of investor confidence. These developments have significantly impacted the fair value of our real estate securities. Continued volatility in the equity markets could continue to significantly impact the fair values of our preferred equity securities and result in further other-than-temporary impairment charges. Further deterioration of economic and credit market conditions would likely result in significant negative changes in factors such as financial conditions of the issuers, expected defaults, analyst reports and forecasts, credit ratings, the value of the underlying collateral and other market data that are relevant to the collectability of the contractual cash flows from these securities, adversely impacting the fair value of our CMBS and CRE-CDO securities and potentially resulting in additional other-than-temporary impairment charges.
Investment Activity
During 2008, we did not invest in any additional real estate securities. During 2007, we acquired real estate securities with an aggregate cost of approximately $199.6 million which were comprised of: (i) preferred equity securities with an aggregate cost of approximately $82.6 million and (ii) CMBS and CRE-CDOs with an aggregate cost of approximately $117.0 million. These assets were acquired using a combination of net proceeds from our public and private offerings.
Contractual Maturities
Our preferred equity securities are perpetual in nature and therefore lack stated maturity, call or redemption dates. Our CMBS and CRE-CDO all have contractual maturities ranging from 2042 through 2052. Expected maturities may differ from contractual maturities due to potential prepayment on CMBS and CRE-CDO securities.
F-19
| 5. | DEBT RELATED INVESTMENTS |
As of December 31, 2008, we had approximately $106.4 million in debt related investments including an investment of approximately $17.5 million in an unconsolidated joint venture (see the discussion below regarding the Liberty Avenue Debt Investment). The following table describes our debt related investments as of December 31, 2008 and 2007 (dollar amounts in thousands).
| | | | | | | | | | | | |
| | | | | | | | | | | Weighted
Average
Maturity
in Years (1) |
| | | Number of Investments | | Net Investment | |
Investment Type | | 2008 | | 2007 | | 2008 | | 2007 | |
Mortgage loan (2) | | — | | 1 | | $ | — | | $ | 28,000 | | N/A |
B-notes | | 4 | | 4 | | | 51,930 | | | 51,942 | | 2.7 |
Mezzanine debt | | 2 | | 2 | | | 36,919 | | | 24,149 | | 5.9 |
| | | | | | | | | | | | |
Subtotal | | 6 | | 7 | | | 88,849 | | | 104,091 | | 4.0 |
Unconsolidated joint venture | | 1 | | — | | | 17,532 | | | — | | 1.4 |
| | | | | | | | | | | | |
Total | | 7 | | 7 | | $ | 106,381 | | $ | 104,091 | | 3.6 |
| | | | | | | | | | | | |
| (1) | As of December 31, 2008 and weighted by the relative investment amounts. |
| (2) | During the year ended December 31, 2008, our one mortgage loan investment was repaid in full. |
The following table describes our debt related income, including equity in earnings of an unconsolidated joint venture, for the years ended December 31, 2008, 2007 and 2006 (dollar amounts in thousands).
| | | | | | | | | | | | |
| | | | | Weighted
Average
Yield as of
December 31,
2008 (1) | |
Investment Type | | 2008 | | 2007 | | 2006 | |
Mortgage loan (2) | | $ | 2,346 | | $ | 2,828 | | $ | 13 | | N/A | |
B-notes | | | 3,947 | | | 4,231 | | | 225 | | 5.9 | % |
Mezzanine debt | | | 3,083 | | | 1,892 | | | — | | 10.0 | % |
| | | | | | | | | | | | |
Subtotal | | $ | 9,376 | | $ | 8,951 | | $ | 238 | | 7.6 | % |
Unconsolidated joint venture | | | 586 | | | — | | | — | | 13.0 | % |
| | | | | | | | | | | | |
Total | | $ | 9,962 | | $ | 8,951 | | $ | 238 | | 8.5 | % |
| | | | | | | | | | | | |
| (1) | Weighted average yield is calculated on an unlevered basis using the amount invested, current interest rates and accretion of premiums or discounts realized upon the initial investment for each investment type as of December 31, 2008. Yields for LIBOR-based, floating-rate investments have been calculated using the one-month LIBOR rate as of December 31, 2008 for purposes of this table. |
| (2) | During the year ended December 31, 2008, our one mortgage loan investment was repaid in full. |
Debt Related Investment and Repayment Activity
Liberty Avenue Debt Investment
On September 25, 2008, we indirectly acquired the Liberty Avenue Debt Investment, a debt investment structured as a redeemable preferred equity investment through a joint venture arrangement. We acquired the Liberty Avenue Debt Investment for a gross investment amount of approximately $17.3 million, which represents our 80% interest in the joint venture. Our investment amount includes an acquisition fee paid to our Advisor of approximately $170,000. The Liberty Avenue Debt Investment relates to an office property located in Pittsburgh, Pennsylvania. The Liberty Avenue Debt Investment matures in May 2010 and we have an option to purchase the underlying property in 2010.
The Liberty Avenue Joint Venture is accounted for as an unconsolidated joint venture, which we account for using the equity method per guidance established under APB No. 18. We include the Liberty Avenue Debt Investment in our debt related investments operating segment as the terms of our investment are managed similar to our other debt related investments.
F-20
Greensboro Park Mezzanine Loan
On May 20, 2008, we acquired the Greensboro Park Mezzanine Loan for a gross investment amount of approximately $16.7 million, which includes an approximate $165,000 acquisition fee paid to our Advisor. The Greensboro Park Mezzanine Loan is secured by the equity interest of the owner of an office property located in the Washington, D.C. market. We acquired the loan at a $1.8 million discount to par value. The Greensboro Park Mezzanine Loan matures in June 2012. We paid for the Greensboro Park Mezzanine Loan through a combination of net proceeds from our public and private offerings and debt financing (see Note 6 for discussion of this debt financing).
Mortgage Note and Mezzanine Loan Repayment
During 2008, we received full repayment of one of our debt related investments, which included both a mortgage note portion and a mezzanine loan portion associated with a real estate development project located in the New York City market. At the time of repayment, the mortgage note and the mezzanine loan had an outstanding balance of $28.0 million and $7.3 million, respectively.
As of December 31, 2008, all our debt related investments were interest only and were not subject to any delinquent principal or interest payments. In addition, all of our debt related investments are subordinate to other more senior positions with respect to the underlying collateral. The following table summarizes our debt related investments as of December 31, 2008 (dollar amounts in thousands).
| | | | | | | | | | | | | |
Description | | Region | | Interest Rate (1) | | | Maturity Date (2) | | Face Amount
of Debt (3) | | Amount of
Debt |
B-note | | Mountain | | LIBOR + 3.3 | % | | August 2009 | | $ | 13,947 | | $ | 13,947 |
B-note | | Pacific | | LIBOR + 2.9 | % | | January 2010 | | | 20,000 | | | 20,004 |
B-note | | Pacific | | 9.2 | % | | October 2011 | | | 3,000 | | | 2,972 |
B-note | | Southwest | | 10.7 | % | | October 2016 | | | 15,000 | | | 15,007 |
Mezzanine debt | | Southwest | | 10.5 | % | | December 2016 | | | 20,000 | | | 19,938 |
Mezzanine debt | | Mid-Atlantic | | 9.4 | % | | May 2012 | | | 18,381 | | | 16,981 |
| | | | | | | | | | | | | |
Subtotal | | | | 7.6 | % | | | | $ | 90,328 | | $ | 88,849 |
Unconsolidated joint venture | | Northeast | | 13.0 | % | | May 2010 | | | 17,329 | | | 17,532 |
| | | | | | | | | | | | | |
Total/weighted average | | | | 8.5 | % | | | | $ | 107,657 | | $ | 106,381 |
| | | | | | | | | | | | | |
| (1) | All variable rate loans are based on the one month LIBOR rate and repriced monthly. The weighted average calculation is based on the one month LIBOR rate as of December 31, 2008. |
| (2) | Reflects the initial maturity of the investment and does not consider any options to extend that are at the discretion of the borrower. |
| (3) | Reflects the principal amount of the debt investment outstanding which is net of principal repayments. |
We use and intend to continue to use debt as a means of financing a portion of our investments. As of December 31, 2008 and 2007, we had outstanding debt obligations of approximately $734.9 million and $699.0 million, respectively. These borrowings were comprised of mortgage notes as of December 31, 2008 and 2007 of approximately $719.0 million and $661.7 million, respectively, and other secured borrowings of approximately $15.9 million and $37.3 million, respectively.
Mortgage Notes
The following table describes our mortgage notes related to our operating properties in more detail as of December 31, 2008 and 2007 (dollar amounts in thousands).
| | | | | | | | | | | | | | | | | | |
| | | Weighted Average Stated
Interest Rate | | | Outstanding Balance (1) | | Gross Investment Amount of
Properties Securing
Mortgage Notes |
| | | 2008 | | | 2007 | | | 2008 | | 2007 | | 2008 | | 2007 |
Fixed rate mortgages | | 6.0 | % | | 5.9 | % | | $ | 661,031 | | $ | 490,797 | | $ | 1,131,051 | | $ | 769,261 |
Floating rate mortgages (2) | | 2.2 | % | | 6.0 | % | | | 57,988 | | | 170,886 | | | 82,320 | | | 262,224 |
| | | | | | | | | | | | | | | | | | |
Total / weighted average | | 5.7 | % | | 5.9 | % | | $ | 719,019 | | $ | 661,683 | | $ | 1,213,371 | | $ | 1,031,485 |
| | | | | | | | | | | | | | | | | | |
| (1) | Amounts presented are net of unamortized discounts to the face value of our outstanding fixed-rate mortgages $221,000 as of December 31, 2008 and net of unamortized premiums of $590,000 as of December 31, 2007. |
| (2) | As of December 31, 2008 and 2007, floating-rate mortgage notes were subject to interest rates at spreads of 1.40% to 3.50% and 0.95% to 1.60%, respectively, over one-month LIBOR. |
F-21
As of December 31, 2008, 18 mortgage notes were interest only and 15 mortgage notes were fully amortizing with outstanding balances of approximately $534.2 million and $184.8 million, respectively. Mortgage notes outstanding as of December 31, 2008 had maturity dates ranging from June 2009 through September 2036. One of our mortgage notes in the amount of $41.8 million will mature in 2009 and this mortgage note has three extension options. Three of our mortgage notes for a total amount of $19.7 million will mature in 2010 and two of these notes in the amount of approximately $16.1 million have extension options. Certain mortgage notes require us to maintain limited financial covenants, all of which were met as of December 31, 2008.
Loan Extinguishment
On May 19, 2008, we repaid floating-rate debt that had been previously secured by 17 retail properties that had been acquired as part of our New England Retail Portfolio purchased in 2007. The floating-rate debt consisted of an interest-only, secured floating-rate senior loan (the “New England Mortgage Loan”) and an interest-only floating-rate mezzanine loan (the “New England Mezzanine Loan”). As of May 19, 2008, the outstanding aggregate principal balance under the New England Mortgage Loan and the New England Mezzanine Loan was approximately $121.9 million.
We repaid the total outstanding aggregate principal balance of both loans for an amount of approximately $111.5 million, representing an approximate $10.4 million discount, or 91.5% of par, from the outstanding aggregate principal balance without penalty and in complete satisfaction of our repayment obligations under the New England Mortgage Loan and the New England Mezzanine Loan agreements. In the accompanying consolidated statements of operations, this discount is presented as a gain on extinguishment of debt, net of approximately $1.1 million of unamortized deferred loan costs.
Borrowing Activity
During the year ended December 31, 2008, we obtained or assumed approximately $184.8 million in new mortgage debt financing that was secured by 21 real properties. During the year ended December 31, 2007, we obtained or assumed approximately $622.8 million in new mortgage debt that was secured by 48 real properties.
Other Secured Borrowings
Borrowings Secured by Debt Related Investments
To partially finance the acquisition of the Greensboro Park Mezzanine Loan, we obtained a floating-rate loan with an outstanding principal balance of approximately $10.8 million that bears interest based at a spread of 1.50% over the one-month LIBOR rate. The loan was used to acquire the Greensboro Park Mezzanine Loan debt related investment and has a maturity date that is coterminous with the maturity of the Greensboro Park Mezzanine Loan, which occurs in 2012. We repaid approximately $592,000 of the outstanding principal balance of this loan during the year ended December 31, 2008, resulting in an outstanding principal balance of approximately $10.2 million as of December 31, 2008. As of December 31, 2008, the net investment amount of the debt investment which secures this borrowing was approximately $16.8 million. For the year ended December 31, 2008, we incurred interest expense for this loan of approximately $273,000. For the years ended December 31, 2007 and 2006, we did not incur interest expense related to the Greensboro Park Mezzanine Loan.
F-22
Securities Margin Account
In July 2006, we established a securities margin account with an independent, third-party commercial lender intended to enable us to borrow funds for various purposes secured by our preferred equity securities. As of December 31, 2008, the fair value of the preferred equity securities which serve as collateral for the securities margin account was approximately $31.6 million. Pursuant to this securities margin account, we have the capacity to borrow up to 65% of the market value of any eligible real estate security held in the account. As of December 31, 2008 and 2007, approximately $5.7 million and $37.3 million, respectively, were outstanding on the securities margin account. The proceeds from these borrowings were used for general corporate and investment purposes. Borrowings associated with this securities margin account are charged interest at a rate of one-month LIBOR plus 50 basis points, and as of December 31, 2008, the interest rate on the securities margin account was approximately 0.9%. For the years ended December 31, 2008, 2007 and 2006, we incurred interest expense for this margin account of approximately $944,000, $963,000 and $363,000, respectively. This margin facility does not have a stated maturity date.
Capitalized Interest
We capitalized approximately $196,000 of interest during the year ended December 31, 2008 associated with certain redevelopment activities at our real properties. We did not capitalize interest during the years ended December 31, 2007 and 2006.
Loan Cost Amortization
Our interest expense for the years ended December 31, 2008, 2007 and 2006, includes $1.7 million, $2.0 million and $353,000 for the amortization of loan costs, respectively. Included in these amounts are approximately $676,000, $501,000 and $303,000, respectively, for the amortization of loan costs related to our financing obligations. See Note 8 for additional details of loan costs associated with our financing obligations.
Debt Maturities
The following table sets forth contractual scheduled maturities of our mortgage debt as of December 31, 2008 (amounts in thousands).
| | | | | | | |
Year | | Mortgage
Notes | | | % of Total
Borrowings | |
2009 | | $ | 41,890 | | | 5.8 | % |
2010 | | | 19,605 | | | 2.7 | % |
2011 | | | 3,713 | | | 0.5 | % |
2012 | | | 21,300 | | | 3.0 | % |
2013 | | | — | | | 0.0 | % |
2014 | | | 55,767 | | | 7.8 | % |
2015 | | | 79,296 | | | 11.0 | % |
2016 | | | 167,953 | | | 23.4 | % |
2017 | | | 280,949 | | | 39.1 | % |
2018 | | | — | | | 0.0 | % |
Thereafter | | | 48,767 | | | 6.8 | % |
| | | | | | | |
Total | | $ | 719,240 | | | 100.0 | % |
Discounts, net of amortization (1) | | | (221 | ) | | | |
| | | | | | | |
Total carrying value of mortgage notes | | $ | 719,019 | | | | |
| | | | | | | |
| (1) | Certain mortgages were assumed in conjunction with the acquisition of properties and, pursuant to SFAS No. 141 (see Note 2), the difference between the fair value and the face value of these notes at the date of acquisition is reflected as a premium or discount which will be amortized to interest expense over the remaining life of the underlying note. |
As of December 31, 2008, we had the following outstanding derivative instruments designed to hedge our exposure to the variability in future cash flows for debt issuances and forecasted debt issuances related to prospective real property acquisitions: (i) two LIBOR-based forward starting swaps hedging cash flows in anticipation of expected future ten-year, fixed-rate debt issuances of approximately $100 million, (ii) a three-year, zero cost collar associated with a floating-rate mortgage note related to the
F-23
acquisition of an office property and (iii) a two-year LIBOR-based interest rate cap. During the year ended December 31, 2008, we terminated two LIBOR-based forward starting swaps with combined notional amounts of $250 million by paying approximately $23.8 million to cash settle the hedges on or before their contractual settlement dates.
As of December 31, 2008 and 2007, derivatives with a fair value of approximately $27.2 million and $27.9 million, respectively, were included in derivative instruments as a liability. As of December 31, 2008 and 2007, the net unrealized loss on our derivatives was approximately $39.5 million and $27.7 million, respectively, as reflected in the accompanying consolidated statement of stockholders’ equity as accumulated other comprehensive income (loss). For hedges of existing variable-rate debt, the amounts reported in accumulated other comprehensive income (loss) will be reclassified to interest expense as interest payments are made on the issued variable-rate debt. For hedges of forecasted issuances of fixed-rate debt, amounts reported in accumulated other comprehensive income (loss) will be reclassified to interest expense as interest payments are made on the fixed-rate debt after the debt has been issued.
Fixed-Rate Debt Issuances
During the year ended December 31, 2008, we obtained approximately $138.4 million in mortgage debt financing secured by 15 of our real properties, which qualified for hedge accounting (see Note 6). As a result of the settlement of derivatives associated with such debt, approximately $12.3 million was included in accumulated other comprehensive income (loss) in the accompanying consolidated balance sheets and will be amortized over the life of the related fixed-rate debt. We expect that approximately $1.2 million of this amount will be amortized to interest expense during the next 12 months. The hedges related to these mortgage debt financings are designated to hedge cash flows for periods of approximately 10 years. We did not settle any derivatives associated with debt issuances during 2007.
Gain (Loss) on Derivatives
During the year ended December 31, 2008, we determined that it was no longer probable that previously forecasted issuances of fixed-rate debt related to an aggregate $111.6 million portion of two of our LIBOR-based forward starting swaps would be issued within the timeframe specified in its corresponding hedge designation memorandum. As a result of the discontinuance of cash flow hedge accounting, a loss of approximately $9.5 million was reclassified from other comprehensive income (loss) to gain (loss) on derivatives.
During the years ended December 31, 2008 and 2007, hedge ineffectiveness resulted in a net loss of approximately $2.1 million and $557,000, respectively. For the same period in 2006, no loss due to hedge ineffectiveness was recorded. These amounts were reflected in the accompanying consolidated statements of operations as loss on derivatives due to a change in the forecasted dates for debt issuances hedged by our remaining forward starting swaps.
Included in the gain (loss) on derivatives discussed above is hedge ineffectiveness attributable to the change in fair value of derivatives not designated as hedges. The amount of hedge ineffectiveness attributable to these hedges was approximately $581,000 and $229,000 the years ended December 31, 2008 and 2007, respectively, and has been included in the accompanying consolidated statements of operations as a net (decrease) increase to gain (loss) on derivatives. We did not record any gain or loss due to the change in fair value of derivatives during 2006.
| 8. | THE OPERATING PARTNERSHIP’S PRIVATE PLACEMENTS |
Our Operating Partnership, through the TRS, is currently offering undivided tenancy-in-common interests in real property and beneficial interests in Delaware Statutory Trusts that own real property (hereinafter referred to collectively as “fractional interests”) to accredited investors in private placements. We anticipate that these fractional interests may serve as replacement properties for investors seeking to complete like-kind exchange transactions under Section 1031 of the Code. The properties owned through such fractional interests sold to accredited investors are 100% leased by our Operating Partnership. Additionally, our Operating Partnership has a purchase option giving it the right, but not the obligation, to acquire the fractional interests from the investors at a later point in time in exchange for partnership units in the Operating Partnership representing OP Units. After a period of one year, holders of OP Units have the right to redeem their OP Units. We have the option, in our sole discretion, of redeeming the OP Units with cash, shares of our common stock or with a combination of cash and shares of our common stock.
The proceeds from the sale of these fractional interests are accounted for as financing obligations in the accompanying consolidated balance sheets pursuant to SFAS No. 98,Accounting for Leases (“SFAS No. 98”). As previously discussed, our Operating Partnership has 100% leased the properties sold to investors, and in accordance with SFAS No. 98, rental payments made pursuant to such leases to investors are accounted for generally as interest expense using the interest method whereby a portion is accounted for as interest expense and a portion is accounted for as an accretion or amortization of the outstanding principal balance of the financing obligations.
F-24
During the year ended December 31, 2008, we raised approximately $64.2 million from the sale of fractional interests in five properties. Furthermore, during 2008 we exercised our option to acquire, at fair value, approximately $65.9 million of previously sold fractional interests in six properties for a combination of (i) approximately 6.5 million OP Units issued at a price of $10.00 per OP Unit, representing approximately $64.8 million of the aggregate purchase and (ii) approximately $1.1 million in cash. The result of this 2008 activity was a net decrease in our financing obligations of approximately $1.7 million for the year ended December 31, 2008.
The following table sets forth certain details regarding the acquisition of the fractional interests in 2008 for which our Operating Partnership issued OP Units (amounts in thousands).
| | | | | | | | | |
Exercise Date | | Property | | Market | | OP Units
Issued | | Total Value (1) |
January 18, 2008 | | Rickenbacker, IV | | Columbus, OH | | 1,441 | | $ | 14,406 |
February 6, 2008 | | Park West Q | | Cincinnati, OH | | 957 | | | 9,572 |
May 13, 2008 | | Eagle Creek East | | Minneapolis, MN | | 882 | | | 8,823 |
May 28, 2008 | | Minnesota Valley III | | Minneapolis, MN | | 1,396 | | | 13,961 |
June 26, 2008 | | Park West L | | Cincinnati, OH | | 804 | | | 8,044 |
August 22, 2008 | | Eagle Creek West | | Minneapolis, MN | | 1,001 | | | 10,006 |
| | | | | | | | | |
| | | | | | 6,481 | | $ | 64,812 |
| | | | | | | | | |
| (1) | Reflects the value of OP Units issued in connection with the exercise of purchase options to acquire the undivided tenancy-in-common interests based on the most recent selling price of our common stock ($10.00 per OP Unit as of December 31, 2008). |
During the years ended December 31, 2008, 2007 and 2006, we incurred rent obligations of approximately $6.1 million, $4.4 million, and $303,000, respectively, under our lease agreements with the investors who have participated in our private placements. The various lease agreements in place as of December 31, 2008 contained expiration dates ranging from April 2018 to January 2037. The following table sets forth the future minimum rental payments due to investors under the various lease agreements associated with our private placements (amounts in thousands).
| | | |
For years ended December 31, | | Future
Minimum
Rental
Payments |
2009 | | $ | 9,283 |
2010 | | | 9,451 |
2011 | | | 9,605 |
2012 | | | 9,652 |
2013 | | | 9,932 |
Thereafter | | | 106,030 |
| | | |
Total | | $ | 153,953 |
| | | |
We pay certain up-front fees and reimburse certain related expenses to our Advisor, the Dealer Manager and Dividend Capital Exchange Facilitators LLC (the “Facilitator”) for raising capital through these private placements. Our Advisor is obligated to pay all of the offering and marketing related costs associated with these private placements. However, we are obligated to pay our Advisor a non-accountable expense allowance equal to 1.5% of the gross equity proceeds raised through these private placements. In addition, we are obligated to pay the Dealer Manager a dealer manager fee of up to 1.5% of gross equity proceeds raised and a commission of up to 5.0% of gross equity proceeds raised through these private placements. The Dealer Manager may re-allow such commissions and a portion of such dealer manager fee to participating broker dealers participating in the respective private placements. In addition, we are obligated to pay a transaction facilitation fee to the Facilitator, an affiliate of our Advisor, of up to 2.0% of gross equity proceeds raised through these private placements.
During the years ended December 31, 2008, 2007 and 2006, we incurred upfront costs of approximately $6.4 million, $6.6 million and $3.9 million, respectively, payable to our Advisor and other affiliates for services provided related to effecting these transactions, which are accounted for as deferred loan costs. Such deferred loan costs are included in other assets in the accompanying
F-25
consolidated balance sheets and amortized to interest expense over the life of the financing obligation. If we elect to exercise our purchase option as described above and issue OP Units, the unamortized up-front fees and expense reimbursements paid to affiliates will be recorded against minority interests as a reduction of the amount received for issuing the OP Units. During the year ended December 31, 2008, we recorded approximately $6.5 million of unamortized deferred loan cost against minority interest as a reduction in the amount received for issuing the OP Units. We did not exercise any purchase options and issue OP units during the years ended December 31, 2007 and 2006. If our Operating Partnership does not elect to exercise any such purchase option, we will continue to account for these transactions as a financing obligation because we will continue to sublease 100% of the properties and will therefore not meet the definition of “active use” set forth in SFAS No. 98 in order to recognize the sale of such fractional interests.
On January 1, 2008, we adopted SFAS No. 157,Fair Value Measurements(“SFAS No. 157”). SFAS No. 157 defines fair value, establishes a framework for measuring fair value, and expands disclosures about fair value measurements. SFAS No. 157 applies to reported balances that are required or permitted to be measured at fair value under existing accounting pronouncements; accordingly, the standard does not require any new fair value measurements of reported balances.
SFAS No. 157 emphasizes that fair value is a market-based measurement, not an entity-specific measurement. Therefore, a fair value measurement should be determined based on the assumptions that market participants would use in pricing the asset or liability. As a basis for considering market participant assumptions in fair value measurements, SFAS No. 157 establishes a fair value hierarchy that distinguishes between market participant assumptions based on market data obtained from sources independent of the reporting entity (observable inputs that are classified within Levels 1 and 2 of the hierarchy) and the reporting entity’s own assumptions about market participant assumptions (unobservable inputs classified within Level 3 of the hierarchy).
Level 1 inputs utilize quoted prices (unadjusted) in active markets for identical assets or liabilities that we have the ability to access. Level 2 inputs are inputs other than quoted prices included in Level 1 that are observable for the asset or liability, either directly or indirectly. Level 2 inputs may include quoted prices for similar assets and liabilities in active markets, as well as inputs that are observable for the asset or liability (other than quoted prices), such as interest rates, foreign exchange rates, and yield curves that are observable at commonly quoted intervals. Level 3 inputs are unobservable inputs for the asset or liabilities, which are typically based on an entity’s own assumptions, as there is little, if any, related market activity. In instances where the determination of the fair value measurement is based on inputs from different levels of the fair value hierarchy, the level in the fair value hierarchy within which the entire fair value measurement falls is based on the lowest level input that is significant to the fair value measurement in its entirety. Our assessment of the significance of a particular input to the fair value measurement in its entirety requires judgment, and considers factors specific to the asset or liability. As of December 31, 2008, we were required to measure the fair value of our investments in real estate securities and derivatives on a recurring basis, as described below.
The table below presents certain of our assets and liabilities measured at fair value on a recurring basis as of December 31, 2008, aggregated by the level in the fair value hierarchy within which those measurements fall as defined above (amounts in thousands).
| | | | | | | | | | | | | | |
| | | Level 1 | | Level 2 | | | Level 3 | | Total | |
Assets | | | | | | | | | | | | | | |
Preferred equity | | $ | 31,592 | | $ | — | | | $ | — | | $ | 31,592 | |
CMBS and CRE-CDOs | | | — | | | — | | | | 20,776 | | | 20,776 | |
| | | | | | | | | | | | | | |
Investment in real estate securities | | | 31,592 | | | — | | | | 20,776 | | | 52,368 | |
Liabilities | | | | | | | | | | | | | | |
Derivative instruments | | | — | | | (27,213 | ) | | | — | | | (27,213 | ) |
| | | | | | | | | | | | | | |
Total | | $ | 31,592 | | $ | (27,213 | ) | | $ | 20,776 | | $ | 25,155 | |
| | | | | | | | | | | | | | |
F-26
The table below presents a reconciliation of the beginning and ending balances of certain of our assets and liabilities having fair value measurements based on significant unobservable inputs (Level 3) between December 31, 2007 and December 31, 2008 (amounts in thousands).
| | | | |
| | | CMBS and
CRE-CDOs | |
Beginning balance as of December 31, 2007 (1) | | $ | 105,175 | |
Included in net income (loss) | | | (122,096 | ) |
Included in other comprehensive income (loss) | | | 37,793 | |
Purchases, issuances and settlements | | | (96 | ) |
| | | | |
Total change in fair value | | | (84,399 | ) |
Transfers in and/or out of Level 3 | | | — | |
| | | | |
Ending balance as of December 31, 2008 | | $ | 20,776 | |
| | | | |
| (1) | We implemented the provisions of SFAS No. 157 effective as of January 1, 2008. The implementation of SFAS No. 157 did not significantly impact our pricing procedures related to our investments in real estate securities that fall under the Level 3 category of the pricing hierarchy. As a result, the fair value of these securities is presented as a beginning balance as of December 31, 2007 as opposed to a transfer into Level 3. |
Fair Value Estimates of Investments in Real Estate Securities
As of December 31, 2008, our real estate securities were valued in two categories, comprised of (i) preferred equity securities and (ii) CMBS and CRE-CDOs. Our pricing procedures for each of the two categories are applied to each specific investment within their respective categories.
Preferred Equity Securities—The valuation of our investments in preferred equity securities is determined using exchange listed prices in an active market. As such, preferred equity securities fall within Level 1 of the fair value hierarchy.
CMBS and CRE-CDOs—We estimate the fair value of our CMBS and CRE-CDO securities using a combination of observable market information and unobservable market assumptions. Observable market information considered in these fair market valuations include benchmark interest rates, interest rate curves, credit market indexes and swap curves. Unobservable market assumptions considered in the determination of the fair market valuations of our CMBS and CRE-CDO investments include market assumptions related to discount rates, default rates, prepayment rates, reviews of trustee or investor reports and non-binding broker quotes and pricing services in what is currently an inactive market. Additionally, we consider security-specific characteristics in determining the fair values of our CMBS and CRE-CDO investments, which include consideration of credit enhancements, the underlying collateral’s average default rates, the average delinquency rate and loan-to-value and several other characteristics. As a result, both Level 2 and Level 3 inputs are used in arriving at the valuation of our investments in CMBS and CRE-CDOs. We consider the Level 3 inputs considered in determining the fair value of its investments in CMBS and CRE-CDO securities to be significant. As such, all investments in CMBS and CRE-CDO securities fall under the Level 3 category of the fair value hierarchy.
Fair Value Estimates of Derivative Instruments
Currently, we use forward starting swaps, zero cost collars and interest rate caps to manage interest rate risk. The values of these instruments are determined using widely accepted valuation techniques, including discounted cash flow analysis of the expected cash flows of each derivative. This analysis reflects the contractual terms of the derivatives, including the period to maturity, and uses observable market-based inputs, including interest rate curves and implied volatilities. The valuation methodologies are segregated into two categories of derivatives: (i) forward starting swaps and (ii) zero cost collars/interest rate caps.
Forward Starting Swaps—Forward starting swaps are considered and measured at fair value as interest rate swaps. The fair values of interest rate swaps are determined using the market standard methodology of netting the discounted future fixed cash payments and the discounted expected variable cash receipts. The variable cash receipts are based on an expectation of future interest rates (i.e. forward curves) derived from observable market interest rate curves.
Zero Cost Collars/Interest Rate Caps (Interest Rate Options)—Zero cost collars and interest rate caps are considered and measured at fair value as interest rate options. The fair values of interest rate options are determined using the market standard methodology of discounting the future expected cash receipts that would occur if variable interest rates fell below or rose above the strike rate of the caps or outside of the applicable collar rates. The variable interest rates used in the calculation of projected receipts on the cap or collar rates are based on an expectation of future interest rates derived from observable market interest rate curves and volatilities.
F-27
To comply with the provisions of SFAS No. 157, we incorporate credit valuation adjustments to appropriately reflect both our own nonperformance risk and the respective counterparty’s nonperformance risk in the fair value measurements. In adjusting the fair value of our derivative contracts for the effect of nonperformance risk, we have considered the impact of netting and any applicable credit enhancements, such as collateral postings, thresholds, mutual puts, and guarantees.
The majority of the inputs used to value our derivative instruments fall within Level 2 of the fair value hierarchy. However, the credit valuation adjustments associated with our derivative instruments utilize Level 3 inputs, such as estimates of current credit spreads, to evaluate the likelihood of potential default by us and our counterparties. As of December 31, 2008, we have assessed the significance of the impact of the credit valuation adjustments and have determined that it was not significant to the overall valuation of our derivative instruments. As a result, we have determined that all of our derivative valuations are appropriately classified in Level 2 of the fair value hierarchy.
| 10. | FAIR VALUE OF FINANCIAL INSTRUMENTS |
We are required to disclose the fair value of our financial instruments for which it is practical to estimate that value under SFAS No. 107, Disclosure about Fair Value of Financial Instruments (“SFAS No 107”). SFAS No. 107 defines the fair value of a financial instrument as the amount at which such financial instrument could be exchanged in a current transaction between willing parties, other than in a forced sale or liquidation. For certain of our financial instruments, fair values are not readily available since there are no active trading markets as characterized by current exchanges between willing parties. Accordingly, we derive or estimate fair value using various valuation techniques, such as computing the present value of estimated future cash flows using discount rates commensurate with the risks involved. However, the determination of estimated cash flows may be subjective and imprecise and changes in assumptions or estimation methodologies can have a material effect on these estimated fair values. In that regard, the fair value estimates may not be substantiated by comparison to independent markets, and in many cases, may not be realized in immediate settlement of the instrument. See Note 9 for further discussion of our determination of fair values in inactive markets and the corresponding application of the SFAS No. 157 hierarchy.
The fair values estimated below are indicative of the interest rate and other assumptions as of December 31, 2008 and 2007, and may not take into consideration the effects of subsequent interest rate or other assumption fluctuations, or changes in the values of underlying collateral. The fair values of cash and cash equivalents, restricted cash, accounts receivable, and accounts payable and accrued expenses approximate their carrying values because of the short-term nature of these instruments. In addition, we determined that the fair value of our other secured borrowings approximates its carrying value as of December 31, 2008 and 2007.
The carrying amounts and estimated fair values of our other financial instruments as of December 31, 2008 and 2007 were as follows (amounts in thousands).
| | | | | | | | | | | | |
| | | 2008 | | 2007 |
| | | Carrying
Amount | | Estimated
Fair Value | | Carrying
Amount | | Estimated
Fair Value |
Assets: | | | | | | | | | | | | |
Investments in real estate securities | | $ | 52,368 | | $ | 52,368 | | $ | 180,663 | | $ | 180,663 |
Fixed-rate debt related investments, net | | | 54,898 | | | 52,086 | | | 37,899 | | | 37,899 |
Floating-rate debt related investments, net | | | 33,951 | | | 33,231 | | | 66,192 | | | 66,192 |
Liabilities: | | | | | | | | | | | | |
Fixed-rate mortgage notes | | $ | 660,982 | | $ | 617,509 | | $ | 490,797 | | $ | 466,300 |
Floating-rate mortgage notes | | | 58,037 | | | 56,381 | | | 170,886 | | | 170,886 |
Derivative liabilities | | | 27,213 | | | 27,213 | | | 27,949 | | | 27,949 |
F-28
See Note 9 for details regarding methodologies and key assumptions applied to determining the fair value of our investments in real estate securities and derivative liabilities. The methodologies used and key assumptions made to estimate fair values of the other financial instruments described in the above table are as follows:
Debt Related Investments—The fair value of our debt investments as of December 31, 2008 was estimated using a discounted cash flow analysis that utilized estimates of scheduled cash flows and discount rates estimated to approximate those that a willing buyer and seller might use. We determined that the fair value of our debt related investments approximated their carrying values as of December 31, 2007.
Mortgage Notes—The fair value of our fixed-rate mortgage notes as of December 31, 2008 and 2007 and our floating-rate mortgage notes as of December 31, 2008 was estimated using a discounted cash flow analysis, based on our estimate of market interest rates. Credit spreads relating to the underlying instruments are based on unobservable Level 3 inputs as defined by SFAS No. 157 which we have determined to be our best estimate of current market spreads of similar instruments. We determined that the fair value of our floating-rate mortgage notes approximated their carrying values as of December 31, 2007.
Our minority interests consist of three components: (i) joint venture partnership interests held by our partners, (ii) OP Units held by third parties and (iii) Special Units held by the parent of our Advisor. The following table summarizes minority interest balances as of December 31, 2008 and 2007 in terms of cumulative contributions, distributions and cumulative allocations of net income (loss) (amounts in thousands).
| | | | | | | | |
| | | 2008 | | | 2007 | |
OP Units: | | | | | | | | |
Contributions | | $ | 59,394 | | | $ | 200 | |
Distributions | | | (2,660 | ) | | | (21 | ) |
Share of net loss | | | (6,276 | ) | | | (60 | ) |
| | | | | | | | |
Subtotal | | | 50,458 | | | | 119 | |
Joint Venture Partner Interests: | | | | | | | | |
Contributions | | | 35,274 | | | | 27,094 | |
Distributions | | | (10,543 | ) | | | (7,501 | ) |
Share of net loss | | | (2,004 | ) | | | (873 | ) |
| | | | | | | | |
Subtotal | | | 22,727 | | | | 18,720 | |
Special Units: | | | | | | | | |
Contributions | | | 1 | | | | 1 | |
Distributions | | | — | | | | — | |
Share of net loss | | | — | | | | — | |
| | | | | | | | |
Subtotal | | | 1 | | | | 1 | |
| | | | | | | | |
Total | | $ | 73,186 | | | $ | 18,840 | |
| | | | | | | | |
OP Units
As of December 31, 2008 and 2007, we owned approximately 96.1% and 99.0%, respectively, of our Operating Partnership, and the remaining interests in our Operating Partnership are owned by third-party investors and our Advisor. After a period of one year, holders of OP Units may request the Operating Partnership to redeem their OP Units. We have the option of redeeming the OP Units with cash, shares of our common stock or with a combination of cash and shares of our common stock. In May 2005, our Operating Partnership issued 20,000 OP Units to our Advisor for gross proceeds of $200,000, which currently represents less than a 0.1% ownership interest in our Operating Partnership. In addition, as of December 31, 2008, we had issued approximately 6.5 million OP Units to third-party investors in connection with our Operating Partnership’s private placements and such units had a maximum approximate redemption value of $64.8 million based on the price of our common stock.
During the year ended December 31, 2008, OP Unit holders contributed approximately $59.2 million to our Operating Partnership and received aggregate distributions from our Operating Partnership of approximately $2.7 million. For the years ended December 31, 2008, 2007 and 2006, we attributed approximately ($6.2) million, $2,000 and ($62,000), respectively, in net gains (losses) of our Operating Partnership to OP Unit holders.
F-29
Joint Venture Partner Interests
Certain of our joint ventures are consolidated by us in the accompanying consolidated financial statements. We present contributions, distributions and equity in earnings of the respective joint venture partners as minority interests.
During the years ended December 31, 2008 and 2007, joint venture partners contributed approximately $8.2 million and $24.4 million, respectively, to these joint ventures and had received distributions from these joint ventures of approximately $3.0 million and $14.9 million, respectively. For the years ended December 31, 2008, 2007 and 2006, joint venture partners collectively participated in approximately $1.1 million, $870,000 and $3,000, respectively, in net losses of their respective joint ventures.
Special Units
On May 4, 2005, the Operating Partnership issued 100 Special Units to the parent of the Advisor for consideration of $1,000. The holder of the Special Units does not participate in the profits and losses of the Operating Partnership. Amounts distributable to the holder of the Special Units will depend on operations and the amount of net sales proceeds received from real property and real estate securities dispositions or upon other events. In general, after holders of OP Units, in aggregate, have received cumulative distributions equal to their capital contributions plus a 6.5% cumulative, non-compounded annual pre-tax return on their net contributions, the holder of the Special Units and the holders of OP Units will receive 15% and 85%, respectively, of the net sales proceeds received by the Operating Partnership upon the disposition of the Operating Partnership’s assets. In addition, the Special Units will be redeemed by the Operating Partnership, resulting in a one-time payment, in the form of a promissory note, to the holder of the Special Units, upon the earliest to occur of the following events:
| | (1) | The listing of our common stock on a national securities exchange or the receipt by our stockholders of securities that are listed on a national securities exchange in exchange for our common stock; or |
| | (2) | The termination or non-renewal of the Advisory Agreement, (i) for “cause,” as defined in the Advisory Agreement, (ii) in connection with a merger, sale of assets or transaction involving us pursuant to which a majority of our directors then in office are replaced or removed, (iii) by the Advisor for “good reason,” as defined in the Advisory Agreement, or (iv) by us or the Operating Partnership other than for “cause.” |
There was no activity related to Special Unit holders during the years ended December 31, 2008, 2007 or 2006.
Common Stock
On May 27, 2005, we filed a registration statement on Form S-11 with the Commission in connection with an initial public offering of our common stock, which was declared effective on January 27, 2006. Pursuant to the registration statement, we offered up to $2.0 billion in shares of our common stock, 75% of which were offered to the public at a price of $10.00 per share, and 25% of which were offered pursuant to our distribution reinvestment plan at a price of $9.50 per share. On June 11, 2007, we filed a registration statement on Form S-11 with the Commission for a follow-on public offering of our common stock, which was declared effective on January 22, 2008. Pursuant to the registration statement, we are currently offering up to $2.0 billion in shares of our common stock, 75% of which are being offered to the public at a price of $10.00 per share, and 25% of which are being offered pursuant to our distribution reinvestment plan at a price of $9.50 per share. The following table summarizes shares sold, gross proceeds received and the commissions and fees paid by offering as of December 31, 2008 (amounts in thousands).
| | | | | | | | | | | | | | | |
| | | Shares | | | Gross
Proceeds | | | Commissions
and Fees | | | Net
Proceeds | |
Shares sold in the initial offering | | 114,742 | | | $ | 1,136,969 | | | $ | (104,295 | ) | | $ | 1,032,674 | |
Shares sold in the follow-on offering | | 42,008 | | | | 413,120 | | | | (35,224 | ) | | | 377,896 | |
Shares sold pursuant to our distribution reinvestment plan in the initial offering | | 3,455 | | | | 32,824 | | | | (309 | ) | | | 32,515 | |
Shares sold pursuant to our distribution reinvestment plan in the follow-on offering | | 5,051 | | | | 47,986 | | | | — | | | | 47,986 | |
Shares repurchased pursuant to our share redemption program | | (6,227 | ) | | | (57,492 | ) | | | — | | | | (57,492 | ) |
| | | | | | | | | | | | | | | |
Total | | 159,029 | | | $ | 1,573,407 | | | $ | (139,828 | ) | | $ | 1,433,579 | |
| | | | | | | | | | | | | | | |
F-30
For the years ended December 31, 2008 and 2007, approximately 43.7 million and 83.0 million shares, net of redemptions, of our common stock were issued in connection with our public offerings, respectively, for net proceeds of approximately $394.5 million and $752.3 million, respectively. The net proceeds from the sale of these shares were transferred to our Operating Partnership in exchange for OP Units on a one-for-one basis.
Redemptions
After having held shares of our common stock for a minimum of one year, our share redemption program may provide investors with a limited opportunity to redeem shares of our common stock, subject to certain restrictions and limitations, at a price equal to or at a discount from the purchase price paid for the shares being redeemed. The discount will vary based upon the length of time that the investors have held the shares of our common stock subject to redemption, as described in the following table.
| | | |
Share Purchase Anniversary | | Redemption Price
as a Percentage
of Purchase Price | |
Less than 1 year | | No Redemption Allowed | |
1 year | | 92.5 | % |
2 years | | 95.0 | % |
3 years | | 97.5 | % |
4 years and longer | | 100.0 | % |
During the years ended December 31, 2008 and 2007, we redeemed approximately 6.0 million shares and 208,000 shares of our common stock, respectively, pursuant to our share redemption program for approximately $55.6 million and $1.9 million, respectively.
Distributions
We accrue and pay distributions on a quarterly basis. Our board of directors declares and authorizes the following quarter’s distribution during the preceding quarter. We calculate individual payments of distributions to each stockholder or OP Unit holder based upon daily record dates during each quarter, so that investors are eligible to earn distributions immediately upon purchasing shares of our common stock or upon purchasing OP Units. During the years ended December 31, 2008 and 2007, we paid distributions to our common stockholders of approximately $84.0 million and $51.2 million, respectively. The following table sets forth the distributions that have been paid and/or authorized as of December 31, 2008.
| | | | | | | | |
Quarter | | Amount Declared
Per
Share/Unit(1) | | Annualized Amount
Per
Share/Unit(1) | | Payment Date |
2006 | | | | | | | | |
2nd Quarter 2006 | | $ | 0.1326 | | $ | 0.55 | | July 17, 2006 |
3rd Quarter 2006 | | $ | 0.1386 | | $ | 0.55 | | October 13, 2006 |
4th Quarter 2006 | | $ | 0.1512 | | $ | 0.60 | | January 12, 2007 |
2007 | | | | | | | | |
1st Quarter 2007 | | $ | 0.1479 | | $ | 0.60 | | April 16, 2007 |
2nd Quarter 2007 | | $ | 0.1496 | | $ | 0.60 | | July 16, 2007 |
3rd Quarter 2007 | | $ | 0.1512 | | $ | 0.60 | | October 11, 2007 |
4th Quarter 2007 | | $ | 0.1513 | | $ | 0.60 | | January 15, 2008 |
2008 | | | | | | | | |
1st Quarter 2008 | | $ | 0.1500 | | $ | 0.60 | | April 15, 2008 |
2nd Quarter 2008 | | $ | 0.1500 | | $ | 0.60 | | July 15, 2008 |
3rd Quarter 2008 | | $ | 0.1500 | | $ | 0.60 | | October 15, 2008 |
4th Quarter 2008 | | $ | 0.1500 | | $ | 0.60 | | January 15, 2009 |
2009 | | | | | | | | |
1st Quarter 2009 | | $ | 0.1500 | | $ | 0.60 | | April 15, 2009 (2) |
| (1) | Assumes ownership of share or unit for the entire quarter. |
| (2) | Expected payment date. |
F-31
Distribution Tax Characterization
Our distributions to stockholders are characterized for federal income tax purposes as (i) ordinary income, (ii) non-taxable return of capital, (iii) long term capital gain or (iv) unrecaptured 1250 gain from certain depreciable properties. Distributions that exceed our current and accumulated earnings and profits (calculated for tax purposes) constitute a return of capital for tax purposes rather than a dividend and reduce the stockholders’ basis in the common shares. To the extent that distributions exceed both current and accumulated earnings and profits and the stockholders’ basis in the common shares, they will generally be treated as a gain from the sale or exchange of our stockholders’ common shares. We notify stockholders of the taxability of distributions paid during the preceding year on an annual basis. The following summarizes the taxability of distributions on common shares for the years ended December 31, 2008, 2007 and 2006.
| | | | | | | | | | | | | | | | | | |
| | | 2008 | | | 2007 | | | 2006 | |
Per common share | | Per share
amount | | Percentage | | | Per share
amount | | Percentage | | | Per share
amount | | Percentage | |
Ordinary income | | $ | 0.29 | | 48.85 | % | | $ | 0.35 | | 58.33 | % | | $ | 0.19 | | 45.24 | % |
Non-taxable return of capital | | | 0.31 | | 51.15 | % | | | 0.24 | | 40.00 | % | | | 0.22 | | 52.38 | % |
Long-term capital gain | | | — | | 0.00 | % | | | 0.01 | | 1.67 | % | | | 0.01 | | 2.38 | % |
Unrecaptured 1250 gain | | | — | | 0.00 | % | | | — | | 0.00 | % | | | — | | 0.00 | % |
| | | | | | | | | | | | | | | | | | |
Total | | $ | 0.60 | | 100.00 | % | | $ | 0.60 | | 100.00 | % | | $ | 0.42 | | 100.00 | % |
| | | | | | | | | | | | | | | | | | |
| 13. | RELATED PARTY TRANSACTIONS |
Our Advisor
Our day-to-day activities are managed by our Advisor, an affiliate, under the terms and conditions of the Advisory Agreement. Our Advisor is considered to be a related party as certain indirect owners and employees of our Advisor serve as our executives. The responsibilities of our Advisor include the selection and underwriting of our real property, real estate securities and debt related investments, the negotiations for these investments, the asset management and financing of these investments and the selection of prospective joint venture partners.
Acquisition Fees
Pursuant to the Advisory Agreement we pay certain acquisition fees to the Advisor. For each real property acquired in the operating stage, the acquisition fee is equal to 1.0% of the purchase price. For each real property acquired prior to or during the development or construction stage, the acquisition fee is equal to up to 4.0% of the total project cost (which will be the amount actually paid or allocated to the purchase, development, construction or improvement of a property exclusive of acquisition fees and acquisition expenses). The Advisor also is entitled to receive an acquisition fee of 1.0% of the principal amount in connection with (i) the origination or acquisition of any type of debt investment including, but not limited to, the origination of mortgage loans, B-notes, mezzanine debt, participating debt (including with equity-like features), non-traded preferred securities, convertible debt, hybrid instruments, equity instruments and other related investments, and (ii) the acquisition of any type of non-securitized debt investment including, but not limited to, acquisitions or participations in mortgage loans, B-notes, mezzanine debt, participating debt (including with equity-like features), non-traded preferred securities, convertible debt, hybrid instruments, equity instruments and other related investments. During the years ended December 31, 2008, 2007 and 2006, our Advisor earned approximately $2.4 million, $11.1 million and $4.5 million in acquisition fees, respectively, which are accounted for as part of the historical cost of the acquired assets.
Asset Management Fees
We also pay our Advisor an asset management fee pursuant to the Advisory Agreement in connection with the asset and portfolio management of real property, real estate securities and debt related investments. The Advisor’s asset management fee is payable as follows:
Prior to the Dividend Coverage Ratio Date (as defined below):
For Direct Real Properties (as defined below), the asset management fee consists of (i) a monthly fee not to exceed one-twelfth of 0.50% of the aggregate cost (before non-cash reserves and depreciation) of Direct Real Properties; and (ii) a monthly fee not to exceed 6% of the aggregate monthly net operating income derived from all Direct Real Properties; provided, however, that the aggregate monthly fee to be paid to the Advisor pursuant to these subclauses (i) and (ii) in aggregate shall not exceed one-twelfth of 0.75% of the aggregate cost (before non-cash reserves and depreciation) of all Direct Real Properties.
F-32
For Product Specialist Real Properties (as defined below), the asset management fee consists of (i) a monthly fee not to exceed one-twelfth of 0.50% of the aggregate cost (before non cash reserves and depreciation) of Product Specialist Real Properties; and (ii) a monthly fee not to exceed 6% of the aggregate monthly net operating income derived from all Product Specialist Real Properties.
After the Dividend Coverage Ratio Date (as defined below):
For all real properties, the asset management fee consists of: (i) a monthly fee not to exceed one-twelfth of 0.50% of the aggregate cost (before non cash reserves and depreciation) of all real property assets within our portfolio; and (ii) a monthly fee not to exceed 8.0% of the aggregate monthly net operating income derived from all real property assets within our portfolio.
“Direct Real Properties”: shall mean those real properties acquired directly by us without the advice or participation of a product specialist engaged by the Advisor.
“Dividend Coverage Ratio”: shall mean, as to any given fiscal quarter, the total amount of distributions made by us in that fiscal quarter divided by the aggregate funds from operations for that fiscal quarter.
“Dividend Coverage Ratio Date”: shall be the date on which our dividend coverage ratio has been less than or equal to 1.00 for two consecutive fiscal quarters.
“Product Specialist Real Properties”: shall mean those real properties acquired by us pursuant to the advice or participation of a product specialist engaged by the Advisor pursuant to a contractual arrangement.
In addition, both before and after the Dividend Coverage Ratio Date, the asset management fee for all real property assets (acquired both prior to and after the Dividend Coverage Ratio Date) includes a fee of 1.0% of the sales price of individual real property assets upon disposition.
For securities and debt related assets, both before and after the Dividend Coverage Ratio Date, the asset management fee consists of a monthly fee equal to one-twelfth of 1.0% of the aggregate value of the securities and debt related assets within our portfolio.
For the years ended December 31, 2008, 2007 and 2006, our Advisor earned approximately $11.6 million, $8.7 million and $722,000 in asset management fees, respectively.
Fees Paid to our Advisor and its Affiliates Related to Public Offerings of our Common Stock
The following table summarized selling costs incurred associated with our public offerings of commons stock by us and paid to our Advisor or affiliates of our Advisor. These amounts have been included as a reduction to additional paid-in capital in the accompanying consolidated statement of stockholders’ equity. See below for further description of each fee for the years ended December 31, 2008, 2007 and 2006 (amounts in thousands).
| | | | | | | | | | | | |
Reimbursement and Fee Description | | 2008 | | 2007 | | 2006 | | Total |
Organization and offering costs reimbursement | | $ | 6,923 | | $ | 12,017 | | $ | 4,784 | | $ | 23,724 |
Dealer manager fees | | | 11,537 | | | 20,159 | | | 8,049 | | | 39,745 |
Broker dealer sales commissions | | | 19,925 | | | 40,780 | | | 15,654 | | | 76,359 |
| | | | | | | | | | | | |
Total reimbursements and fees | | $ | 38,385 | | $ | 72,956 | | $ | 28,487 | | $ | 139,828 |
| | | | | | | | | | | | |
Organizational and Offering Cost Reimbursement
Pursuant to the Advisory Agreement, our Advisor is obligated to advance all of our organizational and offering costs subject to its right to be reimbursed for such costs by us in an amount up to 1.5% of the aggregate gross offering proceeds raised in our public offerings of common stock. Such organizational and offering costs include, but are not limited to, actual legal, accounting, printing and other expenses attributable to preparing registration statements, qualification of the shares for sale in the states and filing fees incurred by our Advisor, as well as reimbursements for marketing, salaries and direct expenses of its employees while engaged in registering and marketing the shares, other than selling commissions and the dealer manager fee. Offering costs incurred in connection with the issuance of equity securities are deducted from stockholders’ equity.
F-33
As of December 31, 2008, the Advisor had incurred reimbursable offering costs of approximately $33.2 million. As of December 31, 2008, we were obligated to reimburse approximately $23.7 million in such reimbursable offering costs. As of December 31, 2008, of the $23.7 million in reimbursable offering costs we had incurred, approximately $216,000 had not yet been reimbursed to the Advisor, and have been included in accounts payable and accrued expenses in the accompanying consolidated balance sheet. As of December 31, 2007, of the $16.8 million in reimbursable offering costs we had incurred, approximately $336,000 had not yet been reimbursed to the Advisor, which have been included in accounts payable and accrued expenses in the accompanying consolidated balance sheet.
As of December 31, 2008, approximately $9.5 million of reimbursable offering costs incurred by the Advisor are not reflected in the accompanying consolidated balance sheets, due to the fact that we are not obligated to reimburse these costs to the Advisor until the corresponding aggregate gross offering proceeds are raised in our public offering of common stock.
Dealer Manager Fees and Broker Dealer Sales Commissions
Pursuant to the Dealer Manager Agreement we pay a dealer manager fee of up to 2.5% of gross offering proceeds raised pursuant to our public offerings of common stock to the Dealer Manager as compensation for managing the offerings. The Dealer Manager is considered to be a related party as certain indirect owners and employees of the Dealer Manager serve as our executives. The Dealer Manager may re-allow a portion of such fees to broker dealers who participate in the offerings. We also pay up to a 6.0% sales commission of gross offering proceeds raised pursuant to our public offerings of common stock. As of December 31, 2008, all sales commissions paid to the Dealer Manager had been re-allowed to participating broker dealers. Such amounts are considered a cost of raising capital and as such are included as a reduction of additional paid-in capital in the accompanying consolidated statement of stockholders’ equity. Of these costs, we had accrued approximately $361,000 and $574,000 for dealer manager fees and $123,000 and $256,000 for sales commissions as of December 31, 2008 and 2007, respectively.
Fees Paid to the Advisor and Affiliates Related to our Operating Partnership’s Private Placement Offerings
The following table summarized costs incurred associated with our Operating Partnership’s private placement offerings by us and paid to our Advisor or affiliates of our Advisor. These amounts are accounted for as deferred loan costs. Such deferred loan costs are included in our consolidated balance sheets and amortized to “Interest expense” over the life of the financing obligation (see Note 8 for additional information). As described in Note 8, if our partnership elects to exercise any purchase option and issue limited partnership units, the unamortized portion of up-front fees and expense reimbursements paid to affiliates will be recorded against minority interest as a selling cost of the limited partnership units. See below for further discussion of each fee described in the below table for the years ended December 31, 2008, 2007 and 2006 (amounts in thousands).
| | | | | | | | | | | | |
Reimbursement and Fee Description | | 2008 | | 2007 | | 2006 | | Total |
Organization and offering costs reimbursement | | $ | 963 | | $ | 1,013 | | $ | 585 | | $ | 2,561 |
Dealer manager fees | | | 963 | | | 1,013 | | | 585 | | | 2,561 |
Broker dealer sales commissions | | | 3,151 | | | 3,262 | | | 1,949 | | | 8,362 |
Facilitator fees | | | 1,284 | | | 1,351 | | | 780 | | | 3,415 |
| | | | | | | | | | | | |
Total reimbursements and fees | | $ | 6,361 | | $ | 6,639 | | $ | 3,899 | | $ | 16,899 |
| | | | | | | | | | | | |
Organizational and Offering Cost Reimbursement
Our Advisor is obligated to pay all of the offering and marketing-related costs associated with our Operating Partnership’s private placement. However, the Operating Partnership is obligated to pay our Advisor a non-accountable expense allowance which equals 1.5% of the gross equity proceeds raised through the Operating Partnership’s private placement.
F-34
Dealer Manager Fees and Broker Dealer Sales Commissions
We have also entered into a separate dealer manager agreement with the Dealer Manager pursuant to which we pay a dealer manager fee of up to 1.5% of the gross equity proceeds raised through our Operating Partnership’s private placements. We also pay the Dealer Manager a sales commission of up to 5.0% of the gross equity proceeds raised through our Operating Partnership’s private placement. As of December 31, 2008, substantially all of the sales commissions were re-allowed to participating broker dealers who are responsible for effecting sales.
Facilitator Fees
The Facilitator is responsible for facilitating transactions associated with the Operating Partnership’s private placements. The Facilitator is considered a related party as certain indirect owners and employees of the Facilitator serve as our executives. We have entered into an agreement with the Facilitator whereby we pay a transaction facilitation fee of up to 2.0% of the gross equity proceeds raised through the Operating Partnership’s private placement.
Other Expense Reimbursements
In addition to the reimbursement of organizational and offering costs, we are also obligated, subject to certain limitations, to reimburse our Advisor for certain other expenses incurred on our behalf for providing services contemplated in the Advisory Agreement, provided that the Advisor does not receive a specific fee for the activities which generate the expenses to be reimbursed. For the years ended December 31, 2008, 2007 and 2006, we incurred approximately $729,000, $431,000 and $273,000, respectively, of these expenses which we reimbursed to the Advisor. We record these reimbursements as general and administrative expenses in our consolidated statements of operations.
Dividend Capital Investments LLC and DCT Industrial Trust Inc.
In addition to utilizing its own management team, the Advisor actively seeks to form strategic alliances with recognized leaders in the real estate and investment management industries. These alliances are intended to allow the Advisor to leverage the organizational infrastructure of experienced real estate developers, operators and investment managers and to potentially give us access to a greater number of real property and real estate securities investment opportunities. The use of product specialists or other service providers does not eliminate or reduce the Advisor’s fiduciary duty to the Company. The Advisor retains ultimate responsibility for the performance of all of the matters entrusted to it under the Advisory Agreement.
The Advisor’s product specialists are and will be compensated through a combination of (a) reallowance of acquisition, disposition, asset management and/or other fees paid by us to the Advisor and (b) potential profit participation in connection with specific portfolio asset(s) identified by them and invested in by us. We may also enter into joint ventures, partnerships or similar arrangements with the Advisor’s product specialists for the purpose of acquiring portfolio assets and, in such cases, the product specialists may or may not make an equity capital contribution to any such arrangement.
On June 12, 2006, our Advisor entered into a product specialist agreement with Dividend Capital Investments LLC (“DCI”) in connection with investment management services related to our investments in real estate securities assets. Pursuant to this agreement, a portion of the asset management fee that our Advisor receives from us related to securities investments is reallowed to DCI in exchange for services provided.
On September 1, 2006, our Advisor entered into a product specialist agreement with DCT Industrial Trust Inc. (“DCT”), in connection with acquisition and asset management services related to our industrial real property investments. Pursuant to this agreement, a portion of the acquisition and asset management fees that our Advisor receives from us related to specific industrial real property investments is reallowed to DCT in exchange for services provided.
In addition, on September 1, 2006, we, through TRT Industrial Fund I LLC, our wholly-owned subsidiary, entered into a joint venture agreement (“DCT Joint Venture I”) with DCT Industrial Fund II LLC, an indirect wholly-owned subsidiary of DCT, for the acquisition, operation and management of up to $150 million in industrial real property assets (the “Industrial Portfolio”). On March 26, 2007, we entered into an amendment to the DCT Joint Venture I. Pursuant to the terms of the amendment the amount of industrial properties to be acquired under the agreement was increased from its original amount of up to $150 million to a total amount of up to approximately $208.5 million.
The term of the DCT Joint Venture I is eight years and contains certain liquidation provisions, as well as certain termination rights should either of the parties fail to perform their obligations thereunder. In connection with the DCT Joint Venture I, we have granted to DCT, subject to certain exceptions, exclusivity rights that generally restrict us from (a) pursuing similar agreements with other industrial operating partners within the United States during the term of the DCT Joint Venture I and (b) directly acquiring or developing industrial assets within the United States during the term of the DCT Joint Venture I.
F-35
On March 27, 2007, we, through TRT Industrial Fund II LLC, our wholly-owned subsidiary, entered into a new joint venture (“DCT Joint Venture II”) with DCT Industrial Fund III LLC, an indirect wholly-owned subsidiary of DCT. The DCT Joint Venture II is subject to similar terms as the DCT Joint Venture I, as discussed above.
On September 9, 2008, we, through TRT Industrial Fund III LLC, our indirect wholly-owned subsidiary, entered into a new joint venture (“DCT Joint Venture III”) with DCT Industrial Fund III LLC, an indirect wholly-owned subsidiary of DCT. The DCT Joint Venture III is subject to similar terms as the DCT Joint Venture I, as discussed above. The amount of industrial properties intended to be acquired under DCT Joint Venture III is $200 million.
As of December 31, 2008, we had acquired 14 properties pursuant to the terms of the DCT Joint Venture I, all of which were acquired by the DCT Joint Venture I entity itself. As of December 31, 2008, we had acquired seven properties pursuant to the terms of the DCT Joint Venture II, six of which were acquired by the DCT Joint Venture II entity itself, and one of which were acquired entirely by us pursuant to the terms of the DCT Joint Venture II. As of December 31, 2008, we had acquired five properties pursuant to the terms of the DCT Joint Venture III, all of which were acquired by the DCT Joint Venture III entity itself.
Acquisitions pursuant to the DCT Joint Venture I, DCT Joint Venture II and DCT Joint Venture III as of December 31, 2008, were generally funded from a combination of (i) equity contributions from us using proceeds from our public and private offerings, (ii) equity contributions from DCT and (iii) debt financing either assumed or issued by the respective joint venture. The acquisition of each asset in the Industrial Portfolio was subject to majority approval by our independent directors.
| 14. | NET INCOME (LOSS) PER COMMON SHARE |
Reconciliations of the numerator and denominator used to calculate basic net income (loss) per common share to the numerator and denominator used to calculate diluted net income (loss) per common share for the years ended December 31, 2008, 2007 and 2006, are described in the following table (amounts in thousands, except per share information).
| | | | | | | | | | | | |
| | | 2008 | | | 2007 | | | 2006 | |
Numerator | | | | | | | | | | | | |
Net income (loss) for basic earnings per share from continuing operations | | $ | (176,621 | ) | | $ | 11,065 | | | $ | (52 | ) |
Dilutive minority interests share in net income (loss) from continuing operations | | | (6,169 | ) | | | (3 | ) | | | (62 | ) |
| | | | | | | | | | | | |
Numerator for diluted earnings per share – adjusted income (loss) from continuing operations | | | (182,790 | ) | | | 11,062 | | | | (114 | ) |
Net income (loss) for basic earnings per share | | $ | (176,386 | ) | | $ | 11,065 | | | $ | (52 | ) |
Dilutive minority interests share in net income (loss) from continuing operations | | | (6,169 | ) | | | (3 | ) | | | (62 | ) |
Dilutive minority interests share in net income (loss) from discontinued operations | | | — | | | | — | | | | — | |
| | | | | | | | | | | | |
Numerator for diluted earnings per share – adjusted net income (loss) | | | (182,555 | ) | | | 11,062 | | | | (114 | ) |
Denominator | | | | | | | | | | | | |
Weighted average shares outstanding-basic | | | 140,106 | | | | 85,473 | | | | 7,087 | |
Incremental weighted average shares effect of conversion of OP units | | | 4,427 | | | | 20 | | | | 20 | |
| | | | | | | | | | | | |
Weighted average shares outstanding-diluted | | | 144,533 | | | | 85,493 | | | | 7,107 | |
| | | | | | | | | | | | |
NET INCOME PER COMMON SHARE-BASIC | | | | | | | | | | | | |
Net income (loss) from continuing operations | | $ | (1.26 | ) | | $ | 0.13 | | | $ | (0.01 | ) |
Net income (loss) from discontinued operations, net of minority interest | | | — | | | | — | | | | — | |
| | | | | | | | | | | | |
Net income (loss) | | $ | (1.26 | ) | | $ | 0.13 | | | $ | (0.01 | ) |
| | | | | | | | | | | | |
NET INCOME PER COMMON SHARE-DILUTED (1) | | | | | | | | | | | | |
Net income (loss) from continuing operations | | $ | (1.26 | ) | | $ | 0.13 | | | $ | (0.02 | ) |
Net income (loss) from discontinued operations, net of minority interest | | | — | | | | — | | | | — | |
| | | | | | | | | | | | |
Net income (loss) | | $ | (1.26 | ) | | $ | 0.13 | | | $ | (0.02 | ) |
| | | | | | | | | | | | |
| (1) | Net income (loss) per common share-diluted is computed by dividing net income (loss) before dilutive minority interests by the weighted average common shares plus shares issuable upon exercising outstanding OP Units. |
SFAS No. 131,Disclosures about Segments of an Enterprise and Related Information (“SFAS No. 131”) establishes standards for the way that public entities report information about operating segments in their financial statements. We have the following business segments: (i) investments in real property, (ii) investments in real estate securities and (iii) debt related investments. The following table sets forth components of net operating income (“NOI”) of our segments for years ended December 31, 2008, 2007 and 2006 (amounts in thousands).
F-36
| | | | | | | | | | | | | | | | | | |
| | | Rental Revenue | | Net Operating Income |
| | | 2008 | | 2007 | | 2006 | | 2008 | | 2007 | | 2006 |
Real property | | $ | 114,670 | | $ | 70,424 | | $ | 5,385 | | $ | 85,048 | | $ | 51,634 | | $ | 3,929 |
Real estate securities | | | 17,567 | | | 15,691 | | | 881 | | | 17,567 | | | 15,691 | | | 881 |
Debt related investments (1) | | | 9,962 | | | 8,951 | | | 238 | | | 9,962 | | | 8,951 | | | 238 |
| | | | | | | | | | | | | | | | | | |
Total | | $ | 142,199 | | $ | 95,066 | | $ | 6,504 | | $ | 112,577 | | $ | 76,276 | | $ | 5,048 |
| | | | | | | | | | | | | | | | | | |
| (1) | Includes operating results from our investment in an unconsolidated joint venture. |
We consider NOI to be an appropriate supplemental financial performance measure, because NOI reflects the specific operating performance of our real properties, real estate securities, and debt related investments and excludes certain items that are not considered to be controllable in connection with the management of each property, such as interest income, depreciation and amortization, general and administrative expenses, asset management fees, interest expense and minority interests. However, NOI should not be viewed as an alternative measure of our financial performance as a whole, since it does exclude such items which could materially impact our results of operations. Further, our NOI may not be comparable to that of other real estate companies, as they may use different methodologies for calculating NOI. Therefore, we believe net income, as defined by GAAP, to be the most appropriate measure to evaluate our overall financial performance.
The following table is a reconciliation of our NOI to our reported net income (loss) from continuing operations for the years ended December 31, 2008, 2007 and 2006 (amounts in thousands).
| | | | | | | | | | | | |
| | | 2008 | | | 2007 | | | 2006 | |
Net operating income | | $ | 112,577 | | | $ | 76,276 | | | | 5,048 | |
Interest income | | | 11,751 | | | | 11,927 | | | | 1,259 | |
Depreciation and amortization expense | | | (52,313 | ) | | | (31,358 | ) | | | (2,321 | ) |
General and administrative expenses | | | (4,232 | ) | | | (3,784 | ) | | | (1,305 | ) |
Asset management fees, related party | | | (11,599 | ) | | | (8,707 | ) | | | (722 | ) |
Interest expense | | | (45,112 | ) | | | (33,600 | ) | | | (2,076 | ) |
Gain (loss) on derivatives | | | (11,673 | ) | | | (557 | ) | | | — | |
Gain on extinguishment of debt | | | 9,309 | | | | — | | | | — | |
Other-than-temporary impairment on securities | | | (192,724 | ) | | | — | | | | — | |
Minority interests | | | 7,395 | | | | 868 | | | | 65 | |
| | | | | | | | | | | | |
Net income (loss) from continuing operations | | $ | (176,621 | ) | | $ | 11,065 | | | $ | (52 | ) |
| | | | | | | | | | | | |
The following table reflects our total assets by business segment as of December 31, 2008 and 2007 (amounts in thousands).
| | | | | | |
| | | 2008 | | 2007 |
Segment assets: | | | | | | |
Net investments in real property | | $ | 1,357,955 | | $ | 1,179,675 |
Investments in real estate securities | | | 52,368 | | | 180,663 |
Debt related investments, net (1) | | | 106,381 | | | 104,091 |
| | | | | | |
Total segment assets, net | | | 1,516,704 | | | 1,464,429 |
Non-segment assets: | | | | | | |
Assets held for sale | | | 3,266 | | | — |
Cash and cash equivalents | | | 540,321 | | | 291,634 |
Other non-segment assets (2) | | | 63,287 | | | 55,721 |
| | | | | | |
Total assets | | $ | 2,123,578 | | $ | 1,811,784 |
| | | | | | |
| (1) | Includes our investment in an unconsolidated joint venture. See Note 6. |
| (2) | Other non-segment assets primarily consist of corporate assets including subscriptions receivable, certain loan costs, including loan costs associated with our financing obligations, and deferred acquisition costs. |
F-37
We operate in a manner intended to qualify for treatment as a REIT for U.S. federal income tax purposes. We first elected REIT status for our taxable year ended December 31, 2006. In order for a former C corporation to elect to be a REIT, it must distribute 100% of its C corporation earnings and profits and agree to be subject to federal tax at the corporate level to the extent of any subsequently recognized built-in gains within a ten year period. We did not have any built-in gains at the time of our conversion to REIT status. As a REIT, we generally will not be subject to federal income taxation at the corporate level to the extent we distribute 100% of our REIT taxable income annually, as defined in the Code, to our stockholders and satisfy other requirements. To continue to qualify as a REIT for federal tax purposes, we must distribute at least 90% of our REIT taxable income annually. No material provisions have been made for federal income taxes in the accompanying consolidated financial statements.
In June 2006, the FASB issued Interpretation No. 48,Accounting for Uncertainty in Income Taxes—an interpretation of FASB Statement No. 109 (“FIN No. 48”). FIN No. 48 clarifies the accounting for uncertainty in income taxes recognized in financial statements in accordance with SFAS No. 109,Accounting for Income Taxes, and prescribes a recognition threshold and measurement attribute of tax positions taken or expected to be taken on a tax return.
We were subject to the provisions of FIN No. 48 as of January 1, 2007, and we have analyzed our various federal and state filing positions, including the assertion that we are not taxable. No amounts were recorded for unrecognized tax benefits or related interest expense and penalties as a result of the implementation of FIN No. 48 as of December 31, 2007. All years of our operations remain open for examination.
| 17. | COMMITMENTS AND CONTINGENCIES |
We and our Operating Partnership are not presently involved in any material litigation nor, to our knowledge, is any material litigation threatened against us or our investments. We and our investments are, from time to time, subject to routine litigation arising in the ordinary course of business. Management believes the costs, if any, incurred by our Operating Partnership and by us related to routine litigation will not materially affect our financial position, operating results or liquidity.
Environmental Matters
A majority of the properties we acquire are subjected to environmental reviews either by us or the previous owners. In addition, we may incur environmental remediation costs associated with certain land parcels we may acquire in connection with the development of the land. We have acquired certain properties in urban and industrial areas that may have been leased to or previously owned by commercial and industrial companies that discharged hazardous materials. We may purchase various environmental insurance policies to mitigate our exposure to environmental liabilities. We are not aware of any environmental liability that we believe would have a material adverse effect on our business, financial condition or results of operations.
| 18. | QUARTERLY FINANCIAL DATA (UNAUDITED) |
The following table presents selected unaudited quarterly financial data for each quarter during the years ended December 31, 2008 and 2007 (amounts in thousands, except per share information).
| | | | | | | | | | | | | | | | | | | | |
| | | For the Quarter Ended | | | For the
Year Ended | |
| | | March 31,
2008 | | | June 30,
2008 | | | September 30,
2008 | | | December 31,
2008 | | | December 31,
2008 | |
Rental revenue | | $ | 28,212 | | | $ | 27,014 | | | $ | 27,475 | | | $ | 31,969 | | | $ | 114,670 | |
Securities income | | | 4,582 | | | | 4,040 | | | | 4,137 | | | | 4,808 | | | | 17,567 | |
Debt related income | | | 2,394 | | | | 2,592 | | | | 2,453 | | | | 1,937 | | | | 9,376 | |
| | | | | | | | | | | | | | | | | | | | |
Total revenue | | | 35,188 | | | | 33,646 | | | | 34,065 | | | | 38,714 | | | | 141,613 | |
Total operating expenses | | | (23,540 | ) | | | (23,964 | ) | | | (23,728 | ) | | | (26,534 | ) | | | (97,766 | ) |
Other income (expense) | | | (34,211 | ) | | | (45,784 | ) | | | (19,814 | ) | | | (120,659 | ) | | | (220,468 | ) |
Net income (loss) from continuing operations | | | (22,563 | ) | | | (36,102 | ) | | | (9,477 | ) | | | (108,479 | ) | | | (176,621 | ) |
Net income (loss) from discontinued operations | | | — | | | | — | | | | 10 | | | | 225 | | | | 235 | |
| | | | | | | | | | | | | | | | | | | | |
Net income (loss) | | $ | (22,563 | ) | | $ | (36,102 | ) | | $ | (9,467 | ) | | $ | (108,254 | ) | | $ | (176,386 | ) |
| | | | | | | | | | | | | | | | | | | | |
Net income (loss) from continuing operations per common share - diluted | | $ | (0.19 | ) | | $ | (0.27 | ) | | $ | 0.06 | | | $ | (0.86 | ) | | $ | (1.26 | ) |
Net income from discontinued operations per common share - diluted | | | — | | | | — | | | | — | | | | — | | | | — | |
| | | | | | | | | | | | | | | | | | | | |
Net income (loss) per common share - diluted | | $ | (0.19 | ) | | $ | (0.27 | ) | | $ | 0.06 | | | $ | (0.86 | ) | | $ | (1.26 | ) |
| | | | | | | | | | | | | | | | | | | | |
F-38
| | | | | | | | | | | | | | | | | | | | |
| | | For the Quarter Ended | | | For the
Year Ended
December 31,
2007 | |
| | | March 31, | | | June 30, | | | September 30, | | | December 31, | | |
| | | 2007 | | | 2007 | | | 2007 | | | 2007 | | |
Rental revenue | | $ | 7,746 | | | $ | 13,661 | | | $ | 22,643 | | | $ | 26,374 | | | $ | 70,424 | |
Securities income | | | 1,873 | | | | 3,990 | | | | 4,936 | | | | 4,892 | | | | 15,691 | |
Debt related income | | | 1,259 | | | | 2,625 | | | | 2,569 | | | | 2,498 | | | | 8,951 | |
| | | | | | | | | | | | | | | | | | | | |
Total revenue | | | 10,878 | | | | 20,276 | | | | 30,148 | | | | 33,764 | | | | 95,066 | |
Total operating expenses | | | (7,536 | ) | | | (12,918 | ) | | | (19,557 | ) | | | (22,628 | ) | | | (62,639 | ) |
Other income (expense) | | | (357 | ) | | | (2,703 | ) | | | (8,272 | ) | | | (10,030 | ) | | | (21,362 | ) |
Net income from continuing operations | | | 2,985 | | | | 4,655 | | | | 2,319 | | | | 1,106 | | | | 11,065 | |
Net income from discontinued operations | | | — | | | | — | | | | — | | | | — | | | | — | |
| | | | | | | | | | | | | | | | | | | | |
Net income | | $ | 2,985 | | | $ | 4,655 | | | $ | 2,319 | | | $ | 1,106 | | | $ | 11,065 | |
| | | | | | | | | | | | | | | | | | | | |
Net income per common share - diluted | | $ | 0.06 | | | $ | 0.06 | | | $ | 0.02 | | | $ | 0.01 | | | $ | 0.13 | |
Net income from discontinued operations per common share - diluted | | | — | | | | — | | | | — | | | | — | | | | — | |
| | | | | | | | | | | | | | | | | | | | |
Net income per common share - diluted | | $ | 0.06 | | | $ | 0.06 | | | $ | 0.02 | | | $ | 0.01 | | | $ | 0.13 | |
| | | | | | | | | | | | | | | | | | | | |
The following discussion represents significant events related to our business activity for the period from January 1, 2009 through March 30, 2009.
Acquisition of Connecticut Avenue Office Center
On March 10, 2009, we acquired an office property located in the Washington, DC market (the “Connecticut Avenue Office Center”) from a third-party seller. We acquired the Connecticut Avenue Office Center using proceeds from our public and private offerings. Additionally, we subsequently financed the Connecticut Avenue Office Center as described in more detail below. The total estimated investment amount for the Connecticut Avenue Office Center is approximately $63.6 million. The Connecticut Avenue Office Center consists of approximately 126,000 net rentable square feet that is currently approximately 98% occupied. The Connecticut Avenue Office Center is subject to leases with twelve tenants with lease expiration dates ranging from 2010 through 2019.
The debt financing of the Connecticut Avenue Office Center consists of a fixed-rate, amortizing mortgage note with an outstanding principal balance of approximately $36.5 million that bears interest at 7.25%. The loan has an expected term of seven years and amortizes over a 30 year life. The loan is recourse to us.
As discussed further below, we adopted SFAS No. 141 (revised 2007), Business Combinations (“SFAS No. 141(R)”) on January 1, 2009. Pursuant to SFAS No. 141(R), certain transaction costs that have historically been capitalized as part of our basis in the property will be expensed as incurred. Such acquisition costs include legal, closing and due diligence costs and acquisition fees payable to our Advisor. As a result, we expect to incur acquisition-related expenses of approximately $1.2 million related to the acquisition of the Connecticut Avenue Office Center. These expenses are comprised of estimated legal, closing and due diligence costs of approximately $566,000 and an estimated acquisition fee payable to our Advisor of approximately $636,000.
Probable Acquisition of Greater DC Retail Center
On January 12, 2009, we entered into a purchase and sale agreement with a third-party seller in connection with the intended acquisition of a retail property located in the Washington, DC market (the “Greater DC Retail Center”). On February 27, 2009, our deposit of approximately $1.3 million, which had been placed in escrow in connection with the intended acquisition of the Greater DC Retail Center, became non-refundable subject to certain terms and conditions of the purchase and sale agreement. We expect to acquire the Greater DC Retail Center in April of 2009. We intend to use proceeds from our public and private offerings and the assumption of a mortgage loan to finance the acquisition of the Greater DC Retail Center. The Greater DC Retail Center consists of approximately 233,000 net rentable square feet that is currently 100% occupied. The Greater DC Retail Center is subject to leases with seven tenants with lease expirations dates ranging from 2010 through 2018.
The mortgage note that we expect to assume in connection with our acquisition of the Greater DC Retail Center has an outstanding principal balance of approximately $42.0 million and is an interest only loan until July 2009, at which point it begins to amortize over a 30-year life. This loan matures in July 2014, subject to a one-year extension option, and bears interest at a stated fixed interest rate of 4.82%.
F-39
We expect the total estimated investment amount for the Greater DC Retail Center to be approximately $65.5 million. In addition, we expect to incur acquisition-related expenses of approximately $1.2 million. These expenses are comprised of estimated legal, closing and due diligence costs of approximately $542,000 and an estimated acquisition fee payable to our Advisor of approximately $655,000.
Proceeds from Public Offering
For the period from January 1, 2009 to March 23, 2009, we issued approximately 6.7 million shares of our common stock pursuant to our follow-on public offering to a total of approximately 700 stockholders for net proceeds of approximately $65.0 million, which includes proceeds from our distribution reinvestment plan of approximately $13.0 million.
Redemptions of Common Stock
Under our share redemption program, we presently limit the number of shares to be redeemed during any consecutive twelve month period to no more than five percent of the number of shares of common stock outstanding at the beginning of such twelve month period (the “Redemption Cap”). The Redemption Cap applicable to redemption requests in the first quarter of 2009 is approximately 853,000 shares of common stock (the “First Quarter Redemption Cap”). As of March 16, 2009 (the “Deadline”), the last day for first quarter 2009 redemption requests to be submitted under our share redemption program, we had received requests to redeem approximately 6.1 million shares of common stock (the “Total First Quarter Redemption Requests”). Based on application of the First Quarter Redemption Cap, we expect that requesting stockholders whose requests were received on or before the Deadline will be redeemed pro rata. As a result, we expect to redeem approximately 13.9% (the “Pro Rata Percentage”) of the shares that each shareholder requested to be redeemed on or before the Deadline subject to the terms and conditions of our share redemption program.
The Total First Quarter Redemption Requests and Pro Rata Percentage are preliminary figures that are subject to change. Under our share redemption program, redemption requests may be withdrawn at any time up to three business days prior to the end of the applicable quarter.
Cash Settlement of Derivative Instrument
On January 28, 2009, we cash settled one of our outstanding forward starting swaps with a notional value of $50 million by paying approximately $12.7 million.
F-40
Report of Independent Registered Public Accounting Firm
The Board of Directors and Stockholders
Dividend Capital Total Realty Trust Inc.:
Under date of March 27, 2009, we reported on the consolidated balance sheets of Dividend Capital Total Realty Trust Inc. (the Company) and subsidiaries as of December 31, 2008 and 2007, and the related consolidated statements of operations, stockholders’ equity, and cash flows for each of the years in the three-year period ended December 31, 2008. In connection with our audits of the aforementioned consolidated financial statements, we also audited the related consolidated financial statement schedule, Schedule III—Real Estate and Accumulated Depreciation (Schedule III). Schedule III is the responsibility of the Company’s management. Our responsibility is to express an opinion on Schedule III based on our audits.
In our opinion, Schedule III—Real Estate and Accumulated Depreciation, when considered in relation to the basic consolidated financial statements taken as a whole, presents fairly, in all material respects, the information set forth therein.
Denver, Colorado
March 27, 2009
F-41
SCHEDULE III—REAL ESTATE AND ACCUMULATED DEPRECIATION
December 31, 2008
(Dollars in thousands)
| | | | | | | | | | | | | | | | | | | | | | | | | | | | | | | | | | | | | |
| | | | | | | | | Initial Cost to Company | | Cost
Capitalized
or
Adjustments
Subsequent
to
Acquisition | | | Gross Amount Carried at
December 31, 2008 | | | | | | | |
Property | | Market | | No. of
Buildings | | Mortgage
Notes | | Land | | Building and
Improvements
(1) | | Total
Costs | | | Land | | Building and
Improvements
(1) | | Total
Costs
(2, 3) | | Accumulated
Depreciation
(3) | | | Acquisition
Date | | Depreciable
life (years) |
Office and Office/R&D Properties | | | | | | | | | | | | | | | | | | | | | | | | | | | | | | |
Jay Street | | Silicon Valley, CA | | 3 | | $ | 23,500 | | $ | 13,859 | | $ | 22,124 | | $ | 35,983 | | $ | 1,001 | | | $ | 13,859 | | $ | 23,125 | | $ | 36,984 | | $ | (3,838 | ) | | 6/28/06 | | 2-40 |
Bala Pointe | | Philadelphia, PA | | 1 | | | 24,000 | | | 10,115 | | | 27,518 | | | 37,633 | | | (87 | ) | | | 10,115 | | | 27,431 | | | 37,546 | | | (4,553 | ) | | 8/28/06 | | 1-40 |
Lundy Avenue | | Silicon Valley, CA | | 3 | | | 14,250 | | | 5,982 | | | 15,459 | | | 21,441 | | | 114 | | | | 5,982 | | | 15,573 | | | 21,555 | | | (1,480 | ) | | 9/28/06 | | 10-40 |
Shiloh Road | | Dallas, TX | | 3 | | | 22,700 | | | 5,165 | | | 30,192 | | | 35,357 | | | 5 | | | | 5,165 | | | 30,197 | | | 35,362 | | | (2,397 | ) | | 12/21/06 | | 10-40 |
40 Boulevard | | Chicago, IL | | 1 | | | 9,700 | | | 2,611 | | | 7,797 | | | 10,408 | | | 4,441 | | | | 2,611 | | | 12,238 | | | 14,849 | | | (2,412 | ) | | 1/24/07 | | 1-40 |
Washington Commons | | Chicago, IL | | 10 | | | 21,300 | | | 9,019 | | | 16,639 | | | 25,658 | | | 1,366 | | | | 9,019 | | | 18,005 | | | 27,024 | | | (4,079 | ) | | 2/1/07 | | 1-40 |
Shackleford | | Little Rock, AR | | 1 | | | 13,650 | | | 2,900 | | | 18,792 | | | 21,692 | | | 28 | | | | 2,900 | | | 18,820 | | | 21,720 | | | (1,154 | ) | | 3/20/07 | | 14-40 |
Fortune Concourse | | Silicon Valley, CA | | 5 | | | 41,890 | | | 16,380 | | | 31,936 | | | 48,316 | | | 9,482 | | | | 16,380 | | | 41,418 | | | 57,798 | | | (6,259 | ) | | 5/17/07 | | 1-40 |
California Circle | | Silicon Valley, CA | | 2 | | | 7,285 | | | 3,659 | | | 10,778 | | | 14,437 | | | 85 | | | | 3,659 | | | 10,863 | | | 14,522 | | | (2,216 | ) | | 7/10/07 | | 3-40 |
Joyce Blvd | | Little Rock, AR | | 1 | | | — | | | 2,699 | | | 8,996 | | | 11,695 | | | — | | | | 2,699 | | | 8,996 | | | 11,695 | | | (438 | ) | | 9/28/07 | | 10-40 |
DeGuigne | | Silicon Valley, CA | | 1 | | | 9,568 | | | 5,841 | | | 13,861 | | | 19,702 | | | 50 | | | | 5,841 | | | 13,911 | | | 19,752 | | | (1,381 | ) | | 11/21/07 | | 3-40 |
Millennium | | Denver, CO | | 1 | | | 33,760 | | | 1,002 | | | 51,565 | | | 52,567 | | | (0 | ) | | | 1,002 | | | 51,565 | | | 52,567 | | | (652 | ) | | 10/1/08 | | 4-40 |
Eden Prairie (ATK) | | Minneapolis/St Paul, MN | | 1 | | | 15,100 | | | 3,538 | | | 25,892 | | | 29,430 | | | — | | | | 3,538 | | | 25,892 | | | 29,430 | | | (234 | ) | | 10/3/08 | | 14-40 |
Austin-Mueller Healthcare | | Austin, Tx | | 1 | | | 22,700 | | | 2,663 | | | 42,311 | | | 44,974 | | | — | | | | 2,663 | | | 42,311 | | | 44,974 | | | — | | | 12/23/08 | | 11-40 |
| | | | | | | | | | | | | | | | | | | | | | | | | | | | | | | | | | | | | |
Total Office and Office/R&D Properties | | 34 | | $ | 259,403 | | $ | 85,433 | | $ | 323,860 | | $ | 409,293 | | $ | 16,485 | | | $ | 85,433 | | $ | 340,345 | | $ | 425,778 | | $ | (31,093 | ) | | | | |
Industrial Properties | | | | | | | | | | | | | | | | | | | | | | | | | | | | | | |
Rickenbacker | | Columbus, OH | | 1 | | $ | 7,466 | | $ | 1,248 | | $ | 13,308 | | $ | 14,556 | | $ | 512 | | | $ | 1,248 | | $ | 13,820 | | $ | 15,068 | | $ | (1,850 | ) | | 10/16/06 | | 3-40 |
Park West Q | | Cincinnati, OH | | 1 | | | 5,566 | | | 1,653 | | | 9,597 | | | 11,250 | | | — | | | | 1,653 | | | 9,597 | | | 11,250 | | | (1,189 | ) | | 10/16/06 | | 6-40 |
Eagle Creek East | | Minneapolis/St Paul, MN | | 1 | | | 4,633 | | | 1,644 | | | 7,511 | | | 9,155 | | | 39 | | | | 1,644 | | | 7,550 | | | 9,194 | | | (899 | ) | | 10/16/06 | | 5-40 |
Minnesota Valley III | | Minneapolis/St Paul, MN | | 1 | | | 6,566 | | | 2,223 | | | 12,462 | | | 14,685 | | | 8 | | | | 2,223 | | | 12,470 | | | 14,693 | | | (1,341 | ) | | 10/31/06 | | 5-40 |
Park West L | | Cincinnati, OH | | 1 | | | 3,866 | | | 902 | | | 7,393 | | | 8,295 | | | 1 | | | | 902 | | | 7,394 | | | 8,296 | | | (864 | ) | | 10/31/06 | | 4-40 |
Eagle Creek West | | Minneapolis/St Paul, MN | | 1 | | | 5,249 | | | 1,910 | | | 8,272 | | | 10,182 | | | 203 | | | | 1,910 | | | 8,475 | | | 10,385 | | | (908 | ) | | 10/31/06 | | 2-40 |
Pencader | | Philadelphia, PA | | 1 | | | 6,050 | | | 2,516 | | | 5,392 | | | 7,908 | | | 82 | | | | 2,516 | | | 5,474 | | | 7,990 | | | (570 | ) | | 12/6/06 | | 2-40 |
Hanson Way Dist. Ctr | | Silicon Valley, CA | | 1 | | | 19,150 | | | 5,544 | | | 19,872 | | | 25,416 | | | — | | | | 5,544 | | | 19,872 | | | 25,416 | | | (1,997 | ) | | 12/7/06 | | 6-40 |
Marine Drive | | Charlotte, NC | | 1 | | | 14,800 | | | 2,037 | | | 19,011 | | | 21,048 | | | 72 | | | | 2,037 | | | 19,083 | | | 21,120 | | | (2,070 | ) | | 12/8/06 | | 10-40 |
Old Silver Spring | | Philadelphia, PA | | 1 | | | 4,700 | | | 1,305 | | | 4,840 | | | 6,145 | | | 5 | | | | 1,305 | | | 4,845 | | | 6,150 | | | (538 | ) | | 12/8/06 | | 2-40 |
Southfield | | Atlanta, GA | | 1 | | | 5,280 | | | 1,280 | | | 5,411 | | | 6,691 | | | (0 | ) | | | 1,280 | | | 5,411 | | | 6,691 | | | (553 | ) | | 3/20/07 | | 3-40 |
Veterans | | Chicago, IL | | 1 | | | 9,200 | | | 2,121 | | | 10,987 | | | 13,108 | | | 36 | | | | 2,121 | | | 11,023 | | | 13,144 | | | (1,031 | ) | | 3/26/07 | | 5-40 |
Commerce Center | | Central PA | | 1 | | | 25,820 | | | 5,939 | | | 28,970 | | | 34,909 | | | — | | | | 5,939 | | | 28,970 | | | 34,909 | | | (2,246 | ) | | 3/26/07 | | 4-40 |
Patriot Drive I | | Dallas, TX | | 1 | | | 4,625 | | | 1,034 | | | 5,548 | | | 6,582 | | | 146 | | | | 1,034 | | | 5,694 | | | 6,728 | | | (778 | ) | | 3/28/07 | | 1-40 |
Patriot Drive II | | Dallas, TX | | 1 | | | 18,375 | | | 3,166 | | | 23,072 | | | 26,238 | | | 84 | | | | 3,166 | | | 23,156 | | | 26,322 | | | (2,430 | ) | | 3/28/07 | | 1-40 |
Plainfield III | | Indianapolis, IN | | 1 | | | 12,000 | | | 2,101 | | | 18,424 | | | 20,525 | | | 1,113 | | | | 2,101 | | | 19,537 | | | 21,638 | | | (1,887 | ) | | 3/28/07 | | 2-40 |
Logistics Boulevard | | Cincinnati, OH | | 1 | | | 16,042 | | | 2,725 | | | 28,878 | | | 31,603 | | | (0 | ) | | | 2,725 | | | 28,878 | | | 31,603 | | | (1,967 | ) | | 6/15/07 | | 9-40 |
Creekside V | | Columbus, OH | | 1 | | | 4,725 | | | 764 | | | 5,628 | | | 6,392 | | | (0 | ) | | | 764 | | | 5,628 | | | 6,392 | | | (468 | ) | | 6/15/07 | | 8-40 |
Midpoint Drive | | Kansas City, KS | | 1 | | | 5,366 | | | 1,176 | | | 9,038 | | | 10,214 | | | 57 | | | | 1,176 | | | 9,095 | | | 10,271 | | | (727 | ) | | 6/15/07 | | 3-40 |
Greenwood Parkway | | Atlanta, GA | | 1 | | | — | | | 2,040 | | | 20,829 | | | 22,869 | | | 76 | | | | 2,040 | | | 20,905 | | | 22,945 | | | (1,143 | ) | | 10/29/07 | | 10-40 |
Westport | | Central PA | | 1 | | | 10,750 | | | 2,376 | | | 27,081 | | | 29,457 | | | 0 | | | | 2,376 | | | 27,081 | | | 29,457 | | | (1,263 | ) | | 1/9/08 | | 3-40 |
6900 Riverport | | Louisville, KY | | 1 | | | — | | | 751 | | | 4,137 | | | 4,888 | | | 0 | | | | 751 | | | 4,137 | | | 4,888 | | | (58 | ) | | 9/17/08 | | 1-40 |
7000 Riverport | | Louisville, KY | | 1 | | | — | | | 1,124 | | | 6,830 | | | 7,954 | | | 0 | | | | 1,124 | | | 6,830 | | | 7,954 | | | (111 | ) | | 9/17/08 | | 1-40 |
7050 Riverport | | Louisville, KY | | 1 | | | — | | | 672 | | | 3,867 | | | 4,539 | | | (0 | ) | | | 672 | | | 3,867 | | | 4,539 | | | (60 | ) | | 9/17/08 | | 5-40 |
7100 Riverport | | Louisville, KY | | 1 | | | — | | | 758 | | | 5,338 | | | 6,096 | | | 0 | | | | 758 | | | 5,338 | | | 6,096 | | | (76 | ) | | 9/17/08 | | 7-40 |
7201 Riverport | | Louisville, KY | | 1 | | | — | | | 1,130 | | | 6,623 | | | 7,753 | | | (0 | ) | | | 1,130 | | | 6,623 | | | 7,753 | | | (84 | ) | | 9/17/08 | | 3-40 |
| | | | | | | | | | | | | | | | | | | | | | | | | | | | | | | | | | | | | |
Total Industrial Properties | | 26 | | $ | 190,229 | | $ | 50,139 | | $ | 318,319 | | $ | 368,458 | | $ | 2,434 | | | $ | 50,139 | | $ | 320,753 | | $ | 370,892 | | $ | (27,108 | ) | | | | |
F-42
| | | | | | | | | | | | | | | | | | | | | | | | | | | | | | | | | | | | | |
| | | | | | | | | | | | | | | Cost
Capitalized or
Adjustments
Subsequent
to Acquisition | | | | | | | | | | | | | | |
| | | | | | | | | Initial Cost to Company | | | Gross Amount Carried at December 31, 2008 | | | | | | | |
Property | | Market | | No. of
Buildings | | Mortgage
Notes | | Land | | Building and
Improvements
(1) | | Total
Costs | | | Land | | Building and
Improvements
(1) | | Total Costs
(2, 3) | | Accumulated
Depreciation
(3) | | | Acquisition
Date | | Depreciable
life (years) |
Retail Properties | | | | | | | | | | | | | | | | | | | | | | | | | | | | | | | | | | | | | |
Bandera Road | | San Antonio, TX | | 1 | | $ | 21,500 | | $ | 8,220 | | $ | 23,392 | | $ | 31,612 | | $ | 162 | | | $ | 8,220 | | $ | 23,554 | | $ | 31,774 | | $ | (1,785 | ) | | 2/1/07 | | 1-40 |
Beaver Creek | | Raleigh, NC | | 1 | | | 26,200 | | | 13,017 | | | 31,375 | | | 44,392 | | | 115 | | | | 13,017 | | | 31,490 | | | 44,507 | | | (1,987 | ) | | 5/11/07 | | 1-40 |
Centerton Square | | Philadelphia, PA | | 1 | | | 67,800 | | | 26,488 | | | 76,813 | | | 103,301 | | | (1 | ) | | | 26,488 | | | 76,812 | | | 103,300 | | | (5,259 | ) | | 5/11/07 | | 2-40 |
Mt. Nebo | | Pittsburgh, PA | | 1 | | | 16,000 | | | 9,371 | | | 16,288 | | | 25,659 | | | (1,089 | ) | | | 9,371 | | | 15,199 | | | 24,570 | | | 87 | | | 5/11/07 | | 2-40 |
CB Square | | Jacksonville, FL | | 1 | | | — | | | 3,768 | | | 16,660 | | | 20,428 | | | (983 | ) | | | 3,768 | | | 15,677 | | | 19,445 | | | (747 | ) | | 6/27/07 | | 2-40 |
Braintree | | New England | | 1 | | | — | | | 9,270 | | | 31,266 | | | 40,536 | | | (213 | ) | | | 9,270 | | | 31,053 | | | 40,323 | | | (2,926 | ) | | 8/1/07 | | 2-40 |
Holbrook | | New England | | 1 | | | — | | | 4,590 | | | 13,931 | | | 18,521 | | | 0 | | | | 4,590 | | | 13,931 | | | 18,521 | | | (934 | ) | | 8/1/07 | | 1-40 |
Kingston | | New England | | 1 | | | 10,575 | | | 8,580 | | | 12,600 | | | 21,180 | | | 174 | | | | 8,580 | | | 12,774 | | | 21,354 | | | (1,361 | ) | | 8/1/07 | | 1-40 |
Manomet | | New England | | 1 | | | — | | | 1,890 | | | 6,480 | | | 8,370 | | | 30 | | | | 1,890 | | | 6,510 | | | 8,400 | | | (601 | ) | | 8/1/07 | | 2-40 |
Orleans | | New England | | 1 | | | 15,110 | | | 8,780 | | | 23,683 | | | 32,463 | | | — | | | | 8,780 | | | 23,683 | | | 32,463 | | | (1,307 | ) | | 8/1/07 | | 1-40 |
Sandwich | | New England | | 1 | | | 15,825 | | | 7,380 | | | 25,778 | | | 33,158 | | | (0 | ) | | | 7,380 | | | 25,778 | | | 33,158 | | | (1,317 | ) | | 8/1/07 | | 1-40 |
Wareham | | New England | | 1 | | | 24,400 | | | 13,130 | | | 27,107 | | | 40,237 | | | 85 | | | | 13,130 | | | 27,192 | | | 40,322 | | | (1,862 | ) | | 8/1/07 | | 1-40 |
Whitman 682 Bedford | | New England | | 1 | | | — | | | 1,830 | | | 4,443 | | | 6,273 | | | 8 | | | | 1,830 | | | 4,451 | | | 6,281 | | | (367 | ) | | 8/1/07 | | 2-40 |
Abington | | New England | | 1 | | | 5,125 | | | 14,396 | | | 594 | | | 14,990 | | | — | | | | 14,396 | | | 594 | | | 14,990 | | | (110 | ) | | 8/1/07 | | 8-40 |
Hyannis | | New England | | 1 | | | 5,075 | | | 10,405 | | | 917 | | | 11,322 | | | 0 | | | | 10,405 | | | 917 | | | 11,322 | | | (71 | ) | | 8/1/07 | | 18-40 |
Rockland 201 Market | | New England | | 1 | | | — | | | 2,417 | | | 86 | | | 2,503 | | | 0 | | | | 2,417 | | | 86 | | | 2,503 | | | (27 | ) | | 8/1/07 | | 4-40 |
Mansfield | | New England | | 1 | | | 9,558 | | | 5,340 | | | 16,490 | | | 21,830 | | | — | | | | 5,340 | | | 16,490 | | | 21,830 | | | (717 | ) | | 8/1/07 | | 15-40 |
Meriden | | New England | | 1 | | | 13,232 | | | 6,560 | | | 22,013 | | | 28,573 | | | — | | | | 6,560 | | | 22,013 | | | 28,573 | | | (1,009 | ) | | 8/1/07 | | 12-40 |
Weymouth | | New England | | 1 | | | — | | | 5,170 | | | 19,396 | | | 24,566 | | | — | | | | 5,170 | | | 19,396 | | | 24,566 | | | (1,354 | ) | | 8/1/07 | | 4-40 |
Whitman 475 Bedford Street | | New England | | 1 | | | 8,049 | | | 3,610 | | | 11,682 | | | 15,292 | | | — | | | | 3,610 | | | 11,682 | | | 15,292 | | | (525 | ) | | 8/1/07 | | 16-40 |
Brockton Eastway Plaza | | New England | | 1 | | | — | | | 2,530 | | | 2,073 | | | 4,603 | | | 68 | | | | 2,530 | | | 2,141 | | | 4,671 | | | (361 | ) | | 8/1/07 | | 1-40 |
Cohasset | | New England | | 1 | | | — | | | 3,920 | | | 7,765 | | | 11,685 | | | 8 | | | | 3,920 | | | 7,773 | | | 11,693 | | | (695 | ) | | 8/1/07 | | 1-40 |
Cranston | | New England | | 1 | | | — | | | 1,810 | | | 4,233 | | | 6,043 | | | (20 | ) | | | 1,810 | | | 4,213 | | | 6,023 | | | (1,121 | ) | | 8/1/07 | | 1-40 |
Hanover | | New England | | 1 | | | — | | | 1,490 | | | 5,093 | | | 6,583 | | | (25 | ) | | | 1,490 | | | 5,068 | | | 6,558 | | | (556 | ) | | 8/1/07 | | 1-40 |
Rockland 360-372 Market | | New England | | 1 | | | — | | | 1,200 | | | 2,437 | | | 3,637 | | | (0 | ) | | | 1,200 | | | 2,437 | | | 3,637 | | | (282 | ) | | 8/1/07 | | 2-40 |
Brockton Westgate Plaza | | New England | | 1 | | | — | | | 3,650 | | | 6,507 | | | 10,157 | | | — | | | | 3,650 | | | 6,507 | | | 10,157 | | | (1,009 | ) | | 8/1/07 | | 2-40 |
North Hanover | | New England | | 1 | | | — | | | 1,380 | | | 2,364 | | | 3,744 | | | — | | | | 1,380 | | | 2,364 | | | 3,744 | | | (113 | ) | | 8/1/07 | | 1-40 |
Harwich | | New England | | 1 | | | 6,965 | | | 5,290 | | | 8,814 | | | 14,104 | | | — | | | | 5,290 | | | 8,814 | | | 14,104 | | | (321 | ) | | 10/18/07 | | 21-40 |
New Bedford | | New England | | 1 | | | 9,506 | | | 3,790 | | | 11,152 | | | 14,942 | | | — | | | | 3,790 | | | 11,152 | | | 14,942 | | | (389 | ) | | 10/18/07 | | 22-40 |
Norwell | | New England | | 1 | | | 8,069 | | | 5,850 | | | 14,547 | | | 20,397 | | | — | | | | 5,850 | | | 14,547 | | | 20,397 | | | (543 | ) | | 10/18/07 | | 15-40 |
New Orleans Restaurant | | New Orleans, LA | | 1 | | | 2,286 | | | 630 | | | 2,853 | | | 3,483 | | | — | | | | 630 | | | 2,853 | | | 3,483 | | | (18 | ) | | 9/17/08 | | 40 |
Columbus Restaurant | | Columbus, OH | | 1 | | | 2,094 | | | 1,100 | | | 2,112 | | | 3,212 | | | — | | | | 1,100 | | | 2,112 | | | 3,212 | | | (13 | ) | | 9/17/08 | | 40 |
Tampa Bay Restaurant | | Tampa Bay, FL | | 1 | | | 2,018 | | | 1,880 | | | 1,098 | | | 2,978 | | | — | | | | 1,880 | | | 1,098 | | | 2,978 | | | (7 | ) | | 9/17/08 | | 40 |
| | | | | | | | | | | | | | | | | | | | | | | | | | | | | | | | | | | | | |
Total Retail Properties | | | | 33 | | $ | 269,387 | | $ | 198,732 | | $ | 452,042 | | $ | 650,774 | | $ | (1,681 | ) | | $ | 198,732 | | $ | 450,361 | | $ | 649,093 | | $ | (29,607 | ) | | | | |
| | | | | | | | | | | | | | | | | | | | | | | | | | | | | | | | | | | | | |
Total | | | | 93 | | $ | 719,019 | | $ | 334,304 | | $ | 1,094,221 | | $ | 1,428,525 | | $ | 17,238 | | | $ | 334,304 | | $ | 1,111,459 | | $ | 1,445,763 | | $ | (87,808 | ) | | | | |
| | | | | | | | | | | | | | | | | | | | | | | | | | | | | | | | | | | | | |
| (1) | Building and improvements include intangible lease assets. |
| (2) | As of December 31, 2008, the aggregate cost for federal income tax purposes of investments in real property was approximately $1.2 billion. |
F-43
| (3) | A summary of activity for real estate and accumulated depreciation for the years ended December 31, 2008, 2007 and 2006: |
| | | | | | | | | |
| | | 2008 | | 2007 | | 2006 |
Investment in real estate: | | | | | | | | | |
Balance at beginning of year | | $ | 1,215,291 | | $ | 259,222 | | $ | — |
Additions through cash expenditures | | | 222,831 | | | 951,021 | | | 259,146 |
Improvements | | | 7,641 | | | 5,048 | | | 76 |
| | | | | | | | | |
Balance at end of year | | $ | 1,445,763 | | $ | 1,215,291 | | $ | 259,222 |
| | | | | | | | | |
Accumulated depreciation: | | | | | | | | | |
Balance at beginning of year | | $ | 35,616 | | $ | 2,591 | | $ | — |
Additions charged to costs and expenses | | | 52,192 | | | 33,025 | | | 2,591 |
| | | | | | | | | |
Balance at end of year | | $ | 87,808 | | $ | 35,616 | | $ | 2,591 |
| | | | | | | | | |
F-44
SIGNATURES
Pursuant to the requirements of Section 13 or 15(d) of the Securities Exchange Act of 1934, the Registrant has duly caused this report to be signed on its behalf by the undersigned, thereunto duly authorized on March 30, 2008.
| | |
| DIVIDEND CAPITAL TOTAL REALTY TRUST INC. |
| |
| By: | | /s/ GUY M. ARNOLD |
| Name: | | Guy M. Arnold |
| Title: | | President |
Pursuant to the requirements of the Securities Exchange Act of 1934, this report has been signed below by the following persons on behalf of the Registrant and in the capacities indicated and on March 30, 2009.
| | |
Signature | | Title |
| |
| /s/ GUY M. ARNOLD | | |
| Guy M. Arnold | | President (principal executive officer) |
| |
| /s/ JOHN A. BLUMBERG | | |
| John A. Blumberg | | Chairman of the Board and Director |
| |
| /s/ CHARLES B. DUKE | | |
| Charles B. Duke | | Director |
| |
| /s/ DANIEL J. SULLIVAN | | |
| Daniel J. Sullivan | | Director |
| |
| /s/ JOHN E. BIALLAS | | Chief Financial Officer (principal financial officer and principal accounting officer) |
| John E. Biallas | | |
F-45