Exhibit 99.1

Dividend Capital Total Realty Trust Inc.
Third Quarter 2009 Financial and Operating Results
DENVER, CO – November 13, 2009: Dividend Capital Total Realty Trust Inc. (“TRT” or the “Company”) today announced additional financial and operating results for the three and nine months ended September 30, 2009 that are supplemental to its Report on Form 10-Q filed with the Securities and Exchange Commission (the “Commission”), on November 13, 2009. As of September 30, 2009, the Company had invested in a diversified portfolio of real property and real estate related investments including 76 operating properties across 26 geographic markets at a gross investment amount of approximately $1.8 billion. During the three months ended September 30, 2009, the Company originated a $65.0 million senior mortgage loan secured by two hotel properties located in the Houston, Texas market. In addition, on November 3, 2009, the Company acquired an office property located in the Princeton, New Jersey market that consists of approximately 167,000 net rentable square feet for a total estimated investment amount of approximately $51.1 million.
Earnings
For the three months ended September 30, 2009 and 2008, the Company reported net losses attributable to common stockholders of approximately $6.5 million and $9.5 million ($0.04 and $0.06 per diluted share), respectively. These results included the effects of the certain non-cash or non-recurring items resulting in a net decrease to earnings of approximately $6.4 million and $13.1 million ($0.03 and $0.09 per diluted share), respectively, specific to losses on derivative instruments and net other-than-temporary impairment charges.
For the nine months ended September 30, 2009 and 2008, the Company reported net losses attributable to common stockholders of approximately $25.2 million and $68.1 million ($0.15 and $0.51 per diluted share), respectively. These results included the effects of the certain non-cash or non-recurring items resulting in a net decrease to earnings of approximately $21.1 million and $78.6 million ($0.12 and $0.57 per diluted share), respectively, specific to losses on derivative instruments, net other-than-temporary impairment charges and a gain on the extinguishment of debt.
Funds from Operations
For the three months ended September 30, 2009 and 2008, the Company reported “Company-defined” funds from operations attributable to common shares-diluted (“FFO”) of approximately $13.9 million and $15.1 million ($0.08 and $0.10 per diluted share), respectively.
For the nine months ended September 30, 2009 and 2008, the Company reported FFO of approximately $33.0 million and $45.2 million ($0.19 and $0.33 per diluted share), respectively. These results included the effects of the certain non-cash or non-recurring items resulting in a net (decrease) increase to FFO of approximately $(8.0) million and $882,000 ($(0.05) and $0.01 per diluted share), respectively, specific to losses on derivative instruments and a gain on the extinguishment of debt.
Selected Operating Data
As of September 30, 2009, TRT had total gross investments of approximately $1.8 billion (before accumulated depreciation of approximately $131.8 million), which were generally diversified across major property sectors as follows:
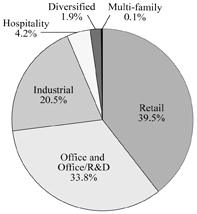
Total Gross Investments: Approximately $1.8 billion
Selected Financial Data
The following table presents selected consolidated financial information for TRT as of September 30, 2009 and December 31, 2008 and for the three and nine months ended September 30, 2009 and 2008. The selected financial information presented below has been derived from TRT’s consolidated financial statements. Since the information presented below is only a summary and does not provide all of the information contained in TRT’s historical consolidated financial statements, including the related notes thereto, you should read it in conjunction with “Management’s Discussion and Analysis of Financial Condition and Results of Operations” and TRT’s consolidated financial statements and notes thereto included in TRT’s Form 10-Q filed with the Commission on November 13, 2009. The amounts in the table are in thousands except per share data.
| For the Three Months Ended September 30, | For the Nine Months Ended September 30, | |||||||||||||||
| 2009 | 2008 | 2009 | 2008 | |||||||||||||
Operating Data: | ||||||||||||||||
Total revenue | $ | 40,547 | $ | 34,090 | $ | 118,961 | $ | 102,867 | ||||||||
Total operating expenses, excluding acquisition-related expenses | (28,284 | ) | (23,728 | ) | (83,994 | ) | (71,194 | ) | ||||||||
Equity in earnings of unconsolidated joint venture | 557 | 31 | 1,653 | 31 | ||||||||||||
Interest income | 497 | 3,303 | 2,599 | 9,212 | ||||||||||||
Interest expense | (14,673 | ) | (10,792 | ) | (41,859 | ) | (33,211 | ) | ||||||||
Acquisition-related expenses and other gains (losses) | 949 | — | (2,827 | ) | — | |||||||||||
Gain (loss) on derivatives | 16 | 471 | (7,997 | ) | (8,427 | ) | ||||||||||
Gain on extinguishment of debt | — | — | — | 9,309 | ||||||||||||
Net other-than-temporary impairment on securities | (6,385 | ) | (13,540 | ) | (13,063 | ) | (79,441 | ) | ||||||||
Net loss | (6,776 | ) | (10,165 | ) | (26,527 | ) | (70,854 | ) | ||||||||
Net loss attributable to noncontrolling interests | 326 | 699 | 1,376 | 2,724 | ||||||||||||
Net loss attributable to common stockholders | $ | (6,450 | ) | $ | (9,466 | ) | $ | (25,151 | ) | $ | (68,130 | ) | ||||
Common Stock Distributions | ||||||||||||||||
Common stock distributions declared | $ | 26,709 | $ | 22,076 | $ | 76,732 | $ | 60,313 | ||||||||
Common stock distributions declared per share | $ | 0.15 | $ | 0.15 | $ | 0.45 | $ | 0.45 | ||||||||
Per Share Data: | ||||||||||||||||
Net loss per common share: | ||||||||||||||||
Basic | $ | (0.04 | ) | $ | (0.06 | ) | $ | (0.15 | ) | $ | (0.51 | ) | ||||
Diluted | $ | (0.04 | ) | $ | (0.06 | ) | $ | (0.15 | ) | $ | (0.51 | ) | ||||
Other Information: | ||||||||||||||||
Weighted average number of common shares outstanding: | ||||||||||||||||
Basic | 178,062 | 147,180 | 170,559 | 134,075 | ||||||||||||
Diluted | 185,118 | 153,116 | 177,695 | 137,805 | ||||||||||||
| As of | ||||||||||||||||
| September 30, 2009 | December 31, 2008 | |||||||||||||||
Balance Sheet Data: | ||||||||||||||||
Total assets | $ | 2,380,356 | $ | 2,123,578 | ||||||||||||
Total debt obligations | $ | 820,617 | $ | 734,928 | ||||||||||||
Total liabilities | $ | 1,069,404 | $ | 963,712 | ||||||||||||
| For the Nine Months Ended September 30, | ||||||||||||||||
| 2009 | 2008 | |||||||||||||||
Cash Flow Data: | ||||||||||||||||
Net cash provided by operating activities | $ | 38,766 | $ | 49,179 | ||||||||||||
Net cash used in investing activities | $ | (158,416 | ) | $ | (75,769 | ) | ||||||||||
Net cash provided by financing activities | $ | 191,525 | $ | 276,202 | ||||||||||||
Funds from Operations (FFO)
The following table presents the calculation of TRT’s Company-defined FFO reconciled from net income (loss) for the three and nine months ended September 30, 2009 and 2008 (amounts in thousands, except per share information):
| For the Three Months Ended, September 30, | For the Nine Months Ended September 30, | |||||||||||||||
| 2009 | 2008 | 2009 | 2008 | |||||||||||||
Reconciliation of net earnings to FFO: | ||||||||||||||||
Net loss | $ | (6,776 | ) | $ | (10,165 | ) | $ | (26,527 | ) | $ | (70,854 | ) | ||||
Add (deduct) NAREIT defined adjustments: | ||||||||||||||||
Depreciation and amortization | 14,588 | 12,582 | 43,577 | 37,872 | ||||||||||||
Noncontrolling interests’ share of funds from operations | (919 | ) | (509 | ) | (2,524 | ) | (502 | ) | ||||||||
Subtotals-NAREIT defined FFO | 6,893 | 1,908 | 14,526 | (33,484 | ) | |||||||||||
Add (deduct) our defined adjustments: | ||||||||||||||||
Net other-than-temporary impairment on securities | 6,385 | 13,540 | 13,063 | 79,441 | ||||||||||||
Amortization of other-than-temporary impairment | 1,339 | (387 | ) | 1,972 | — | �� | ||||||||||
Acquisition-related expenses and other (gains) losses | (949 | ) | — | 2,827 | — | |||||||||||
Noncontrolling interest share of our defined adjustments | (258 | ) | (512 | ) | (706 | ) | (2,010 | ) | ||||||||
Company-defined FFO attributable to common shares-basic | 13,410 | 14,549 | 31,682 | 43,947 | ||||||||||||
Company-defined FFO attributable to dilutive OP units | 531 | 589 | 1,320 | 1,245 | ||||||||||||
Company-defined FFO attributable to common shares-diluted | $ | 13,941 | $ | 15,138 | $ | 33,002 | $ | 45,192 | ||||||||
FFO per share-basic | $ | 0.08 | $ | 0.10 | $ | 0.19 | $ | 0.33 | ||||||||
FFO per share-diluted | $ | 0.08 | $ | 0.10 | $ | 0.19 | $ | 0.33 | ||||||||
Weighted Average Number of Shares Outstanding | ||||||||||||||||
Basic | 178,062 | 147,180 | 170,559 | 134,075 | ||||||||||||
Diluted | 185,118 | 153,116 | 177,695 | 137,805 | ||||||||||||
FFO Definitions, Adjustments and Limitations
The Company believes that FFO, as defined by the National Association of Real Estate Investment Trusts (“NAREIT”), is a meaningful supplemental measure of the Company’s operating performance because historical cost accounting for real estate assets in accordance with Generally Accepted Accounting Principles (“GAAP”) implicitly assumes that the value of real estate assets diminishes predictably over time, as reflected through depreciation and amortization expense. However, since real estate values have historically risen or fallen with market and other conditions, many industry investors and analysts have considered presentation of operating results for real estate companies that use historical cost accounting to be insufficient. Thus, NAREIT created FFO as a supplemental measure of operating performance for real estate investment trusts that excludes historical cost depreciation and amortization, among other items, from net income, as defined by GAAP.
FFO as defined by NAREIT (“NAREIT-defined FFO”) consists of net income (loss), calculated in accordance with GAAP, plus real estate-related depreciation and amortization, less gains (or losses) from dispositions of real estate held for investment purposes. Importantly, as part of its guidance concerning FFO, NAREIT has stated that the “management of each of its member companies has the responsibility and authority to publish financial information that it regards as useful to the financial community.” As a result, modifications to NAREIT-defined FFO are common among REITs as companies seek to provide financial measures that meaningfully reflect the specific characteristics of their businesses. TRT believes that potential investors and stockholders who review its operating results are best served by a Company-defined FFO measure that makes certain adjustments to net income (loss) computed under GAAP in addition to those included in the NAREIT-defined FFO because TRT believes that such additional adjustments create a better measure of its operating performance.
TRT’s definition of Company-defined FFO is generally consistent with NAREIT-defined FFO. However, NAREIT-defined FFO does not specifically address how other-than-temporary impairment of available-for-sale preferred equity or debt securities should be treated in calculating FFO nor does it address how to account for acquisition-related costs, which were capitalized prior to January 1, 2009.
TRT currently has both the ability and the intention to hold all of its preferred equity and debt securities investments for the long term, although it may, from time to time, sell any of these investments as part of its overall management of the portfolio. TRT classifies these investments as available-for-sale, and therefore they are reported at estimated fair value in TRT’s financial statements prepared in accordance with GAAP. For purposes of calculating net income (loss) computed under GAAP for the three and nine months ended September 30, 2009 and
2008, due in part to the amount and duration of the decline in the fair value of these assets, TRT has classified in its statement of operations a portion of its preferred equity and debt securities investments as being impaired on an other-than-temporary basis.
Period to period fluctuations in the impairment line item can be caused by the accounting treatment for factors that may not be relevant to TRT’s long-term investment strategy, long-term capital structures or long-term tax planning. Accordingly, in addition to NAREIT-defined FFO, TRT believes that investors may also find it useful if FFO information that is made available to them excludes other-than-temporary impairment charges and related amortization adjustments, and therefore allows investors to align their analysis and evaluation of TRT’s operating results along the same lines that TRT’s management uses in planning and executing its business strategy. Therefore, Company-defined FFO adds back other-than-temporary impairment charges and related amortization adjustments. According to Staff Accounting Bulletin No. 59, the staff of the Commission does not believe that other-than-temporary-impairment should necessarily be interpreted to mean permanent impairment. In addition, the underlying accounting treatment is not the primary driver in management’s decision-making process and capital investment decisions for these types of investments.
Pursuant to Accounting Standards Codification Topic 805,Business Combinations (“ASC Topic 805”), beginning on January 1, 2009, expenses associated with the acquisition of real property, including acquisition fees paid to the Advisor and gains or losses related to the change in fair value of contingent consideration related to the acquisition of real property, are recorded to earnings for GAAP purposes. Prior to January 1, 2009, TRT capitalized costs associated with the acquisition of real property, including acquisition fees paid to the Advisor and changes in contingent consideration, and amortized those costs over the related life of the acquired assets. Additionally, as disclosed in the TRT’s prospectus, these types of expenditures are to be funded from the TRT’s net proceeds received from the sale of its common stock and not from the TRT’s operations as is implied by ASC Topic 805. Therefore, Company-defined FFO adds back acquisition-related expenses, gains and losses to provide a better reflection of its intended use of proceeds and the operating performance of its real properties, real estate securities and debt related investments. TRT believes that providing FFO information that adds back acquisition-related expenses, gains and losses promotes comparability to its historic presentation of FFO as well as comparability to other real estate companies that may have significantly different levels of acquisition-related activities compared to TRT. Further, these types of expenditures are not recurring in nature and therefore may distort a reader’s ability to develop an opinion about the future prospects of the Company’s performance.
FFO (both NAREIT-defined and Company-defined) is presented herein as a supplemental financial measure and has inherent limitations. TRT does not use FFO as, nor should it be considered to be, an alternative to net income (loss) computed under GAAP as an indicator of TRT’s operating performance, or as an alternative to cash from operating activities computed under GAAP, or as an indicator of the TRT’s ability to fund its short or long-term cash requirements. TRT uses FFO as an indication of its operating performance and as a guide to making decisions about future investments. TRT’s Company-defined FFO calculation is not meant to represent a comprehensive system of financial reporting and does not present, nor does TRT intend it to present, a complete picture of TRT’s financial condition and operating performance. In addition, other REITs may choose to treat impairment charges, acquisition-related expenses and potentially other accounting line items in a manner different from TRT due to specific differences in investment strategy or for other reasons. TRT’s Company-defined FFO calculation is limited by its exclusion of impairments related to their real estate securities, but TRT continuously evaluates its securities portfolio and the usefulness of the FFO measure in relation thereto. TRT believes that net income (loss) computed under GAAP remains the primary measure of performance and that FFO is only meaningful when it is used in conjunction with net income (loss) computed under GAAP. Further, TRT believes that its consolidated financial statements, prepared in accordance with GAAP, provide the most meaningful picture of its financial condition and operating performance.
Dividends on Common Stock
TRT’s Board of Directors has declared a quarterly cash dividend of $0.15 per common share for the quarter ended December 31, 2009. This dividend represents an annualized yield of 6.0% based on a $10.00 share price.
Earnings Conference Call
TRT also announced that it will be hosting a public conference call on Tuesday, November 17, 2009 to review the third quarter financial and operating results. John Blumberg, Chairman, Guy Arnold, President, and Kirk Scott, Chief Financial Officer, will present performance data and provide management commentary. The conference call will take place at 2:15 p.m. MST and can be accessed by dialing 800.213.4039 and referencing “Dividend Capital Passcode 633 485 00.”
Contact Information
Dividend Capital Total Realty Trust, Inc.
518 Seventeenth Street, 17th Floor
Denver, Colorado 80202
Telephone: (303) 228-2200
Attn: Guy M. Arnold, President
####
Certain items in this document may constitute forward-looking statements within the meaning of the Private Securities Litigation Reform Act of 1995. Words such as “expect(s),” “may,” “will,” “should,” “potentially,” “intend,” “seek,” “anticipate,” “estimate,” “believe,” and “could” and similar expressions are intended to identify such forward-looking statements. These statements are based on management’s current expectations and beliefs and are subject to a number of risks and uncertainties that could lead to actual results materially different from those described in the forward-looking statements. Dividend Capital Total Realty Trust Inc. can give no assurance that its expectations will be attained. Factors that could cause actual results to differ materially from Dividend Capital Total Realty Trust Inc.’s expectations include, but are not limited to, the uncertainty of the sources for funding Dividend Capital Total Realty Trust Inc.’s future capital needs, delays in the acquisition, development and construction of real properties, changes in economic conditions generally and the real estate and securities markets specifically and the other risks detailed from time to time in Dividend Capital Total Realty Trust’s SEC reports. Such forward-looking statements speak only as of the date of this press release. Dividend Capital Total Realty Trust Inc. expressly disclaims any obligation to release publicly any updates or revisions to any forward-looking statements contained herein to reflect any change in the Dividend Capital Total Realty Trust Inc.’s expectations with regard thereto or change in events, conditions or circumstances on which any statement is based.