Dividend Capital Diversified Property Fund Inc. 8-K
Exhibit 99.2


Table of Contents
CAUTIONARY NOTE REGARDING FORWARD LOOKING STATEMENTS
Statements included in this portfolio performance and review package that are not historical facts (including any statements concerning investment objectives, other plans and objectives of management for future operations or economic performance or assumptions or forecasts related thereto) are forward looking statements. These statements are only predictions. We caution that forward looking statements are not guarantees. Actual events or our investments and results of operations could differ materially from those expressed or implied in the forward looking statements. Forward looking statements are typically identified by the use of terms such as “may,” “will,” “should,” “expect,” “could,” “intend,” “plan,” “anticipate,” “estimate,” “believe,” “continue,” “predict,” “potential” or the negative of such terms and other comparable terminology.
The forward looking statements included herein are based upon our current expectations, plans, estimates, assumptions and beliefs that involve numerous risks and uncertainties. Assumptions relating to the foregoing involve judgments with respect to, among other things, future economic, competitive and market conditions and future business decisions, all of which are difficult or impossible to predict accurately and many of which are beyond our control. Although we believe that the expectations reflected in such forward looking statements are based on reasonable assumptions, our actual results and performance could differ materially from those set forth in the forward looking statements. Factors which could have a material adverse effect on our operations and future prospects include, but are not limited to: the continuing impact of high unemployment and the slow economic recovery, which is having and may continue to have a negative effect on the following, among other things, the fundamentals of our business, including overall market demand and occupancy, tenant space utilization, and rental rates; the value of our real estate assets, which may limit our ability to dispose of assets at attractive prices or obtain or maintain debt financing secured by our properties or on an unsecured basis; general risks affecting the real estate industry (including, without limitation, the inability to enter into or renew leases, dependence on tenants’ financial condition, and competition from other developers, owners and operators of real estate); our ability to effectively raise and deploy proceeds from our equity offerings; risks associated with the availability and terms of debt and equity financing and refinancing and the use of debt to fund acquisitions and developments, including the risk associated with interest rates impacting the cost and/or availability of financing and refinancing; the business opportunities that may be presented to and pursued by us; changes in laws or regulations (including changes to laws governing the taxation of real estate investment trusts); changes in accounting principles, policies and guidelines applicable to real estate investment trusts; environmental, regulatory and/or safety requirements; and the availability and cost of comprehensive insurance, including coverage for terrorist acts and earthquakes. Except as otherwise required by the federal securities laws, we undertake no obligation to publicly update or revise any forward looking statements after the date of this supplemental package, whether as a result of new information, future events, changed circumstances or any other reason. You should review the risk factors contained in Part I, Item 1A of our 2015 Annual Report on Form 10-K, filed with the Securities and Exchange Commission on March 3, 2016, and in our subsequent quarterly reports.
Please see the section titled “Definitions” at the end of this portfolio performance and review package for definitions of terms used herein.
Page | 2
| Performance |
Dividend Capital Diversified Property Fund Inc. is a daily NAV-based REIT and has invested in a diverse portfolio of real property and real estate related investments. As used herein, “the Portfolio,” “we,” “our” and “us” refer to Dividend Capital Diversified Property Fund Inc. and its consolidated subsidiaries and partnerships except where the context otherwise requires.
Quarter Highlights
| · | Total return of 1.91% for the quarter; 9.40% for the last 12 months |
| · | Acquired (i) retail property in Chester, NJ for $53.8 million, (ii) office property in Boca Raton, FL for $35.8 million, and (iii) retail property in Tulsa, OK for $31.8 million |
| · | Sold (i) office property in Sunnyvale, CA for $16.8 million and (ii) retail property in Rockland, MA for $1.6 million |
| · | Percentage leased of 90.1% as of December 31, 2015 (if weighted by the fair value of each segment, our portfolio was 91.7% leased as of December 31, 2015) |
| · | Paid weighted-average distribution of $0.0894/share |
| (1) | As determined in accordance with our Valuation Procedures, filed as Exhibit 99.1 to our 2015 Annual Report on Form 10-K. See a discussion of some of the differences between the definition of “fair value” of our real estate assets as used in our Valuation Procedures and in this document versus GAAP values in the section titled “Definitions” beginning on page 24.For a description of key assumptions used in calculating the value of our real properties as of December 31, 2015, please refer to “Market for Registrant’s Common Equity, Related Stockholder Matters and Issuer Purchases of Equity Securities” in Part II, Item 5 of our 2015 Annual Report on Form 10-K. |
| (2) | Any market for which we do not show a corresponding percentage of our total fair value comprises 1% or less of the total fair value of our real property portfolio. |
| (3) | Represents the compounded return realized from reinvested distributions before class specific expenses. We pay our dealer manager (1) a dealer manager fee equal to 1/365th of 0.60% of our NAV per share for Class A shares and Class W shares for each day, (2) a dealer manager fee equal to 1/365th of 0.10% of our NAV per share for Class I shares for each day and (3) for Class A shares only, a distribution fee equal to 1/365th of 0.50% of our NAV per share for Class A shares for each day. |
| (4) | Excludes the impact of up-front commissions paid with respect to certain Class A shares. We pay selling commissions on Class A shares sold in the primary offering of up to 3.0% of the public offering price per share, which may be higher or lower due to rounding. Selling commissions may be reduced or eliminated to or for the account of certain categories of purchasers. |
| (5) | Total return represents the compound annual rate of return assuming reinvestment of all dividend distributions. Past performance is not a guarantee of future results. |
| (6) | Q4 2012 represents the first full quarter for which we have complete NAV return data. As such, we use 9/30/12 as “inception” for the purpose of calculating cumulative returns since inception. | |
Page | 3
| Net Asset Value |
The following table sets forth the components of NAV for the Portfolio as of the end of each of the five quarters ending December 31, 2015, as determined in accordance with our valuation procedures. For information about the valuation procedures and key assumptions used in these calculations, please refer to our Annual Report on Form 10-K or Quarterly Report on Form 10-Q for the applicable period. As used below, “Fund Interests” means our Class E shares, Class A shares, Class W shares, and Class I shares, along with the OP Units held by third parties, and “Aggregate Fund NAV” means the NAV of all of the Fund Interests (amounts in thousands except per share information).
| As of | ||||||||||||||||||||
| December 31, 2015 | September 30, 2015 | June 30, 2015 | March 31, 2015 | December 31, 2014 | ||||||||||||||||
| Real properties: | ||||||||||||||||||||
| Office | $ | 1,378,635 | $ | 1,356,600 | $ | 1,308,600 | $ | 1,245,000 | $ | 1,446,850 | ||||||||||
| Industrial | 90,250 | 88,050 | 86,850 | 85,800 | 248,300 | |||||||||||||||
| Retail | 950,925 | 872,300 | 835,320 | 833,770 | 786,705 | |||||||||||||||
| Total real properties | 2,419,810 | 2,316,950 | 2,230,770 | 2,164,570 | 2,481,855 | |||||||||||||||
| Debt related investments | 15,722 | 27,775 | 56,548 | 87,901 | 94,951 | |||||||||||||||
| Total investments | 2,435,532 | 2,344,725 | 2,287,318 | 2,252,471 | 2,576,806 | |||||||||||||||
| Cash and other assets, net of other liabilities | (14,069 | ) | (26,734 | ) | (25,014 | ) | (22,269 | ) | (10,814 | ) | ||||||||||
| Debt obligations | (1,098,853 | ) | (997,517 | ) | (818,417 | ) | (827,304 | ) | (1,192,250 | ) | ||||||||||
| Outside investors’ interests | (4,771 | ) | (4,498 | ) | (4,494 | ) | (4,445 | ) | (8,652 | ) | ||||||||||
| Aggregate Fund NAV | $ | 1,317,839 | $ | 1,315,976 | $ | 1,439,393 | $ | 1,398,453 | $ | 1,365,090 | ||||||||||
| Total Fund Interests outstanding | 176,490 | 177,468 | 195,153 | 191,434 | 190,547 | |||||||||||||||
| NAV per Fund Interest | $ | 7.47 | $ | 7.42 | $ | 7.38 | $ | 7.31 | $ | 7.16 | ||||||||||
Page | 4
| Net Asset Value (continued) |
The following table sets forth the quarterly changes to the components of NAV for the Portfolio, for each of the most recent four quarters, and for the twelve month period ended December 31, 2015 (amounts in thousands, except per share information):
| Three Months Ended | Year Ended | |||||||||||||||||||||||
| December 31, 2015 | September 30, 2015 | June 30, 2015 | March 31, 2015 | December 31, 2015 | December 31, 2014 | |||||||||||||||||||
| NAV as of beginning of period | $ | 1,315,976 | $ | 1,439,393 | $ | 1,398,453 | $ | 1,365,090 | $ | 1,365,090 | $ | 1,311,924 | ||||||||||||
| Fund level changes to NAV | ||||||||||||||||||||||||
| Realized/unrealized gains on net assets | 4,239 | 5,149 | 12,168 | 22,540 | 44,096 | 32,472 | ||||||||||||||||||
| Income accrual | 25,131 | 23,391 | 24,237 | 26,217 | 98,976 | 94,880 | ||||||||||||||||||
| Dividend accrual | (15,997 | ) | (16,747 | ) | (17,584 | ) | (17,197 | ) | (67,525 | ) | (66,676 | ) | ||||||||||||
| Advisory fee | (3,851 | ) | (3,847 | ) | (4,143 | ) | (3,931 | ) | (15,772 | ) | (15,413 | ) | ||||||||||||
| Performance based fee | (187 | ) | (364 | ) | (342 | ) | (352 | ) | (1,245 | ) | (413 | ) | ||||||||||||
| Class specific changes to NAV | ||||||||||||||||||||||||
| Dealer Manager fee | (77 | ) | (71 | ) | (59 | ) | (49 | ) | (256 | ) | (120 | ) | ||||||||||||
| Distribution fee | (15 | ) | (13 | ) | (12 | ) | (11 | ) | (51 | ) | (28 | ) | ||||||||||||
| NAV as of end of period | ||||||||||||||||||||||||
| before share sale/redemption activity | $ | 1,325,219 | $ | 1,446,891 | $ | 1,412,718 | $ | 1,392,307 | $ | 1,423,313 | $ | 1,356,626 | ||||||||||||
| Share sale/redemption activity | ||||||||||||||||||||||||
| Shares sold | 17,244 | 12,201 | 64,745 | 18,665 | 112,855 | 98,490 | ||||||||||||||||||
| Shares redeemed | (24,624 | ) | (143,116 | ) | (38,070 | ) | (12,519 | ) | (218,329 | ) | (90,026 | ) | ||||||||||||
| NAV as of end of period | $ | 1,317,839 | $ | 1,315,976 | $ | 1,439,393 | $ | 1,398,453 | $ | 1,317,839 | $ | 1,365,090 | ||||||||||||
| Shares outstanding beginning of period | 177,468 | 195,153 | 191,434 | 190,547 | 190,547 | 189,280 | ||||||||||||||||||
| Shares sold | 2,323 | 1,650 | 8,883 | 2,603 | 15,459 | 14,059 | ||||||||||||||||||
| Shares redeemed | (3,301 | ) | (19,335 | ) | (5,164 | ) | (1,716 | ) | (29,516 | ) | (12,792 | ) | ||||||||||||
| Shares outstanding end of period | 176,490 | 177,468 | 195,153 | 191,434 | 176,490 | 190,547 | ||||||||||||||||||
| NAV per share as of beginning of period | $ | 7.42 | $ | 7.38 | $ | 7.31 | $ | 7.16 | $ | 7.16 | $ | 6.93 | ||||||||||||
| Change in NAV per share | 0.05 | 0.04 | 0.07 | 0.15 | 0.31 | 0.23 | ||||||||||||||||||
| NAV per share as of end of period | $ | 7.47 | $ | 7.42 | $ | 7.38 | $ | 7.31 | $ | 7.47 | $ | 7.16 | ||||||||||||
Page | 5
| Financial Highlights |
Amounts in thousands, except per share information and percentages.
| As of or For the Three Months Ended | As of or For the Twelve Months Ended | |||||||||||||||||||||||||||
| Selected Operating Data (as adjusted)(1) | December 31, 2015 | September 30, 2015 | June 30, 2015 | March 31, 2015 | December 31, 2014 | December 31, 2015 | December 31, 2014 | |||||||||||||||||||||
| Total revenues | $ | 56,298 | $ | 53,661 | $ | 52,659 | $ | 62,582 | $ | 59,093 | $ | 225,200 | $ | 232,565 | ||||||||||||||
| Net operating income (“NOI”)(2) | 40,121 | 38,784 | 39,252 | 47,453 | 46,043 | 165,610 | 181,228 | |||||||||||||||||||||
| Net income (loss) | 776 | (1,425 | ) | 107 | 132,201 | 5,700 | 131,659 | 33,994 | ||||||||||||||||||||
| Portfolio Statistics | ||||||||||||||||||||||||||||
| Operating properties | 60 | 59 | 58 | 58 | 68 | 60 | 68 | |||||||||||||||||||||
| Square feet | 10,133 | 9,763 | 9,493 | 9,327 | 11,871 | 10,133 | 11,871 | |||||||||||||||||||||
| Percentage leased at end of period | 90.1 | % | 88.8 | % | 87.5 | % | 89.5 | % | 93.7 | % | 90.1 | % | 93.7 | % | ||||||||||||||
| Earnings Per Share | ||||||||||||||||||||||||||||
| Net income (loss) per share | $ | 0.00 | $ | (0.00 | ) | $ | 0.00 | $ | 0.69 | $ | 0.03 | $ | 0.70 | $ | 0.16 | |||||||||||||
| Funds from Operations (“FFO”) per share(3) | $ | 0.12 | $ | 0.11 | $ | 0.10 | $ | 0.13 | $ | 0.12 | $ | 0.47 | $ | 0.48 | ||||||||||||||
| Company-defined FFO per share(3) | $ | 0.13 | $ | 0.12 | $ | 0.10 | $ | 0.14 | $ | 0.12 | $ | 0.49 | $ | 0.48 | ||||||||||||||
| Weighted average number of common shares outstanding - basic | 166,352 | 174,290 | 183,157 | 179,317 | 179,926 | 175,938 | 178,273 | |||||||||||||||||||||
| Weighted average number of common shares outstanding - diluted | 179,203 | 187,279 | 196,267 | 191,766 | 192,137 | 188,789 | 190,991 | |||||||||||||||||||||
| Net Asset Value (“NAV”)(4) | ||||||||||||||||||||||||||||
| NAV per share at the end of period | $ | 7.47 | $ | 7.42 | $ | 7.38 | $ | 7.31 | $ | 7.16 | $ | 7.47 | $ | 7.16 | ||||||||||||||
| Weighted average distributions per share | $ | 0.0894 | $ | 0.0895 | $ | 0.0896 | $ | 0.0897 | $ | 0.0872 | $ | 0.3582 | $ | 0.3492 | ||||||||||||||
| Weighted average closing dividend yield - annualized | 4.79 | % | 4.83 | % | 4.86 | % | 4.91 | % | 4.87 | % | 4.80 | % | 4.87 | % | ||||||||||||||
| Weighted average total return for the period | 1.90 | % | 1.75 | % | 2.19 | % | 3.23 | % | 2.31 | % | 9.37 | % | 8.56 | % | ||||||||||||||
| Aggregate fund NAV at end of period | $ | 1,317,839 | $ | 1,315,976 | $ | 1,439,393 | $ | 1,398,453 | $ | 1,365,090 | $ | 1,317,839 | $ | 1,365,090 | ||||||||||||||
| Consolidated Debt | ||||||||||||||||||||||||||||
| Leverage(5) | 45 | % | 43 | % | 36 | % | 37 | % | 47 | % | 45 | % | 47 | % | ||||||||||||||
| Weighted average stated interest rate of total borrowings | 4.1 | % | 4.3 | % | 4.8 | % | 4.9 | % | 4.8 | % | 4.1 | % | 4.8 | % | ||||||||||||||
| Secured borrowings | $ | 587,086 | $ | 543,947 | $ | 574,043 | $ | 652,127 | $ | 853,267 | $ | 587,086 | $ | 853,267 | ||||||||||||||
| Secured borrowings as % of total borrowings | 53 | % | 54 | % | 70 | % | 78 | % | 71 | % | 53 | % | 71 | % | ||||||||||||||
| Unsecured borrowings | $ | 517,000 | $ | 459,000 | $ | 250,000 | $ | 181,000 | $ | 345,000 | $ | 517,000 | $ | 345,000 | ||||||||||||||
| Unsecured borrowings as % of total borrowings | 47 | % | 46 | % | 30 | % | 22 | % | 29 | % | 47 | % | 29 | % | ||||||||||||||
| Fixed rate borrowings(6) | $ | 954,631 | $ | 919,633 | $ | 815,973 | $ | 824,967 | $ | 1,145,017 | $ | 954,631 | $ | 1,145,017 | ||||||||||||||
| Fixed rate borrowings as % of total borrowings | 86 | % | 92 | % | 99 | % | 99 | % | 96 | % | 86 | % | 96 | % | ||||||||||||||
| Floating rate borrowings | $ | 149,455 | $ | 83,314 | $ | 8,070 | $ | 8,160 | $ | 53,250 | $ | 149,455 | $ | 53,250 | ||||||||||||||
| Floating rate borrowings as % of total borrowings | 14 | % | 8 | % | 1 | % | 1 | % | 4 | % | 14 | % | 4 | % | ||||||||||||||
| Total borrowings | $ | 1,104,086 | $ | 1,002,947 | $ | 824,043 | $ | 833,127 | $ | 1,198,267 | $ | 1,104,086 | $ | 1,198,267 | ||||||||||||||
| (1) | Operating data in this table and throughout this document are presented inclusive of amounts relating to real properties that have been disposed of or classified as held for sale at the end of the period, and in certain cases, reclassified as discontinued operations in our GAAP financial statements. Certain asset and liability amounts in this table and throughout this document are presented inclusive of amounts relating to real properties that have been classified as held for sale in our GAAP financial statements. |
| (2) | For a reconciliation of NOI to GAAP net income, see the section titled “Results of Operations” beginning on page 12. |
| (3) | For a reconciliation of FFO and Company-Defined FFO to GAAP net income, see the section titled “Funds from Operations” beginning on page 10. |
| (4) | As determined in accordance with our Valuation Procedures, filed as Exhibit 99.1 to our 2015 Annual Report on Form 10-K. |
| (5) | Leverage presented represents our total borrowings, calculated on a GAAP basis, divided by the fair value of our real property and debt investments. |
| (6) | Fixed rate borrowings presented includes floating rate borrowings that are effectively fixed by a derivative instrument such as a swap through maturity or substantially through maturity. |
Page | 6
| |
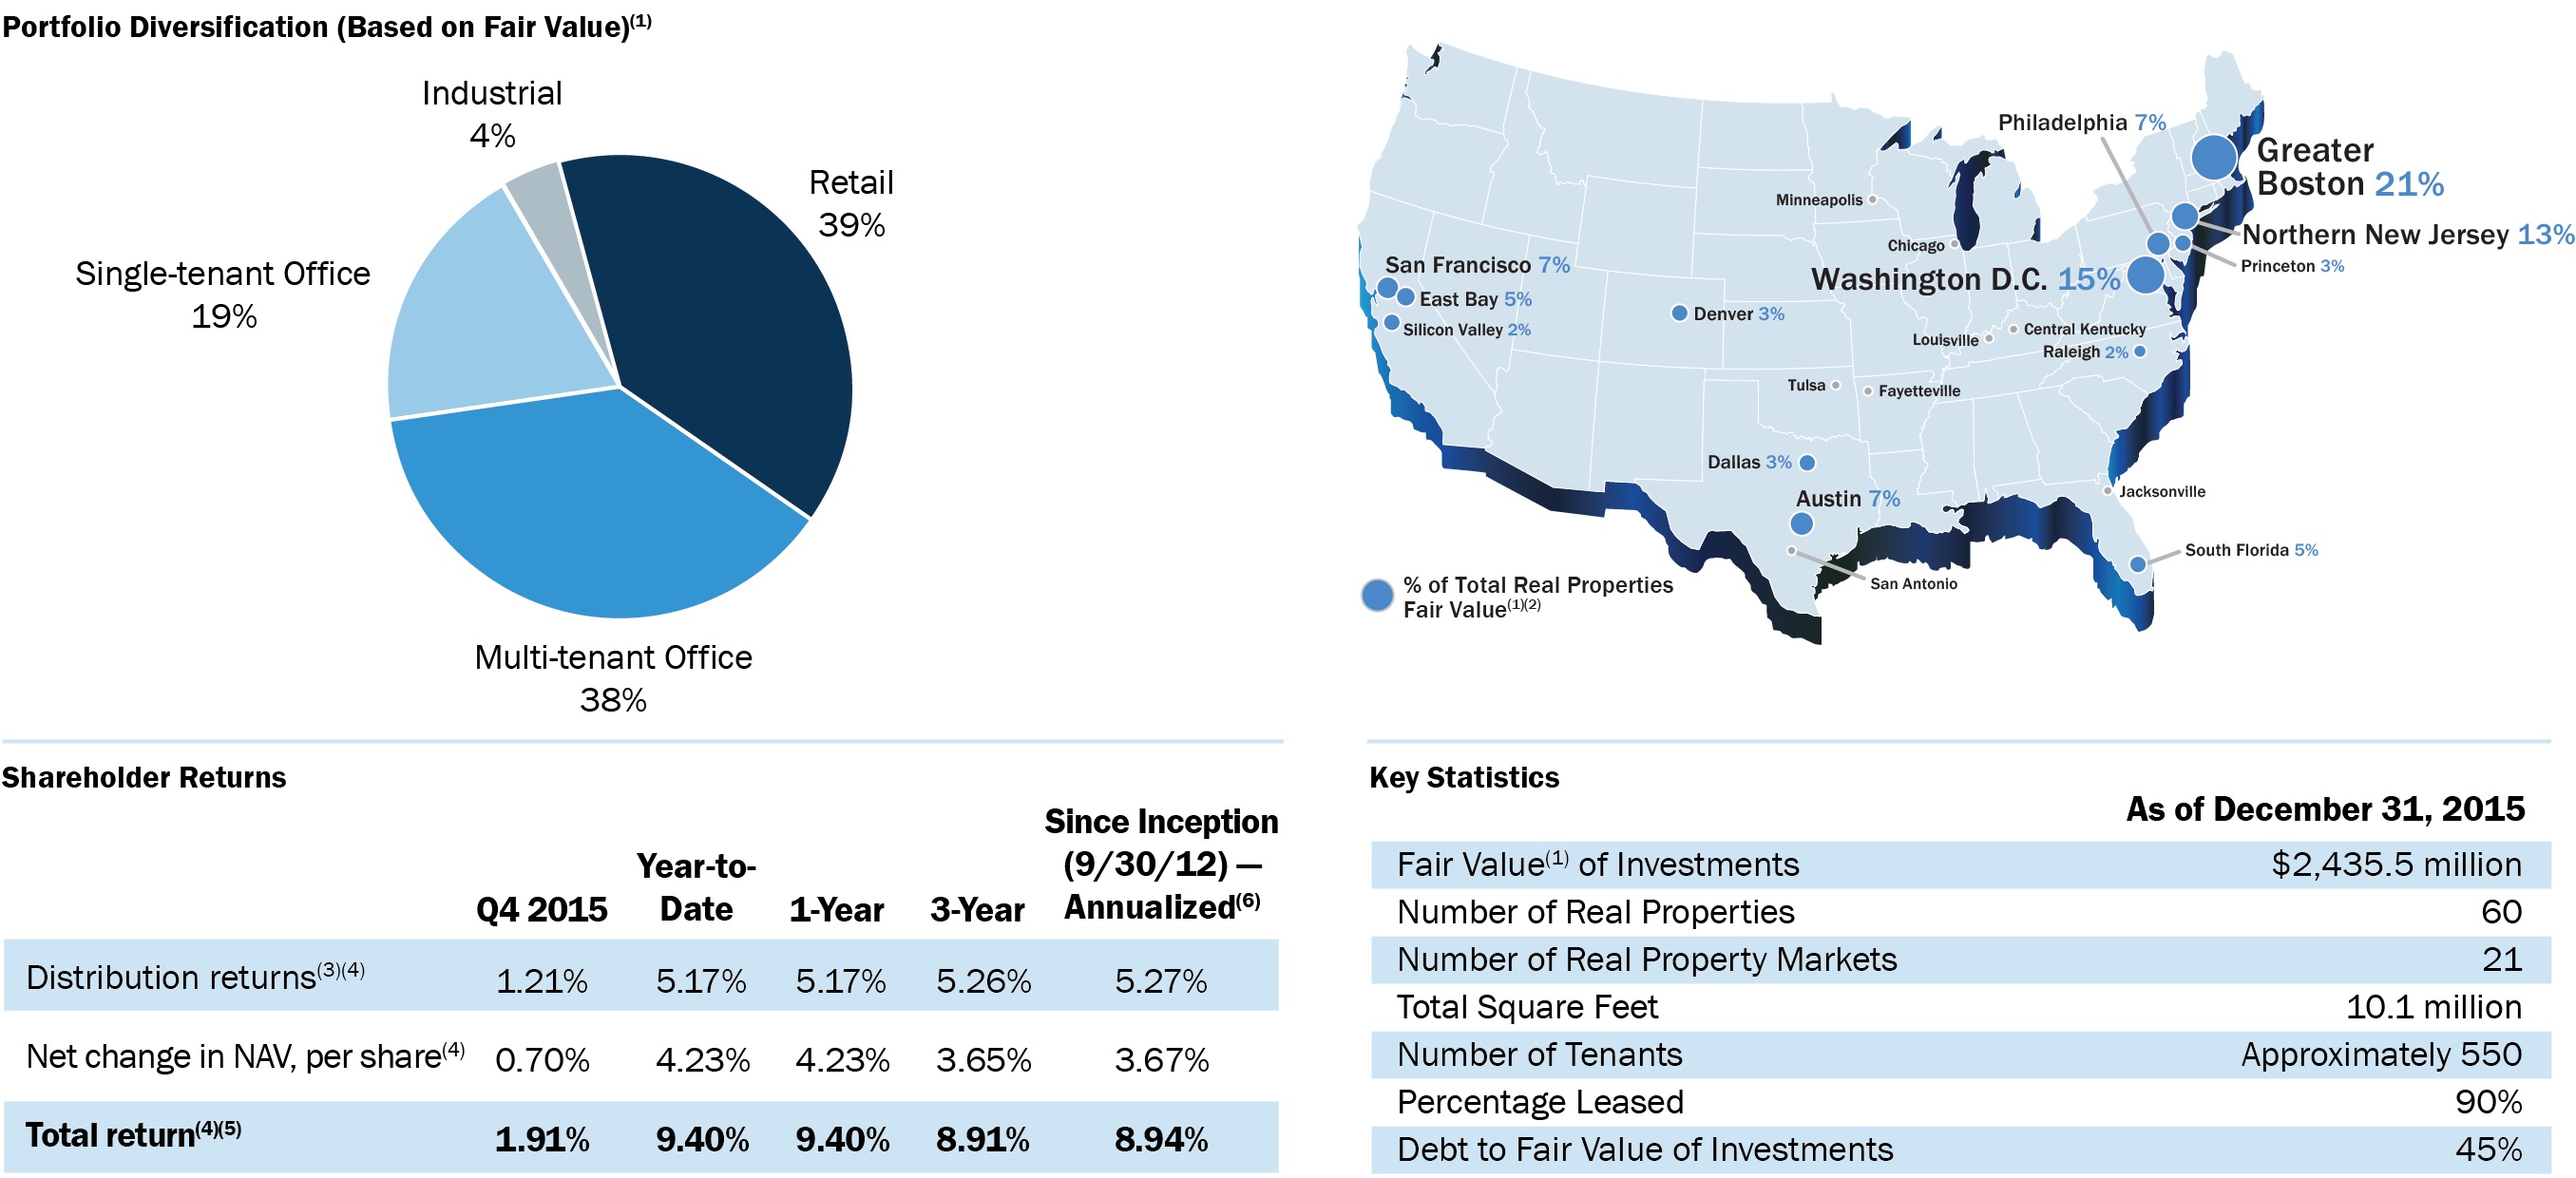
| Portfolio Profile |
As of December 31, 2015, our real property investments were geographically diversified across 21 markets throughout the United States. Our debt related investments are located in three additional markets resulting in a combined portfolio allocation across 24 markets. The following table presents information about the operating results and fair value of our real property and debt investment portfolios as of or for the three months ended December 31, 2015 (dollar and square footage amount in thousands).
| Real Properties(1) | ||||||||||||||||||||||||
| As of or for the three months ended December 31, 2015 | Total | Office | Industrial | Retail | Debt Related Investments, Net | Grand Total | ||||||||||||||||||
| Number of investments | 60 | 20 | 6 | 34 | 3 | 63 | ||||||||||||||||||
| Square footage | 10,133 | 4,461 | 1,909 | 3,763 | N/A | 10,133 | ||||||||||||||||||
| Percentage leased at period end | 90.1 | % | 91.0 | % | 80.4 | % | 93.9 | % | N/A | 90.1 | % | |||||||||||||
| Net operating income (“NOI”) (2) | $ | 38,793 | $ | 23,385 | $ | 1,099 | $ | 14,309 | $ | 1,328 | $ | 40,121 | ||||||||||||
| Segment as % of total NOI | 96.7 | % | 58.3 | % | 2.7 | % | 35.7 | % | 3.3 | % | 100.0 | % | ||||||||||||
| NOI - cash basis (3) | $ | 38,897 | $ | 24,285 | $ | 1,033 | $ | 13,579 | $ | 1,328 | $ | 40,225 | ||||||||||||
| Fair Value (4) | $ | 2,419,810 | $ | 1,378,635 | $ | 90,250 | $ | 950,925 | $ | 15,722 | $ | 2,435,532 | ||||||||||||
| Segment as % of total Fair Value | 99.3 | % | 56.6 | % | 3.7 | % | 39.0 | % | 0.7 | % | 100.0 | % | ||||||||||||
| (1) | “As of” information includes all real properties that we owned as of December 31, 2015. Operations information provided here and throughout this document is presented inclusive of amounts related to properties that have been disposed of as of December 31, 2015,including amounts that are classified within discontinued operations in our 2015 Annual Report on Form 10-K and Quarterly Reports on Form 10-Q. |
| (2) | For a reconciliation of NOI to GAAP net income, see the section titled “Results of Operations” beginning on page 12. |
| (3) | For a reconciliation of NOI – Cash Basis to NOI and to GAAP net income, see the section titled “Results of Operations” beginning on page 12. |
| (4) | As determined in accordance with our Valuation Procedures, filed as Exhibit 99.1 to our 2015 Annual Report on Form 10-K. See a discussion of some of the differences between the definition of “fair value” of our real estate assets as used in our Valuation Procedures and in this document versus GAAP values in the section titled “Definitions” beginning on page 23. For a description of key assumptions used in calculating the value of our real properties as of December 31, 2015, please refer to “Market for Registrant’s Common Equity, Related Stockholder Matters and Issuer Purchases of Equity Securities” in Part II, Item 5 of our 2015 Annual Report on Form 10-K. |
| Page | 7 |
| | |
| Balance Sheets |
The following table presents our consolidated balance sheets, as adjusted, as of the end of each of the five quarters ended December 31, 2015. Certain asset and liability amounts in this table are presented inclusive of amounts relating to real properties that have been classified as held for sale in our GAAP financial statements (dollar amounts in thousands):
| As of | ||||||||||||||||||||
December 31, 2015 | September 30, 2015 | June 30, 2015 | March 31, 2015 | December 31, 2014 | ||||||||||||||||
| ASSETS | ||||||||||||||||||||
| Investments in real property | $ | 2,380,174 | $ | 2,270,746 | $ | 2,199,150 | $ | 2,139,022 | $ | 2,472,926 | ||||||||||
| Accumulated depreciation and amortization | (505,957 | ) | (489,395 | ) | (473,526 | ) | (455,064 | ) | (523,246 | ) | ||||||||||
| Total net investments in real property | 1,874,217 | 1,781,351 | 1,725,624 | 1,683,958 | 1,949,680 | |||||||||||||||
| Debt related investments, net | 15,722 | 27,775 | 56,548 | 87,901 | 94,951 | |||||||||||||||
| Total net investments | 1,889,939 | 1,809,126 | 1,782,172 | 1,771,859 | 2,044,631 | |||||||||||||||
| Cash and cash equivalents | 15,769 | 15,186 | 28,919 | 10,226 | 14,461 | |||||||||||||||
| Restricted cash | 18,394 | 20,258 | 19,026 | 18,564 | 27,454 | |||||||||||||||
| Other assets, net | 43,106 | 46,250 | 47,223 | 49,877 | 61,587 | |||||||||||||||
| Total Assets | $ | 1,967,208 | $ | 1,890,820 | $ | 1,877,340 | $ | 1,850,526 | $ | 2,148,133 | ||||||||||
| LIABILITIES AND EQUITY | ||||||||||||||||||||
| Liabilities: | ||||||||||||||||||||
| Mortgage notes and other secured borrowings | $ | 587,086 | $ | 543,947 | $ | 574,043 | $ | 652,127 | $ | 853,267 | ||||||||||
| Unsecured borrowings | 517,000 | 459,000 | 250,000 | 181,000 | 345,000 | |||||||||||||||
| Intangible lease liabilities, net | 63,874 | 58,649 | 54,994 | 54,937 | 86,243 | |||||||||||||||
| Other liabilities | 73,297 | 84,129 | 99,460 | 70,744 | 99,643 | |||||||||||||||
| Total Liabilities | 1,241,257 | 1,145,725 | 978,497 | 958,808 | 1,384,153 | |||||||||||||||
| Equity: | ||||||||||||||||||||
| Stockholders’ equity: | ||||||||||||||||||||
| Common stock | 1,641 | 1,650 | 1,821 | 1,783 | 1,784 | |||||||||||||||
| Additional paid-in capital | 1,470,859 | 1,479,403 | 1,607,115 | 1,584,780 | 1,586,444 | |||||||||||||||
| Distributions in excess of earnings | (832,681 | ) | (818,531 | ) | (802,620 | ) | (786,286 | ) | (893,791 | ) | ||||||||||
| Accumulated other comprehensive loss | (11,014 | ) | (14,985 | ) | (9,405 | ) | (11,808 | ) | (10,120 | ) | ||||||||||
| Total stockholders’ equity | 628,805 | 647,537 | 796,911 | 788,469 | 684,317 | |||||||||||||||
| Noncontrolling interests | 97,146 | 97,558 | 101,932 | 103,249 | 79,663 | |||||||||||||||
| Total Equity | 725,951 | 745,095 | 898,843 | 891,718 | 763,980 | |||||||||||||||
| Total Liabilities and Equity | $ | 1,967,208 | $ | 1,890,820 | $ | 1,877,340 | $ | 1,850,526 | $ | 2,148,133 | ||||||||||
| Page | 8 |
| |
| Statements Of Operations |
The following table presents our condensed consolidated statements of operations, as adjusted, for each of the five quarters ended December 31, 2015 and the years ended December 31, 2015 and 2014. Operating data in this table are presented inclusive of amounts relating to real properties that have been reclassified as discontinued operations in our GAAP financial statements (amounts in thousands, except per share data):
| Three Months Ended | Year Ended | |||||||||||||||||||||||||||
December 31, 2015 | September 30, 2015 | June 30, 2015 | March 31, 2015 | December 31, 2014 | December 31, 2015 | December 31, 2014 | ||||||||||||||||||||||
| REVENUE: | ||||||||||||||||||||||||||||
| Rental revenue | $ | 54,970 | $ | 52,854 | $ | 51,075 | $ | 59,379 | $ | 57,268 | $ | 218,278 | $ | 225,169 | ||||||||||||||
| Debt related income | 1,328 | 807 | 1,584 | 3,203 | 1,825 | 6,922 | 7,396 | |||||||||||||||||||||
| Total Revenue | 56,298 | 53,661 | 52,659 | 62,582 | 59,093 | 225,200 | 232,565 | |||||||||||||||||||||
| EXPENSES: | ||||||||||||||||||||||||||||
| Rental expense | 16,177 | 14,877 | 13,407 | 15,129 | 13,050 | 59,590 | 51,337 | |||||||||||||||||||||
| Real estate depreciation and amortization expense | 21,710 | 20,851 | 19,738 | 20,815 | 22,514 | 83,114 | 88,994 | |||||||||||||||||||||
| General and administrative expenses | 2,564 | 2,477 | 2,944 | 2,735 | 2,922 | 10,720 | 11,108 | |||||||||||||||||||||
| Advisory fees, related party | 4,062 | 4,225 | 4,497 | 4,299 | 4,242 | 17,083 | 15,919 | |||||||||||||||||||||
| Acquisition-related expenses | 1,385 | 476 | 358 | 425 | 243 | 2,644 | 1,205 | |||||||||||||||||||||
| Impairment of real estate property | — | 6,500 | 224 | 1,400 | — | 8,124 | 9,500 | |||||||||||||||||||||
| Total Operating Expenses | 45,898 | 49,406 | 41,168 | 44,803 | 42,971 | 181,275 | 178,063 | |||||||||||||||||||||
| Other Income (Expenses): | ||||||||||||||||||||||||||||
| Interest and other income | 693 | 704 | 163 | 632 | 480 | 2,192 | 1,162 | |||||||||||||||||||||
| Interest expense | (11,301 | ) | (10,951 | ) | (11,275 | ) | (13,981 | ) | (15,354 | ) | (47,508 | ) | (62,199 | ) | ||||||||||||||
| Loss on extinguishment of debt and financing commitments | — | — | (272 | ) | (896 | ) | — | (1,168 | ) | (63 | ) | |||||||||||||||||
| Gain on sale of real property | 984 | 4,567 | — | 128,667 | 4,452 | 134,218 | 40,592 | |||||||||||||||||||||
| Net Income (Loss) | 776 | (1,425 | ) | 107 | 132,201 | 5,700 | 131,659 | 33,994 | ||||||||||||||||||||
| Net (income) loss attributable to noncontrolling interests | (46 | ) | 1,297 | (37 | ) | (8,618 | ) | (397 | ) | (7,404 | ) | (4,802 | ) | |||||||||||||||
| NET INCOME (LOSS) ATTRIBUTABLE TO COMMON STOCKHOLDERS | $ | 730 | $ | (128 | ) | $ | 70 | $ | 123,583 | $ | 5,303 | $ | 124,255 | $ | 29,192 | |||||||||||||
| NET INCOME (LOSS) PER BASIC AND DILUTED COMMON SHARE | $ | 0.00 | $ | (0.00 | ) | $ | 0.00 | $ | 0.69 | $ | 0.03 | $ | 0.70 | $ | 0.16 | |||||||||||||
WEIGHTED AVERAGE NUMBER OF COMMON SHARES OUTSTANDING | ||||||||||||||||||||||||||||
| Basic | 166,352 | 174,290 | 183,157 | 179,317 | 179,926 | 175,938 | 178,273 | |||||||||||||||||||||
| Diluted | 179,203 | 187,279 | 196,267 | 191,766 | 192,137 | 188,789 | 190,991 | |||||||||||||||||||||
| Weighted average distributions declared per common share | $ | 0.0894 | $ | 0.0895 | $ | 0.0896 | $ | 0.0897 | $ | 0.0872 | $ | 0.3582 | $ | 0.3492 | ||||||||||||||
| Page | 9 |
| |
| Funds From Operations |
The following tables present NAREIT-Defined Funds From Operations (“FFO”) and Company-defined FFO for each of the five quarters ended December 31, 2015 and the years ended December 31, 2015 and 2014. Operating data in these tables are presented inclusive of amounts relating to real properties that have been reclassified as discontinued operations in our GAAP financial statements (amounts in thousands except for per share amounts and percentages):
| Three Months Ended | Year Ended | |||||||||||||||||||||||||||
| December 31, 2015 | September 30, 2015 | June 30, 2015 | March 31, 2015 | December 31, 2014 | December 31, 2015 | December 31, 2014 | ||||||||||||||||||||||
| Reconciliation of net earnings to FFO: | ||||||||||||||||||||||||||||
| Net (loss) income attributable to common stockholders | $ | 730 | $ | (128 | ) | $ | 70 | $ | 123,583 | $ | 5,303 | $ | 124,255 | $ | 29,192 | |||||||||||||
| Add (deduct) NAREIT-defined adjustments: | ||||||||||||||||||||||||||||
| Depreciation and amortization expense | 21,710 | 20,851 | 19,738 | 20,815 | 22,514 | 83,114 | 88,994 | |||||||||||||||||||||
| Gain on disposition of real property | (984 | ) | (4,567 | ) | — | (128,667 | ) | (4,452 | ) | (134,218 | ) | (40,592 | ) | |||||||||||||||
| Impairment of real property | — | 6,500 | 224 | 1,400 | — | 8,124 | 9,500 | |||||||||||||||||||||
| Noncontrolling interests’ share of adjustments | (1,588 | ) | (2,891 | ) | (1,435 | ) | 6,810 | (1,251 | ) | 895 | (1,848 | ) | ||||||||||||||||
| FFO attributable to common shares-basic | 19,868 | 19,765 | 18,597 | 23,941 | 22,114 | 82,170 | 85,246 | |||||||||||||||||||||
| FFO attributable to dilutive OP units | 1,535 | 1,473 | 1,331 | 1,662 | 1,501 | 6,001 | 6,077 | |||||||||||||||||||||
| FFO attributable to common shares-diluted | $ | 21,403 | $ | 21,238 | $ | 19,928 | $ | 25,603 | $ | 23,615 | $ | 88,171 | $ | 91,323 | ||||||||||||||
| FFO per share-basic and diluted | $ | 0.12 | $ | 0.11 | $ | 0.10 | $ | 0.13 | $ | 0.12 | $ | 0.47 | $ | 0.48 | ||||||||||||||
| FFO payout ratio | 75 | % | 79 | % | 88 | % | 67 | % | 71 | % | 77 | % | 73 | % | ||||||||||||||
| Reconciliation of FFO to Company-Defined FFO: | ||||||||||||||||||||||||||||
| FFO attributable to common shares-basic | $ | 19,868 | $ | 19,765 | $ | 18,597 | $ | 23,941 | $ | 22,114 | $ | 82,170 | $ | 85,246 | ||||||||||||||
| Add (deduct) our adjustments: | ||||||||||||||||||||||||||||
| Acquisition-related expenses | 1,385 | 476 | 358 | 425 | 243 | 2,644 | 1,205 | |||||||||||||||||||||
| Loss on extinguishment of debt and financing commitments | — | — | 272 | 896 | — | 1,168 | 63 | |||||||||||||||||||||
| Unrealized (gain) loss on derivatives | (3 | ) | 117 | (128 | ) | 11 | — | (3 | ) | — | ||||||||||||||||||
| Noncontrolling interests’ share of our adjustments | (99 | ) | (41 | ) | (34 | ) | (86 | ) | (16 | ) | (260 | ) | (84 | ) | ||||||||||||||
| Company-Defined FFO attributable to common shares-basic | 21,151 | 20,317 | 19,065 | 25,187 | 22,341 | 85,719 | 86,430 | |||||||||||||||||||||
| Company-Defined FFO attributable to dilutive OP units | 1,634 | 1,514 | 1,365 | 1,748 | 1,516 | 6,261 | 6,161 | |||||||||||||||||||||
| Company-Defined FFO attributable to common shares-diluted | $ | 22,785 | $ | 21,831 | $ | 20,430 | $ | 26,935 | $ | 23,857 | $ | 91,980 | $ | 92,591 | ||||||||||||||
| Company-Defined FFO per share-basic and diluted | $ | 0.13 | $ | 0.12 | $ | 0.10 | $ | 0.14 | $ | 0.12 | $ | 0.49 | $ | 0.48 | ||||||||||||||
| Weighted average number of shares outstanding | ||||||||||||||||||||||||||||
| Basic | 166,352 | 174,290 | 183,157 | 179,317 | 179,926 | 175,938 | 178,273 | |||||||||||||||||||||
| Diluted | 179,203 | 187,279 | 196,267 | 191,766 | 192,137 | 188,789 | 190,991 | |||||||||||||||||||||
| Page | 10 |
| |
| Funds From Operations (continued) |
The following table presents certain other supplemental information for each of the five quarters ended December 31, 2015 and the years ended December 31, 2015 and 2014 (amounts in thousands):
| Three Months Ended | Year Ended | |||||||||||||||||||||||||||
December 31, 2015 | September 30, 2015 | June 30, 2015 | March 31, 2015 | December 31, 2014 | December 31, 2015 | December 31, 2014 | ||||||||||||||||||||||
| Other Supplemental Information | �� | |||||||||||||||||||||||||||
| Capital Expenditures Summary | ||||||||||||||||||||||||||||
| Recurring capital expenditures(1) | $ | 3,152 | $ | 2,476 | $ | 3,871 | $ | 2,795 | $ | 4,084 | $ | 12,294 | $ | 11,971 | ||||||||||||||
| Non-recurring capital expenditures(2) | 1,167 | 311 | 255 | 261 | 818 | 1,994 | 2,713 | |||||||||||||||||||||
| Total Capital Expenditures | 4,319 | 2,787 | 4,126 | 3,056 | 4,902 | 14,288 | 14,684 | |||||||||||||||||||||
| Other non-cash adjustments | ||||||||||||||||||||||||||||
| Straight-line rent decrease (increase) to rental revenue | 291 | 286 | 43 | 356 | (98 | ) | 976 | (3,037 | ) | |||||||||||||||||||
| Amortization of above- and below- market rent (increase) decrease to rental revenue | (197 | ) | (130 | ) | (133 | ) | (353 | ) | (537 | ) | (813 | ) | (616 | ) | ||||||||||||||
| Amortization of loan costs and hedges - increase to interest expense | 983 | 996 | 1,021 | 1,101 | 1,240 | 4,101 | 4,845 | |||||||||||||||||||||
| Amortization of mark-to-market adjustments on borrowings - (decrease) increase to interest expense | (608 | ) | (463 | ) | (268 | ) | (265 | ) | (262 | ) | (1,604 | ) | (721 | ) | ||||||||||||||
| Total other non-cash adjustments | $ | 469 | $ | 689 | $ | 663 | $ | 839 | $ | 343 | $ | 2,660 | $ | 471 | ||||||||||||||
| (1) | Recurring capital expenditures include lease incentives. Unlike other capital expenditures, we record lease incentives as other assets in our balance sheet and we classify payments for lease incentives as cash used in operating activities in our statement of cash flows. |
| (2) | Amounts presented as non-recurring capital expenditures for the three months ended September 30, 2015 and the year ended December 31, 2015 exclude a payment of $12.0 million to terminate a purchase option previously held by a third party related to an office property in Northern New Jersey. We accounted for the payment as an investment in real property. |
| Page | 11 |
| |
| Results Of Operations |
The following tables present revenue and net operating income (“NOI”) of our four operating segments, as adjusted, for each of the five quarters ending December 31, 2015 and the years ended December 31, 2015 and 2014. Our same store portfolio includes all operating properties owned for the entirety of all periods presented, and includes 49 properties acquired prior to January 1, 2014, and owned through December 31, 2015, comprising approximately 8.2 million square feet (amounts in thousands):
| Three Months Ended | Year Ended | |||||||||||||||||||||||||||
| Revenue: | December 31, 2015 | September 30, 2015 | June 30, 2015 | March 31, 2015 | December 31, 2014 | December 31, 2015 | December 31, 2014 | |||||||||||||||||||||
| Same store real property: | ||||||||||||||||||||||||||||
| Office | $ | 26,899 | $ | 27,439 | $ | 27,571 | $ | 28,308 | $ | 27,557 | $ | 110,217 | $ | 111,217 | ||||||||||||||
| Industrial | 1,525 | 1,424 | 1,438 | 1,628 | 1,614 | 6,015 | 6,629 | |||||||||||||||||||||
| Retail | 14,569 | 14,286 | 14,232 | 17,018 | 14,193 | 60,104 | 57,206 | |||||||||||||||||||||
| Total same store real property revenue | 42,993 | 43,149 | 43,241 | 46,954 | 43,364 | 176,336 | 175,052 | |||||||||||||||||||||
| 2014/2015 Acquisitions/Dispositions | 11,977 | 9,705 | 7,834 | 12,425 | 13,904 | 41,942 | 50,117 | |||||||||||||||||||||
| Debt related investments | 1,328 | 807 | 1,584 | 3,203 | 1,825 | 6,922 | 7,396 | |||||||||||||||||||||
| Total | $ | 56,298 | $ | 53,661 | $ | 52,659 | $ | 62,582 | $ | 59,093 | $ | 225,200 | $ | 232,565 | ||||||||||||||
| NOI: | ||||||||||||||||||||||||||||
| Same store real property: | ||||||||||||||||||||||||||||
| Office | $ | 19,217 | $ | 19,597 | $ | 20,220 | $ | 20,783 | $ | 20,220 | $ | 79,817 | $ | 81,033 | ||||||||||||||
| Industrial | 1,099 | 951 | 1,019 | 1,111 | 1,242 | 4,180 | 4,869 | |||||||||||||||||||||
| Retail | 11,136 | 11,055 | 11,180 | 12,246 | 11,160 | 45,617 | 44,994 | |||||||||||||||||||||
| Total same store real property NOI | 31,452 | 31,603 | 32,419 | 34,140 | 32,622 | 129,614 | 130,896 | |||||||||||||||||||||
| 2014/2015 Acquisitions/Dispositions | 7,341 | 6,374 | 5,249 | 10,110 | 11,596 | 29,074 | 42,936 | |||||||||||||||||||||
| Debt related investments | 1,328 | 807 | 1,584 | 3,203 | 1,825 | 6,922 | 7,396 | |||||||||||||||||||||
| Total | $ | 40,121 | $ | 38,784 | $ | 39,252 | $ | 47,453 | $ | 46,043 | $ | 165,610 | $ | 181,228 | ||||||||||||||
| NOI - cash basis: | ||||||||||||||||||||||||||||
| Same store real property: | ||||||||||||||||||||||||||||
| Office | $ | 20,898 | $ | 21,140 | $ | 21,531 | $ | 22,072 | $ | 21,198 | $ | 85,641 | $ | 83,530 | ||||||||||||||
| Industrial | 1,033 | 931 | 981 | 1,041 | 1,172 | 3,986 | 4,381 | |||||||||||||||||||||
| Retail | 10,798 | 10,717 | 10,843 | 11,840 | 10,693 | 44,198 | 42,973 | |||||||||||||||||||||
| Total same store real property NOI - cash basis | 32,729 | 32,788 | 33,355 | 34,953 | 33,063 | 133,825 | 130,884 | |||||||||||||||||||||
| 2014/2015 Acquisitions/Dispositions | 6,168 | 5,351 | 4,230 | 9,248 | 10,459 | 24,997 | 39,012 | |||||||||||||||||||||
| Debt related investments | 1,328 | 807 | 1,584 | 3,203 | 1,825 | 6,922 | 7,396 | |||||||||||||||||||||
| Total | $ | 40,225 | $ | 38,946 | $ | 39,169 | $ | 47,404 | $ | 45,347 | $ | 165,744 | $ | 177,292 | ||||||||||||||
| Page | 12 |
| |
| Results Of Operations (continued) |
The following tables present a reconciliation of NOI – Cash Basis and NOI of our four operating segments, as adjusted, to GAAP net income attributable to common stockholders for each of the five quarters ending December 31, 2015 and the years ended December 31, 2015 and 2014 (amounts in thousands):
| Three Months Ended | Year Ended | |||||||||||||||||||||||||||
December 31, | September 30, | June 30, | March 31, | December 31, | December 31, | December 31, 2014 | ||||||||||||||||||||||
| NOI - cash basis | $ | 40,225 | $ | 38,946 | $ | 39,169 | $ | 47,404 | $ | 45,347 | $ | 165,744 | $ | 177,292 | ||||||||||||||
| Straight line rent | (291 | ) | (286 | ) | (43 | ) | (356 | ) | 98 | (976 | ) | 3,037 | ||||||||||||||||
| Net amortization of above- and below-market lease assets and liabilities, and other non-cash adjustments to rental revenue | 187 | 124 | 126 | 405 | 598 | 842 | 899 | |||||||||||||||||||||
| NOI | $ | 40,121 | $ | 38,784 | $ | 39,252 | $ | 47,453 | $ | 46,043 | $ | 165,610 | $ | 181,228 | ||||||||||||||
| Real estate depreciation and amortization expense | (21,710 | ) | (20,851 | ) | (19,738 | ) | (20,815 | ) | (22,514 | ) | (83,114 | ) | (88,994 | ) | ||||||||||||||
| General and administrative expenses | (2,564 | ) | (2,477 | ) | (2,944 | ) | (2,735 | ) | (2,922 | ) | (10,720 | ) | (11,108 | ) | ||||||||||||||
| Advisory fees, related party | (4,062 | ) | (4,225 | ) | (4,497 | ) | (4,299 | ) | (4,242 | ) | (17,083 | ) | (15,919 | ) | ||||||||||||||
| Acquisition-related expenses | (1,385 | ) | (476 | ) | (358 | ) | (425 | ) | (243 | ) | (2,644 | ) | (1,205 | ) | ||||||||||||||
| Impairment of real estate property | — | (6,500 | ) | (224 | ) | (1,400 | ) | — | (8,124 | ) | (9,500 | ) | ||||||||||||||||
| Interest and other income | 693 | 704 | 163 | 632 | 480 | 2,192 | 1,162 | |||||||||||||||||||||
| Interest expense | (11,301 | ) | (10,951 | ) | (11,275 | ) | (13,981 | ) | (15,354 | ) | (47,508 | ) | (62,199 | ) | ||||||||||||||
| Loss on extinguishment of debt and financing commitments | — | — | (272 | ) | (896 | ) | — | (1,168 | ) | (63 | ) | |||||||||||||||||
| Gain on sale of real property | 984 | 4,567 | — | 128,667 | 4,452 | 134,218 | 40,592 | |||||||||||||||||||||
| Net (income) loss attributable to noncontrolling interests | (46 | ) | 1,297 | (37 | ) | (8,618 | ) | (397 | ) | (7,404 | ) | (4,802 | ) | |||||||||||||||
| Net income (loss) attributable to common stockholders | $ | 730 | $ | (128 | ) | $ | 70 | $ | 123,583 | $ | 5,303 | $ | 124,255 | $ | 29,192 | |||||||||||||
The following tables present details regarding our capital expenditures for each of the five quarters ending December 31, 2015 and the years ended December 31, 2015 and 2014 (amounts in thousands):
| Three Months Ended | Year Ended | |||||||||||||||||||||||||||
| Recurring Capital Expenditures: | December 31, 2015 | September 30, 2015 | June 30, 2015 | March 31, 2015 | December 31, 2014 | December 31, 2015 | December 31, 2014 | |||||||||||||||||||||
| Land and building improvements | $ | 1,425 | $ | 1,035 | $ | 1,850 | $ | 848 | $ | 1,626 | $ | 5,158 | $ | 3,539 | ||||||||||||||
| Tenant improvements | 1,178 | 607 | 1,503 | 1,500 | 1,250 | 4,788 | 4,471 | |||||||||||||||||||||
| Leasing costs(1) | 549 | 834 | 518 | 447 | 1,208 | 2,348 | 3,961 | |||||||||||||||||||||
| Total recurring capital expenditures | $ | 3,152 | $ | 2,476 | $ | 3,871 | $ | 2,795 | $ | 4,084 | $ | 12,294 | $ | 11,971 | ||||||||||||||
| Non-recurring Capital Expenditures: | ||||||||||||||||||||||||||||
| Land and building improvements(2) | $ | 665 | $ | 50 | $ | 29 | $ | 15 | $ | 93 | $ | 759 | $ | 228 | ||||||||||||||
| Tenant improvements | 320 | 219 | 42 | 205 | 618 | 786 | 1,889 | |||||||||||||||||||||
| Leasing costs | 182 | 42 | 184 | 41 | 107 | 449 | 596 | |||||||||||||||||||||
| Total non-recurring capital expenditures | $ | 1,167 | $ | 311 | $ | 255 | $ | 261 | $ | 818 | $ | 1,994 | $ | 2,713 | ||||||||||||||
| (1) | Recurring leasing costs include lease incentives. Unlike other capital expenditures, we record lease incentives as other assets in our balance sheet and we classify payments for lease incentives as cash used in operating activities in our statement of cash flows. |
| (2) | Amounts presented as non-recurring capital expenditures for land and building improvements for the three months ended September 30, 2015 and the year ended December 31, 2015 exclude a payment of $12.0 million to terminate a purchase option previously held by a third party related to an office property in Northern New Jersey. We accounted for the payment as an investment in real property. |
| Page | 13 |
| |
The following table describes certain information about our capital structure. Amounts reported as financing capital and our joint venture partners’ interests are presented on a GAAP basis. Amounts reported as equity capital other than our joint venture partners’ interests are presented based on the NAV as of December 31, 2015 (shares and dollar amounts other than price per share / unit in thousands).
| FINANCING: | As of December 31, 2015 | |||
| Mortgage notes | $ | 587,086 | ||
| Unsecured line of credit | 167,000 | |||
| Unsecured term loans | 350,000 | |||
| Total Financing | $ | 1,104,086 | ||
| EQUITY: | Shares / Units | Percentage of Aggregate Shares and Units Outstanding | NAV Per Share / Unit | Value | ||||||||||||
| Class E Common Stock | 137,275 | 77.8 | % | $ | 7.47 | $ | 1,025,115 | |||||||||
| Class A Common Stock | 1,703 | 1.0 | % | 7.47 | 12,715 | |||||||||||
| Class W Common Stock | 1,811 | 1.0 | % | 7.47 | 13,522 | |||||||||||
| Class I Common Stock(1) | 22,893 | 13.0 | % | 7.47 | 170,876 | |||||||||||
| Class E OP Units(2) | 12,808 | 7.2 | % | 7.47 | 95,611 | |||||||||||
| Total/Weighted Average | 176,490 | 100.0 | % | $ | 7.47 | $ | 1,317,839 | |||||||||
| Joint venture partners’ noncontrolling interests | 2,412 | |||||||||||||||
| Total Equity | 1,320,251 | |||||||||||||||
| TOTAL CAPITALIZATION | $ | 2,424,337 | ||||||||||||||
| (1) | Amounts reported do not include approximately 441,000 restricted stock units granted to the Advisor that remain unvested as of December 31, 2015. |
| (2) | Subsequent to December 31, 2015, we entered into an amended and restated operating partnership agreement which created two series of Class E OP Units, including Series 1 Class E OP Units and Series 2 Class E OP Units, each series with different redemption and registration rights. As of December 31, 2015, only Series 1 Class E OP Units were outstanding. For information about the amended and restated operating partnership agreement, please refer to our Current Report on Form 8-K, filed March 3, 2016. |
| Page | 14 |
| |
| Finance & Capital (continued) |
The following table presents a summary of our borrowings as of December 31, 2015 (dollar amounts in thousands):
Weighted | Outstanding Balance | Gross Investment Amount Securing Borrowings(1) | ||||||||||
| Fixed rate mortgages | 5.6% | $ | 579,196 | $ | 1,016,560 | |||||||
| Floating rate mortgages | 3.4% | 7,890 | 16,618 | |||||||||
| Total secured borrowings | 5.5% | 587,086 | 1,033,178 | |||||||||
| Line of credit(2) | 1.9% | 167,000 | N/A | |||||||||
| Term loans(2) | 2.6% | 350,000 | N/A | |||||||||
| Total unsecured borrowings | 2.4% | 517,000 | N/A | |||||||||
| Total borrowings | 4.1% | $ | 1,104,086 | N/A | ||||||||
| (1) | “Gross Investment Amount” as used here and throughout this document represents the allocated gross basis of real property, calculated in accordance with GAAP, inclusive of the effect of gross intangible lease liabilities totaling approximately $95.3 million and before accumulated depreciation and amortization of approximately $506.0 million as of December 31, 2015. |
| (2) | Approximately $375.4 million of our unsecured floating rate borrowings are effectively fixed by the use of fixed-for-floating rate swap instruments as of December 31, 2015. The stated interest rate disclosed above includes the impact of these swaps. |
The following table presents a summary of our covenants and our actual results for each of the five quarters ended December 31, 2015, calculated in accordance with the terms of our credit facilities.
| Actual as of: | ||||||||||||||||||||||
| Portfolio-Level Covenants: | Covenant | December 31, 2015 | September 30, | June 30, 2015 | March 31, 2015 | December 31, 2014 | ||||||||||||||||
| Leverage | < 60% | 45.1 | % | 42.2 | % | 35.1 | % | 36.2 | % | 43.9 | % | |||||||||||
| Fixed Charge Coverage | > 1.50 | 2.6 | 2.5 | 2.4 | 2.3 | 2.1 | ||||||||||||||||
| Secured Indebtedness | < 55% | 24.0 | % | 22.9 | % | 24.4 | % | 28.3 | % | 31.2 | % | |||||||||||
| Unencumbered Pool Covenants: | ||||||||||||||||||||||
| Unsecured Interest Coverage | >2.0 | 7.7 | 9.3 | 9.4 | 8.4 | 9.4 | ||||||||||||||||
| Leverage | < 60% | 38.4 | % | 35.5 | % | 21.6 | % | 17.8 | % | 38.8 | % | |||||||||||
| Page | 15 |
| |
| Finance & Capital (continued) |
The following table presents a detailed analysis of our borrowings outstanding as of December 31, 2015 (dollar amounts in thousands).
| As of December 31, 2015 | ||||||||||||||||||||||
| Borrowings | Principal Balance | Secured / Unsecured | Maturity Date | Extension Options | % of Total Borrowings | Fixed or Floating Interest Rate | Current InterestRate | |||||||||||||||
| 40 Boulevard | $ | 7,890 | Secured | 1/24/2016 | None | 0.7 | % | Floating | 3.43 | % | ||||||||||||
| Washington Commons(1) | 21,300 | Secured | 2/1/2016 | None | 1.9 | % | Fixed | 5.94 | % | |||||||||||||
| 1300 Connecticut(1) | 33,582 | Secured | 4/10/2016 | None | 3.0 | % | Fixed | 7.25 | % | |||||||||||||
| 1300 Connecticut B Note(1) | 11,459 | Secured | 4/10/2016 | None | 1.0 | % | Fixed | 5.53 | % | |||||||||||||
| 655 Montgomery | 56,134 | Secured | 6/11/2016 | None | 5.1 | % | Fixed | 6.01 | % | |||||||||||||
| Jay Street | 23,500 | Secured | 7/11/2016 | None | 2.1 | % | Fixed | 6.05 | % | |||||||||||||
| Bala Pointe | 24,000 | Secured | 9/1/2016 | None | 2.2 | % | Fixed | 5.89 | % | |||||||||||||
| Harborside | 107,248 | Secured | 12/10/2016 | 2 - 1 Year | 9.7 | % | Fixed | 5.50 | % | |||||||||||||
| Total 2016 | 285,113 | 25.7 | % | 5.86 | % | |||||||||||||||||
| Shiloh Road | 22,700 | Secured | 1/8/2017 | None | 2.1 | % | Fixed | 5.57 | % | |||||||||||||
| Bandera Road | 21,500 | Secured | 2/8/2017 | None | 1.9 | % | Fixed | 5.46 | % | |||||||||||||
| Eastern Retail Portfolio | 110,000 | Secured | 6/11/2017 | None | 9.9 | % | Fixed | 5.51 | % | |||||||||||||
| Wareham | 24,400 | Secured | 8/8/2017 | None | 2.2 | % | Fixed | 6.13 | % | |||||||||||||
| Kingston | 10,574 | Secured | 11/1/2017 | None | 1.0 | % | Fixed | 6.33 | % | |||||||||||||
| Sandwich | 15,825 | Secured | 11/1/2017 | None | 1.4 | % | Fixed | 6.33 | % | |||||||||||||
| Total 2017 | 204,999 | 18.5 | % | 5.69 | % | |||||||||||||||||
| Bank of America Term Loan(2) | 150,000 | Unsecured | 1/31/2018 | 2 - 1 Year | 13.6 | % | Floating | 1.91 | % | |||||||||||||
| Line of Credit(2) | 167,000 | Unsecured | 1/31/2019 | 1 - 1 Year | 15.1 | % | Floating | 3.09 | % | |||||||||||||
| Shenandoah | 10,834 | Secured | 9/1/2021 | None | 1.0 | % | Fixed | 4.84 | % | |||||||||||||
| Wells Fargo Term Loan(2) | 200,000 | Unsecured | 2/27/2022 | None | 18.1 | % | Floating | 1.88 | % | |||||||||||||
| Norwell | 4,986 | Secured | 10/1/2022 | None | 0.5 | % | Fixed | 6.76 | % | |||||||||||||
| Greater DC Retail Center | 70,000 | Secured | 12/1/2025 | None | 6.3 | % | Fixed | 3.80 | % | |||||||||||||
| Harwich | 5,337 | Secured | 9/1/2028 | None | 0.5 | % | Fixed | 5.24 | % | |||||||||||||
| New Bedford | 7,580 | Secured | 12/1/2029 | None | 0.7 | % | Fixed | 5.91 | % | |||||||||||||
| Total 2018 - 2029 | 615,737 | 55.8 | % | 2.61 | % | |||||||||||||||||
| Total borrowings | 1,105,849 | 100.0 | % | 4.02 | % | |||||||||||||||||
| Add: mark-to-market adjustment on assumed debt | 1,304 | |||||||||||||||||||||
| Less: GAAP principal amortization on restructured debt | (3,067 | ) | ||||||||||||||||||||
| Total Borrowings (GAAP basis) | $ | 1,104,086 | ||||||||||||||||||||
| (1) | Subsequent to December 31, 2015, we repaid all amounts due on our 40 Boulevard, 1300 Connecticut, and Washington Commons mortgage notes using proceeds from our line of credit. |
| (2) | Approximately $375.4 million of our term loan and line of credit borrowings are effectively fixed by the use of fixed-for-floating rate swap instruments as of December 31, 2015. The stated interest rates disclosed above include the impact of these swaps. |
| Page | 16 |
| |
The following table describes our operating property portfolio as of December 31, 2015 (dollar and square feet amounts in thousands):
| Market | Number of Properties | Gross Investment Amount | % of Gross Investment Amount | Net Rentable Square Feet | % of Total Net Rentable Square Feet | % Leased (1) | Secured Indebtedness (2) | |||||||||||||||||||||
| Office Properties: | ||||||||||||||||||||||||||||
| Washington, DC | 3 | $ | 282,939 | �� | 11.9 | % | 878 | 8.7 | % | 78.4 | % | $ | 45,041 | |||||||||||||||
| Northern New Jersey | 1 | 224,545 | 9.4 | % | 594 | 5.9 | % | 100.0 | % | 107,248 | ||||||||||||||||||
| Austin, TX | 3 | 153,419 | 6.4 | % | 585 | 5.8 | % | 99.3 | % | — | ||||||||||||||||||
| East Bay, CA | 1 | 145,339 | 6.1 | % | 405 | 4.0 | % | 100.0 | % | — | ||||||||||||||||||
| San Francisco, CA | 1 | 120,238 | 5.1 | % | 264 | 2.6 | % | 91.6 | % | 56,134 | ||||||||||||||||||
| South Florida | 2 | 82,130 | 3.5 | % | 363 | 3.6 | % | 92.2 | % | — | ||||||||||||||||||
| Denver, CO | 1 | 82,106 | 3.5 | % | 257 | 2.5 | % | 89.6 | % | — | ||||||||||||||||||
| Princeton, NJ | 1 | 51,233 | 2.2 | % | 167 | 1.6 | % | 100.0 | % | — | ||||||||||||||||||
| Chicago, IL | 2 | 43,745 | 1.8 | % | 307 | 3.0 | % | 76.1 | % | 29,190 | ||||||||||||||||||
| Philadelphia, PA | 1 | 43,482 | 1.8 | % | 173 | 1.7 | % | 81.7 | % | 24,000 | ||||||||||||||||||
| Silicon Valley, CA | 1 | 41,912 | 1.8 | % | 143 | 1.4 | % | 91.8 | % | 23,500 | ||||||||||||||||||
| Dallas, TX | 1 | 35,875 | 1.5 | % | 155 | 1.5 | % | 91.1 | % | — | ||||||||||||||||||
| Minneapolis/St Paul, MN | 1 | 29,515 | 1.2 | % | 107 | 1.1 | % | 100.0 | % | — | ||||||||||||||||||
| Fayetteville, AR | 1 | 11,695 | 0.5 | % | 63 | 0.6 | % | 100.0 | % | — | ||||||||||||||||||
| Total/Weighted Average Office: 14 markets with average annual rent of $29.37 per sq. ft. | 20 | 1,348,173 | 56.7 | % | 4,461 | 44.0 | % | 91.0 | % | 285,113 | ||||||||||||||||||
| Industrial Properties: | ||||||||||||||||||||||||||||
| Dallas, TX | 1 | 35,746 | 1.6 | % | 446 | 4.4 | % | 35.1 | % | 22,700 | ||||||||||||||||||
| Central Kentucky | 1 | 28,296 | 1.2 | % | 727 | 7.2 | % | 100.0 | % | — | ||||||||||||||||||
| Louisville, KY | 4 | 27,273 | 1.1 | % | 736 | 7.3 | % | 88.5 | % | — | ||||||||||||||||||
| Total/Weighted Average Industrial: three markets with average annual rent of $3.48 per sq. ft. | 6 | 91,315 | 3.9 | % | 1,909 | 18.9 | % | 80.4 | % | 22,700 | ||||||||||||||||||
| Retail Properties: | ||||||||||||||||||||||||||||
| Greater Boston | 26 | 545,382 | 22.9 | % | 2,280 | 22.5 | % | 94.0 | % | 84,702 | ||||||||||||||||||
| Philadelphia, PA | 1 | 105,126 | 4.4 | % | 426 | 4.2 | % | 99.1 | % | 67,800 | ||||||||||||||||||
| Washington, DC | 1 | 62,533 | 2.6 | % | 233 | 2.3 | % | 99.3 | % | 70,000 | ||||||||||||||||||
| Northern New Jersey | 1 | 58,484 | 2.5 | % | 223 | 2.2 | % | 94.6 | % | — | ||||||||||||||||||
| Raleigh, NC | 1 | 45,553 | 1.9 | % | 142 | 1.4 | % | 99.2 | % | 26,200 | ||||||||||||||||||
| South Florida | 1 | 37,898 | 1.6 | % | 124 | 1.2 | % | 100.0 | % | 10,834 | ||||||||||||||||||
| Tulsa, OK | 1 | 34,147 | 1.4 | % | 101 | 1.0 | % | 100.0 | % | — | ||||||||||||||||||
| San Antonio, TX | 1 | 32,069 | 1.3 | % | 161 | 1.6 | % | 89.6 | % | 21,500 | ||||||||||||||||||
| Jacksonville, FL | 1 | 19,494 | 0.8 | % | 73 | 0.7 | % | 20.3 | % | — | ||||||||||||||||||
| Total/Weighted Average Retail: nine markets with average annual rent of $16.80 per sq. ft. | 34 | 940,686 | 39.4 | % | 3,763 | 37.1 | % | 93.9 | % | 281,036 | ||||||||||||||||||
| Grand Total/Weighted Average | 60 | $ | 2,380,174 | 100.0 | % | 10,133 | 100.0 | % | 90.1 | % | $ | 588,849 | ||||||||||||||||
| (1) | Based on executed leases as of December 31, 2015. If weighted by the fair value of each segment, our portfolio was 91.7% leased as of December 31, 2015. |
| (2) | Secured indebtedness represents the principal balance outstanding and does not include our mark-to-market adjustment on debt or GAAP principal amortization on our troubled debt restructuring. |
| Page | 17 |
| |
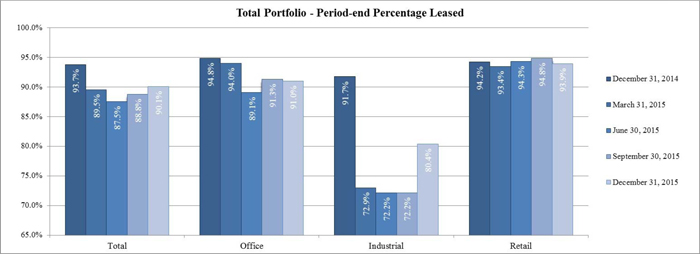
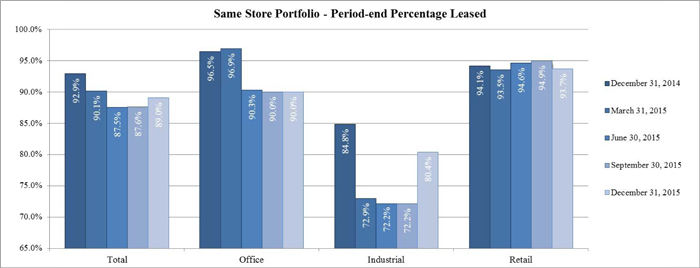
The following graphs highlight our total portfolio and same store portfolio percentage leased at the end of each of the five quarters ended December 31, 2015, by segment and in total:
| Page | 18 |
Leasing Activity (continued)
As of December 31, 2015, the weighted average remaining term of our leases was approximately 4.5 years, based on annualized base rent, and 7.0 years, based on leased square footage. The following table presents our lease expirations, by segment and in total, as of December 31, 2015 (dollars and square feet in thousands):
| Total | Office | Industrial | Retail | ||||||||||||||||||||||||||||
| Year | Number of Leases Expiring | Annualized Base Rent | % of Total Annualized Base Rent | Square Feet | Number of Leases Expiring | Annualized Base Rent | Square Feet | Number of Leases Expiring | Annualized Base Rent | Square Feet | Number of Leases Expiring | Annualized Base Rent | Square Feet | ||||||||||||||||||
| 2016(1) (2) | 104 | $ | 21,925 | 12.0 | % | 917 | 68 | $ | 19,974 | 750 | 1 | $ | 182 | 52 | 35 | $ | 1,769 | 115 | |||||||||||||
| 2017 | 95 | 43,730 | 23.7 | % | 1,398 | 49 | 39,029 | 1,015 | 2 | 189 | 53 | 44 | 4,512 | 330 | |||||||||||||||||
| 2018 | 126 | 13,443 | 7.3 | % | 680 | 72 | 9,079 | 390 | 2 | 142 | 40 | 52 | 4,222 | 250 | |||||||||||||||||
| 2019 | 107 | 24,945 | 13.5 | % | 1,237 | 50 | 13,772 | 464 | 2 | 1,226 | 212 | 55 | 9,947 | 561 | |||||||||||||||||
| 2020 | 111 | 24,229 | 13.1 | % | 1,259 | 43 | 10,206 | 452 | 1 | 299 | 105 | 67 | 13,724 | 702 | |||||||||||||||||
| 2021 | 49 | 15,704 | 8.5 | % | 1,577 | 20 | 6,955 | 240 | 3 | 3,120 | 1,021 | 26 | 5,629 | 316 | |||||||||||||||||
| 2022 | 32 | 9,105 | 4.9 | % | 516 | 15 | 4,053 | 152 | — | — | — | 17 | 5,052 | 364 | |||||||||||||||||
| 2023 | 29 | 15,364 | 8.3 | % | 626 | 13 | 11,190 | 376 | — | — | — | 16 | 4,174 | 250 | |||||||||||||||||
| 2024 | 24 | 4,977 | 2.7 | % | 333 | 6 | 1,755 | 94 | — | — | — | 18 | 3,222 | 239 | |||||||||||||||||
| 2025 | 15 | 3,726 | 2.0 | % | 199 | 6 | 2,221 | 80 | 1 | 178 | 51 | 8 | 1,327 | 68 | |||||||||||||||||
| Thereafter | 22 | 7,304 | 4.0 | % | 378 | 4 | 986 | 40 | — | — | — | 18 | 6,318 | 338 | |||||||||||||||||
| Total | 714 | $ | 184,452 | 100.0 | % | 9,120 | 346 | $ | 119,220 | 4,053 | 12 | $ | 5,336 | 1,534 | 356 | $ | 59,896 | 3,533 | |||||||||||||
| (1) | Includes 8 office leases and 9 retail leases with combined annualized base rent of approximately $423,000 that are on a month-to-month basis. |
| (2) | Includes our lease with Northrop Grumman, which leased 100% of an office property comprising approximately 575,000 square feet, located in the Washington, DC market (“Colshire”). Northrop Grumman exercised a purchase option during January 2016 to acquire Colshire on February 18, 2016 (the “Northrop Grumman Purchase Option”). As a result, Northrop Grumman is no longer our tenant. Excluding the Northrop Grumman lease, we would have 103 leases expiring during 2016, with total annualized base rent of approximately $6.0 million or approximately 3.3% of total portfolio annualized base rent, comprising approximately 342,000 square feet or approximately 3.8% of total portfolio square feet. For a more detailed discussion of the purchase option and the related property disposition, see “Item 7. Management’s Discussion and Analysis of Financial Condition and Results of Operations” of our 2015 Annual Report on Form 10-K. |
| Page | 19 |
Leasing Activity (continued)
The following table presents our top 10 tenants by annualized base rent and their related industry sector, as of December 31, 2015 (dollars and square feet in thousands):
| Tenant | Locations | Industry Sector | Annualized Base Rent (1) | % of Total Annualized Base Rent | Square Feet | % of Occupied Square Feet | ||||||||||
| 1 | Charles Schwab & Co., Inc. | 2 | Securities, Commodities, Fin. Inv./Rel. Activities | $ | 23,408 | 12.8 | % | 602 | 6.6 | % | ||||||
| 2 | Sybase | 1 | Publishing Information (except Internet) | 18,692 | 10.3 | % | 405 | 4.5 | % | |||||||
| 3 | Northrop Grumman (2) | 1 | Professional, Scientific and Technical Services | 15,901 | 8.7 | % | 575 | 6.3 | % | |||||||
| 4 | Stop & Shop | 16 | Food and Beverage Stores | 14,983 | 8.2 | % | 911 | 10.1 | % | |||||||
| 5 | Novo Nordisk | 1 | Chemical Manufacturing | 4,535 | 2.5 | % | 167 | 1.8 | % | |||||||
| 6 | Seton Health Care | 1 | Hospitals | 4,339 | 2.4 | % | 156 | 1.7 | % | |||||||
| 7 | Shaw’s Supermarket | 4 | Food and Beverage Stores | 3,944 | 2.2 | % | 240 | 2.7 | % | |||||||
| 8 | I.A.M. National Pension Fund | 1 | Funds, Trusts and Other Financial Vehicles | 3,023 | 1.7 | % | 63 | 0.7 | % | |||||||
| 9 | TJX Companies | 7 | Clothing and Clothing Accessories Stores | 2,969 | 1.6 | % | 299 | 3.3 | % | |||||||
| 10 | Home Depot | 1 | Building Material and Garden Equipment and Supplies Dealers | 2,470 | 1.4 | % | 102 | 1.1 | % | |||||||
| Total | 35 | $ | 94,264 | 51.8 | % | 3,520 | 38.8 | % | ||||||||
| (1) | Annualized base rent represents the annualized monthly base rent of executed leases as of December 31, 2015. |
| (2) | As a result of the execution of the Northrop Grumman Purchase Option, Northrop Grumman is no longer our tenant. For a more detailed discussion of the Northrop Grumman Purchase Option and the related property disposition, see “Item 7. Management’s Discussion and Analysis of Financial Condition and Results of Operations” of our 2015 Annual Report on Form 10-K. Subsequent to the disposition of Colshire, Alliant Techsystems Inc., a tenant in the computer and electronic product manufacturing industry, became our 10th largest tenant with an annualized base rent of approximately $2.4 million as of December 31, 2015, comprising approximately 107,000 square feet in one of our office properties. |
| Page | 20 |
Leasing Activity (continued)
The following series of tables details leasing activity during the four quarters ended December 31, 2015:
| Quarter | Number of Leases Signed | Gross Leasable Area (“GLA”) Signed | Average Rent Per Sq. Ft. | Average Growth / Straight Line Rent | Weighted Average Lease term (mos) | Tenant Improvements & Incentives Per Sq. Ft. | Average Free Rent (mos) | ||||||||||
| Office Comparable (1) | |||||||||||||||||
| Q4 2015 | 19 | 48,504 | $ | 27.98 | 27.5 | % | 56 | $ | 21.41 | 1.6 | |||||||
| Q3 2015 | 14 | 79,831 | 35.11 | 33.4 | % | 47 | 27.93 | 0.9 | |||||||||
| Q2 2015 | 16 | 57,885 | 31.33 | 39.7 | % | 57 | 10.50 | 1.3 | |||||||||
| Q1 2015 | 12 | 36,394 | 28.59 | 28.9 | % | 48 | 11.16 | 1.6 | |||||||||
| Total - twelve months | 61 | 222,614 | $ | 31.36 | 33.0 | % | 52 | $ | 19.24 | 1.3 | |||||||
| Industrial Comparable (1) | |||||||||||||||||
| Q4 2015 | 1 | 104,896 | $ | 2.93 | 98.9 | % | 62 | $ | 1.44 | 2.0 | |||||||
| Q3 2015 | 0 | — | 0.00 | 0.0 | % | 0 | 0.00 | — | |||||||||
| Q2 2015 | 0 | — | 0.00 | 0.0 | % | 0 | 0.00 | — | |||||||||
| Q1 2015 | 1 | 1,200 | 3.75 | 7.0 | % | 36 | 0.34 | — | |||||||||
| Total - twelve months | 2 | 106,096 | $ | 2.94 | 96.4 | % | 62 | $ | 1.43 | 2.0 | |||||||
| Retail Comparable (1) | |||||||||||||||||
| Q4 2015 | 11 | 21,343 | $ | 25.91 | 15.2 | % | 37 | $ | 1.45 | — | |||||||
| Q3 2015 | 19 | 139,735 | 12.87 | 15.2 | % | 75 | 2.00 | — | |||||||||
| Q2 2015 | 20 | 139,310 | 16.04 | 14.7 | % | 58 | 0.62 | — | |||||||||
| Q1 2015 | 12 | 140,021 | 18.49 | 9.6 | % | 53 | 3.46 | 0.1 | |||||||||
| Total - twelve months | 62 | 440,409 | $ | 15.77 | 13.1 | % | 61 | $ | 2.00 | 0.0 | |||||||
| Total Comparable Leasing (1) | |||||||||||||||||
| Q4 2015 | 31 | 174,743 | $ | 11.59 | 30.8 | % | 57 | $ | 6.98 | 1.6 | |||||||
| Q3 2015 | 33 | 219,566 | 18.76 | 24.9 | % | 65 | 11.43 | 0.3 | |||||||||
| Q2 2015 | 36 | 197,195 | 20.48 | 24.3 | % | 58 | 3.52 | 0.4 | |||||||||
| Q1 2015 | 25 | 177,615 | 20.33 | 14.7 | % | 52 | 5.01 | 0.4 | |||||||||
| Total - twelve months | 125 | 769,119 | $ | 17.91 | 23.1 | % | 58 | $ | 6.91 | 0.7 | |||||||
| Total Leasing | |||||||||||||||||
| Q4 2015 | 42 | 239,990 | $ | 12.51 | 46 | $ | 6.65 | 1.2 | |||||||||
| Q3 2015 | 45 | 272,108 | 18.14 | 63 | 11.70 | 0.3 | |||||||||||
| Q2 2015 | 46 | 296,599 | 19.16 | 46 | 3.69 | 0.4 | |||||||||||
| Q1 2015 | 42 | 297,686 | 17.64 | 57 | 9.36 | 0.6 | |||||||||||
| Total - twelve months | 175 | 1,106,383 | $ | 17.18 | 53 | $ | 7.83 | 0.6 | |||||||||
| (1) | Comparable leases comprise leases for which prior leases were in place for the same suite within 12 months of executing a new lease. Comparable leases must have terms of at least six months and the square footage of the suite occupied by the new tenant cannot deviate by more than 50% from the size of the old lease’s suite. |
| Page | 21 |
The following tables describe changes in our portfolio from December 31, 2013 through December 31, 2015 (dollars and square feet in thousands):
| Square Feet | ||||||||||||||||||||
| Properties and Square Feet Activity | Number of Properties | Total | Office | Industrial | Retail | |||||||||||||||
| Properties owned as of | ||||||||||||||||||||
| December 31, 2013 | 82 | 15,250 | 5,132 | 7,046 | 3,072 | |||||||||||||||
| 2014 Acquisitions | 3 | 585 | 262 | — | 323 | |||||||||||||||
| 2014 Dispositions | (17 | ) | (3,973 | ) | (300 | ) | (3,563 | ) | (110 | ) | ||||||||||
| Building remeasurement and other (1) | — | 9 | — | 9 | — | |||||||||||||||
| December 31, 2014 | 68 | 11,871 | 5,094 | 3,492 | 3,285 | |||||||||||||||
| 2015 Acquisitions | 8 | 1,383 | 792 | — | 591 | |||||||||||||||
| 2015 Dispositions | (17 | ) | (3,124 | ) | (1,427 | ) | (1,583 | ) | (114 | ) | ||||||||||
| Building remeasurement and other (1) | 1 | 3 | 2 | — | 1 | |||||||||||||||
| December 31, 2015 | 60 | 10,133 | 4,461 | 1,909 | 3,763 | |||||||||||||||
| (1) | Building remeasurements reflect changes in gross leasable area due to renovations or expansions of existing properties. In the first quarter of 2015 we retained one building of a two-building campus while disposing of the other building, resulting in an additional property that we did not previously consider a distinct property. |
| Property Acquisitions | Segment | Location | Acquisition Date | Number of Properties | Contract Purchase Price | Square Feet | ||||||||||||
| (dollars and square feet in thousands) | ||||||||||||||||||
| 2014: | ||||||||||||||||||
| Durgin Square | Retail | Portsmouth, NH | 5/28/2014 | 1 | $ | 24,700 | 138 | |||||||||||
| 1st Avenue Plaza | Office | Denver, CO | 8/22/2014 | 1 | 75,000 | 262 | ||||||||||||
| Salt Pond | Retail | Narragansett, RI | 11/4/2014 | 1 | 39,160 | 185 | ||||||||||||
| Total 2014 | 3 | $ | 138,860 | 585 | ||||||||||||||
| 2015: | ||||||||||||||||||
| Rialto | Office | Austin, TX | 1/15/2015 | 1 | $ | 37,300 | 155 | |||||||||||
| South Cape | Retail | Mashpee, MA | 3/18/2015 | 1 | 35,450 | 143 | ||||||||||||
| City View | Office | Austin, TX | 4/24/2015 | 1 | 68,750 | 274 | ||||||||||||
| Venture Corporate Center | Office | Hollywood, FL | 8/6/2015 | 1 | 45,750 | 253 | ||||||||||||
| Shenandoah | Retail | Davie, FL | 8/6/2015 | 1 | 32,670 | 124 | ||||||||||||
| Chester Springs | Retail | Chester, NJ | 10/8/2015 | 1 | 53,781 | 223 | ||||||||||||
| Yale Village | Retail | Tulsa, OK | 12/9/2015 | 1 | 31,800 | 101 | ||||||||||||
| Bank of America Tower | Office | Boca Raton, FL | 12/11/2015 | 1 | 35,750 | 110 | ||||||||||||
| Total 2015 | 8 | $ | 341,251 | 1,383 | ||||||||||||||
| Page | 22 |
Investment Activity (continued)
| Property Dispositions | Segment | Location | Disposition Date | Number of Properties | Contract Sales Price | Square Feet | ||||||||||||
| (dollars and square feet in thousands) | ||||||||||||||||||
| During 2014 | ||||||||||||||||||
| Industrial Portfolio | Industrial | Various (1) | 1/22/2014 | 12 | $ | 175,000 | 3,387 | |||||||||||
| Cranston | Retail | Cranston, RI | 2/18/2014 | 1 | 6,750 | 110 | ||||||||||||
| Shackleford | Office | Little Rock, AR | 2/25/2014 | 1 | 19,550 | 102 | ||||||||||||
| Land Parcel | N/A | Denver, CO | 4/14/2014 | — | 780 | — | ||||||||||||
| Shadelands | Office | East Bay, CA | 6/13/2014 | 1 | 5,700 | 60 | ||||||||||||
| Lundy (2) | Industrial | Silicon Valley, CA | 10/15/2014 | 1 | 13,579 | 177 | ||||||||||||
| South Havana | Office | Denver, CO | 11/7/2014 | 1 | 9,100 | 138 | ||||||||||||
| Total 2014 | 17 | $ | 230,459 | 3,974 | ||||||||||||||
| During 2015 | ||||||||||||||||||
| Park Place | Office | Dallas, TX | 1/16/2015 | 1 | $ | 46,600 | 177 | |||||||||||
| Office and Industrial Portfolio | Office and Industrial | Various (3) | 3/11/2015 | 12 | 398,635 | 2,669 | ||||||||||||
| Mt. Nebo | Retail | Pittsburgh, PA | 5/5/2015 | 1 | 12,500 | 103 | ||||||||||||
| 2100 Corporate Center Drive | Office | Los Angeles, CA | 7/20/2015 | 1 | 12,549 | 111 | ||||||||||||
| Land parcel | N/A | Denver, CO | 8/12/2015 | — | 7,577 | — | ||||||||||||
| DeGuigne | Office | Sunnyvale, CA | 12/14/2015 | 1 | 16,750 | 53 | ||||||||||||
| Rockland 201 Market | Retail | Rockland, MA | 12/18/2015 | 1 | 1,625 | 11 | ||||||||||||
| Total 2015 | 17 | $ | 496,236 | 3,124 | ||||||||||||||
| (1) | The Industrial Portfolio comprised 12 industrial properties located in the Atlanta, GA, Cincinnati, OH, Central Pennsylvania, Columbus, OH, Dallas, TX, Indianapolis, IN, and Minneapolis, MN markets. |
| (2) | Sales price for the Lundy property represents the principal balance outstanding of the mortgage note on the property as of the date of the foreclosure sale. Due to the contractual balance of the mortgage note, we did not receive any proceeds from the sale of Lundy. |
| (3) | The Office and Industrial Portfolio comprised (i) six office properties comprising 1.1 million net rentable square feet located in Los Angeles, CA (three properties), Northern New Jersey, Miami, FL, and Dallas, TX, and (ii) six industrial properties comprising 1.6 million net rentable square feet located in Los Angeles, CA, Dallas, TX, Cleveland, OH, Chicago, IL, Houston, TX, and Denver, CO. |
| Page | 23 |
This section contains an explanation of certain non-GAAP financial measures we provide in other sections of this document, as well as the reasons why management believes these measures provide useful information to investors about the Company’s financial condition or results of operations. Additional detail can be found in the Portfolio’s most recent annual report on Form 10-K and quarterly report on Form 10-Q, as well as other documents filed with or furnished to the Securities and Exchange Commission from time to time.
2015 Annual Report on Form 10-K
We refer to our Annual Report on Form 10-K for the period ended December 31, 2015, filed with the Securities and Exchange Commission on March 3, 2016, as our “2015 Annual Report on Form 10-K.”
Annualized Base Rent
Annualized base rent represents the annualized monthly base rent of leases executed as of December 31, 2015.
Comparable leases
Comparable leases comprise leases for which prior leases were in place for the same suite within 12 months of executing a new lease. Comparable leases must have terms of at least six months and the square footage of the suite occupied by the new tenant cannot deviate by more than 50% from the size of the old lease’s suite.
Funds From Operations (“FFO”)
We believe that FFO, as defined by the National Association of Real Estate Investment Trusts (“NAREIT”), is a meaningful supplemental measure of our operating performance because historical cost accounting for real estate assets in accordance with U.S. Generally Accepted Accounting Principles (“GAAP”) implicitly assumes that the value of real estate assets diminishes predictably over time, as reflected through depreciation and amortization expense. However, since real estate values have historically risen or fallen with market and other conditions, many industry investors and analysts have considered presentation of operating results for real estate companies that use historical cost accounting to be insufficient. Thus, NAREIT created FFO as a supplemental measure of operating performance for real estate investment trusts that consists of net income (loss), calculated in accordance with GAAP, plus real estate-related depreciation and amortization and impairment of depreciable real estate, less gains (or losses) from dispositions of real estate held for investment purposes.
Company-Defined FFO
As part of its guidance concerning FFO, NAREIT has stated that the “management of each of its member companies has the responsibility and authority to publish financial information that it regards as useful to the financial community.” As a result, modifications to FFO are common among REITs as companies seek to provide financial measures that meaningfully reflect the specific characteristics of their businesses. In addition to the NAREIT definition of FFO and other GAAP measures, we provide a Company-Defined FFO measure that we believe is helpful in assisting management and investors assess the sustainability of our operating performance. As described further below, our Company-Defined FFO presents a performance metric that adjusts for items that we do not believe to be related to our ongoing operations. In addition, these adjustments are made in connection with calculating certain of the Company’s financial covenants including its interest coverage ratio and fixed charge coverage ratio and therefore we believe this metric will help our investors better understand how certain of our lenders view and measure the financial performance of the Company and ultimately its compliance with these financial covenants.However, no single measure can provide users of financial information with sufficient information and only our disclosures read as a whole can be relied upon to adequately portray our financial position, liquidity and results of operations.
Our Company-Defined FFO is derived by adjusting FFO for the following items: acquisition-related expenses and gains and losses associated with extinguishment of debt and financing commitments. Historically, Management has also adjusted FFO for certain other adjustments that did not occur in any of the periods presented, and are further described in Item 7 of Part II of our 2014 Annual Report on Form 10-K, “Management’s Discussion and Analysis of Financial Condition and Results of Operations—How We Measure Our Performance.” Management’s evaluation of our future operating performance excludes these items based on the following economic considerations:
Acquisition-related expenses— For GAAP purposes, expenses associated with the efforts to acquire real properties, including efforts related to acquisition opportunities that are not ultimately completed, are recorded to earnings. We believe by excluding acquisition-related expenses, Company-Defined FFO provides useful supplemental information for management and investors when evaluating the sustainability of our operating performance, because these types of expenses are directly correlated to our investment activity rather than our ongoing operating activity.
| Page | 24 |
Definitions (continued)
Gains and losses on derivatives and on the extinguishment of debt and financing commitments —— Unrealized gains and losses on derivatives represent the gains or losses on the fair value of derivative instruments that are not accounted for as hedges of the underlying financing transactions. Such gains and losses may be due to the nonoccurrence of forecasted financings or ineffectiveness due to changes in the expected terms of financing transactions. As these gains or losses relate to underlying long-term assets and liabilities, where we are not speculating or trading assets, our management believes that any such gains or losses are not reflective of our ongoing operations. Losses on extinguishment of debt and financing commitments represent losses incurred as a result of the early retirement of debt obligations and breakage costs and fees incurred related to certain of our derivatives and other financing commitments. Such losses may be due to dispositions of assets, the repayment of debt prior to its contractual maturity or the nonoccurrence of forecasted financings. Our management believes that any such losses are not related to our ongoing operations. Accordingly, we believe by excluding anticipated gains or losses on derivatives and losses on extinguishment of debt and financing commitments, Company-Defined FFO provides useful supplemental information for management and investors when evaluating the sustainability of our operating performance.
We also believe that Company-Defined FFO allows investors and analysts to compare the performance of our portfolio with other REITs that are not currently affected by the adjusted items. In addition, as many other REITs adjust FFO to exclude the items described above, we believe that our calculation and reporting of Company-Defined FFO may assist investors and analysts in comparing our performance with that of other REITs. However, because Company-Defined FFO excludes items that are an important component in an analysis of our historical performance, such supplemental measure should not be construed as a complete historical performance measure and may exclude items that have a material effect on the value of our common stock.
Limitations of FFO and Company-Defined FFO
FFO (both NAREIT-defined and Company-Defined) is presented herein as a supplemental financial measure and has inherent limitations. We do not use FFO or Company-Defined FFO as, nor should they be considered to be, an alternative to net income (loss) computed under GAAP as an indicator of our operating performance, or as an alternative to cash from operating activities computed under GAAP, or as an indicator of liquidity or our ability to fund our short or long-term cash requirements, including distributions to stockholders. Management uses FFO and Company-Defined FFO as indications of our future operating performance and as a guide to making decisions about future investments. Our FFO and Company-Defined FFO calculations do not present, nor do we intend them to present, a complete picture of our financial condition and operating performance. In addition, other REITs may define FFO and an adjusted FFO metric differently and choose to treat acquisition-related expenses and potentially other accounting line items in a manner different from us due to specific differences in investment strategy or for other reasons; therefore, comparisons with other REITs may not be meaningful. Our Company-Defined FFO calculation is limited by its exclusion of certain items previously discussed, but we continuously evaluate our investment portfolio and the usefulness of our Company-Defined FFO measure in relation thereto. We believe that net income (loss) computed under GAAP remains the primary measure of performance and that FFO or Company-Defined FFO are only meaningful when they are used in conjunction with net income (loss) computed under GAAP. Further, we believe that our consolidated financial statements, prepared in accordance with GAAP, provide the most meaningful picture of our financial condition and operating performance.
Specifically with respect to fees and expenses associated with the acquisition of real property, which are excluded from Company-Defined FFO, such fees and expenses are characterized as operational expenses under GAAP and included in the determination of net income (loss) and income (loss) from operations, both of which are performance measures under GAAP. The purchase of operating properties is a key strategic objective of our business plan focused on generating operating income and cash flow in order to fund our obligations and to make distributions to investors. However, as the corresponding acquisition-related costs are paid in cash, these acquisition-related costs negatively impact our GAAP operating performance and our GAAP cash flows from operating activities during the period in which properties are acquired. In addition, if we acquire a property after all offering proceeds from our public offerings have been invested, there will not be any offering proceeds to pay the corresponding acquisition-related costs. Accordingly, such costs will then be paid from other sources of cash such as additional debt proceeds, operational earnings or cash flow, net proceeds from the sale of properties, or other ancillary cash flows. Among other reasons as previously discussed, the treatment of acquisition-related costs is a reason why Company-Defined FFO is not a complete indicator of our overall financial performance, especially during periods in which properties are being acquired. Note that, pursuant to our valuation policies, acquisition expenses result in an immediate decrease to our NAV.
FFO and Company-Defined FFO may not be useful performance measures as a result of the various adjustments made to net income for the charges described above to derive such performance measures. Specifically, we intend to operate as a perpetual-life vehicle and, as such, it is likely for our operating results to be negatively affected by certain of these charges in the future, specifically acquisition-related expenses, as it is currently contemplated as part of our business plan to acquire additional investment properties which would result in additional acquisition-related expenses. Any change in our operational structure would cause the non-GAAP measure to be re-evaluated as to the relevance of any adjustments included in the non-GAAP measure. As a result, we caution investors against using FFO or Company-Defined FFO to determine a price to earnings ratio or yield relative to our NAV.
Further, FFO or Company-Defined FFO is not comparable to the performance measure established by the Investment Program Association (the “IPA”), referred to as “modified funds from operations,” or “MFFO,” as MFFO makes further adjustments including certain mark-to-market items and adjustments for the effects of straight-line rent. As such, FFO and Company-Defined FFO may not be comparable to the MFFO of non-listed REITs that disclose MFFO in accordance with the IPA standard. More specifically, Company-Defined FFO has limited comparability to the MFFO and other adjusted FFO metrics of those REITs that do not intend to operate as perpetual-life vehicles as such REITs have a defined acquisition stage. Because we do not have a defined acquisition stage, we may continue to acquire real estate and real estate-related investments for an indefinite period of time. Therefore, Company-Defined FFO may not reflect our future operating performance in the same manner that the MFFO or other adjusted FFO metrics of a REIT with a defined acquisition stage may reflect its operating performance after the REIT had completed its acquisition stage.
| Page | 25 |
Definitions (continued)
Neither the Securities and Exchange Commission nor any other regulatory body, nor NAREIT, has adopted a set of standardized adjustments that includes the adjustments that we use to calculate Company-Defined FFO. In the future, the Securities and Exchange Commission or another regulatory body, or NAREIT, may decide to standardize the allowable adjustments across the non-listed REIT industry at which point we may adjust our calculation and characterization of Company-Defined FFO.
Gross Investment Amount
The allocated gross basis of real property and debt related investments, after certain adjustments. Gross Investment Amount for real property (i) includes the effect of intangible lease liabilities, (ii) excludes accumulated depreciation and amortization, and (iii) includes the impact of impairments. Amounts reported for debt related investments represent our net accounting basis of the debt investments, which includes (i) unpaid principal balances, (ii) unamortized discounts, premiums, and deferred charges, and (iii) allowances for loan loss.
Net Operating Income (“NOI”) and NOI – Cash Basis
We also use NOI as a supplemental financial performance measure because NOI reflects the specific operating performance of our real properties and debt related investments and excludes certain items that are not considered to be controllable in connection with the management of each property, such as other-than-temporary impairment, gains and losses related to provisions for losses on debt related investments, gains or losses on derivatives, acquisition-related expenses, losses on extinguishment of debt and financing commitments, interest income, depreciation and amortization, general and administrative expenses, advisory fees, interest expense and noncontrolling interests. However, NOI should not be viewed as an alternative measure of our financial performance as a whole, since it does exclude such items that could materially impact our results of operations. Further, our NOI may not be comparable to that of other real estate companies, as they may use different methodologies for calculating NOI. Therefore, we believe net income, as defined by GAAP, to be the most appropriate measure to evaluate our overall financial performance. “NOI – Cash Basis” is NOI after eliminating the effects of straight-lining of rent and the impact of above- and below-market lease amortization and other non-cash amortization adjustments to rental revenue.
Non-Recurring Capital Expenditures
We classify capital expenditures that significantly increase a property’s ability to generate additional revenues relative to our initial underwriting as non-recurring capital expenditures. Examples of such capital expenditures may include property expansions, renovations or other significant strategic upgrades. Conversely, we classify capital expenditures incurred to maintain a property’s ability to generate expected revenues as “recurring.” In addition, we also classify the following capital expenditures as non-recurring:
| · | First Generation Leasing Costs: We classify capital expenditures incurred to lease spaces for which we have either (i) never had a tenant or (ii) we expected a vacancy of the leasable space within two years of acquisition as non-recurring capital expenditures. |
| · | Value-Add Acquisitions: We define a Value-Add Acquisition as a property that we acquire with one or more of the following characteristics: (i) existing vacancy equal to or in excess of 20%, (ii) short-term lease roll-over, typically during the first two years of ownership, that results in vacancy in excess of 20% when combined with the existing vacancy at the time of acquisition or (iii) significant capital improvement requirements in excess of 20% of the purchase price within the first two years of ownership. We classify any capital expenditures in Value-Add Acquisitions as non-recurring until the property reaches the earlier of (i) stabilization, which we define as 90% leased or (ii) five years after the date we acquire the property. |
| · | Other Acquisitions: For property acquisitions that do not meet the criteria to qualify as Value-Add Acquisitions, we classify all anticipated capital expenditures within the first year of ownership as non-recurring. |
Same Store Properties
In our analysis of NOI, particularly to make comparisons of NOI between periods meaningful, it is important to provide information for properties that were in-service and owned by us throughout each period presented. We refer to properties acquired or placed in-service prior to the beginning of the earliest period presented and owned by us through the end of the latest period presented as “Same Store Properties.” “Same Store Properties” therefore exclude properties placed in-service, acquired, repositioned, or in development or redevelopment after the beginning of the earliest period presented or disposed of prior to the end of the latest period presented. Accordingly, it takes at least one year and one quarter after a property is acquired or treated as “in-service” for that property to be included in “Same Store Properties.” For the purposes of this supplement, our “Same Store Properties” include properties classified as held for sale in our annual financial statements at the end of the most recently completed period.
Valuation Procedures
We refer to our Valuation Procedures filed as Exhibit 99.1 to our 2015 Annual Report on Form 10-K as our “Valuation Procedures.”
| Page | 26 |