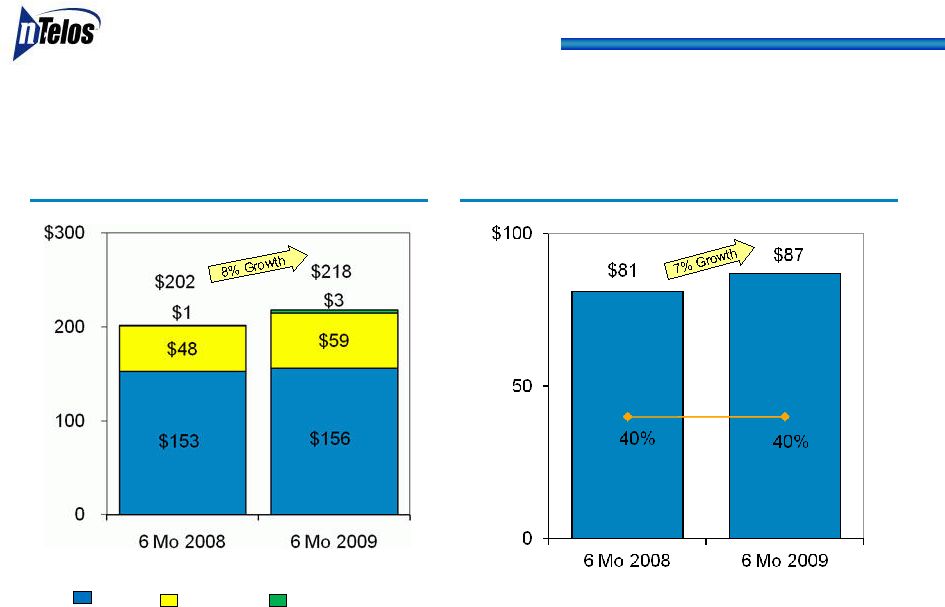
30 Summary of Operating Results ($ in thousands) Six Months Ended: Three Months Ended: June 30, 2008 June 30, 2009 June 30, 2008 June 30, 2009 Operating Revenues Wireless PCS Operations 99,950 $ 108,858 $ 201,864 $ 218,064 $ Wireline Operations RLEC 14,922 14,458 29,357 29,148 Competitive Wireline 15,790 16,567 31,536 33,210 Wireline Total 30,712 31,025 60,893 62,358 Other 143 118 298 243 130,805 $ 140,001 $ 263,055 $ 280,665 $ Operating Expenses Wireless PCS Operations 58,718 $ 64,842 $ 120,707 $ 131,257 $ Wireline Operations RLEC 3,884 3,725 7,734 7,466 Competitive Wireline 9,413 9,834 18,707 19,683 Wireline Total 13,297 13,559 26,441 27,149 Other 1,203 1,313 2,773 3,871 73,218 $ 79,714 $ 149,921 $ 162,277 $ Adjusted EBITDA (a non-GAAP Measure) Wireless PCS Operations 41,232 $ 44,016 $ 40.4% 81,157 $ 40.2% 86,807 $ Wireline Operations RLEC 11,038 10,733 74.2% 21,623 73.7% 21,682 Competitive Wireline 6,377 6,733 40.6% 12,829 40.7% 13,527 Wireline Total 17,415 17,466 56.3% 34,452 56.6% 35,209 Other (1,060) (1,195) (2,475) (3,628) 57,587 $ 60,287 $ 43.1% 113,134 $ 43.0% 118,388 $ Capital Expenditures Wireless PCS Operations 19,739 $ 16,668 $ 30,368 $ 34,619 $ Wireline Operations RLEC 4,548 4,025 7,601 6,862 Competitive Wireline 4,477 8,001 12,414 15,355 Wireline Total 9,025 12,026 20,015 22,217 Other 2,490 9,231 6,347 12,703 31,254 $ 37,925 $ 56,730 $ 69,539 $ Adjusted EBITDA less Capital Expenditures (a non-GAAP Measure) Wireless PCS Operations 21,493 $ 27,348 $ 50,789 $ 52,188 $ Wireline Operations RLEC 6,490 6,708 14,022 14,820 Competitive Wireline 1,900 (1,268) 415 (1,828) Wireline Total 8,390 5,440 14,437 12,992 Other (3,550) (10,426) (8,822) (16,331) 26,333 $ 22,362 $ 56,404 $ 48,849 $ (before depreciation & amortization, asset impairment charges, accretion of asset retirement obligations, non-cash compensation and voluntary early retirement program charges, a non-GAAP Measure of operating expenses) |