
Investor Presentation May 2016

1 Forward-Looking Statements / Non-GAAP Financial Measures Forward-Looking Statements During the course of this presentation, we may make forward-looking statements or provide forward- looking information. All statements that address expectations or projections about the future are forward-looking statements. Some of these statements include words such as “expects,” “anticipates,” “believes,” “estimates,” “plans,” “intends,” “projects,” and “indicates.” Although they reflect our current expectations, these statements are not guarantees of future performance, but involve a number of risks, uncertainties, and assumptions which are difficult to predict. Some of the factors that may cause actual outcomes and results to differ materially from those expressed in, or implied by, the forward- looking statements include, but are not necessarily limited to, general economic conditions, competitive pressures, the commodity nature of the Company’s products and their price movements, raw material costs and availability, and the ability to retain key employees. The Company does not undertake to update any forward-looking statements as a result of future developments or new information. Non-GAAP Financial Measures Included in this presentation are certain non-GAAP financial measures, including EBITDA, designed to complement the financial information presented in accordance with generally accepted accounting principles in the United States of America because management believes such measures are useful to investors. Our non-GAAP financial measures are not necessarily comparable to other similarly titled captions of other companies due to potential inconsistencies in the metrics of calculation. For a reconciliation of net income (loss) to EBITDA and segment income (loss) to segment EBITDA, see the Appendix to this presentation.
2 Investment Highlights Leadership Positions in Wood Products Manufacturing and Building Materials Distribution on a National Scale Distinctive Competence in Managing Vertical Integration to Create Value Low-Cost Manufacturing and Distribution Footprint Driven by Business Models and Capital Investment Well Positioned for Continued Growth with Housing Recovery Experienced Management with Track Record of Cost Discipline and Growth
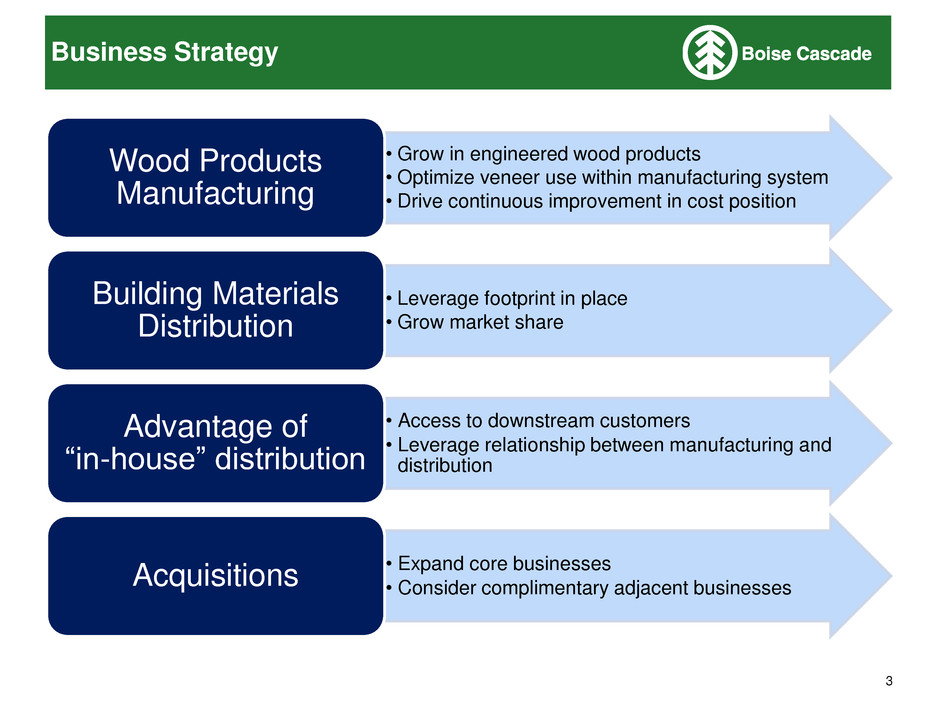
3 Business Strategy • Grow in engineered wood products • Optimize veneer use within manufacturing system • Drive continuous improvement in cost position Wood Products Manufacturing • Leverage footprint in place • Grow market share Building Materials Distribution • Access to downstream customers • Leverage relationship between manufacturing and distribution Advantage of “in-house” distribution • Expand core businesses • Consider complimentary adjacent businesses Acquisitions
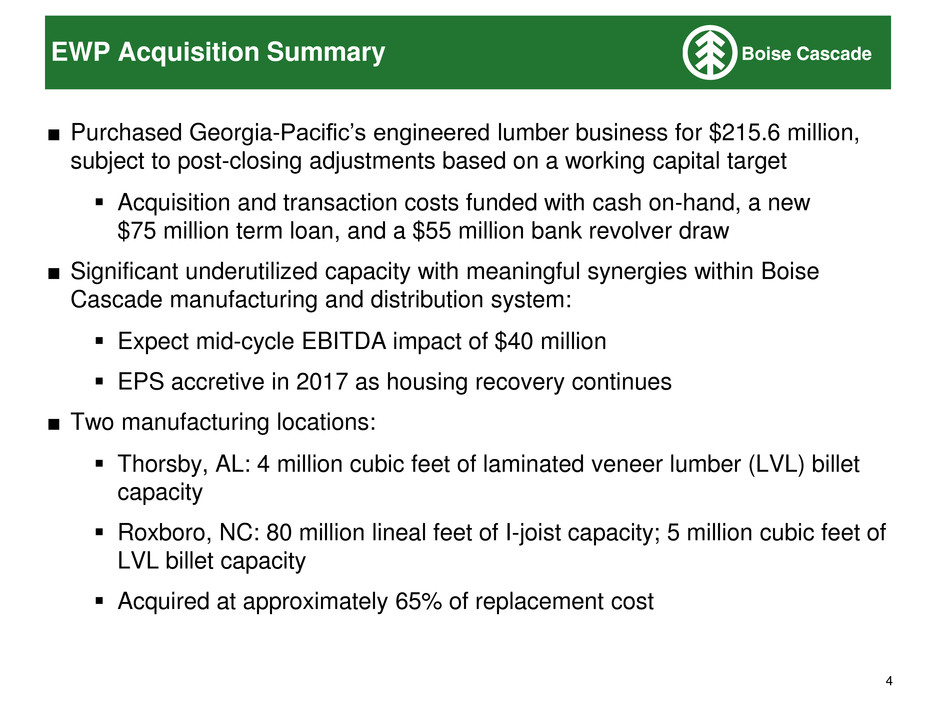
4 EWP Acquisition Summary ■ Purchased Georgia-Pacific’s engineered lumber business for $215.6 million, subject to post-closing adjustments based on a working capital target Acquisition and transaction costs funded with cash on-hand, a new $75 million term loan, and a $55 million bank revolver draw ■ Significant underutilized capacity with meaningful synergies within Boise Cascade manufacturing and distribution system: Expect mid-cycle EBITDA impact of $40 million EPS accretive in 2017 as housing recovery continues ■ Two manufacturing locations: Thorsby, AL: 4 million cubic feet of laminated veneer lumber (LVL) billet capacity Roxboro, NC: 80 million lineal feet of I-joist capacity; 5 million cubic feet of LVL billet capacity Acquired at approximately 65% of replacement cost
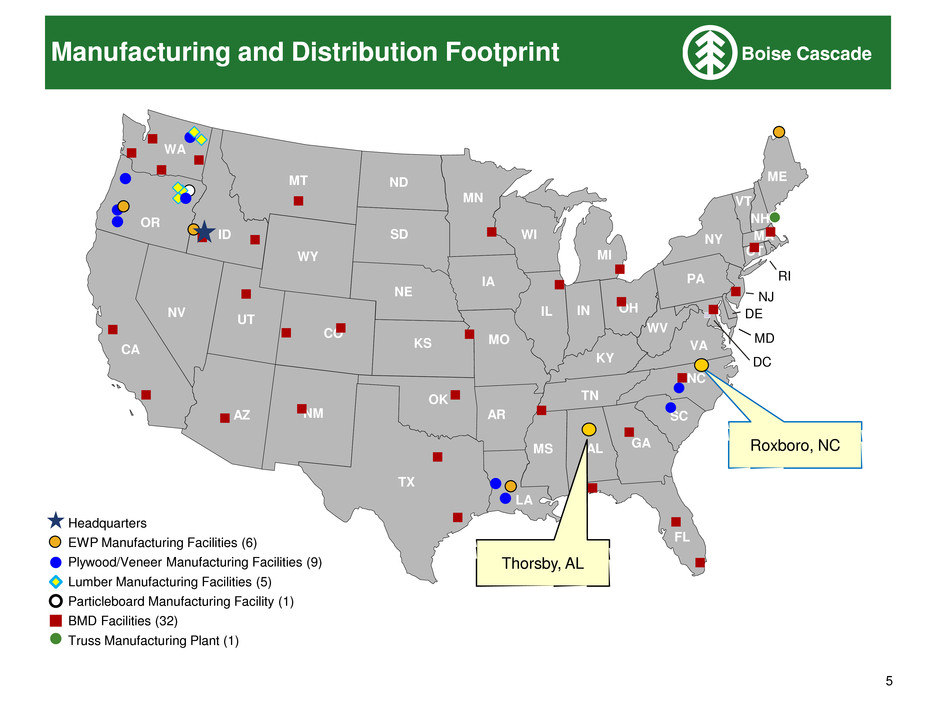
5 Manufacturing and Distribution Footprint ID FL NM DE MD TX OK KS NE SD ND MT WY CO UT AZ NV WA CA OR KY ME NY VT NH MA RI CT WV IN IL NC TN SC AL MS AR LA MO IA MN WI NJ GA DC VA MI OH PA Thorsby, AL Roxboro, NC Headquarters EWP Manufacturing Facilities (6) Plywood/Veneer Manufacturing Facilities (9) Lumber Manufacturing Facilities (5) Particleboard Manufacturing Facility (1) BMD Facilities (32) Truss Manufacturing Plant (1)
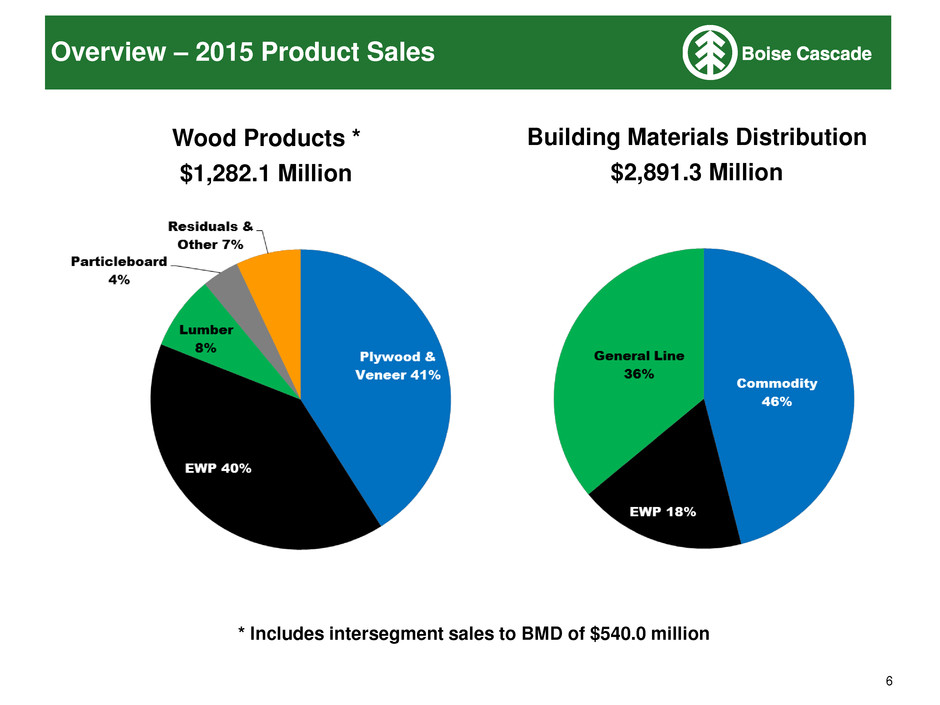
6 Overview – 2015 Product Sales Wood Products * $1,282.1 Million Building Materials Distribution $2,891.3 Million * Includes intersegment sales to BMD of $540.0 million

7 Overview – Primary Operations (2015) Dry Veneer Production(1) 2,312 mmsf BCC Distribution Plywood/PLV Production 1,951 mmsf Sold as Plywood 1,635 mmsf Production LVL/Flange 20.1 mmcf I-joist 198 mmlf Sales LVL 13.1 mmcf I-joist 201 mmlf 1,951 mmsf veneer 361 mmsf veneer 26% of plywood volume 66% of EWP volume 352 mmsf PLV (1) Includes net purchases of approximately 140mmsf
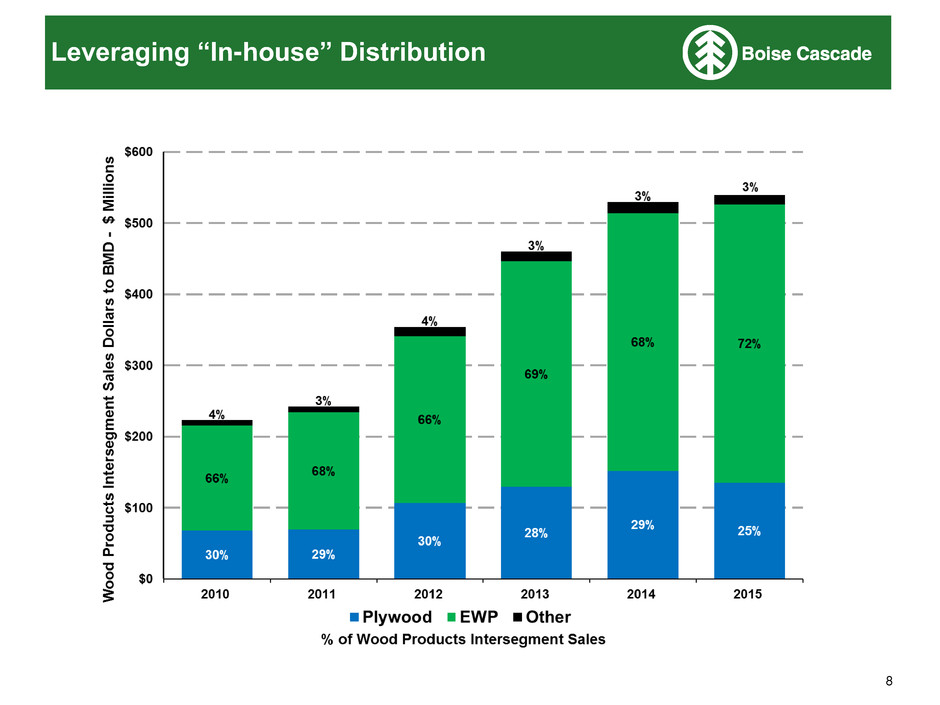
8 Leveraging “In-house” Distribution
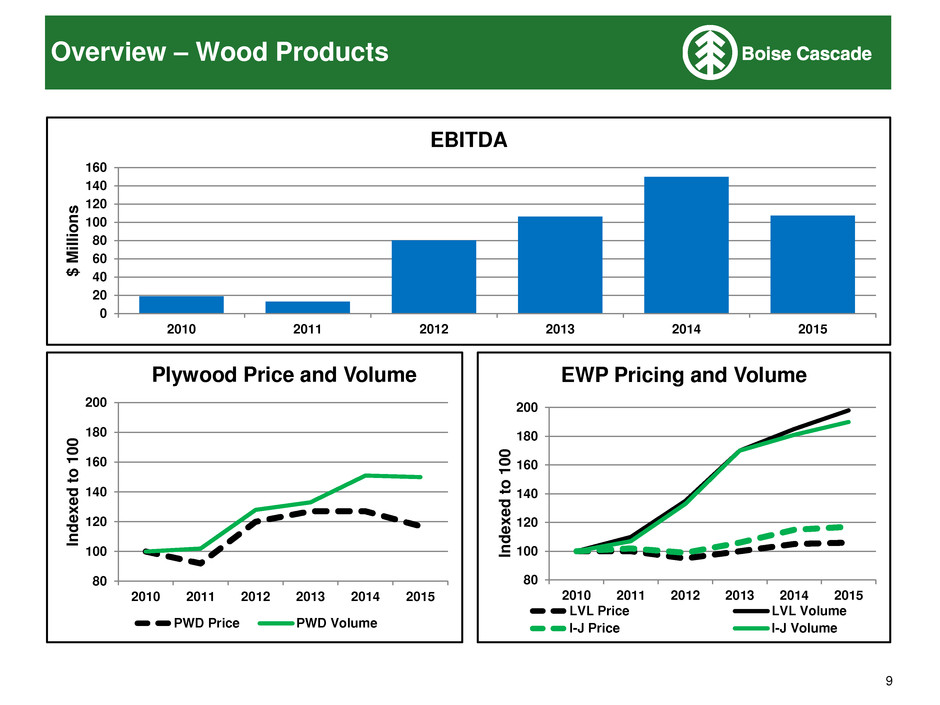
9 Overview – Wood Products 80 100 120 140 160 180 200 2010 2011 2012 2013 2014 2015 Ind e x e d t o 1 0 0 EWP Pricing and Volume LVL Price LVL Volume I-J Price I-J Volume 80 100 120 140 160 180 200 2010 2011 2012 2013 2014 2015 Ind e x e d t o 1 0 0 Plywood Price and Volume PWD Price PWD Volume 0 20 40 60 80 100 120 140 160 2010 2011 2012 2013 2014 2015 $ M il li on s EBITDA
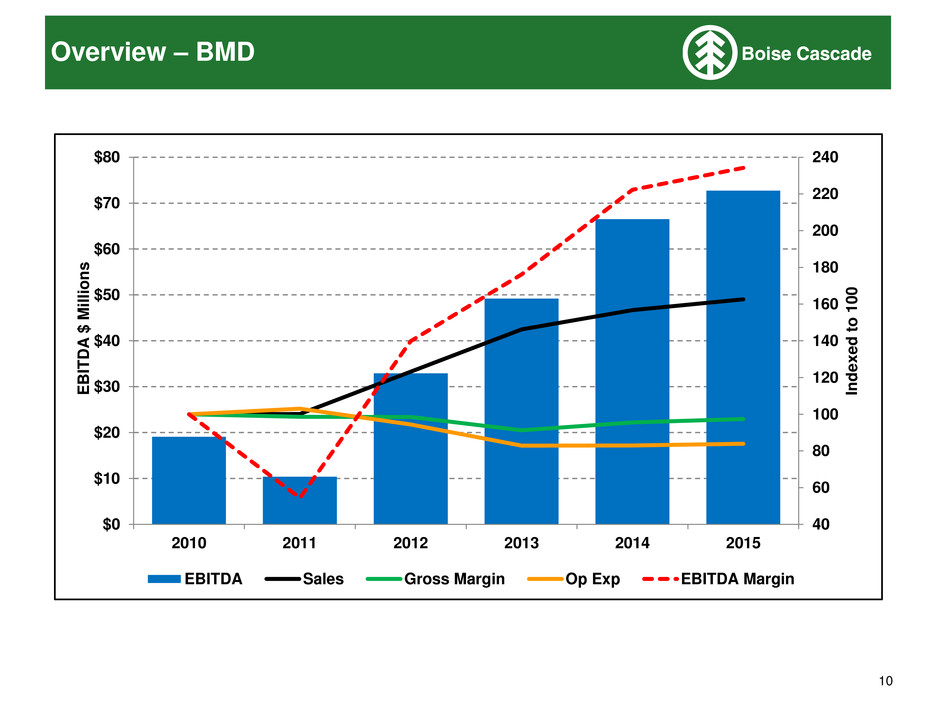
10 Overview – BMD 40 60 80 100 120 140 160 180 200 220 240 $0 $10 $20 $30 $40 $50 $60 $70 $80 2010 2011 2012 2013 2014 2015 Ind e x e d t o 1 0 0 E BIT D A $ Mil lion s EBITDA Sales Gross Margin Op Exp EBITDA Margin
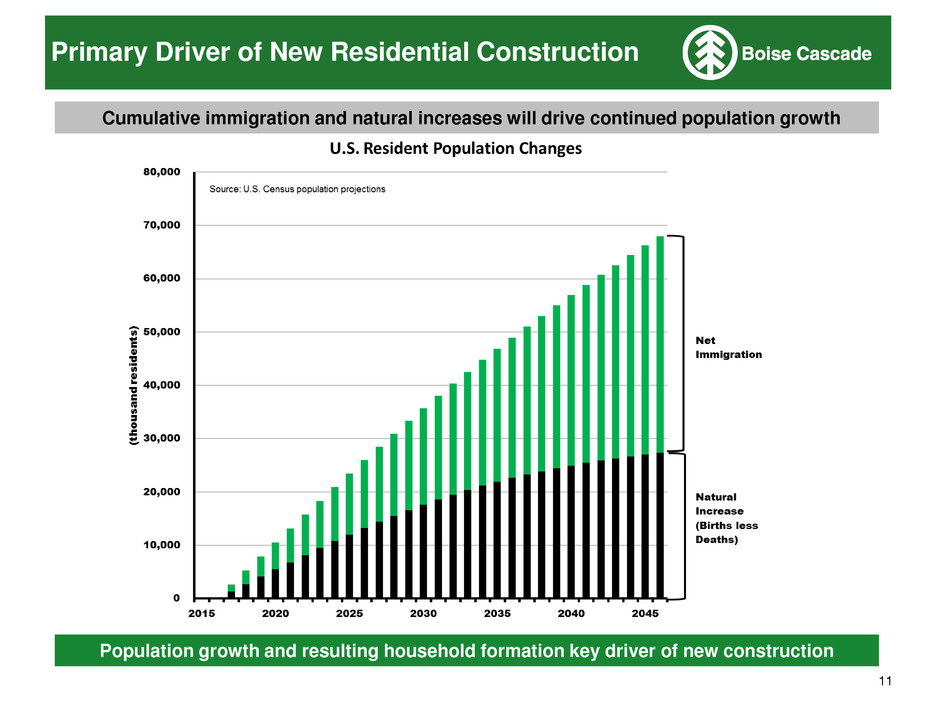
11 Population growth and resulting household formation key driver of new construction Cumulative immigration and natural increases will drive continued population growth Primary Driver of New Residential Construction
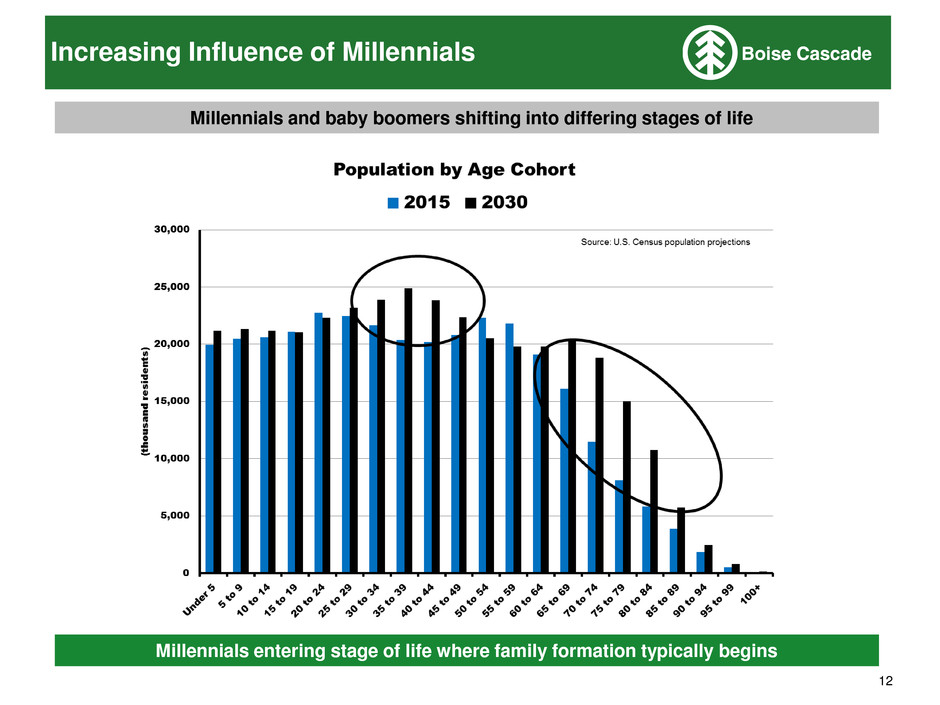
12 Millennials entering stage of life where family formation typically begins Millennials and baby boomers shifting into differing stages of life Increasing Influence of Millennials
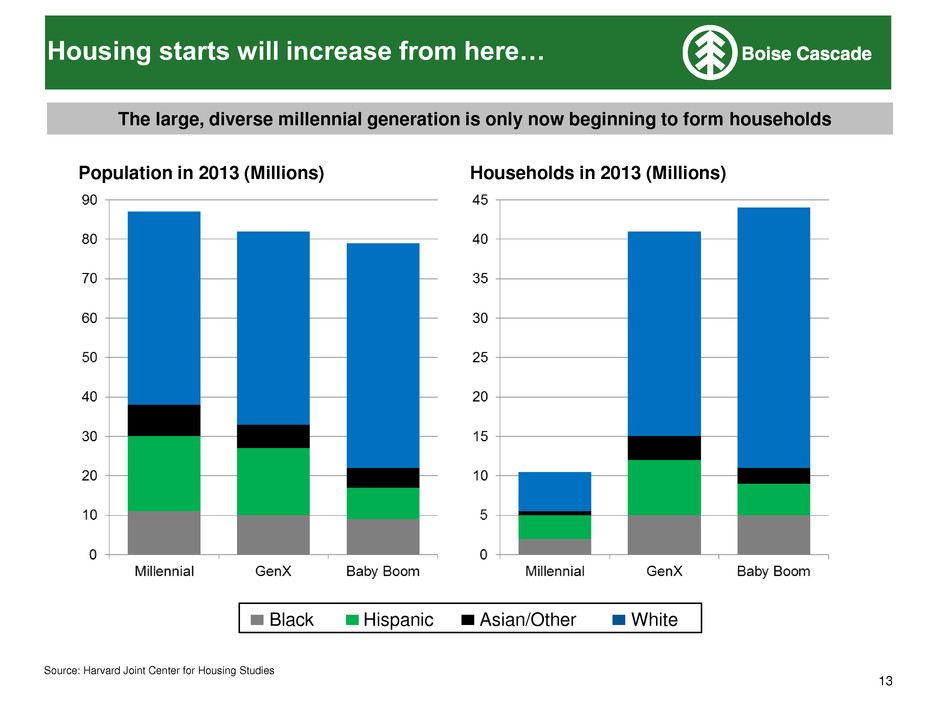
13 Population in 2013 (Millions) Households in 2013 (Millions) Housing starts will increase from here… Source: Harvard Joint Center for Housing Studies The large, diverse millennial generation is only now beginning to form households Black Hispanic Asian/Other White
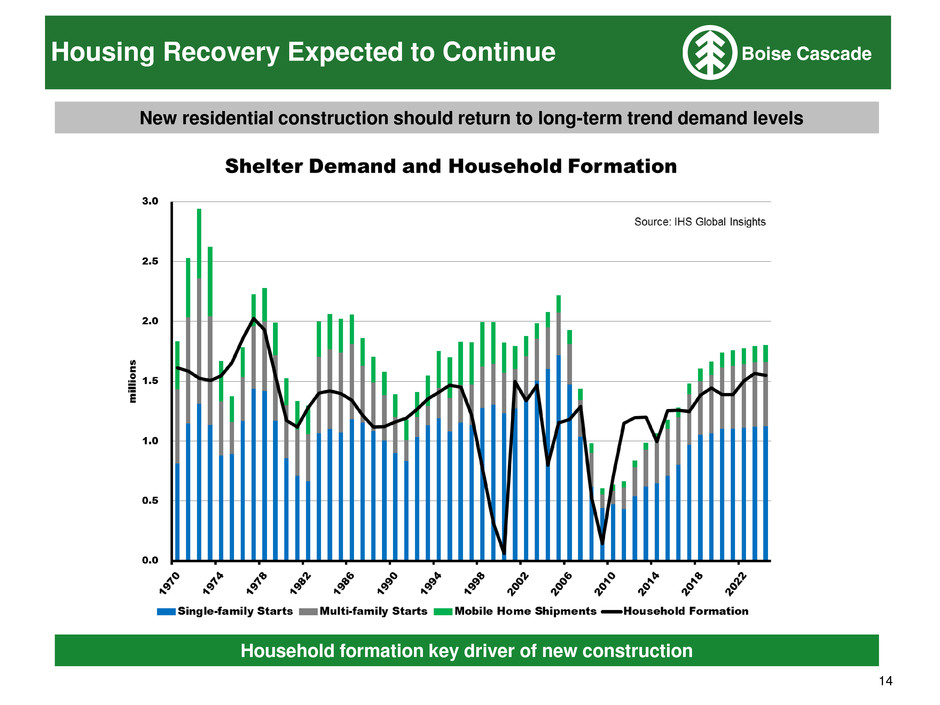
14 Household formation key driver of new construction New residential construction should return to long-term trend demand levels Housing Recovery Expected to Continue

15 Total Structural Panel Usage for North America
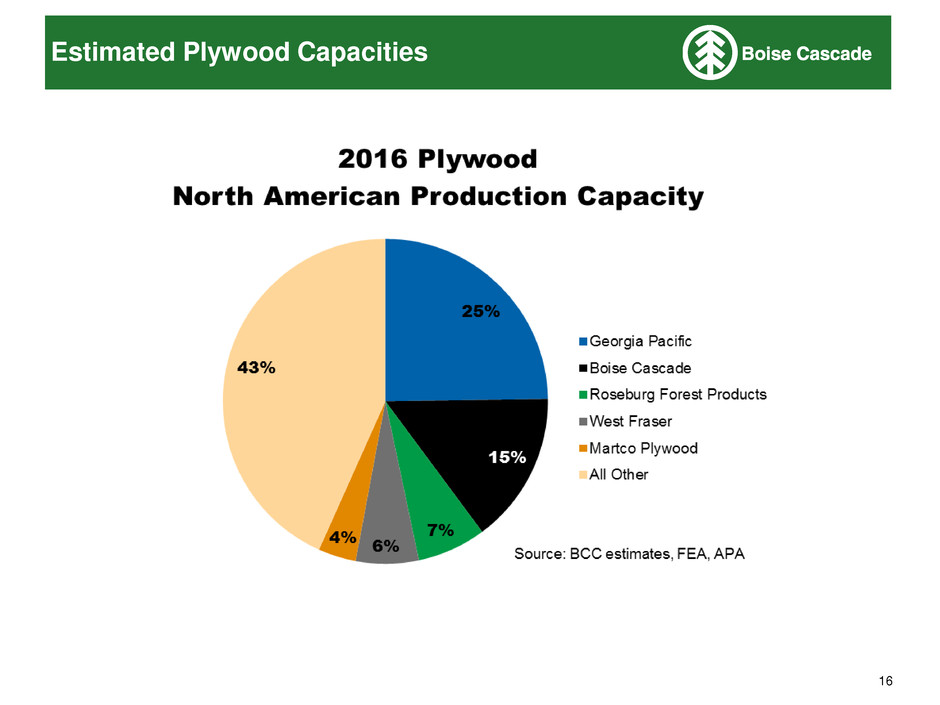
16 Estimated Plywood Capacities

17 Plywood Capacity by Region

18 Softwood Plywood Net Imports and Total Demand
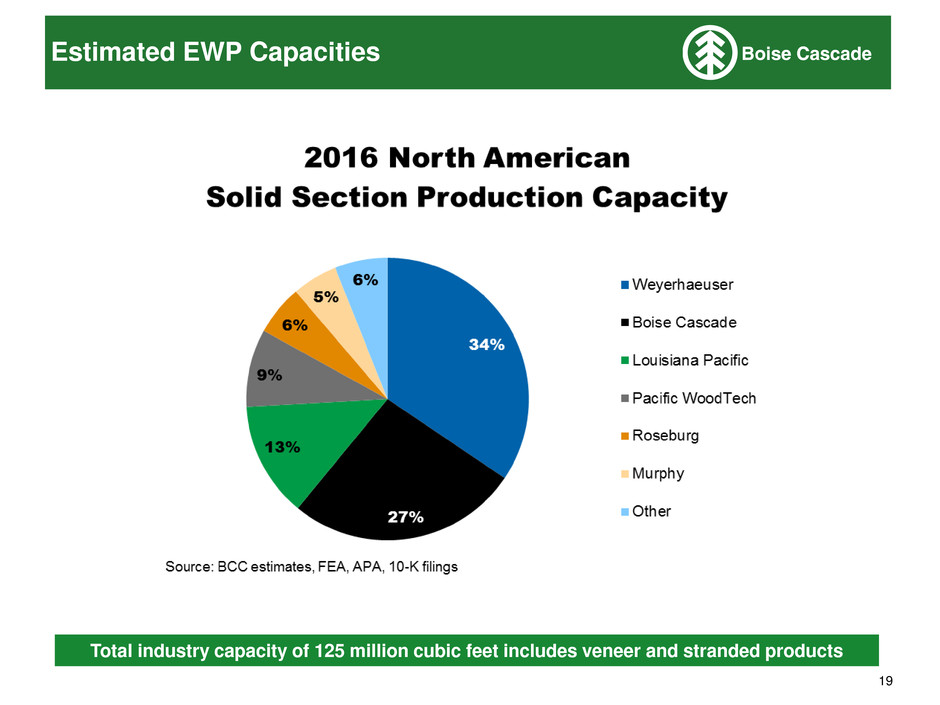
19 Estimated EWP Capacities Total industry capacity of 125 million cubic feet includes veneer and stranded products

20 Overview – BMD Product Sales $ Millions Product Examples 2015 Sales - $2,891 Key Services LVL Logistics I-joists Truckload shipments Glulams Break bulk / Packaging Mill direct shipments Composite Decking Siding Financial Metal Products Credit Housewrap Price Risk Mitigation - Commodities Rebar Sales & Marketing Market Development / Product Knowledge Dimension / Studs Customer Service Board Special Orders OSB Warranty Claims Plywood Technical Services Particleboard EWP Design and Specification MDF Commodity $1,343 General Line $1,038 EWP $510

21 Overview – Capital Allocation

22 Capital Allocation Priorities ■ Support organic growth Newly acquired EWP facilities Modernization project at Florien, LA plywood operations (dryer completion 2Q 2016) ■ Pursue distribution acquisitions ■ Repurchase shares opportunistically Authorization for up to 2 million shares announced March 2015 Through April 2016, 903,011 shares repurchased at an average price of $29.17 per share ■ Target gross debt-to-EBITDA of 2.5x
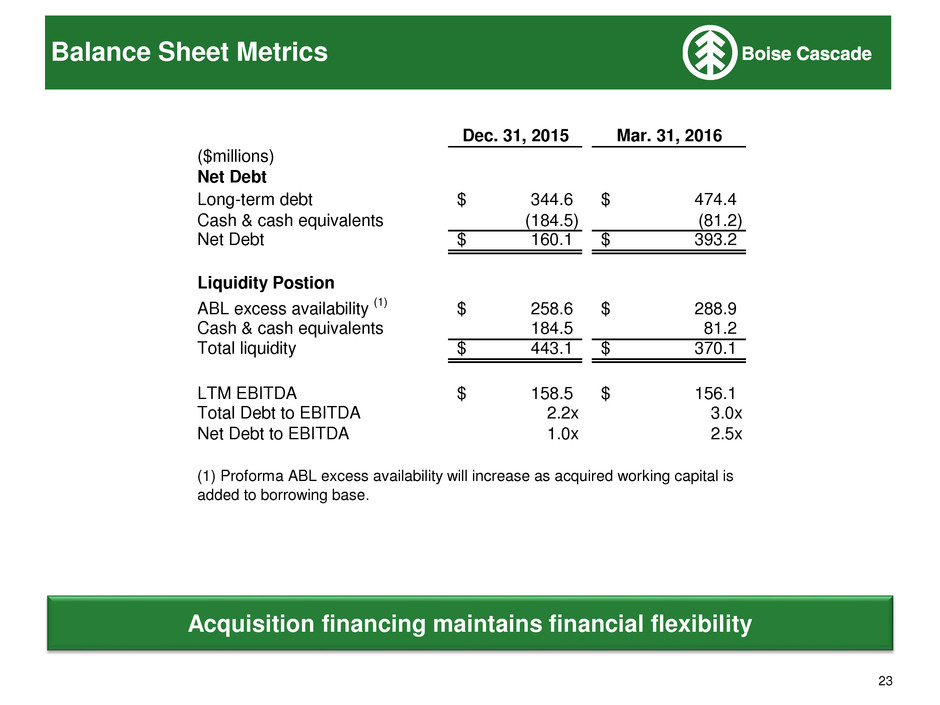
23 Acquisition financing maintains financial flexibility Balance Sheet Metrics Dec. 31, 2015 Mar. 31, 2016 ($millions) Net Debt Long-term debt 344.6$ 474.4$ Cash & cash equivalents (184.5) (81.2) Net Debt 160.1$ 393.2$ Liquidity Postion ABL excess availability (1) 258.6$ 288.9$ Cash & cash equivalents 184.5 81.2 Total liquidity 443.1$ 370.1$ LTM EBITDA 158.5$ 156.1$ Total Debt to EBITDA 2.2x 3.0x Net Debt to EBITDA 1.0x 2.5x (1) Proforma ABL excess availability will increase as acquired working capital is added to borrowing base.
Appendix
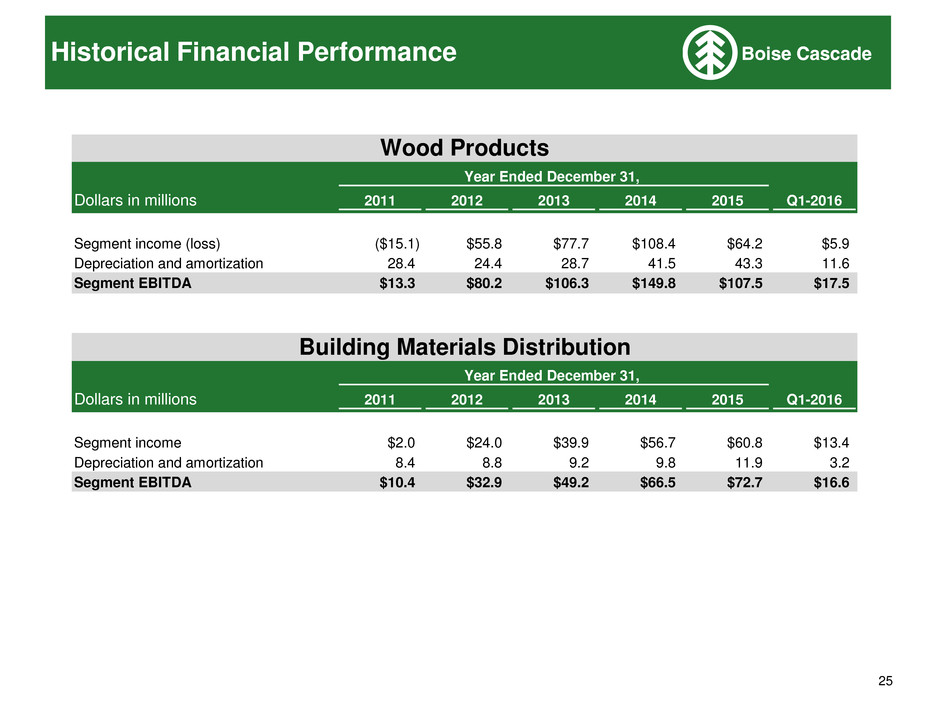
25 Historical Financial Performance Dollars in millions 2011 2012 2013 2014 2015 Q1-2016 Segment income (loss) ($15.1) $55.8 $77.7 $108.4 $64.2 $5.9 Depreciation and amortization 28.4 24.4 28.7 41.5 43.3 11.6 Segment EBITDA $13.3 $80.2 $106.3 $149.8 $107.5 $17.5 Dollars in millions 2011 2012 2013 2014 2015 Q1-2016 Segment income $2.0 $24.0 $39.9 $56.7 $60.8 $13.4 Depreciation and amortization 8.4 8.8 9.2 9.8 11.9 3.2 Segment EBITDA $10.4 $32.9 $49.2 $66.5 $72.7 $16.6 Year Ended December 31, Year Ended December 31, Wood Products Building Materials Distribution
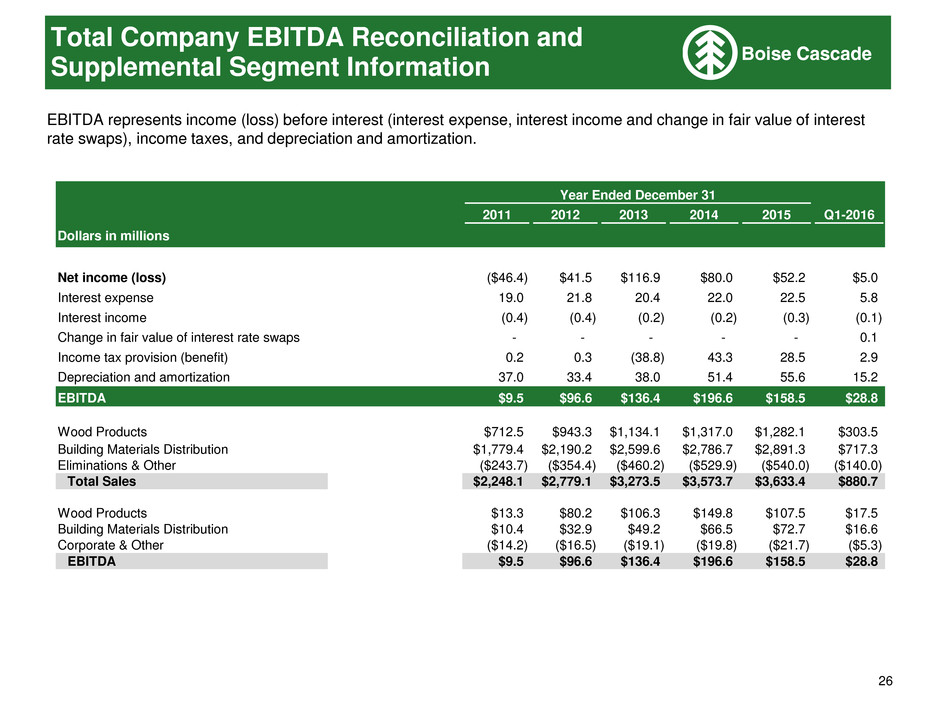
26 EBITDA represents income (loss) before interest (interest expense, interest income and change in fair value of interest rate swaps), income taxes, and depreciation and amortization. Total Company EBITDA Reconciliation and Supplemental Segment Information 2011 2012 2013 2014 2015 Q1-2016 Dollars in millions Net income (loss) ($46.4) $41.5 $116.9 $80.0 $52.2 $5.0 Interest expense 19.0 21.8 20.4 22.0 22.5 5.8 Interest income (0.4) (0.4) (0.2) (0.2) (0.3) (0.1) Change in fair value of interest rate swaps - - - - - 0.1 Income tax provision (benefit) 0.2 0.3 (38.8) 43.3 28.5 2.9 Depreciation and amortization 37.0 33.4 38.0 51.4 55.6 15.2 EBITDA $9.5 $96.6 $136.4 $196.6 $158.5 $28.8 Wood Products $712.5 $943.3 $1,134.1 $1,317.0 $1,282.1 $303.5 Building Materials Distribution $1,779.4 $2,190.2 $2,599.6 $2,786.7 $2,891.3 $717.3 Eli i tions & Other ($243.7) ($354.4) ($460.2) ($529.9) ($540.0) ($140.0) Total Sales $2,248.1 $2,779.1 $3,273.5 $3,573.7 $3,633.4 $880.7 Wood Products $13.3 $80.2 $106.3 $149.8 $107.5 $17.5 Building Materials Distribution $10.4 $32.9 $49.2 $66.5 $72.7 $16.6 Corporate & Other ($14.2) ($16.5) ($19.1) ($19.8) ($21.7) ($5.3) EBITDA $9.5 $96.6 $136.4 $196.6 $158.5 $28.8 Year Ended December 31
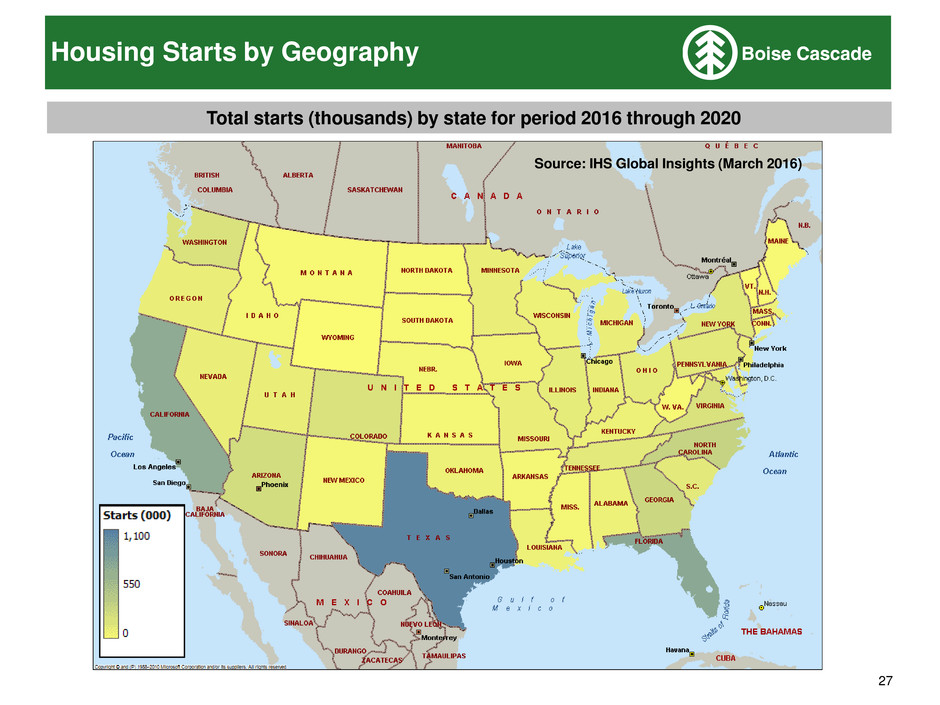
27 Housing Starts by Geography Total starts (thousands) by state for period 2016 through 2020 Source: IHS Global Insights (March 2016)
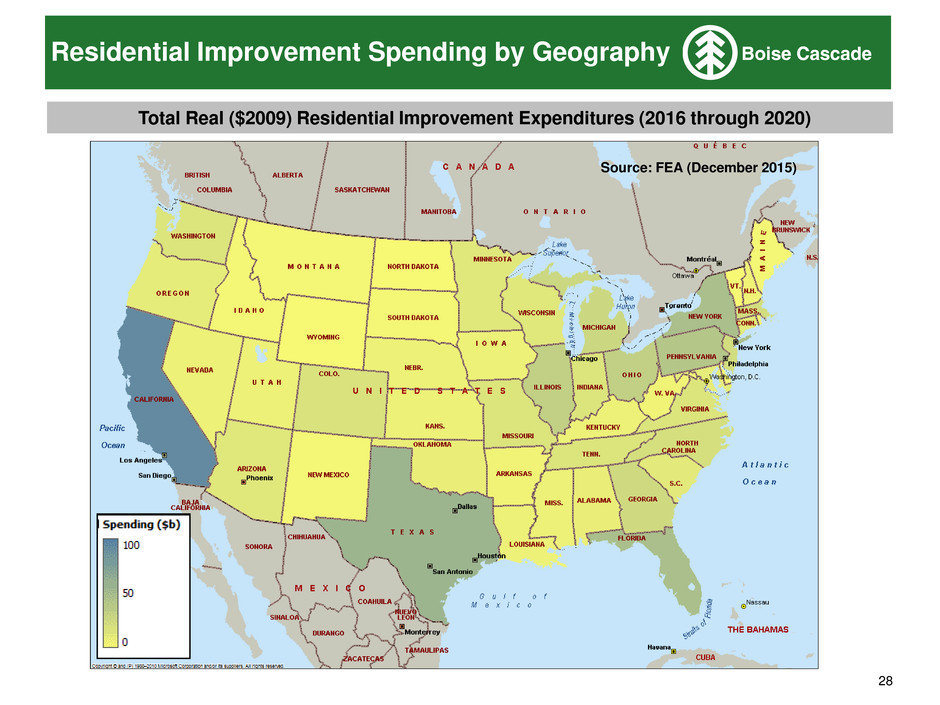
28 Residential Improvement Spending by Geography Total Real ($2009) Residential Improvement Expenditures (2016 through 2020) Source: FEA (December 2015)
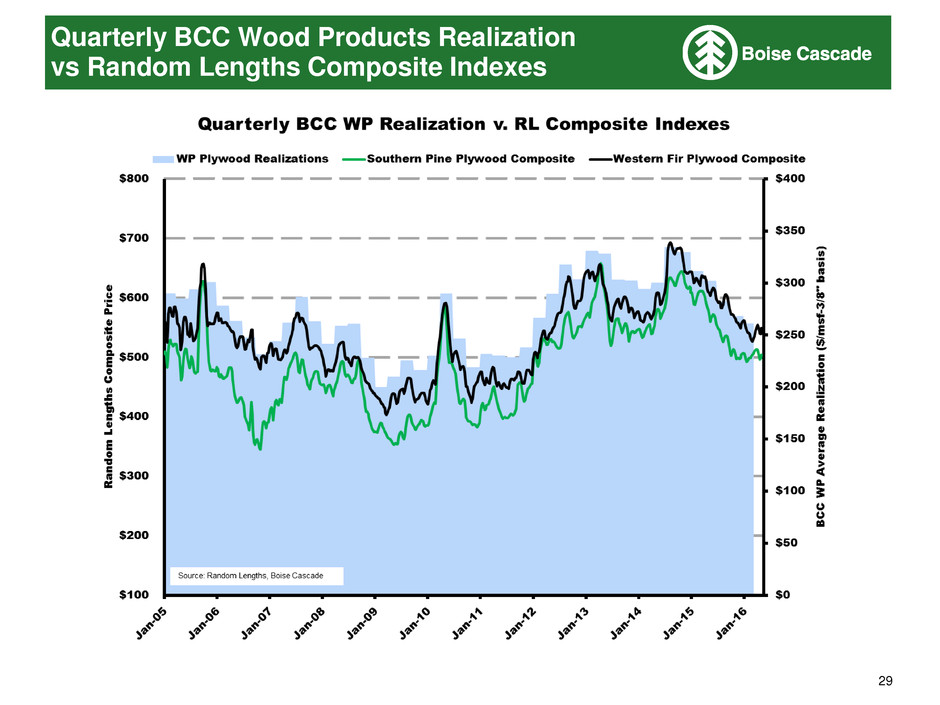
29 Quarterly BCC Wood Products Realization vs Random Lengths Composite Indexes
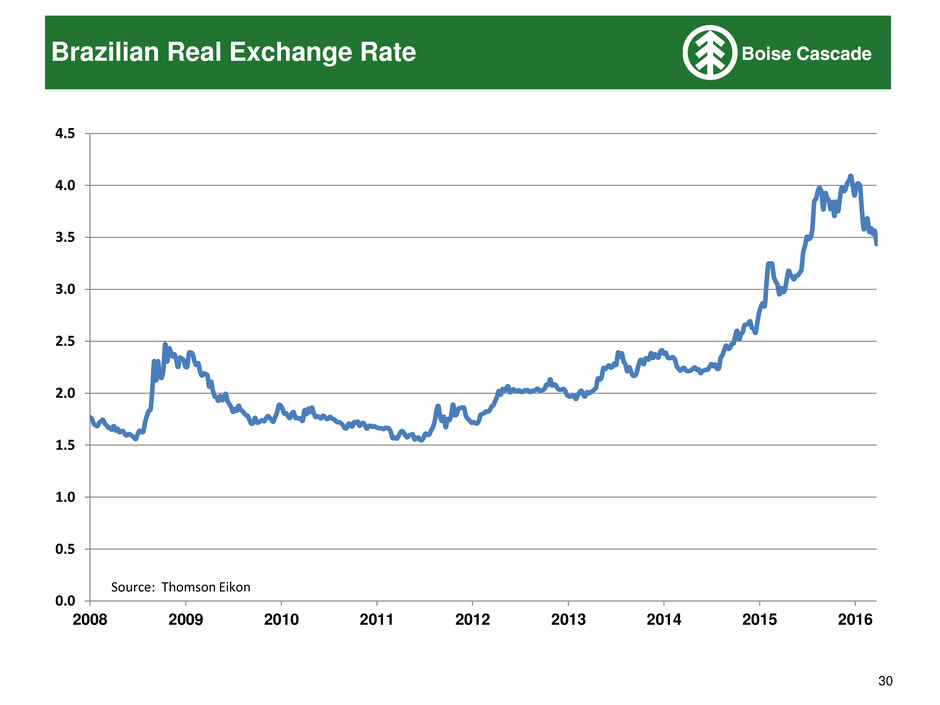
30 Brazilian Real Exchange Rate 0.0 0.5 1.0 1.5 2.0 2.5 3.0 3.5 4.0 4.5 2008 2009 2010 2011 2012 2013 2014 2015 2016 Source: Thomson Eikon
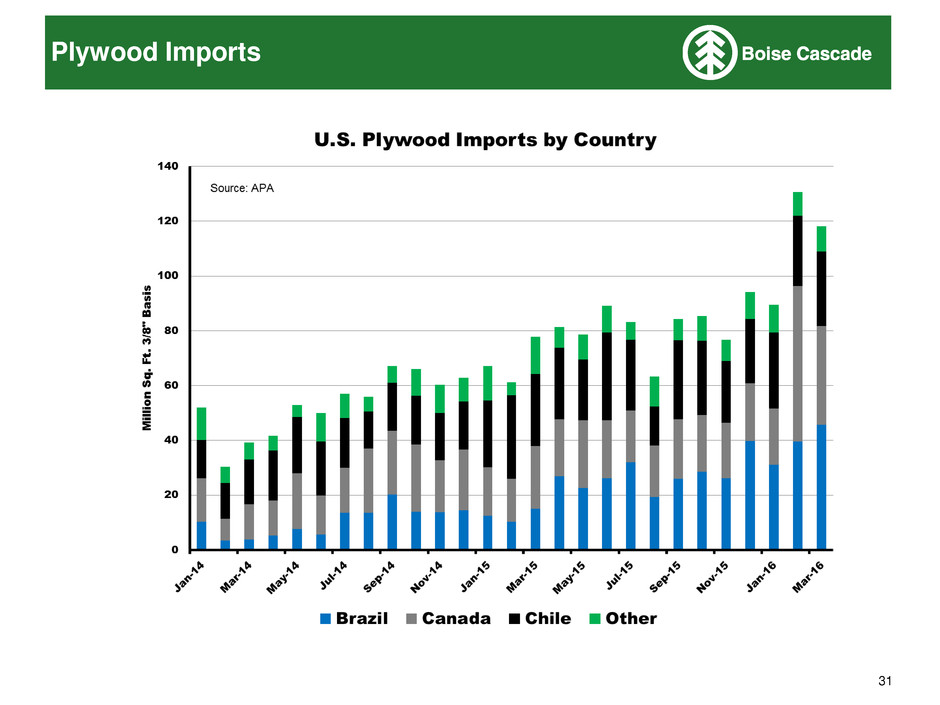
31 Plywood Imports


