UNITED STATES
SECURITIES AND EXCHANGE COMMISSION
Washington, D.C. 20549
FORM 10-Q
(Mark One)
| x | Quarterly Report Pursuant to Section 13 or 15(d) of the Securities Exchange Act of 1934 |
For the Quarterly Period Ended September 30, 2012.
| ¨ | Transition Report Pursuant to Section 13 or 15(d) of the Securities Exchange Act of 1934 |
For the Transition Period From to .
Commission File No. 333-128166-10

Affinia Group Intermediate Holdings Inc.
(Exact name of registrant as specified in its charter)
| | |
| Delaware | | 34-2022081 |
(State or Other Jurisdiction of Incorporation or Organization) | | (I.R.S. Employer Identification No.) |
| | |
| 1101 Technology Drive, Ann Arbor, Michigan | | 48108 |
| (Address of Principal Executive Offices) | | (Zip Code) |
(734) 827-5400
(Registrant’s Telephone Number, Including Area Code)
N/A
(Former Name, Former Address and Former Fiscal Year, if Changed Since Last Report)
Indicate by check mark whether the registrant (1) has filed all reports required to be filed by Section 13 or 15(d) of the Securities Exchange Act of 1934 during the preceding 12 months (or for such shorter period that the registrant was required to file such reports), and (2) has been subject to such filing requirements for the past 90 days. Yes ¨ No x
(Note: As a voluntary filer not subject to the filing requirements of Section 13 or 15(d) of the Exchange Act, the registrant has filed all reports required to be filed by Section 13 or 15(d) of the Exchange Act during the preceding 12 months (or for such shorter period that the registrant would have been required to file such reports) as if it were subject to such filing requirements).
Indicate by check mark whether the registrant has submitted electronically and posted on its corporate Web site, if any, every Interactive Data File required to be submitted and posted pursuant to Rule 405 of Regulation S-T (§232.405 of this chapter) during the preceding 12 months (or for such shorter period that the registrant was required to submit and post such files). Yes x No ¨
Indicate by check mark whether the registrant is a large accelerated filer, an accelerated filer, a non-accelerated filer, or a smaller reporting company. See the definitions of “large accelerated filer,” “accelerated filer” and “smaller reporting company” in Rule 12b-2 of the Exchange Act.
| | | | | | |
| Large accelerated filer | | ¨ | | Accelerated filer | | ¨ |
| Non-accelerated filer | | x (Do not check if a smaller reporting company) | | Smaller reporting company | | ¨ |
Indicate by check mark whether the registrant is a shell company (as defined in Rule 12b-2 of the Exchange Act). Yes ¨ No x
There were 1,000 shares outstanding of the registrant’s common stock as of November 13, 2012 (all of which are privately owned and not traded on a public market).
Index
Affinia Group Intermediate Holdings Inc.
2
CAUTIONARY NOTE REGARDING FORWARD-LOOKING STATEMENTS
This report includes “forward-looking statements” within the meaning of Section 27A of the Securities Act of 1933, as amended (the “Securities Act”) and Section 21E of the Securities Exchange Act of 1934, as amended (the “Exchange Act”). These forward-looking statements may include comments concerning our plans, objectives, goals, strategies, future events, future revenue or performance, capital expenditures, financing needs, plans or intentions relating to acquisitions, business trends and other information that is not historical. When used in this report, the words “anticipates,” “believes,” “estimates,” “expects,” “forecasts,” “intends,” “plans,” “projects,” or future or conditional verbs, such as “could,” “may,” “should,” or “will,” and variations of such words or similar expressions are intended to identify forward-looking statements. All forward-looking statements, including, without limitation, management’s examination of historical operating trends and data are based upon our current expectations and various assumptions. Our expectations, beliefs and projections are expressed in good faith and we believe there is a reasonable basis for them. However, there is no assurance that these expectations, beliefs and projections will be achieved. For a more detailed discussion of these risks and uncertainties, see Part I, “Item 1A. Risk Factors” in our Annual Report on form 10-K for the year ended December 31, 2011. With respect to all forward-looking statements, we claim the protection of the safe harbor for forward-looking statements contained in the Private Securities Litigation Reform Act of 1995.
There are a number of risks and uncertainties that could cause our actual results to differ materially from the forward-looking statements contained in this report. Such risks, uncertainties and other important factors include, among others, continued volatility in and disruption to the global economy and the resulting impact on the availability and cost of credit; financial viability of key customers and key suppliers; our dependence on our largest customers; increased crude oil and gasoline prices and resulting reductions in global demand for the use of automobiles; the shift in demand from premium to economy products; pricing and pressures from imports; increasing costs for manufactured components, raw materials and energy prices; the expansion of return policies or the extension of payment terms; risks associated with our non-U.S. operations; risks related to our receivables factoring arrangements; product liability and warranty and recall claims brought against us; reduced inventory levels by our distributors resulting from consolidation and increased efficiency; environmental and automotive safety regulations; the availability of raw materials, manufactured components or equipment from our suppliers; challenges to our intellectual property portfolio; our ability to develop improved products; the introduction of improved products and services that extend replacement cycles otherwise reduce demand for our products; our ability to achieve cost savings from our restructuring plans; work stoppages, labor disputes or similar difficulties that could significantly disrupt our operations; our ability to successfully combine our operations with any businesses we have acquired or may acquire; our ability to successfully effect dispositions of existing lines of business; our ability to successfully complete divestitures without significant business disruptions, including potential sale of the Brake North America and Asia operations; risk of impairment charges to our long-lived assets; risk of impairment to intangibles and goodwill; the risk of business disruptions related to a variety of events or conditions including natural and man-made disasters; risks associated with foreign exchange rate fluctuations; risks associated with our expansion into new markets; the impact on our tax rate resulting from the mix of our profits and losses in various jurisdictions; reductions in the value of our deferred tax assets; difficulties in developing, maintaining or upgrading information technology systems; risks associated with doing business in corrupting environments; our substantial leverage and limitations on flexibility in operating our business contained in our debt agreements. Additionally, there may be other factors that could cause our actual results to differ materially from the forward-looking statements. Our forward-looking statements are only as of the date of this report or as of the date they are made and we undertake no obligation to update forward-looking statements.
3
PART I
FINANCIAL INFORMATION
| Item 1. | Financial Statements |
Affinia Group Intermediate Holdings Inc.
Unaudited Condensed Consolidated Statements of Operations
| | | | | | | | | | | | | | | | |
(Dollars in millions) | | Three Months
Ended
September 30,
2011 | | | Three Months
Ended
September 30,
2012 | | | Nine Months
Ended
September 30,
2011 | | | Nine Months
Ended
September 30,
2012 | |
Net sales | | $ | 380 | | | $ | 375 | | | $ | 1,134 | | | $ | 1,112 | |
Cost of sales | | | (289 | ) | | | (287 | ) | | | (870 | ) | | | (858 | ) |
| | | | | | | | | | | | | | | | |
Gross profit | | | 91 | | | | 88 | | | | 264 | | | | 254 | |
Selling, general and administrative expenses | | | (49 | ) | | | (50 | ) | | | (152 | ) | | | (148 | ) |
| | | | | | | | | | | | | | | | |
Operating profit | | | 42 | | | | 38 | | | | 112 | | | | 106 | |
Loss on extinguishment of debt | | | — | | | | — | | | | — | | | | (1 | ) |
Other income, net | | | 2 | | | | 2 | | | | 1 | | | | 2 | |
Interest expense | | | (17 | ) | | | (16 | ) | | | (51 | ) | | | (48 | ) |
| | | | | | | | | | | | | | | | |
Income from continuing operations before income tax provision, equity in income and noncontrolling interest | | | 27 | | | | 24 | | | | 62 | | | | 59 | |
Income tax provision | | | (7 | ) | | | (10 | ) | | | (16 | ) | | | (24 | ) |
Equity in income, net of tax | | | — | | | | 1 | | | | — | | | | 1 | |
| | | | | | | | | | | | | | | | |
Net income from continuing operations | | | 20 | | | | 15 | | | | 46 | | | | 36 | |
Loss from discontinued operations, net of tax | | | (1 | ) | | | (10 | ) | | | (14 | ) | | | (57 | ) |
| | | | | | | | | | | | | | | | |
Net income (loss) | | | 19 | | | | 5 | | | | 32 | | | | (21 | ) |
Less: net income attributable to noncontrolling interest, net of tax | | | — | | | | 1 | | | | 1 | | | | 1 | |
| | | | | | | | | | | | | | | | |
Net income (loss) attributable to the Company | | $ | 19 | | | $ | 4 | | | $ | 31 | | | $ | (22 | ) |
| | | | | | | | | | | | | | | | |
The accompanying notes are an integral part of the unaudited condensed consolidated financial statements.
4
Affinia Group Intermediate Holdings Inc.
Unaudited Condensed Consolidated Statements of Comprehensive Income
| | | | | | | | | | | | | | | | |
(Dollars in millions) | | Three Months
Ended
September 30,
2011 | | | Three Months
Ended
September 30,
2012 | | | Nine Months
Ended
September 30,
2011 | | | Nine Months
Ended
September 30,
2012 | |
Net income (loss) | | $ | 19 | | | $ | 5 | | | $ | 32 | | | $ | (21 | ) |
Other comprehensive income (loss), net of tax: | | | | | | | | | | | | | | | | |
Change in foreign currency translation adjustments | | | (49 | ) | | | 11 | | | | (26 | ) | | | — | |
| | | | | | | | | | | | | | | | |
Total other comprehensive income (loss) | | | (49 | ) | | | 11 | | | | (26 | ) | | | — | |
| | | | | | | | | | | | | | | | |
Total comprehensive income (loss) | | | (30 | ) | | | 16 | | | | 6 | | | | (21 | ) |
Less: comprehensive income attributable to noncontrolling interest, net of tax | | | — | | | | 1 | | | | 1 | | | | 1 | |
| | | | | | | | | | | | | | | | |
Comprehensive income (loss) attributable to the Company | | $ | (30 | ) | | $ | 15 | | | $ | 5 | | | $ | (22 | ) |
| | | | | | | | | | | | | | | | |
The accompanying notes are an integral part of the unaudited condensed consolidated financial statements.
5
Affinia Group Intermediate Holdings Inc.
Unaudited Condensed Consolidated Balance Sheets
| | | | | | | | |
(Dollars in millions) | | December 31,
2011 | | | September 30,
2012 | |
Assets | | | | | | | | |
Current assets: | | | | | | | | |
Cash and cash equivalents | | $ | 54 | | | $ | 49 | |
Trade accounts receivable, less allowances of $1 million for 2011 and 2012 | | | 211 | | | | 190 | |
Inventories, net | | | 276 | | | | 304 | |
Current deferred taxes | | | 60 | | | | 67 | |
Prepaid taxes | | | 21 | | | | 28 | |
Other current assets | | | 22 | | | | 25 | |
Current assets of discontinued operations | | | 416 | | | | 359 | |
| | | | | | | | |
Total current assets | | | 1,060 | | | | 1,022 | |
Property, plant, and equipment, net | | | 118 | | | | 118 | |
Goodwill | | | 28 | | | | 24 | |
Other intangible assets, net | | | 94 | | | | 89 | |
Deferred financing costs | | | 18 | | | | 16 | |
Deferred income taxes | | | 109 | | | | 114 | |
Investments and other assets | | | 32 | | | | 27 | |
| | | | | | | | |
Total assets | | $ | 1,459 | | | $ | 1,410 | |
| | | | | | | | |
Liabilities and shareholder’s equity | | | | | | | | |
Current liabilities: | | | | | | | | |
Accounts payable | | $ | 126 | | | $ | 157 | |
Notes payable | | | 20 | | | | 27 | |
Other accrued expenses | | | 80 | | | | 85 | |
Accrued payroll and employee benefits | | | 10 | | | | 25 | |
Current liabilities of discontinued operations | | | 183 | | | | 180 | |
| | | | | | | | |
Total current liabilities | | | 419 | | | | 474 | |
Long-term debt | | | 678 | | | | 606 | |
Deferred employee benefits and other noncurrent liabilities | | | 15 | | | | 7 | |
| | | | | | | | |
Total liabilities | | | 1,112 | | | | 1,087 | |
| | | | | | | | |
Contingencies and commitments | | | | | | | | |
Common stock, $.01 par value, 1,000 shares authorized, issued and outstanding | | | — | | | | — | |
Additional paid-in capital | | | 458 | | | | 455 | |
Accumulated deficit | | | (130 | ) | | | (152 | ) |
Accumulated other comprehensive income | | | 6 | | | | 6 | |
| | | | | | | | |
Total shareholder’s equity of the Company | | | 334 | | | | 309 | |
Noncontrolling interest in consolidated subsidiaries | | | 13 | | | | 14 | |
| | | | | | | | |
Total shareholder’s equity | | | 347 | | | | 323 | |
| | | | | | | | |
Total liabilities and shareholder’s equity | | $ | 1,459 | | | $ | 1,410 | |
| | | | | | | | |
The accompanying notes are an integral part of the unaudited condensed consolidated financial statements.
6
Affinia Group Intermediate Holdings Inc.
Unaudited Condensed Consolidated Statements of Cash Flows
| | | | | | | | |
(Dollars in millions) | | Nine Months
Ended
September 30,
2011 | | | Nine Months
Ended
September 30,
2012 | |
Operating activities | | | | | | | | |
Net income (loss) | | $ | 32 | | | $ | (21 | ) |
Adjustments to reconcile net income (loss) to net cash provided by (used in) operating activities: | | | | | | | | |
Depreciation and amortization | | | 29 | | | | 17 | |
Impairment of assets | | | 1 | | | | 88 | |
Stock-based compensation | | | 1 | | | | — | |
Loss on extinguishment of debt | | | — | | | | 1 | |
Provision for deferred income taxes | | | (2 | ) | | | (37 | ) |
Change in trade accounts receivable | | | (23 | ) | | | (8 | ) |
Change in inventories | | | (29 | ) | | | (13 | ) |
Change in other current operating assets | | | (40 | ) | | | (2 | ) |
Change in other current operating liabilities | | | 5 | | | | 50 | |
Change in other | | | — | | | | 13 | |
| | | | | | | | |
Net cash provided by (used in) operating activities | | $ | (26 | ) | | $ | 88 | |
| | |
Investing activities | | | | | | | | |
Proceeds from sales of assets | | $ | 3 | | | $ | 4 | |
Change in restricted cash | | | 4 | | | | 1 | |
Additions to property, plant and equipment | | | (40 | ) | | | (19 | ) |
Other investing activities | | | 4 | | | | — | |
| | | | | | | | |
Net cash used in investing activities | | $ | (29 | ) | | $ | (14 | ) |
| | |
Financing activities | | | | | | | | |
Net decrease in other short-term debt | | $ | (11 | ) | | $ | (4 | ) |
Payments of other debt | | | (8 | ) | | | (2 | ) |
Proceeds from other debt | | | 20 | | | | — | |
Repayment on Secured Notes | | | — | | | | (23 | ) |
Capital contribution | | | 2 | | | | — | |
Net proceeds from (payments of) ABL Revolver | | | 80 | | | | (50 | ) |
| | | | | | | | |
Net cash provided by (used in) financing activities | | | 83 | | | | (79 | ) |
Effect of exchange rates on cash | | | (5 | ) | | | — | |
Increase (decrease) in cash and cash equivalents | | | 23 | | | | (5 | ) |
Cash and cash equivalents at beginning of the period | | | 55 | | | | 54 | |
| | | | | | | | |
Cash and cash equivalents at end of the period | | $ | 78 | | | $ | 49 | |
| | | | | | | | |
| | |
Supplemental cash flows information | | | | | | | | |
Cash paid during the period for: | | | | | | | | |
Interest | | $ | 44 | | | $ | 42 | |
Income taxes | | $ | 20 | | | $ | 16 | |
Noncash investing and financing activities: | | | | | | | | |
Additions to property, plant and equipment included in accounts payable | | $ | 3 | | | $ | 1 | |
The accompanying notes are an integral part of the unaudited condensed consolidated financial statements.
7
Affinia Group Intermediate Holdings Inc.
Notes to Unaudited Condensed Consolidated Financial Statements
Note 1. Description of Business
Affinia Group Intermediate Holdings Inc. is a global leader in the commercial and light vehicle replacement products and services industry. We derive approximately 99% of our sales from this industry. We design, manufacture, distribute and market a broad range of filtration, chassis, brake and other products in North America, Europe, South America, and Asia and generate sales in over 70 countries. We market our products under a variety of well known brands including WIX®, Raybestos®, FiltronTM, Nakata®, McQuay-Norris® and ecoLAST®. Additionally, we provide private label products to large distributors, such as NAPA®, CARQUEST® and ACDelco®. We are controlled by affiliates of The Cypress Group L.L.C (collectively, “Cypress”).
Affinia Group Inc., the Company’s direct, wholly-owned subsidiary and a Delaware corporation formed on June 28, 2004, entered into a stock and asset purchase agreement on November 30, 2004, as amended, with Dana Corporation, which provided for the acquisition by Affinia Group Inc. of substantially all of Dana Corporation’s aftermarket business operations (the “Acquisition”).
The accompanying Unaudited Condensed Consolidated Financial Statements include the accounts of the Company and its subsidiaries. In these Notes to the Unaudited Condensed Consolidated Financial Statements, the terms “the Company,” “we,” “our” and “us” refer to Affinia Group Intermediate Holdings Inc. and its subsidiaries on a consolidated basis.
Note 2. Summary of Significant Accounting Policies
Basis of Presentation
The interim financial information is prepared in conformity with accounting principles generally accepted in the United States of America (“U.S. GAAP”), and such principles are applied on a basis consistent with information reflected in our Form 10-K for the year ended December 31, 2011 filed with the Securities and Exchange Commission (“SEC”). Certain information and footnote disclosures normally included in financial statements prepared in accordance with U.S. GAAP have been condensed or omitted pursuant to the rules and regulations promulgated by the SEC. In the opinion of management, the interim financial information includes all adjustments and accruals, consisting only of normal recurring adjustments, which are necessary for a fair presentation of results for the respective interim period.
Principles of Consolidation
In accordance with Accounting Standards Codification (“ASC”) Topic 810, “Consolidation,” the consolidated financial statements include the accounts of Affinia Group Intermediate Holdings Inc. and its wholly-owned subsidiaries and majority-owned subsidiaries. All intercompany transactions have been eliminated. Equity investments in which we exercise significant influence but do not control are accounted for using the equity method. Investments in which we are not able to exercise significant influence over the investee are accounted for under the cost method.
Note 3. New Accounting Pronouncements
Adopted Accounting Pronouncements
In June 2011, the Financial Accounting Standards Board (the “FASB”) amended ASC 220, “Comprehensive Income” with ASU 2011-05, “Comprehensive Income (Topic 220) – Presentation of Comprehensive Income,” which revises the manner in which comprehensive income is presented in an entity’s financial statements. This update requires the presentation of the components of comprehensive income in either a continuous statement of comprehensive income or in two separate but consecutive financial statements. The option to present comprehensive income on the statement of stockholders’ equity has been eliminated. The provisions of this update are effective for fiscal years, and interim periods within those years, beginning after December 15, 2011. We adopted ASU 2011-05 for the quarter ending March 31, 2012 and retrospectively for the quarter ending March 31, 2011. The implementation of this update resulted in presentation changes only.
In September 2011, the FASB amended ASC 350, “Intangibles – Goodwill and Other” with ASU 2011-08, “Intangibles – Goodwill and Other (Topic 350): Testing Goodwill for Impairment.” Under the revised guidance, entities testing goodwill for impairment have the option of performing a qualitative assessment before calculating the fair value of a reporting unit in step 1 of the goodwill impairment test. If entities determine, on the basis of qualitative factors, that the fair value of a reporting unit is not more likely than not less than the carrying amount, the two-step impairment test would not be required. Otherwise, further testing would be needed. The amendments are effective for all entities for annual and interim goodwill impairment tests performed for fiscal years beginning after December 15, 2011. We adopted ASU 2011-08 for the fiscal year ending December 31, 2011 because early adoption was permitted.
8
Accounting Pronouncements Not Yet Adopted
In July 2012, the FASB amended ASC 350, “Intangibles – Goodwill and Other” with ASU 2012-02, “Intangibles – Goodwill and Other (Topic 350): Testing Indefinite-lived Intangible Assets for Impairment.” Under the revised guidance, an organization has the option to first assess qualitative factors to determine whether it is necessary to perform the quantitative impairment test. An organization electing to perform a qualitative assessment is no longer required to calculate the fair value of an indefinite-lived intangible asset unless the organization determines, based on a qualitative assessment, that it is “more likely than not” that the asset is impaired. The guidance is effective for impairment tests for fiscal years beginning after September 15, 2012. Earlier application is permitted for us prior to the issuance of our upcoming annual or interim filings.
Note 4. Discontinued Operation – Brake
In the fourth quarter of 2011, we committed to a plan to sell the Brake North America and Asia group. In accordance with ASC Topic 205-20,“Presentation of Financial Statements – Discontinued Operations,” the Brake North America and Asia group qualified as a discontinued operation. The consolidated statements of operations, consolidated statements of comprehensive income and consolidated balance sheets for all periods presented have been adjusted to reflect this group as a discontinued operation. The consolidated statements of cash flows for all periods presented were not adjusted to reflect this group as a discontinued operation. The table below summarizes the Brake North America and Asia group’s net sales, loss before income tax provision, income tax provision, loss from discontinued operations, net of tax, net income attributable to noncontrolling interest, net of tax and loss attributable to the discontinued operations.
| | | | | | | | | | | | | | | | |
(Dollars in millions) | | Three Months
Ended
September 30,
2011 | | | Three Months
Ended
September 30,
2012 | | | Nine Months
Ended
September 30,
2011 | | | Nine Months
Ended
September 30,
2012 | |
Net sales | | $ | 177 | | | $ | 159 | | | $ | 490 | | | $ | 480 | |
Loss before income tax provision | | | (1 | ) | | | (19 | ) | | | (20 | ) | | | (91 | ) |
Income tax benefit | | | — | | | | 9 | | | | 6 | | | | 34 | |
| | | | | | | | | | | | | | | | |
Loss from discontinued operations, net of tax | | | (1 | ) | | | (10 | ) | | | (14 | ) | | | (57 | ) |
Less: net income attributable to noncontrolling interest, net of tax | | | — | | | | 1 | | | | 1 | | | | 1 | |
| | | | | | | | | | | | | | | | |
Loss attributable to the discontinued operations | | $ | (1 | ) | | $ | (11 | ) | | $ | (15 | ) | | $ | (58 | ) |
| | | | | | | | | | | | | | | | |
We entered into an Asset Purchase Agreement with Carter Automotive Company Inc. (“Carter”) on June 28, 2012, pursuant to which Carter purchased certain assets located in our Juarez, Mexico facility, which is included in our Brake North America and Asia group, for $2.5 million. The transaction resulted in an impairment and loss on sale of $6 million on fixed assets and inventory for the second quarter of 2012.
The Company determined at the end of 2011 and September 2012 that the net carrying value of the Brake North America and Asia group may not be recoverable through the sales process. At the end of 2011, the fair value of the Brake North America and Asia group assets held for sale were determined based on current market data, discounted cash flow model and observable valuation multiples for comparable companies. As a result, an impairment charge of $165 million was recorded within discontinued operations in 2011 to reduce the carrying value of the business to expected realizable value. A tax benefit to the Company of $57 million was recorded in 2011 relating to the impairment.
As of September 30, 2012, the estimate of fair value of the Brake North America and Asia group was updated based on current market data, which resulted in an impairment of $88 million for the first nine months of 2012. The loss on discontinued operations before income tax provision for the first nine months of 2012 is $91 million and is comprised of the $88 million impairment and an operational loss of $3 million. The income tax benefit related to discontinued operations was $34 million, which included a $32 million tax benefit related to the impairment.
9
The following table shows an analysis of assets and liabilities held for sale:
| | | | | | | | |
(Dollars in millions) | | December 31,
2011 | | | September 30,
2012 | |
Restricted cash | | $ | 7 | | | $ | 6 | |
Accounts receivable | | | 75 | | | | 102 | |
Inventory | | | 221 | | | | 203 | |
Current deferred taxes | | | 4 | | | | 8 | |
Prepaid taxes | | | 51 | | | | 36 | |
Other current assets | | | 7 | | | | 13 | |
Property, plant and equipment | | | 122 | | | | 124 | |
Goodwill | | | 25 | | | | 25 | |
Other intangible assets | | | 53 | | | | 53 | |
Deferred income taxes | | | 7 | | | | 31 | |
Other assets | | | 9 | | | | 11 | |
Impairment of assets | | | (165 | ) | | | (253 | ) |
| | | | | | | | |
Total assets of discontinued operations | | $ | 416 | | | $ | 359 | |
| | | | | | | | |
Accounts payable | | $ | 59 | | | $ | 64 | |
Notes payable | | | 20 | | | | 11 | |
Other accrued expenses | | | 82 | | | | 76 | |
Accrued payroll and employee benefits | | | 14 | | | | 16 | |
Deferred employee benefits and other noncurrent liabilities | | | 8 | | | | 13 | |
| | | | | | | | |
Total liabilities of discontinued operations | | $ | 183 | | | $ | 180 | |
| | | | | | | | |
Note 5. Derivatives
The Company’s financial derivative assets and liabilities consist of standard currency forward contracts. The fair value framework requires the categorization of assets and liabilities into three levels based upon the assumptions (inputs) used to price the assets or liabilities. Level 1 provides the most reliable measure of fair value, whereas Level 3 generally requires significant management judgment. The three levels are defined as follows:
| | • | | Level 1: Unadjusted quoted prices in active markets for identical assets and liabilities. |
| | • | | Level 2: Observable inputs other than those included in Level 1. For example, quoted prices for similar assets or liabilities in active markets or quoted prices for identical assets or liabilities in inactive markets. |
| | • | | Level 3: Unobservable inputs reflecting management’s own assumptions about the inputs used in pricing the asset or liability. |
All derivative instruments are recognized on our balance sheet at fair value. The fair value measurements of our currency derivatives are based upon Level 2 inputs consisting of observable market data pertaining to relevant currency exchange rates, as reported by a recognized independent third-party financial information provider. Based upon the Company’s periodic assessment of our own creditworthiness and that of the counterparties to our derivative instruments’ fair value measurements are not adjusted for nonperformance risk.
Currency Rate Derivatives
Our currency derivative contracts are valued using then-current spot and forward market data as provided by external financial institutions. We enter into short-term hedging transactions with banking institutions of only the highest tiered credit ratings, and thus the counterparty credit risk associated with these contracts is not considered significant.
Our currency derivatives are undesignated hedges of specific net monetary asset balances subject to currency revaluation. Changes in the fair value of these hedging transactions are recognized in income each accounting period. At September 30, 2012, the aggregate notional amount of our currency derivatives was $80 million having a fair market value of less than $1 million in assets and $1 million in liabilities.
The Company’s outstanding currency forward contracts are recorded in the Consolidated Balance Sheets as “Other current assets” or “Other accrued expenses,” accordingly. Currency derivative gains and losses are recognized in “Other income, net” in the Consolidated Statements of Operations in the reporting period of occurrence. The Company has not recorded currency derivative gains (losses) to other comprehensive income nor has it reclassified prior period currency derivative results from other comprehensive income to earning during the last twelve months. The Company does not anticipate that it will record any currency derivative gains or losses to other comprehensive income or that it will reclassify prior period currency derivative results from other comprehensive income to earnings in the next twelve months.
10
The notional amount and fair value of our outstanding currency forward contracts were as follows:
| | | | | | | | | | | | |
(Dollars in millions) | | Notional Amount | | | Asset Derivative | | | Liability Derivative | |
As of September 30, 2012 | | $ | 80 | | | $ | — | | | $ | 1 | |
As of December 31, 2011 | | $ | 62 | | | $ | 1 | | | $ | — | |
Currency derivative gains and losses are recognized in “Other income, net” in the Consolidated Statements of Operations in the reporting period of occurrence. The short-term currency exchange rate forward contracts are intended to offset the currency exchange gain or loss related to the re-measurement process. The currency gains and losses are as follows:
| | | | | | | | | | | | | | | | |
(Dollars in millions) | | Three Months
Ended
September 30,
2011 | | | Three Months
Ended
September 30,
2012 | | | Nine Months
Ended
September 30,
2011 | | | Nine Months
Ended
September 30,
2012 | |
Gain (loss) on derivative instruments | | $ | (4 | ) | | $ | 2 | | | $ | (2 | ) | | $ | 2 | |
Note 6. Debt
Our debt consists of notes that are publicly traded, an ABL revolver and other short-term borrowings. The fair value framework requires the categorization of our debt into three levels based upon the assumptions (inputs) used to determine fair value. The fair value of debt and the categorization of the hierarchy level of fair value, net of discount, is as follows:
Fair Value of Debt at December 31, 2011
| | | | | | | | | | | | |
(Dollars in millions) | | Book Value
of Debt | | | Fair Value
Factor | | | Fair Value
of Debt | |
Senior subordinated notes, due November 2014(1) | | $ | 367 | | | | 99.69 | % | | $ | 366 | |
Senior secured notes, due August 2016(1) | | | 201 | | | | 109.06 | % | | | 219 | |
ABL revolver, due November 2015(2) | | | 110 | | | | 100 | % | | | 110 | |
Other debt(2) (3) | | | 20 | | | | 100 | % | | | 20 | |
| | | | | | | | | | | | |
Total fair value of debt at December 31, 2011(3) | | | | | | | | | | $ | 715 | |
| | | | | | | | | | | | |
Fair Value of Debt at September 30, 2012
| | | | | | | | | | | | |
(Dollars in millions) | | Book Value
of Debt | | | Fair Value
Factor | | | Fair Value
of Debt | |
Senior subordinated notes, due November 2014(1) | | $ | 367 | | | | 100.81 | % | | $ | 370 | |
Senior secured notes, due August 2016(1) | | | 179 | | | | 108.44 | % | | | 194 | |
ABL revolver, due May 2017(2) | | | 60 | | | | 100 | % | | | 60 | |
Other debt(2) (3) | | | 27 | | | | 100 | % | | | 27 | |
| | | | | | | | | | | | |
Total fair value of debt at September 30, 2012(3) | | | | | | | | | | $ | 651 | |
| | | | | | | | | | | | |
| (1) | The fair value of the long-term debt was estimated based on quoted market prices obtained through broker or pricing services and categorized within Level 2 of the hierarchy. The fair value of our debt that is publicly traded in the secondary market is classified as Level 2 and is based on current market yields obtained through broker or pricing services. |
| (2) | The carrying value of fixed rate short-term debt and the debt included in discontinued operations approximates fair value because of the short term nature of these instruments, and the carrying value of the Company’s current floating rate debt instruments approximates fair value because of the variable interest rates pertaining to those instruments. The fair value of debt is categorized within Level 2 of the hierarchy. |
| (3) | The debt as of December 31, 2011 and September 30, 2012 excludes $20 million and $11 million, respectively, of notes payable in our Brake North America and Asia group, which is classified in current liabilities of discontinued operations. |
11
On May 22, 2012, Affinia Group Inc. entered into the Omnibus Fourth Amendment to ABL Credit Agreement and Other Credit Documents (the “ABL Amendment”) among the Company, Affinia Group Inc., certain of the Company’s U.S. subsidiaries, certain of the Company’s Canadian subsidiaries, the lenders party thereto, Bank of America, N.A., as the administrative agent, and the other agents party thereto. As amended by the ABL Amendment, the asset-based revolving credit facility (the “ABL Revolver”) includes (i) a revolving credit facility of up to $300 million (which may be increased or decreased in accordance with the reallocation provisions of the ABL Revolver) for borrowings solely to the U.S. domestic borrowers, including (a) a $40 million sub-limit for letters of credit and (b) a $30 million swingline facility and (ii) a revolving credit facility of up to $15 million (which may be increased or decreased in accordance with the reallocation provisions of the ABL Revolver, but in no event to exceed $25 million) for Canadian Dollar denominated revolving loans solely to a Canadian borrower. Availability under the ABL Revolver is based upon monthly (or more frequent under certain circumstances) borrowing base valuations of the Company’s eligible inventory and accounts receivable and is reduced by certain reserves in effect from time to time.
In addition, under the ABL Revolver, a financial covenant exists which would be triggered if excess availability under the ABL Revolver is less than (i) with respect to periods prior to the sale of all or substantially all of the ABL priority collateral of the consolidated U.S. and Canadian brake operations of the Company and the guarantors, the greater of 10.0% of the total revolving loan commitments and $31.5 million or (ii) with respect to periods after the sale of all or substantially all of the ABL priority collateral of the consolidated U.S. and Canadian brake operations of the Company and the guarantors, the greater of 10.0% of the total borrowing base and $20.0 million. If the covenant trigger were to occur, we would be required to satisfy and maintain a fixed charge coverage ratio of at least 1.00x, measured for the last twelve-month period. As of November 13, 2012, none of the covenant triggers have occurred. The fixed charge coverage ratio was 1.79x as of September 30, 2012. The impact of falling below the fixed charge coverage ratio would not be a default but instead the imposition of restrictions on our ability to pursue certain operational or financial transactions (e.g. asset dispositions, dividends and acquisitions).
On June 25, 2012, Affinia Group Inc. redeemed $22.5 million aggregate principal amount of the Secured Notes pursuant to their terms at a redemption price equal to 103% of the principal amount of such notes being redeemed, plus accrued and unpaid interest to the redemption date.
During the second quarter of 2012, we recorded a write-off of less than $1 million to interest expense for unamortized deferred financing costs associated with the redemption of $22.5 million of the Secured Notes. Additionally, we recorded $1 million in total deferred financing costs related to the amendment of our ABL Revolver.
Note 7. Inventories, net
Inventories are valued at the lower of cost or market. Cost is determined on the FIFO basis for all domestic inventories or average cost basis for non-U.S. inventories. Inventories are reduced by an adjustment for slow-moving and obsolete inventories based on management’s review of on-hand inventories compared to historical and estimated future sales and usage. A summary of inventories, net is provided in the table below:
| | | | | | | | |
(Dollars in millions) | | At December 31,
2011(1) | | | At September 30,
2012(1) | |
Raw materials | | $ | 68 | | | $ | 74 | |
Work-in-process | | | 19 | | | | 16 | |
Finished goods | | | 189 | | | | 214 | |
| | | | | | | | |
| | $ | 276 | | | $ | 304 | |
| | | | | | | | |
| (1) | The inventory as of December 31, 2011 and September 30, 2012 excludes $221 million and $203 million, respectively, of inventory in our Brake North America and Asia group, which is classified in current assets of discontinued operations. |
Note 8. Goodwill
Goodwill as of December 31, 2011 was $28 million and consisted of the following: $22 million for the acquisition of North America Parts Distributors, Inc. (“NAPD”), $4 million for the initial acquisition in 2004 and $2 million for a minor acquisition in 2008. For the 2004 acquisition, in accordance with ASC Topic 805-740, the tax benefit for the excess of tax-deductible goodwill over the reported amount of goodwill is applied to first reduce the goodwill related to the acquisition. The tax benefit for the excess of tax deductible goodwill reduced reported goodwill by $4 million during the first nine months of 2012. The reported amount of goodwill for the 2004 acquisition was reduced to zero, and the remaining tax benefit will reduce the basis of intangible assets purchased in the 2004 acquisition. Any remaining tax benefit reduces the income tax provision.
12
The following table summarizes our goodwill activity, which is related to the On and Off-highway segment for the first nine months of 2012:
| | | | |
(Dollars in millions) | | Nine Months
Ended
September 30,
2012 | |
Balance at December 31, 2011(1) | | $ | 28 | |
Tax benefit reductions | | | (4 | ) |
| | | | |
Balance at September 30, 2012(1) | | $ | 24 | |
| | | | |
| (1) | The goodwill as of December 31, 2011 and September 30, 2012 excludes $25 million of goodwill in our Brake North America and Asia group, which is classified in current assets of discontinued operations. |
Note 9. Commitments and Contingencies
At September 30, 2012, the Company had purchase commitments for property, plant and equipment of approximately $2 million, which excludes our Brake North America and Asia group purchase commitments for property, plant and equipment of approximately $2 million.
A reconciliation of the changes in our return reserves, which is included in other accrued expenses, is as follows:
| | | | | | | | |
(Dollars in millions) | | Nine Months
Ended
September 30,
2011(1) | | | Nine Months
Ended
September 30,
2012(2) | |
Beginning balance | | $ | 17 | | | $ | 11 | |
Amounts charged to revenue | | | 35 | | | | 14 | |
Returns processed | | | (34 | ) | | | (11 | ) |
| | | | | | | | |
Ending balance | | $ | 18 | | | $ | 14 | |
| | | | | | | | |
| (1) | Includes our Brake North America and Asia group, which is classified as discontinued operations that had amounts charged to revenue of $18 million for the nine months ended September 30, 2011 and returns processed of $20 million for the nine months ended September 30, 2011. The return reserve as of December 31, 2010 and September 30, 2011 includes $8 million and $6 million in our Brake North America and Asia group, respectively. |
| (2) | Excludes our Brake North America and Asia group, which is classified as discontinued operations that had amounts charged to revenue of $13 million for the nine months ended September 30, 2012 and returns processed of $13 million for the nine months ended September 30, 2012. The return reserve as of December 31, 2011 and September 30, 2012 excludes $6 million in our Brake North America and Asia group, which is classified in current liabilities of discontinued operations. |
Note 10. Income Taxes
The total amount of unrecognized tax benefits as of December 31, 2011 and September 30, 2012 was $2 million, and if recognized, would affect the effective tax rate. The Company recognizes interest related to unrecognized tax benefits in interest expense and recognizes penalties as part of the income tax provision. As of September 30, 2012, the Company’s accrual for interest and penalties was less than $1 million. The Company is subject to taxation in the U.S. and various state and foreign jurisdictions. For jurisdictions in which the Company transacts significant business, tax years ended December 31, 2004 and later remain subject to examination by tax authorities. We do not anticipate any material change in the total amount of unrecognized tax benefits to occur within the next twelve months. The effective tax rate was 26% and 41% for the first nine months of 2011 and 2012, respectively.
Note 11. Legal Proceedings
On September 30, 2011, we entered into a settlement agreement with Satisfied Brake Products Inc. (“Satisfied”) for $10 million to settle our claims against Satisfied for their theft of our trade secrets. Upon execution of the settlement agreement, $2.5 million was due immediately and up to an additional $7.5 million is to be provided after liquidation of Satisfied’s business. On September 30, 2011, we recorded a gain of $2.5 million in continuing operations in the consolidated financial statements. Additionally, we recorded $4 million as a gain in continuing operations in the first quarter of 2012. We will record the rest of the income from settlement once the realization is assured beyond a reasonable doubt, which we anticipate will occur if and when we receive the assets of the settlement.
13
The Company has various accruals for civil liability, including product liability, and other costs. If there is a range of equally probable outcomes, we accrue at the lower end of the range. The Company had $4 million and $1 million accrued as of December 31, 2011 and September 30, 2012, respectively. In addition, we have various other claims that are reasonably possible of occurrence that range from less than $1 million to $10 million in the aggregate. There are no recoveries expected from third parties.
Note 12. Segment and Geographic Information
The products, customer base, distribution channel, manufacturing process, and procurement are similar throughout all of the Company’s operations. However, due to different economic characteristics in the Company’s operations and in conformity with ASC Topic 280, “Segment Reporting,” the Company provides information to its Chief Operating Decision Maker (CODM) in three separate reporting segments: (1) the On and Off-highway reportable segment, which aggregates the Filtration, Chassis and Commercial Distribution South America operating segments, (2) South America other segment (which was formerly referred to as Brake South America segment) and (3) Discontinued operation, which includes the Brake North America and Asia group. All three reporting segments are in the On and Off-highway industry, but for segment reporting purposes, we refer to the first segment as the On and Off-highway segment. Our Brake North America and Asia group was classified as discontinued operations and, as such, is no longer presented in the net sales and operating profit segment tables below. See “Note 4. Discontinued Operation – Brake.” Segment net sales, operating profit, total assets, depreciation and amortization and capital expenditures were as follows:
| | | | | | | | | | | | | | | | |
| | | Net Sales | |
(Dollars in millions) | | Three Months
Ended
September 30,
2011 | | | Three Months
Ended
September 30,
2012 | | | Nine Months
Ended
September 30,
2011 | | | Nine Months
Ended
September 30,
2012 | |
On and Off-Highway segment | | $ | 378 | | | $ | 371 | | | $ | 1,130 | | | $ | 1,103 | |
South America other segment | | | 4 | | | | 6 | | | | 12 | | | | 15 | |
Corporate, eliminations and other | | | (2 | ) | | | (2 | ) | | | (8 | ) | | | (6 | ) |
| | | | | | | | | | | | | | | | |
| | $ | 380 | | | $ | 375 | | | $ | 1,134 | | | $ | 1,112 | |
| | | | | | | | | | | | | | | | |
| | | | | | | | | | | | | | | | |
| | | Operating Profit | |
(Dollars in millions) | | Three Months
Ended
September 30,
2011 | | | Three Months
Ended
September 30,
2012 | | | Nine Months
Ended
September 30,
2011 | | | Nine Months
Ended
September 30,
2012 | |
On and Off-Highway segment | | $ | 48 | | | $ | 48 | | | $ | 135 | | | $ | 132 | |
South America other segment | | | (1 | ) | | | 1 | | | | (1 | ) | | | 1 | |
Corporate, eliminations and other | | | (5 | ) | | | (11 | ) | | | (22 | ) | | | (27 | ) |
| | | | | | | | | | | | | | | | |
| | $ | 42 | | | $ | 38 | | | $ | 112 | | | $ | 106 | |
| | | | | | | | | | | | | | | | |
| | | | | | | | |
| | | Total Assets | |
(Dollars in millions) | | December 31,
2011 | | | September 30,
2012 | |
On and Off-Highway segment | | $ | 716 | | | $ | 741 | |
South America other segment | | | 19 | | | | 17 | |
Corporate, eliminations and other | | | 308 | | | | 293 | |
Assets of discontinued operations | | | 416 | | | | 359 | |
| | | | | | | | |
| | $ | 1,459 | | | $ | 1,410 | |
| | | | | | | | |
14
| | | | | | | | | | | | | | | | |
| | | Depreciation and Amortization | |
(Dollars in millions) | | Three Months
Ended
September 30,
2011 | | | Three Months
Ended
September 30,
2012 | | | Nine Months
Ended
September 30,
2011 | | | Nine Months
Ended
September 30,
2012 | |
On and Off-Highway segment | | $ | 4 | | | $ | 5 | | | $ | 12 | | | $ | 13 | |
South America other segment | | | — | | | | — | | | | — | | | | — | |
Corporate, eliminations and other | | | 2 | | | | 1 | | | | 6 | | | | 4 | |
| | | | | | | | | | | | | | | | |
Total from continuing operations | | | 6 | | | | 6 | | | | 18 | | | | 17 | |
Discontinued operations(1) | | | 4 | | | | — | | | | 11 | | | | — | |
| | | | | | | | | | | | | | | | |
| | $ | 10 | | | $ | 6 | | | $ | 29 | | | $ | 17 | |
| | | | | | | | | | | | | | | | |
| (1) | The depreciation and amortization for the long-lived assets to be disposed of by sale was ceased on December 31, 2011 in accordance with ASC 360, “Property, Plant and Equipment.” |
| | | | | | | | | | | | | | | | |
| | | Capital Expenditures | |
(Dollars in millions) | | Three Months
Ended
September 30,
2011 | | | Three Months
Ended
September 30,
2012 | | | Nine Months
Ended
September 30,
2011 | | | Nine Months
Ended
September 30,
2012 | |
On and Off-Highway segment | | $ | 6 | | | $ | 5 | | | $ | 19 | | | $ | 10 | |
South America other segment | | | — | | | | — | | | | — | | | | — | |
Corporate, eliminations and other | | | — | | | | — | | | | — | | | | — | |
| | | | | | | | | | | | | | | | |
Total from continuing operations | | | 6 | | | | 5 | | | | 19 | | | | 10 | |
Discontinued operations | | | 7 | | | | 3 | | | | 21 | | | | 9 | |
| | | | | | | | | | | | | | | | |
| | $ | 13 | | | $ | 8 | | | $ | 40 | | | $ | 19 | |
| | | | | | | | | | | | | | | | |
Net sales by geographic region were determined based on origin of sale and are as follows:
| | | | | | | | | | | | | | | | |
(Dollars in millions) | | Three Months
Ended
September 30,
2011 | | | Three Months
Ended
September 30,
2012 | | | Nine Months
Ended
September 30,
2011 | | | Nine Months
Ended
September 30,
2012 | |
Brazil | | $ | 120 | | | $ | 100 | | | $ | 338 | | | $ | 299 | |
Canada | | | 18 | | | | 19 | | | | 55 | | | | 55 | |
Poland | | | 36 | | | | 36 | | | | 113 | | | | 108 | |
Other countries | | | 25 | | | | 36 | | | | 69 | | | | 90 | |
| | | | | | | | | | | | | | | | |
Total other countries | | | 199 | | | | 191 | | | | 575 | | | | 552 | |
United States | | | 181 | | | | 184 | | | | 559 | | | | 560 | |
| | | | | | | | | | | | | | | | |
| | $ | 380 | | | $ | 375 | | | $ | 1,134 | | | $ | 1,112 | |
| | | | | | | | | | | | | | | | |
15
Geographic data for long-lived assets are comprised of property, plant and equipment, goodwill, other intangible assets and deferred financing costs and are as follows:
| | | | | | | | |
(Dollars in millions) | | December 31,
2011 | | | September 30,
2012 | |
Brazil | | $ | 14 | | | $ | 14 | |
China | | | 14 | | | | 16 | |
Poland | | | 26 | | | | 27 | |
Other countries | | | 11 | | | | 8 | |
| | | | | | | | |
Total other countries | | | 65 | | | | 65 | |
United States | | | 193 | | | | 182 | |
| | | | | | | | |
| | $ | 258 | | | $ | 247 | |
| | | | | | | | |
| (1) | Long-lived assets as of December 31, 2011 and September 30, 2012 excludes $200 million and $202 million, respectively, in our Brake North America and Asia group, which is classified in current assets of discontinued operations. |
We offer primarily two types of products: filtration products, which include oil, fuel, air and other filters and chassis products, which include steering, suspension and driveline components. Additionally, we have Commercial Distribution South America products, which offer chassis, filtration and other products. The Company’s sales by group of similar products are as follows:
| | | | | | | | | | | | | | | | |
(Dollars in millions) | | Three Months
Ended
September 30,
2011 | | | Three Months
Ended
September 30,
2012 | | | Nine Months
Ended
September 30,
2011 | | | Nine Months
Ended
September 30,
2012 | |
Filtration products | | $ | 207 | | | $ | 212 | | | $ | 611 | | | $ | 632 | |
Chassis products | | | 47 | | | | 50 | | | | 167 | | | | 153 | |
Commercial Distribution South America products | | | 124 | | | | 109 | | | | 352 | | | | 318 | |
Corporate, eliminations and other(1) | | | 2 | | | | 4 | | | | 4 | | | | 9 | |
| | | | | | | | | | | | | | | | |
| | $ | 380 | | | $ | 375 | | | $ | 1,134 | | | $ | 1,112 | |
| | | | | | | | | | | | | | | | |
| (1) | Other includes our South America other segment. |
Note 13. Stock Incentive Plan
On July 20, 2005, Affinia Group Holdings Inc., which is our parent, adopted the Affinia Group Holdings Inc. 2005 Stock Incentive Plan, which we refer to as our 2005 Stock Plan. The 2005 Stock Plan permits the grant of non-qualified stock options, incentive stock options, stock appreciation rights, restricted stock and other stock-based awards to employees, directors or consultants of Affinia Group Holdings Inc. and its affiliates. A maximum of 350,000 shares of Affinia Group Holdings Inc. common stock may be subject to awards under the 2005 Stock Plan.
A table of the 2005 Stock Plan balances for the restricted stock units, stock options, deferred compensation shares and stock awards is summarized below.
| | | | | | | | |
| | | December 31,
2011 | | | September 30,
2012 | |
Restricted stock units | | | 242,000 | | | | 242,000 | |
Stock options | | | 28,680 | | | | 27,128 | |
Deferred compensation shares | | | 30,819 | | | | 30,236 | |
Stock award | | | 163 | | | | 163 | |
Shares available | | | 48,338 | | | | 50,473 | |
| | | | | | | | |
Number of shares of common stock subject to awards | | | 350,000 | | | | 350,000 | |
| | | | | | | | |
16
Stock Options
As of September 30, 2012, 27,128 stock options had been awarded, which included exercised options of 3,000, vested options of 23,128 and unvested options of 1,000. Pursuant to the terms of the 2005 Stock Plan, each option expires on August 1, 2015. The exercise price is $100 per option.
We account for our employee stock options under the fair value method of accounting using a Black-Scholes model to measure stock-based compensation expense at the date of grant. Dividend yields were not a factor because there were no cash dividends declared during 2011 and the first nine months of 2012. Our weighted-average Black-Scholes fair value assumptions include:
| | | | | | | | |
| | | 2011 | | | 2012 | |
Weighted-average effective term | | | 5.1 years | | | | 5.0 years | |
Weighted-average risk free interest rate | | | 4.34 | % | | | 4.34 | % |
Weighted-average expected volatility | | | 39.9 | % | | | 39.9 | % |
Weighted-average fair value of options (Dollars in millions) | | $ | 1 | | | $ | 1 | |
The fair value of the stock option grants is amortized to expense over the vesting period. The Company reduces the overall compensation expense by a turnover rate consistent with historical trends. Stock-based compensation expense, which was recorded in selling, general and administrative expenses, and tax related income tax benefits were nil for each of the nine month periods ending September 30, 2011 and 2012.
| | | | |
| | | Options | |
Outstanding at December 31, 2011(1) | | | 28,680 | |
Forfeited/expired | | | (4,552 | ) |
| | | | |
Outstanding at September 30, 2012(1) | | | 24,128 | |
| | | | |
| (1) | Excludes 3,000 options that were exercised as of December 31, 2011 and September 30, 2012. |
Option Exchange
Affinia Group Holdings Inc. completed an offer to certain eligible holders of stock options to exchange their existing stock options to purchase shares of Affinia Group Holdings Inc.’s common stock for restricted stock units (“RSUs”) with new vesting terms (the “Option Exchange”). The Option Exchange election period commenced on August 25, 2010 and expired on September 24, 2010. The completion of the Option Exchange for the RSUs occurred on October 18, 2010, and 100% of the eligible option holders elected to participate. A total of 24 eligible employees and directors participated in the Option Exchange. In addition, three eligible employees and directors who did not have vested options received RSUs. Affinia Group Holdings Inc. accepted for exchange options to purchase a total of 61,868 shares of Affinia Group Holdings Inc.’s common stock. All surrendered options were cancelled in exchange for RSUs. The options had been fully expensed by the exchange date. The total RSUs issued on October 18, 2010 covered 235,000 shares of Affinia Group Holdings Inc.’s common stock.
On December 23, 2011, Affinia Group Holdings Inc. completed another Option Exchange. The Option Exchange election period commenced on December 1, 2011 and expired on December 23, 2011. The completion of the Option Exchange for the RSUs occurred on December 23, 2011, and 100% of the two eligible option holders elected to participate. Affinia Group Holdings Inc. accepted for exchange options to purchase a total of 825 shares of Affinia Group Holdings Inc.’s common stock. All surrendered options were cancelled in exchange for RSUs. The options had been fully expensed by the exchange date. The total RSUs issued on December 23, 2011 covered 4,000 shares of Affinia Group Holdings Inc.’s common stock.
Restricted Stock Units
The RSUs granted in connection with the Option Exchange are governed by the 2005 Stock Plan and a Restricted Stock Unit Award Agreement.
The RSUs are subject to performance-based and market-based vesting restrictions, which differ from the performance and time-based vesting restrictions applicable to the exchanged stock options. The RSUs will vest if (i) the RSU holder remains employed with Affinia Group Holdings Inc. on the date that either of the following vesting conditions occurs and (ii) either of the following vesting conditions occurs on or prior to the date on which Cypress ceases to hold any remaining Affinia Group Holdings Inc. common stock:
| | • | | Cypress Scenario—Cypress has received aggregate transaction proceeds in cash or marketable securities (not subject to escrow, lock-up, trading restrictions or claw-back) with respect to the disposition of more than 50% of its common equity interests in Affinia Group Holdings Inc. in an amount that represents a per-share equivalent value that is greater than or equal to two times the average per share price paid by Cypress for its aggregate common equity investment in Affinia Group Holdings Inc.; or |
17
| | • | | IPO Scenario—Affinia Group Holdings Inc.’s common stock trades on a public stock exchange at an average closing price of $225 (as adjusted for stock splits) over a 60 consecutive trading day period. |
As of September 30, 2012, 242,000 RSUs had been awarded, none of which have vested. We estimate the fair value of market-based RSUs using a Monte Carlo simulation model on the date of grant. Our weighted-average Monte Carlo fair value assumptions include:
| | | | | | | | |
| | | Cypress Scenario | | | IPO Scenario | |
Effective term | | | 0.6 years | | | | 1.4 years | |
Expected volatility | | | 70 | % | | | 70 | % |
Fair value of an RSU | | $ | 107.92 | | | $ | 124.41 | |
Expected expense (Dollars in millions) | | $ | 26 | | | $ | 30 | |
In the event that either of the performance-based conditions (Cypress Scenario or IPO Scenario) is met, the fair value of the RSUs will be recognized in stock-based compensation expense either (1) pro rata over the requisite service term including a cumulative catch-up related to service provided through the date the performance condition is met or (2) in full once the respective market-based condition is met or (3) in full if the requisite service period has already passed when the performance condition is met. Stock-based compensation expense, which would be recorded in selling, general and administrative expenses, and tax related income tax benefits was not recorded for the first nine months of 2012 as neither of the performance conditions have been met. If the RSUs do not vest prior to ten years from the date of grant, then the RSUs will expire. If the performance condition is met on the 242,000 RSUs, the amount of expense we would have to record is $30 million under the IPO scenario or $26 million under the Cypress scenario.
| | | | |
| | | RSUs | |
Outstanding at December 31, 2011 | | | 242,000 | |
Granted | | | — | |
Forfeited/expired | | | — | |
| | | | |
Outstanding at September 30, 2012 | | | 242,000 | |
| | | | |
Deferred Compensation Plan
We started a deferred compensation plan in 2008 that permits executives to defer receipt of all or a portion of the amounts payable under our non-equity incentive compensation plan. All amounts deferred are treated solely for purposes of the plan to have been notionally invested in the common stock of Affinia Group Holdings Inc. As such, the accounts under the plan will reflect investment gains and losses associated with an investment in the Affinia Group Holdings Inc.’s common stock. We match 25% of the deferral with an additional notional investment in common stock of Affinia Group Holdings Inc., which is subject to vesting as provided in the plan. Deferred compensation expense, which was recorded in selling, general and administrative expenses, and tax related income tax benefits were $1 million and less than $1 million for the first nine months of 2011 and 2012, respectively.
Note 14. Accounts Receivable Factoring
We have agreements with third party financial institutions to factor on a non-recourse basis certain receivables. The terms of the factoring arrangements provide for the factoring of certain U.S. Dollar-denominated or Canadian Dollar-denominated receivables, which are purchased at the face value amount of the receivable discounted at the annual rate of LIBOR plus a spread on the purchase date. The amount factored is not contractually defined by the factoring arrangements and our use will vary each month based on the amount of underlying receivables and the cash flow needs of the Company.
During the first nine months of 2011 and 2012, the total accounts receivable factored was $307 million and $505 million, respectively, and the cost incurred on factoring was $3 million and $4 million, respectively. Accounts receivable factored by the Company are accounted for as a sale and removed from the balance sheet at the time of factoring and the cost of the factoring is accounted for in other income or in discontinued operations if it relates to our Brake North America and Asia Group.
18
Note 15. Financial Information for Guarantors and Non-Guarantors
Affinia Group Intermediate Holdings Inc. (presented as “Parent” in the following schedules), through its wholly-owned subsidiary, Affinia Group Inc. (presented as “Issuer” in the following schedules), issued $225 million aggregate principal amount of its 10.75% Senior Secured Notes due 2016 (the “Secured Notes”) on August 13, 2009, and Affinia Group Inc. issued $300 million aggregate principal amount of its 9% Senior Subordinated Notes due 2014 (the “Subordinated Notes”) on November 30, 2004, with an additional $100 million in principal amount issued December 9, 2010. As of September 30, 2012, there were $367 million and $179 million of Subordinated Notes and Secured Notes outstanding, respectively. The notes were offered only to qualified institutional buyers and certain persons in offshore transactions.
The Secured Notes are fully, unconditionally and jointly and severally guaranteed on a senior secured basis and the Subordinated Notes are fully, unconditionally and jointly and severally guaranteed on an unsecured senior subordinated basis. The Subordinated Notes are general obligations of the Issuer and guaranteed by the Parent and all of the Issuer’s wholly owned current and future domestic subsidiaries (the “Guarantors”). The Issuer’s obligations under the Secured Notes are guaranteed by the Guarantors and are secured by first-priority liens, subject to permitted liens and exceptions for excluded assets, on substantially all of the Issuers, and the Guarantors’ tangible and intangible assets (excluding the ABL Collateral as defined below), including real property, fixtures and equipment owned or acquired in the future by the Issuer and the Guarantors (the “Non-ABL Collateral”) and are secured by second-priority liens on all accounts receivable, inventory, cash, deposit accounts, securities accounts and proceeds of the foregoing and certain assets related thereto held by the Issuer and the Guarantors, which constitute collateral under the ABL Revolver on a first-priority basis (the “ABL Collateral”).
The following unaudited information presents Condensed Consolidating Statements of Operations for the three and nine months ended September 30, 2011 and 2012, Condensed Consolidating Statements of Comprehensive Income for the three and nine months ended September 30, 2011 and 2012, Condensed Consolidating Balance Sheets as of December 31, 2011 and September 30, 2012 and Condensed Consolidating Statements of Cash Flows for the nine months ended September 30, 2011 and 2012 of (1) the Parent, (2) the Issuer, (3) the Guarantors, (4) the Non-Guarantors, and (5) eliminations to arrive at the information for the Company on a consolidated basis.
19
Affinia Group Intermediate Holdings Inc.
Guarantor Condensed
Consolidating Statement of Operations
For the Three Months Ended September 30, 2011
| | | | | | | | | | | | | | | | | | | | | | | | |
(Dollars in millions) | | Parent | | | Issuer | | | Guarantor | | | Non-Guarantor | | | Eliminations | | | Consolidated
Total | |
Net sales | | $ | — | | | $ | — | | | $ | 199 | | | $ | 264 | | | $ | (83 | ) | | $ | 380 | |
Cost of sales | | | — | | | | — | | | | (157 | ) | | | (215 | ) | | | 83 | | | | (289 | ) |
| | | | | | | | | | | | | | | | | | | | | | | | |
Gross profit | | | — | | | | — | | | | 42 | | | | 49 | | | | — | | | | 91 | |
Selling, general and administrative expenses | | | — | | | | (6 | ) | | | (21 | ) | | | (22 | ) | | | — | | | | (49 | ) |
| | | | | | | | | | | | | | | | | | | | | | | | |
Operating profit (loss) | | | — | | | | (6 | ) | | | 21 | | | | 27 | | | | — | | | | 42 | |
Other income, net | | | — | | | | 1 | | | | — | | | | 1 | | | | — | | | | 2 | |
Interest expense | | | — | | | | (17 | ) | | | — | | | | — | | | | — | | | | (17 | ) |
| | | | | | | | | | | | | | | | | | | | | | | | |
Income (loss) from continuing operations before income tax provision, equity in income and noncontrolling interest | | | — | | | | (22 | ) | | | 21 | | | | 28 | | | | — | | | | 27 | |
Income tax provision | | | — | | | | — | | | | — | | | | (7 | ) | | | — | | | | (7 | ) |
Equity in income, net of tax | | | 19 | | | | 41 | | | | 21 | | | | — | | | | (81 | ) | | | — | |
| | | | | | | | | | | | | | | | | | | | | | | | |
Net income from continuing operations | | | 19 | | | | 19 | | | | 42 | | | | 21 | | | | (81 | ) | | | 20 | |
Loss from discontinued operations, net of tax | | | — | | | | — | | | | (1 | ) | | | — | | | | — | | | | (1 | ) |
| | | | | | | | | | | | | | | | | | | | | | | | |
Net income | | | 19 | | | | 19 | | | | 41 | | | | 21 | | | | (81 | ) | | | 19 | |
Less: net income attributable to noncontrolling interest, net of tax | | | — | | | | — | | | | — | | | | — | | | | — | | | | — | |
| | | | | | | | | | | | | | | | | | | | | | | | |
Net income attributable to the Company | | $ | 19 | | | $ | 19 | | | $ | 41 | | | $ | 21 | | | $ | (81 | ) | | $ | 19 | |
| | | | | | | | | | | | | | | | | | | | | | | | |
Guarantor Condensed
Consolidating Statement of Comprehensive Income
For the Three Months Ended September 30, 2011
| | | | | | | | | | | | | | | | | | | | | | | | |
(Dollars in millions) | | Parent | | | Issuer | | | Guarantor | | | Non-Guarantor | | | Eliminations | | | Consolidated
Total | |
Net income | | $ | 19 | | | $ | 19 | | | $ | 41 | | | $ | 21 | | | $ | (81 | ) | | $ | 19 | |
Other comprehensive loss, net of tax: | | | | | | | | | | | | | | | | | | | | | | | | |
Change in foreign currency translation adjustments | | | (49 | ) | | | (49 | ) | | | — | | | | (49 | ) | | | 98 | | | | (49 | ) |
| | | | | | | | | | | | | | | | | | | | | | | | |
Total other comprehensive loss | | | (49 | ) | | | (49 | ) | | | — | | | | (49 | ) | | | 98 | | | | (49 | ) |
| | | | | | | | | | | | | | | | | | | | | | | | |
Total comprehensive income (loss) | | | (30 | ) | | | (30 | ) | | | 41 | | | | (28 | ) | | | 17 | | | | (30 | ) |
Less: comprehensive income attributable to noncontrolling interest, net of tax | | | — | | | | — | | | | — | | | | — | | | | — | | | | — | |
| | | | | | | | | | | | | | | | | | | | | | | | |
Comprehensive income (loss) attributable to the Company | | $ | (30 | ) | | $ | (30 | ) | | $ | 41 | | | $ | (28 | ) | | $ | 17 | | | $ | (30 | ) |
| | | | | | | | | | | | | | | | | | | | | | | | |
20
Affinia Group Intermediate Holdings Inc.
Guarantor Condensed
Consolidating Statement of Operations
For the Nine Months Ended September 30, 2011
| | | | | | | | | | | | | | | | | | | | | | | | |
(Dollars in millions) | | Parent | | | Issuer | | | Guarantor | | | Non-Guarantor | | | Eliminations | | | Consolidated
Total | |
Net sales | | $ | — | | | $ | — | | | $ | 612 | | | $ | 794 | | | $ | (272 | ) | | $ | 1,134 | |
Cost of sales | | | — | | | | — | | | | (486 | ) | | | (656 | ) | | | 272 | | | | (870 | ) |
| | | | | | | | | | | | | | | | | | | | | | | | |
Gross profit | | | — | | | | — | | | | 126 | | | | 138 | | | | — | | | | 264 | |
Selling, general and administrative expenses | | | — | | | | (23 | ) | | | (65 | ) | | | (64 | ) | | | — | | | | (152 | ) |
| | | | | | | | | | | | | | | | | | | | | | | | |
Operating profit (loss) | | | — | | | | (23 | ) | | | 61 | | | | 74 | | | | — | | | | 112 | |
Other income (loss), net | | | — | | | | — | | | | (1 | ) | | | 2 | | | | — | | | | 1 | |
Interest expense | | | — | | | | (50 | ) | | | — | | | | (1 | ) | | | — | | | | (51 | ) |
| | | | | | | | | | | | | | | | | | | | | | | | |
Income (loss) from continuing operations before income tax provision, equity in income and noncontrolling interest | | | — | | | | (73 | ) | | | 60 | | | | 75 | | | | — | | | | 62 | |
Income tax benefit (provision) | | | — | | | | 10 | | | | (6 | ) | | | (20 | ) | | | — | | | | (16 | ) |
Equity in income, net of tax | | | 31 | | | | 94 | | | | 57 | | | | — | | | | (182 | ) | | | — | |
| | | | | | | | | | | | | | | | | | | | | | | | |
Net income from continuing operations | | | 31 | | | | 31 | | | | 111 | | | | 55 | | | | (182 | ) | | | 46 | |
Income (loss) from discontinued operations, net of tax | | | — | | | | — | | | | (16 | ) | | | 2 | | | | — | | | | (14 | ) |
| | | | | | | | | | | | | | | | | | | | | | | | |
Net income | | | 31 | | | | 31 | | | | 95 | | | | 57 | | | | (182 | ) | | | 32 | |
Less: net income attributable to noncontrolling interest, net of tax | | | — | | | | — | | | | 1 | | | | — | | | | — | | | | 1 | |
| | | | | | | | | | | | | | | | | | | | | | | | |
Net income attributable to the Company | | $ | 31 | | | $ | 31 | | | $ | 94 | | | $ | 57 | | | $ | (182 | ) | | $ | 31 | |
| | | | | | | | | | | | | | | | | | | | | | | | |
Guarantor Condensed
Consolidating Statement of Comprehensive Income
For the Nine Months Ended September 30, 2011
| | | | | | | | | | | | | | | | | | | | | | | | |
(Dollars in millions) | | Parent | | | Issuer | | | Guarantor | | | Non-Guarantor | | | Eliminations | | | Consolidated
Total | |
Net income | | $ | 31 | | | $ | 31 | | | $ | 95 | | | $ | 57 | | | $ | (182 | ) | | $ | 32 | |
Other comprehensive loss, net of tax: | | | | | | | | | | | | | | | | | | | | | | | | |
Change in foreign currency translation adjustments | | | (26 | ) | | | (26 | ) | | | — | | | | (26 | ) | | | 52 | | | | (26 | ) |
| | | | | | | | | | | | | | | | | | | | | | | | |
Total other comprehensive loss | | | (26 | ) | | | (26 | ) | | | — | | | | (26 | ) | | | 52 | | | | (26 | ) |
| | | | | | | | | | | | | | | | | | | | | | | | |
Total comprehensive income | | | 5 | | | | 5 | | | | 95 | | | | 31 | | | | (130 | ) | | | 6 | |
Less: comprehensive income attributable to noncontrolling interest, net of tax | | | — | | | | — | | | | 1 | | | | — | | | | — | | | | 1 | |
| | | | | | | | | | | | | | | | | | | | | | | | |
Comprehensive income attributable to the Company | | $ | 5 | | | $ | 5 | | | $ | 94 | | | $ | 31 | | | $ | (130 | ) | | $ | 5 | |
| | | | | | | | | | | | | | | | | | | | | | | | |
21
Affinia Group Intermediate Holdings Inc.
Guarantor Condensed
Consolidating Statement of Operations
For the Three Months Ended September 30, 2012
| | | | | | | | | | | | | | | | | | | | | | | | |
(Dollars in millions) | | Parent | | | Issuer | | | Guarantor | | | Non-Guarantor | | | Eliminations | | | Consolidated
Total | |
Net sales | | $ | — | | | $ | — | | | $ | 202 | | | $ | 286 | | | $ | (113 | ) | | $ | 375 | |
Cost of sales | | | — | | | | — | | | | (159 | ) | | | (241 | ) | | | 113 | | | | (287 | ) |
| | | | | | | | | | | | | | | | | | | | | | | | |
Gross profit | | | — | | | | — | | | | 43 | | | | 45 | | | | — | | | | 88 | |
Selling, general and administrative expenses | | | — | | | | (13 | ) | | | (16 | ) | | | (21 | ) | | | — | | | | (50 | ) |
| | | | | | | | | | | | | | | | | | | | | | | | |
Operating profit (loss) | | | — | | | | (13 | ) | | | 27 | | | | 24 | | | | — | | | | 38 | |
Other income (loss), net | | | — | | | | — | | | | (1 | ) | | | 3 | | | | — | | | | 2 | |
Interest expense | | | — | | | | (15 | ) | | | — | | | | (1 | ) | | | — | | | | (16 | ) |
| | | | | | | | | | | | | | | | | | | | | | | | |
Income (loss) from continuing operations before income tax provision, equity in income and noncontrolling interest | | | — | | | | (28 | ) | | | 26 | | | | 26 | | | | — | | | | 24 | |
Income tax provision | | | — | | | | (2 | ) | | | — | | | | (8 | ) | | | — | | | | (10 | ) |
Equity in income, net of tax | | | 4 | | | | 34 | | | | 12 | | | | 1 | | | | (50 | ) | | | 1 | |
| | | | | | | | | | | | | | | | | | | | | | | | |
Net income from continuing operations | | | 4 | | | | 4 | | | | 38 | | | | 19 | | | | (50 | ) | | | 15 | |
Loss from discontinued operations, net of tax | | | — | | | | — | | | | (3 | ) | | | (7 | ) | | | — | | | | (10 | ) |
| | | | | | | | | | | | | | | | | | | | | | | | |
Net income | | | 4 | | | | 4 | | | | 35 | | | | 12 | | | | (50 | ) | | | 5 | |
Less: net income attributable to noncontrolling interest, net of tax | | | — | | | | — | | | | 1 | | | | — | | | | — | | | | 1 | |
| | | | | | | | | | | | | | | | | | | | | | | | |
Net income attributable to the Company | | $ | 4 | | | $ | 4 | | | $ | 34 | | | $ | 12 | | | $ | (50 | ) | | $ | 4 | |
| | | | | | | | | | | | | | | | | | | | | | | | |
Guarantor Condensed
Consolidating Statement of Comprehensive Income
For the Three Months Ended September 30, 2012
| | | | | | | | | | | | | | | | | | | | | | | | |
(Dollars in millions) | | Parent | | | Issuer | | | Guarantor | | | Non-Guarantor | | | Eliminations | | | Consolidated
Total | |
Net income | | $ | 4 | | | $ | 4 | | | $ | 35 | | | $ | 12 | | | $ | (50 | ) | | $ | 5 | |
Other comprehensive income, net of tax: | | | | | | | | | | | | | | | | | | | | | | | | |
Change in foreign currency translation adjustments | | | 11 | | | | 11 | | | | — | | | | 11 | | | | (22 | ) | | | 11 | |
| | | | | | | | | | | | | | | | | | | | | | | | |
Total other comprehensive income | | | 11 | | | | 11 | | | | — | | | | 11 | | | | (22 | ) | | | 11 | |
| | | | | | | | | | | | | | | | | | | | | | | | |
Total comprehensive income | | | 15 | | | | 15 | | | | 35 | | | | 23 | | | | (72 | ) | | | 16 | |
Less: comprehensive income attributable to noncontrolling interest, net of tax | | | — | | | | — | | | | 1 | | | | — | | | | — | | | | 1 | |
| | | | | | | | | | | | | | | | | | | | | | | | |
Comprehensive income attributable to the Company | | $ | 15 | | | $ | 15 | | | $ | 34 | | | $ | 23 | | | $ | (72 | ) | | $ | 15 | |
| | | | | | | | | | | | | | | | | | | | | | | | |
22
Affinia Group Intermediate Holdings Inc.
Guarantor Condensed
Consolidating Statement of Operations
For the Nine Months Ended September 30, 2012
| | | | | | | | | | | | | | | | | | | | | | | | |
(Dollars in millions) | | Parent | | | Issuer | | | Guarantor | | | Non-Guarantor | | | Eliminations | | | Consolidated
Total | |
Net sales | | $ | — | | | $ | — | | | $ | 611 | | | $ | 784 | | | $ | (283 | ) | | $ | 1,112 | |
Cost of sales | | | — | | | | — | | | | (495 | ) | | | (646 | ) | | | 283 | | | | (858 | ) |
| | | | | | | | | | | | | | | | | | | | | | | | |
Gross profit | | | — | | | | — | | | | 116 | | | | 138 | | | | — | | | | 254 | |
Selling, general and administrative expenses | | | — | | | | (35 | ) | | | (51 | ) | | | (62 | ) | | | — | | | | (148 | ) |
| | | | | | | | | | | | | | | | | | | | | | | | |
Operating profit (loss) | | | — | | | | (35 | ) | | | 65 | | | | 76 | | | | — | | | | 106 | |
Loss on extinguishment of debt | | | — | | | | (1 | ) | | | — | | | | — | | | | — | | | | (1 | ) |
Other income (loss), net | | | — | | | | 1 | | | | (4 | ) | | | 5 | | | | — | | | | 2 | |
Interest expense | | | — | | | | (47 | ) | | | — | | | | (1 | ) | | | — | | | | (48 | ) |
| | | | | | | | | | | | | | | | | | | | | | | | |
Income (loss) from continuing operations before income tax provision, equity in income and noncontrolling interest | | | — | | | | (82 | ) | | | 61 | | | | 80 | | | | — | | | | 59 | |
Income tax provision | | | — | | | | (4 | ) | | | — | | | | (20 | ) | | | — | | | | (24 | ) |
Equity in income (loss), net of tax | | | (22 | ) | | | 64 | | | | 18 | | | | 1 | | | | (60 | ) | | | 1 | |
| | | | | | | | | | | | | | | | | | | | | | | | |
Net income (loss) from continuing operations | | | (22 | ) | | | (22 | ) | | | 79 | | | | 61 | | | | (60 | ) | | | 36 | |
Loss from discontinued operations, net of tax | | | — | | | | — | | | | (14 | ) | | | (43 | ) | | | — | | | | (57 | ) |
| | | | | | | | | | | | | | | | | | | | | | | | |
Net income (loss) | | | (22 | ) | | | (22 | ) | | | 65 | | | | 18 | | | | (60 | ) | | | (21 | ) |
Less: net income attributable to noncontrolling interest, net of tax | | | — | | | | — | | | | 1 | | | | — | | | | — | | | | 1 | |
| | | | | | | | | | | | | | | | | | | | | | | | |
Net income (loss) attributable to the Company | | $ | (22 | ) | | $ | (22 | ) | | $ | 64 | | | $ | 18 | | | $ | (60 | ) | | $ | (22 | ) |
| | | | | | | | | | | | | | | | | | | | | | | | |
Guarantor Condensed
Consolidating Statement of Comprehensive Income
For the Nine Months Ended September 30, 2012
| | | | | | | | | | | | | | | | | | | | | | | | |
(Dollars in millions) | | Parent | | | Issuer | | | Guarantor | | | Non-Guarantor | | | Eliminations | | | Consolidated
Total | |
Net income (loss) | | $ | (22 | ) | | $ | (22 | ) | | $ | 65 | | | $ | 18 | | | $ | (60 | ) | | $ | (21 | ) |
Other comprehensive income, net of tax: | | | | | | | | | | | | | | | | | | | | | | | | |
Change in foreign currency translation adjustments | | | — | | | | — | | | | — | | | | — | | | | — | | | | — | |
| | | | | | | | | | | | | | | | | | | | | | | | |
Total other comprehensive income | | | — | | | | — | | | | — | | | | — | | | | — | | | | — | |
| | | | | | | | | | | | | | | | | | | | | | | | |
Total comprehensive income (loss) | | | (22 | ) | | | (22 | ) | | | 65 | | | | 18 | | | | (60 | ) | | | (21 | ) |
Less: comprehensive income attributable to noncontrolling interest, net of tax | | | — | | | | — | | | | 1 | | | | — | | | | — | | | | 1 | |
| | | | | | | | | | | | | | | | | | | | | | | | |
Comprehensive income (loss) attributable to the Company | | $ | (22 | ) | | $ | (22 | ) | | $ | 64 | | | $ | 18 | | | $ | (60 | ) | | $ | (22 | ) |
| | | | | | | | | | | | | | | | | | | | | | | | |
23
Affinia Group Intermediate Holdings Inc.
Guarantor Condensed
Consolidating Balance Sheet
December 31, 2011
| | | | | | | | | | | | | | | | | | | | | | | | |
(Dollars in millions) | | Parent | | | Issuer | | | Guarantor | | | Non-Guarantor | | | Eliminations | | | Consolidated
Total | |
Assets | | | | | | | | | | | | | | | | | | | | | | | | |
Current assets: | | | | | | | | | | | | | | | | | | | | | | | | |
Cash and cash equivalents | | $ | — | | | $ | 9 | | | $ | — | | | $ | 45 | | | $ | — | | | $ | 54 | |
Accounts receivable | | | — | | | | — | | | | 91 | | | | 120 | | | | — | | | | 211 | |
Inventories | | | — | | | | — | | | | 164 | | | | 112 | | | | — | | | | 276 | |
Other current assets | | | — | | | | 64 | | | | 9 | | | | 30 | | | | — | | | | 103 | |
Current assets of discontinued operations | | | — | | | | — | | | | 272 | | | | 144 | | | | — | | | | 416 | |
| | | | | | | | | | | | | | | | | | | | | | | | |
Total current assets | | | — | | | | 73 | | | | 536 | | | | 451 | | | | — | | | | 1,060 | |
Investments and other assets | | | — | | | | 207 | | | | 54 | | | | 20 | | | | — | | | | 281 | |
Intercompany investments | | | 334 | | | | 1,418 | | | | 675 | | | | — | | | | (2,427 | ) | | | — | |
Intercompany receivables | | | — | | | | (629 | ) | | | 271 | | | | 358 | | | | — | | | | — | |
Property, plant and equipment, net | | | — | | | | 3 | | | | 57 | | | | 58 | | | | — | | | | 118 | |
| | | | | | | | | | | | | | | | | | | | | | | | |
Total assets | | $ | 334 | | | $ | 1,072 | | | $ | 1,593 | | | $ | 887 | | | $ | (2,427 | ) | | $ | 1,459 | |
| | | | | | | | | | | | | | | | | | | | | | | | |
| | | | | | |
Liabilities and shareholder’s equity | | | | | | | | | | | | | | | | | | | | | | | | |
Current liabilities: | | | | | | | | | | | | | | | | | | | | | | | | |
Accounts payable | | $ | — | | | $ | 12 | | | $ | 74 | | | $ | 40 | | | $ | — | | | $ | 126 | |
Notes payable | | | — | | | | — | | | | — | | | | 20 | | | | — | | | | 20 | |
Accrued payroll and employee benefits | | | — | | | | 3 | | | | 2 | | | | 5 | | | | — | | | | 10 | |
Other accrued liabilities | | | — | | | | 20 | | | | 30 | | | | 30 | | | | — | | | | 80 | |
Current liabilities of discontinued operations | | | — | | | | — | | | | 69 | | | | 114 | | | | — | | | | 183 | |
| | | | | | | | | | | | | | | | | | | | | | | | |
Total current liabilities | | | — | | | | 35 | | | | 175 | | | | 209 | | | | — | | | | 419 | |
Deferred employee benefits and noncurrent liabilities | | | — | | | | 12 | | | | — | | | | 3 | | | | — | | | | 15 | |
Long-term debt | | | — | | | | 678 | | | | — | | | | — | | | | — | | | | 678 | |
| | | | | | | | | | | | | | | | | | | | | | | | |
Total liabilities | | | — | | | | 725 | | | | 175 | | | | 212 | | | | — | | | | 1,112 | |
Total shareholder’s equity | | | 334 | | | | 347 | | | | 1,418 | | | | 675 | | | | (2,427 | ) | | | 347 | |
| | | | | | | | | | | | | | | | | | | | | | | | |
Total liabilities and equity | | $ | 334 | | | $ | 1,072 | | | $ | 1,593 | | | $ | 887 | | | $ | (2,427 | ) | | $ | 1,459 | |
| | | | | | | | | | | | | | | | | | | | | | | | |
24
Affinia Group Intermediate Holdings Inc.
Guarantor Condensed
Consolidating Balance Sheet
September 30, 2012
| | | | | | | | | | | | | | | | | | | | | | | | |
(Dollars in millions) | | Parent | | | Issuer | | | Guarantor | | | Non-Guarantor | | | Eliminations | | | Consolidated
Total | |
Assets | | | | | | | | | | | | | | | | | | | | | | | | |
Current assets: | | | | | | | | | | | | | | | | | | | | | | | | |
Cash and cash equivalents | | $ | — | | | $ | 6 | | | $ | — | | | $ | 43 | | | $ | — | | | $ | 49 | |
Accounts receivable | | | — | | | | — | | | | 60 | | | | 130 | | | | — | | | | 190 | |
Inventories, net | | | — | | | | — | | | | 167 | | | | 137 | | | | — | | | | 304 | |
Other current assets | | | — | | | | 68 | | | | 11 | | | | 41 | | | | — | | | | 120 | |
Current assets of discontinued operations | | | — | | | | — | | | | 288 | | | | 71 | | | | — | | | | 359 | |
| | | | | | | | | | | | | | | | | | | | | | | | |
Total current assets | | | — | | | | 74 | | | | 526 | | | | 422 | | | | — | | | | 1,022 | |
Investments and other assets | | | — | | | | 206 | | | | 43 | | | | 21 | | | | — | | | | 270 | |
Intercompany investments | | | 309 | | | | 1,522 | | | | 718 | | | | — | | | | (2,549 | ) | | | — | |
Intercompany receivables | | | — | | | | (817 | ) | | | 370 | | | | 447 | | | | — | | | | — | |
Property, plant and equipment, net | | | — | | | | 2 | | | | 51 | | | | 65 | | | | — | | | | 118 | |
| | | | | | | | | | | | | | | | | | | | | | | | |
Total assets | | $ | 309 | | | $ | 987 | | | $ | 1,708 | | | $ | 955 | | | $ | (2,549 | ) | | $ | 1,410 | |
| | | | | | | | | | | | | | | | | | | | | | | | |
| | | | | | |
Liabilities and shareholder’s equity | | | | | | | | | | | | | | | | | | | | | | | | |
Current liabilities: | | | | | | | | | | | | | | | | | | | | | | | | |
Accounts payable | | $ | — | | | $ | 15 | | | $ | 85 | | | $ | 57 | | | $ | — | | | $ | 157 | |
Notes payable | | | — | | | | 4 | | | | — | | | | 23 | | | | — | | | | 27 | |
Accrued payroll and employee benefits | | | — | | | | 9 | | | | 7 | | | | 9 | | | | — | | | | 25 | |
Other accrued liabilities | | | — | | | | 26 | | | | 27 | | | | 32 | | | | — | �� | | | 85 | |
Current liabilities of discontinued operations | | | — | | | | — | | | | 67 | | | | 113 | | | | — | | | | 180 | |
| | | | | | | | | | | | | | | | | | | | | | | | |
Total current liabilities | | | — | | | | 54 | | | | 186 | | | | 234 | | | | — | | | | 474 | |
Deferred employee benefits and noncurrent liabilities | | | — | | | | 4 | | | | — | | | | 3 | | | | — | | | | 7 | |
Long-term debt | | | — | | | | 606 | | | | — | | | | — | | | | — | | | | 606 | |
| | | | | | | | | | | | | | | | | | | | | | | | |
Total liabilities | | | — | | | | 664 | | | | 186 | | | | 237 | | | | — | | | | 1,087 | |
Total shareholder’s equity | | | 309 | | | | 323 | | | | 1,522 | | | | 718 | | | | (2,549 | ) | | | 323 | |
| | | | | | | | | | | | | | | | | | | | | | | | |
Total liabilities and equity | | $ | 309 | | | $ | 987 | | | $ | 1,708 | | | $ | 955 | | | $ | (2,549 | ) | | $ | 1,410 | |
| | | | | | | | | | | | | | | | | | | | | | | | |
25
Affinia Group Intermediate Holdings Inc.
Guarantor Condensed
Consolidating Statement of Cash Flows
For the Nine Months Ended September 30, 2011
| | | | | | | | | | | | | | | | | | | | | | | | |
(Dollars in millions) | | Parent | | | Issuer | | | Guarantor | | | Non-Guarantor | | | Elimination | | | Consolidated
Total | |
Operating activities | | | | | | | | | | | | | | | | | | | | | | | | |
Net cash provided by (used in) operating activities | | $ | — | | | $ | (79 | ) | | $ | 7 | | | $ | 46 | | | $ | — | | | $ | (26 | ) |
Investing activities | | | | | | | | | | | | | | | | | | | | | | | | |
Proceeds from sales of assets | | | — | | | | — | | | | — | | | | 3 | | | | — | | | | 3 | |
Change in restricted cash | | | — | | | | — | | | | — | | | | 4 | | | | — | | | | 4 | |
Additions to property, plant and equipment | | | — | | | | — | | | | (14 | ) | | | (26 | ) | | | — | | | | (40 | ) |
Other investing activities | | | — | | | | — | | | | 4 | | | | — | | | | — | | | | 4 | |
| | | | | | | | | | | | | | | | | | | | | | | | |
Net cash used in investing activities | | | — | | | | — | | | | (10 | ) | | | (19 | ) | | | — | | | | (29 | ) |
Financing activities | | | | | | | | | | | | | | | | | | | | | | | | |
Net decrease in other short-term debt | | | — | | | | — | | | | — | | | | (11 | ) | | | — | | | | (11 | ) |
Payments of other debt | | | — | | | | — | | | | — | | | | (8 | ) | | | — | | | | (8 | ) |
Proceeds from other debt | | | — | | | | — | | | | — | | | | 20 | | | | — | | | | 20 | |
Capital contribution | | | — | | | | — | | | | — | | | | 2 | | | | — | | | | 2 | |
Net proceeds from ABL Revolver | | | — | | | | 80 | | | | — | | | | — | | | | — | | | | 80 | |
| | | | | | | | | | | | | | | | | | | | | | | | |
Net cash provided by financing activities | | | — | | | | 80 | | | | — | | | | 3 | | | | — | | | | 83 | |
Effect of exchange rates on cash | | | — | | | | — | | | | — | | | | (5 | ) | | | — | | | | (5 | ) |
Increase (decrease) in cash and cash equivalents | | | — | | | | 1 | | | | (3 | ) | | | 25 | | | | — | | | | 23 | |
Cash and cash equivalents at beginning of the period | | | — | | | | 9 | | | | 3 | | | | 43 | | | | — | | | | 55 | |
| | | | | | | | | | | | | | | | | | | | | | | | |
Cash and cash equivalents at end of the period | | $ | — | | | $ | 10 | | | $ | — | | | $ | 68 | | | $ | — | | | $ | 78 | |
| | | | | | | | | | | | | | | | | | | | | | | | |
26
Affinia Group Intermediate Holdings Inc.
Guarantor Condensed
Consolidating Statement of Cash Flows
For the Nine Months Ended September 30, 2012
| | | | | | | | | | | | | | | | | | | | | | | | |
(Dollars in millions) | | Parent | | | Issuer | | | Guarantor | | | Non-Guarantor | | | Elimination | | | Consolidated
Total | |
Operating activities | | | | | | | | | | | | | | | | | | | | | | | | |
Net cash provided by operating activities | | $ | — | | | $ | 70 | | | $ | 6 | | | $ | 12 | | | $ | — | | | $ | 88 | |
Investing activities | | | | | | | | | | | | | | | | | | | | | | | | |
Change in restricted cash | | | — | | | | — | | | | — | | | | 1 | | | | — | | | | 1 | |
Additions to property, plant and equipment | | | — | | | | — | | | | (7 | ) | | | (12 | ) | | | — | | | | (19 | ) |
Proceeds from sales of assets | | | — | | | | — | | | | 1 | | | | 3 | | | | — | | | | 4 | |
| | | | | | | | | | | | | | | | | | | | | | | | |
Net cash used in investing activities | | | — | | | | — | | | | (6 | ) | | | (8 | ) | | | — | | | | (14 | ) |
Financing activities | | | | | | | | | | | | | | | | | | | | | | | | |
Net decrease in other short-term debt | | | — | | | | — | | | | — | | | | (4 | ) | | | — | | | | (4 | ) |
Payments of other debt | | | — | | | | — | | | | — | | | | (2 | ) | | | — | | | | (2 | ) |
Repayment on Secured Notes | | | — | | | | (23 | ) | | | — | | | | — | | | | — | | | | (23 | ) |
Net payments of ABL Revolver | | | — | | | | (50 | ) | | | — | | | | — | | | | — | | | | (50 | ) |
| | | | | | | | | | | | | | | | | | | | | | | | |
Net cash used in financing activities | | | — | | | | (73 | ) | | | — | | | | (6 | ) | | | — | | | | (79 | ) |
Effect of exchange rates on cash | | | — | | | | — | | | | — | | | | — | | | | — | | | | — | |
Decrease in cash and cash equivalents | | | — | | | | (3 | ) | | | — | | | | (2 | ) | | | — | | | | (5 | ) |
Cash and cash equivalents at beginning of the period | | | — | | | | 9 | | | | — | | | | 45 | | | | — | | | | 54 | |
| | | | | | | | | | | | | | | | | | | | | | | | |
Cash and cash equivalents at end of the period | | $ | — | | | $ | 6 | | | $ | — | | | $ | 43 | | | $ | — | | | $ | 49 | |
| | | | | | | | | | | | | | | | | | | | | | | | |
27
| Item 2. | Management’s Discussion and Analysis of Financial Condition and Results of Operations |
Company Overview
We are a global leader in the commercial and light vehicle replacement products and services industry, which is also referred to as the aftermarket. Our extensive aftermarket product offering consists principally of filtration and chassis products. Our filtration products fit medium and heavy duty trucks, light vehicles, equipment in the off-highway market (i.e., construction, mining, forestry and agricultural) and equipment for industrial and marine applications. Our chassis products fit light vehicles, medium and heavy duty trucks, trailers and all terrain vehicles. In addition, we provide aftermarket products and distribution services in South America. We believe that the growth of the global aftermarket, from which we derived approximately 99% of our net sales in 2011, is predominantly driven by the size, age and use of the population of vehicles and equipment in operation. We design, manufacture, distribute and market a broad range of aftermarket products in North America, South America, Europe, Asia and Africa and generate sales in over 70 countries.
The net sales by product grouping for our continuing operations, together with major brands and the concentration of on and off-highway replacement product sales and OEM sales for the year ended December 31, 2011 are illustrated in the chart below.
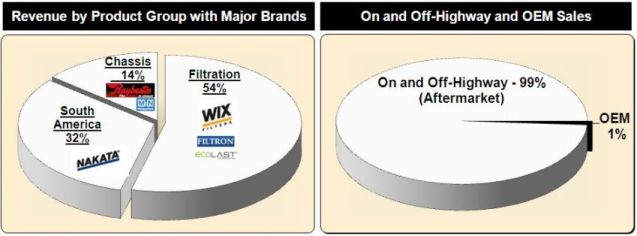
We market our continuing products under a variety of well-known brands, including WIX®, Raybestos®, Filtron™, Nakata®, McQuay-Norris® and ecoLast®. Additionally, we provide private label products to large aftermarket distributors, including NAPA®, CARQUEST® and ACDelco®. We believe that we have achieved our leading market positions due to the quality and reputation of our brands and products among professional installers, who are the primary decision makers for the purchase of the products we supply to the aftermarket.
We provide many of our customers with an extensive range of value added services which help build customer loyalty and generate repeat business while differentiating us from our competitors. These services include e-catalogs, technical services, electronic data interchange, direct shipments of products and point-of-sale marketing materials. The depth of our value added services has led to numerous customer awards.
28
Transformation
Our filtration, South America and chassis product groups fit with our strategic initiatives of growth and profitability. As shown in the chart below these product groups have grown significantly since our acquisition in 2004.
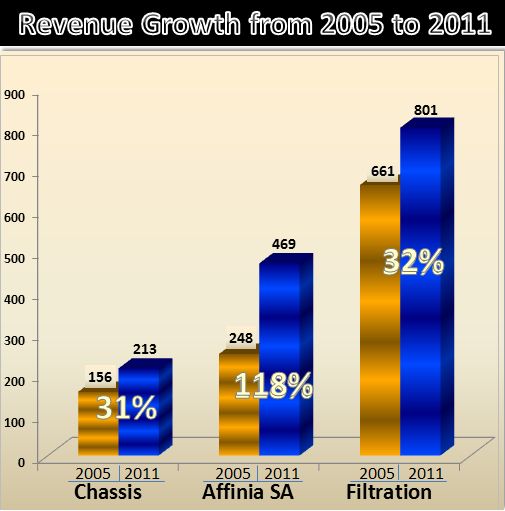
Our filtration products group has seen significant growth since 2005 as we have successfully entered new markets in Europe and in Central America and grown existing market share. We believe that we hold the #1 market position in North America for filtration products by net sales for the year ended December 31, 2011, and we also have a strong presence in Eastern Europe, which includes the #1 market position for filtration products in Poland.
Our South America products group has experienced rapid growth since 2005 in its distribution operations as we have invested to grow this business. Based on management estimates and certain information from third parties, we believe that we hold the #2 market position in Brazilian aftermarket parts distribution by net sales for the year ended December 31, 2011.
Our chassis products group has experienced significant growth in the last two years as we have gained new customers and expanded business with existing customers. With the recent growth in chassis product sales, we believe we have now achieved the #1 market position for aftermarket chassis products by a marginal percentage in North America by net sales for the year ended December 31, 2011.
29
The following are major transformation projects we have completed or are in the process of completing in our continuing operations:
| | • | | Third quarter of 2012 – We purchased the remaining 15% ownership interest in our filtration manufacturing facility in China. |
| | • | | First quarter of 2012 – Our Brazilian distribution company opened a new branch at the end of 2011, which began operating in the first quarter of 2012. |
| | • | | Second quarter of 2011 – During April 2011, we completed the construction of a filtration manufacturing facility in China, in which we owned 85% ownership interest. This facility manufactures products in China and distributes these products in Asia and North America. We began shipping products from this facility during the third quarter of 2011. |
| | • | | Second quarter of 2011 – We completed a new filtration facility in Poland and began shipping products in the second quarter of 2011. The facility was constructed to handle our increased production volumes in Poland and other European countries where we distribute products. |
| | • | | 2010 and 2011 – Our Brazilian distribution company opened one new branch in 2010 and a new warehouse in January 2011. The new warehouse more than tripled our distribution company’s warehouse and distribution capacity in Brazil. The new branch has contributed to the growth of our Brazilian distribution business. |
| | • | | Fourth quarter of 2010 – We purchased substantially all the assets of NAPD, a chassis distributor with strong foreign name plate capabilities. |
| | • | | Fourth quarter of 2010 – We initiated filter product distribution capabilities in Russia. |
| | • | | Third quarter of 2007 – We opened our first filter manufacturing operation in Mexico. During 2008, the manufacturing operation was brought up to its full capabilities. This operation serves markets in both North America and Central America. We expanded our distribution capabilities at this operation to increase our sales in the Mexican market. |
| | • | | Second quarter of 2007 – We opened a new filter manufacturing plant in Ukraine on April 1, 2007 to help meet increased demand for filtration products in Eastern Europe. The plant became fully operational in 2009. |
30
Since our acquisition in 2004, we have transformed the company by investing in our existing operations and expanding into low cost countries, which has positioned us for growth. During 2011, we experienced a record for sales and operating profit from continuing operations as shown by the charts below.
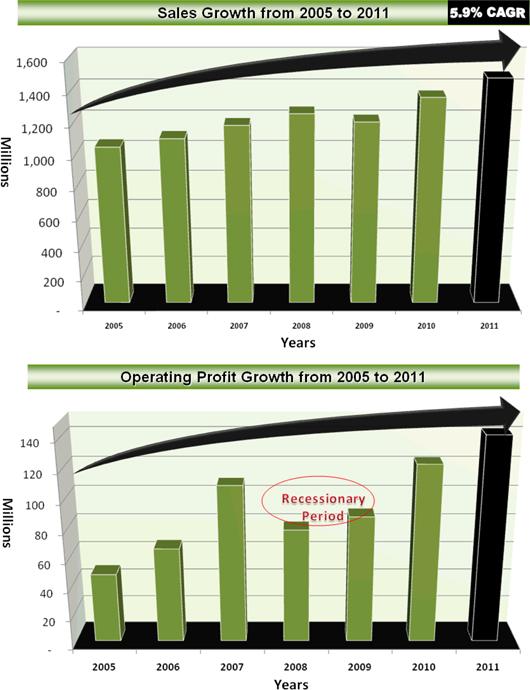
Strategic Focus
With the sale of the Commercial Distribution Europe group in 2010 and the potential sale of the Brake North America and Asia group in 2012, we have positioned ourselves to be a global filtration, chassis and distribution business. With the realignment of our company, we believe that we will be able to better focus on expanding our global manufacturing and distribution capabilities throughout the world.
31
Acquisitions and New Technology
On December 16, 2010, the Company, through its subsidiary, Affinia Products Corp LLC, acquired substantially all the assets of NAPD, which is located in Ramsey, New Jersey. NAPD designs and engineers chassis products, which are manufactured by contractors in low labor cost countries. The NAPD acquisition expands our product offering of chassis parts to one of broadest in the industry. More specifically, the acquisition provides us with broad range of European branded product coverage. We acquired NAPD’s assets and liabilities for cash consideration of $52 million.
In January 2011, we introduced ecoLAST® oil filters, a line of heavy duty oil filters that has been demonstrated to double oil life. WIX ecoLAST oil filters capture dirt and soot like a traditional filter, while utilizing media to sequester the acids in the oil. WIX’s ecoLAST oil filters are a direct replacement with no changes or modification required to the vehicle.
Reduction of Debt Levels
We have decreased debt levels in 2012 due to a decrease in inventory levels, an increase in accounts payable, which was mainly due to timing, and an increase in accounts receivable factored. The increase in cash provided by operating activities enabled us to decrease our borrowings under the ABL Revolver and the amount of our outstanding Secured Notes. On June 25, 2012, Affinia Group Inc. redeemed $22.5 million aggregate principal amount of the Secured Notes, pursuant to their terms at a redemption price equal to 103% of the principal amount of such notes being redeemed, plus accrued and unpaid interest to the redemption date.
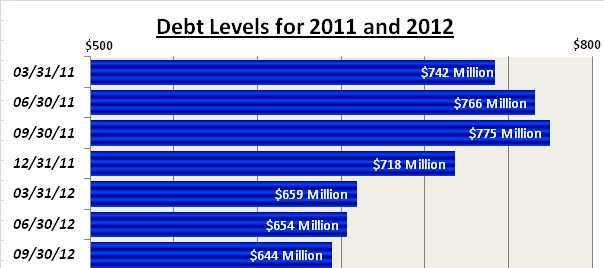
Critical Accounting Policies
The Company’s critical accounting policies are those related to asset impairment, inventories, revenue recognition, sales returns and rebates, estimated costs related to product warranties, pensions, income taxes, contingency reserves and restructuring expenses. These policies are more fully described in the notes to the consolidated financial statements in the Company’s Annual Report on Form 10-K for the year ended December 31, 2011. There have been no material changes to our critical accounting policies since December 31, 2011.
The preparation of interim financial statements involves the use of certain estimates that are consistent with those used in the preparation of the annual financial statements.
Basis of Presentation
The On and Off-highway segment is comprised of the following operations: Filtration, Commercial Distribution South America, and Chassis. The On and Off-highway segment used to include our Brake North America and Asia group, which is classified as a discontinued operation. The Company also has one other reportable segment, South America other. In the Results of Operations tables below, we have identified in tabular format the revenue by product. Previously reported consolidated statements of operations for all periods presented have been adjusted to reflect the Brake North America and Asia group as a discontinued operation.
32
Results of Operations
Three months ended September 30, 2011 compared to the three months ended September 30, 2012
Net sales.Consolidated sales decreased by $5 million, which was primarily due to unfavorable currency effects of $32 million, in the third quarter of 2012 in comparison to the third quarter of 2011. The increase in sales on a currency adjusted basis was due to increased sales in our Commercial Distribution South America products and our European and South American filtration operations. The following table summarizes the consolidated net sales results for the three months ended September 30, 2011 and the consolidated net sales results for the three months ended September 30, 2012:
| | | | | | | | | | | | | | | | | | | | |
(Dollars in millions) | | Consolidated
Three Months
Ended
September 30,
2011 | | | Consolidated
Three Months
Ended
September 30,
2012 | | | Dollar
Change | | | Percent
Change | | | Currency
Effect (1) | |
Net sales | | | | | | | | | | | | | | | | | | | | |
Filtration products | | $ | 207 | | | $ | 212 | | | $ | 5 | | | | 2 | % | | $ | (6 | ) |
Commercial Distribution South America products | | | 124 | | | | 109 | | | | (15 | ) | | | -12 | % | | | (26 | ) |
Chassis products | | | 47 | | | | 50 | | | | 3 | | | | 6 | % | | | — | |
| | | | | | | | | | | | | | | | | | | | |
On and Off-highway segment | | | 378 | | | | 371 | | | | (7 | ) | | | -2 | % | | | (32 | ) |
South America other segment | | | 4 | | | | 6 | | | | 2 | | | | 50 | % | | | — | |
Corporate, eliminations and other | | | (2 | ) | | | (2 | ) | | | — | | | | — | | | | — | |
| | | | | | | | | | | | | | | | | | | | |
Total net sales | | $ | 380 | | | $ | 375 | | | $ | (5 | ) | | | -1 | % | | $ | (32 | ) |
| | | | | | | | | | | | | | | | | | | | |
| (1) | The currency effect was calculated by comparing the local currency net sales for all international locations for both periods, each at the current year exchange rate, to determine the impact of the currency between periods. These currency effects provide a clearer understanding of the operating results of our foreign entities because they exclude the varying effects that changes in foreign currency exchange rates may have on those results. |
On and Off-highway segment products sales decreased due to the following:
| | (1) | Filtration products sales increased in the third quarter of 2012 in comparison to the third quarter of 2011 due to increased sales of $11 million in our European and South American operations related to new customers and new business with existing customers. The increased sales were partially offset by unfavorable currency translation effects of $6 million, which mainly related to Poland. |
| | (2) | Commercial Distribution South America products sales decreased by $15 million in the third quarter of 2012 in comparison to the third quarter of 2011 due to $26 million of negative currency effects. Partially offsetting the decrease were price increases on certain products and new business on our Brazilian and Argentinean distribution companies and our Brazilian shock operations. |
| | (3) | Chassis products sales increased in the third quarter of 2012 in comparison to the third quarter of 2011. During 2011, our sales increased due to new business in our premium chassis product line. During the first six months of 2011, we had higher sales than the first six months of 2012 due to a significant amount of initial orders related to new business in our premium chassis product line. However, the premium sales in the third quarter of 2012 and 2011 were comparable. Sales were higher in the third quarter of 2012 due to a one-time return related to a new customer in the third quarter of 2011. |
South America other segment products sales increased in the third quarter of 2012 in comparison to the third quarter of 2011 due mainly to increased sales in our Venezuelan distribution operations.
33
The following table summarizes the consolidated results for the three months ended September 30, 2011 and the consolidated results for the three months ended September 30, 2012:
| | | | | | | | | | | | | | | | |
(Dollars in millions) | | Consolidated
Three Months
Ended
September 30,
2011 | | | Consolidated
Three Months
Ended
September 30,
2012 | | | Dollar
Change | | | Percent
Change | |
Net sales | | $ | 380 | | | $ | 375 | | | $ | (5 | ) | | | -1 | % |
Cost of sales | | | (289 | ) | | | (287 | ) | | | 2 | | | | -1 | % |
| | | | | | | | | | | | | | | | |
Gross profit | | | 91 | | | | 88 | | | | (3 | ) | | | -3 | % |
Gross margin | | | 24 | % | | | 24 | % | | | | | | | | |
Selling, general and administrative expenses(1) | | | (49 | ) | | | (50 | ) | | | (1 | ) | | | 2 | % |
Selling, general and administrative expenses as a percent of sales | | | 13 | % | | | 13 | % | | | | | | | | |
| | | | | | | | | | | | | | | | |
Operating profit (loss) | | | | | | | | | | | | | | | | |
On and Off-highway segment | | | 48 | | | | 48 | | | | — | | | | NM | |
South America other segment | | | (1 | ) | | | 1 | | | | 2 | | | | 200 | % |
Corporate, eliminations and other | | | (5 | ) | | | (11 | ) | | | (6 | ) | | | -120 | % |
| | | | | | | | | | | | | | | | |
Operating profit | | | 42 | | | | 38 | | | | (4 | ) | | | -10 | % |
Operating margin | | | 11 | % | | | 10 | % | | | | | | | | |
Other income, net | | | 2 | | | | 2 | | | | — | | | | NM | |
Interest expense | | | (17 | ) | | | (16 | ) | | | 1 | | | | -6 | % |
| | | | | | | | | | | | | | | | |
Income from continuing operations, before income tax provision, equity in income and noncontrolling interest | | | 27 | | | | 24 | | | | (3 | ) | | | -11 | % |
Income tax provision | | | (7 | ) | | | (10 | ) | | | (3 | ) | | | 43 | % |
Equity in income, net of tax | | | — | | | | 1 | | | | 1 | | | | NM | |
| | | | | | | | | | | | | | | | |
Net income from continuing operations | | | 20 | | | | 15 | | | | (5 | ) | | | -25 | % |
Loss from discontinued operations, net of tax | | | (1 | ) | | | (10 | ) | | | (9 | ) | | | -900 | % |
| | | | | | | | | | | | | | | | |
Net income | | | 19 | | | | 5 | | | | (14 | ) | | | -74 | % |
Less: net income attributable to noncontrolling interest, net of tax | | | — | | | | 1 | | | | 1 | | | | NM | |
| | | | | | | | | | | | | | | | |
Net income attributable to the Company | | $ | 19 | | | $ | 4 | | | $ | (15 | ) | | | -79 | % |
| | | | | | | | | | | | | | | | |
| (1) | We recorded $1 million of restructuring costs in selling, general and administrative expenses in the third quarter of 2012. |
Gross profit/Gross margin. Gross margin remained consistent during the third quarter of 2012 in comparison to the third quarter of 2011. Gross profit decreased $3 million in the third quarter of 2012 in comparison to the third quarter of 2011 due to unfavorable currency translation effects of $8 million and an increase in material and manufacturing costs of $2 million. The increase in material and manufacturing costs was mainly due to new business that required temporarily sourcing some components of our chassis products from higher cost sources. The decrease in gross profit was partially offset by an increase in sales volume of $6 million and a decrease in operating costs of $1 million.
Selling, general and administrative expenses.Our selling, general and administrative expenses for the third quarter of 2012 increased by $1 million from the third quarter of 2011 due to increase in legal and professional fees related to special projects and restructuring costs, partially offset by decrease in the Satisfied settlement, payroll related costs and advertising costs. We recognized a $2.5 million gain on the Satisfied settlement in the third quarter of 2011.
Operating profit/Operating margin.Operating profit decreased by $4 million in the third quarter of 2012 in comparison to the third quarter of 2011. The operating profit in the On and Off-highway segment remained consistent during the third quarter of 2012 in comparison to the third quarter of 2011. Corporate, eliminations and other operating loss increased in the third quarter of 2012 in comparison to the third quarter of 2011 by $6 million due to increased legal and professional fees related to special projects and the Satisfied settlement of $2.5 million in the third quarter of 2011.
34
Interest expense.Interest expense decreased by $1 million in the third quarter of 2012 in comparison to the third quarter of 2011 due to lower debt levels.
Income tax provision. The income tax provision was $10 million and $7 million for the third quarter of 2012 and 2011, respectively. The effective tax rate was higher in the third quarter of 2012 in comparison to the third quarter of 2011 due to deemed distributions from certain foreign subsidiaries.
Loss from discontinued operations, net of tax. The loss from discontinued operations before income tax provision for the third quarter of 2012 was $19 million and was comprised of a $26 million impairment and offset by operational income of $7 million. The income tax benefit related to discontinued operations was $9 million, which includes a $9 million tax benefit related to the impairment. In the third quarter of 2011, we incurred a loss from discontinued operations of $1 million.
Net income.Net income decreased in the third quarter of 2012 in comparison to the third quarter of 2011 due mainly to the increase in the loss from discontinued operations, net of tax and a decrease in operating profit.
Nine months ended September 30, 2011 compared to the nine months ended September 30, 2012.
Net sales.Consolidated sales decreased by $22 million, which was primarily due to unfavorable currency effects of $75 million, in the first nine months of 2012 in comparison to the first nine months of 2011. The following table summarizes the consolidated net sales results for the nine months ended September 30, 2011 and the consolidated net sales results for the nine months ended September 30, 2012.
| | | | | | | | | | | | | | | | | | | | |
(Dollars in millions) | | Consolidated
Nine Months
Ended
September 30,
2011 | | | Consolidated
Nine Months
Ended
September 30,
2012 | | | Dollar
Change | | | Percent
Change | | | Currency
Effect (1) | |
Net sales | | | | | | | | | | | | | | | | | | | | |
Filtration products | | $ | 611 | | | $ | 632 | | | $ | 21 | | | | 3 | % | | $ | (20 | ) |
Commercial Distribution South America products | | | 352 | | | | 318 | | | | (34 | ) | | | -10 | % | | | (55 | ) |
Chassis products | | | 167 | | | | 153 | | | | (14 | ) | | | -8 | % | | | — | |
| | | | | | | | | | | | | | | | | | | | |
On and Off-highway segment | | | 1,130 | | | | 1,103 | | | | (27 | ) | | | -2 | % | | | (75 | ) |
South America other segment | | | 12 | | | | 15 | | | | 3 | | | | 25 | % | | | — | |
Corporate, eliminations and other | | | (8 | ) | | | (6 | ) | | | 2 | | | | 25 | % | | | — | |
| | | | | | | | | | | | | | | | | | | | |
Total net sales | | $ | 1,134 | | | $ | 1,112 | | | $ | (22 | ) | | | -2 | % | | $ | (75 | ) |
| | | | | | | | | | | | | | | | | | | | |
| (1) | The currency effect was calculated by comparing the local currency net sales for all international locations for both periods, each at a current year exchange rate, to determine the impact of the currency between periods. These currency effects provide a clearer understanding of the operating results of our foreign entities because they exclude the varying effects that changes in foreign currency exchange rates may have on those results. |
On and Off-highway segment products sales decreased due to the following:
| | (1) | Filtration products sales increased in the first nine months of 2012 in comparison to the first nine months of 2011 due to increased sales of $13 million in our North American and Asia operations due to increased volume. Additionally, our sales increased by $28 million in our European and South American operations related to new customers and new business with existing customers. The increased sales were partially offset by unfavorable currency translation effects of $20 million, which mainly related to Poland. |
| | (2) | Commercial Distribution South America products sales decreased by $34 million in the first nine months of 2012 in comparison to the first nine months of 2011 due to $55 million of negative currency effects. Partially offsetting the decrease were price increases on certain products and new business at our Brazilian and Argentinean distribution companies and our Brazilian shock operations. |
| | (3) | Chassis products sales decreased in the first six months of 2012 by $17 million offset by an increase of $3 million in the third quarter of 2012 compared to last year. During the first six months of 2011, our sales increased due to new business in our premium chassis line. The new business in 2011 resulted in significant initial orders to fulfill customer requirements. The first nine months of 2012 represents a more normal run rate for the new business. |
35
South America other segment products sales increased in the first nine months of 2012 in comparison to the first nine months of 2011 due mainly to increased sales in our Venezuelan operations.
The following table summarizes the consolidated results for the nine months ended September 30, 2011 and the consolidated results for the nine months ended September 30, 2012:
| | | | | | | | | | | | | | | | |
(Dollars in millions) | | Consolidated
Nine Months
Ended
September 30,
2011 | | | Consolidated
Nine Months
Ended
September 30,
2012 | | | Dollar
Change | | | Percent
Change | |
Net sales | | $ | 1,134 | | | $ | 1,112 | | | $ | (22 | ) | | | -2 | % |
Cost of sales | | | (870 | ) | | | (858 | ) | | | 12 | | | | -1 | % |
| | | | | | | | | | | | | | | | |
Gross profit | | | 264 | | | | 254 | | | | (10 | ) | | | -4 | % |
Gross margin | | | 23 | % | | | 23 | % | | | | | | | | |
Selling, general and administrative expenses(1) | | | (152 | ) | | | (148 | ) | | | 4 | | | | -3 | % |
Selling, general and administrative expenses as a percent of sales | | | 13 | % | | | 13 | % | | | | | | | | |
| | | | | | | | | | | | | | | | |
Operating profit (loss) | | | | | | | | | | | | | | | | |
On and Off-highway segment | | | 135 | | | | 132 | | | | (3 | ) | | | -2 | % |
South America other segment | | | (1 | ) | | | 1 | | | | 2 | | | | 200 | % |
Corporate, eliminations and other | | | (22 | ) | | | (27 | ) | | | (5 | ) | | | -23 | % |
| | | | | | | | | | | | | | | | |
Operating profit | | | 112 | | | | 106 | | | | (6 | ) | | | -5 | % |
Operating margin | | | 10 | % | | | 10 | % | | | | | | | | |
Loss on extinguishment of debt | | | — | | | | (1 | ) | | | (1 | ) | | | NM | |
Other income, net | | | 1 | | | | 2 | | | | 1 | | | | 100 | % |
Interest expense | | | (51 | ) | | | (48 | ) | | | 3 | | | | -6 | % |
| | | | | | | | | | | | | | | | |
Income from continuing operations, before income tax provision, equity in income and noncontrolling interest | | | 62 | | | | 59 | | | | (3 | ) | | | -5 | % |
Income tax provision | | | (16 | ) | | | (24 | ) | | | (8 | ) | | | 50 | % |
Equity in income, net of tax | | | — | | | | 1 | | | | 1 | | | | NM | |
| | | | | | | | | | | | | | | | |
Net income from continuing operations | | | 46 | | | | 36 | | | | (10 | ) | | | -22 | % |
Loss from discontinued operations, net of tax | | | (14 | ) | | | (57 | ) | | | (43 | ) | | | -307 | % |
| | | | | | | | | | | | | | | | |
Net income (loss) | | | 32 | | | | (21 | ) | | | (53 | ) | | | -166 | % |
Less: net income attributable to noncontrolling interest, net of tax | | | 1 | | | | 1 | | | | — | | | | NM | |
| | | | | | | | | | | | | | | | |
Net income (loss) attributable to the Company | | $ | 31 | | | $ | (22 | ) | | $ | (53 | ) | | | -171 | % |
| | | | | | | | | | | | | | | | |
| (1) | We recorded $1 million and $2 million of restructuring costs in selling, general and administrative expenses in the first nine months of 2011 and 2012, respectively. |
Gross profit/Gross margin. Gross margin remained consistent during the first nine months of 2012 in comparison to the first nine months of 2011. Gross profit decreased $10 million in the first nine months of 2012 in comparison to the first nine months of 2011 due to unfavorable currency translation effects of $18 million, higher material and manufacturing costs of $6 million and an increase in freight costs of $2 million. The increase in material and manufacturing costs was mainly due to new business that required temporarily sourcing some components of our chassis products from higher cost sources. The decrease in gross profit was partially offset by an increase in sales volume of $12 million and a decrease in operating costs.
Selling, general and administrative expenses.Our selling, general and administrative expenses for the first nine months of 2012 decreased by $4 million from the first nine months of 2011 due to decrease in advertising and marketing costs and the higher gain realized in the Satisfied settlement in the current year. We recognized gains of $2.5 million and $4 million in the first nine months of 2011 and 2012, respectively, related to the settlement.
36
Operating profit/Operating margin.Operating profit decreased by $6 million in the first nine months of 2012 in comparison to the first nine months of 2011 due to a lower gross profit. The operating profit in the On and Off-highway segment decreased by $3 million due to mainly lower gross margin on our chassis products in the first nine months of 2012 in comparison to the first nine months of 2011. Corporate, eliminations and other operating loss increased in the first nine months of 2012 in comparison to the first nine months of 2011 by $5 million due to increased restructuring costs and legal and professional fees related to special projects.
Interest expense.Interest expense decreased by $3 million in the first nine months of 2012 in comparison to the first nine months of 2011 due to lower debt levels.
Income tax provision. The income tax provision was $24 million and $16 million for the first nine months of 2012 and 2011, respectively. The effective tax rate was higher in the first nine months of 2012 in comparison to the first nine months of 2011 due to deemed distributions from certain foreign subsidiaries.
Loss from discontinued operations, net of tax. The loss from discontinued operations before income tax provision for the first nine months of 2012 is $91 million and is comprised of the $88 million impairment and an operational loss of $3 million. The income tax benefit related to discontinued operations was $34 million, which includes a $32 million tax benefit related to the impairment. In the first nine months of 2011, we incurred a loss from discontinued operations of $14 million.
Net income (loss).Net income increased in the first nine months of 2012 in comparison to the first nine months of 2011 due mainly to the decrease in the loss from discontinued operations, net of tax and a decrease in operating profit.
Results by Geographic Region
Net sales by geographic region were as follows:
| | | | | | | | | | | | | | | | |
(Dollars in millions) | | Three Months
Ended September 30,
2011 | | | Three Months
Ended September 30,
2012 | | | Nine Months
Ended September 30,
2011 | | | Nine Months
Ended September 30,
2012 | |
Net sales | | | | | | | | | | | | | | | | |
United States | | $ | 181 | | | $ | 184 | | | $ | 559 | | | $ | 560 | |
Foreign | | | 199 | | | | 191 | | | | 575 | | | | 552 | |
| | | | | | | | | | | | | | | | |
Total net sales | | $ | 380 | | | $ | 375 | | | $ | 1,134 | | | $ | 1,112 | |
| | | | | | | | | | | | | | | | |
United States sales as a percent of total sales | | | 48 | % | | | 49 | % | | | 49 | % | | | 51 | % |
Foreign sales as a percent of total sales | | | 52 | % | | | 51 | % | | | 51 | % | | | 49 | % |
United States.Net sales remained consistent in the first nine months of 2012 in comparison to the first nine months of 2011.
Foreign. Net sales decreased in the first nine months of 2012 in comparison to the first nine months of 2011 due to unfavorable currency translation effects, partially offset by increased sales to new customers and new business with existing customers.
37
Income from continuing operations before income tax provision, equity in income and noncontrolling interest by geographic region was as follows:
| | | | | | | | | | | | | | | | |
(Dollars in millions) | | Three Months
Ended September 30,
2011 | | | Three Months
Ended September 30,
2012 | | | Nine Months
Ended September 30,
2011 | | | Nine Months
Ended September 30,
2012 | |
Income (loss) from continuing operations before income tax provision, equity in income and noncontrolling interest | | | | | | | | | | | | | | | | |
United States | | $ | (1 | ) | | $ | (2 | ) | | $ | (13 | ) | | $ | (21 | ) |
Foreign | | | 28 | | | | 26 | | | | 75 | | | | 80 | |
| | | | | | | | | | | | | | | | |
Total income from continuing operations before income tax provision, equity in income and noncontrolling interest | | $ | 27 | | | $ | 24 | | | $ | 62 | | | $ | 59 | |
| | | | | | | | | | | | | | | | |
United States. Loss from continuing operations before income tax provision, equity in income and noncontrolling interest increased in the first nine months of 2012 in comparison to the first nine months of 2011 due to a decrease in gross profit.
The United States income from continuing operations before income tax provision, equity in income and noncontrolling interest was lower than the foreign income from continuing operations before income tax provision, equity in income and noncontrolling interest due to the inclusion of corporate costs in our United States operations and higher profitability of some of our subsidiaries in foreign locations. The majority of our debt relates to our United States operations and as a consequence almost all of the associated interest expense is allocated to our domestic operations. During the first nine months of 2012, our United States operations had $47 million of interest expense and our foreign operations had $1 million of interest expense.
Foreign. Income from continuing operations before income tax provision, equity in income and noncontrolling interest increased in the first nine months of 2012 in comparison to the first nine months of 2011. The majority of the increase was due to an improvement in gross profit, which was driven by an increase in sales volume, partially offset by unfavorable currency translation effects.
Liquidity and Capital Resources
The Company’s primary source of liquidity is cash flow from operations and available borrowings from our ABL Revolver. Our primary liquidity requirements are significant and are expected to be primarily for debt servicing, working capital, restructuring obligations and capital spending.
We are significantly leveraged as a result of the Acquisition in 2004, the refinancing that occurred in 2009 and the issuance of additional Subordinated Notes in 2010. As of September 30, 2012, the Company had $644 million in aggregate indebtedness, which included $11 million classified in current liabilities of discontinued operations for our Brake North America and Asia group. As of September 30, 2012, we had an additional $184 million of borrowing capacity available under our ABL Revolver after giving effect to $12 million in outstanding letters of credit, none of which was drawn against, and $4 million for borrowing base reserves. In addition, we had cash and cash equivalents of $54 million and $49 million as of December 31, 2011 and September 30, 2012, respectively.
We spent $40 million and $19 million in capital expenditures during the first nine months of 2011 and 2012, respectively. The cash flow from operations on an annual basis has historically been adequate to meet our liquidity needs. However, during the first half of the year, cash flows from operations are typically not sufficient to meet our liquidity needs, and we therefore utilize our ABL Revolver to bridge our financing needs until the second half of the year. Based on the current level of operations, we believe that cash flow from operations and available cash, together with available borrowings under our ABL Revolver, will be adequate to meet our short term and long term liquidity needs.
Our ABL Revolver matures in May 2017, our Subordinated Notes mature in November 2014 and our Secured Notes mature in 2016. Refinancing our ABL Revolver, our Subordinated Notes and our Secured Notes will require significant additional sources of liquidity over the long term. Furthermore, if we were to undertake a significant acquisition or capital improvement plan, we may need additional sources of liquidity. We expect to meet such liquidity needs by entering into new or additional credit facilities and/or offering new or additional debt securities, but whether such sources of liquidity will be available to us at any given point in the future will depend on a number of factors that are outside of our control, including general market conditions.
38
Asset Based Credit Facilities
Overview.Affinia Group Intermediate Holdings Inc., Affinia Group Inc. and certain of its subsidiaries entered into a $315 million ABL Revolver maturing in 2017 (subject to early termination under certain limited circumstances). There was $60 million outstanding on the ABL Revolver at September 30, 2012. The ABL Revolver includes (i) a revolving credit facility of up to $300 million (which may be increased or decreased in accordance with the reallocation provisions of the ABL Revolver) for borrowings solely to the U.S. domestic borrowers (the “U.S. Facility”), including (a) a $40 million sub-limit for letters of credit and (b) a $30 million swingline facility and (ii) a revolving credit facility of up to $15 million (which may be increased or decreased in accordance with the reallocation provisions of the ABL Revolver, but in no event to exceed $25 million) for Canadian Dollar denominated revolving loans solely to a Canadian borrower (the “Canadian Facility”). Availability under the ABL Revolver is based upon monthly (or more frequent under certain circumstances) borrowing base valuations of Affinia Group Inc.’s eligible inventory and accounts receivable and is reduced by certain reserves in effect from time to time.
Guarantees and Collateral. The indebtedness, obligations and liabilities under the U.S. Facility are unconditionally guaranteed jointly and severally on a senior secured basis by Affinia Group Intermediate Holdings Inc. and certain of its current and future U.S. subsidiaries, and are secured by a first-priority lien on accounts receivable, inventory, cash, deposit accounts, securities accounts and proceeds of the foregoing and certain assets related thereto and a second-priority lien on the collateral securing the Secured Notes on a first-priority basis (collectively, the “U.S. Collateral”).
The indebtedness, obligations and liabilities under the Canadian Facility are unconditionally guaranteed jointly and severally on a senior secured basis by Affinia Group Intermediate Holdings Inc., certain of its current and future U.S. subsidiaries and certain of its Canadian subsidiaries and are also secured by the U.S. Collateral and by a first-priority lien on substantially all of the Canadian borrower’s and the Canadian guarantors’ existing and future assets, including, but not limited to, accounts receivable and inventory (but excluding owned real property and the capital stock of any non-U.S. and non-Canadian subsidiaries of the Canadian borrower or the Canadian guarantors).
Mandatory Prepayments. If at any time the outstanding borrowings under the ABL Revolver (including outstanding letters of credit and swingline loans) exceed the lesser of (i) the borrowing base as in effect at such time and (ii) the aggregate revolving commitments as in effect at such time, the borrowers will be required to prepay an amount equal to such excess and/or cash collateralize outstanding letters of credit.
Voluntary Prepayments. Subject to certain conditions, the ABL Revolver allows the borrowers to voluntarily reduce the amount of the revolving commitments and to prepay the loans without premium or penalty other than customary breakage costs for LIBOR rate contracts.
Covenants. The ABL Revolver contains certain covenants that, among other things, limit or restrict the ability of Affinia Group Intermediate Holdings Inc. and its subsidiaries to (subject to certain qualifications and exceptions):
| | • | | create liens and encumbrances; |
| | • | | incur additional indebtedness; |
| | • | | merge, dissolve, liquidate or consolidate; |
| | • | | make acquisitions and investments; |
| | • | | dispose of or transfer assets; |
| | • | | pay dividends or make other payments in respect of the borrowers’ capital stock; |
| | • | | amend certain material governance documents; |
| | • | | change the nature of the borrowers’ business; |
| | • | | make any advances, investments or loans; |
| | • | | engage in certain transactions with affiliates; |
| | • | | issue or dispose of equity interests; |
| | • | | change the borrowers’ fiscal periods; and |
| | • | | restrict dividends, distributions or other payments from Affinia Group Intermediate Holdings Inc.’s subsidiaries. |
In addition, commencing on the day that an event of default occurs or availability under the ABL Revolver is less than (i) with respect to periods prior to the sale of all or substantially all of the ABL priority collateral of the consolidated U.S. and Canadian brake operations of the Company and the guarantors, the greater of 10.0% of the total revolving loan commitments and $31.5 million or (ii) with respect to periods after the sale of all or substantially all of the ABL priority collateral of the consolidated U.S. and Canadian brake operations of the Company and the guarantors, the greater of 10.0% of the total borrowing base and $20.0 million, Affinia Group Intermediate Holdings Inc. is required to maintain a fixed charge coverage ratio of at least 1.00x measured for the last 12-month period.
39
Interest Rates and Fees. Outstanding borrowings under the U.S. Facility will accrue interest at an annual rate of interest equal to (i) a base rate plus the applicable spread or (ii) a LIBOR rate plus the applicable spread. Swingline loans will bear interest at a base rate plus the applicable spread. Outstanding borrowings under the Canadian Facility will accrue interest at an annual rate of interest equal to (i) the Canadian prime rate plus the applicable spread or (ii) the BA rate (the average discount rate of bankers’ acceptances as quoted on the Reuters Screen CDOR page) plus the applicable spread. We will pay a commission on letters of credit issued under the U.S. Facility at a rate equal to the applicable spread for loans based upon the LIBOR rate (which will be increased by 2% per annum during an event of default).
The borrowers will pay certain fees with respect to the ABL Revolver, including (i) an unused commitment fee on the undrawn portion of the credit facility of 0.25% per annum in the event that more than 50% of the commitments (excluding swingline loans) under the credit facility are utilized, 0.375% per annum in the event that more than 25% but less than or equal to 50% of the commitments (excluding swingline loans) under the credit facility are utilized, and 0.50% per annum in the event that less than or equal to 25% of the commitments (excluding swingline loans) under the credit facility are utilized and (ii) customary annual administration fees in respect of letters of credit and fronting fees in respect of letters of credit equal to 0.125% per annum on the stated amount of each letter of credit outstanding during each fiscal quarter.
Following the occurrence and during the continuance of an event of default, all loans and other obligations may bear interest at a rate 2% in excess of the otherwise applicable rate of interest for so long as such event of default remains outstanding.
Cash Dominion. If availability under the ABL Revolver is less than (i) with respect to periods prior to the sale of all or substantially all of the ABL priority collateral of the consolidated U.S. and Canadian brake operations of the Company and the guarantors, the greater of 12.5% of the total revolving loan commitments and $39.375 million and (ii) with respect to periods after the sale of all or substantially all of the ABL priority collateral of the consolidated U.S. and Canadian brake operations of the Company and the guarantors, the greater of 12.5% of the total borrowing base and $22.5 million, or if there exists an event of default, amounts in Affinia Group Intermediate Holdings Inc.’s deposit accounts and the deposit accounts of the subsidiary guarantors (other than certain excluded accounts) will be transferred daily into a blocked account held by the administrative agent and applied to reduce the outstanding amounts under the ABL Revolver.
Senior Notes
Overview.In November 2004, Affinia Group Inc. issued $300 million aggregate principal amount of the Subordinated Notes, which bear interest at a rate of 9% and mature on November 30, 2014, pursuant to an indenture dated as of November 30, 2004 (the “senior subordinated indenture”). On December 9, 2010, Affinia Group Inc. issued $100 million of additional Subordinated Notes. In connection with our refinancing in August 2009, Affinia Group Inc. issued $225 million aggregate principal amount of the Secured Notes (together with the Subordinated Notes, the “Senior Notes”), which bear interest at a rate of 10.75% and mature on August 15, 2016, pursuant to an indenture dated as of August 13, 2009 (the “senior secured indenture” and, together with the senior subordinated indenture, the “senior indentures”). On December 31, 2010 and June 25, 2012, Affinia Group Inc. redeemed $22.5 million aggregate principal amount of the Secured Notes pursuant to their terms at a redemption price equal to 103% of the principal amount of such notes being redeemed, plus accrued and unpaid interest to the redemption date. As of September 30, 2012, $367 million principal amount of the Subordinated Notes was outstanding and $179 million principal amount of the Secured Notes was outstanding, net of a $1 million issue discount which is being amortized until the Secured Notes mature.
Guarantees and Collateral. The Subordinated Notes are unconditionally guaranteed jointly and severally on a senior subordinated basis by substantially all of our wholly-owned domestic subsidiaries. The Secured Notes are unconditionally guaranteed jointly and severally on a senior secured basis by substantially all of our wholly-owned domestic subsidiaries.
The Secured Notes and the related guarantees are secured on a first-priority lien basis by substantially all of the assets (other than accounts receivable, inventory, cash, deposit accounts, securities accounts and proceeds of the foregoing and certain assets related thereto) of Affinia Group Inc. and the guarantors and on a second-priority lien basis by the accounts receivable, inventory, cash, deposit accounts, securities accounts and proceeds of the foregoing and certain assets related thereto of Affinia Group Inc. and the guarantors.
Interest Payments. Interest on the Subordinated Notes is payable on May 30 and November 30 of each year and interest on the Secured Notes is payable on February 15 and August 15 of each year.
Optional Redemption. We may redeem some or all of the Senior Notes at any time at redemption prices described or set forth in the applicable senior indenture.
40
Change of Control.Upon the occurrence of certain change of control events specified in the applicable senior indenture, each holder of the Subordinated Notes or Secured Notes has the right to require us to repurchase such holder’s Subordinated Notes or Secured Notes, as applicable, at a purchase price in cash equal to 101% of the principal amount thereof, plus accrued and unpaid interest to the repurchase date.
Covenants.The senior indentures contain certain covenants that, among other things, limit or restrict the ability of Affinia Group Inc. and its restricted subsidiaries to (subject to certain qualifications and exceptions):
| | • | | incur and guarantee additional indebtedness, issue disqualified stock or issue certain preferred stock; |
| | • | | pay dividends, make other distributions on, redeem or repurchase stock or make certain other restricted payments; |
| | • | | create certain liens or encumbrances; |
| | • | | make certain investments or acquisitions; |
| | • | | make capital expenditures; |
| | • | | restrict dividends, distributions or other payments from our subsidiaries; |
| | • | | change their line of business; |
| | • | | enter into transactions with affiliates; |
| | • | | consolidate, merge, sell or otherwise dispose of all or substantially all of their assets; and |
| | • | | designate subsidiaries as unrestricted subsidiaries. |
Cash Flows
Net cash provided by (used in) operating activities
Net cash provided by (used in) operating activities is summarized in the table below for the nine months ended September 30, 2011 and 2012:
| | | | | | | | |
(Dollars in millions) | | Nine Months
Ended
September 30,
2011 | | | Nine Months
Ended
September 30,
2012 | |
Net income (loss) | | $ | 32 | | | $ | (21 | ) |
Impairment of assets | | | 1 | | | | 88 | |
Change in trade accounts receivable | | | (23 | ) | | | (8 | ) |
Change in inventories | | | (29 | ) | | | (13 | ) |
Change in other current operating liabilities | | | 5 | | | | 50 | |
| | | | | | | | |
Subtotal | | | (14 | ) | | | 96 | |
Other changes in operating activities | | | (12 | ) | | | (8 | ) |
| | | | | | | | |
Net cash provided by (used in) operating activities | | $ | (26 | ) | | $ | 88 | |
| | | | | | | | |
Net income (loss) – Net income decreased in the first nine months of 2012 in comparison to the first nine months of 2011 due to the loss from discontinued operations, net of tax and a decrease in operating profit.
Impairment of assets – We recorded an $88 million impairment charge related to our Brake North America and Asia group in the first nine months of 2012, offset by a tax benefit to the Company of $32 million.
Change in trade accounts receivable – The change in trade accounts receivable was a $23 million and an $8 million use of cash in the first nine months of 2011 and 2012, respectively. The change in trade accounts receivable was due to timing of payments and increased levels of factoring in the first nine months of 2012.
Inventories – The change in inventories was a $29 million and a $13 million use of cash in the first nine months of 2011 and 2012, respectively. In the first half of 2011, we built up inventory to keep up with increased demand, which was due to improved market conditions in the aftermarket industry, new business with new customers and additional business with existing customers.
41
During the last half of 2011 and the first six months of 2012, we made a concerted effort to decrease inventory levels. During the third quarter of 2012, inventory increased in our Commercial Distribution South America products and our filtration products due to higher sales run rate on those products.
Change in other current operating liabilities – The change in other current operating liabilities was a $5 million and a $50 million source of cash during the first nine months of 2011 and 2012, respectively. The change was primarily due to an increase in accounts payable, which was a $19 million use of cash and a $37 million source of cash in the first nine months of 2011 and 2012, respectively. Accounts payable fluctuates from period to period due to the timing of payments.
Net cash used in investing activities
Net cash used in investing activities is summarized in the table below for the first nine months of 2011 and 2012:
| | | | | | | | |
(Dollars in millions) | | Nine Months
Ended
September 30,
2011 | | | Nine Months
Ended
September 30,
2012 | |
Proceeds from sale of assets | | $ | 3 | | | $ | 4 | |
Change in restricted cash | | | 4 | | | | 1 | |
Additions to property, plant and equipment | | | (40 | ) | | | (19 | ) |
Other investing activities | | | 4 | | | | — | |
| | | | | | | | |
Net cash used in investing activities | | $ | (29 | ) | | $ | (14 | ) |
| | | | | | | | |
Additions to property, plant and equipment – The additions increased significantly in 2011 due to the expansion in China for new friction and filtration facilities. The total additions to property, plant and equipment in China decreased $12 million in the first nine months of 2012 in comparison to the first nine months of 2011. The friction and filtration facilities in China were completed during 2011 and as a consequence the additions in property, plant and equipment decreased during the first nine months of 2012.
Net cash provided by (used in) financing activities
Net cash provided by (used in) financing activities is summarized in the table below for the first nine months of 2011 and 2012:
| | | | | | | | |
(Dollars in millions) | | Nine Months
Ended
September 30,
2011 | | | Nine Months
Ended
September 30,
2012 | |
Net decrease in other short-term debt | | $ | (11 | ) | | $ | (4 | ) |
Payments of other debt | | | (8 | ) | | | (2 | ) |
Proceeds from other debt | | | 20 | | | | — | |
Repayment on Secured Notes | | | — | | | | (23 | ) |
Capital Contribution | | | 2 | | | | — | |
Net proceeds from (payments of) ABL Revolver | | | 80 | | | | (50 | ) |
| | | | | | | | |
Net cash provided by (used in) financing activities | | $ | 83 | | | $ | (79 | ) |
| | | | | | | | |
Repayment on Secured Notes – In June 2012, we redeemed $22.5 million of our Secured Notes using cash provided by operating activities.
Net proceeds from ABL Revolver – The additional borrowings in the first nine months of 2011 were needed to fund the additional operational needs related to increased levels of capital spending and higher levels of working capital. In the first nine months of 2012, we were able to reduce the ABL Revolver due to the cash provided by operating activities, which included an increase in accounts receivable factored.
| Item 3. | Quantitative and Qualitative Disclosures About Market Risk |
We are exposed to various market risks, such as currency exchange and interest rate fluctuation. Where necessary to minimize such risks we may enter into financial derivative transactions; however, we do not enter into derivatives or other financial instruments for trading or speculative purposes.
42
Currency risk
We conduct business throughout the world. Although we manage our businesses in such a way as to reduce a portion of the risks associated with operating internationally, changes in currency exchange rates may adversely impact our results of operations and financial position.
The results of operations and financial position of each of our operations are measured in their respective local (functional) currency. Business transactions denominated in currencies other than an operation’s functional currency produce foreign exchange gains and losses as a result of the re-measurement process, as described in ASC Topic 830,“Foreign Currency Matters.” To the extent that our business activities create monetary assets or liabilities denominated in a non-local currency, changes in an entity’s functional currency exchange rate versus each currency in which an entity transacts business have a varying impact on an entity’s results of operations and financial position, as reported in functional currency terms. Therefore, for entities that transact business in multiple currencies, we seek to minimize the net amount of cash flows and balances denominated in non-local currencies. However, in the normal course of conducting international business, some amount of non-local currency exposure will exist. Therefore, management monitors these exposures and may engage in business activities or execute financial hedge transactions intended to mitigate the potential financial impact due to changes in the respective exchange rates.
Our consolidated results of operations and financial position, as reported in U.S. Dollars, are also affected by changes in currency exchange rates. The results of operations of non-U.S. Dollar functional entities are translated into U.S. Dollars for consolidated reporting purposes each period at the average currency exchange rate experienced during the period. To the extent that the U.S. Dollar may appreciate or depreciate over time, the contribution of non-U.S. Dollar denominated results of operations to our U.S. Dollar reported consolidated earnings will vary accordingly. Therefore, changes in the various local currency exchange rates, as applied to the revenue and expenses of our non-U.S. Dollar operations may have a significant impact on our sales and, to a lesser extent, consolidated net income trends. In addition, a significant portion of our consolidated financial position is maintained at foreign locations and is denominated in functional currencies other than the U.S. Dollar. The non-U.S. Dollar denominated monetary assets and liabilities are translated into U.S. Dollars at each respective currency’s exchange rate then in effect at the end of each reporting period. The financial impact of the translation process is reflected within the other comprehensive income component of shareholder’s equity. Accordingly, the amounts shown in our consolidated shareholder’s equity account will fluctuate depending upon the cumulative appreciation or depreciation of the U.S. Dollar versus each of the respective functional currencies in which we conduct business. Management seeks to lessen the potential financial impact upon our consolidated results of operations due to exchange rate changes by engaging in business activities or by executing financial derivative transactions intended to mitigate specific transactional underlying currency exposures. We do not engage in activities solely intended to counteract the impact that changes in currency exchange rates may have upon our U.S. Dollar reported statement of financial condition nor do we engage in currency transactions for speculative purposes.
Our foreign currency exchange rate risk management efforts primarily focus upon operationally managing the net amount of non-functional currency denominated monetary assets and liabilities. In addition, we routinely execute short-term currency exchange rate forward contracts intended to mitigate the earnings impact related to the re-measurement process. At September 30, 2012, we had currency exchange rate derivatives with an aggregate notional value of $80 million and fair values of less than $1 million in assets and $1 million in liabilities.
Interest rate risk
We are exposed to the risk of rising interest rates to the extent that we fund operations with short-term or variable-rate borrowings. At September 30, 2012, the Company’s $644 million of aggregate debt outstanding, which includes $11 million classified in current liabilities of discontinued operations for our Brake North America and Asia group, consisted of $95 million of floating-rate debt and $549 million of fixed-rate debt.
Pursuant to our written interest rate risk management policy, we actively monitor and manage our fixed versus floating rate debt composition within a specified range. At quarter-end, fixed rate debt comprised approximately 85% of our total debt. Based on the amount of floating-rate debt outstanding at September 30, 2012, a 1% rise in interest rates would result in approximately $1 million in incremental interest expense.
Commodity Price Risk Management
We are exposed to adverse price movements or surcharges related to commodities that are used in the normal course of business operations. Management actively seeks to negotiate contractual terms with our customers and suppliers to limit the potential financial impact related to these exposures.
43
| Item 4. | Controls and Procedures |
We maintain disclosure controls and procedures that are designed to ensure that information required to be disclosed in our reports under the Exchange Act is recorded, processed, summarized and reported within the time periods specified in the Securities and Exchange Commission’s rules and forms, and that such information is accumulated and communicated to our management, including our principal executive officer and principal financial officer, as appropriate, to allow timely decisions regarding required disclosures. Any controls and procedures, no matter how well designed and operated, can provide only reasonable assurance of achieving the desired control objectives. Under the supervision and with the participation of our management, including our principal executive officer and principal financial officer, we conducted an evaluation of our disclosure controls and procedures, as such term is defined under Rules 13a-15(e) promulgated under the Exchange Act. Based on this evaluation, our principal executive officer and our principal financial officer concluded that our disclosure controls and procedures were effective at the reasonable assurance level as of the quarter ended September 30, 2012.
During the quarter ended September 30, 2012, there were no changes in our internal control over financial reporting (as such term is defined in Rules 13a-15(f) and 15d-15(f) under the Exchange Act) that have materially affected, or are reasonably likely to materially affect, our internal control over financial reporting.
PART II
OTHER INFORMATION
On September 30, 2011, we entered into a settlement agreement with Satisfied for $10 million to settle our claims against Satisfied for their theft of our trade secrets. Upon execution of the settlement agreement, $2.5 million was due immediately and up to an additional $7.5 million is to be provided after liquidation of Satisfied’s business. On September 30, 2011, we have recorded a gain of $2.5 million in continuing operations in the consolidated financial statements. Additionally, we recorded $4 million as a gain in continuing operations in the first quarter of 2012. We will record the rest of the income from settlement once the realization is assured beyond a reasonable doubt, which we anticipate will occur if and when we receive the assets of the settlement.
In addition to the other information set forth in this report, you should carefully consider the factors discussed in Part I, “Item 1A. Risk Factors” in our Annual Report on Form 10-K for the year ended December 31, 2011, which could materially affect our business, financial condition or future results. The risks described in our Annual Report on Form 10-K are not the only risks facing our Company. Additional risks and uncertainties not currently known to us or that we currently deem to be immaterial also may materially adversely affect our business, financial condition and/or operating results. There have been no material changes to the risk factors disclosed in Part I, “Item 1A. Risk Factors” in our Annual Report on Form 10-K for the year ended December 31, 2011.
44
| | |
| |
| 4.1 | | Fourth Supplemental Indenture, dated as of August 31, 2012, among Affinia Group Inc., Affinia Group Intermediate Holdings Inc., the Subsidiary Guarantors thereto and Wilmington Trust, National Association. |
| |
| 4.2 | | Limited Waiver to Lien Subordination Agreement and Inter creditor Agreement, dated as of August 31, 2012, by and between Bank of America, N.A., Wilmington Trust, National Association, Affinia Group Inc., Affinia Group Intermediate Holdings Inc. and the subsidiaries named therein. |
| |
| 10.1 | | Amended and Restated Employment Agreement, dated December 15, 2008, by and between Affinia Group Inc. and Terry R. McCormack, which is incorporated herein by reference from Exhibit 10.12 on Form 10-K of Affinia Group Intermediate Holdings Inc. filed on March 6, 2009. |
| |
| 10.2 | | Amended and Restated Employment Agreement, dated December 15, 2008, by and between Affinia Group Inc. and Keith A. Wilson, which is incorporated herein by reference from Exhibit 10.13 on Form 10-K of Affinia Group Intermediate Holdings Inc. filed on March 6, 2009. |
| |
| 10.3 | | Amended and Restated Employment Agreement, dated December 15, 2008, by and between Affinia Group Inc. and Thomas H. Madden, which is incorporated herein by reference from Exhibit 10.15 on Form 10-K of Affinia Group Intermediate Holdings Inc. filed on March 6, 2009. |
| |
| 10.4 | | Amended and Restated Employment Agreement, dated December 15, 2008, by and between Affinia Group Inc. and Steven E. Keller, which is incorporated herein by reference from Exhibit 10.16 on Form 10-K of Affinia Group Intermediate Holdings Inc. filed on March 6, 2009. |
| |
| 31.1 | | Certification of President and Chief Executive Officer pursuant to Rule 13a-14(a) of the Securities and Exchange Act, as amended. |
| |
| 31.2 | | Certification of Senior Vice President and Chief Financial Officer pursuant to Rule 13a-14(a) of the Securities and Exchange Act, as amended. |
| |
| 32.1 | | Certifications of Chief Executive Officer and Chief Financial Officer pursuant to 18 U.S.C. Section 1350(b) |
| |
| 101 | | The following financial information from our Quarterly Report on Form 10-Q for the quarter ended September 30, 2012, formatted in XBRL (eXtensible Business Reporting Language): (i) Unaudited Condensed Consolidated Statements of Operations, (ii) Unaudited Condensed Consolidated Statements of Comprehensive Income (iii) Unaudited Condensed Consolidated Balance Sheets, (iv) Unaudited Condensed Consolidated Statements of Cash Flows, and (v) the Notes to Unaudited Condensed Consolidated Financial Statements. |
45
SIGNATURES
Pursuant to the requirements of the Securities Exchange Act of 1934, the registrant has duly caused this report to be signed on its behalf by the undersigned, thereunto duly authorized.
| | |
| AFFINIA GROUP INTERMEDIATE HOLDINGS INC. |
| |
By: | | /s/ Terry R. McCormack |
| | Terry R. McCormack |
| | Chief Executive Officer, President, and Director (Principal Executive Officer) Date: November 13, 2012 |
| |
By: | | /s/ Thomas H. Madden |
| | |
| | Thomas H. Madden Senior Vice President and Chief Financial Officer (Principal Financial Officer) Date: November 13, 2012 |
46