Filed by AMEC plc
This communication is filed pursuant to Rule 425 under the United States Securities Act of 1933
Subject Company: Foster Wheeler AG
Commission File Number: 001-31305
Date: August 27, 2014
The following is the post half-year results roadshow presentation made available by AMEC to investors on August 27, 2014:
| AMEC plc Investor slide pack August/September 2014 |
| 2 This presentation is for informational purposes only and does not constitute or form part of an offer to sell or the solicitation of an offer to buy or subscribe to any securities, nor shall there be any sale of securities in any jurisdiction in which such offer, solicitation or sale would be unlawful prior to registration or qualification under the securities laws of any such jurisdiction. This presentation is not an offer of securities for sale into the United States. No offering of securities shall be made in the United States except pursuant to registration under the US Securities Act of 1933, or an exemption therefrom. In connection with the proposed offer, AMEC expects to file a registration statement on Form F-4, which will include a prospectus (the “prospectus”), and a Tender Offer statement on Schedule TO (the “Schedule TO”). The proposed offer will be made exclusively by means of, and subject to, the terms and conditions set out in, an offer document containing and setting out the terms and conditions of the offer and a letter of transmittal to be delivered to Foster Wheeler, filed with the United States Securities and Exchange Commission (the “SEC”) and mailed to Foster Wheeler shareholders. The proposed offer will be made by AMEC or an affiliate of AMEC and not by any other person, including Bank of America Merrill Lynch or Barclays. The release, publication or distribution of this presentation in certain jurisdictions may be restricted by law and therefore persons in such jurisdictions into which this presentation is released, published or distributed should inform themselves about and observe such restrictions. SHAREHOLDERS OF FOSTER WHEELER ARE URGED TO READ ANY DOCUMENTS REGARDING THE PROPOSED OFFER WHEN THEY BECOME AVAILABLE (INCLUDING THE EXHIBITS THERETO) AS THEY WILL CONTAIN IMPORTANT INFORMATION ABOUT THE PROPOSED OFFER. The registration statement, the Schedule TO and other related documents in relation to the proposed offer will be available electronically without charge at the SEC's website, www.sec.gov, after they have been filed. Any materials filed with the SEC may also be obtained without charge at AMEC’s website, www.amec.com and on AMEC’s and Foster Wheeler’s common site, www.amecandfosterwheeler.com. This presentation does not constitute an offer or a solicitation in any jurisdiction in which such offer or solicitation is unlawful. An offer will not be made in, nor will deposits be accepted in, any jurisdiction in which the making or acceptance thereof would not be in compliance with the laws of such jurisdiction. However, AMEC may, in its sole discretion, take such action as it may deem necessary to extend an offer in any such jurisdiction. Forward-looking statements This presentation contains statements which constitute “forward-looking statements”. Forward-looking statements include any statements related to the expected benefits or estimated synergies resulting from a transaction with Foster Wheeler and are generally identified by words such as “believe,” “expect,” “anticipate,” “intend,” “estimate,” “will,” “may,” “continue,” “should” and other similar expressions. Forward-looking statements are subject to various risks and uncertainties, many of which are difficult to predict and generally beyond the control of AMEC, that could cause actual results and developments to differ materially from those expressed in, or implied or projected by, the forward-looking statements. AMEC does not undertake to update any of the forward-looking statements after this date to conform such statements to actual results, to reflect the occurrence of anticipated results or otherwise. Important information |
| AMEC today 3 Diversified model minimises risk and maximises opportunity Long term track record of growth Focused on creating shareholder value |
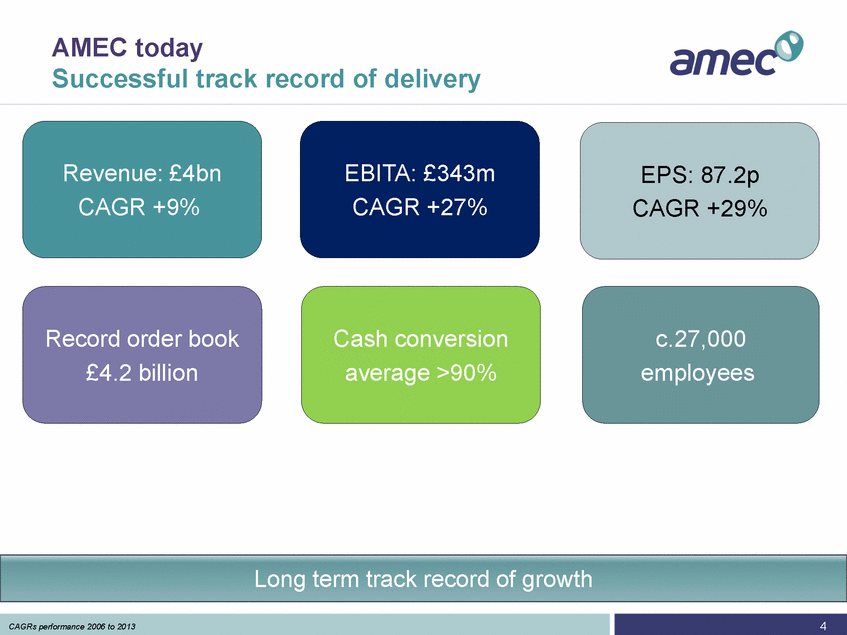
| AMEC today Successful track record of delivery 4 Record order book £4.2 billion Revenue: £4bn CAGR +9% c.27,000 employees EBITA: £343m CAGR +27% Cash conversion average >90% EPS: 87.2p CAGR +29% CAGRs performance 2006 to 2013 Long term track record of growth |
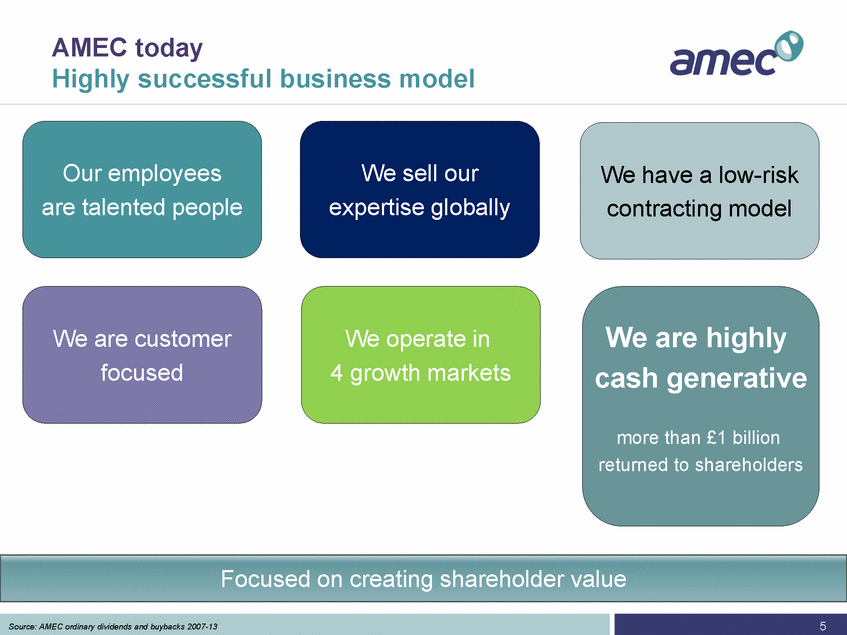
| AMEC today Highly successful business model We are customer focused Our employees are talented people Source: AMEC ordinary dividends and buybacks 2007-13 We are highly cash generative more than £1 billion returned to shareholders We sell our expertise globally 5 We operate in 4 growth markets We have a low-risk contracting model Focused on creating shareholder value |
| Current performance and outlook for 2014 6 1 Excluding impact of currency translation, acquisitions and incremental procurement Long term fundamentals positive – some near term challenges H1 highlights: ‘solid underlying performance’ Underlying revenue (1) up 4% underlying EBITA margin (1) flat Stronger Sterling impacted revenue Order book of £4.2 billion Half year dividend up 10% 2014 outlook: ‘modest underlying growth’ Modest underlying revenue growth Slightly lower margin due to mix FY effect of stronger Sterling c.£250m revenue, c.£25m EBITA Continued good cash conversion Foster Wheeler set to close in early Q4 |
| AMEC + Foster Wheeler: a compelling combination 6150_85 6153_85 14_85 7 Better business development Broad skill base Asset light Multi market More collaboration More growth markets |
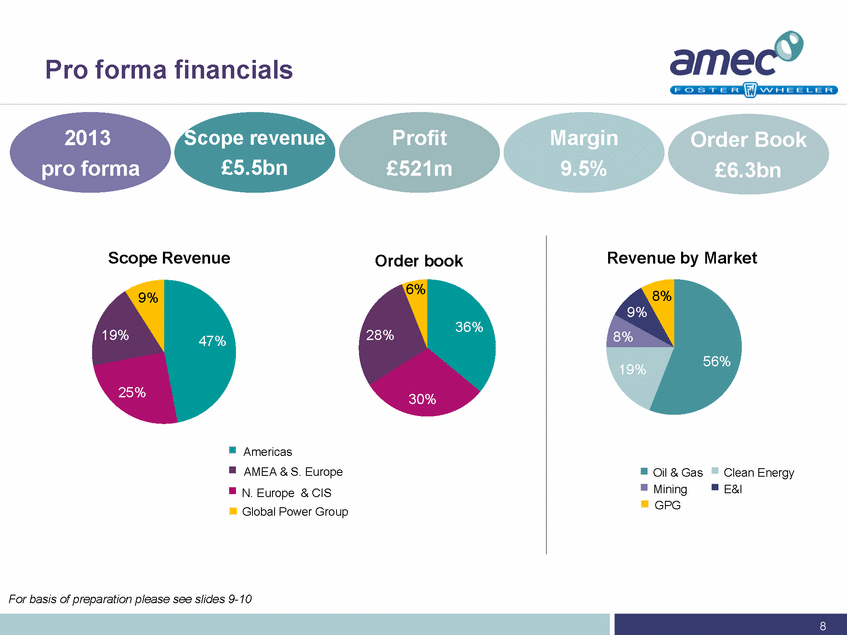
| Pro forma financials Scope Revenue Americas AMEA & S. Europe N. Europe & CIS Order book Global Power Group For basis of preparation please see slides 9-10 Mining Clean Energy E&I Revenue by Market GPG 2013 pro forma 8 Scope revenue £5.5bn Profit £521m Margin 9.5% Order Book £6.3bn 1. 2. |
| Pro forma headline numbers Scope Revenue(1) (£m) Note: All numbers are estimates and prepared under IFRS and AMEC’s accounting policies. Scope revenue excludes the incremental procurement of AMEC and pass-through procurement of Foster Wheeler. Pro forma trading profit is the profit before net financing expense, amortisation and exceptional items of AMEC and Foster Wheeler, plus their shares of JV income. AMEC Foster Wheeler Trading Profit(2) (£m) & Margin (%) 9 Information prepared for illustrative purposes only 2013 average exchange rate £:US$ of 1.57 1. 2. |
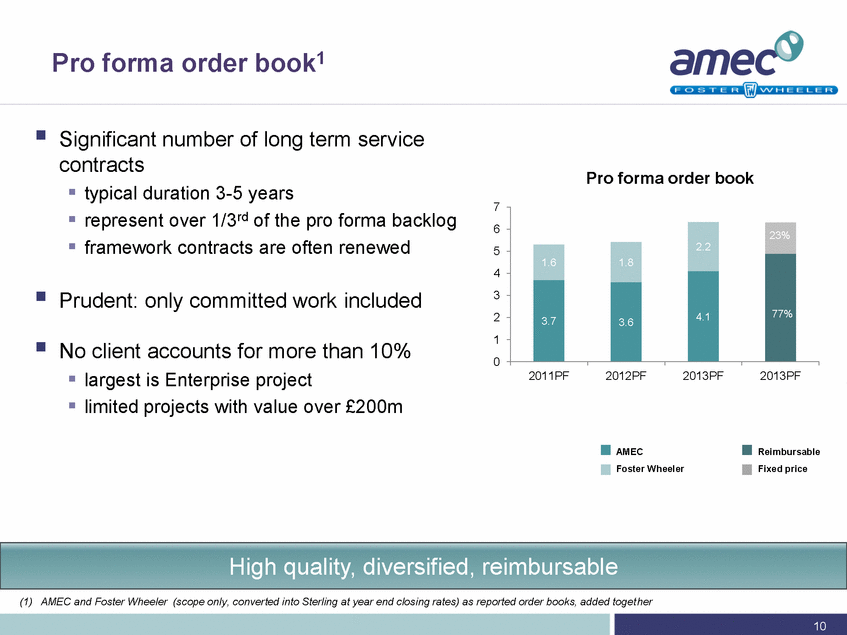
| Pro forma order book1 Significant number of long term service contracts typical duration 3-5 years represent over 1/3rd of the pro forma backlog framework contracts are often renewed Prudent: only committed work included No client accounts for more than 10% largest is Enterprise project limited projects with value over £200m Pro forma order book AMEC Foster Wheeler High quality, diversified, reimbursable 10 AMEC and Foster Wheeler (scope only, converted into Sterling at year end closing rates) as reported order books, added together 77% 23% Reimbursable Fixed price |
| Significant revenue synergies including product cross sell opportunities Identified cost synergies of at least US$75 million per annum actions completed by end of year 2 approximate cost of $75-90 million to achieve mainly removal of duplicated corporate overhead and G&A costs Tax synergies meaningful benefits of utilising tax losses more efficiently, and greater cross-group arbitrage opportunities annual effective tax rate expected to be in mid-to-low 20s Full benefits of cost synergies from year 3 on Significant synergies 11 |
| Capital structure guidance 12 Cash generation Investment Revenue growth Trading Profit growth Dividend Progressive dividend Cover 2-2.5x Surplus cash Additional returns to shareholders Leverage Up to 2x EBITDA Strong balance sheet and attractive cash generation to drive returns Forecast net debt at closing of circa £850m Average interest rate of 3% Expected investment grade rating |
| Americas Access entire O&G value chain with environmental to EPC services Global centre of excellence for deepwater, refining and onshore upstream, Mining, E&I AMEA & Southern Europe Immediate scale benefit Enhanced NOC access Broader service offering , including EPC Global High Value Delivery Centres Improved Power Equipment market access Northern Europe & CIS Global centre of excellence for greenfield, gas monetisation, asset support and brownfield O&G Global centre of excellence for nuclear services Global E&C platform 13 Strategy & Business Development Identifying and prioritising prospects Resource planning and optimisation Supporting collaboration |
| Oil & Gas market Business overview Strong customer relationships Leading engineer and project manager across the oil and gas value chain World class track record of delivery: Upstream: FEED and project management for offshore complex topside production facilities and oil sands Midstream: FEED, project management and EPC services for gas monetisation Downstream: FEED, project management and EPC services Longstanding relationships with IOCs, NOCs and Independents Strong asset management position in offshore market Significant opportunity to manage resources across sectors 14 |
| Receiving terminal / regasification plant Petro- chemicals plant(s) Refinery Onshore Oil & Gas production system Offshore Oil & Gas production system Gas liquefaction plant (Onshore) Gas gathering system Power/ Heating Plastics, fertilisers, fibers, etc. Transport fuels & heating oil LNG Upstream Midstream Downstream Onshore pipelines LNG tankers Gas Pipelines (mainly) Pipelines, tankers, trucks, etc. Gas pipelines (Onshore) Oil gathering system Oil receiving terminal Crude tankers or offshore pipelines Gas-to Liquids Crude oil Coal-to-Liquids Coal Gas Oil & Gas market Combined position Offshore production Onshore production Liquefaction Regasification Refinery Petrochemical plant Focus areas Integrated refinery and petrochemical plants Oil Sands (Unconventional) Significantly enhances addressable market 15 |
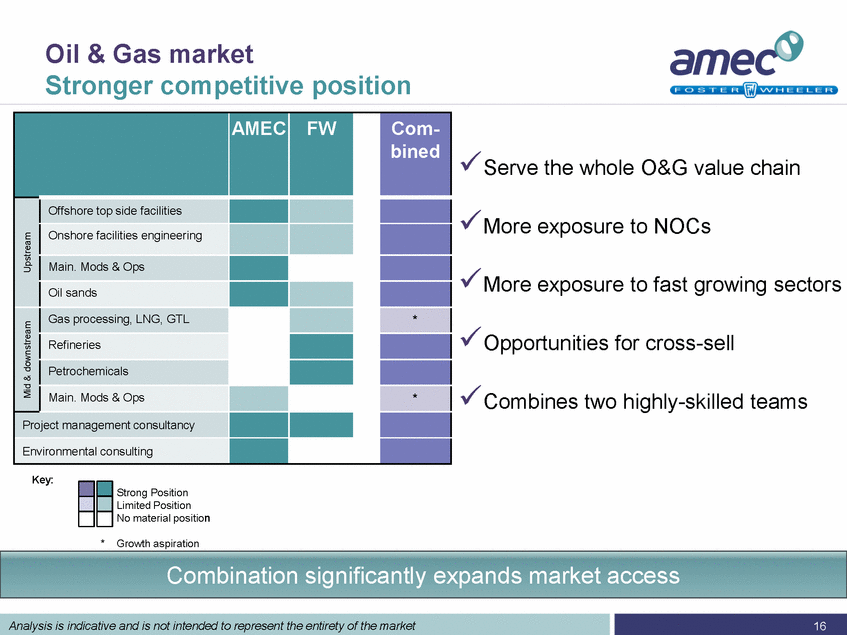
| Analysis is indicative and is not intended to represent the entirety of the market Combination significantly expands market access Key: Strong Position Limited Position No material position * Growth aspiration Oil & Gas market Stronger competitive position 16 Serve the whole O&G value chain More exposure to NOCs More exposure to fast growing sectors Opportunities for cross-sell Combines two highly-skilled teams |
| Consulting & Front End Execution / Design & Construction Hook-Up & Commissioning Asset Management Decommissioning & Reclamation SERVICES/SKILLS Prefeasibility studies Feasibility studies FEED1 Execution planning Technical & environmental consulting, permitting Engineering Procurement Construction Management (EPCM) Engineering Procurement Construction (EPC) Detailed design Project management Construction management (Selective) Construction and fabrication Supply chain management /procurement Project controls Factory acceptance test Pressure testing Safety system check Equipment checks Plant and start-up assistance Mechanical completion System commissioning Operation & Maintenance (O&M) Retrofits and upgrades Operations optimisation Maintenance strategies Lifetime expansions Operational readiness reviews Operator training Regulatory upgrades Programme/project management Engineering Planning Technical support Structural analysis Tailings management and reclamation engineering (in Mining market) Well positioned across the life cycle of our customers’ assets Oil & Gas market Across the asset life cycle O&M support Brownfield/revamp Projects Greenfield/grassroots Projects Front End Consultancy Late Life Management Environmental Services 1Front End Engineering and Design 17 |
| Business overview Strong customer relationships Engineering, design, project delivery and asset support in chosen sectors Nuclear – support the full lifecycle of nuclear energy, with strong positions in the UK and Canada, expanding operations in the US and internationally Renewables – EPC capabilities. Strong positions in North American wind and solar market segments Power – EPC capabilities, asset maintenance and retrofitting of existing power facilities. Potential for synergies with GPG Transmission and Distribution –Focused on gas and electricity in the UK and North America, with opportunities to expand internationally Pharma/Bioprocesses –Strong positions in pharmaceutical, biomass and biofuels Clean Energy market 18 |
| Consultancy, design, project and construction management services and handling systems Expertise across broad spectrum of commodities: including iron ore, copper, potash and gold Leader in projects with significant logistical challenges: remote location Top-tier position in consulting, materials handling systems and strong environmental and growing underground expertise Leading EPCM position across the Americas Established position in Australia and growing African business Business overview Strong customer relationships Mining market 19 |
| Business overview Strong customer relationships Leading consulting, engineering and project management firm Currently focused in North America + UK, growth opportunities in ME/Asia E&I market focused on four sectors Water Transportation / Infrastructure Government Services Industrial / Commercial Network of ~230 offices and ~7,400 employees focused on the following disciplines Environmental science & remediation Water resource management Geosciences Design engineering and construction management Environment & Infrastructure market 20 Environment & Infrastructure market not services. The market comprises of 4 sectors: government services, industrial/commercial, transport/infrastructure and water. All other activities are captured in the other markets |
| Business overview 3 year revenues1 Leading expertise 17.9% 21.1% 18.5% Global Power Group Samcheok Plant, South Korea– Flagship 4 x 550 MWe supercritical multifuel CFBs, powering two 1 GWe STGs, with commercial operation expected late-2015 (Similar 460 MWe CFB already in operation) Worldwide customer reach, with installed base in: Korea, China, India, Vietnam, Turkey, Finland, German, Poland, Sweden, Spain, Venezuela, USA, Canada, Australia, South Africa, etc. in recent years Over 400 CFB units sold over 30 years Cumulated capacity of 25 GWe in operations Leader in design, fabrication and supply of CFB boilers for industry and utilities Circulating fluidised-bed (CFB) steam generators proprietary technology, and extensive operational database leader in the ‘over 300MWe’ CFB market leader in difficult-to-burn fuels and fuel flexibility Other products and services include pulverised Coal (PC) steam generators heat recovery steam generators (HRSG) environmental and aftermarket services Production and procurement arranged to leverage low cost fabrication EBITDA margin2 £m 21 1. GPG revenues as reported by FW, translated into Sterling at average rate for each year. 2. As reported by FW (pre C&F) |
| AMEC plc Supplementary information |
| Appendix H1 revenue – by geography 23 Excluding the impacts of currency movements, acquisitions and the impact of a £50 million reduction in incremental procurement activity in Americas from £100 million to £50 million American Clean Energy and Middle East O&G fuels growth £ million 2014 Headline Underlying 1 Americas 1,060 -8% +7% Europe 545 -7% -7% Growth Regions 279 +5% +17% Investment Services 3 Intercompany eliminations (29) 1,858 -7% +4% 1 |
| Appendix H1 revenue – by market 24 1 Excluding the impacts of currency movements, acquisitions and a reduction of £50 million in incremental procurement activity Environment & Infrastructure market not services. The market comprises of 4 sectors: government services, industrial/commercial, transport/infrastructure and water. All other activities are captured in the other markets Clean Energy growth offsets weaker Oil & Gas £ million 2014 Headline Underlying 1 Oil & Gas 867 -13% -5% Mining 205 -18% +7% Clean Energy 542 +16% +22% Environment & Infrastructure2 270 - +3% Investment Services 3 Intercompany eliminations (29) 1,858 -7% +4% 2 |
| Appendix Americas bridge EBITA development (£m) Revenue growth (%) 1 Year-on-year impact of material acquisitions and disposals 2 Year-on-year impact of currency translation Underlying performance masked by currency headwind -4% +8 -12% 25 +1 - 14 £1,218m £1,154m +1% +7% -6 |
| Appendix Europe bridge EBITA development (£m) Revenue growth (%) 1 Year-on-year impact of material acquisitions and disposals 2 Year-on-year impact of currency translation Margin benefited from non-recurrence of TGPP one-off - 7% + 8 26 -3 |
| Appendix Growth Regions bridge EBITA development (£m) Revenue growth (%) 1 Year-on-year impact of material acquisitions and disposals 2 Year-on-year impact of currency translation Strong revenue growth -10% +3 27 -1.5 +15% -0.4 |
| Appendix Treatment of asbestos liabilities Intention to fully capture Foster Wheeler liability up front based on actuarial valuation. Indicative calculation: Changes based on experience and movement in US 30 year T-bill rate intention to present it split out from underlying business Cash outflow unaffected by accounting treatment US$ m Gross Liability 800 Insurance (100) 700 Discount (200) NPV 500 28 Approx. £300m |
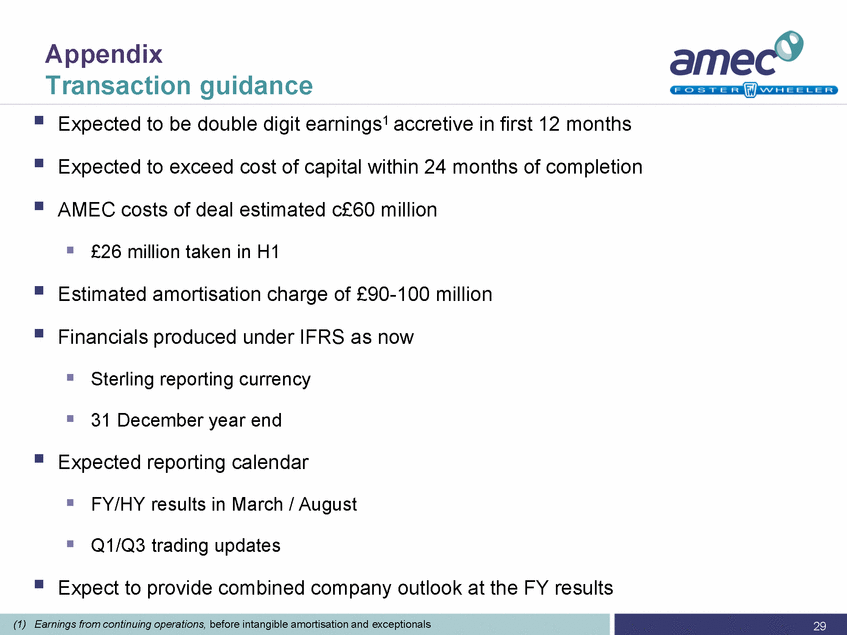
| Expected to be double digit earnings1 accretive in first 12 months Expected to exceed cost of capital within 24 months of completion AMEC costs of deal estimated c£60 million £26 million taken in H1 Estimated amortisation charge of £90-100 million Financials produced under IFRS as now Sterling reporting currency 31 December year end Expected reporting calendar FY/HY results in March / August Q1/Q3 trading updates Expect to provide combined company outlook at the FY results Appendix Transaction guidance 29 Earnings from continuing operations, before intangible amortisation and exceptionals (1) |


