 Filed by Tronox Incorporated Lender Presentation Public Lenders January 26, 2012 Pursuant to Rule 425 of the Securities Act of 1933, as amended Subject Company: Tronox Incorporated (File No: 001-32669) |
 Forward-Looking Statements 2 This document contains forward-looking statements within the meaning of the Private Securities Litigation Reform Act of 1995. Forward- looking statements are typically identified by words or phrases such as “may,” “will,” “anticipate,” “estimate,” “expect,” “project,” “intend,” “plan, ” “believe,” “target,” “forecast,” and other words and terms of similar meaning. Forward-looking statements involve estimates, expectations, projections, goals, forecasts, assumptions, risks and uncertainties. Tronox Incorporated and Tronox Limited caution readers that any forward-looking statement is not a guarantee of future performance and that actual results could differ materially from those contained in the forward-looking statement. Such forward-looking statements include, but are not limited to, statements about the benefits of the proposed transaction involving Tronox Incorporated, Tronox Limited and Exxaro Resources Limited (“Exxaro”), including future financial and operating results, Tronox Incorporated’s, Tronox Limited’s or Exxaro’s plans, objectives, expectations and intentions, the expected timing of completion of the transaction, and other statements that are not historical facts. Important factors that could cause actual results to differ materially from those indicated by such forward-looking statements include risks and uncertainties relating to: the ability to obtain the requisite Tronox Incorporated shareholder approvals; the risk that Tronox Incorporated, Tronox Limited and Exxaro may be unable to obtain governmental and regulatory approvals required for the transaction, or required governmental and regulatory approvals may delay the transaction or result in the imposition of conditions that could cause the parties to abandon the transaction; the performance of the Tronox and Exxaro Mineral Sands business; the risk that a condition to closing of the transaction may not be satisfied; the ability of the combined company to obtain necessary financing to refinance existing indebtedness or modifying existing financing arrangements, and finance the combined business post-closing and the terms on which such financing or modification may be available; the timing to consummate the proposed transaction; the risk that the businesses will not be integrated successfully; the risk that Tronox Limited will not be able to complete registration of its shares with the SEC and/or the listing thereof on a securities exchange, and the timing therefore; the risks to shareholders associated with becoming shareholders of an Australian-domiciled holding company; the risk that the expected cost savings and any other synergies from the transaction may not be fully realized or may take longer to realize than expected; disruption from the transaction making it more difficult to maintain relationships with customers, employees or suppliers; the diversion of management time on transaction-related issues; the market value of Tronox Incorporated’s products; demand for consumer products for which Tronox Incorporated’s businesses supply raw materials; the financial resources of competitors; the market for debt and/or equity financing; the ability to achieve favorable tax structuring for the benefit of Tronox Limited and its subsidiaries and shareholders; the ability to respond to challenges in international markets; changes in currency exchange rates; political or economic conditions in areas where Tronox Limited and its subsidiaries will operate; the risk of changes in laws and regulations applicable to the business and assets of Tronox Limited and its subsidiaries will operate; trade and regulatory matters; general economic conditions; and other factors and risks identified in the Risk Factors Section of Tronox Incorporated’s Registration Statement on form S-4 filed with the U.S. Securities and Exchange Commission (SEC) on December 30, 2010. Each forward-looking statement speaks only as of the date of the particular statement and neither Tronox Incorporated nor Tronox Limited undertakes any obligation to update or revise its forward-looking statements, whether as a result of new information, future events or otherwise. |
 3 Additional Information and Where to Find it. This document does not constitute an offer to sell or the solicitation of an offer to buy any securities, or a solicitation of any vote or approval, nor shall there be any sale of securities in any jurisdiction in which such offer, solicitation or sale would be unlawful prior to registration or qualification under the securities laws of any such jurisdiction. In connection with the proposed transaction involving Tronox Incorporated, Tronox Limited and Exxaro, Tronox Limited and Tronox Incorporated have filed with the SEC a Registration Statement on Form S-4 that includes a preliminary proxy statement of Tronox Incorporated that also constitutes a preliminary prospectus of Tronox Limited. The registration statement relating to the securities to be offered has been filed with the Securities and Exchange Commission but has not yet become effective. These securities may not be sold nor may offers to buy be accepted prior to the time the registration statement becomes effective. Tronox Incorporated will deliver the proxy statement/prospectus to its stockholders once the Registration Statement is effective. Tronox Incorporated urges investors and stockholders to read the proxy statement/prospectus (including any amendments or supplements thereto) regarding the proposed transaction, as well as other documents filed with the SEC, because they contain important information. You may obtain copies of all documents filed with the SEC regarding this transaction, free of charge, at the SEC’s website (www.sec.gov). You may also obtain these documents, free of charge, from Tronox Incorporated’s website (www.tronox.com) under the heading “Investor Relations” Non-GAAP Financial Measures EBITDA and Adjusted EBITDA, which are used by management to measure performance, are non-GAAP financial measures. Management believes that EBITDA and Adjusted EBITDA are useful to investors, as EBITDA is commonly used in the industry as a means of evaluating operating performance and Adjusted EBITDA is used in our debt instruments to determine compliance with financial covenants. Both EBITDA and Adjusted EBITDA are included as a supplemental measure of our operating performance because they eliminate items that have less bearing on operating performance and highlight trends in the core business that may not otherwise be apparent when relying solely on GAAP financial measures. In addition, Adjusted EBITDA is one of the primary measures management uses for planning and budgeting processes and to monitor and evaluate financial and operating results. EBITDA and Adjusted EBITDA are not recognized terms under GAAP and do not purport to be an alternative to measures of our financial performance as determined in accordance with GAAP, such as net income (loss). Because other companies may calculate EBITDA and Adjusted EBITDA differently than we do, EBITDA may not be, and Adjusted EBITDA as presented herein is not, comparable to similarly titled measures reported by other companies. A reconciliation of EBITDA and Adjusted EBITDA to net income are included at the end of this presentation Additional Information & Non-GAAP Financial Measures |
 Today’s Presenters Tom Casey Chairman and Chief Executive Officer, Tronox Dan Greenwell Senior Vice President and Chief Financial Officer, Tronox John Romano Executive Vice President, Tronox Robert Gibney VP Administration and Materials Procurement, Tronox Michael Smith Director, Corporate Development and Investor Relations, Tronox Greg Berube Goldman Sachs Logan Nicholson Goldman Sachs 4 |
 Table of Contents I. Introduction and Transaction Overview II. Tronox Overview III. Exxaro Mineral Sands Overview IV. Perspective on the TiO 2 Market V. Key Credit Highlights VI. Historical Financial Performance VII. Summary Terms and Timeline Appendix: Additional Materials 5 |
 I. Introduction and Transaction Overview 6 |
 Tronox Overview Tronox Inc. (“Tronox” or the “Company”) is one of the largest global titanium dioxide (TiO 2 ) producers with operations in the U.S., Europe and Australia Globally, Tronox has 465,000 tonnes of annual rated chloride pigment production capacity One of only two chloride-only producers in the world Tronox markets a full range of superior pigment grades for a variety of end-users under the TRONOX® brand name Pigment sales represented 91% of revenues for the LTM period ended 9/30/2011 Through its Electrolytic business, Tronox produces Electrolytic Manganese Dioxide (used in high-performance battery applications), sodium chlorate, boron and other specialty chemicals Tronox has experienced a significant increase in Adjusted EBITDA since 2009 as a result of strong end-market demand alongside continued industry-wide supply constraints Revenues and Adjusted EBITDA have increased from $1,070 million and $142 million in 2009 to $1,594 million and $410 million, respectively, for the LTM period ended 9/30/2011 Adjusted EBITDA margin has expanded from 13% in 2009 to 26% for the LTM period ended 9/30/2011 7 |
 Transaction Overview On September 26, 2011, Tronox announced the execution of a definitive agreement to acquire Exxaro Resources’ (“Exxaro”) mineral sands operations, which will create the world’s largest vertically-integrated TiO 2 pigment company (“New Tronox”) Exxaro will receive approximately 38.5% of the common equity in New Tronox in exchange for its mineral sands operations, which will be contributed debt free For the LTM period ended 9/30/2011, New Tronox generated pro forma revenues of $2,205 million and Adjusted EBITDA of $695 million (32% Adjusted EBITDA margin) New Tronox will have approximately 3,500 employees and 16 locations around the world The acquisition is expected to close in Q2 2012 Prior to the closing of the acquisition, Tronox will refinance its existing Senior Secured Term Loan with a new $425 million Senior Secured Term Loan and $125 million Senior Secured Delayed Draw Term Loan (together, the “Term Facility”) The Term Facility will expressly permit the Exxaro acquisition and, together with cash on hand, will fund all cash uses in connection with the acquisition Tronox’s existing $125 million ABL Revolver expected to remain outstanding. New Tronox may upsize the current $125 million ABL facility to up to $400 million Pro forma for the financing, total leverage will be 1.1x on a standalone basis and 0.8x on a pro forma basis, based on LTM 9/30/2011 Adjusted EBITDA 8 8 |
 9 Sources and Uses 1. Estimated. 2. Estimated capex reimbursement to Exxaro at closing for growth capex incurred between signing and Apr-2012. 3. Estimated net debt and working capital adjustments. Financing Closing ($ in millions) Sources $mm Uses $mm New Senior Secured Term Loan $ 425.0 Refinance Existing Senior Secured Term Loan $ 421.7 Balance Sheet Cash 9.5 Estimated Transaction Fees, OID, and Expenses 12.8 Total Funded Sources $ 434.5 Total Funded Uses $ 434.5 New Senior Secured Delayed Draw Term Loan 125.0 New Senior Secured Delayed Draw Term Loan 125.0 Total Sources $ 559.5 Total Uses $ 559.5 Pro Forma for April 30, 2012 Closing of Acquisition ($ in millions) Sources $mm Uses $mm Cash 1 $ 178.6 Cash Merger Consideration ($12.50/share) $ 190.0 New Senior Secured Delayed Draw Term Loan 125.0 Closing Capex Adjustment 2 75.0 Other Closing Adjustments 3 8.6 Estimated Transaction Fees 30.0 Total Sources $ 303.6 Total Uses $ 303.6 |
 10 Pro Forma Capitalization 1. Standalone Tronox will have ~$17mm of LCs posted under the Revolving Credit Facility. 2. New Tronox will have ~$47mm of LCs posted under the Revolving Credit Facility. New Tronox may increase the size of the ABL to up to $400mm. 3. New Tronox assumes consolidation of Exxaro’s 50% interest in Tiwest Finance lease at closing. 4. Market capitalization as of 25-Jan 2012. New Tronox market cap includes ~10.0mm Class B shares to be issued at closing and ~1.4mm Class B shares allocated for potential future issuance to Exxaro for Exxaro’s retained 26% interest in the South African businesses. Standalone Tronox New Tronox ($ in millions) Refinancing PF for x LTM 9/30/2011 Stand Alone M&A Related PF for M&A x LTM 9/30/2011 9/30/2011 Adjustments Refinancing Adj. EBITDA April '12 Adjustments Closing Adj. EBITDA Cash $ 130.6 $(9.5) $ 121.1 NA NA NA $125mm Asset Based Revolving Credit Facility 1 - - - 0.0 x - NA NA New Asset Based Revolving Credit Facility 2 NA NA NA NA NA - - 0.0 x New Senior Secured Term Loan - 425.0 425.0 1.0 425.0 - 425.0 0.6 New Senior Secured Delayed Draw Term Loan - - - 1.0 - 125.0 125.0 0.8 Existing Senior Secured Term Loan 421.8 (421.8) - 1.0 - - - 0.8 Total Secured Debt $ 421.8 $ 425.0 1.0 x $ 425.0 $ 550.0 0.8 x Tiwest Finance Lease 3 6.6 - 6.6 1.1 x 6.6 6.6 13.2 0.8 x Total Debt $ 428.4 $ 431.6 1.1 x $ 431.6 $ 563.2 0.8 x Market Capitalization 4 2,025.0 - 2,025.0 4.9 x 2,025.0 - 3,564.0 5.1 x Enterprise Value $ 2,322.8 $ 2,335.5 5.7 x $ 2,456.6 $ 4,127.2 5.9 x Adjusted EBITDA Tronox Standalone LTM 9/30/11 $ 409.7 New Tronox Adjusted LTM 9/30/11 $ 694.7 |
 II. Tronox Overview 11 11 |
 Tronox Overview Company Overview Global pure play TiO 2 producer One of the largest global TiO 2 producers and marketers with 8% share of global capacity Focused primarily on coatings, plastics and paper laminates Efficient, low-cost manufacturing footprint Global operations and international presence Specialty electrolytic chemicals operations Financial Summary Production Facilities ($US in millions) 12 (units in MT) 1. Includes 100% of Tiwest pigment. 2. Shown at 100% of JV capacity and production. 12 Pigment Facilities Location Capacity Hamilton 225,000 Botlek 90,000 Electrolytic Facilities Location Capacity Hamilton (Sodium Chlorate) 150,000 Henderson (EMD) 27,000 Henderson (Boron Products) 525 Tiwest Joint Venture Facilities² Location Capacity Kwinana 150,000 Northern Operations Capacity Zircon 70,000 Synthetic Rutile 220,000 Rutile 36,000 Leucoxene 26,000 LTM 2008A 2009A 2010A 9/30/2011 Pigment Revenue $ 1,116 $ 938 $ 1,068 $ 1,450 Electrolytics 121 127 128 135 Other 8 5 21 9 Revenue $ 1,246 $ 1,070 $ 1,218 $ 1,594 Adj. EBITDA $ 99 $ 142 $ 203 $ 410 Margin 8% 13% 17% 26% 1 |
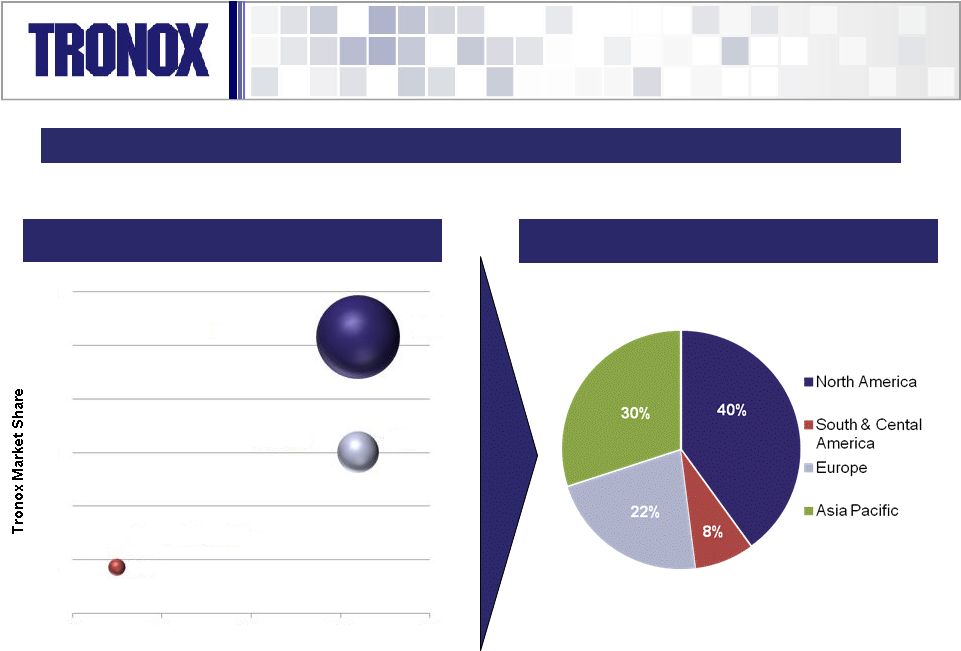 Tronox Overall Position Summary 2010A Tronox Geographic Positioning by Sales Volumes Note: Size of bubble represents Tronox sales in its end markets. Projected growth rates are internal Tronox estimates. 13 78% 19% 3% 0% 2% 4% 6% 8% 10% 12% -1% 0% 2% 3% 4% Coatings Plastics Paper & Specialties Market Growth Rate Tronox’s sales effort is leveraged towards the higher growth and higher value segments 2010A Tronox Positioning in TiO 2 Market |
 100% of Tronox capacity is produced via the chloride process Chloride technology yields consistently whiter, brighter pigment grades preferred for many of the largest end-use applications (e.g. paints and plastics) as compared to the sulfate process The chloride production process offers significant cost savings over the sulfate process Generates less waste, uses less energy and is less labor intensive than the sulfate process Results in ~15% cost advantage (according to TZMI) Proprietary technology and numerous worldwide patents create barriers to entry Proprietary technology, operating expertise and worldwide patents require technical sophistication and a highly skilled workforce that cannot be easily replicated by new entrants Extremely complex to develop and operate the chloride process technology Significant lead time and capital required to build chloride plant Proprietary Process and Highly Efficient Flexible Operations Tronox is one of only five major TiO 2 producers in the world utilizing proprietary chloride technology 14 |
 III. Exxaro Mineral Sands Overview 15 15 |
 16 Exxaro Mineral Sands Combination Rationale Tronox and Exxaro have worked together for more than 20 years, having jointly operated the Tiwest Joint Venture, which is a vertically integrated TiO 2 operation that served as the model for the New Tronox The combination is expected to create the following benefits for New Tronox: A secured ore supply that will help reduce earnings volatility from raw material price fluctuations and / or supply constraints Secured ore supply creates a solid platform for future growth and enhanced earnings potential Increases scale, public market profile and access to capital markets Expected run-rate cost savings of ~$30mm in the short-term and potential for additional cost savings in the longer-term Substantial free cash flow generation with flexible capital expenditures The Tronox / Exxaro Mineral Sands combination creates the leading global, vertically-integrated TiO 2 pigment producer with access to diverse and growing global markets |
 Exxaro Mineral Sands Overview Company Overview Exxaro Mineral Sands is comprised of KZN Sands, Namakwa Sands and a 50% interest in the Tiwest JV 3 rd largest titanium ore feedstock producer globally in 2010 (10% market share) with 3 producing assets 3 rd largest zircon producer globally in 2010 Geographically well positioned to serve markets in Asia, the Middle East, Europe, North and South America Existing inventory will be enough to supply slag furnaces until the Fairbreeze mine is online Financial Summary ($USD mm) Production Facilities 17 (units in MT) 17 Revenue by Segment (Avg. 2008A – 2010A) LTM 2008A 2009A 2010A 9/30/2011 Revenue $ 334 $ 419 $ 636 $ 864 Adj. EBITDA $ 57 $ 142 $ 133 $ 285 % Margin 17% 34% 21% 33% Capex $ 69 $ 99 $ 95 $ 102 Location Capacity Kwinana 150,000 Northern Operations Capacity Synthetic Rutile 220,000 Zircon 70,000 Rutile 36,000 Leucoxene 26,000 Reserve Life of Mine 15+ years Tiwest Joint Venture Facilities ² Titanium Feedstocks Slag 25% Rutile 6% SR 5% Zircon 27% Pigment 24% 1. Shown at 100% of JV capacity and production. 2. KZN Sands gives effect to Fairbreeze mine development project expected to open in 2014 with 190kt of TiO ore capacity and 60kt of zircon capacity. Other 13% Namakwa Sands Capacity Slag 160,000 Zircon 135,000 Pig Iron 100,000 Rutile 31,000 Reserve Life of Mine 20+ years KZN Sands³ Capacity Slag 220,000 Pig Iron / Scrap Iron 121,000 Zircon 60,000 Rutile 30,000 Reserve Life of Mine 12+ years Mineral Sands Facilities 2 |
 New Tronox EBITDA Profile 18 Standalone Tronox Adj. EBITDA Contribution New Tronox will benefit from a more diversified earnings stream New Tronox Adj. EBITDA Contribution Zircon, Pig Iron & Other 22% |
 IV. Perspective on the TiO 2 Market 19 |
 20 Factors that Influence the TiO 2 Cycle Long-term global demand for TiO 2 is expected to grow by approximately 3-4%, which is consistent with long-term GDP trends Global sales of TiO 2 in 2010 are estimated to have exceeded 5.3 million tonnes, generating approximately $12 billion in industry-wide revenues Demand for TiO 2 is being driven in part by a resurgent global economy following the economic downturn in 2008 and 2009 The global market for TiO 2 is expected to remain healthy due primarily to support from the ongoing growth in emerging economies Long-term demand TiO 2 usage per capita in the major emerging markets, particularly in China and India, is significantly below that seen in most Western countries Demand Significant TiO 2 capacity reductions in 2009 (7-8% of global capacity) with very limited new capacity expected due to high costs, long lead time and difficult permitting process Tronox has increased prices by ~10% from 2009 to 2010 and by ~40% from 2010 to 2011 Titanium feedstock demand will continue to outpace supply for the near and medium term, as no new substantive supply is expected to come online until at least 2014 Pricing |
 21 21 Industry Capacity Utilization During the last cycle, over 380,000 MT of capacity was taken out of market, which management estimates to be a 7 – 8% reduction Bringing new capacity online requires significant capex, long lead time and requires difficult to achieve permitting (in particular environmental regulations): as a result a new Chloride facility has not been built since 1994 1. Tronox management data. Significant Capacity Reductions The global TiO 2 pigment market has been tight with major producers operating near full capacity (>95%) 60% 65% 70% 75% 80% 85% 90% 95% 100% 1986 1987 1988 1989 1990 1991 1992 1993 1994 1995 1996 1997 1998 1999 2000 2001 2002 2003 2004 2005 2006 2007 2008 2009 2010 2011 380,000 MT taken out via plant closures – Grimsby (s) 40 – France (s) 65 – Chinese (s) 125 – Baltimore (c) 50 – Savannah (c)100 10 plants built during this period with last Chloride plant built in 1994 210,000 MT taken out via plant closures – Antioch (c) 30 – Baltimore (s) 50 – Antwerp (s) 30 – Grimsby (s) 40 – Savannah (s) 60 1 |
 22 2.0% 1.5% 2.0% 0.0% 2.0% 4.0% 3.5% 6.0% 3.5% 8.5% 7.5% 7.5% 2.6 Billion people in China and India 0.25kg per capita increase in consumption in these two countries over 3 years equates to 650,000MT increase in demand (11.6% increase in market capacity, or approximately 3 plants the size of Hamilton) TiO 2 Consumption per Capita and Growth Rates 2008–2013 Est. CAGR : Emerging Markets Significant long-term TiO 2 consumption growth expected from emerging markets 1. Company estimates and U.S. Government Population Statistics. TiO 2 usage per capita in the major emerging markets, particularly in China and India, is significantly below that seen in most Western countries Rising Demand from Emerging Markets… 1 |
 23 Increase in Households and Population: 2030E Increase Over 2000 Levels Population and Urbanization to Drive Demand Growth in Emerging Markets Source: TZMI 4Q 2011 forecast. Despite sluggish housing starts in the U.S. and Europe, supply / demand dynamics remain strong The combination of U.S. / European improvements and an ever increasing population / urbanization in emerging markets are expected to be a major contributor to demand growth ...As Global Economies Grow Asian Middle Class Forecast: 2010, 2020 & 2030 CAGR (%) |
 Constrained Feedstock Environment is Expected to Persist Fundamentals for titanium feedstocks remain strong, despite recent softening in China Developing countries’ intensity of pigment use is expected to grow with rising living standards (GDP/capita) Supply deficits remain tight for most feedstock products, particularly for high quality chloride feedstocks No new substantive supply expected to enter the market prior to year end 2013 High risk and long lead time (typically 5-7 years) in starting new projects Ore suppliers have succeeded in moving prices higher and changing prices quickly Ore prices are expected to increase for pigment producers, despite short-term demand softening Vertical integration into ore provides significant advantages Opportunity to capture value throughout the TiO 2 chain Growth enabled through assured feedstock 24 1. Per TZMI 4Q2011 forecast. 2. Goldman Sachs Research. Global Supply / Demand for Titanium Feedstock Feedstock Pricing ($ / tonne) Ore supply is tight, creating a favorable pricing environment for the foreseeable future 24 Existing / Approved Production Potential New Projects Underlying Demand 1 2 1 |
 TiO 2 pigment producers are limited in their ability to make significant capacity expansions to meet incremental demand due to the constrained ore market Access to ore is critical for any meaningful capacity increases Limited substitutes Time and cost to build greenfield plants Tronox management estimates that during 2007-2009, approximately 7-8% of global capacity was shuttered The projected expansion of TiO 2 pigment supply reflects announced but not completed production facilities, most of which are in China and producing via the sulfate process Current supply dynamics and projected demand increases is expected to result in a continued favorable pricing environment over the long term TiO 2 - Supply/Demand (000’s tonnes) 1 25 TiO 2 Pigment Pricing ($ / tonne) 2 1. Per TZMI 4Q2011 forecast. 2. Per TZMI 4Q2011 forecast. 25 Structural Shift in the Industry Expected to Continue to Drive TiO 2 Prices Higher 3,000 4,000 5,000 6,000 7,000 2007A 2008A 2009A 2010A 2011F 2012F 2013F 2014F 2015F Supply Potential New Projects Demand 0.0% 50.0% 100.0% 150.0% 200.0% 250.0% 2009A 2010A 2011E 2012E 2013E 2014E 2015E As a result of strong underlying demand, a lack of capacity and overall structural shift in the industry, TiO 2 prices have increased significantly and are expected to remain high |
 Tronox Has Experienced an Enduring Step Change in Profitability 26 The fundamental structure of the TiO2 value chain has changed 8% reduction of pigment supply in 2008/2009 No new chloride plants have been built since 1994 No new major feedstock supply since 2008/2009 Demand has increased by 14% during the same period These structural conditions can only be changed by the addition of new pigment production capacity AND new feedstock supply. These projects require 3 to 5 years to bring online and identified potential new facilities are not expected to keep up with forecasted demand growth Demand growth is highly correlated to development; Asia, India and other developing markets are materially expanding their urban middle class There are no practical substitutes for TiO2 in coatings; in addition, TiO2 is only ~13% of the cost of paint • Although extremely conservative, Tronox has examined a potential stress / downside case with the following assumptions: • Pigment volumes reduced by 16%; current pigment price levels reduced by $1,000 / tonne and Exxaro margins reduced by 50% Adjusted EBITDA ($ in millions) Standalone Tronox Illustrative Downside Adj. EBITDA of ~$325mm $695 $184 $336 $ 99 $ 142 $ 203 $ 410 $ 564 2008 2009 2010 LTM 3Q 2011 3Q 2011 Annualized Standalone Tronox Adj. EBITDA New Tronox Adj. EBITDA Standalone Tronox Illustrative Downside Adj. EBITDA New Tronox Illustrative Downside Adj. EBITDA $1,072 $156 New Tronox Illustrative Downside Adj. EBITDA of ~$585mm |
 V. Key Credit Highlights 27 |
 Leading Global Pigment Platform Well Positioned Against its Peers Strong Financial Momentum Strong and Experienced Management Team Key Credit Strengths Long-Standing Blue Chip TiO2 Customer Relationships Vertical Integration Provides Significant Competitive Advantage Low Cost and Efficient Production Network 28 Compelling Operational Rationale |
 Leading Global Pigment Platform 29 Botlek, The Netherlands Hamilton, MS Namakwa Sands KZN Sands Tiwest Oklahoma City, OK Note: Namakwa Sands, KZN Sands and Tiwest are each made up of 3 locations. 1. 100% of capacity and production. 2. KZN Sands gives effect to Fairbreeze mine development project expected to open in 2014 with 190kt of TiO ² ore capacity and 60kt of zircon capacity. Headquarters Locations Henderson, NV New Tronox will have 3,500 employees in 16 locations around the world Johannesburg Singapore Shanghai, China 29 Location Capacity (MT) Hamilton 225,000 Botlek 90,000 Location Capacity (MT) Hamilton (Sodium Chlorate) 150,000 Henderson (EMD) 27,000 Henderson (Boron Products) 525 Location Capacity (MT) Kwinana 150,000 Northern Operations Capacity (MT) Synthetic Rutile 220,000 Zircon 70,000 Rutile 36,000 Leucoxene 26,000 Reserve Life of Mine 15+ years Namakwa Sands Capacity (MT) Slag 160,000 Zircon 135,000 Pig Iron 100,000 Rutile 31,000 Reserve Life of Mine 20+ years KZN Sands² Capacity (MT) Slag 220,000 Pig Iron / Scrap Iron 121,000 Zircon 60,000 Rutile 30,000 Reserve Life of Mine 12+ years Tronox Electrolytic Facilities Tiwest Joint Venture Facilities ¹ Exxaro Mineral Sands Facilities Tronox Pigment Facilities |
 Long-Standing Blue Chip TiO 2 Customer Relationships Tronox’s Blue Chip Customer Relationships 30 Builds strong relationships with its customers resulting in a high customer retention rate Tronox has supplied its top ten TiO 2 customers for over ten years Diversified customer base of approximately 1,000 customers in over 90 countries Customers include market leaders in each of the major end-use markets for TiO 2 Approximately 40% of global volume under multi- year contracts with market based pricing Tronox works closely with its customers to optimize their formulations, thereby enhancing the use of TiO 2 in their production processes |
 31 Low Cost and Efficient Production Network Combined with the Exxaro Mineral Sands’ titanium feedstock assets in South Africa and Australia, this network of TiO2 and titanium feedstock facilities will give New Tronox the flexibility to optimize asset and feedstock utilization and generate operational, logistical and market efficiencies Vertical Integration gives us a significant cost / tonne advantage The Company’s TiO 2 operations are among the lowest cost producers of TiO 2 globally Vertically Integrated Production Significant and Scalable Operations Gateway to Asia Geographic Diversity Tronox’s three TiO2 production facilities are strategically positioned in key geographies: North America, Europe and Australia The Hamilton facility is the third largest TiO2 production facility in the world and has the size and scale to service customers in North America and around the globe The Tiwest Joint Venture, located in Australia, is well positioned to service growing demand from Asian markets |
 Vertical Integration Provides Significant Competitive Advantage 32 Tronox Today (000’s tonnes of ore) New Tronox (000’s tonnes of ore) New Tronox will be long of titanium feedstock, giving the Company significant advantages compared to its peers, especially in a today’s rising ore pricing environment 32 Tronox today is required to source ~229,000 tonnes of feedstock in the open market New Tronox will be long ~211,000 tonnes of feedstock Tronox Titanium Feedstock Requirements Tronox Titanium Feedstock Requirments Tronox Titanium Feedstock Capacity Tronox Titanium Feedstock Capacity 200 429 723 512 |
 33 Business Model Pigments value chain TiO ² pigments Primarily TiO ² pigments Diversified chemicals TiO ² pigment exposure Diversified chemicals TiO ² pigment exposure LTM Revenue $2,205 mm ¹ NA $1,879 mm Total: $11,000 mm Pigment: $1,550 mm Total: $37,587 mm LTM Adj. EBITDA $695 mm ¹ NA $510 mm Total : $1,135 mm Pigment: $434 mm Total: $6,327 mm EBITDA Margin 31.5% NA 27.1% total Total: 10.3% Pigment: 28.0% Total: 16.8% Total Capacity 465 kt 750 kt 532 kt 560 kt 1,100 kt % Chloride vs. Sulfate Capacity (Based on Capacity) Location of Facilities Hamilton, MS Kwinana, Australia Botlek, The Netherlands Ashtabula, OH Yanbu, Saudi Arabia Stallingborough, UK Kemerton, Australia Arembepe, Brazil Thann, France Baltimore, MD Leverkusen, Germany Varennes, Canada Langerbrugge, Belgium Nordenham,Germany Fredrikstad, Norway Lake Charles, LA Greatham, UK Calais, France Huelva, Spain Scarlino, Italy Lake Charles, LA Telek Kalung, Malaysia Umbogintwini, SA New Johnsonville, TN DeLisle, MS Altamira, Mexico Kuan Yin, Taiwan Edge Moor, DE Ore Production / Feedstock Integration Fully integrated Total: 723 kt Partially dependant on third-party feedstock ² ~60% dependant on third-party feedstock ³ ~90% dependant on third-party feedstock ³ Pro Forma Source: Company filings, Wall Street Research and TZMI 1. Tronox Revenue and Adjusted LTM EBITDA presented on a combined 2011E basis. 2. Operates mine in Paraiba, Brazil. Owner of Bemax (Australia), world’s 5 largest producer. Potential to increase existing ore capacity with ore from the Snapper mine which will come into production in 2011. 3. Based on 2010A ore production figures for Kronos. 328 kt ilmenite used in sulfate process. Purchase slag/rutile (470 kt). 4. Based on DuPont Jul-2011 conference call transcript. DuPont operates a titanium ore surface mine near Starke, FL. . Well Positioned Against Its Peers Pure Play TiO2 Diversified Chloride 100% Chloride 88% Sulfate 12% Chloride 100% th Sulfate 25% Chloride 45% Chloride 75% Sulfate 55% |
 Compelling Operational Rationale 34 Consolidation of Tiwest JV Elimination of duplicate services Rationalization of SG&A Marketing Supply & chain Finance Improved logistics – larger shipments to fewer clients Near Term Synergies Medium Term Synergies Estimated Run-Rate savings of ~$30 mm (annual) Optimization of ore in-use High grade TiO 2 feedstocks Cheaper slag fines Significant cost advantages from optimization Less waste (better environmental management) Lower chlorine & coke costs Lower freight costs per tonne of TiO 2 Ability to effectively “debottleneck” pigment production with limited capital expenditures New Tronox’s network of TiO 2 and titanium feedstock facilities will have the flexibility to optimize asset and feedstock utilization, and a secured ore supply creates a solid platform for future growth and enhanced earnings potential |
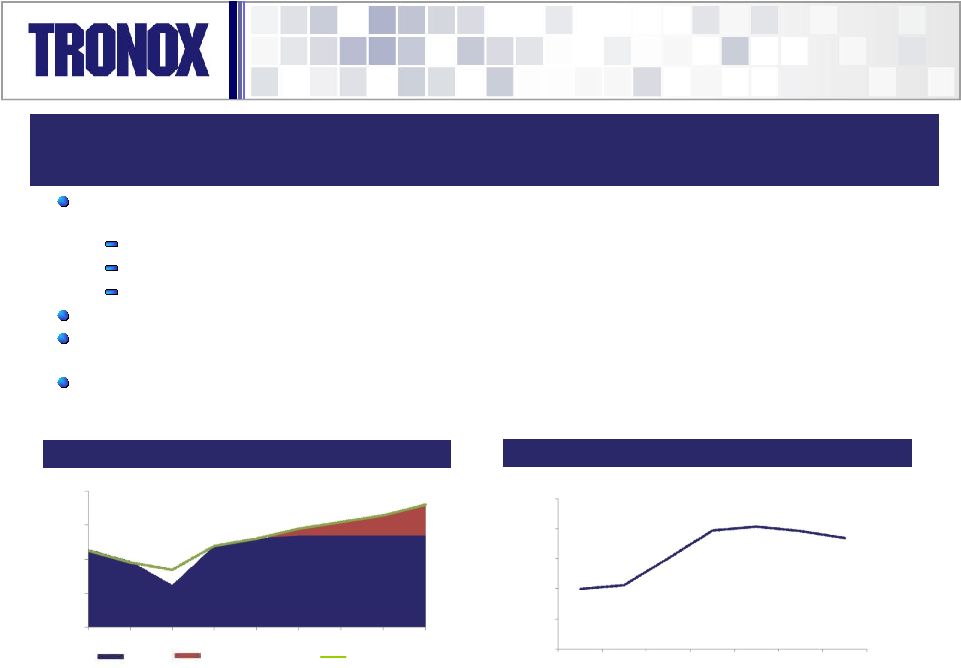
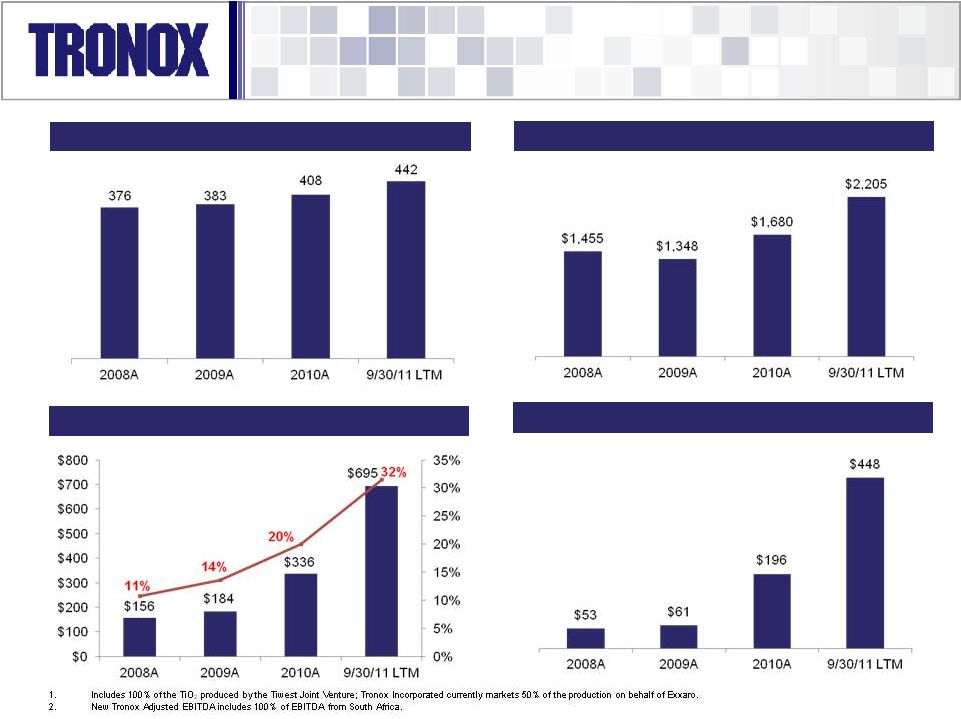
 New Tronox Net Sales ($MM) Strong Financial Momentum 35 Standalone Tronox Adj. EBITDA ($MM) New Tronox Adj. EBITDA ($MM) Standalone Tronox Net Sales ($MM) Since 2008, Tronox has increased Adjusted EBITDA by 390% |
 Strong and Experienced Management Team 36 36 Joined the company in 1991 Vice President, Administrative and Materials Procurement since January 2011 Other positions at Tronox have included: Vice President of Human Resources and Corporate Affairs, Vice President of Global Pigment Marketing; Chief Marketing Officer of Avestor (the high technology battery joint venture); Vice President and General Manager, Paper and Specialties; and Vice President, Investor Relations Robert Gibney Vice President, Administration and Materials Procurement Chairman since February 2011 Chief Executive Officer since October 2011 Previously served in various senior managerial and directorial roles, including: CEO of Current Group, Chairman & CEO of One Communications Corp, and various senior positions at Global Crossing Other experience also includes more than five years practicing law in the public and private sectors, and three years of investment banking Tom Casey Chairman and Chief Executive Officer John Romano Executive Vice President Joined the company in 1988 Executive Vice President since January 2011 Other positions at Tronox have included: Vice President, Sales; Vice President, Global Pigment Sales for Tronox LLC; Vice President, Global Pigment Marketing; and Regional Marketing Manager Mike Foster Vice President, General Counsel and Secretary Vice President, General Counsel and Secretary since January 2008 Other positions at Tronox have included: Managing Counsel, Staff Attorney and Staff Attorney for Kerr-McGee Shared Services LLC Previously Corporate Counsel for CMS Field Services and Counsel for Enogex, Inc. Experience also includes more than five years practicing law in the public and private sectors Joined the company in January 2012 Previously served in various executive financial and operational roles, including Chief Financial Officer at Terra Industries, Corporate Controller for Belden, Inc., Chief Financial Officer for Zoltek Companies, Operations Manager for Sigma Chemical Company, and Senior Manager at KPMG Experience includes acquisition execution and financial system integration Daniel Greenwell Senior Vice President and Chief Financial Officer |
 VI. Historical Financial Performance 37 |
 Adjusted EBITDA Standalone Tronox Historical Financials 38 Revenue Pigment Sales Volumes¹ (Kt) Adjusted EBITDA – Capex 1. Includes 100% of the TiO ² produced by the Tiwest Joint Venture; Tronox Incorporated currently markets 50% of the production on behalf of Exxaro. |
 New Tronox Adjusted EBITDA² New Tronox Pro Forma Historical Financials 39 New Tronox Revenue New Tronox Pigment Sales Volumes¹ (Kt) New Tronox Adjusted EBITDA – Capex |
 VII.Summary Terms and Timeline 40 |
 41 Indicative Summary of Terms Senior Secured Term Loan Borrower Tronox Pigments (Netherlands) BV Guarantors Each of (i) the Borrower’s existing and subsequently acquired or organized subsidiaries, (ii) Tronox’s direct and indirect existing and subsequently acquired or organized subsidiaries and (iii) following the consummation of the acquisition of Exxaro Mineral Sands, each of New Tronox‘s direct and indirect existing and subsequently acquired or organized subsidiaries, in each case, subject to certain exceptions (including the exclusion of all South African entities) Security First Lien on all assets of the Company excluding those assets which secure the ABL Revolver (A/R and Inventory) and Second Lien on the ABL Assets Amount $425mm Senior Secured Term Loan $125mm Delayed Draw Term Loan (6 month availability) Incremental Facility $100 million (subject to 50bps MFN) Maturity 6 years Amortization 1% per annum (or 0.25% for each quarter of any partial year), with the remaining balance due on the six–year anniversary of the Closing Date Indicative Coupon L + TBD bps (TBD LIBOR floor) Delayed Draw Commitment Fee TBD Original Issue Discount TBD Call Protection 101 “soft call” for one year Mandatory Prepayments 100% Asset Sales, 100% Insurance Proceeds, 100% Debt Issuance, 50% Excess Cash Flow in year one (subject to step-downs based on Net Total Leverage thereafter) Financial Covenant Maximum Net Total Leverage Negative Covenants Standard and customary, including, but not limited to: incurrence of additional debt, asset sales, liens, restricted payments, investments, mergers and acquisitions, transactions with affiliates |
 42 Summary Timetable Date: Event January 23 rd Announce Transaction January 26 th Bank Meeting February 3 rd Lender Commitments Due February 6 th Expected Pricing February 8 th Expected Closing and Funding January 2012 February 2012 S M T W T F S S M T W T F S 1 2 3 4 5 6 7 1 2 3 4 8 9 10 11 12 13 14 5 6 7 8 9 10 11 15 16 17 18 19 20 21 12 13 14 15 16 17 18 22 23 24 25 26 27 28 19 20 21 22 23 24 25 29 30 31 26 27 28 Key Date |
 Appendix 43 43 |
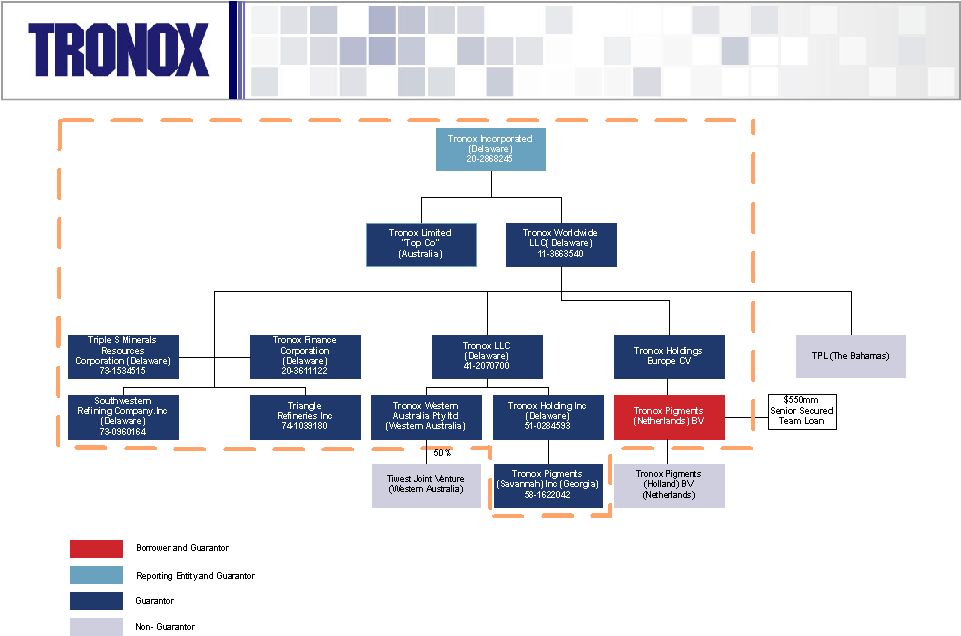 Standalone Tronox Pro Forma Corporate Structure 44 Note: Dotted line delineates boundary of guarantors under the credit facility. |
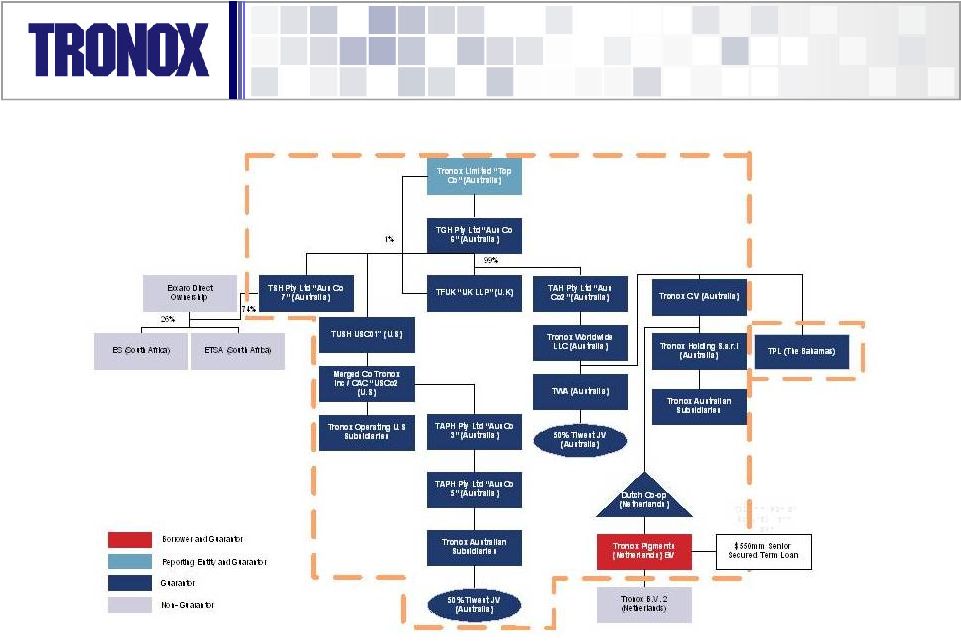 45 New Tronox Pro Forma Corporate Structure Note: Dotted line delineates boundary of guarantors under the credit facility. Non-U.S. entities will provide a 45-day post-closing period to provide the guarantees. |
 Exxaro Transaction Detail Transaction Structure Detail Current Tronox shareholders to exchange existing common stock for new Class A shares in Australian-domiciled company (“New Tronox”) and $12.50 of cash per share Option to receive exchangeable shares in Tronox Inc. with right to exchange later into Class A shares of New Tronox and $12.50 per share, subject to minimum and maximum (with pro ration) election thresholds Exchangeable share election is intended to provide certain Tronox shareholders with a mechanism to retain their Tronox shares and perhaps allow them to defer a taxable event until the exchangeable share is exchanged into stock of New Tronox and cash Exxaro contributing mineral sands operations to New Tronox in exchange for Class B shares in New Tronox Exxaro to retain 26% direct minority ownership in the South African businesses to comply with South African BEE ownership requirements Transaction should be taxable to Tronox shareholders Exxaro Class B Shares Approximately 10.0 million shares issued to Exxaro (excluding put/call shares) Put/call shares: 1.4 million shares in exchange for Exxaro’s 26% direct interest in the South African operations in the event that the BEE compliance structure is no longer required 46 46 |
 Exxaro Transaction Detail (cont’d) Pro Forma Shares Outstanding 25.2 million shares outstanding (excluding Exxaro’s put/call shares) Intention to list on a major exchange, such as the NYSE, after closing Board of Directors 9 member board comprising: 6 Class A Directors (including the CEO of Tronox) and 3 Class B Directors (nominated by Exxaro) Tom Casey will remain CEO and Chairman of New Tronox Regulatory Approvals Requires regulatory approvals from South Africa Department of Mineral Resources, South Africa Reserve Bank and Australian Foreign Investment Review Board Competition authorities SEC registration and Tronox shareholder approval Anticipated Closing 2Q 2012 47 47 |
 Additional Tax Asset Information Tronox should retain many of the tax attributes it presently has available to it, including historical NOLs (subject to annual limitation) Tax attributes appear to be worth at least $300 million on a Net Present Value basis These tax attributes (which are subject to audit by IRS) consist of: Pre-emergence NOLs (~$160 million) Tax deductions arising from Tronox's bankruptcy emergence (“interest premium”: ~$1 billion) Potential future deductions relating to environmental remediation agreed to as part of the bankruptcy emergence Transaction with Exxaro is expected result in an “ownership change” for purposes of §382, thereby imposing an annual limitation on Tronox's ability to utilize its NOLs The amount of such limitation will depend on the value of Tronox's stock at closing and on long-term tax-exempt interest rate at that time, and thus the annual limitation cannot be known at this time However, any limitation is not expected to have a significant impact on a Net Present Value basis to Tronox’s tax attributes 48 48 |
 Financial Reconciliation 49 ($US in millions) Note: Pro forma financials do not include synergies or cost savings; Unaudited Tronox financials for 2008 and 2009. 49 1 Intercompany eliminations are primarily due to sales from Exxaro’s South African mineral sands assets to Tronox's pigment operations. On a pro forma basis, those sales will become intercompany and will be eliminated on the revenue and cost side. Since the Tiwest Joint Venture is currently incorporated into Tronox's financials on a proportionate basis in the standalone financials, there are limited incremental intercompany eliminations as a result of the transaction. LTM 9 mos ended 9 mos ended 2008A 2009A 2010A 9/30/2011 9/30/2010 9/30/2011 Tronox Revenue $ 1,246 $ 1,070 $ 1,218 $ 1,594 $ 892 $ 1,268 Exxaro Revenue 334 419 634 864 458 688 Less Pro Forma Intercompany Eliminations 1 (125) (141) (172) (254) (129) (211) Combined Revenue $ 1,455 $ 1,348 $ 1,680 $ 2,205 $ 1,221 $ 1,745 Tronox Adjusted EBITDA $ 99 $ 142 $ 203 $ 410 $ 148 $ 354 Exxaro EBITDA 57 42 133 285 108 260 Adj. EBITDA $ 156 $ 184 $ 336 $ 695 $ 256 $ 614 Tronox Capex $ 34 $ 24 $ 45 $ 145 $ 27 $ 126 Exxaro Capex 69 99 95 102 64 72 Combined Capex $ 103 $ 123 $ 140 $ 247 $ 90 $ 198 |
 Tronox EBITDA Reconciliation 50 ($US in millions) 50 LTM 9 Mos Ended 9 Mos Ended 2008 2009 2010 9/30/2011 9/30/2011 9/30/2010 Net income (loss) ($335) ($39) $5 $766 $807 $45 Interest and debt expense $54 $36 $50 $35 $24 $40 Income tax provision (benefit) ($2) ($2) $2 $3 $4 $3 Depreciation and amortization expense $76 $53 $50 $74 $61 $37 Income (loss) from discontinued operations $1 $1 - - EBITDA ($207) $49 $108 $878.4 $896 $125 Reorganization expense associated with bankruptcy ¹ - $13 $145 $124 $46 $67 Gain on fresh start accounting - - - ($659) ($659) - Noncash gain on liquidation of subsidiary - - ($5) ($0) ($0) ($5) Provision for environmental remediation and restoration, net of reimbursements ² $73 - ($47) ($12) ($5) ($40) (Income) Loss from discontinued operations $189 $10 ($1) ($2) $0 $1 Restructuring costs not associated with the bankruptcy $14 - - - - - Pension and post retirement settlement/curtailments $26 $10 - - - - Gain on sale of assets ($25) ($1) - - - - Impairment charges 3 $25 $0 - - - - Unusual or non-recurring items 4 - $24 - - - - Litigation Settlement ($10) ($10) - Plant closure costs - $25 $1 ($0) $0 $2 Fresh start inventory mark-up - - - $36 $36 - Stock-based compensation $1 $0 $1 $8 $8 $0 Foreign currency remeasurement ($7) $15 $12 $8 $1 $5 Transaction costs, registration rights penalty and financial statement restatement costs - - - $35 $35 - Other items 5 $11 ($4) ($9) $3 $6 ($6) Adjusted EBITDA $99 $142 $203 $410 $354 $148 1. The Company has incurred costs related to the Chapter 11 bankruptcy proceedings. These items include cash and non-cash charges related to contract terminations, prepetition obligations, debtor-in- possession financing costs, legal and professional fees. 2. In 2010, the Company recorded receivables from the insurance carrier related to environmental clean-up obligations at the Henderson facility. 3. In 2008, the Company recorded impairment charges of approximately $3.3 million related to the Savannah, Georgia, and approximately $21.6 million related to the Botlek, Netherlands, long-lived assets. 4. The 2009 amount represents the net loss on deconsolidation of the Company’s German subsidiaries. The 2010 amount is related to the liquidation of certain holding companies that resulted in a non-cash net gain due to the realization of cumulative translation adjustments. 5. Includes noncash pension and postretirement healthcare costs and accretion expense. |
 51 51 |