UNITED STATES
SECURITIES AND EXCHANGE COMMISSION
Washington, D.C. 20549
FORM N-CSR
CERTIFIED SHAREHOLDER REPORT OF REGISTERED MANAGEMENT INVESTMENT COMPANIES
Investment Company Act file number
First Trust Exchange-Traded Fund
(Exact name of registrant as specified in charter)
120 East Liberty Drive, Suite 400
Wheaton, IL 60187
(Address of principal executive offices) (Zip code)
W. Scott Jardine, Esq.
First Trust Portfolios L.P.
120 East Liberty Drive, Suite 400
Wheaton, IL 60187
(Name and address of agent for service)
Registrant's telephone number, including area code:
Date of reporting period:
Form N-CSR is to be used by management investment companies to file reports with the Commission not later than 10 days after the transmission to stockholders of any report that is required to be transmitted to stockholders under Rule 30e-1 under the Investment Company Act of 1940 (17 CFR 270.30e-1). The Commission may use the information provided on Form N-CSR in its regulatory, disclosure review, inspection, and policymaking roles.
A registrant is required to disclose the information specified by Form N-CSR, and the Commission will make this information public. A registrant is not required to respond to the collection of information contained in Form N-CSR unless the Form displays a currently valid Office of Management and Budget (“OMB”) control number. Please direct comments concerning the accuracy of the information collection burden estimate and any suggestions for reducing the burden to Secretary, Securities and Exchange Commission, 100 F Street, NE, Washington, DC 20549. The OMB has reviewed this collection of information under the clearance requirements of 44 U.S.C. § 3507.
Item 1. Reports to Shareholders.
(a) Following is a copy of the annual reports transmitted to shareholders pursuant to Rule 30e-1 under the Act.
First Trust Dow Jones Select
MicroCap Index Fund
FDM | NYSE ARCA, INC.
ANNUAL SHAREHOLDER REPORT | December 31, 2024
This annual shareholder report contains important information about the First Trust Dow Jones Select MicroCap Index Fund (the “Fund”) for the year of January 1, 2024 to December 31, 2024 (the “Period”). You can find additional information about the Fund at www.ftportfolios.com/fund-documents/etf/FDM. You can also request this information by contacting us at 1-800-621-1675 or info@ftportfolios.com.
WHAT WERE THE FUND COSTS FOR THE LAST YEAR?
(Based on a hypothetical $10,000 investment)
| Fund | Costs of a $10,000 investment | Costs paid as a percentage
of a $10,000 investment |
| First Trust Dow Jones Select MicroCap Index Fund | $64 | 0.60% |
HOW DID THE FUND PERFORM LAST YEAR? WHAT AFFECTED THE FUND’S PERFORMANCE?
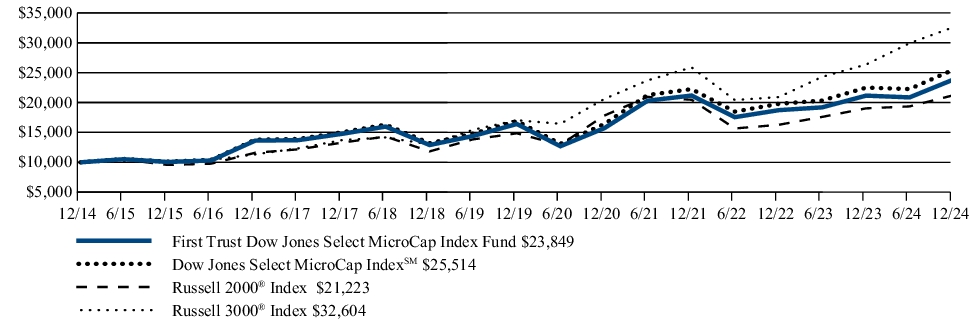
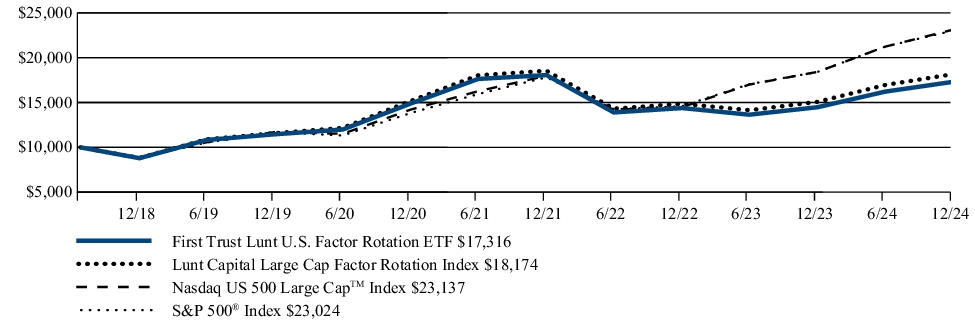
The Fund returned 12.73% during the 12 months ended December 31, 2024. The Fund outperformed its benchmark, the Russell 2000® Index, which returned 11.54% for the same Period.
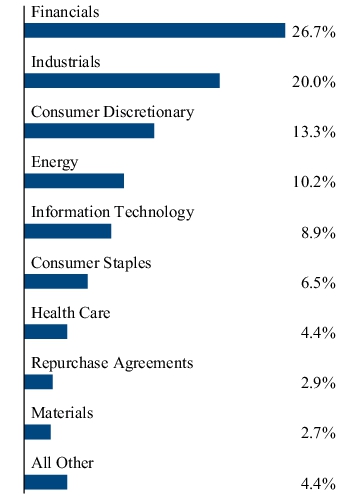
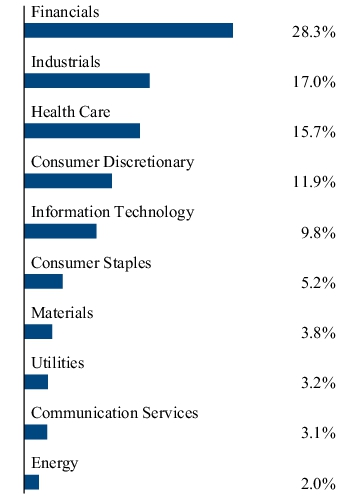
During the Period, the greatest allocation in the Fund went to securities in the Financials sector. This sector’s average weight in the Fund was 27.2% and contributed 5.1% to the Fund’s overall return. The greatest contribution to the Fund’s return was 6.9% from the allocation to the Industrials sector. The greatest source of drag for the Fund came from investments in the Consumer Discretionary sector, which caused a -2.2% drag in the Fund.
FUND PERFORMANCE (December 31, 2014 to December 31, 2024)
The performance line graph below shows the performance of a hypothetical $10,000 initial investment in the Fund over a ten-year period (or for the life of the Fund, if shorter). The subsequent account value as of the end of the Period is listed next to the name of the Fund or index, as applicable. The performance table below shows the average annual total returns of the Fund for the past one-, five-, and ten-year periods, as applicable (or for the life of the Fund, if shorter), as of the end of the Period. Both the line graph and performance table compare the Fund’s performance to an appropriate broad-based index and may compare to additional indices reflecting the market segment(s) in which the Fund invests over the same periods.
Investment Performance of $10,000
| Average Annual Total Returns (as of December 31, 2024) | 1 Year | 5 Year | 10 Year |
| First Trust Dow Jones Select MicroCap Index Fund | 12.73% | 7.76% | 9.08% |
| Dow Jones Select MicroCap IndexSM | 13.43% | 8.60% | 9.82% |
| Russell 2000® Index | 11.54% | 7.40% | 7.82% |
| Russell 3000® Index | 23.81% | 13.86% | 12.55% |
Visit www.ftportfolios.com/etf/FDM for more recent performance information.
The Fund’s past performance is not a good predictor of the Fund’s future performance. The graph and table do not reflect the deduction of taxes that a shareholder would pay on Fund distributions or redemption of Fund shares. The Fund’s total returns would have been lower if certain fees had not been waived and expenses reimbursed by the investment advisor.
KEY FUND STATISTICS (As of December 31, 2024)
| Fund net assets | $177,447,912 |
| Total number of portfolio holdings | 143 |
| Total advisory fee paid | $789,760 |
| Portfolio turnover rate | 71% |
WHAT DID THE FUND INVEST IN? (As of December 31, 2024)
The tables below show the investment makeup of the Fund, representing the percentage of total investments of the Fund.
| Turning Point Brands, Inc. | 1.8% |
| Vimeo, Inc. | 1.7% |
| Solaris Energy Infrastructure, Inc. | 1.7% |
| Centrus Energy Corp., Class A | 1.7% |
| Limbach Holdings, Inc. | 1.5% |
| Mizuho Financial Group, Inc. | 1.5% |
| RBC Dominion Securities, Inc. | 1.4% |
| BJ's Restaurants, Inc. | 1.4% |
| Central Pacific Financial Corp. | 1.4% |
| Hackett Group (The), Inc. | 1.3% |
WHERE CAN I FIND ADDITIONAL INFORMATION ABOUT THE FUND?
Visit www.ftportfolios.com/fund-documents/etf/FDM to view additional information about the Fund such as the prospectus, financial information, Fund holdings and proxy voting information. You may also request this information by contacting us at 1-800-621-1675 or info@ftportfolios.com.
OTHER INFORMATION
Dow Jones Select MicroCap IndexSM (“Index”) is a product of S&P Dow Jones Indices, LLC or its affiliates (“SPDJI”) and has been licensed for use by First Trust. S&P® is a registered trademark of Standard & Poor’s Financial Services LLC (“S&P”); Dow Jones® is a registered trademark of Dow Jones Trademark Holdings LLC (“Dow Jones”); and these trademarks have been licensed for use by SPDJI and sublicensed for certain purposes by First Trust. The Fund is not sponsored, endorsed, sold or promoted by SPDJI, Dow Jones, S&P or their respective affiliates and none of such parties make any representation regarding the advisability of investing in such product(s) nor do they have any liability for any errors, omissions, or interruptions of the Index.
First Trust Morningstar
Dividend Leaders Index Fund
FDL | NYSE ARCA, INC.
ANNUAL SHAREHOLDER REPORT | December 31, 2024
This annual shareholder report contains important information about the First Trust Morningstar Dividend Leaders Index Fund (the “Fund”) for the year of January 1, 2024 to December 31, 2024 (the “Period”). You can find additional information about the Fund at www.ftportfolios.com/fund-documents/etf/FDL. You can also request this information by contacting us at 1-800-621-1675 or info@ftportfolios.com.
WHAT WERE THE FUND COSTS FOR THE LAST YEAR?
(Based on a hypothetical $10,000 investment)
| Fund | Costs of a $10,000 investment | Costs paid as a percentage
of a $10,000 investment |
| First Trust Morningstar Dividend Leaders Index Fund | $47 | 0.43% |
HOW DID THE FUND PERFORM LAST YEAR? WHAT AFFECTED THE FUND’S PERFORMANCE?
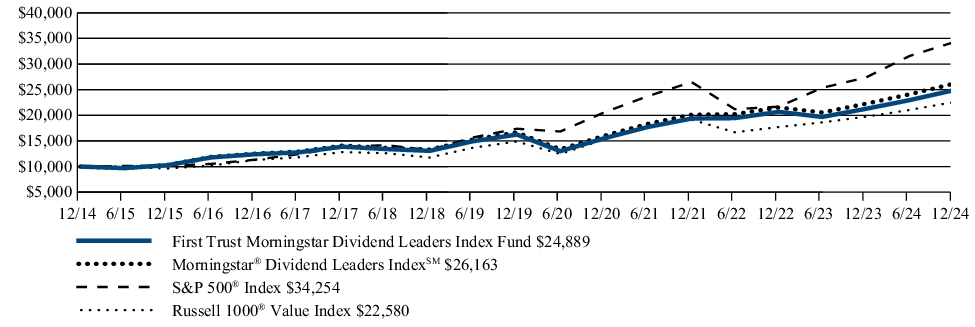
The Fund returned 16.98% during the 12 months ended December 31, 2024. The Fund underperformed its benchmark, the S&P 500® Index, which returned 25.02% for the same Period.
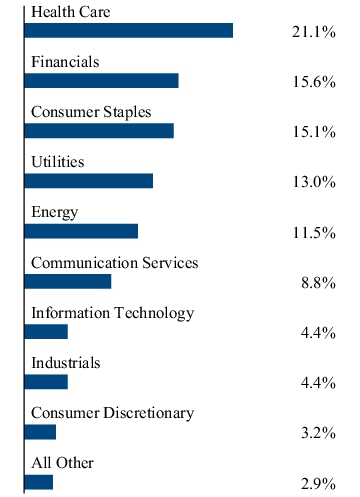
During the Period, the greatest allocation in the Fund was 19.4% to the Financials sector, which contributed 3.9% to the Fund’s overall return and were greatest source of return for the Fund. The most negative contribution to the Fund’s return came from investments in the Materials sector, which caused a -0.4% drag in the Fund.
FUND PERFORMANCE (December 31, 2014 to December 31, 2024)
The performance line graph below shows the performance of a hypothetical $10,000 initial investment in the Fund over a ten-year period (or for the life of the Fund, if shorter). The subsequent account value as of the end of the Period is listed next to the name of the Fund or index, as applicable. The performance table below shows the average annual total returns of the Fund for the past one-, five-, and ten-year periods, as applicable (or for the life of the Fund, if shorter), as of the end of the Period. Both the line graph and performance table compare the Fund’s performance to an appropriate broad-based index and may compare to additional indices reflecting the market segment(s) in which the Fund invests over the same periods.
Investment Performance of $10,000
| Average Annual Total Returns (as of December 31, 2024) | 1 Year | 5 Year | 10 Year |
| First Trust Morningstar Dividend Leaders Index Fund | 16.98% | 8.90% | 9.55% |
| Morningstar® Dividend Leaders IndexSM | 17.49% | 9.45% | 10.10% |
| S&P 500® Index | 25.02% | 14.53% | 13.10% |
| Russell 1000® Value Index | 14.37% | 8.68% | 8.49% |
Visit www.ftportfolios.com/etf/FDL for more recent performance information.
The Fund’s past performance is not a good predictor of the Fund’s future performance. The graph and table do not reflect the deduction of taxes that a shareholder would pay on Fund distributions or redemption of Fund shares. The Fund’s total returns would have been lower if certain fees had not been waived and expenses reimbursed by the investment advisor.
KEY FUND STATISTICS (As of December 31, 2024)
| Fund net assets | $4,451,266,050 |
| Total number of portfolio holdings | 96 |
| Total advisory fee paid | $12,291,397 |
| Portfolio turnover rate | 46% |
WHAT DID THE FUND INVEST IN? (As of December 31, 2024)
The tables below show the investment makeup of the Fund, representing the percentage of total investments of the Fund.
| AbbVie, Inc. | 8.4% |
| Verizon Communications, Inc. | 8.2% |
| Chevron Corp. | 7.6% |
| Pfizer, Inc. | 7.5% |
| Philip Morris International, Inc. | 6.0% |
| Altria Group, Inc. | 5.0% |
| International Business Machines Corp. | 4.4% |
| United Parcel Service, Inc., Class B | 3.5% |
| Gilead Sciences, Inc. | 2.9% |
| Duke Energy Corp. | 2.4% |
WHERE CAN I FIND ADDITIONAL INFORMATION ABOUT THE FUND?
Visit www.ftportfolios.com/fund-documents/etf/FDL to view additional information about the Fund such as the prospectus, financial information, Fund holdings and proxy voting information. You may also request this information by contacting us at 1-800-621-1675 or info@ftportfolios.com.
OTHER INFORMATION
Morningstar® and Morningstar® Dividend Leaders IndexSM are registered trademarks and service marks of Morningstar, Inc. (“Morningstar”) and have been licensed for use by First Trust on behalf of the Fund. The Fund is not sponsored, endorsed, issued, sold or promoted by Morningstar and Morningstar makes no representation regarding the advisability of investing in the Fund.
First Trust US Equity Opportunities ETF
FPX | NYSE Arca, Inc.
ANNUAL SHAREHOLDER REPORT | December 31, 2024
This annual shareholder report contains important information about the First Trust US Equity Opportunities ETF (the “Fund”) for the year of January 1, 2024 to December 31, 2024 (the “Period”). You can find additional information about the Fund at www.ftportfolios.com/fund-documents/etf/FPX. You can also request this information by contacting us at 1-800-621-1675 or info@ftportfolios.com.
WHAT WERE THE FUND COSTS FOR THE LAST YEAR?
(Based on a hypothetical $10,000 investment)
| Fund | Costs of a $10,000 investment | Costs paid as a percentage
of a $10,000 investment |
| First Trust US Equity Opportunities ETF | $63 | 0.56% |
HOW DID THE FUND PERFORM LAST YEAR? WHAT AFFECTED THE FUND’S PERFORMANCE?
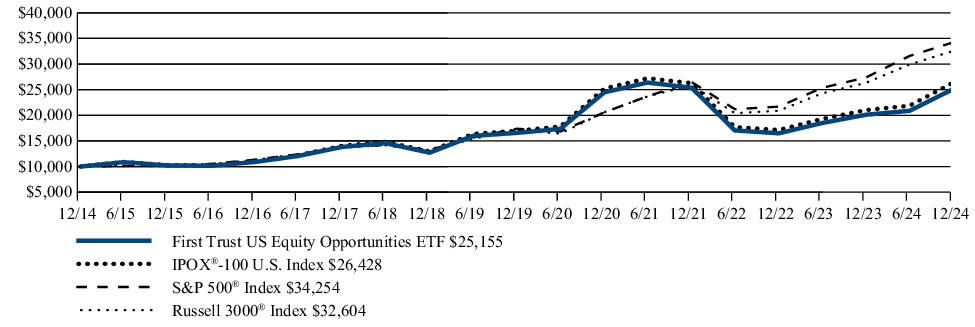
The Fund returned 25.02% during the 12 months ended December 31, 2024. The Fund outperformed its benchmark, the Russell 3000® Index, which returned 23.81% for the same Period.
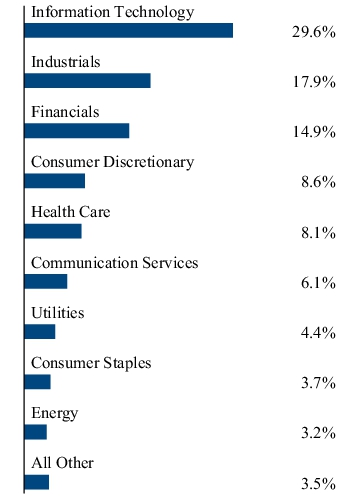
During the Period, the two sectors with the greatest allocation were also the most positive contributors to the Fund’s overall return. The Fund allocated 25.4% to the Industrials sector, which contributed 5.8% to the Fund’s overall return. The Fund also allocated 23.6% to the Information Technology sector, which contributed 12.1% to the Fund’s overall return. The most negative contribution to return came from the Health Care sector, which caused -1.5% drag in the Fund.
FUND PERFORMANCE (December 31, 2014 to December 31, 2024)
The performance line graph below shows the performance of a hypothetical $10,000 initial investment in the Fund over a ten-year period (or for the life of the Fund, if shorter). The subsequent account value as of the end of the Period is listed next to the name of the Fund or index, as applicable. The performance table below shows the average annual total returns of the Fund for the past one-, five-, and ten-year periods, as applicable (or for the life of the Fund, if shorter), as of the end of the Period. Both the line graph and performance table compare the Fund’s performance to an appropriate broad-based index and may compare to additional indices reflecting the market segment(s) in which the Fund invests over the same periods.
Investment Performance of $10,000
| Average Annual Total Returns (as of December 31, 2024) | 1 Year | 5 Year | 10 Year |
| First Trust US Equity Opportunities ETF | 25.02% | 8.70% | 9.66% |
| IPOX®-100 U.S. Index | 25.71% | 9.24% | 10.21% |
| S&P 500® Index | 25.02% | 14.53% | 13.10% |
| Russell 3000® Index | 23.81% | 13.86% | 12.55% |
Visit www.ftportfolios.com/etf/FPX for more recent performance information.
The Fund’s past performance is not a good predictor of the Fund’s future performance. The graph and table do not reflect the deduction of taxes that a shareholder would pay on Fund distributions or redemption of Fund shares.
KEY FUND STATISTICS (As of December 31, 2024)
| Fund net assets | $783,452,632 |
| Total number of portfolio holdings | 103 |
| Total advisory fee paid | $2,961,296 |
| Portfolio turnover rate | 77% |
WHAT DID THE FUND INVEST IN? (As of December 31, 2024)
The tables below show the investment makeup of the Fund, representing the percentage of total investments of the Fund.
| Palantir Technologies, Inc., Class A | 6.9% |
| AppLovin Corp., Class A | 6.8% |
| Carrier Global Corp. | 6.4% |
| Samsara, Inc., Class A | 6.1% |
| DoorDash, Inc., Class A | 4.3% |
| GE Vernova, Inc. | 3.8% |
| Constellation Energy Corp. | 3.6% |
| Kenvue, Inc. | 3.0% |
| Duolingo, Inc. | 2.7% |
| CrowdStrike Holdings, Inc., Class A | 2.6% |
WHERE CAN I FIND ADDITIONAL INFORMATION ABOUT THE FUND?
Visit www.ftportfolios.com/fund-documents/etf/FPX to view additional information about the Fund such as the prospectus, financial information, Fund holdings and proxy voting information. You may also request this information by contacting us at 1-800-621-1675 or info@ftportfolios.com.
OTHER INFORMATION
IPOX® and IPOX®-100 U.S. Index are registered international trademarks and service marks of IPOX® Schuster LLC (“IPOX”) and have been licensed for use by First Trust. The Fund is not sponsored, endorsed, sold or promoted by IPOX, and IPOX makes no representation regarding the advisability of trading in such Fund. IPOX® is an international trademark of IPOX Schuster LLC. Index of Initial Public Offerings (IPOX) and IPOX Derivatives Patent No. US 7,698,197.
First Trust NYSE® Arca®
Biotechnology Index Fund
FBT | NYSE Arca, Inc.
ANNUAL SHAREHOLDER REPORT | December 31, 2024
This annual shareholder report contains important information about the First Trust NYSE® Arca® Biotechnology Index Fund (the “Fund”) for the year of January 1, 2024 to December 31, 2024 (the “Period”). You can find additional information about the Fund at www.ftportfolios.com/fund-documents/etf/FBT. You can also request this information by contacting us at 1-800-621-1675 or info@ftportfolios.com.
WHAT WERE THE FUND COSTS FOR THE LAST YEAR?
(Based on a hypothetical $10,000 investment)
| Fund | Costs of a $10,000 investment | Costs paid as a percentage
of a $10,000 investment |
| First Trust NYSE® Arca® Biotechnology Index Fund | $56 | 0.54% |
HOW DID THE FUND PERFORM LAST YEAR? WHAT AFFECTED THE FUND’S PERFORMANCE?
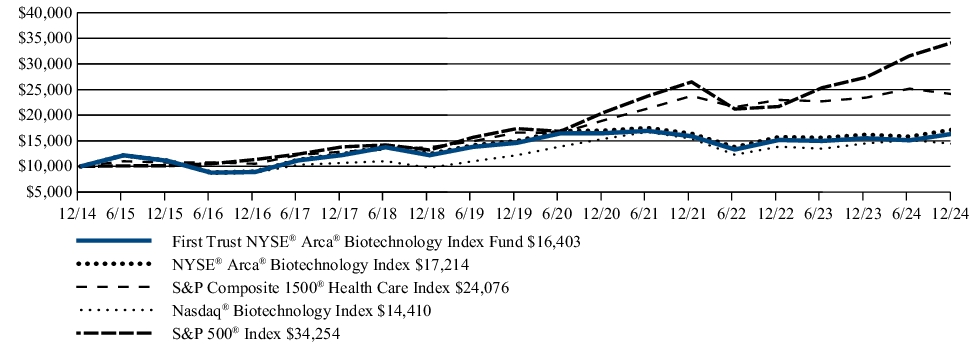
The Fund returned 5.76% during the 12 months ended December 31, 2024. The Fund outperformed its benchmark, the S&P Composite 1500® Health Care Index, which returned 2.81% for the same Period.
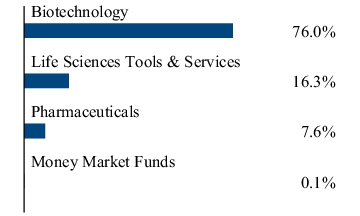
During the Period, the Fund was highly concentrated in the Biotechnology industry, which received a 76.2% allocation in the Fund. However, the investments in the Pharmaceuticals industry contributed 3.9% to the Fund’s overall return, the most of any industry. Investments in the Life Sciences Tools & Services industry contributed -1.1% to the Fund’s return, and was the only industry with a negative return.
FUND PERFORMANCE (December 31, 2014 to December 31, 2024)
The performance line graph below shows the performance of a hypothetical $10,000 initial investment in the Fund over a ten-year period (or for the life of the Fund, if shorter). The subsequent account value as of the end of the Period is listed next to the name of the Fund or index, as applicable. The performance table below shows the average annual total returns of the Fund for the past one-, five-, and ten-year periods, as applicable (or for the life of the Fund, if shorter), as of the end of the Period. Both the line graph and performance table compare the Fund’s performance to an appropriate broad-based index and may compare to additional indices reflecting the market segment(s) in which the Fund invests over the same periods.
Investment Performance of $10,000
| Average Annual Total Returns (as of December 31, 2024) | 1 Year | 5 Year | 10 Year |
| First Trust NYSE® Arca® Biotechnology Index Fund | 5.76% | 2.34% | 5.07% |
| NYSE® Arca® Biotechnology Index | 6.28% | 2.83% | 5.58% |
| S&P Composite 1500® Health Care Index | 2.81% | 7.70% | 9.18% |
| Nasdaq® Biotechnology Index | -0.57% | 3.40% | 3.72% |
| S&P 500® Index | 25.02% | 14.53% | 13.10% |
Visit www.ftportfolios.com/etf/FBT for more recent performance information.
The Fund’s past performance is not a good predictor of the Fund’s future performance. The graph and table do not reflect the deduction of taxes that a shareholder would pay on Fund distributions or redemption of Fund shares.
KEY FUND STATISTICS (As of December 31, 2024)
| Fund net assets | $1,111,743,523 |
| Total number of portfolio holdings | 31 |
| Total advisory fee paid | $4,666,445 |
| Portfolio turnover rate | 71% |
WHAT DID THE FUND INVEST IN? (As of December 31, 2024)
The tables below show the investment makeup of the Fund, representing the percentage of total investments of the Fund.
| Exelixis, Inc. | 4.4% |
| ACADIA Pharmaceuticals, Inc. | 4.2% |
| Natera, Inc. | 4.2% |
| Neurocrine Biosciences, Inc. | 4.1% |
| Argenx SE, ADR | 3.9% |
| Corcept Therapeutics, Inc. | 3.8% |
| Intra-Cellular Therapies, Inc. | 3.8% |
| Gilead Sciences, Inc. | 3.7% |
| Incyte Corp. | 3.6% |
| Repligen Corp. | 3.6% |
WHERE CAN I FIND ADDITIONAL INFORMATION ABOUT THE FUND?
Visit www.ftportfolios.com/fund-documents/etf/FBT to view additional information about the Fund such as the prospectus, financial information, Fund holdings and proxy voting information. You may also request this information by contacting us at 1-800-621-1675 or info@ftportfolios.com.
OTHER INFORMATION
Source ICE Data Indices, LLC, is used with permission. “NYSE®” is a service/trade mark of ICE Data Indices, LLC or its affiliates. This trademark has been licensed, along with the NYSE® Arca® Biotechnology Index (the “Index”) for use by First Trust Portfolios L.P. in connection with the First Trust NYSE® Arca® Biotechnology Index Fund (the “Product”). Neither First Trust Portfolios L.P., First Trust Exchange-Traded Fund (the “Trust”) nor the Product, as applicable, is sponsored, endorsed, sold or promoted by ICE Data Indices, LLC, its affiliates or its Third Party Suppliers (“ICE Data and its Suppliers”). ICE Data and its Suppliers make no representations or warranties regarding the advisability of investing in securities generally, in the Product particularly, the Trust or the ability of the Index to track general market performance. Past performance of an Index is not an indicator of or a guarantee of future results.
ICE DATA AND ITS SUPPLIERS DISCLAIM ANY AND ALL WARRANTIES AND REPRESENTATIONS, EXPRESS AND/OR IMPLIED, INCLUDING ANY WARRANTIES OF MERCHANTABILITY OR FITNESS FOR A PARTICULAR PURPOSE OR USE, INCLUDING THE INDICES, INDEX DATA AND ANY INFORMATION INCLUDED IN, RELATED TO, OR DERIVED THEREFROM (“INDEX DATA”). ICE DATA AND ITS SUPPLIERS SHALL NOT BE SUBJECT TO ANY DAMAGES OR LIABILITY WITH RESPECT TO THE ADEQUACY, ACCURACY, TIMELINESS OR COMPLETENESS OF THE INDICES AND THE INDEX DATA, WHICH ARE PROVIDED ON AN “AS IS” BASIS AND YOUR USE IS AT YOUR OWN RISK.
First Trust Dow Jones Internet Index Fund
FDN | NYSE ARCA, INC.
ANNUAL SHAREHOLDER REPORT | December 31, 2024
This annual shareholder report contains important information about the First Trust Dow Jones Internet Index Fund (the “Fund”) for the year of January 1, 2024 to December 31, 2024 (the “Period”). You can find additional information about the Fund at www.ftportfolios.com/fund-documents/etf/FDN. You can also request this information by contacting us at 1-800-621-1675 or info@ftportfolios.com.
WHAT WERE THE FUND COSTS FOR THE LAST YEAR?
(Based on a hypothetical $10,000 investment)
| Fund | Costs of a $10,000 investment | Costs paid as a percentage
of a $10,000 investment |
| First Trust Dow Jones Internet Index Fund | $56 | 0.49% |
HOW DID THE FUND PERFORM LAST YEAR? WHAT AFFECTED THE FUND’S PERFORMANCE?
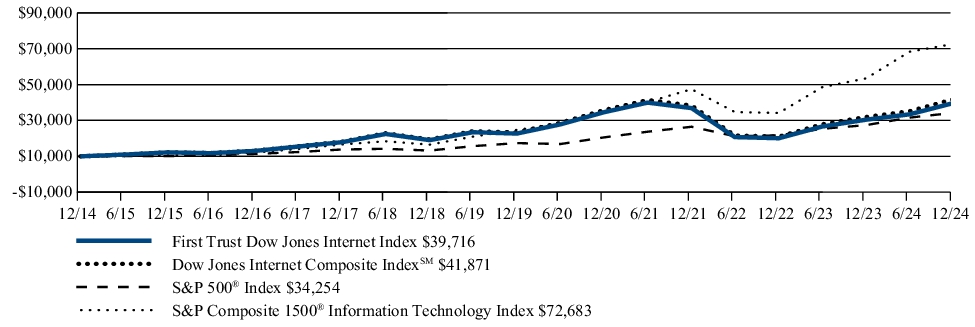
The Fund returned 30.52% during the 12 months ended December 31, 2024. The Fund underperformed its benchmark, the S&P Composite 1500® Information Technology Index, which returned 35.93% for the same Period.
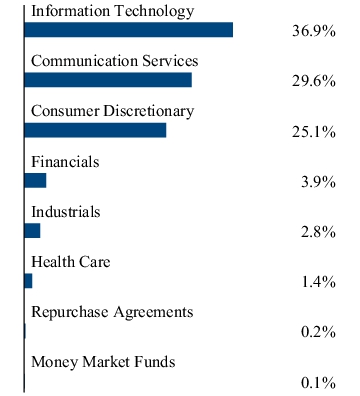
During the Period, the Information Technology sector received the greatest allocation in the Fund with a 39.4% average weight. The allocation to this sector contributed 7.4% to the Fund’s return. The largest contribution to the Fund’s return came from the Communication Services sector, which had an average weight of 30.8% and contributed 12.6% to return. The only negatively contributing sector to the Fund’s return was the Health Care sector, which contributed -0.3%.
FUND PERFORMANCE (December 31, 2014 to December 31, 2024)
The performance line graph below shows the performance of a hypothetical $10,000 initial investment in the Fund over a ten-year period (or for the life of the Fund, if shorter). The subsequent account value as of the end of the Period is listed next to the name of the Fund or index, as applicable. The performance table below shows the average annual total returns of the Fund for the past one-, five-, and ten-year periods, as applicable (or for the life of the Fund, if shorter), as of the end of the Period. Both the line graph and performance table compare the Fund’s performance to an appropriate broad-based index and may compare to additional indices reflecting the market segment(s) in which the Fund invests over the same periods.
Investment Performance of $10,000
| Average Annual Total Returns (as of December 31, 2024) | 1 Year | 5 Year | 10 Year |
| First Trust Dow Jones Internet Index Fund | 30.52% | 11.84% | 14.79% |
| Dow Jones Internet Composite IndexSM | 31.12% | 12.41% | 15.40% |
| S&P 500® Index | 25.02% | 14.53% | 13.10% |
| S&P Composite 1500® Information Technology Index | 35.93% | 24.06% | 21.94% |
Visit www.ftportfolios.com/etf/FDN for more recent performance information.
The Fund’s past performance is not a good predictor of the Fund’s future performance. The graph and table do not reflect the deduction of taxes that a shareholder would pay on Fund distributions or redemption of Fund shares.
KEY FUND STATISTICS (As of December 31, 2024)
| Fund net assets | $6,803,638,493 |
| Total number of portfolio holdings | 44 |
| Total advisory fee paid | $24,052,029 |
| Portfolio turnover rate | 32% |
WHAT DID THE FUND INVEST IN? (As of December 31, 2024)
The tables below show the investment makeup of the Fund, representing the percentage of total investments of the Fund.
| Amazon.com, Inc. | 10.0% |
| Meta Platforms, Inc., Class A | 9.7% |
| Netflix, Inc. | 8.1% |
| Salesforce, Inc. | 6.8% |
| Alphabet, Inc., Class A | 5.6% |
| Arista Networks, Inc. | 4.9% |
| Cisco Systems, Inc. | 4.8% |
| Alphabet, Inc., Class C | 4.6% |
| Booking Holdings, Inc. | 4.4% |
| PayPal Holdings, Inc. | 3.9% |
WHERE CAN I FIND ADDITIONAL INFORMATION ABOUT THE FUND?
Visit www.ftportfolios.com/fund-documents/etf/FDN to view additional information about the Fund such as the prospectus, financial information, Fund holdings and proxy voting information. You may also request this information by contacting us at 1-800-621-1675 or info@ftportfolios.com.
OTHER INFORMATION
Dow Jones Internet Composite IndexSM (“Index”) is a product of S&P Dow Jones Indices, LLC or its affiliates (“SPDJI”) and has been licensed for use by First Trust. S&P® is a registered trademark of Standard & Poor’s Financial Services LLC (“S&P”); Dow Jones® is a registered trademark of Dow Jones Trademark Holdings LLC (“Dow Jones”); and these trademarks have been licensed for use by SPDJI and sublicensed for certain purposes by First Trust. The Fund is not sponsored, endorsed, sold or promoted by SPDJI, Dow Jones, S&P or their respective affiliates and none of such parties make any representation regarding the advisability of investing in such product(s) nor do they have any liability for any errors, omissions, or interruptions of the Index.
First Trust Capital Strength® ETF
FTCS | NASDAQ, INC.
ANNUAL SHAREHOLDER REPORT | December 31, 2024
This annual shareholder report contains important information about the First Trust Capital Strength® ETF (the “Fund”) for the year of January 1, 2024 to December 31, 2024 (the “Period”). You can find additional information about the Fund at www.ftportfolios.com/fund-documents/etf/FTCS. You can also request this information by contacting us at 1-800-621-1675 or info@ftportfolios.com.
WHAT WERE THE FUND COSTS FOR THE LAST YEAR?
(Based on a hypothetical $10,000 investment)
| Fund | Costs of a $10,000 investment | Costs paid as a percentage
of a $10,000 investment |
| First Trust Capital Strength® ETF | $55 | 0.52% |
HOW DID THE FUND PERFORM LAST YEAR? WHAT AFFECTED THE FUND’S PERFORMANCE?
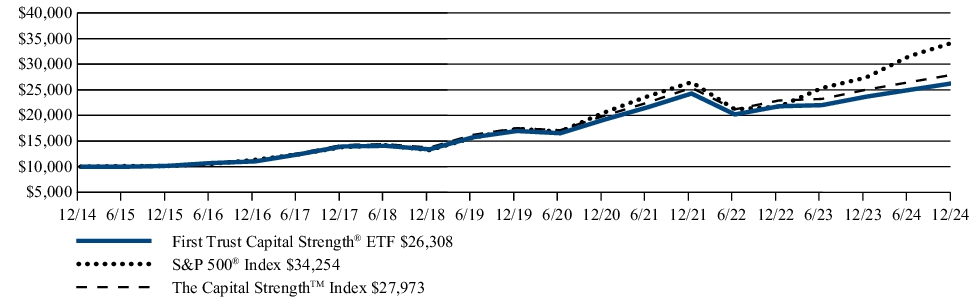
The Fund returned 11.21% during the 12 months ended December 31, 2024. The Fund underperformed its benchmark, the S&P 500® Index, which returned 25.02% for the same Period.
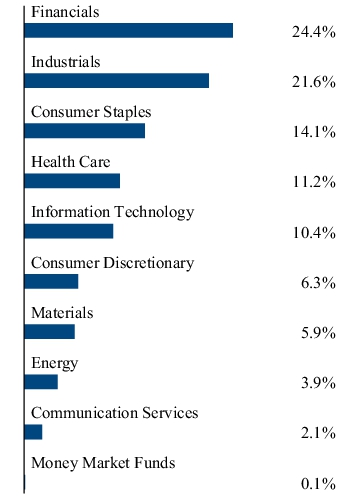
During the Period, the Fund allocated 20.5% to the Industrials sector, which was the largest sector weight in the Fund. The second highest weight was the Financials sector, which had an average weight of 18.7%. The Financials sector contributed 4.1% to the Fund’s return, which was the largest positive return contribution of any sector. The Energy sector contributed -0.5% to return, which was the largest detractor to the Fund’s return.
FUND PERFORMANCE (December 31, 2014 to December 31, 2024)
The performance line graph below shows the performance of a hypothetical $10,000 initial investment in the Fund over a ten-year period (or for the life of the Fund, if shorter). The subsequent account value as of the end of the Period is listed next to the name of the Fund or index, as applicable. The performance table below shows the average annual total returns of the Fund for the past one-, five-, and ten-year periods, as applicable (or for the life of the Fund, if shorter), as of the end of the Period. Both the line graph and performance table compare the Fund’s performance to an appropriate broad-based index and may compare to additional indices reflecting the market segment(s) in which the Fund invests over the same periods.
Investment Performance of $10,000
| Average Annual Total Returns (as of December 31, 2024) | 1 Year | 5 Year | 10 Year |
| First Trust Capital Strength® ETF | 11.21% | 9.17% | 10.16% |
| S&P 500® Index | 25.02% | 14.53% | 13.10% |
| The Capital Strength IndexTM | 11.81% | 9.81% | 10.83% |
Visit www.ftportfolios.com/etf/FTCS for more recent performance information.
The Fund’s past performance is not a good predictor of the Fund’s future performance. The graph and table do not reflect the deduction of taxes that a shareholder would pay on Fund distributions or redemption of Fund shares.
KEY FUND STATISTICS (As of December 31, 2024)
| Fund net assets | $8,581,233,143 |
| Total number of portfolio holdings | 51 |
| Total advisory fee paid | $42,884,298 |
| Portfolio turnover rate | 87% |
WHAT DID THE FUND INVEST IN? (As of December 31, 2024)
The tables below show the investment makeup of the Fund, representing the percentage of total investments of the Fund.
| Walmart, Inc. | 2.3% |
| Visa, Inc., Class A | 2.3% |
| Cisco Systems, Inc. | 2.2% |
| Snap-on, Inc. | 2.2% |
| Costco Wholesale Corp. | 2.2% |
| TJX (The) Cos., Inc. | 2.2% |
| Packaging Corp. of America | 2.2% |
| Mastercard, Inc., Class A | 2.1% |
| Blackrock, Inc. | 2.1% |
| Ameriprise Financial, Inc. | 2.1% |
WHERE CAN I FIND ADDITIONAL INFORMATION ABOUT THE FUND?
Visit www.ftportfolios.com/fund-documents/etf/FTCS to view additional information about the Fund such as the prospectus, financial information, Fund holdings and proxy voting information. You may also request this information by contacting us at 1-800-621-1675 or info@ftportfolios.com.
OTHER INFORMATION
Nasdaq® and The Capital StrengthTM Index (the “Index”) are registered trademarks and service marks of Nasdaq, Inc. (together with its affiliates hereinafter referred to as the “Corporations”) and are licensed for use by First Trust. The Fund has not been passed on by the Corporations as to its legality or suitability. The Fund is not issued, endorsed, sold or promoted by the Corporations. THE CORPORATIONS MAKE NO WARRANTIES AND BEAR NO LIABILITY WITH RESPECT TO THE FUND.
First Trust Value Line®
Dividend Index Fund
FVD | NYSE Arca, Inc.
ANNUAL SHAREHOLDER REPORT | December 31, 2024
This annual shareholder report contains important information about the First Trust Value Line® Dividend Index Fund (the “Fund”) for the year of January 1, 2024 to December 31, 2024 (the “Period”). You can find additional information about the Fund at www.ftportfolios.com/fund-documents/etf/FVD. You can also request this information by contacting us at 1-800-621-1675 or info@ftportfolios.com.
WHAT WERE THE FUND COSTS FOR THE LAST YEAR?
(Based on a hypothetical $10,000 investment)
| Fund | Costs of a $10,000 investment | Costs paid as a percentage
of a $10,000 investment |
| First Trust Value Line® Dividend Index Fund | $64 | 0.61% |
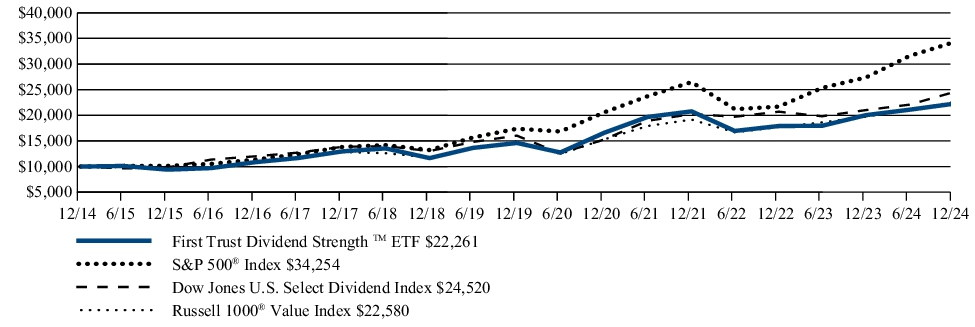
HOW DID THE FUND PERFORM LAST YEAR? WHAT AFFECTED THE FUND’S PERFORMANCE?
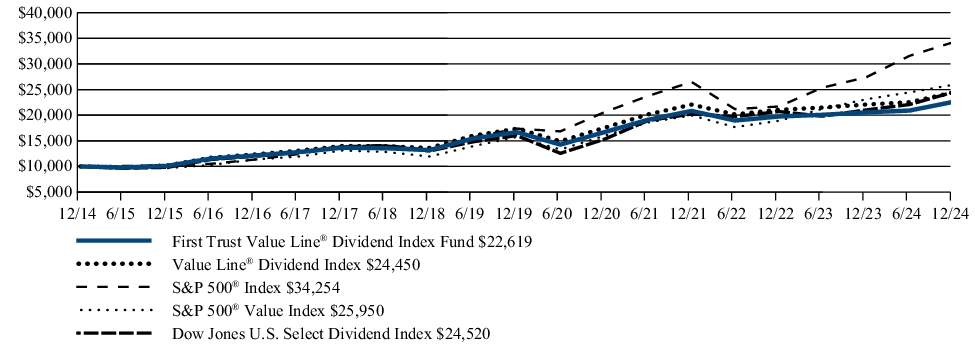
The Fund returned 10.00% during the 12 months ended December 31, 2024. The Fund underperformed its benchmark, the S&P 500® Index, which returned 25.02% for the same Period.
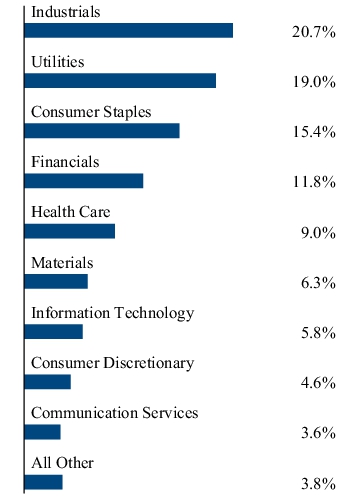
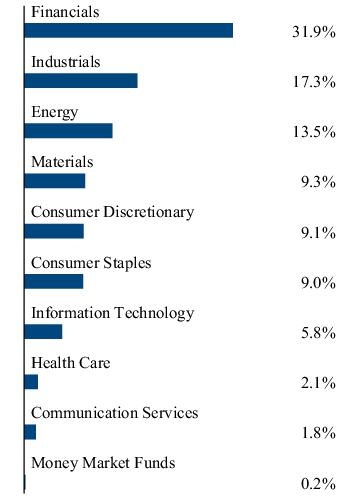
During the Period, the Fund allocated 20.6% to the Industrials sector, which was the largest sector weight in the Fund. Financials, at 3.6%, contributed the most to the Fund’s return of any sector. Investments in the Communication Services sector caused the largest drag of any sector, contributing -0.2%.
FUND PERFORMANCE (December 31, 2014 to December 31, 2024)
The performance line graph below shows the performance of a hypothetical $10,000 initial investment in the Fund over a ten-year period (or for the life of the Fund, if shorter). The subsequent account value as of the end of the Period is listed next to the name of the Fund or index, as applicable. The performance table below shows the average annual total returns of the Fund for the past one-, five-, and ten-year periods, as applicable (or for the life of the Fund, if shorter), as of the end of the Period. Both the line graph and performance table compare the Fund’s performance to an appropriate broad-based index and may compare to additional indices reflecting the market segment(s) in which the Fund invests over the same periods.
Investment Performance of $10,000
| Average Annual Total Returns (as of December 31, 2024) | 1 Year | 5 Year | 10 Year |
| First Trust Value Line® Dividend Index Fund | 10.00% | 6.26% | 8.50% |
| Value Line® Dividend Index | 10.74% | 7.08% | 9.35% |
| S&P 500® Index | 25.02% | 14.53% | 13.10% |
| S&P 500® Value Index | 12.29% | 10.49% | 10.01% |
| Dow Jones U.S. Select Dividend IndexSM | 16.62% | 8.86% | 9.38% |
Visit www.ftportfolios.com/etf/FVD for more recent performance information.
The Fund’s past performance is not a good predictor of the Fund’s future performance. The graph and table do not reflect the deduction of taxes that a shareholder would pay on Fund distributions or redemption of Fund shares. The Fund’s total returns would have been lower if certain fees had not been waived and expenses reimbursed by the investment advisor.
KEY FUND STATISTICS (As of December 31, 2024)
| Fund net assets | $9,281,568,741 |
| Total number of portfolio holdings | 222 |
| Total advisory fee paid | $47,250,167 |
| Portfolio turnover rate | 73% |
WHAT DID THE FUND INVEST IN? (As of December 31, 2024)
The tables below show the investment makeup of the Fund, representing the percentage of total investments of the Fund.
| Toyota Motor Corp., ADR | 0.5% |
| Honda Motor Co., Ltd., ADR | 0.5% |
| Starbucks Corp. | 0.5% |
| Maximus, Inc. | 0.5% |
| Target Corp. | 0.5% |
| Cal-Maine Foods, Inc. | 0.5% |
| America Movil S.A.B. de C.V., ADR | 0.5% |
| Spire, Inc. | 0.5% |
| Southwest Gas Holdings, Inc. | 0.5% |
| Enbridge, Inc. | 0.5% |
WHERE CAN I FIND ADDITIONAL INFORMATION ABOUT THE FUND?
Visit www.ftportfolios.com/fund-documents/etf/FVD to view additional information about the Fund such as the prospectus, financial information, Fund holdings and proxy voting information. You may also request this information by contacting us at 1-800-621-1675 or info@ftportfolios.com.
OTHER INFORMATION
Value Line® and Value Line® Dividend Index are trademarks or registered trademarks of Value Line, Inc. (“Value Line”) and have been licensed for use for certain purposes by First Trust. The Fund is not sponsored, endorsed, recommended, sold or promoted by Value Line and Value Line makes no representation regarding the advisability of investing in products utilizing such strategy.
First Trust Growth StrengthTM ETF
FTGS | Nasdaq, Inc.
ANNUAL SHAREHOLDER REPORT | December 31, 2024
This annual shareholder report contains important information about the First Trust Growth StrengthTM ETF (the “Fund”) for the year of January 1, 2024 to December 31, 2024 (the “Period”). You can find additional information about the Fund at www.ftportfolios.com/fund-documents/etf/FTGS. You can also request this information by contacting us at 1-800-621-1675 or info@ftportfolios.com.
WHAT WERE THE FUND COSTS FOR THE LAST YEAR?
(Based on a hypothetical $10,000 investment)
| Fund | Costs of a $10,000 investment | Costs paid as a percentage
of a $10,000 investment |
| First Trust Growth StrengthTM ETF | $65 | 0.60% |
HOW DID THE FUND PERFORM LAST YEAR? WHAT AFFECTED THE FUND’S PERFORMANCE?
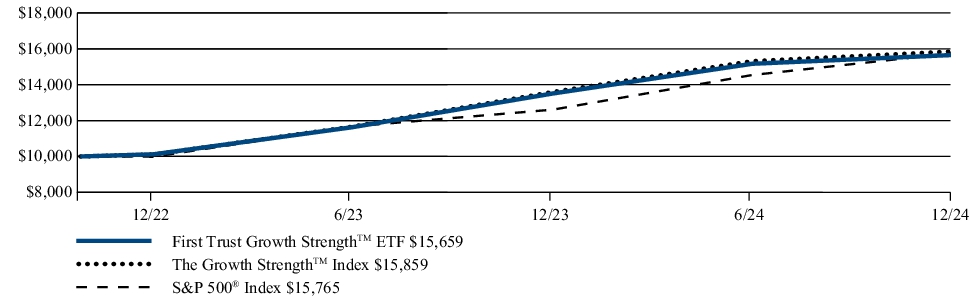
The Fund returned 15.87% during the 12 months ended December 31, 2024. The Fund underperformed its benchmark, the S&P 500® Index, which returned 25.02% for the same Period.
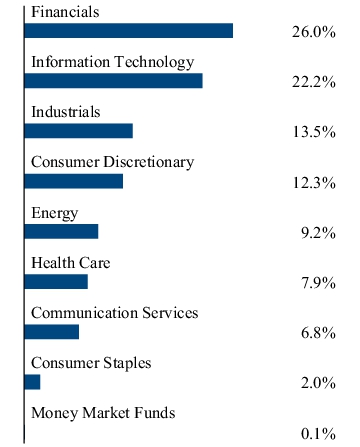
During the Period, the Information Technology sector received the greatest allocation of any sector in the Fund with an average weight of 29.3%. The allocation to this sector contributed 6.8% to the Fund’s overall return, which was the greatest return contribution of any sector. The most negative contribution to the Fund’s return came from the Energy sector, at -1.1%. This sector also had an average weight of 9.0%.
FUND PERFORMANCE (October 25, 2022 to December 31, 2024)
The performance line graph below shows the performance of a hypothetical $10,000 initial investment in the Fund over a ten-year period (or for the life of the Fund, if shorter). The subsequent account value as of the end of the Period is listed next to the name of the Fund or index, as applicable. The performance table below shows the average annual total returns of the Fund for the past one-, five-, and ten-year periods, as applicable (or for the life of the Fund, if shorter), as of the end of the Period. Both the line graph and performance table compare the Fund’s performance to an appropriate broad-based index and may compare to additional indices reflecting the market segment(s) in which the Fund invests over the same periods.
Investment Performance of $10,000
| Average Annual Total Returns (as of December 31, 2024) | 1 Year | Since
Inception
(10/25/22) |
| First Trust Growth StrengthTM ETF | 15.87% | 22.80% |
| The Growth Strength™ Index | 16.62% | 23.52% |
| S&P 500® Index | 25.02% | 23.18% |
Visit www.ftportfolios.com/etf/FTGS for more recent performance information.
The Fund’s past performance is not a good predictor of the Fund’s future performance. The graph and table do not reflect the deduction of taxes that a shareholder would pay on Fund distributions or redemption of Fund shares.
KEY FUND STATISTICS (As of December 31, 2024)
| Fund net assets | $909,410,740 |
| Total number of portfolio holdings | 51 |
| Total advisory fee paid | $2,831,601 |
| Portfolio turnover rate | 102% |
WHAT DID THE FUND INVEST IN? (As of December 31, 2024)
The tables below show the investment makeup of the Fund, representing the percentage of total investments of the Fund.
| Deckers Outdoor Corp. | 2.6% |
| Expedia Group, Inc. | 2.4% |
| Netflix, Inc. | 2.4% |
| Cadence Design Systems, Inc. | 2.4% |
| Amazon.com, Inc. | 2.4% |
| Live Nation Entertainment, Inc. | 2.3% |
| Arista Networks, Inc. | 2.2% |
| Visa, Inc., Class A | 2.2% |
| Dexcom, Inc. | 2.2% |
| American Express Co. | 2.2% |
WHERE CAN I FIND ADDITIONAL INFORMATION ABOUT THE FUND?
Visit www.ftportfolios.com/fund-documents/etf/FTGS to view additional information about the Fund such as the prospectus, financial information, Fund holdings and proxy voting information. You may also request this information by contacting us at 1-800-621-1675 or info@ftportfolios.com.
OTHER INFORMATION
Nasdaq® and The Growth StrengthTM Index (the “Index”) are registered trademarks and service marks of Nasdaq, Inc. (together with its affiliates hereinafter referred to as the “Corporations”) and are licensed for use by First Trust. The Fund has not been passed on by the Corporations as to its legality or suitability. The Fund is not issued, endorsed, sold or promoted by the Corporations. THE CORPORATIONS MAKE NO WARRANTIES AND BEAR NO LIABILITY WITH RESPECT TO THE FUND.
First Trust Indxx Aerospace & Defense ETF
MISL | NYSE ARCA, INC.
ANNUAL SHAREHOLDER REPORT | December 31, 2024
This annual shareholder report contains important information about the First Trust Indxx Aerospace & Defense ETF (the “Fund”) for the year of January 1, 2024 to December 31, 2024 (the “Period”). You can find additional information about the Fund at www.ftportfolios.com/fund-documents/etf/MISL. You can also request this information by contacting us at 1-800-621-1675 or info@ftportfolios.com.
WHAT WERE THE FUND COSTS FOR THE LAST YEAR?
(Based on a hypothetical $10,000 investment)
| Fund | Costs of a $10,000 investment | Costs paid as a percentage
of a $10,000 investment |
| First Trust Indxx Aerospace & Defense ETF | $66 | 0.60% |
HOW DID THE FUND PERFORM LAST YEAR? WHAT AFFECTED THE FUND’S PERFORMANCE?
The Fund returned 20.44% during the 12 months ended December 31, 2024. The Fund underperformed its benchmark, the S&P 500® Index, which returned 25.02% for the same Period.
During the Period, the Aerospace & Defense sub-industry received the greatest allocation of any sub-industry in the Fund with an average weight of 83.6%. The allocation to this sub-industry contributed 16.0% to the Fund’s overall return, the greatest return contribution of any sub-industry. No sub-industry had a material negative contribution to the Fund’s return.
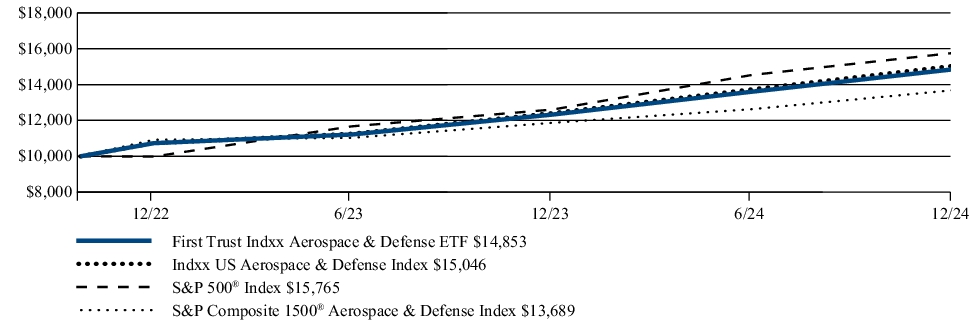
FUND PERFORMANCE (October 25, 2022 to December 31, 2024)
The performance line graph below shows the performance of a hypothetical $10,000 initial investment in the Fund over a ten-year period (or for the life of the Fund, if shorter). The subsequent account value as of the end of the Period is listed next to the name of the Fund or index, as applicable. The performance table below shows the average annual total returns of the Fund for the past one-, five-, and ten-year periods, as applicable (or for the life of the Fund, if shorter), as of the end of the Period. Both the line graph and performance table compare the Fund’s performance to an appropriate broad-based index and may compare to additional indices reflecting the market segment(s) in which the Fund invests over the same periods.
Investment Performance of $10,000
| Average Annual Total Returns (as of December 31, 2024) | 1 Year | Since
Inception
(10/25/22) |
| First Trust Indxx Aerospace & Defense ETF | 20.44% | 19.86% |
| Indxx US Aerospace & Defense Index | 21.22% | 20.57% |
| S&P 500® Index | 25.02% | 23.18% |
| S&P Composite 1500® Aerospace & Defense Index | 15.30% | 15.46% |
Visit www.ftportfolios.com/etf/MISL for more recent performance information.
The Fund’s past performance is not a good predictor of the Fund’s future performance. The graph and table do not reflect the deduction of taxes that a shareholder would pay on Fund distributions or redemption of Fund shares.
KEY FUND STATISTICS (As of December 31, 2024)
| Fund net assets | $111,051,232 |
| Total number of portfolio holdings | 35 |
| Total advisory fee paid | $433,937 |
| Portfolio turnover rate | 16% |
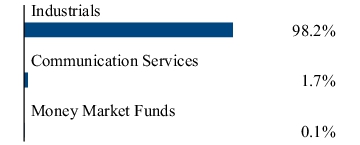
WHAT DID THE FUND INVEST IN? (As of December 31, 2024)
The tables below show the investment makeup of the Fund, representing the percentage of total investments of the Fund.
| Boeing (The) Co. | 9.9% |
| RTX Corp. | 7.9% |
| TransDigm Group, Inc. | 7.6% |
| General Dynamics Corp. | 7.4% |
| Lockheed Martin Corp. | 6.8% |
| Howmet Aerospace, Inc. | 4.4% |
| Curtiss-Wright Corp. | 3.9% |
| HEICO Corp. | 3.8% |
| Northrop Grumman Corp. | 3.7% |
| Textron, Inc. | 3.7% |
WHERE CAN I FIND ADDITIONAL INFORMATION ABOUT THE FUND?
Visit www.ftportfolios.com/fund-documents/etf/MISL to view additional information about the Fund such as the prospectus, financial information, Fund holdings and proxy voting information. You may also request this information by contacting us at 1-800-621-1675 or info@ftportfolios.com.
OTHER INFORMATION
Indxx and Indxx US Aerospace & Defense Index (“Index”) are trademarks of Indxx, Inc. (“Indxx”) and have been licensed for use for certain purposes by First Trust. The Fund is not sponsored, endorsed, sold or promoted by Indxx, and Indxx makes no representation regarding the advisability of trading in such product. The Index is determined, composed and calculated by Indxx without regard to First Trust or the Fund.
First Trust Bloomberg
Inflation Sensitive Equity ETF
FTIF | NYSE ARCA, INC.
ANNUAL SHAREHOLDER REPORT | December 31, 2024
This annual shareholder report contains important information about the First Trust Bloomberg Inflation Sensitive Equity ETF (the “Fund”) for the year of January 1, 2024 to December 31, 2024 (the “Period”). You can find additional information about the Fund at www.ftportfolios.com/fund-documents/etf/FTIF. You can also request this information by contacting us at 1-800-621-1675 or info@ftportfolios.com.
WHAT WERE THE FUND COSTS FOR THE LAST YEAR?
(Based on a hypothetical $10,000 investment)
| Fund | Costs of a $10,000 investment | Costs paid as a percentage
of a $10,000 investment |
| First Trust Bloomberg Inflation Sensitive Equity ETF | $60 | 0.60% |
HOW DID THE FUND PERFORM LAST YEAR? WHAT AFFECTED THE FUND’S PERFORMANCE?
The Fund returned 0.55% during the 12 months ended December 31, 2024. The Fund underperformed its benchmark, the S&P 500® Index, which returned 25.02% for the same Period.
During the Period, the Energy sector received the greatest allocation of any sector in the Fund with an average weight of 33.7%. The allocation to this sector contributed -3.7% to the Fund’s overall return, which was the most negative return contribution of any sector. With an average weight of 27.2%, the Industrials sector contributed 4.7% to the Fund’s return, which was the greatest return contribution of any sector.
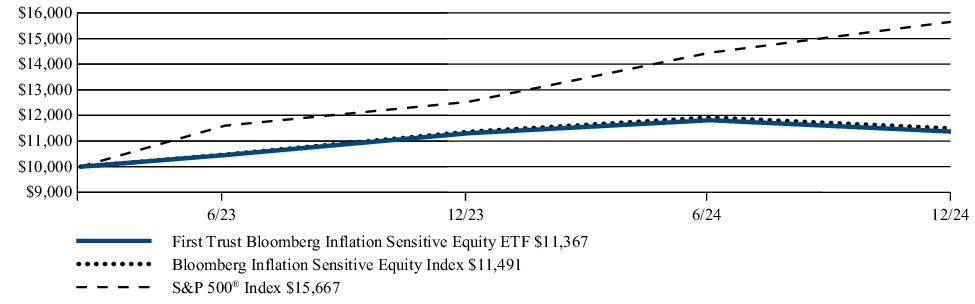
FUND PERFORMANCE (March 13, 2023 to December 31, 2024)
The performance line graph below shows the performance of a hypothetical $10,000 initial investment in the Fund over a ten-year period (or for the life of the Fund, if shorter). The subsequent account value as of the end of the Period is listed next to the name of the Fund or index, as applicable. The performance table below shows the average annual total returns of the Fund for the past one-, five-, and ten-year periods, as applicable (or for the life of the Fund, if shorter), as of the end of the Period. Both the line graph and performance table compare the Fund’s performance to an appropriate broad-based index and may compare to additional indices reflecting the market segment(s) in which the Fund invests over the same periods.
Investment Performance of $10,000
| Average Annual Total Returns (as of December 31, 2024) | 1 Year | Since
Inception
(3/13/23) |
| First Trust Bloomberg Inflation Sensitive Equity ETF | 0.55% | 7.37% |
| Bloomberg Inflation Sensitive Equity Index | 1.10% | 8.01% |
| S&P 500® Index | 25.02% | 28.28% |
Visit www.ftportfolios.com/etf/FTIF for more recent performance information.
The Fund’s past performance is not a good predictor of the Fund’s future performance. The graph and table do not reflect the deduction of taxes that a shareholder would pay on Fund distributions or redemption of Fund shares.
KEY FUND STATISTICS (As of December 31, 2024)
| Fund net assets | $1,071,369 |
| Total number of portfolio holdings | 50 |
| Total advisory fee paid | $9,176 |
| Portfolio turnover rate | 90% |
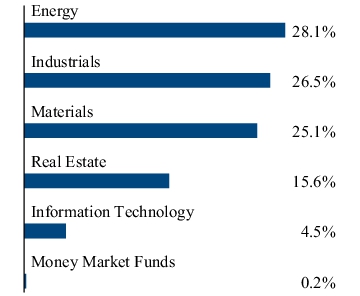
WHAT DID THE FUND INVEST IN? (As of December 31, 2024)
The tables below show the investment makeup of the Fund, representing the percentage of total investments of the Fund.
| ConocoPhillips | 3.7% |
| Cummins, Inc. | 2.6% |
| International Paper Co. | 2.6% |
| Quanta Services, Inc. | 2.6% |
| Packaging Corp. of America | 2.6% |
| CRH PLC | 2.6% |
| Jones Lang LaSalle, Inc. | 2.6% |
| Westinghouse Air Brake Technologies Corp. | 2.5% |
| Keysight Technologies, Inc. | 2.5% |
| RTX Corp. | 2.4% |
WHERE CAN I FIND ADDITIONAL INFORMATION ABOUT THE FUND?
Visit www.ftportfolios.com/fund-documents/etf/FTIF to view additional information about the Fund such as the prospectus, financial information, Fund holdings and proxy voting information. You may also request this information by contacting us at 1-800-621-1675 or info@ftportfolios.com.
OTHER INFORMATION
“Bloomberg®” and Bloomberg Inflation Sensitive Equity Index licensed herein (the “Indices”) are service marks of Bloomberg Finance L.P. and its affiliates, including Bloomberg Index Services Limited, the administrator of the Indices (collectively, “Bloomberg”) and have been licensed for use for certain purposes by First Trust Advisors L.P. (the “Licensee”). Bloomberg is not affiliated with the Licensee, and Bloomberg does not approve, endorse, review, or recommend the financial products referenced herein (the “Financial Products”). Bloomberg does not guarantee the timeliness, accurateness, or completeness of any data or information relating to the Indices or the Financial Products.
First Trust NASDAQ-100
Equal Weighted Index Fund
QQEW | NASDAQ, INC.
ANNUAL SHAREHOLDER REPORT | December 31, 2024
This annual shareholder report contains important information about the First Trust NASDAQ-100 Equal Weighted Index Fund (the “Fund”) for the year of January 1, 2024 to December 31, 2024 (the “Period”). You can find additional information about the Fund at www.ftportfolios.com/fund-documents/etf/QQEW. You can also request this information by contacting us at 1-800-621-1675 or info@ftportfolios.com.
WHAT WERE THE FUND COSTS FOR THE LAST YEAR?
(Based on a hypothetical $10,000 investment)
| Fund | Costs of a $10,000 investment | Costs paid as a percentage
of a $10,000 investment |
| First Trust NASDAQ-100 Equal Weighted Index Fund | $57 | 0.55% |
HOW DID THE FUND PERFORM LAST YEAR? WHAT AFFECTED THE FUND’S PERFORMANCE?
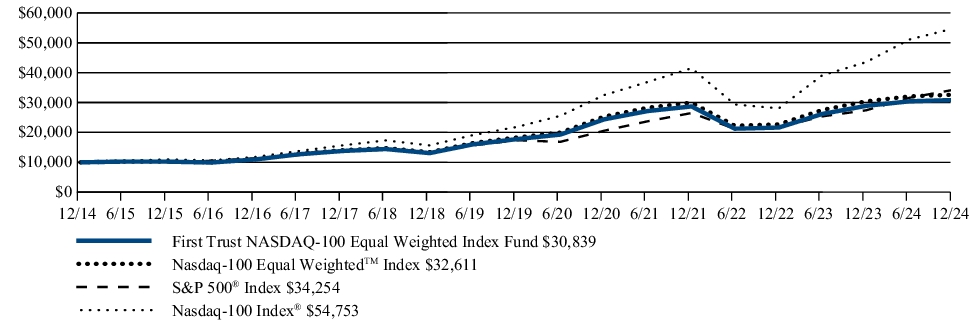
The Fund returned 6.81% during the 12 months ended December 31, 2024. The Fund underperformed its benchmark, the Nasdaq-100® Index, which returned 25.88% for the same Period.
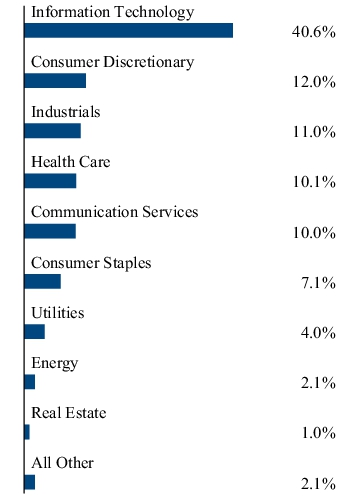
During the Period, the Fund allocated 38.1% to the Information Technology sector, by far the greatest allocation to any sector in the Fund. The Consumer Discretionary sector had the most positive contribution to return of any sector during the Period, with a 2.5% contribution to the Fund’s overall return. The most negative contribution to the Fund’s return came from investments in the Consumer Staples sector, which caused a -1.3% drag in the Fund.
FUND PERFORMANCE (December 31, 2014 to December 31, 2024)
The performance line graph below shows the performance of a hypothetical $10,000 initial investment in the Fund over a ten-year period (or for the life of the Fund, if shorter). The subsequent account value as of the end of the Period is listed next to the name of the Fund or index, as applicable. The performance table below shows the average annual total returns of the Fund for the past one-, five-, and ten-year periods, as applicable (or for the life of the Fund, if shorter), as of the end of the Period. Both the line graph and performance table compare the Fund’s performance to an appropriate broad-based index and may compare to additional indices reflecting the market segment(s) in which the Fund invests over the same periods.
Investment Performance of $10,000
| Average Annual Total Returns (as of December 31, 2024) | 1 Year | 5 Year | 10 Year |
| First Trust NASDAQ-100 Equal Weighted Index Fund | 6.81% | 11.68% | 11.92% |
| Nasdaq-100 Equal WeightedTM Index | 7.31% | 12.24% | 12.55% |
| S&P 500® Index | 25.02% | 14.53% | 13.10% |
| Nasdaq-100 Index® | 25.88% | 20.18% | 18.53% |
Visit www.ftportfolios.com/etf/QQEW for more recent performance information.
The Fund’s past performance is not a good predictor of the Fund’s future performance. The graph and table do not reflect the deduction of taxes that a shareholder would pay on Fund distributions or redemption of Fund shares. The Fund’s total returns would have been lower if certain fees had not been waived and expenses reimbursed by the investment advisor.
KEY FUND STATISTICS (As of December 31, 2024)
| Fund net assets | $1,859,605,340 |
| Total number of portfolio holdings | 103 |
| Total advisory fee paid | $8,232,091 |
| Portfolio turnover rate | 26% |
WHAT DID THE FUND INVEST IN? (As of December 31, 2024)
The tables below show the investment makeup of the Fund, representing the percentage of total investments of the Fund.
| Diamondback Energy, Inc. | 1.1% |
| Broadcom, Inc. | 1.1% |
| Biogen, Inc. | 1.1% |
| Starbucks Corp. | 1.0% |
| Microchip Technology, Inc. | 1.0% |
| GLOBALFOUNDRIES, Inc. | 1.0% |
| Intel Corp. | 1.0% |
| Coca-Cola Europacific Partners PLC | 1.0% |
| Baker Hughes Co. | 1.0% |
| Exelon Corp. | 1.0% |
WHERE CAN I FIND ADDITIONAL INFORMATION ABOUT THE FUND?
Visit www.ftportfolios.com/fund-documents/etf/QQEW to view additional information about the Fund such as the prospectus, financial information, Fund holdings and proxy voting information. You may also request this information by contacting us at 1-800-621-1675 or info@ftportfolios.com.
OTHER INFORMATION
Nasdaq®, Nasdaq-100®, Nasdaq-100 Index®, and Nasdaq-100 Equal WeightedTM Index (the “Index”) are registered trademarks and service marks of Nasdaq, Inc. (together with its affiliates hereinafter referred to as the “Corporations”) and are licensed for use by First Trust. The Fund has not been passed on by the Corporations as to its legality or suitability. The Fund is not issued, endorsed, sold or promoted by the Corporations. THE CORPORATIONS MAKE NO WARRANTIES AND BEAR NO LIABILITY WITH RESPECT TO THE FUND.
First Trust NASDAQ-100-Technology
Sector Index Fund
QTEC | NASDAQ, INC.
ANNUAL SHAREHOLDER REPORT | December 31, 2024
This annual shareholder report contains important information about the First Trust NASDAQ-100-Technology Sector Index Fund (the “Fund”) for the year of January 1, 2024 to December 31, 2024 (the “Period”). You can find additional information about the Fund at www.ftportfolios.com/fund-documents/etf/QTEC. You can also request this information by contacting us at 1-800-621-1675 or info@ftportfolios.com.
WHAT WERE THE FUND COSTS FOR THE LAST YEAR?
(Based on a hypothetical $10,000 investment)
| Fund | Costs of a $10,000 investment | Costs paid as a percentage
of a $10,000 investment |
| First Trust NASDAQ-100-Technology Sector Index Fund | $56 | 0.54% |
HOW DID THE FUND PERFORM LAST YEAR? WHAT AFFECTED THE FUND’S PERFORMANCE?
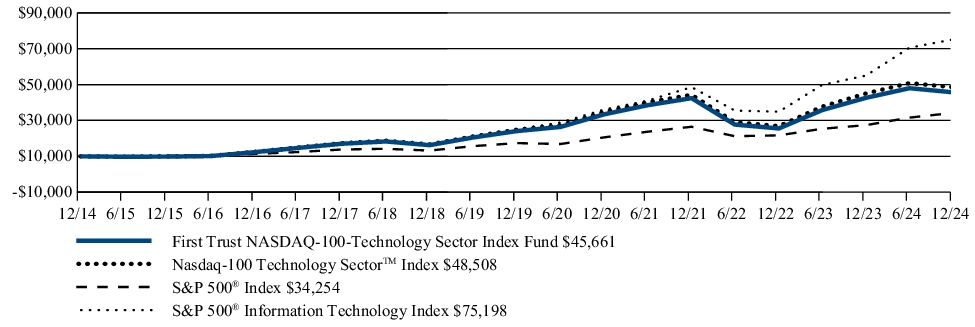
The Fund returned 7.12% during the 12 months ended December 31, 2024. The Fund underperformed its benchmark, the S&P 500® Information Technology Index, which returned 36.61% for the same Period.
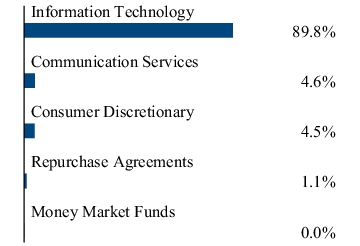
The largest industry allocations during the Period were the Semiconductors & Semiconductor Equipment industry at 42.3% and the Software industry at 37.4%. They contributed 3.3% and 2.7%, respectively, to the Fund’s return, which were the largest contributions to the Fund’s return since the Fund is so concentrated in these two industries. The most negative contribution to the Fund’s return came from investments in the IT Services industry which caused a -0.9% drag in the Fund.
FUND PERFORMANCE (December 31, 2014 to December 31, 2024)
The performance line graph below shows the performance of a hypothetical $10,000 initial investment in the Fund over a ten-year period (or for the life of the Fund, if shorter). The subsequent account value as of the end of the Period is listed next to the name of the Fund or index, as applicable. The performance table below shows the average annual total returns of the Fund for the past one-, five-, and ten-year periods, as applicable (or for the life of the Fund, if shorter), as of the end of the Period. Both the line graph and performance table compare the Fund’s performance to an appropriate broad-based index and may compare to additional indices reflecting the market segment(s) in which the Fund invests over the same periods.
Investment Performance of $10,000
| Average Annual Total Returns (as of December 31, 2024) | 1 Year | 5 Year | 10 Year |
| First Trust NASDAQ-100-Technology Sector Index Fund | 7.12% | 13.65% | 16.40% |
| Nasdaq-100 Technology SectorTM Index | 7.72% | 14.32% | 17.11% |
| S&P 500® Index | 25.02% | 14.53% | 13.10% |
| S&P 500® Information Technology Index | 36.61% | 24.55% | 22.35% |
Visit www.ftportfolios.com/etf/QTEC for more recent performance information.
The Fund’s past performance is not a good predictor of the Fund’s future performance. The graph and table do not reflect the deduction of taxes that a shareholder would pay on Fund distributions or redemption of Fund shares. The Fund’s total returns would have been lower if certain fees had not been waived and expenses reimbursed by the investment advisor.
KEY FUND STATISTICS (As of December 31, 2024)
| Fund net assets | $3,806,918,142 |
| Total number of portfolio holdings | 48 |
| Total advisory fee paid | $15,522,440 |
| Portfolio turnover rate | 28% |
WHAT DID THE FUND INVEST IN? (As of December 31, 2024)
The tables below show the investment makeup of the Fund, representing the percentage of total investments of the Fund.
| Broadcom, Inc. | 2.4% |
| Microchip Technology, Inc. | 2.4% |
| GLOBALFOUNDRIES, Inc. | 2.4% |
| Intel Corp. | 2.4% |
| Advanced Micro Devices, Inc. | 2.3% |
| Lam Research Corp. | 2.3% |
| QUALCOMM, Inc. | 2.3% |
| Texas Instruments, Inc. | 2.3% |
| Analog Devices, Inc. | 2.3% |
| KLA Corp. | 2.3% |
Any amount shown as 0.0% represents less than 0.1%.
WHERE CAN I FIND ADDITIONAL INFORMATION ABOUT THE FUND?
Visit www.ftportfolios.com/fund-documents/etf/QTEC to view additional information about the Fund such as the prospectus, financial information, Fund holdings and proxy voting information. You may also request this information by contacting us at 1-800-621-1675 or info@ftportfolios.com.
OTHER INFORMATION
Nasdaq®, Nasdaq-100®, Nasdaq-100 Index®, and Nasdaq-100 Technology SectorTM Index (the “Index”) are registered trademarks and service marks of Nasdaq, Inc. (together with its affiliates hereinafter referred to as the “Corporations”) and are licensed for use by First Trust. The Fund has not been passed on by the Corporations as to its legality or suitability. The Fund is not issued, endorsed, sold or promoted by the Corporations. THE CORPORATIONS MAKE NO WARRANTIES AND BEAR NO LIABILITY WITH RESPECT TO THE FUND.
First Trust NASDAQ-100 Ex-Technology
Sector Index Fund
QQXT | NASDAQ, INC.
ANNUAL SHAREHOLDER REPORT | December 31, 2024
This annual shareholder report contains important information about the First Trust NASDAQ-100 Ex-Technology Sector Index Fund (the “Fund”) for the year of January 1, 2024 to December 31, 2024 (the “Period”). You can find additional information about the Fund at www.ftportfolios.com/fund-documents/etf/QQXT. You can also request this information by contacting us at 1-800-621-1675 or info@ftportfolios.com.
WHAT WERE THE FUND COSTS FOR THE LAST YEAR?
(Based on a hypothetical $10,000 investment)
| Fund | Costs of a $10,000 investment | Costs paid as a percentage
of a $10,000 investment |
| First Trust NASDAQ-100 Ex-Technology Sector Index Fund | $62 | 0.60% |
HOW DID THE FUND PERFORM LAST YEAR? WHAT AFFECTED THE FUND’S PERFORMANCE?
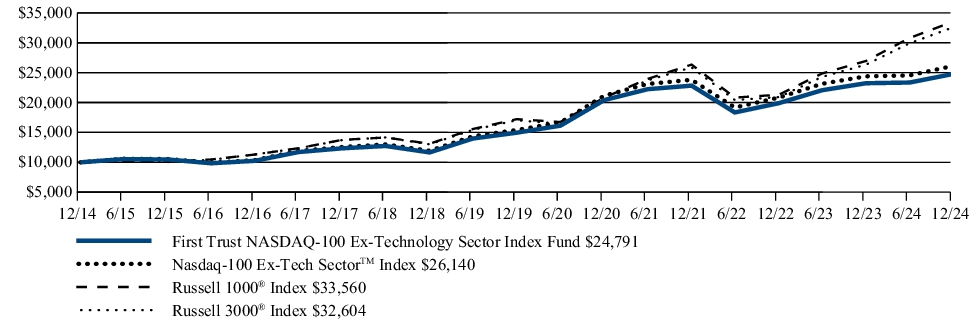
The Fund returned 6.73% during the 12 months ended December 31, 2024. The Fund underperformed its benchmark, the Russell 1000® Index, which returned 24.51% for the same Period.
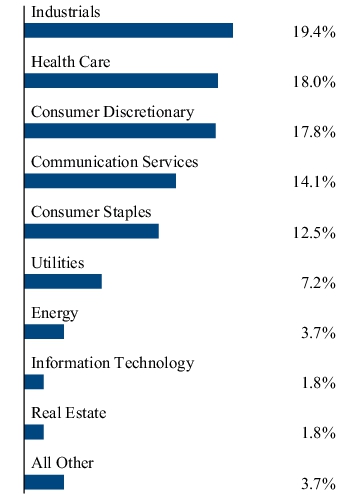
During the Period, the Fund allocated 20.0% to the Health Care sector, the largest of any sector. The largest contribution to the Fund’s return came from the Consumer Discretionary sector at 3.8%. The largest drag on the Fund’s return came from the Consumer Staples sector, which caused a
-2.2% drag in the Fund.
FUND PERFORMANCE (December 31, 2014 to December 31, 2024)
The performance line graph below shows the performance of a hypothetical $10,000 initial investment in the Fund over a ten-year period (or for the life of the Fund, if shorter). The subsequent account value as of the end of the Period is listed next to the name of the Fund or index, as applicable. The performance table below shows the average annual total returns of the Fund for the past one-, five-, and ten-year periods, as applicable (or for the life of the Fund, if shorter), as of the end of the Period. Both the line graph and performance table compare the Fund’s performance to an appropriate broad-based index and may compare to additional indices reflecting the market segment(s) in which the Fund invests over the same periods.
Investment Performance of $10,000
| Average Annual Total Returns (as of December 31, 2024) | 1 Year | 5 Year | 10 Year |
| First Trust NASDAQ-100 Ex-Technology Sector Index Fund | 6.73% | 10.63% | 9.50% |
| Nasdaq-100 Ex-Tech SectorTM Index | 7.19% | 11.15% | 10.09% |
| Russell 1000® Index | 24.51% | 14.28% | 12.87% |
| Russell 3000® Index | 23.81% | 13.86% | 12.55% |
Visit www.ftportfolios.com/etf/QQXT for more recent performance information.
The Fund’s past performance is not a good predictor of the Fund’s future performance. The graph and table do not reflect the deduction of taxes that a shareholder would pay on Fund distributions or redemption of Fund shares. The Fund’s total returns would have been lower if certain fees had not been waived and expenses reimbursed by the investment advisor.
KEY FUND STATISTICS (As of December 31, 2024)
| Fund net assets | $111,827,843 |
| Total number of portfolio holdings | 57 |
| Total advisory fee paid | $530,656 |
| Portfolio turnover rate | 27% |
WHAT DID THE FUND INVEST IN? (As of December 31, 2024)
The tables below show the investment makeup of the Fund, representing the percentage of total investments of the Fund.
| Diamondback Energy, Inc. | 1.9% |
| Biogen, Inc. | 1.9% |
| Starbucks Corp. | 1.9% |
| Coca-Cola Europacific Partners PLC | 1.8% |
| Baker Hughes Co. | 1.8% |
| Exelon Corp. | 1.8% |
| Monster Beverage Corp. | 1.8% |
| Regeneron Pharmaceuticals, Inc. | 1.8% |
| Ross Stores, Inc. | 1.8% |
| Vertex Pharmaceuticals, Inc. | 1.8% |
WHERE CAN I FIND ADDITIONAL INFORMATION ABOUT THE FUND?
Visit www.ftportfolios.com/fund-documents/etf/QQXT to view additional information about the Fund such as the prospectus, financial information, Fund holdings and proxy voting information. You may also request this information by contacting us at 1-800-621-1675 or info@ftportfolios.com.
OTHER INFORMATION
Nasdaq®, Nasdaq-100®, Nasdaq-100 Index®, and Nasdaq-100 Ex-Tech SectorTM Index (the “Index”) are registered trademarks and service marks of Nasdaq, Inc. (together with its affiliates hereinafter referred to as the “Corporations”) and are licensed for use by First Trust. The Fund has not been passed on by the Corporations as to its legality or suitability. The Fund is not issued, endorsed, sold or promoted by the Corporations. THE CORPORATIONS MAKE NO WARRANTIES AND BEAR NO LIABILITY WITH RESPECT TO THE FUND.
First Trust NASDAQ® Clean Edge®
Green Energy Index Fund
QCLN | NASDAQ, INC.
ANNUAL SHAREHOLDER REPORT | December 31, 2024
This annual shareholder report contains important information about the First Trust NASDAQ® Clean Edge® Green Energy Index Fund (the “Fund”) for the year of January 1, 2024 to December 31, 2024 (the “Period”). You can find additional information about the Fund at www.ftportfolios.com/fund-documents/etf/QCLN. You can also request this information by contacting us at 1-800-621-1675 or info@ftportfolios.com.
WHAT WERE THE FUND COSTS FOR THE LAST YEAR?
(Based on a hypothetical $10,000 investment)
| Fund | Costs of a $10,000 investment | Costs paid as a percentage
of a $10,000 investment |
| First Trust NASDAQ® Clean Edge® Green Energy Index Fund | $51 | 0.56% |
HOW DID THE FUND PERFORM LAST YEAR? WHAT AFFECTED THE FUND’S PERFORMANCE?
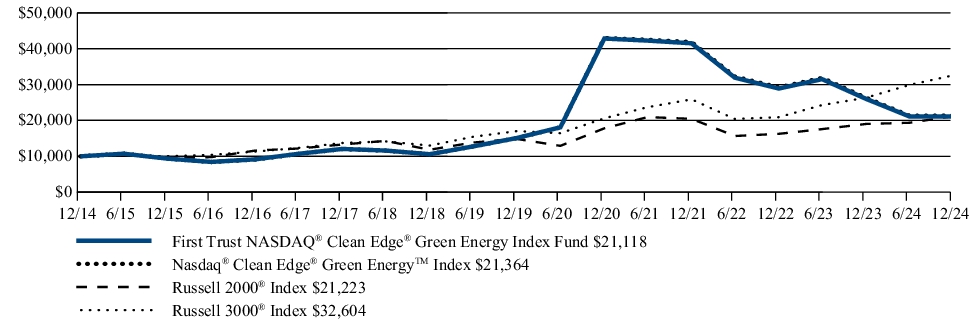
The Fund returned -18.82% during the 12 months ended December 31, 2024. The Fund underperformed its benchmark, the Russell 2000® Index, which returned 11.54% for the same Period.
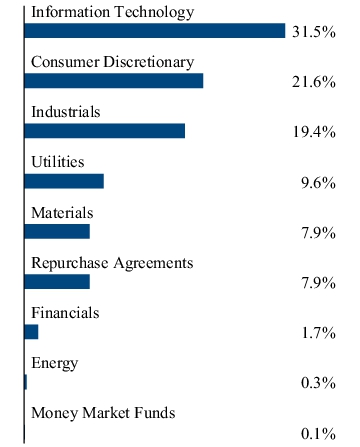
During the Period, the largest average weight in the Fund was the Information Technology sector at 38.5%. This sector was also the largest drag on the Fund, contributing -9.5% to the Fund’s total return. The largest positive contributor to the Fund’s return was the Consumer Discretionary sector, which contributed 1.3%. This was also the only sector to materially contribute positive returns to the Fund during the Period.
FUND PERFORMANCE (December 31, 2014 to December 31, 2024)
The performance line graph below shows the performance of a hypothetical $10,000 initial investment in the Fund over a ten-year period (or for the life of the Fund, if shorter). The subsequent account value as of the end of the Period is listed next to the name of the Fund or index, as applicable. The performance table below shows the average annual total returns of the Fund for the past one-, five-, and ten-year periods, as applicable (or for the life of the Fund, if shorter), as of the end of the Period. Both the line graph and performance table compare the Fund’s performance to an appropriate broad-based index and may compare to additional indices reflecting the market segment(s) in which the Fund invests over the same periods.
Investment Performance of $10,000
| Average Annual Total Returns (as of December 31, 2024) | 1 Year | 5 Year | 10 Year |
| First Trust NASDAQ® Clean Edge® Green Energy Index Fund | -18.82% | 6.92% | 7.76% |
| Nasdaq® Clean Edge® Green EnergyTM Index | -18.87% | 7.20% | 7.89% |
| Russell 2000® Index | 11.54% | 7.40% | 7.82% |
| Russell 3000® Index | 23.81% | 13.86% | 12.55% |
Visit www.ftportfolios.com/etf/QCLN for more recent performance information.
The Fund’s past performance is not a good predictor of the Fund’s future performance. The graph and table do not reflect the deduction of taxes that a shareholder would pay on Fund distributions or redemption of Fund shares. The Fund’s total returns would have been lower if certain fees had not been waived and expenses reimbursed by the investment advisor.
KEY FUND STATISTICS (As of December 31, 2024)
| Fund net assets | $548,439,213 |
| Total number of portfolio holdings | 55 |
| Total advisory fee paid | $2,918,634 |
| Portfolio turnover rate | 29% |
WHAT DID THE FUND INVEST IN? (As of December 31, 2024)
The tables below show the investment makeup of the Fund, representing the percentage of total investments of the Fund.
| Tesla, Inc. | 9.1% |
| Rivian Automotive, Inc., Class A | 7.0% |
| ON Semiconductor Corp. | 6.9% |
| First Solar, Inc. | 6.9% |
| Albemarle Corp. | 5.2% |
| Lucid Group, Inc. | 5.0% |
| RBC Dominion Securities, Inc. | 4.0% |
| Bank of America Corp. | 3.8% |
| Enphase Energy, Inc. | 3.7% |
| Acuity Brands, Inc. | 3.5% |
WHERE CAN I FIND ADDITIONAL INFORMATION ABOUT THE FUND?
Visit www.ftportfolios.com/fund-documents/etf/QCLN to view additional information about the Fund such as the prospectus, financial information, Fund holdings and proxy voting information. You may also request this information by contacting us at 1-800-621-1675 or info@ftportfolios.com.
OTHER INFORMATION
Nasdaq®, Clean Edge®, and Nasdaq® Clean Edge® Green EnergyTM Index (the “Index”) are registered trademarks and service marks of Nasdaq, Inc. and Clean Edge, Inc., respectively (together with its affiliates hereinafter referred to as the “Corporations”) and are licensed for use by First Trust. The Fund has not been passed on by the Corporations as to its legality or suitability. The Fund is not issued, endorsed, sold or promoted by the Corporations. THE CORPORATIONS MAKE NO WARRANTIES AND BEAR NO LIABILITY WITH RESPECT TO THE FUND.
First Trust S&P REIT Index Fund
FRI | NYSE ARCA, INC.
ANNUAL SHAREHOLDER REPORT | December 31, 2024
This annual shareholder report contains important information about the First Trust S&P REIT Index Fund (the “Fund”) for the year of January 1, 2024 to December 31, 2024 (the “Period”). You can find additional information about the Fund at www.ftportfolios.com/fund-documents/etf/FRI. You can also request this information by contacting us at 1-800-621-1675 or info@ftportfolios.com.
WHAT WERE THE FUND COSTS FOR THE LAST YEAR?
(Based on a hypothetical $10,000 investment)
| Fund | Costs of a $10,000 investment | Costs paid as a percentage
of a $10,000 investment |
| First Trust S&P REIT Index Fund | $51 | 0.49% |
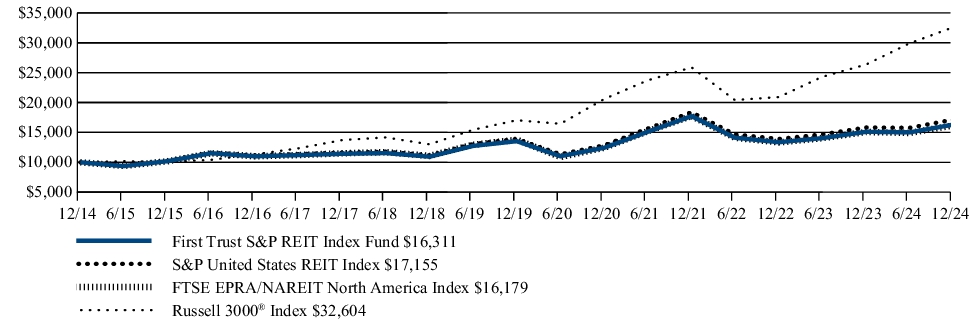
HOW DID THE FUND PERFORM LAST YEAR? WHAT AFFECTED THE FUND’S PERFORMANCE?
The Fund returned 7.96% during the 12 months ended December 31, 2024. The Fund underperformed its benchmark, the Russell 3000® Index, which returned 23.81% for the same Period.
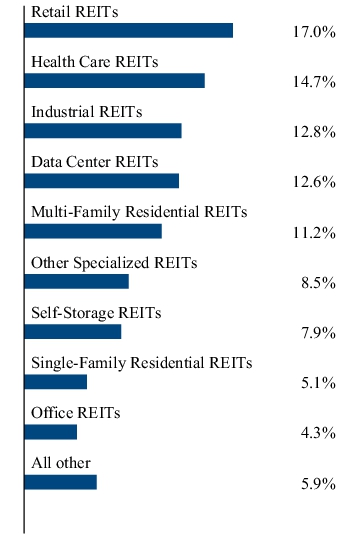
During the Period, the Retail Real Estate Investment Trusts (“REITs”) category received the greatest allocation of any category in the Fund with an average weight of 16.7%. The allocation to this category contributed 2.4% to the Fund’s overall return. With a weight of 12.7%, the Health Care REITs category contributed 3.0% to the Fund’s return, which was the greatest return contribution of any category. The most negative contribution to the Fund’s return of -3.0% came from the Industrial REITs category which had an average weight of 15.0%.
FUND PERFORMANCE (December 31, 2014 to December 31, 2024)
The performance line graph below shows the performance of a hypothetical $10,000 initial investment in the Fund over a ten-year period (or for the life of the Fund, if shorter). The subsequent account value as of the end of the Period is listed next to the name of the Fund or index, as applicable. The performance table below shows the average annual total returns of the Fund for the past one-, five-, and ten-year periods, as applicable (or for the life of the Fund, if shorter), as of the end of the Period. Both the line graph and performance table compare the Fund’s performance to an appropriate broad-based index and may compare to additional indices reflecting the market segment(s) in which the Fund invests over the same periods.
Investment Performance of $10,000
| Average Annual Total Returns (as of December 31, 2024) | 1 Year | 5 Year | 10 Year |
| First Trust S&P REIT Index Fund | 7.96% | 3.80% | 5.01% |
| S&P United States REIT Index | 8.44% | 4.30% | 5.55% |
| FTSE EPRA/NAREIT North America Index | 7.36% | 3.26% | 4.93% |
| Russell 3000® Index | 23.81% | 13.86% | 12.55% |
Visit www.ftportfolios.com/etf/FRI for more recent performance information.
The Fund’s past performance is not a good predictor of the Fund’s future performance. The graph and table do not reflect the deduction of taxes that a shareholder would pay on Fund distributions or redemption of Fund shares. The Fund’s total returns would have been lower if certain fees had not been waived and expenses reimbursed by the investment advisor.
KEY FUND STATISTICS (As of December 31, 2024)
| Fund net assets | $176,521,238 |
| Total number of portfolio holdings | 138 |
| Total advisory fee paid | $435,803 |
| Portfolio turnover rate | 7% |
WHAT DID THE FUND INVEST IN? (As of December 31, 2024)
The tables below show the investment makeup of the Fund, representing the percentage of total investments of the Fund.
| Prologis, Inc. | 8.5% |
| Equinix, Inc. | 7.9% |
| Welltower, Inc. | 6.5% |
| Digital Realty Trust, Inc. | 4.6% |
| Simon Property Group, Inc. | 4.6% |
| Public Storage | 4.1% |
| Realty Income Corp. | 4.1% |
| Extra Space Storage, Inc. | 2.8% |
| AvalonBay Communities, Inc. | 2.7% |
| Iron Mountain, Inc. | 2.7% |
WHERE CAN I FIND ADDITIONAL INFORMATION ABOUT THE FUND?
Visit www.ftportfolios.com/fund-documents/etf/FRI to view additional information about the Fund such as the prospectus, financial information, Fund holdings and proxy voting information. You may also request this information by contacting us at 1-800-621-1675 or info@ftportfolios.com.
OTHER INFORMATION
S&P United States REIT Index (“Index”) is a product of S&P Dow Jones Indices, LLC or its affiliates (“SPDJI”) and has been licensed for use by First Trust. S&P® is a registered trademark of Standard & Poor’s Financial Services LLC (“S&P”); Dow Jones® is a registered trademark of Dow Jones Trademark Holdings LLC (“Dow Jones”); and these trademarks have been licensed for use by SPDJI and sublicensed for certain purposes by First Trust. The Fund is not sponsored, endorsed, sold or promoted by SPDJI, Dow Jones, S&P or their respective affiliates and none of such parties make any representation regarding the advisability of investing in such product(s) nor do they have any liability for any errors, omissions, or interruptions of the Index.
First Trust Water ETF
FIW | NYSE ARCA, INC.
ANNUAL SHAREHOLDER REPORT | December 31, 2024
This annual shareholder report contains important information about the First Trust Water ETF (the “Fund”) for the year of January 1, 2024 to December 31, 2024 (the “Period”). You can find additional information about the Fund at www.ftportfolios.com/fund-documents/etf/FIW. You can also request this information by contacting us at 1-800-621-1675 or info@ftportfolios.com.
WHAT WERE THE FUND COSTS FOR THE LAST YEAR?
(Based on a hypothetical $10,000 investment)
| Fund | Costs of a $10,000 investment | Costs paid as a percentage
of a $10,000 investment |
| First Trust Water ETF | $53 | 0.51% |
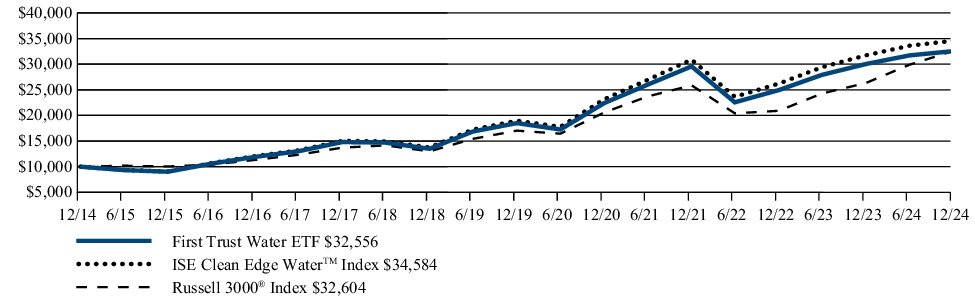
HOW DID THE FUND PERFORM LAST YEAR? WHAT AFFECTED THE FUND’S PERFORMANCE?
The Fund returned 8.37% during the 12 months ended December 31, 2024. The Fund underperformed its benchmark, the Russell 3000® Index, which returned 23.81% for the same Period.
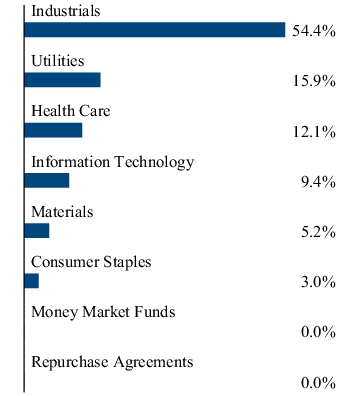
During the Period, the largest sector allocation was the Industrials sector, with an average portfolio weight of 55.3%. This sector also contributed the most to the Fund’s return at 6.3%. The most negatively contributing sector was the Utilities sector. This sector carried an average weight of 16.6% and caused a -1.4% contribution to the Fund’s overall return.
FUND PERFORMANCE (December 31, 2014 to December 31, 2024)
The performance line graph below shows the performance of a hypothetical $10,000 initial investment in the Fund over a ten-year period (or for the life of the Fund, if shorter). The subsequent account value as of the end of the Period is listed next to the name of the Fund or index, as applicable. The performance table below shows the average annual total returns of the Fund for the past one-, five-, and ten-year periods, as applicable (or for the life of the Fund, if shorter), as of the end of the Period. Both the line graph and performance table compare the Fund’s performance to an appropriate broad-based index and may compare to additional indices reflecting the market segment(s) in which the Fund invests over the same periods.
Investment Performance of $10,000
| Average Annual Total Returns (as of December 31, 2024) | 1 Year | 5 Year | 10 Year |
| First Trust Water ETF | 8.37% | 11.96% | 12.53% |
| ISE Clean Edge WaterTM Index | 8.95% | 12.76% | 13.21% |
| Russell 3000® Index | 23.81% | 13.86% | 12.55% |
Visit www.ftportfolios.com/etf/FIW for more recent performance information.
The Fund’s past performance is not a good predictor of the Fund’s future performance. The graph and table do not reflect the deduction of taxes that a shareholder would pay on Fund distributions or redemption of Fund shares.
KEY FUND STATISTICS (As of December 31, 2024)
| Fund net assets | $1,775,803,066 |
| Total number of portfolio holdings | 38 |
| Total advisory fee paid | $6,860,223 |
| Portfolio turnover rate | 15% |
WHAT DID THE FUND INVEST IN? (As of December 31, 2024)
The tables below show the investment makeup of the Fund, representing the percentage of total investments of the Fund.
| Waters Corp. | 4.5% |
| IDEX Corp. | 4.3% |
| Pentair PLC | 4.2% |
| Agilent Technologies, Inc. | 4.0% |
| Roper Technologies, Inc. | 3.9% |
| AECOM | 3.9% |
| Ecolab, Inc. | 3.9% |
| Veralto Corp. | 3.8% |
| American Water Works Co., Inc. | 3.7% |
| IDEXX Laboratories, Inc. | 3.6% |
Any amount shown as 0.0% represents less than 0.1%
WHERE CAN I FIND ADDITIONAL INFORMATION ABOUT THE FUND?
Visit www.ftportfolios.com/fund-documents/etf/FIW to view additional information about the Fund such as the prospectus, financial information, Fund holdings and proxy voting information. You may also request this information by contacting us at 1-800-621-1675 or info@ftportfolios.com.
OTHER INFORMATION
Nasdaq®, Clean Edge®, and ISE Clean Edge WaterTM Index (the “Index”) are registered trademarks and service marks of Nasdaq, Inc. and Clean Edge, Inc., respectively (together with its affiliates hereinafter referred to as the “Corporations”) and are licensed for use by First Trust. The Fund has not been passed on by the Corporations as to its legality or suitability. The Fund is not issued, endorsed, sold or promoted by the Corporations. THE CORPORATIONS MAKE NO WARRANTIES AND BEAR NO LIABILITY WITH RESPECT TO THE FUND.
First Trust Natural Gas ETF
FCG | NYSE ARCA, INC.
ANNUAL SHAREHOLDER REPORT | December 31, 2024
This annual shareholder report contains important information about the First Trust Natural Gas ETF (the “Fund”) for the year of January 1, 2024 to December 31, 2024 (the “Period”). You can find additional information about the Fund at www.ftportfolios.com/fund-documents/etf/FCG. You can also request this information by contacting us at 1-800-621-1675 or info@ftportfolios.com.
WHAT WERE THE FUND COSTS FOR THE LAST YEAR?
(Based on a hypothetical $10,000 investment)
| Fund | Costs of a $10,000 investment | Costs paid as a percentage
of a $10,000 investment |
| First Trust Natural Gas ETF | $58 | 0.57% |
HOW DID THE FUND PERFORM LAST YEAR? WHAT AFFECTED THE FUND’S PERFORMANCE?
The Fund returned 3.98% during the 12 months ended December 31, 2024. The Fund underperformed its benchmark, the S&P Composite 1500® Energy Index, which returned 5.98% for the same Period.
During the Period, the Oil & Gas Exploration and Production sub-industry was the largest allocation in the Fund at 84.2%. This sub-industry contributed 2.1% to the Fund’s overall return. The Oil and Gas Storage and Transportation sub-industry received the second highest allocation by sub-industry at an average weight of 9.7% and contributed 2.8% to the Fund’s return. The most negative contribution to return came from the Integrated Oil & Gas sub-industry, which received only a single allocation, Occidental Petroleum Corporation. The 1.7% allocation to this security caused -0.7% drag to the Fund’s overall return.
FUND PERFORMANCE (December 31, 2014 to December 31, 2024)
The performance line graph below shows the performance of a hypothetical $10,000 initial investment in the Fund over a ten-year period (or for the life of the Fund, if shorter). The subsequent account value as of the end of the Period is listed next to the name of the Fund or index, as applicable. The performance table below shows the average annual total returns of the Fund for the past one-, five-, and ten-year periods, as applicable (or for the life of the Fund, if shorter), as of the end of the Period. Both the line graph and performance table compare the Fund’s performance to an appropriate broad-based index and may compare to additional indices reflecting the market segment(s) in which the Fund invests over the same periods.
Investment Performance of $10,000
| Average Annual Total Returns (as of December 31, 2024) | 1 Year | 5 Year | 10 Year |
| First Trust Natural Gas ETF | 3.98% | 19.10% | -5.49% |
| ISE-Revere Natural GasTM Index | 4.68% | 18.68% | -5.60% |
| S&P Composite 1500® Energy Index | 5.98% | 12.11% | 4.34% |
| Russell 3000® Index | 23.81% | 13.86% | 12.55% |
Visit www.ftportfolios.com/etf/FCG for more recent performance information.
The Fund’s past performance is not a good predictor of the Fund’s future performance. The graph and table do not reflect the deduction of taxes that a shareholder would pay on Fund distributions or redemption of Fund shares. The Fund’s total returns would have been lower if certain fees had not been waived and expenses reimbursed by the investment advisor.
KEY FUND STATISTICS (As of December 31, 2024)
| Fund net assets | $402,372,855 |
| Total number of portfolio holdings | 45 |
| Total advisory fee paid | $1,616,815 |
| Portfolio turnover rate | 38% |
WHAT DID THE FUND INVEST IN? (As of December 31, 2024)
The tables below show the investment makeup of the Fund, representing the percentage of total investments of the Fund.
| Hess Midstream, L.P., Class A | 4.6% |
| Western Midstream Partners, L.P. | 4.4% |
| Occidental Petroleum Corp. | 4.4% |
| ConocoPhillips | 4.2% |
| EQT Corp. | 4.1% |
| EOG Resources, Inc. | 4.0% |
| Expand Energy Corp. | 3.9% |
| Diamondback Energy, Inc. | 3.9% |
| APA Corp. | 3.6% |
| Coterra Energy, Inc. | 3.6% |
WHERE CAN I FIND ADDITIONAL INFORMATION ABOUT THE FUND?
Visit www.ftportfolios.com/fund-documents/etf/FCG to view additional information about the Fund such as the prospectus, financial information, Fund holdings and proxy voting information. You may also request this information by contacting us at 1-800-621-1675 or info@ftportfolios.com.
OTHER INFORMATION
Nasdaq® and ISE-Revere Natural GasTM Index (the “Index”) are registered trademarks and service marks of Nasdaq, Inc. (together with its affiliates hereinafter referred to as the “Corporations”) and are licensed for use by First Trust. The Fund has not been passed on by the Corporations as to its legality or suitability. The Fund is not issued, endorsed, sold or promoted by the Corporations. THE CORPORATIONS MAKE NO WARRANTIES AND BEAR NO LIABILITY WITH RESPECT TO THE FUND.
First Trust NASDAQ®
ABA Community Bank Index Fund
QABA | NASDAQ, INC.
ANNUAL SHAREHOLDER REPORT | December 31, 2024
This annual shareholder report contains important information about the First Trust NASDAQ® ABA Community Bank Index Fund (the “Fund”) for the year of January 1, 2024 to December 31, 2024 (the “Period”). You can find additional information about the Fund at www.ftportfolios.com/fund-documents/etf/QABA. You can also request this information by contacting us at 1-800-621-1675 or info@ftportfolios.com.
WHAT WERE THE FUND COSTS FOR THE LAST YEAR?
(Based on a hypothetical $10,000 investment)
| Fund | Costs of a $10,000 investment | Costs paid as a percentage
of a $10,000 investment |
| First Trust NASDAQ® ABA Community Bank Index Fund | $64 | 0.60% |
HOW DID THE FUND PERFORM LAST YEAR? WHAT AFFECTED THE FUND’S PERFORMANCE?
The Fund returned 14.51% during the 12 months ended December 31, 2024. The Fund underperformed its benchmark, the S&P Composite 1500® Financials Index, which returned 29.78% for the same Period.
During the Period, 98.0% of the Fund was allocated to the Regional Banks sub-industry, with the bulk of the remainder of the average allocations being in other financial-related sub-industries. Regional banks contributed 15.3% towards the Fund’s return, the greatest of any sub-industry. The Commercial & Residential Mortgage Finance sub-industry contributed the only negative contribution to the Fund’s return of all sub-industries, detracting -0.1% from the Fund’s return.
FUND PERFORMANCE (December 31, 2014 to December 31, 2024)
The performance line graph below shows the performance of a hypothetical $10,000 initial investment in the Fund over a ten-year period (or for the life of the Fund, if shorter). The subsequent account value as of the end of the Period is listed next to the name of the Fund or index, as applicable. The performance table below shows the average annual total returns of the Fund for the past one-, five-, and ten-year periods, as applicable (or for the life of the Fund, if shorter), as of the end of the Period. Both the line graph and performance table compare the Fund’s performance to an appropriate broad-based index and may compare to additional indices reflecting the market segment(s) in which the Fund invests over the same periods.
Investment Performance of $10,000
| Average Annual Total Returns (as of December 31, 2024) | 1 Year | 5 Year | 10 Year |
| First Trust NASDAQ® ABA Community Bank Index Fund | 14.51% | 4.01% | 6.46% |
| Nasdaq OMX® ABA Community BankTM Index | 15.24% | 4.66% | 7.13% |
| S&P Composite 1500® Financials Index | 29.78% | 11.44% | 11.33% |
| Russell 3000® Index | 23.81% | 13.86% | 12.55% |
Visit www.ftportfolios.com/etf/QABA for more recent performance information.
The Fund’s past performance is not a good predictor of the Fund’s future performance. The graph and table do not reflect the deduction of taxes that a shareholder would pay on Fund distributions or redemption of Fund shares. The Fund’s total returns would have been lower if certain fees had not been waived and expenses reimbursed by the investment advisor.
KEY FUND STATISTICS (As of December 31, 2024)
| Fund net assets | $122,247,168 |
| Total number of portfolio holdings | 159 |
| Total advisory fee paid | $347,252 |
| Portfolio turnover rate | 20% |
WHAT DID THE FUND INVEST IN? (As of December 31, 2024)
The tables below show the investment makeup of the Fund, representing the percentage of total investments of the Fund.
| Commerce Bancshares, Inc. | 4.1% |
| Wintrust Financial Corp. | 4.1% |
| UMB Financial Corp. | 2.7% |
| First Financial Bankshares, Inc. | 2.5% |
| United Bankshares, Inc. | 2.5% |
| Bank OZK | 2.5% |
| Hancock Whitney Corp. | 2.3% |
| International Bancshares Corp. | 1.9% |
| BancFirst Corp. | 1.9% |
| Texas Capital Bancshares, Inc. | 1.8% |
Any amount shown as 0.0% represents less than 0.1%
WHERE CAN I FIND ADDITIONAL INFORMATION ABOUT THE FUND?
Visit www.ftportfolios.com/fund-documents/etf/QABA to view additional information about the Fund such as the prospectus, financial information, Fund holdings and proxy voting information. You may also request this information by contacting us at 1-800-621-1675 or info@ftportfolios.com.
OTHER INFORMATION
Nasdaq®, Nasdaq OMX®, OMX®, American Bankers Association®, ABA® and Nasdaq OMX® ABA Community BankTM Index (the “Index”) are registered trademarks and service marks of Nasdaq, Inc. and American Bankers Associations, respectively (together with its affiliates hereinafter referred to as the “Corporations”) and are licensed for use by First Trust. The Fund has not been passed on by the Corporations as to its legality or suitability. The Fund is not issued, endorsed, sold or promoted by the Corporations. THE CORPORATIONS MAKE NO WARRANTIES AND BEAR NO LIABILITY WITH RESPECT TO THE FUND.
First Trust Dividend StrengthTM ETF
FTDS | NASDAQ, INC.
ANNUAL SHAREHOLDER REPORT | December 31, 2024
This annual shareholder report contains important information about the First Trust Dividend StrengthTM ETF (the “Fund”) for the year of January 1, 2024 to December 31, 2024 (the “Period”). You can find additional information about the Fund at www.ftportfolios.com/fund-documents/etf/FTDS. You can also request this information by contacting us at 1-800-621-1675 or info@ftportfolios.com.
WHAT WERE THE FUND COSTS FOR THE LAST YEAR?
(Based on a hypothetical $10,000 investment)
| Fund | Costs of a $10,000 investment | Costs paid as a percentage
of a $10,000 investment |
| First Trust Dividend StrengthTM ETF | $74 | 0.70% |
HOW DID THE FUND PERFORM LAST YEAR? WHAT AFFECTED THE FUND’S PERFORMANCE?
The Fund returned 11.09% during the 12 months ended December 31, 2024. The Fund underperformed its benchmark, the Dow Jones U.S. Select Dividend Index, which returned 16.62% for the same Period.
During the Period, the Financials sector was the largest sector allocation by average weight at 30.4%. The largest contribution to the Fund’s return was also the Financials sector, which contributed 10.6%. The largest negative contributor to the Fund’s return was the Consumer Staples sector, which contributed -2.4% to Fund return.
FUND PERFORMANCE (December 31, 2014 to December 31, 2024)
The performance line graph below shows the performance of a hypothetical $10,000 initial investment in the Fund over a ten-year period (or for the life of the Fund, if shorter). The subsequent account value as of the end of the Period is listed next to the name of the Fund or index, as applicable. The performance table below shows the average annual total returns of the Fund for the past one-, five-, and ten-year periods, as applicable (or for the life of the Fund, if shorter), as of the end of the Period. Both the line graph and performance table compare the Fund’s performance to an appropriate broad-based index and may compare to additional indices reflecting the market segment(s) in which the Fund invests over the same periods.
Investment Performance of $10,000
| Average Annual Total Returns (as of December 31, 2024) | 1 Year | 5 Year | 10 Year |
| First Trust Dividend StrengthTM ETF | 11.09% | 8.79% | 8.33% |
| The Dividend StrengthTM Index(1) (2) | 11.89% | N/A | N/A |
| S&P 500® Index | 25.02% | 14.53% | 13.10% |
| Dow Jones U.S. Select Dividend Index | 16.62% | 8.86% | 9.38% |
| Russell 1000® Value Index | 14.37% | 8.68% | 8.49% |
| (1) | On April 29, 2022, the Fund’s underlying index changed from the Nasdaq AlphaDEX® Total US Market Index to The Dividend StrengthTM Index. Therefore, the Fund’s performance and total returns shown are not necessarily indicative of the performance the Fund, based on its current index, would have generated. |
| (2) | Because the Fund’s underlying index has an inception date of March 7, 2022, performance data for the Index is not available for all periods shown in the table because performance data does not exist for some of the entire periods. |
Visit www.ftportfolios.com/etf/FTDS for more recent performance information.
The Fund’s past performance is not a good predictor of the Fund’s future performance. The graph and table do not reflect the deduction of taxes that a shareholder would pay on Fund distributions or redemption of Fund shares. The Fund’s total returns would have been lower if certain fees had not been waived and expenses reimbursed by the investment advisor.
KEY FUND STATISTICS (As of December 31, 2024)
| Fund net assets | $25,280,278 |
| Total number of portfolio holdings | 51 |
| Total advisory fee paid | $72,572 |
| Portfolio turnover rate | 104% |
WHAT DID THE FUND INVEST IN? (As of December 31, 2024)
The tables below show the investment makeup of the Fund, representing the percentage of total investments of the Fund.
| Garmin Ltd. | 2.6% |
| Wyndham Hotels & Resorts, Inc. | 2.6% |
| Unum Group | 2.4% |
| Cullen/Frost Bankers, Inc. | 2.3% |
| Coterra Energy, Inc. | 2.3% |
| Commerce Bancshares, Inc. | 2.2% |
| Home BancShares, Inc. | 2.2% |
| Dick’s Sporting Goods, Inc. | 2.2% |
| East West Bancorp, Inc. | 2.2% |
| Snap-on, Inc. | 2.2% |
WHERE CAN I FIND ADDITIONAL INFORMATION ABOUT THE FUND?
Visit www.ftportfolios.com/fund-documents/etf/FTDS to view additional information about the Fund such as the prospectus, financial information, Fund holdings and proxy voting information. You may also request this information by contacting us at 1-800-621-1675 or info@ftportfolios.com.
OTHER INFORMATION
Nasdaq® and The Dividend StrengthTM Index (the “Index”) are registered trademarks and service marks of Nasdaq, Inc. (together with its affiliates hereinafter referred to as the “Corporations”) and are licensed for use by First Trust. The Fund has not been passed on by the Corporations as to its legality or suitability. The Fund is not issued, endorsed, sold or promoted by the Corporations. THE CORPORATIONS MAKE NO WARRANTIES AND BEAR NO LIABILITY WITH RESPECT TO THE FUND.
First Trust Dow 30 Equal Weight ETF
EDOW | NYSE ARCA, INC.
ANNUAL SHAREHOLDER REPORT | December 31, 2024
This annual shareholder report contains important information about the First Trust Dow 30 Equal Weight ETF (the “Fund”) for the year of January 1, 2024 to December 31, 2024 (the “Period”). You can find additional information about the Fund at www.ftportfolios.com/fund-documents/etf/EDOW. You can also request this information by contacting us at 1-800-621-1675 or info@ftportfolios.com.
WHAT WERE THE FUND COSTS FOR THE LAST YEAR?
(Based on a hypothetical $10,000 investment)
| Fund | Costs of a $10,000 investment | Costs paid as a percentage
of a $10,000 investment |
| First Trust Dow 30 Equal Weight ETF | $53 | 0.50% |
HOW DID THE FUND PERFORM LAST YEAR? WHAT AFFECTED THE FUND’S PERFORMANCE?
The Fund returned 13.16% during the 12 months ended December 31, 2024. The Fund underperformed its benchmark, the Dow Jones Industrial AverageTM, which returned 14.99% for the same Period.
During the Period, the largest sector allocation by weight was the Information Technology sector, with an average portfolio weight of 19.9%. The Financials sector contributed the most to the Fund’s return, contributing 6.5%. The largest negative contribution to the Fund’s return came from the Materials sector, which contributed -0.6%.
FUND PERFORMANCE (August 8, 2017 to December 31, 2024)
The performance line graph below shows the performance of a hypothetical $10,000 initial investment in the Fund over a ten-year period (or for the life of the Fund, if shorter). The subsequent account value as of the end of the Period is listed next to the name of the Fund or index, as applicable. The performance table below shows the average annual total returns of the Fund for the past one-, five-, and ten-year periods, as applicable (or for the life of the Fund, if shorter), as of the end of the Period. Both the line graph and performance table compare the Fund’s performance to an appropriate broad-based index and may compare to additional indices reflecting the market segment(s) in which the Fund invests over the same periods.
Investment Performance of $10,000
| Average Annual Total Returns (as of December 31, 2024) | 1 Year | 5 Year | Since
Inception
(8/8/17) |
| First Trust Dow 30 Equal Weight ETF | 13.16% | 8.86% | 10.49% |
| Dow Jones Industrial Average® Equal Weight Index | 13.77% | 9.53% | 11.13% |
| Dow Jones Industrial AverageTM | 14.99% | 10.55% | 11.64% |
| S&P 500® Index | 25.02% | 14.53% | 14.36% |
Visit www.ftportfolios.com/etf/EDOW for more recent performance information.
The Fund’s past performance is not a good predictor of the Fund’s future performance. The graph and table do not reflect the deduction of taxes that a shareholder would pay on Fund distributions or redemption of Fund shares.
KEY FUND STATISTICS (As of December 31, 2024)
| Fund net assets | $230,517,383 |
| Total number of portfolio holdings | 31 |
| Total advisory fee paid | $1,161,536 |
| Portfolio turnover rate | 28% |
WHAT DID THE FUND INVEST IN? (As of December 31, 2024)
The tables below show the investment makeup of the Fund, representing the percentage of total investments of the Fund.
| Boeing (The) Co. | 3.7% |
| Apple, Inc. | 3.5% |
| Cisco Systems, Inc. | 3.5% |
| Visa, Inc., Class A | 3.5% |
| Merck & Co., Inc. | 3.4% |
| 3M Co. | 3.4% |
| Coca-Cola (The) Co. | 3.4% |
| Johnson & Johnson | 3.4% |
| Honeywell International, Inc. | 3.4% |
| JPMorgan Chase & Co. | 3.4% |
WHERE CAN I FIND ADDITIONAL INFORMATION ABOUT THE FUND?
Visit www.ftportfolios.com/fund-documents/etf/EDOW to view additional information about the Fund such as the prospectus, financial information, Fund holdings and proxy voting information. You may also request this information by contacting us at 1-800-621-1675 or info@ftportfolios.com.
OTHER INFORMATION
Dow Jones Industrial Average® Equal Weight Index (“Index”) is a product of S&P Dow Jones Indices, LLC or its affiliates (“SPDJI”) and has been licensed for use by First Trust. S&P® is a registered trademark of Standard & Poor’s Financial Services LLC (“S&P”); Dow Jones® is a registered trademark of Dow Jones Trademark Holdings LLC (“Dow Jones”); and these trademarks have been licensed for use by SPDJI and sublicensed for certain purposes by First Trust. The Fund is not sponsored, endorsed, sold or promoted by SPDJI, Dow Jones, S&P or their respective affiliates and none of such parties make any representation regarding the advisability of investing in such product(s) nor do they have any liability for any errors, omissions, or interruptions of the Index.
First Trust Lunt U.S. Factor Rotation ETF
FCTR | CBOE BZX EXCHANGE, INC.
ANNUAL SHAREHOLDER REPORT | December 31, 2024
This annual shareholder report contains important information about the First Trust Lunt U.S. Factor Rotation ETF (the “Fund”) for the year of January 1, 2024 to December 31, 2024 (the “Period”). You can find additional information about the Fund at www.ftportfolios.com/fund-documents/etf/FCTR. You can also request this information by contacting us at 1-800-621-1675 or info@ftportfolios.com.
WHAT WERE THE FUND COSTS FOR THE LAST YEAR?
(Based on a hypothetical $10,000 investment)
| Fund | Costs of a $10,000 investment | Costs paid as a percentage
of a $10,000 investment |
| First Trust Lunt U.S. Factor Rotation ETF | $71 | 0.65% |
HOW DID THE FUND PERFORM LAST YEAR? WHAT AFFECTED THE FUND’S PERFORMANCE?
The Fund returned 19.60% during the 12 months ended December 31, 2024. The Fund underperformed its benchmark, the Nasdaq US 500 Large CapTM Index, which returned 25.61% for the same Period.
During the Period, the largest sector allocation by weight was the Information Technology sector, with an average portfolio weight of 20.9%. The Financials sector was also highly weighted at 19.2%. The Information Technology sector contributed the most to the Fund’s return, at 12.2%. The largest negative contribution to the Fund’s return came from the Consumer Staples sector, at -1.3%.
FUND PERFORMANCE (July 25, 2018 to December 31, 2024)
The performance line graph below shows the performance of a hypothetical $10,000 initial investment in the Fund over a ten-year period (or for the life of the Fund, if shorter). The subsequent account value as of the end of the Period is listed next to the name of the Fund or index, as applicable. The performance table below shows the average annual total returns of the Fund for the past one-, five-, and ten-year periods, as applicable (or for the life of the Fund, if shorter), as of the end of the Period. Both the line graph and performance table compare the Fund’s performance to an appropriate broad-based index and may compare to additional indices reflecting the market segment(s) in which the Fund invests over the same periods.
Investment Performance of $10,000
| Average Annual Total Returns (as of December 31, 2024) | 1 Year | 5 Year | Since
Inception
(7/25/18) |
| First Trust Lunt U.S. Factor Rotation ETF | 19.60% | 8.61% | 8.91% |
| Lunt Capital Large Cap Factor Rotation Index | 20.54% | 9.44% | 9.73% |
| Nasdaq US 500 Large CapTM Index | 25.61% | 14.59% | 13.92% |
| S&P 500® Index | 25.02% | 14.53% | 13.84% |
Visit www.ftportfolios.com/etf/FCTR for more recent performance information.
The Fund’s past performance is not a good predictor of the Fund’s future performance. The graph and table do not reflect the deduction of taxes that a shareholder would pay on Fund distributions or redemption of Fund shares.
KEY FUND STATISTICS (As of December 31, 2024)
| Fund net assets | $70,896,515 |
| Total number of portfolio holdings | 179 |
| Total advisory fee paid | $469,835 |
| Portfolio turnover rate | 431% |
WHAT DID THE FUND INVEST IN? (As of December 31, 2024)
The tables below show the investment makeup of the Fund, representing the percentage of total investments of the Fund.
| AppLovin Corp., Class A | 4.0% |
| Palantir Technologies, Inc., Class A | 2.0% |
| Vistra Corp. | 1.7% |
| Motorola Solutions, Inc. | 1.7% |
| United Airlines Holdings, Inc. | 1.6% |
| Paychex, Inc. | 1.5% |
| Broadridge Financial Solutions, Inc. | 1.4% |
| Stryker Corp. | 1.3% |
| Automatic Data Processing, Inc. | 1.1% |
| General Motors Co. | 1.1% |
WHERE CAN I FIND ADDITIONAL INFORMATION ABOUT THE FUND?
Visit www.ftportfolios.com/fund-documents/etf/FCTR to view additional information about the Fund such as the prospectus, financial information, Fund holdings and proxy voting information. You may also request this information by contacting us at 1-800-621-1675 or info@ftportfolios.com.
OTHER INFORMATION
Lunt Capital Management, Inc. (“Lunt”) and Lunt Capital Large Cap Factor Rotation Index (“Lunt Index”) are trademarks of Lunt and have been licensed for use for certain purposes by First Trust. The First Trust Lunt U.S. Factor Rotation ETF is based on the Lunt Index and is not sponsored, endorsed, sold or promoted by Lunt, and Lunt makes no representation regarding the advisability of trading in such fund. Lunt has contracted with Nasdaq, Inc. to calculate and maintain the Lunt Index. The Fund is not sponsored, endorsed, sold or promoted by Nasdaq, Inc. or its affiliates (Nasdaq, with its affiliates, hereinafter referred to as the “Corporations”). The Corporations have not passed on the legality or suitability of, or the accuracy or adequacy of descriptions and disclosures relating to, the Fund. The Corporations make no representation or warranty, express or implied to the owners of the Fund or any member of the public regarding the advisability of investing in securities generally or in the Fund particularly, or the ability of the Lunt Index to track general stock performance.
First Trust S&P 500
Diversified Free Cash Flow ETF
FCFY | NYSE ARCA, INC.
ANNUAL SHAREHOLDER REPORT | December 31, 2024
This annual shareholder report contains important information about the First Trust S&P 500 Diversified Free Cash Flow ETF (the “Fund”) for the year of January 1, 2024 to December 31, 2024 (the “Period”). You can find additional information about the Fund at www.ftportfolios.com/fund-documents/etf/FCFY. You can also request this information by contacting us at 1-800-621-1675 or info@ftportfolios.com.
WHAT WERE THE FUND COSTS FOR THE LAST YEAR?
(Based on a hypothetical $10,000 investment)
| Fund | Costs of a $10,000 investment | Costs paid as a percentage
of a $10,000 investment |
| First Trust S&P 500 Diversified Free Cash Flow ETF | $63 | 0.60% |
HOW DID THE FUND PERFORM LAST YEAR? WHAT AFFECTED THE FUND’S PERFORMANCE?
The Fund returned 11.28% during the 12 months ended December 31, 2024. The Fund underperformed its benchmark, the S&P 500® Index, which returned 25.02% for the same Period.
During the Period, the Information Technology sector received the greatest allocation of any sector in the Fund with an average weight of 29.6%. The allocation to this sector contributed 3.8% to the Fund’s overall return. With an average weight of 13.9%, the Financials sector contributed 4.2% to the Fund’s return, the greatest return contribution of any sector. The most negative contribution to the Fund’s return came from the Materials sector at -0.4%. This sector also had an average weight in the Fund of 2.1%.
FUND PERFORMANCE (August 23, 2023 to December 31, 2024)
The performance line graph below shows the performance of a hypothetical $10,000 initial investment in the Fund over a ten-year period (or for the life of the Fund, if shorter). The subsequent account value as of the end of the Period is listed next to the name of the Fund or index, as applicable. The performance table below shows the average annual total returns of the Fund for the past one-, five-, and ten-year periods, as applicable (or for the life of the Fund, if shorter), as of the end of the Period. Both the line graph and performance table compare the Fund’s performance to an appropriate broad-based index and may compare to additional indices reflecting the market segment(s) in which the Fund invests over the same periods.
Investment Performance of $10,000
| Average Annual Total Returns (as of December 31, 2024) | 1 Year | Since
Inception
(8/23/23) |
| First Trust S&P 500 Diversified Free Cash Flow ETF | 11.28% | 16.26% |
| S&P 500® Sector-Neutral FCF Index | 11.99% | 17.00% |
| S&P 500® Index | 25.02% | 24.91% |
Visit www.ftportfolios.com/etf/FCFY for more recent performance information.
The Fund’s past performance is not a good predictor of the Fund’s future performance. The graph and table do not reflect the deduction of taxes that a shareholder would pay on Fund distributions or redemption of Fund shares.
KEY FUND STATISTICS (As of December 31, 2024)
| Fund net assets | $1,204,294 |
| Total number of portfolio holdings | 101 |
| Total advisory fee paid | $7,085 |
| Portfolio turnover rate | 63% |
WHAT DID THE FUND INVEST IN? (As of December 31, 2024)
The tables below show the investment makeup of the Fund, representing the percentage of total investments of the Fund.
| Warner Bros. Discovery, Inc. | 4.6% |
| Skyworks Solutions, Inc. | 3.2% |
| Gen Digital, Inc. | 3.0% |
| Hewlett Packard Enterprise Co. | 2.9% |
| Jabil, Inc. | 2.7% |
| HP, Inc. | 2.6% |
| Synchrony Financial | 2.5% |
| EPAM Systems, Inc. | 2.5% |
| F5, Inc. | 2.3% |
| QUALCOMM, Inc. | 2.1% |
WHERE CAN I FIND ADDITIONAL INFORMATION ABOUT THE FUND?
Visit www.ftportfolios.com/fund-documents/etf/FCFY to view additional information about the Fund such as the prospectus, financial information, Fund holdings and proxy voting information. You may also request this information by contacting us at 1-800-621-1675 or info@ftportfolios.com.
OTHER INFORMATION
S&P 500® Sector-Neutral FCF Index (“Index”) is a product of S&P Dow Jones Indices, LLC or its affiliates (“SPDJI”) and has been licensed for use by First Trust. S&P® is a registered trademark of Standard & Poor’s Financial Services LLC (“S&P”); Dow Jones® is a registered trademark of Dow Jones Trademark Holdings LLC (“Dow Jones”); and these trademarks have been licensed for use by SPDJI and sublicensed for certain purposes by First Trust. The Fund is not sponsored, endorsed, sold or promoted by SPDJI, Dow Jones, S&P or their respective affiliates and none of such parties make any representation regarding the advisability of investing in such product(s) nor do they have any liability for any errors, omissions, or interruptions of the Index.
FT Vest Gold Strategy Quarterly Buffer ETF
BGLD | CBOE BZX EXCHANGE, INC.
ANNUAL SHAREHOLDER REPORT | December 31, 2024
This annual shareholder report contains important information about the FT Vest Gold Strategy Quarterly Buffer ETF (the “Fund”) for the year of January 1, 2024 to December 31, 2024 (the “Period”). You can find additional information about the Fund at www.ftportfolios.com/fund-documents/etf/BGLD. You can also request this information by contacting us at 1-800-621-1675 or info@ftportfolios.com.
This report describes changes to the Fund that occurred during the Period.
WHAT WERE THE FUND COSTS FOR THE LAST YEAR?
(Based on a hypothetical $10,000 investment)
| Fund | Costs of a $10,000 investment | Costs paid as a percentage
of a $10,000 investment |
| FT Vest Gold Strategy Quarterly Buffer ETF | $100 | 0.90% |
HOW DID THE FUND PERFORM LAST YEAR? WHAT AFFECTED THE FUND’S PERFORMANCE?
The Fund returned 21.87% for the 12 months ended December 31, 2024. The Fund underperformed its benchmark, the S&P 500® Index, which returned 25.02% for the same Period.
This underperformance was due to the following:
| Fund Net Asset Value Performance Attributed to: | | |
| Equities/Synthetic equities on GLD | 26.66 | % |
| GLD Options (Buffer and Cap) | -3.89 | % |
| Fees and expenses | -0.90 | % |
The Fund seeks to provide returns (before fees and expenses) that match the price return of the SPDR® Gold Trust (the “GLD”), up to a predetermined upside cap while providing a buffer against GLD losses between -5% and -15% over each of the quarterly target outcome periods. During the Period, the Fund held U.S. treasuries and various options on GLD. This combination provided the above buffer, and also set a cap, or limit, on upside performance. The Fund’s options strategy sets a quarterly cap on Fund performance, and thus limits the Fund’s performance for each quarterly roll period (ending February 28, May 31, August 31, and November 30.) Due to these caps, the Fund was not able to take full advantage of the strong GLD rally in 2024, and thus underperformed GLD.
FUND PERFORMANCE (January 20, 2021 to December 31, 2024)
The performance line graph below shows the performance of a hypothetical $10,000 initial investment in the Fund over a ten-year period (or for the life of the Fund, if shorter). The subsequent account value as of the end of the Period is listed next to the name of the Fund or index, as applicable. The performance table below shows the average annual total returns of the Fund for the past one-, five-, and ten-year periods, as applicable (or for the life of the Fund, if shorter), as of the end of the Period. Both the line graph and performance table compare the Fund’s performance to an appropriate broad-based index and may compare to additional indices reflecting the market segment(s) in which the Fund invests over the same periods.
Investment Performance of $10,000
| Average Annual Total Returns (as of December 31, 2024) | 1 Year | Since
Inception
(1/20/21) |
| FT Vest Gold Strategy Quarterly Buffer ETF | 21.87% | 6.34% |
| LBMA Gold Price | 25.53% | 9.01% |
| S&P 500® Index | 25.02% | 13.03% |
Visit www.ftportfolios.com/etf/BGLD for more recent performance information.
The Fund’s past performance is not a good predictor of the Fund’s future performance. The graph and table do not reflect the deduction of taxes that a shareholder would pay on Fund distributions or redemption of Fund shares.
KEY FUND STATISTICS (As of December 31, 2024)
| Fund net assets | $51,381,943 |
| Total number of portfolio holdings | 5 |
| Total advisory fee paid | $281,015 |
| Portfolio turnover rate | 0% |
WHAT DID THE FUND INVEST IN? (As of December 31, 2024)
The table below shows the investment makeup of the Fund, representing the percentage of net assets of the Fund.
| U.S. Treasury Bills | 94.8% |
| Money Market Funds | 0.5% |
| Purchased Options | 4.9% |
| Written Options | (0.3%) |
| Net Other Assets and Liabilities | 0.1% |
| Total | 100.0% |
HOW HAS THE FUND MATERIALLY CHANGED?
This is a summary of certain changes to the Fund since January 1, 2024. For more complete information, you may review the Fund’s prospectus and any applicable supplements at www.ftportfolios.com/fund-documents/etf/BGLD or upon request at 1-800-621-1675 or info@ftportfolios.com.
During the fiscal year ended December 31, 2024, the Fund’s predetermined upside cap on Underlying ETF returns was reset based upon prevailing market conditions at the start of each new Target Outcome Period.
WHERE CAN I FIND ADDITIONAL INFORMATION ABOUT THE FUND?
Visit www.ftportfolios.com/fund-documents/etf/BGLD to view additional information about the Fund such as the prospectus, financial information, Fund holdings and proxy voting information. You may also request this information by contacting us at 1-800-621-1675 or info@ftportfolios.com.
OTHER INFORMATION
The Fund is not sponsored, endorsed, sold or promoted by SPDR® Gold Trust and World Gold Trust Services, LLC, (together with their affiliates hereinafter referred to as the “Corporations”). The Corporations have not passed on the legality or suitability of, or the accuracy or adequacy of, descriptions and disclosures relating to the Fund or the FLEX Options. The Corporations make no representations or warranties, express or implied, regarding the advisability of investing in the Fund or the FLEX Options or results to be obtained by the Fund or the FLEX Options, shareholders or any other person or entity from use of the Underlying ETF. The Corporations have no liability in connection with the management, administration, marketing or trading of the Fund or the FLEX Options.
FT Vest Gold Strategy Target Income ETF®
IGLD | CBOE BZX EXCHANGE, INC.
ANNUAL SHAREHOLDER REPORT | December 31, 2024
This annual shareholder report contains important information about the FT Vest Gold Strategy Target Income ETF® (the “Fund”) for the year of January 1, 2024 to December 31, 2024 (the “Period”). You can find additional information about the Fund at www.ftportfolios.com/fund-documents/etf/IGLD. You can also request this information by contacting us at 1-800-621-1675 or info@ftportfolios.com.
WHAT WERE THE FUND COSTS FOR THE LAST YEAR?
(Based on a hypothetical $10,000 investment)
| Fund | Costs of a $10,000 investment | Costs paid as a percentage
of a $10,000 investment |
| FT Vest Gold Strategy Target Income ETF® | $93 | 0.85% |
HOW DID THE FUND PERFORM LAST YEAR? WHAT AFFECTED THE FUND’S PERFORMANCE?
The Fund returned 18.80% for the 12 months ended December 31, 2024. The Fund underperformed its benchmark, the S&P 500® Index, which returned 25.02% for the same Period.
This underperformance was due to the following:
| Fund Net Asset Value Performance Attributed to: | | |
| Equities/Synthetic equities on GLD | 26.66 | % |
| GLD Options (Short Calls) | -7.01 | % |
| Fees and expenses | -0.85 | % |
The Fund held securities with the economic equivalent to a long position (“Synthetic Long”) in SPDR® Gold Shares (“GLD”). In addition, the Fund sold (wrote) a varying amount of one-month at-the-money covered call options on GLD each month. The net effect of the Synthetic Long position in GLD and the sold options allows the Fund to participate in GLD rallies at a rate less than 100%. Due to the strong positive performance of GLD during 2024, the Fund was negatively impacted by this options strategy, which is generally expected to benefit the Fund’s portfolio most during gold market downturns.
FUND PERFORMANCE (March 2, 2021 to December 31, 2024)
The performance line graph below shows the performance of a hypothetical $10,000 initial investment in the Fund over a ten-year period (or for the life of the Fund, if shorter). The subsequent account value as of the end of the Period is listed next to the name of the Fund or index, as applicable. The performance table below shows the average annual total returns of the Fund for the past one-, five-, and ten-year periods, as applicable (or for the life of the Fund, if shorter), as of the end of the Period. Both the line graph and performance table compare the Fund’s performance to an appropriate broad-based index and may compare to additional indices reflecting the market segment(s) in which the Fund invests over the same periods.
Investment Performance of $10,000
| Average Annual Total Returns (as of December 31, 2024) | 1 Year | Since
Inception
(3/2/21) |
| FT Vest Gold Strategy Target Income ETF® | 18.80% | 7.41% |
| LBMA Gold Price | 25.53% | 11.42% |
| S&P 500® Index | 25.02% | 13.25% |
Visit www.ftportfolios.com/etf/IGLD for more recent performance information.
The Fund’s past performance is not a good predictor of the Fund’s future performance. The graph and table do not reflect the deduction of taxes that a shareholder would pay on Fund distributions or redemption of Fund shares.
The final determination of the source and tax status of all calendar year 2024 distributions, including any return of capital, will be made after the end of 2024 and will be provided on Form 1099-DIV.
KEY FUND STATISTICS (As of December 31, 2024)
| Fund net assets | $130,897,042 |
| Total number of portfolio holdings | 5 |
| Total advisory fee paid | $903,248 |
| Portfolio turnover rate | 0% |
WHAT DID THE FUND INVEST IN? (As of December 31, 2024)
The table below shows the investment makeup of the Fund, representing the percentage of net assets of the Fund.
| U.S. Treasury Bills | 145.3% |
| Money Market Funds | 2.4% |
| Purchased Options | 0.3% |
| Written Options | (46.7%) |
| Net Other Assets and Liabilities | (1.3%) |
| Total | 100.0% |
WHERE CAN I FIND ADDITIONAL INFORMATION ABOUT THE FUND?
Visit www.ftportfolios.com/fund-documents/etf/IGLD to view additional information about the Fund such as the prospectus, financial information, Fund holdings and proxy voting information. You may also request this information by contacting us at 1-800-621-1675 or info@ftportfolios.com.
OTHER INFORMATION
The Fund is not sponsored, endorsed, sold or promoted by SPDR® Gold Trust and World Gold Trust Services, LLC, (together with their affiliates hereinafter referred to as the “Corporations”). The Corporations have not passed on the legality or suitability of, or the accuracy or adequacy of, descriptions and disclosures relating to the Fund or the FLEX Options. The Corporations make no representations or warranties, express or implied, regarding the advisability of investing in the Fund or the FLEX Options or results to be obtained by the Fund or the FLEX Options, shareholders or any other person or entity from use of the Underlying ETF. The Corporations have no liability in connection with the management, administration, marketing or trading of the Fund or the FLEX Options.
First Trust WCM Developing
World Equity ETF
WCME | NYSE ARCA, INC.
ANNUAL SHAREHOLDER REPORT | December 31, 2024
This annual shareholder report contains important information about the First Trust WCM Developing World Equity ETF (the “Fund”) for the year of January 1, 2024 to December 31, 2024 (the “Period”). You can find additional information about the Fund at www.ftportfolios.com/fund-documents/etf/WCME. You can also request this information by contacting us at 1-800-621-1675 or info@ftportfolios.com.
This report describes changes to the Fund that occurred during the Period.
WHAT WERE THE FUND COSTS FOR THE LAST YEAR?
(Based on a hypothetical $10,000 investment)
| Fund | Costs of a $10,000 investment | Costs paid as a percentage
of a $10,000 investment |
| First Trust WCM Developing World Equity ETF | $101 | 1.01% |
Effective October 7, 2024, the Fund acquired all of the assets, subject to the liabilities, of WCM Developing World Equity Fund (the “Predecessor Fund”), an open-end investment management company. The Fund has assumed the accounting and performance history of the Predecessor Fund, which had an inception date of Mach 31, 2020. While the Predecessor Fund and Fund have investment policies and practices that are substantially similar, the Predecessor Fund’s past performance is not necessarily indicative of how the Fund will perform in the future. The Fund’s total returns would have been lower and the costs and advisory fees paid would have been higher if certain fees had not been waived and expenses reimbursed by the investment advisor of the Predecessor Fund.
HOW DID THE FUND PERFORM LAST YEAR? WHAT AFFECTED THE FUND’S PERFORMANCE?
The Fund returned 0.45% for the 12 months ended December 31, 2024. The Fund underperformed its benchmark, the MSCI Emerging Markets Index, which returned 7.50% for the same Period.
This underperformance was driven by an underweight position in Information Technology and an overweight in Health Care (from a sector allocation standpoint), as well as stock selection within the Health Care, Information Technology, and Consumer Discretionary sectors. Additionally, emerging markets have outperformed developed markets over the prior 12 months, which served as a headwind as the Fund is more heavily weighted towards developed markets versus the benchmark.
Contributors to Performance (selection and allocation):
From a sector standpoint, the picks in the Materials, Energy, and Financials sectors were additive on a selection effect basis. The underweight positions in the Materials, Consumer Staples, and Consumer Discretionary sectors were additive from an allocation perspective.
On a geographic basis, the picks in the Americas and Europe were additive from a selection effect angle. From an allocation perspective, overweight positions in Africa and the Middle East contributed positively to returns.
Detractors from Performance (selection and allocation):
Looking at sector-specific selection, the picks in the Information Technology, Health Care, and Consumer Discretionary sectors were detractors from performance. We saw some detraction to performance from an allocation effect standpoint from an underweight position in Information Technology, as well as the overweight positions in Health Care and Industrials.
The picks in Asia Pacific and Africa and the Middle East detracted from performance from a geographic selection effect angle. From an allocation standpoint, overweight positions in the Americas and Europe, as well as an underweight position in Asia Pacific, detracted from performance.
Stylistic Factors Impacting Performance (within the benchmark):
High Quality stocks (on a return on equity basis) outperformed Low Quality, which served as a tailwind.
Large Cap outperformed Small Cap, serving as a tailwind.
Emerging markets outperformed Developed markets, which served as a headwind as the Fund is more heavily weighted towards Developed markets versus the benchmark.
FUND PERFORMANCE (March 31, 2020 to December 31, 2024)
The performance line graph below shows the performance of a hypothetical $10,000 initial investment in the Fund over a ten-year period (or for the life of the Fund, if shorter). The subsequent account value as of the end of the Period is listed next to the name of the Fund or index, as applicable. The performance table below shows the average annual total returns of the Fund for the past one-, five-, and ten-year periods, as applicable (or for the life of the Fund, if shorter), as of the end of the Period. Both the line graph and performance table compare the Fund’s performance to an appropriate broad-based index and may compare to additional indices reflecting the market segment(s) in which the Fund invests over the same periods.
Investment Performance of $10,000
| Average Annual Total Returns (as of December 31, 2024) | 1 Year | Since
Inception
(3/31/20) |
| First Trust WCM Developing World Equity ETF | 0.45% | 7.51% |
| MSCI Emerging Markets Index | 7.50% | 7.72% |
Visit www.ftportfolios.com/etf/WCME for more recent performance information.
The Fund’s past performance is not a good predictor of the Fund’s future performance. The graph and table do not reflect the deduction of taxes that a shareholder would pay on Fund distributions or redemption of Fund shares. The Fund’s total returns would have been lower if certain fees had not been waived and expenses reimbursed by the investment advisor.
KEY FUND STATISTICS (As of December 31, 2024)
| Fund net assets | $2,323,210 |
| Total number of portfolio holdings | 32 |
| Total advisory fee paid | $0 |
| Portfolio turnover rate | 85% |
WHAT DID THE FUND INVEST IN? (As of December 31, 2024)
The tables below show the investment makeup of the Fund, representing the percentage of total investments of the Fund.
| Taiwan Semiconductor Manufacturing Co., Ltd. | 9.2% |
| United Overseas Bank Ltd. | 5.1% |
| HDFC Bank Ltd., ADR | 4.6% |
| TOTVS S.A. | 4.1% |
| Tencent Holdings Ltd. | 4.0% |
| Bid Corp., Ltd. | 3.9% |
| B3 S.A. - Brasil Bolsa Balcao | 3.8% |
| Nippon Paint Holdings Co., Ltd. | 3.8% |
| Grupo Aeroportuario del Pacifico S.A.B. de C.V., Class B | 3.5% |
| AstraZeneca PLC | 3.4% |
HOW HAS THE FUND MATERIALLY CHANGED?
This is a summary of certain changes to the Fund since its reorganization on October 7, 2024. For more complete information, you may review the Fund’s prospectus and any applicable supplements at www.ftportfolios.com/fund-documents/etf/WCME or upon request at 1-800-621-1675 or info@ftportfolios.com.
During the fiscal year ended December 31, 2024, the Fund added the ability to invest in equity securities of companies domiciled in China that list and trade directly on Chinese stock exchanges (“China A Shares”).
WHERE CAN I FIND ADDITIONAL INFORMATION ABOUT THE FUND?
Visit www.ftportfolios.com/fund-documents/etf/WCME to view additional information about the Fund such as the prospectus, financial information, Fund holdings and proxy voting information. You may also request this information by contacting us at 1-800-621-1675 or info@ftportfolios.com.
First Trust WCM International Equity ETF
WCMI | NYSE Arca, Inc.
ANNUAL SHAREHOLDER REPORT | December 31, 2024
This annual shareholder report contains important information about the First Trust WCM International Equity ETF (the “Fund”) for the year of January 1, 2024 to December 31, 2024 (the “Period”). You can find additional information about the Fund at www.ftportfolios.com/fund-documents/etf/WCMI. You can also request this information by contacting us at 1-800-621-1675 or info@ftportfolios.com.
This report describes changes to the Fund that occurred during the Period.
WHAT WERE THE FUND COSTS FOR THE LAST YEAR?
(Based on a hypothetical $10,000 investment)
| Fund | Costs of a $10,000 investment | Costs paid as a percentage
of a $10,000 investment |
| First Trust WCM International Equity ETF | $88 | 0.86% |
Effective October 7, 2024, the Fund acquired all of the assets, subject to the liabilities, of WCM International Equity Fund (the “Predecessor Fund”), an open-end investment management company. The Fund has assumed the accounting and performance history of the Predecessor Fund, which had an inception date of Mach 31, 2020. While the Predecessor Fund and Fund have investment policies and practices that are substantially similar, the Predecessor Fund’s past performance is not necessarily indicative of how the Fund will perform in the future. The Fund’s total returns would have been lower and the costs and advisory fees paid would have been higher if certain fees had not been waived and expenses reimbursed by the investment advisor of the Predecessor Fund.
HOW DID THE FUND PERFORM LAST YEAR? WHAT AFFECTED THE FUND’S PERFORMANCE?
The Fund returned 3.48% for the 12 months ended December 31, 2024. The Fund underperformed its benchmark, the MSCI ACWI ex-USA Index, which returned 5.53% for the same Period.
This underperformance was driven by an overweight position in Health Care and underweight position in Information Technology (from a sector allocation standpoint), as well as stock selection within the Health Care, Information Technology, and Communication Services sectors. Additionally, emerging markets outperformed developed markets over the prior 12 months, which served as a headwind as the Fund is more heavily weighted towards developed markets versus the benchmark.
Contributors to Performance (selection and allocation):
From a sector standpoint, positive selection effect was supported by picks in the Energy, Materials, and Consumer Staples sectors. An overweight position in the Financials sector, as well as underweight positions in the Consumer Staples and Materials sectors were also additive from an allocation perspective.
On a geographic basis, picks in Europe and the Americas were additive from a selection effect angle. From an allocation perspective, the portfolio positioning did not contribute positively to returns.
Detractors from Performance (selection and allocation):
Looking at sector-specific selection, picks in the Health Care, Information Technology, and Communication Services sectors were the largest detractors from performance. Detractors from an allocation standpoint came from an overweight position in the Health Care sector, as well as an underweight positions in the Information Technology and Communication Services sectors.
The picks in Asia Pacific detracted from the Fund’s performance from a geographic selection effect angle. From an allocation standpoint, underweight positions in Asia Pacific and Africa and the Middle East, as well overweight positions in the Americas and Europe, detracted from performance.
Stylistic Factors Impacting Performance (within the benchmark):
High Quality stocks (on a return on equity basis) outperformed Low Quality, which served as a tailwind.
Large Cap outperformed Small Cap, serving as a tailwind.
Emerging markets outperformed developed markets, which served as a headwind as the Fund is more heavily weighted towards Developed markets versus the benchmark.
FUND PERFORMANCE (March 31, 2020 to December 31, 2024)
The performance line graph below shows the performance of a hypothetical $10,000 initial investment in the Fund over a ten-year period (or for the life of the Fund, if shorter). The subsequent account value as of the end of the Period is listed next to the name of the Fund or index, as applicable. The performance table below shows the average annual total returns of the Fund for the past one-, five-, and ten-year periods, as applicable (or for the life of the Fund, if shorter), as of the end of the Period. Both the line graph and performance table compare the Fund’s performance to an appropriate broad-based index and may compare to additional indices reflecting the market segment(s) in which the Fund invests over the same periods.
Investment Performance of $10,000
| Average Annual Total Returns (as of December 31, 2024) | 1 Year | Since
Inception
(3/31/20) |
| First Trust WCM International Equity ETF | 3.48% | 10.91% |
| MSCI ACWI ex-USA Index | 5.53% | 10.33% |
Visit www.ftportfolios.com/etf/WCMI for more recent performance information.
The Fund’s past performance is not a good predictor of the Fund’s future performance. The graph and table do not reflect the deduction of taxes that a shareholder would pay on Fund distributions or redemption of Fund shares. The Fund’s total returns would have been lower if certain fees had not been waived and expenses reimbursed by the investment advisor.
KEY FUND STATISTICS (As of December 31, 2024)
| Fund net assets | $54,400,256 |
| Total number of portfolio holdings | 37 |
| Total advisory fee paid | $268,231 |
| Portfolio turnover rate | 65% |
WHAT DID THE FUND INVEST IN? (As of December 31, 2024)
The tables below show the investment makeup of the Fund, representing the percentage of total investments of the Fund.
| AstraZeneca PLC, ADR | 4.9% |
| United Overseas Bank Ltd. | 4.9% |
| Wise PLC, Class A | 4.2% |
| Persimmon PLC | 4.0% |
| Canadian National Railway Co. | 3.8% |
| HDFC Bank Ltd., ADR | 3.4% |
| Taiwan Semiconductor Manufacturing Co., Ltd. | 3.3% |
| Haleon PLC | 3.3% |
| London Stock Exchange Group PLC | 3.2% |
| Spirax Group PLC | 3.2% |
HOW HAS THE FUND MATERIALLY CHANGED?
This is a summary of certain changes to the Fund since its reorganization October 7, 2024. For more complete information, you may review the Fund’s prospectus and any applicable supplements at www.ftportfolios.com/fund-documents/etf/WCMI or upon request at 1-800-621-1675 or info@ftportfolios.com.
During the fiscal year ended December 31, 2024, the Fund added the ability to invest in equity securities of companies domiciled in China that list and trade directly on Chinese stock exchanges (“China A Shares”).
WHERE CAN I FIND ADDITIONAL INFORMATION ABOUT THE FUND?
Visit www.ftportfolios.com/fund-documents/etf/WCMI to view additional information about the Fund such as the prospectus, financial information, Fund holdings and proxy voting information. You may also request this information by contacting us at 1-800-621-1675 or info@ftportfolios.com.
| (b) | Not applicable to the Registrant. |
Item 2. Code of Ethics.
| (a) | The First Trust Exchange-Traded Fund (“Registrant”), as of the end of the period covered by this report, has adopted a code of ethics that applies to the Registrant’s principal executive officer, principal financial officer, principal accounting officer or controller, or persons performing similar functions, regardless of whether these individuals are employed by the Registrant or a third party. |
| (c) | There have been no amendments, during the period covered by this report, to a provision of the code of ethics that applies to the Registrant's principal executive officer, principal financial officer, principal accounting officer or controller, or persons performing similar functions, regardless of whether these individuals are employed by the Registrant or a third party, and that relates to any element of the code of ethics description. |
| (d) | The Registrant, during the period covered by this report, has not granted any waivers, including an implicit waiver, from a provision of the code of ethics that applies to the Registrant’s principal executive officer, principal financial officer, principal accounting officer or controller, or persons performing similar functions, regardless of whether these individuals are employed by the Registrant or a third party, that relates to one or more of the items set forth in paragraph (b) of this item’s instructions. |
| (f) | A copy of the code of ethics that applies to the Registrant’s principal executive officer, principal financial officer, principal accounting officer or controller is filed as an exhibit pursuant to Item 13(a)(1). |
Item 3. Audit Committee Financial Expert.
As of the end of the period covered by the report, the Registrant’s Board of Trustees has determined that Thomas R. Kadlec and Robert F. Keith are qualified to serve as audit committee financial experts serving on its audit committee and that each of them is “independent,” as defined by Item 3 of Form N-CSR.
Item 4. Principal Accountant Fees and Services.
| (a) | Audit Fees (Registrant) -- The aggregate fees billed for professional services rendered by the principal accountant for the audit of the Registrant’s annual financial statements or services that are normally provided by the accountant in connection with statutory and regulatory filings or engagements were $459,000 for the fiscal year ended 2023 and $514,000 for the fiscal year ended 2024. |
| (b) | Audit-Related Fees (Registrant) -- The aggregate fees billed for assurance and related services by the principal accountant that are reasonably related to the performance of the audit of the Registrant’s financial statements and are not reported under paragraph (a) of this Item were $0 for the fiscal year ended 2023 and $0 for the fiscal year ended 2024. |
Audit-Related Fees (Investment Advisor) -- The aggregate fees billed for assurance and related services by the principal accountant that are reasonably related to the performance of the audit of the Registrant’s financial statements and are not reported under paragraph (a) of this Item were $0 for the fiscal year ended 2023 and $0 for the fiscal year ended 2024.
Audit-Related Fees (Distributor) -- The aggregate fees billed for assurance and related services by the principal accountant that are reasonably related to the performance of the audit of the Registrant’s financial statements and are not reported under paragraph (a) of this Item were $0 for the fiscal year ended 2023 and $0 for the fiscal year ended 2024.
| (c) | Tax Fees (Registrant) -- The aggregate fees billed for professional services rendered by the principal accountant for tax return review and debt instrument tax analysis and reporting were $310,870 for the fiscal year ended 2023 and $224,824 for the fiscal year ended 2024. |
Tax Fees (Investment Advisor) -- The aggregate fees billed for professional services rendered by the principal accountant for tax compliance, tax advice, and tax planning to the Registrant’s advisor and distributor were $0 for the fiscal year ended 2023 and $0 for the fiscal year ended 2024.
Tax Fees (Distributor) -- The aggregate fees billed for professional services rendered by the principal accountant for tax compliance, tax advice, and tax planning to the Registrant’s distributor were $0 for the fiscal year ended 2023 and $0 for the fiscal year ended 2024.
These fees were for tax consultation and/or tax return preparation and professional services rendered for PFIC (Passive Foreign Investment Company) Identification Services.
| (d) | All Other Fees (Registrant) -- The aggregate fees billed for products and services provided by the principal accountant to the Registrant, other than the services reported in paragraphs (a) through (c) of this Item were $0 for the fiscal year ended 2023 and $0 for the fiscal year ended 2024. |
All Other Fees (Investment Advisor) -- The aggregate fees billed for products and services provided by the principal accountant to the Registrant’s investment advisor, other than the services reported in paragraphs (a) through (c) of this Item were $0 for the fiscal year ended 2023 and $0 for the fiscal year ended 2024.
All Other Fees (Distributor) -- The aggregate fees billed for products and services provided by the principal accountant to the Registrant’s distributor, other than the services reported in paragraphs (a) through (c) of this Item were $0 for the fiscal year ended 2023 and $0 for the fiscal year ended 2024.
(e)(1) Disclose the audit committee’s pre-approval policies and procedures described in paragraph (c) (7) of Rule 2-01 of Regulation S-X.
Pursuant to its charter and its Audit and Non-Audit Services Pre-Approval Policy, the Audit Committee (the “Committee”) is responsible for the pre-approval of all audit services and permitted non-audit services (including the fees and terms thereof) to be performed for the Registrant by its independent auditors. The Chairman of the Committee is authorized to give such pre-approvals on behalf of the Committee up to $25,000 and report any such pre-approval to the full Committee.
The Committee is also responsible for the pre-approval of the independent auditor’s engagements for non-audit services with the Registrant’s advisor (not including a sub-advisor whose role is primarily portfolio management and is sub-contracted or overseen by another investment advisor) and any entity controlling, controlled by or under common control with the investment advisor that provides ongoing services to the Registrant, if the engagement relates directly to the operations and financial reporting of the Registrant, subject to the de minimis exceptions for non-audit services described in Rule 2-01 of Regulation S-X. If the independent auditor has provided non-audit services to the Registrant’s advisor (other than any sub-advisor whose role is primarily portfolio management and is sub-contracted with or overseen by another investment advisor) and any entity controlling, controlled by or under common control with the investment advisor that provides ongoing services to the Registrant that were not pre-approved pursuant to its policies, the Committee will consider whether the provision of such non-audit services is compatible with the auditor’s independence.
(e)(2) The percentage of services described in each of paragraphs (b) through (d) for the Registrant and the Registrant’s investment advisor and distributor of this Item that were approved by the audit committee pursuant to the pre-approval exceptions included in paragraph (c)(7)(i)(C) or paragraph(C)(7)(ii) of Rule 2-01 of Regulation S-X are as follows:
| Registrant: | | Advisor and Distributor: |
| (b) 0% | | (b) 0% |
| (c) 0% | | (c) 0% |
| (d) 0% | | (d) 0% |
| (f) | The percentage of hours expended on the principal accountant’s engagement to audit the Registrant’s financial statements for the most recent fiscal year that were attributed to work performed by persons other than the principal accountant’s full-time, permanent employees was less than fifty percent. |
| (g) | The aggregate non-audit fees billed by the Registrant’s accountant for services rendered to the Registrant, and rendered to the Registrant’s investment advisor (not including any sub-advisor whose role is primarily portfolio management and is subcontracted with or overseen by another investment advisor), and any entity controlling, controlled by, or under common control with the advisor that provides ongoing services to the Registrant for the fiscal year ended 2023 were $310,870 for the Registrant, $44,000 for the Registrant’s investment advisor and $60,500 for the Registrant’s distributor; and for the fiscal year ended 2024 were $224,824 for the Registrant, $28,080 for the Registrant’s investment advisor and $32,400 for the Registrant’s distributor. |
| (h) | The Registrant’s audit committee of its Board of Trustees has determined that the provision of non-audit services that were rendered to the Registrant’s investment advisor (not including any sub-advisor whose role is primarily portfolio management and is subcontracted with or overseen by another investment advisor), and any entity controlling, controlled by, or under common control with the investment advisor that provides ongoing services to the Registrant that were not pre-approved pursuant to paragraph (c)(7)(ii) of Rule 2-01 of Regulation S-X is compatible with maintaining the principal accountant’s independence. |
(i) Not applicable to the Registrant.
(j) Not applicable to the Registrant.
Item 5. Audit Committee of Listed Registrants.
| (a) | The Registrant has a separately designated standing audit committee established in accordance with Section 3(a)(58)(A) of the Securities Exchange Act of 1934 consisting of all the independent directors of the Registrant. The audit committee of the Registrant is comprised of: Richard E. Erickson, Thomas R. Kadlec, Denise M. Keefe, Robert F. Keith, Niel B. Nielson and Bronwyn Wright. |
| (b) | Not applicable to the Registrant. |
Item 6. Investments.
| (a) | The Schedule of Investments in securities of unaffiliated issuers as of the close of the reporting period is included in the Financial Statements and Other Information filed under Item 7(a) of this Form N-CSR. |
| (b) | Not applicable to the Registrant. |
Item 7. Financial Statements and Financial Highlights for Open-End Management Investment Companies.
(a) Following is a copy of the annual financial statements required, and for the periods specified, by Regulation S-X.
Annual Financial
Statements and
Other Information |
For the Year Ended
December 31, 2024 |
First Trust Exchange-Traded Fund
First Trust Dow Jones Select MicroCap Index Fund (FDM) |
First Trust Morningstar Dividend Leaders Index Fund (FDL) |
First Trust US Equity Opportunities ETF (FPX) |
First Trust NYSE® Arca® Biotechnology Index Fund (FBT) |
First Trust Dow Jones Internet Index Fund (FDN) |
First Trust Capital Strength® ETF (FTCS) |
First Trust Value Line® Dividend Index Fund (FVD) |
First Trust Growth StrengthTM ETF (FTGS) |
First Trust Indxx Aerospace & Defense ETF (MISL) |
First Trust Bloomberg Inflation Sensitive Equity ETF (FTIF) |
First Trust Exchange-Traded Fund
Annual Financial Statements and Other Information
December 31, 2024
Performance and Risk Disclosure
There is no assurance that any series of First Trust Exchange-Traded Fund (the “Trust”) described in this report (each such series is referred to as a “Fund” and collectively, as the “Funds”) will achieve its investment objective. Each Fund is subject to market risk, which is the possibility that the market values of securities owned by the Fund will decline and that the value of the Fund’s shares may therefore be less than what you paid for them. Accordingly, you can lose money by investing in a Fund.
Performance data quoted represents past performance, which is no guarantee of future results, and current performance may be lower or higher than the figures shown. For the most recent month-end performance figures, please visit www.ftportfolios.com or speak with your financial advisor. Investment returns, net asset value and share price will fluctuate and Fund shares, when sold, may be worth more or less than their original cost.
First Trust Advisors L.P., the Funds’ advisor, may also periodically provide additional information on Fund performance on each Fund’s webpage at www.ftportfolios.com.
This report contains information that may help you evaluate your investment. It includes details about each Fund and presents data that provides insight into each Fund’s performance and investment approach.
The material risks of investing in each Fund are spelled out in its prospectus, statement of additional information, and other Fund regulatory filings.
First Trust Dow Jones Select MicroCap Index Fund (FDM)Portfolio of InvestmentsDecember 31, 2024
| | |
|
| Aerospace & Defense — 0.9% | |
| National Presto Industries, Inc. | |
| | |
| | |
| | |
| | |
| Capital City Bank Group, Inc. | |
| Central Pacific Financial Corp. | |
| Esquire Financial Holdings, Inc. | |
| Farmers & Merchants Bancorp, Inc. | |
| Financial Institutions, Inc. | |
| | |
| | |
| Metropolitan Bank Holding Corp. (a) | |
| | |
| MidWestOne Financial Group, Inc. | |
| | |
| Northeast Community Bancorp, Inc. | |
| | |
| Penns Woods Bancorp, Inc. | |
| Peoples Bancorp of North Carolina, Inc. | |
| | |
| | |
| Southern Missouri Bancorp, Inc. | |
| | |
| | |
| Entrada Therapeutics, Inc. (a) | |
| | |
| Diamond Hill Investment Group, Inc. | |
| | |
| Oppenheimer Holdings, Inc., Class A | |
| | |
| | |
| | |
| | |
| | |
| | |
| | |
| Aris Water Solutions, Inc., Class A | |
| | |
|
| Commercial Services & Supplies (Continued) | |
| Liquidity Services, Inc. (a) | |
| | |
| | |
| | |
| | |
| Construction & Engineering | |
| Concrete Pumping Holdings, Inc. (a) | |
| Great Lakes Dredge & Dock Corp. (a) | |
| Limbach Holdings, Inc. (a) | |
| | |
| | |
| | |
| EZCORP, Inc., Class A (a) | |
| Regional Management Corp. | |
| World Acceptance Corp. (a) | |
| | |
| Consumer Staples Distribution | |
| Natural Grocers by Vitamin Cottage, Inc. | |
| | |
| Village Super Market, Inc., Class A | |
| | |
| Diversified Consumer Services | |
| | |
| Lincoln Educational Services Corp. (a) | |
| | |
| Electrical Equipment — 2.2% | |
| | |
| | |
| Preformed Line Products Co. | |
| | |
| Electronic Equipment, Instruments & Components | |
| Climb Global Solutions, Inc. | |
| | |
| Frequency Electronics, Inc. | |
| Kimball Electronics, Inc. (a) | |
| Vishay Precision Group, Inc. (a) | |
| | |
See Notes to Financial Statements
First Trust Dow Jones Select MicroCap Index Fund (FDM)Portfolio of Investments (Continued)December 31, 2024 | | |
COMMON STOCKS (Continued) |
| Energy Equipment & Services | |
| Energy Services of America Corp. | |
| Natural Gas Services Group, Inc. (a) | |
| Solaris Energy Infrastructure, Inc. | |
| TETRA Technologies, Inc. (a) | |
| | |
| | |
| Vivid Seats, Inc., Class A (a) (b) | |
| Financial Services — 3.1% | |
| Acacia Research Corp. (a) | |
| International Money Express, Inc. (a) | |
| | |
| | |
| | |
| | |
| | |
| Seneca Foods Corp., Class A (a) | |
| | |
| | |
| Kewaunee Scientific Corp. (a) | |
| Tactile Systems Technology, Inc. (a) | |
| | |
| | |
| Cross Country Healthcare, Inc. (a) | |
| | |
| Viemed Healthcare, Inc. (a) | |
| | |
| Hotels, Restaurants & Leisure | |
| BJ’s Restaurants, Inc. (a) | |
| El Pollo Loco Holdings, Inc. (a) | |
| Portillo’s, Inc., Class A (a) (b) | |
| | |
| Household Durables — 3.3% | |
| | |
| Ethan Allen Interiors, Inc. | |
| Flexsteel Industries, Inc. | |
| Hamilton Beach Brands Holding Co., Class A | |
| | |
| | |
|
| Household Durables (Continued) | |
| | |
| Smith Douglas Homes Corp. (a) | |
| | |
| Household Products — 1.5% | |
| Central Garden & Pet Co. (a) (b) | |
| | |
| | |
| | |
| American Coastal Insurance Corp. (a) | |
| Greenlight Capital Re Ltd., Class A (a) | |
| Heritage Insurance Holdings, Inc. (a) | |
| | |
| James River Group Holdings Ltd. | |
| | |
| Universal Insurance Holdings, Inc. | |
| | |
| Interactive Media & Services | |
| | |
| | |
| | |
| Hackett Group (The), Inc. | |
| | |
| | |
| MasterCraft Boat Holdings, Inc. (a) | |
| Smith & Wesson Brands, Inc. | |
| | |
| | |
| | |
| | |
| | |
| | |
| L.B. Foster Co., Class A (a) | |
| | |
| | |
| | |
| | |
| | |
| | |
| Universal Stainless & Alloy Products, Inc. (a) | |
See Notes to Financial Statements
First Trust Dow Jones Select MicroCap Index Fund (FDM)Portfolio of Investments (Continued)December 31, 2024 | | |
COMMON STOCKS (Continued) |
| | |
| AG Mortgage Investment Trust, Inc. | |
| Oil, Gas & Consumable Fuels | |
| | |
| Centrus Energy Corp., Class A (a) (b) | |
| Excelerate Energy, Inc., Class A | |
| | |
| | |
| Riley Exploration Permian, Inc. | |
| | |
| | |
| | |
| | |
| | |
| Passenger Airlines — 1.0% | |
| Sun Country Airlines Holdings, Inc. (a) | |
| | |
| Nature’s Sunshine Products, Inc. (a) | |
| | |
| | |
| | |
| | |
| Professional Services — 3.0% | |
| | |
| Kelly Services, Inc., Class A | |
| | |
| | |
| | |
| | |
| RMR Group (The), Inc., Class A | |
| Semiconductors & Semiconductor Equipment | |
| | |
| | |
| Consensus Cloud Solutions, Inc. (a) | |
| Logility Supply Chain Solutions, Inc. | |
| | |
| | |
| | |
| | |
|
| Specialty Retail (Continued) | |
| Haverty Furniture Cos., Inc. | |
| | |
| | |
| Technology Hardware, Storage | |
| CompoSecure, Inc., Class A (b) | |
| | |
| | |
| | |
| Textiles, Apparel & Luxury | |
| Lakeland Industries, Inc. | |
| | |
| | |
| Superior Group of Cos., Inc. | |
| | |
| | |
| Turning Point Brands, Inc. | |
| | |
| | |
| Willis Lease Finance Corp. | |
| | |
| | |
| Artesian Resources Corp., Class A | |
| Consolidated Water Co., Ltd. | |
| | |
| | |
| | |
MONEY MARKET FUNDS — 0.1% |
| Dreyfus Government Cash Management Fund, Institutional Shares - 4.36% (c) | |
| | |
See Notes to Financial Statements
First Trust Dow Jones Select MicroCap Index Fund (FDM)Portfolio of Investments (Continued)December 31, 2024 | | |
REPURCHASE AGREEMENTS — 3.0% |
| Mizuho Financial Group, Inc., 4.45% (c), dated 12/31/24, due 01/02/25, with a maturity value of $2,707,797. Collateralized by U.S. Treasury Securities, interest rates of 0.63% to 5.00%, due 10/31/25 to 06/30/30. The value of the collateral including accrued interest is $2,761,272. (d) | |
| RBC Dominion Securities, Inc., 4.50% (c), dated 12/31/24, due 01/02/25, with a maturity value of $2,601,302. Collateralized by U.S. Treasury Securities, interest rates of 0.00% to 4.88%, due 11/30/25 to 11/15/54. The value of the collateral including accrued interest is $2,652,665. (d) | |
| Total Repurchase Agreements | |
| | |
|
|
| Total Investments — 103.0% | |
| | |
| Net Other Assets and Liabilities — (3.0)% | |
| | |
| Non-income producing security. |
| All or a portion of this security is on loan (see Note 2D - Securities Lending in the Notes to Financial Statements). The remaining contractual maturity of all of the securities lending transactions is overnight and continuous. The aggregate value of such securities is $5,112,056 and the total value of the collateral held by the Fund, including for securities sold and pending settlement, is $5,307,780. |
| Rate shown reflects yield as of December 31, 2024. |
| This security serves as collateral for securities on loan. |
Abbreviations throughout the Portfolio of Investments: |
| – Real Estate Investment Trusts |
Valuation InputsA summary of the inputs used to value the Fund’s investments as of December 31, 2024 is as follows (see Note 2A - Portfolio Valuation in the Notes to Financial Statements):
| | | Level 2
Significant
Observable
Inputs | Level 3
Significant
Unobservable
Inputs |
| | | | |
| | | | |
| | | | |
| | | | |
| See Portfolio of Investments for industry breakout. |
Offsetting Assets and Liabilities
Offsetting assets and liabilities requires entities to disclose both gross and net information about instruments and transactions eligible for offset, and to disclose instruments and transactions subject to master netting or similar agreements (see Note 2C - Offsetting on the Statements of Assets and Liabilities in the Notes to Financial Statements).
The Fund’s loaned securities were all subject to an enforceable Securities Lending Agency Agreement. Securities lent in accordance with the Securities Lending Agency Agreement on a gross basis were as follows:
Securities Lending Agency Agreement |
Total gross amount presented on the Statements of Assets and Liabilities(1) | |
| |
| |
| The amount presented on the Statements of Assets and Liabilities, which is included in “Investments, at value,” is not offset and is shown on a gross basis. |
| At December 31, 2024, the value of the collateral received from each borrower exceeded the value of the related securities loaned. This amount is disclosed on the Portfolio of Investments. |
See Notes to Financial Statements
First Trust Dow Jones Select MicroCap Index Fund (FDM)Portfolio of Investments (Continued)December 31, 2024 The Fund’s investments in repurchase agreements were all subject to an enforceable Master Repurchase Agreement. Repurchase Agreements on a gross basis were as follows:
|
Total gross amount presented on the Statements of Assets and Liabilities(3) | |
| |
| |
| The amount is included in “Investments, at value” on the Statements of Assets and Liabilities. |
| At December 31, 2024, the value of the collateral received from each seller exceeded the value of the repurchase agreements. |
See Notes to Financial Statements
First Trust Morningstar Dividend Leaders Index Fund (FDL)Portfolio of InvestmentsDecember 31, 2024
| | |
|
| Air Freight & Logistics — | |
| United Parcel Service, Inc., Class B | |
| | |
| | |
| | |
| | |
| | |
| | |
| Citizens Financial Group, Inc. | |
| Columbia Banking System, Inc. | |
| | |
| | |
| | |
| | |
| First Interstate BancSystem, Inc., Class A | |
| Huntington Bancshares, Inc. | |
| | |
| PNC Financial Services Group (The), Inc. | |
| | |
| | |
| | |
| | |
| | |
| | |
| | |
| | |
| | |
| | |
| | |
| | |
| | |
| Artisan Partners Asset Management, Inc., Class A | |
| | |
| | |
| Janus Henderson Group PLC | |
| | |
| T. Rowe Price Group, Inc. | |
| | |
| | |
| | |
| | |
| LyondellBasell Industries N.V., Class A | |
| Scotts Miracle-Gro (The) Co. | |
| | |
| | |
|
| | |
| | |
| Diversified Telecommunication | |
| Verizon Communications, Inc. | |
| Electric Utilities — 10.7% | |
| | |
| | |
| American Electric Power Co., Inc. | |
| | |
| | |
| | |
| | |
| | |
| | |
| | |
| | |
| Pinnacle West Capital Corp. | |
| Portland General Electric Co. | |
| | |
| | |
| | |
| Financial Services — 0.2% | |
| | |
| | |
| | |
| | |
| | |
| | |
| | |
| | |
| | |
| New Jersey Resources Corp. | |
| | |
| | |
| | |
| | |
| | |
| | |
| Hotels, Restaurants & Leisure | |
| | |
| | |
| | |
| | |
| Household Durables — 0.3% | |
| | |
See Notes to Financial Statements
First Trust Morningstar Dividend Leaders Index Fund (FDL)Portfolio of Investments (Continued)December 31, 2024 | | |
COMMON STOCKS (Continued) |
| Household Products — 1.7% | |
| | |
| | |
| | |
| | |
| Fidelity National Financial, Inc. | |
| First American Financial Corp. | |
| | |
| Prudential Financial, Inc. | |
| | |
| | |
| International Business Machines Corp. | |
| | |
| | |
| | |
| | |
| Stanley Black & Decker, Inc. | |
| | |
| | |
| Interpublic Group of (The) Cos., Inc. | |
| Nexstar Media Group, Inc. | |
| | |
| | |
| | |
| | |
| | |
| | |
| Northwestern Energy Group, Inc. | |
| | |
| | |
| Oil, Gas & Consumable Fuels | |
| | |
| | |
| | |
| | |
| | |
| | |
| | |
| | |
| | |
| Professional Services — 0.1% | |
| | |
| | |
| | |
| | |
|
| | |
| | |
| Philip Morris International, Inc. | |
| | |
| | |
| MSC Industrial Direct Co., Inc., Class A | |
| | |
| | |
MONEY MARKET FUNDS — 0.2% |
| Dreyfus Government Cash Management Fund, Institutional Shares - 4.36% (a) | |
| | |
|
|
| Total Investments — 99.8% | |
| | |
| Net Other Assets and Liabilities — 0.2% | |
| | |
| Rate shown reflects yield as of December 31, 2024. |
Valuation InputsA summary of the inputs used to value the Fund’s investments as of December 31, 2024 is as follows (see Note 2A - Portfolio Valuation in the Notes to Financial Statements):
| | | Level 2
Significant
Observable
Inputs | Level 3
Significant
Unobservable
Inputs |
| | | | |
| | | | |
| | | | |
| See Portfolio of Investments for industry breakout. |
See Notes to Financial Statements
First Trust US Equity Opportunities ETF (FPX)Portfolio of InvestmentsDecember 31, 2024
| | |
|
| Aerospace & Defense — 1.2% | |
| | |
| | |
| | |
| | |
| | |
| | |
| Rivian Automotive, Inc., Class A (a) (b) | |
| | |
| | |
| | |
| Vita Coco (The) Co., Inc. (a) | |
| | |
| | |
| Janux Therapeutics, Inc. (a) | |
| Krystal Biotech, Inc. (a) | |
| Kymera Therapeutics, Inc. (a) | |
| Nuvalent, Inc., Class A (a) | |
| REVOLUTION Medicines, Inc. (a) | |
| United Therapeutics Corp. (a) | |
| | |
| | |
| | |
| | |
| | |
| | |
| | |
| | |
| | |
| Coinbase Global, Inc., Class A (a) | |
| Robinhood Markets, Inc., Class A (a) | |
| StepStone Group, Inc., Class A | |
| | |
| | |
| | |
| ACV Auctions, Inc., Class A (a) | |
| | |
| | |
| | |
| Lumentum Holdings, Inc. (a) | |
| | |
|
| Construction & Engineering | |
| Everus Construction Group, Inc. (a) | |
| | |
| | |
| | |
| SoFi Technologies, Inc. (a) | |
| Consumer Staples Distribution | |
| | |
| Diversified Consumer Services | |
| | |
| Diversified Telecommunication | |
| AST SpaceMobile, Inc. (a) (b) | |
| Electric Utilities — 4.5% | |
| Constellation Energy Corp. | |
| | |
| | |
| Electrical Equipment — 5.3% | |
| | |
| Vertiv Holdings Co., Class A | |
| | |
| Electronic Equipment, Instruments & Components | |
| | |
| | |
| | |
| Energy Equipment & Services | |
| | |
| Kodiak Gas Services, Inc. | |
| | |
| | |
| Liberty Media Corp.-Liberty Formula One, Class C (a) | |
| Liberty Media Corp.-Liberty Live, Class C (a) | |
| ROBLOX Corp., Class A (a) | |
| Warner Bros. Discovery, Inc. (a) | |
| | |
| Financial Services — 6.0% | |
| | |
| Corebridge Financial, Inc. | |
| | |
| Jackson Financial, Inc., Class A | |
| Mr. Cooper Group, Inc. (a) | |
See Notes to Financial Statements
First Trust US Equity Opportunities ETF (FPX)Portfolio of Investments (Continued)December 31, 2024 | | |
COMMON STOCKS (Continued) |
| Financial Services (Continued) | |
| Shift4 Payments, Inc., Class A (a) | |
| | |
| | |
| | |
| GE HealthCare Technologies, Inc. | |
| | |
| PROCEPT BioRobotics Corp. (a) | |
| | |
| | |
| | |
| BrightSpring Health Services, Inc. (a) | |
| | |
| Tenet Healthcare Corp. (a) | |
| | |
| | |
| American Healthcare REIT, Inc. | |
| | |
| Doximity, Inc., Class A (a) | |
| Waystar Holding Corp. (a) | |
| | |
| Hotels, Restaurants & Leisure | |
| DoorDash, Inc., Class A (a) | |
| Dutch Bros, Inc., Class A (a) | |
| Life Time Group Holdings, Inc. (a) | |
| Sweetgreen, Inc., Class A (a) | |
| | |
| | |
| Fidelity National Financial, Inc. | |
| Ryan Specialty Holdings, Inc. | |
| | |
| Interactive Media & Services | |
| | |
| Reddit, Inc., Class A (a) | |
| | |
| | |
| Kyndryl Holdings, Inc. (a) | |
| Snowflake, Inc., Class A (a) | |
| | |
| | |
|
| | |
| Atmus Filtration Technologies, Inc. | |
| | |
| | |
| | |
| Oil, Gas & Consumable Fuels | |
| | |
| | |
| | |
| | |
| Paper & Forest Products — | |
| | |
| | |
| | |
| | |
| Ligand Pharmaceuticals, Inc. (a) | |
| Professional Services — 0.9% | |
| First Advantage Corp. (a) | |
| | |
| UL Solutions, Inc., Class A | |
| | |
| | |
| Compass Inc., Class A (a) | |
| Jones Lang LaSalle, Inc. (a) | |
| | |
| | |
| Phillips Edison & Co., Inc. | |
| Semiconductors & Semiconductor Equipment | |
| | |
| Credo Technology Group Holding Ltd. (a) | |
| | |
| | |
| AppLovin Corp., Class A (a) | |
| Clearwater Analytics Holdings, Inc., Class A (a) | |
| CrowdStrike Holdings, Inc., Class A (a) | |
| | |
| Klaviyo, Inc., Class A (a) | |
| | |
| Palantir Technologies, Inc., Class A (a) | |
| Procore Technologies, Inc. (a) | |
See Notes to Financial Statements
First Trust US Equity Opportunities ETF (FPX)Portfolio of Investments (Continued)December 31, 2024 | | |
COMMON STOCKS (Continued) |
| | |
| Rubrik, Inc., Class A (a) | |
| Samsara, Inc., Class A (a) | |
| ServiceTitan, Inc., Class A (a) | |
| Vertex, Inc., Class A (a) | |
| | |
| | |
| Victoria’s Secret & Co. (a) | |
| | |
| | |
MONEY MARKET FUNDS — 0.1% |
| Dreyfus Government Cash Management Fund, Institutional Shares - 4.36% (c) | |
| | |
| | |
REPURCHASE AGREEMENTS — 0.8% |
| Mizuho Financial Group, Inc., 4.45% (c), dated 12/31/24, due 01/02/25, with a maturity value of $3,322,592. Collateralized by U.S. Treasury Securities, interest rates of 0.63% to 5.00%, due 10/31/25 to 06/30/30. The value of the collateral including accrued interest is $3,388,208. (d) | |
| RBC Dominion Securities, Inc., 4.50% (c), dated 12/31/24, due 01/02/25, with a maturity value of $3,192,269. Collateralized by U.S. Treasury Securities, interest rates of 0.00% to 4.88%, due 11/30/25 to 11/15/54. The value of the collateral including accrued interest is $3,255,301. (d) | |
| Total Repurchase Agreements | |
| | |
|
|
| Total Investments — 100.8% | |
| | |
| Net Other Assets and Liabilities — (0.8)% | |
| | |
| Non-income producing security. |
| All or a portion of this security is on loan (see Note 2D - Securities Lending in the Notes to Financial Statements). The remaining contractual maturity of all of the securities lending transactions is overnight and continuous. The aggregate value of such securities is $6,189,176 and the total value of the collateral held by the Fund, including for securities sold and pending settlement, is $6,513,242. |
| Rate shown reflects yield as of December 31, 2024. |
| This security serves as collateral for securities on loan. |
Abbreviations throughout the Portfolio of Investments: |
| – Real Estate Investment Trusts |
Valuation InputsA summary of the inputs used to value the Fund’s investments as of December 31, 2024 is as follows (see Note 2A - Portfolio Valuation in the Notes to Financial Statements):
| | | Level 2
Significant
Observable
Inputs | Level 3
Significant
Unobservable
Inputs |
| | | | |
| | | | |
| | | | |
| | | | |
| See Portfolio of Investments for industry breakout. |
Offsetting Assets and Liabilities
Offsetting assets and liabilities requires entities to disclose both gross and net information about instruments and transactions eligible for offset, and to disclose instruments and transactions subject to master netting or similar agreements (see Note 2C - Offsetting on the Statements of Assets and Liabilities in the Notes to Financial Statements).
The Fund’s loaned securities were all subject to an enforceable Securities Lending Agency Agreement. Securities lent in accordance with the Securities Lending Agency Agreement on a gross basis were as follows:
Securities Lending Agency Agreement |
Total gross amount presented on the Statements of Assets and Liabilities(1) | |
| |
| |
See Notes to Financial Statements
First Trust US Equity Opportunities ETF (FPX)Portfolio of Investments (Continued)December 31, 2024 | The amount presented on the Statements of Assets and Liabilities, which is included in “Investments, at value,” is not offset and is shown on a gross basis. |
| At December 31, 2024, the value of the collateral received from each borrower exceeded the value of the related securities loaned. This amount is disclosed on the Portfolio of Investments. |
The Fund’s investments in repurchase agreements were all subject to an enforceable Master Repurchase Agreement. Repurchase Agreements on a gross basis were as follows:
|
Total gross amount presented on the Statements of Assets and Liabilities(3) | |
| |
| |
| The amount is included in “Investments, at value” on the Statements of Assets and Liabilities. |
| At December 31, 2024, the value of the collateral received from each seller exceeded the value of the repurchase agreements. |
See Notes to Financial Statements
First Trust NYSE® Arca® Biotechnology Index Fund (FBT)Portfolio of InvestmentsDecember 31, 2024
| | |
|
| | |
| ACADIA Pharmaceuticals, Inc. (a) | |
| | |
| Alnylam Pharmaceuticals, Inc. (a) | |
| | |
| | |
| | |
| | |
| BioMarin Pharmaceutical, Inc. (a) | |
| | |
| Catalyst Pharmaceuticals, Inc. (a) | |
| | |
| | |
| | |
| | |
| Halozyme Therapeutics, Inc. (a) | |
| | |
| | |
| | |
| Neurocrine Biosciences, Inc. (a) | |
| Regeneron Pharmaceuticals, Inc. (a) | |
| Sarepta Therapeutics, Inc. (a) | |
| United Therapeutics Corp. (a) | |
| Vertex Pharmaceuticals, Inc. (a) | |
| | |
| Life Sciences Tools & Services | |
| | |
| | |
| Mettler-Toledo International, Inc. (a) | |
| | |
| | |
| | |
| | |
| Corcept Therapeutics, Inc. (a) | |
| Intra-Cellular Therapies, Inc. (a) | |
| | |
| | |
| | |
| | |
MONEY MARKET FUNDS — 0.1% |
| Dreyfus Government Cash Management Fund, Institutional Shares - 4.36% (b) | |
| | |
|
|
| Total Investments — 100.1% | |
| | |
| Net Other Assets and Liabilities — (0.1)% | |
| | |
| Non-income producing security. |
| Rate shown reflects yield as of December 31, 2024. |
Abbreviations throughout the Portfolio of Investments: |
| – American Depositary Receipt |
Valuation InputsA summary of the inputs used to value the Fund’s investments as of December 31, 2024 is as follows (see Note 2A - Portfolio Valuation in the Notes to Financial Statements):
| | | Level 2
Significant
Observable
Inputs | Level 3
Significant
Unobservable
Inputs |
| | | | |
| | | | |
| | | | |
| See Portfolio of Investments for industry breakout. |
See Notes to Financial Statements
First Trust Dow Jones Internet Index Fund (FDN)Portfolio of InvestmentsDecember 31, 2024
| | |
|
| | |
| | |
| | |
| | |
| | |
| | |
| | |
| Arista Networks, Inc. (a) | |
| | |
| | |
| | |
| | |
| | |
| | |
| ROBLOX Corp., Class A (a) | |
| | |
| Financial Services — 4.0% | |
| PayPal Holdings, Inc. (a) | |
| | |
| Veeva Systems, Inc., Class A (a) | |
| Hotels, Restaurants & Leisure | |
| Airbnb, Inc., Class A (a) | |
| | |
| DoorDash, Inc., Class A (a) | |
| DraftKings, Inc., Class A (a) | |
| Flutter Entertainment PLC (a) | |
| | |
| Interactive Media & Services | |
| | |
| | |
| Meta Platforms, Inc., Class A | |
| ZoomInfo Technologies, Inc. (a) | |
| | |
| | |
| Akamai Technologies, Inc. (a) | |
| Cloudflare, Inc., Class A (a) | |
| GoDaddy, Inc., Class A (a) | |
| | |
| Snowflake, Inc., Class A (a) | |
| | |
| | |
| Professional Services — 0.5% | |
| | |
| | |
|
| | |
| Atlassian Corp., Class A (a) | |
| | |
| Confluent, Inc., Class A (a) | |
| Datadog, Inc., Class A (a) | |
| | |
| Dropbox, Inc., Class A (a) | |
| | |
| MARA Holdings, Inc. (a) (b) | |
| Nutanix, Inc., Class A (a) | |
| | |
| Smartsheet, Inc., Class A (a) | |
| Workday, Inc., Class A (a) | |
| Zoom Communications, Inc. (a) | |
| | |
| | |
| | |
| | |
| | |
MONEY MARKET FUNDS — 0.0% |
| Morgan Stanley Institutional Liquidity Funds - Treasury Portfolio - Institutional Class - 4.37% (c) | |
| | |
See Notes to Financial Statements
First Trust Dow Jones Internet Index Fund (FDN)Portfolio of Investments (Continued)December 31, 2024 | | |
REPURCHASE AGREEMENTS — 0.2% |
| Bank of America Corp., 4.45% (c), dated 12/31/24, due 01/02/25, with a maturity value of $6,538,079. Collateralized by U.S. Treasury Securities, interest rates of 0.00% to 3.63%, due 05/31/28 to 05/15/54. The value of the collateral including accrued interest is $6,667,192. (d) | |
| RBC Dominion Securities, Inc., 4.50% (c), dated 12/31/24, due 01/02/25, with a maturity value of $6,807,154. Collateralized by U.S. Treasury Securities, interest rates of 0.00% to 4.88%, due 11/30/25 to 11/15/54. The value of the collateral including accrued interest is $6,941,562. (d) | |
| Total Repurchase Agreements | |
| | |
|
|
| Total Investments — 100.2% | |
| | |
| Net Other Assets and Liabilities — (0.2)% | |
| | |
| Non-income producing security. |
| All or a portion of this security is on loan (see Note 2D - Securities Lending in the Notes to Financial Statements). The remaining contractual maturity of all of the securities lending transactions is overnight and continuous. The aggregate value of such securities is $12,268,094 and the total value of the collateral held by the Fund, including for securities sold and pending settlement, is $13,341,916. |
| Rate shown reflects yield as of December 31, 2024. |
| This security serves as collateral for securities on loan. |
Valuation InputsA summary of the inputs used to value the Fund’s investments as of December 31, 2024 is as follows (see Note 2A - Portfolio Valuation in the Notes to Financial Statements):
| | | Level 2
Significant
Observable
Inputs | Level 3
Significant
Unobservable
Inputs |
| | | | |
| | | | |
| | | | |
| | | | |
| See Portfolio of Investments for industry breakout. |
Offsetting Assets and Liabilities
Offsetting assets and liabilities requires entities to disclose both gross and net information about instruments and transactions eligible for offset, and to disclose instruments and transactions subject to master netting or similar agreements (see Note 2C - Offsetting on the Statements of Assets and Liabilities in the Notes to Financial Statements).
The Fund’s loaned securities were all subject to an enforceable Securities Lending Agency Agreement. Securities lent in accordance with the Securities Lending Agency Agreement on a gross basis were as follows:
Securities Lending Agency Agreement |
Total gross amount presented on the Statements of Assets and Liabilities(1) | |
| |
| |
| The amount presented on the Statements of Assets and Liabilities, which is included in “Investments, at value,” is not offset and is shown on a gross basis. |
| At December 31, 2024, the value of the collateral received from each borrower exceeded the value of the related securities loaned. This amount is disclosed on the Portfolio of Investments. |
See Notes to Financial Statements
First Trust Dow Jones Internet Index Fund (FDN)Portfolio of Investments (Continued)December 31, 2024 The Fund’s investments in repurchase agreements were all subject to an enforceable Master Repurchase Agreement. Repurchase Agreements on a gross basis were as follows:
|
Total gross amount presented on the Statements of Assets and Liabilities(3) | |
| |
| |
| The amount is included in “Investments, at value” on the Statements of Assets and Liabilities. |
| At December 31, 2024, the value of the collateral received from each seller exceeded the value of the repurchase agreements. |
See Notes to Financial Statements
First Trust Capital Strength® ETF (FTCS)Portfolio of InvestmentsDecember 31, 2024
| | |
|
| Aerospace & Defense — 5.3% | |
| | |
| | |
| | |
| | |
| Air Freight & Logistics — | |
| Expeditors International of Washington, Inc. | |
| | |
| | |
| | |
| | |
| | |
| | |
| Regeneron Pharmaceuticals, Inc. (a) | |
| | |
| | |
| Ameriprise Financial, Inc. | |
| | |
| | |
| | |
| | |
| | |
| | |
| | |
| | |
| | |
| | |
| | |
| | |
| | |
| Consumer Staples Distribution | |
| | |
| | |
| | |
| | |
| Packaging Corp. of America | |
| | |
| | |
| Financial Services — 4.4% | |
| Mastercard, Inc., Class A | |
| | |
| | |
| | |
|
| | |
| | |
| | |
| | |
| | |
| | |
| | |
| | |
| | |
| | |
| Household Products — 5.9% | |
| | |
| | |
| Procter & Gamble (The) Co. | |
| | |
| Industrial Conglomerates — | |
| Honeywell International, Inc. | |
| | |
| | |
| | |
| | |
| | |
| | |
| Marsh & McLennan Cos., Inc. | |
| RenaissanceRe Holdings Ltd. | |
| | |
| | |
| Cognizant Technology Solutions Corp., Class A | |
| International Business Machines Corp. | |
| | |
| | |
| | |
| Oil, Gas & Consumable Fuels | |
| | |
| | |
| | |
| | |
| | |
| Professional Services — 4.2% | |
| Automatic Data Processing, Inc. | |
| | |
| | |
See Notes to Financial Statements
First Trust Capital Strength® ETF (FTCS)Portfolio of Investments (Continued)December 31, 2024 | | |
COMMON STOCKS (Continued) |
| | |
| | |
| | |
| | |
| | |
| | |
| | |
| | |
| | |
MONEY MARKET FUNDS — 0.1% |
| Dreyfus Government Cash Management Fund, Institutional Shares - 4.36% (b) | |
| | |
|
|
| Total Investments — 100.0% | |
| | |
| Net Other Assets and Liabilities — 0.0% | |
| | |
| Non-income producing security. |
| Rate shown reflects yield as of December 31, 2024. |
Valuation InputsA summary of the inputs used to value the Fund’s investments as of December 31, 2024 is as follows (see Note 2A - Portfolio Valuation in the Notes to Financial Statements):
| | | Level 2
Significant
Observable
Inputs | Level 3
Significant
Unobservable
Inputs |
| | | | |
| | | | |
| | | | |
| See Portfolio of Investments for industry breakout. |
See Notes to Financial Statements
First Trust Value Line® Dividend Index Fund (FVD)Portfolio of InvestmentsDecember 31, 2024
| | |
|
| Aerospace & Defense — 2.3% | |
| | |
| L3Harris Technologies, Inc. | |
| | |
| | |
| | |
| | |
| Air Freight & Logistics — | |
| C.H. Robinson Worldwide, Inc. | |
| Expeditors International of Washington, Inc. | |
| United Parcel Service, Inc., Class B | |
| | |
| | |
| | |
| | |
| Honda Motor Co., Ltd., ADR | |
| | |
| | |
| | |
| | |
| Bank of Nova Scotia (The) | |
| Canadian Imperial Bank of Commerce | |
| Commerce Bancshares, Inc. | |
| | |
| | |
| Toronto-Dominion Bank (The) | |
| | |
| | |
| Brown-Forman Corp., Class B | |
| | |
| Constellation Brands, Inc., Class A | |
| | |
| | |
| | |
| | |
| | |
| | |
| | |
| | |
| | |
| | |
|
| | |
| | |
| Johnson Controls International PLC | |
| | |
| | |
| Bank of New York Mellon (The) Corp. | |
| | |
| Cboe Global Markets, Inc. | |
| | |
| Goldman Sachs Group (The), Inc. | |
| | |
| | |
| | |
| T. Rowe Price Group, Inc. | |
| | |
| | |
| Air Products and Chemicals, Inc. | |
| | |
| | |
| | |
| | |
| Sensient Technologies Corp. | |
| | |
| | |
| | |
| | |
| | |
| | |
| | |
| | |
| | |
| | |
| | |
| | |
| Consumer Staples Distribution | |
| | |
| | |
| | |
| | |
| | |
| | |
| Packaging Corp. of America | |
See Notes to Financial Statements
First Trust Value Line® Dividend Index Fund (FVD)Portfolio of Investments (Continued)December 31, 2024 | | |
COMMON STOCKS (Continued) |
| Containers & Packaging (Continued) | |
| | |
| | |
| | |
| Diversified Telecommunication | |
| | |
| | |
| | |
| Verizon Communications, Inc. | |
| | |
| Electric Utilities — 8.1% | |
| | |
| | |
| American Electric Power Co., Inc. | |
| | |
| | |
| | |
| | |
| | |
| | |
| | |
| | |
| | |
| | |
| Pinnacle West Capital Corp. | |
| Portland General Electric Co. | |
| | |
| | |
| | |
| | |
| Electrical Equipment — 0.9% | |
| | |
| | |
| | |
| Electronic Equipment, Instruments & Components | |
| | |
| | |
| | |
| Financial Services — 0.5% | |
| Jack Henry & Associates, Inc. | |
| | |
| | |
| | |
| | |
| | |
| | |
|
| Food Products (Continued) | |
| | |
| | |
| | |
| | |
| | |
| | |
| | |
| | |
| | |
| Mondelez International, Inc., Class A | |
| | |
| | |
| | |
| | |
| Chesapeake Utilities Corp. | |
| | |
| New Jersey Resources Corp. | |
| Northwest Natural Holding Co. | |
| | |
| Southwest Gas Holdings, Inc. | |
| | |
| | |
| | |
| Canadian National Railway Co. | |
| | |
| | |
| Schneider National, Inc., Class B | |
| | |
| | |
| | |
| | |
| | |
| Baxter International, Inc. | |
| | |
| | |
| | |
| | |
| | |
| | |
| | |
| | |
| Hotels, Restaurants & Leisure | |
| | |
| | |
| | |
See Notes to Financial Statements
First Trust Value Line® Dividend Index Fund (FVD)Portfolio of Investments (Continued)December 31, 2024 | | |
COMMON STOCKS (Continued) |
| Household Products — 2.7% | |
| | |
| | |
| | |
| Procter & Gamble (The) Co. | |
| Reynolds Consumer Products, Inc. | |
| | |
| | |
| Industrial Conglomerates — | |
| | |
| Honeywell International, Inc. | |
| | |
| | |
| | |
| | |
| | |
| | |
| Hanover Insurance Group (The), Inc. | |
| Marsh & McLennan Cos., Inc. | |
| Selective Insurance Group, Inc. | |
| | |
| Travelers (The) Cos., Inc. | |
| | |
| | |
| | |
| | |
| Cognizant Technology Solutions Corp., Class A | |
| | |
| International Business Machines Corp. | |
| | |
| | |
| | |
| | |
| | |
| | |
| | |
| Illinois Tool Works, Inc. | |
| Lincoln Electric Holdings, Inc. | |
| | |
| | |
| | |
| | |
| | |
| | |
| | |
|
| | |
| | |
| | |
| | |
| | |
| | |
| | |
| | |
| Consolidated Edison, Inc. | |
| | |
| | |
| | |
| Northwestern Energy Group, Inc. | |
| Public Service Enterprise Group, Inc. | |
| | |
| | |
| | |
| Oil, Gas & Consumable Fuels | |
| | |
| | |
| | |
| | |
| | |
| | |
| | |
| | |
| | |
| | |
| | |
| | |
| | |
| | |
| | |
| | |
| | |
| | |
| Takeda Pharmaceutical Co., Ltd., ADR | |
| | |
| Professional Services — 3.6% | |
| Automatic Data Processing, Inc. | |
| Booz Allen Hamilton Holding Corp. | |
| Broadridge Financial Solutions, Inc. | |
| | |
| | |
| | |
See Notes to Financial Statements
First Trust Value Line® Dividend Index Fund (FVD)Portfolio of Investments (Continued)December 31, 2024 | | |
COMMON STOCKS (Continued) |
| Professional Services (Continued) | |
| | |
| | |
| | |
| Semiconductors & Semiconductor Equipment | |
| | |
| Taiwan Semiconductor Manufacturing Co., Ltd., ADR | |
| | |
| | |
| | |
| Dolby Laboratories, Inc., Class A | |
| | |
| | |
| | |
| | |
| | |
| | |
| | |
| | |
| | |
| | |
| | |
| Textiles, Apparel & Luxury | |
| | |
| | |
| | |
| British American Tobacco PLC, ADR | |
| Philip Morris International, Inc. | |
| | |
| | |
| | |
| | |
| | |
| MSC Industrial Direct Co., Inc., Class A | |
| | |
| | |
| | |
| American States Water Co. | |
| American Water Works Co., Inc. | |
| California Water Service Group | |
| | |
|
| Water Utilities (Continued) | |
| Essential Utilities, Inc. | |
| | |
| | |
| Wireless Telecommunication | |
| America Movil S.A.B. de C.V., ADR | |
| Rogers Communications, Inc., Class B | |
| | |
| | |
| | |
| | |
MONEY MARKET FUNDS — 0.2% |
| Dreyfus Government Cash Management Fund, Institutional Shares - 4.36% (a) | |
| | |
|
|
| Total Investments — 99.9% | |
| | |
| Net Other Assets and Liabilities — 0.1% | |
| | |
| Rate shown reflects yield as of December 31, 2024. |
Abbreviations throughout the Portfolio of Investments: |
| – American Depositary Receipt |
| – Real Estate Investment Trusts |
Valuation InputsA summary of the inputs used to value the Fund’s investments as of December 31, 2024 is as follows (see Note 2A - Portfolio Valuation in the Notes to Financial Statements):
| | | Level 2
Significant
Observable
Inputs | Level 3
Significant
Unobservable
Inputs |
| | | | |
| | | | |
| | | | |
| See Portfolio of Investments for industry breakout. |
See Notes to Financial Statements
First Trust Growth StrengthTM ETF (FTGS)Portfolio of InvestmentsDecember 31, 2024
| | |
|
| | |
| Monster Beverage Corp. (a) | |
| | |
| United Therapeutics Corp. (a) | |
| | |
| | |
| | |
| | |
| | |
| | |
| | |
| Ameriprise Financial, Inc. | |
| | |
| | |
| | |
| | |
| | |
| Arista Networks, Inc. (a) | |
| | |
| | |
| | |
| | |
| Electronic Equipment, Instruments & Components | |
| | |
| Energy Equipment & Services | |
| | |
| | |
| Live Nation Entertainment, Inc. (a) | |
| | |
| | |
| Financial Services — 8.4% | |
| | |
| Mastercard, Inc., Class A | |
| PayPal Holdings, Inc. (a) | |
| | |
| | |
| | |
| | |
| | |
| | |
| | |
|
| Hotels, Restaurants & Leisure | |
| Chipotle Mexican Grill, Inc. (a) | |
| | |
| | |
| Household Durables — 2.9% | |
| | |
| | |
| | |
| | |
| | |
| | |
| | |
| | |
| RenaissanceRe Holdings Ltd. | |
| | |
| | |
| Interactive Media & Services | |
| Meta Platforms, Inc., Class A | |
| | |
| | |
| | |
| | |
| Oil, Gas & Consumable Fuels | |
| | |
| | |
| | |
| | |
| | |
| | |
| | |
| Professional Services — 4.1% | |
| Automatic Data Processing, Inc. | |
| | |
| | |
| Semiconductors & Semiconductor Equipment | |
| | |
| Monolithic Power Systems, Inc. | |
| | |
| | |
| | |
| Cadence Design Systems, Inc. (a) | |
| | |
| | |
See Notes to Financial Statements
First Trust Growth StrengthTM ETF (FTGS)Portfolio of Investments (Continued)December 31, 2024 | | |
COMMON STOCKS (Continued) |
| | |
| Palo Alto Networks, Inc. (a) | |
| Workday, Inc., Class A (a) | |
| | |
| Textiles, Apparel & Luxury | |
| Deckers Outdoor Corp. (a) | |
| | |
| | |
MONEY MARKET FUNDS — 0.1% |
| Dreyfus Government Cash Management Fund, Institutional Shares - 4.36% (b) | |
| | |
|
|
| Total Investments — 99.9% | |
| | |
| Net Other Assets and Liabilities — 0.1% | |
| | |
| Non-income producing security. |
| Rate shown reflects yield as of December 31, 2024. |
Valuation InputsA summary of the inputs used to value the Fund’s investments as of December 31, 2024 is as follows (see Note 2A - Portfolio Valuation in the Notes to Financial Statements):
| | | Level 2
Significant
Observable
Inputs | Level 3
Significant
Unobservable
Inputs |
| | | | |
| | | | |
| | | | |
| See Portfolio of Investments for industry breakout. |
See Notes to Financial Statements
First Trust Indxx Aerospace & Defense ETF (MISL)Portfolio of InvestmentsDecember 31, 2024
| | |
|
| Aerospace & Defense — 85.4% | |
| | |
| | |
| | |
| | |
| | |
| | |
| | |
| | |
| | |
| | |
| Huntington Ingalls Industries, Inc. | |
| Intuitive Machines, Inc. (a) | |
| Kratos Defense & Security Solutions, Inc. (a) | |
| L3Harris Technologies, Inc. | |
| | |
| | |
| | |
| Mercury Systems, Inc. (a) | |
| | |
| National Presto Industries, Inc. | |
| | |
| | |
| | |
| Spirit AeroSystems Holdings, Inc., Class A (a) | |
| | |
| | |
| | |
| | |
| | |
| Diversified Telecommunication | |
| AST SpaceMobile, Inc. (a) | |
| Professional Services — 12.8% | |
| CACI International, Inc., Class A (a) | |
| | |
| | |
| | |
| Science Applications International Corp. | |
| | |
| | |
| | |
| | |
MONEY MARKET FUNDS — 0.1% |
| Dreyfus Government Cash Management Fund, Institutional Shares - 4.36% (b) | |
| | |
|
|
| Total Investments — 100.0% | |
| | |
| Net Other Assets and Liabilities — (0.0)% | |
| | |
| Non-income producing security. |
| Rate shown reflects yield as of December 31, 2024. |
Valuation InputsA summary of the inputs used to value the Fund’s investments as of December 31, 2024 is as follows (see Note 2A - Portfolio Valuation in the Notes to Financial Statements):
| | | Level 2
Significant
Observable
Inputs | Level 3
Significant
Unobservable
Inputs |
| | | | |
| | | | |
| | | | |
| See Portfolio of Investments for industry breakout. |
See Notes to Financial Statements
First Trust Bloomberg Inflation Sensitive Equity ETF (FTIF)Portfolio of InvestmentsDecember 31, 2024
| | |
|
| Aerospace & Defense — 4.6% | |
| | |
| | |
| | |
| Air Freight & Logistics — | |
| United Parcel Service, Inc., Class B | |
| | |
| Advanced Drainage Systems, Inc. | |
| | |
| CF Industries Holdings, Inc. | |
| | |
| | |
| | |
| International Flavors & Fragrances, Inc. | |
| LyondellBasell Industries N.V., Class A | |
| | |
| | |
| Construction & Engineering | |
| | |
| | |
| | |
| | |
| | |
| Packaging Corp. of America | |
| | |
| | |
| | |
| Electronic Equipment, Instruments & Components | |
| Keysight Technologies, Inc. (a) | |
| | |
| | |
| Energy Equipment & Services | |
| | |
| | |
| | |
| Weatherford International PLC | |
| | |
| | |
|
| | |
| | |
| | |
| | |
| | |
| Omega Healthcare Investors, Inc. | |
| Hotel & Resort REITs — 2.0% | |
| Host Hotels & Resorts, Inc. | |
| | |
| | |
| | |
| | |
| | |
| Westinghouse Air Brake Technologies Corp. | |
| | |
| | |
| | |
| | |
| | |
| Oil, Gas & Consumable Fuels | |
| | |
| | |
| | |
| | |
| | |
| | |
| Magnolia Oil & Gas Corp., Class A | |
| | |
| | |
| PBF Energy, Inc., Class A | |
| | |
| | |
| | |
| | |
| Jones Lang LaSalle, Inc. (a) | |
| | |
| American Homes 4 Rent, Class A | |
| | |
| Simon Property Group, Inc. | |
| | |
| Lamar Advertising Co., Class A | |
| | |
| | |
See Notes to Financial Statements
First Trust Bloomberg Inflation Sensitive Equity ETF (FTIF)Portfolio of Investments (Continued)December 31, 2024 | | |
MONEY MARKET FUNDS — 0.2% |
| Dreyfus Government Cash Management Fund, Institutional Shares - 4.36% (b) | |
| | |
|
|
| Total Investments — 99.9% | |
| | |
| Net Other Assets and Liabilities — 0.1% | |
| | |
| Non-income producing security. |
| Rate shown reflects yield as of December 31, 2024. |
Abbreviations throughout the Portfolio of Investments: |
| – Real Estate Investment Trusts |
Valuation InputsA summary of the inputs used to value the Fund’s investments as of December 31, 2024 is as follows (see Note 2A - Portfolio Valuation in the Notes to Financial Statements):
| | | Level 2
Significant
Observable
Inputs | Level 3
Significant
Unobservable
Inputs |
| | | | |
| | | | |
| | | | |
| See Portfolio of Investments for industry breakout. |
See Notes to Financial Statements
This page intentionally left blank.
First Trust Exchange-Traded FundStatements of Assets and Liabilities
December 31, 2024
| First Trust Dow Jones Select MicroCap Index Fund
(FDM) | First Trust Morningstar Dividend Leaders Index Fund
(FDL) | First Trust US Equity Opportunities ETF
(FPX) | First Trust NYSE® Arca® Biotechnology Index Fund
(FBT) |
| | | | |
| | | | |
| | | | |
Due from authorized participant | | | | |
| | | | |
| | | | |
Securities lending income | | | | |
| | | | |
Investment securities sold | | | | |
| | | | |
| | | | |
| | | | |
|
| | | | |
| | | | |
Collateral for securities on loan | | | | |
| | | | |
| | | | |
| | | | |
Shareholder reporting fees | | | | |
| | | | |
Investment securities purchased | | | | |
| | | | |
| | | | |
| | | | |
| | | | |
|
| | | | |
| | | | |
| | | | |
Accumulated distributable earnings (loss) | | | | |
| | | | |
NET ASSET VALUE, per share | | | | |
Number of shares outstanding (unlimited number of shares authorized, par value $0.01 per share) | | | | |
| | | | |
Securities on loan, at value | | | | |
See Notes to Financial Statements
First Trust Dow Jones Internet Index Fund
(FDN) | First Trust Capital Strength® ETF
(FTCS) | First Trust Value Line® Dividend Index Fund
(FVD) | First Trust Growth StrengthTM ETF
(FTGS) | First Trust Indxx Aerospace & Defense ETF
(MISL) | First Trust Bloomberg Inflation Sensitive Equity ETF
(FTIF) |
| | | | | |
| | | | | |
| | | | | |
| | | | | |
| | | | | |
| | | | | |
| | | | | |
| | | | | |
| | | | | |
| | | | | |
| | | | | |
| | | | | |
|
| | | | | |
| | | | | |
| | | | | |
| | | | | |
| | | | | |
| | | | | |
| | | | | |
| | | | | |
| | | | | |
| | | | | |
| | | | | |
| | | | | |
| | | | | |
|
| | | | | |
| | | | | |
| | | | | |
| | | | | |
| | | | | |
| | | | | |
| | | | | |
| | | | | |
| | | | | |
See Notes to Financial Statements
First Trust Exchange-Traded FundStatements of Operations
For the Year Ended December 31, 2024
| First Trust Dow Jones Select MicroCap Index Fund
(FDM) | First Trust Morningstar Dividend Leaders Index Fund
(FDL) | First Trust US Equity Opportunities ETF
(FPX) | First Trust NYSE® Arca® Biotechnology Index Fund
(FBT) |
| | | | |
| | | | |
Securities lending income (net of fees) | | | | |
| | | | |
| | | | |
|
| | | | |
| | | | |
| | | | |
Accounting and administration fees | | | | |
| | | | |
Shareholder reporting fees | | | | |
| | | | |
| | | | |
| | | | |
Trustees’ fees and expenses | | | | |
| | | | |
| | | | |
| | | | |
Less fees waived by the investment advisor | | | | |
| | | | |
NET INVESTMENT INCOME (LOSS) | | | | |
|
NET REALIZED AND UNREALIZED GAIN (LOSS): | | | | |
Net realized gain (loss) on: | | | | |
| | | | |
| | | | |
Foreign currency transactions | | | | |
| | | | |
Net change in unrealized appreciation (depreciation) on: | | | | |
| | | | |
Foreign currency translation | | | | |
Net change in unrealized appreciation (depreciation) | | | | |
NET REALIZED AND UNREALIZED GAIN (LOSS) | | | | |
NET INCREASE (DECREASE) IN NET ASSETS RESULTING FROM OPERATIONS | | | | |
| Fund is subject to a unitary fee (see Note 3 in the Notes to Financial Statements). |
See Notes to Financial Statements
First Trust Dow Jones Internet Index Fund
(FDN) | First Trust Capital Strength® ETF
(FTCS) | First Trust Value Line® Dividend Index Fund
(FVD) | First Trust Growth StrengthTM ETF
(FTGS) | First Trust Indxx Aerospace & Defense ETF
(MISL) | First Trust Bloomberg Inflation Sensitive Equity ETF
(FTIF) |
| | | | | |
| | | | | |
| | | | | |
| | | | | |
| | | | | |
|
| | | | | |
| | | | | |
| | | | | |
| | | | | |
| | | | | |
| | | | | |
| | | | | |
| | | | | |
| | | | | |
| | | | | |
| | | | | |
| | | | | |
| | | | | |
| | | | | |
| | | | | |
| | | | | |
|
| | | | | |
| | | | | |
| | | | | |
| | | | | |
| | | | | |
| | | | | |
| | | | | |
| | | | | |
| | | | | |
| | | | | |
| | | | | |
| | | | | |
See Notes to Financial Statements
First Trust Exchange-Traded FundStatements of Changes in Net Assets
| First Trust Dow Jones Select MicroCap Index Fund (FDM) | First Trust Morningstar Dividend Leaders Index Fund (FDL) |
| | | | |
| | | | |
Net investment income (loss) | | | | |
| | | | |
Net change in unrealized appreciation (depreciation) | | | | |
Net increase (decrease) in net assets resulting from operations | | | | |
|
DISTRIBUTIONS TO SHAREHOLDERS FROM: | | | | |
| | | | |
|
SHAREHOLDER TRANSACTIONS: | | | | |
Proceeds from shares sold | | | | |
| | | | |
Net increase (decrease) in net assets resulting from shareholder transactions | | | | |
Total increase (decrease) in net assets | | | | |
|
| | | | |
| | | | |
| | | | |
|
CHANGES IN SHARES OUTSTANDING: | | | | |
Shares outstanding, beginning of period | | | | |
| | | | |
| | | | |
Shares outstanding, end of period | | | | |
See Notes to Financial Statements
First Trust US Equity Opportunities ETF (FPX) | First Trust NYSE® Arca® Biotechnology Index Fund (FBT) | First Trust Dow Jones Internet Index Fund (FDN) |
| | | | | |
| | | | | |
| | | | | |
| | | | | |
| | | | | |
| | | | | |
|
| | | | | |
| | | | | |
|
| | | | | |
| | | | | |
| | | | | |
| | | | | |
| | | | | |
|
| | | | | |
| | | | | |
| | | | | |
|
| | | | | |
| | | | | |
| | | | | |
| | | | | |
| | | | | |
See Notes to Financial Statements
First Trust Exchange-Traded FundStatements of Changes in Net Assets (Continued)
| First Trust Capital Strength® ETF (FTCS) | First Trust Value Line® Dividend Index Fund (FVD) |
| | | | |
| | | | |
Net investment income (loss) | | | | |
| | | | |
Net change in unrealized appreciation (depreciation) | | | | |
Net increase (decrease) in net assets resulting from operations | | | | |
|
DISTRIBUTIONS TO SHAREHOLDERS FROM: | | | | |
| | | | |
|
SHAREHOLDER TRANSACTIONS: | | | | |
Proceeds from shares sold | | | | |
| | | | |
Net increase (decrease) in net assets resulting from shareholder transactions | | | | |
Total increase (decrease) in net assets | | | | |
|
| | | | |
| | | | |
| | | | |
|
CHANGES IN SHARES OUTSTANDING: | | | | |
Shares outstanding, beginning of period | | | | |
| | | | |
| | | | |
Shares outstanding, end of period | | | | |
| Inception date is March 13, 2023, which is consistent with the commencement of investment operations and is the date the initial creation units were established. |
See Notes to Financial Statements
First Trust Growth StrengthTM ETF (FTGS) | First Trust Indxx Aerospace & Defense ETF (MISL) | First Trust Bloomberg Inflation Sensitive Equity ETF (FTIF) |
| | | | | Period
Ended
12/31/2023 (a) |
| | | | | |
| | | | | |
| | | | | |
| | | | | |
| | | | | |
|
| | | | | |
| | | | | |
|
| | | | | |
| | | | | |
| | | | | |
| | | | | |
| | | | | |
|
| | | | | |
| | | | | |
| | | | | |
|
| | | | | |
| | | | | |
| | | | | |
| | | | | |
| | | | | |
See Notes to Financial Statements
First Trust Exchange-Traded FundFinancial Highlights
For a share outstanding throughout each period First Trust Dow Jones Select MicroCap Index Fund (FDM)
| |
| | | | | |
Net asset value, beginning of period | | | | | |
Income from investment operations: | | | | | |
Net investment income (loss) | | | | | |
Net realized and unrealized gain (loss) | | | | | |
Total from investment operations | | | | | |
Distributions paid to shareholders from: | | | | | |
| | | | | |
Net asset value, end of period | | | | | |
| | | | | |
|
Ratios to average net assets/supplemental data: | | | | | |
Net assets, end of period (in 000’s) | | | | | |
Ratio of total expenses to average net assets | | | | | |
Ratio of net expenses to average net assets | | | | | |
Ratio of net investment income (loss) to average net assets | | | | | |
Portfolio turnover rate (c) | | | | | |
| Based on average shares outstanding. |
| Total return is calculated assuming an initial investment made at the net asset value at the beginning of the period, reinvestment of all distributions at net asset value during the period, and redemption at net asset value on the last day of the period. The returns presented do not reflect the deduction of taxes that a shareholder would pay on Fund distributions or the redemption or sale of Fund shares. Total return is calculated for the time period presented and is not annualized for periods of less than a year. The total returns would have been lower if certain fees had not been waived and expenses reimbursed by the investment advisor. |
| Portfolio turnover is calculated for the time period presented and is not annualized for periods of less than a year and does not include securities received or delivered from processing creations or redemptions and in-kind transactions. |
See Notes to Financial Statements
First Trust Exchange-Traded FundFinancial Highlights (Continued)
For a share outstanding throughout each period First Trust Morningstar Dividend Leaders Index Fund (FDL)
| |
| | | | | |
Net asset value, beginning of period | | | | | |
Income from investment operations: | | | | | |
Net investment income (loss) | | | | | |
Net realized and unrealized gain (loss) | | | | | |
Total from investment operations | | | | | |
Distributions paid to shareholders from: | | | | | |
| | | | | |
Net asset value, end of period | | | | | |
| | | | | |
|
Ratios to average net assets/supplemental data: | | | | | |
Net assets, end of period (in 000’s) | | | | | |
Ratio of total expenses to average net assets | | | | | |
Ratio of net expenses to average net assets | | | | | |
Ratio of net investment income (loss) to average net assets | | | | | |
Portfolio turnover rate (c) | | | | | |
| Based on average shares outstanding. |
| Total return is calculated assuming an initial investment made at the net asset value at the beginning of the period, reinvestment of all distributions at net asset value during the period, and redemption at net asset value on the last day of the period. The returns presented do not reflect the deduction of taxes that a shareholder would pay on Fund distributions or the redemption or sale of Fund shares. Total return is calculated for the time period presented and is not annualized for periods of less than a year. The total returns would have been lower if certain fees had not been waived and expenses reimbursed by the investment advisor. |
| Portfolio turnover is calculated for the time period presented and is not annualized for periods of less than a year and does not include securities received or delivered from processing creations or redemptions and in-kind transactions. |
See Notes to Financial Statements
First Trust Exchange-Traded FundFinancial Highlights (Continued)
For a share outstanding throughout each period First Trust US Equity Opportunities ETF (FPX)
| |
| | | | | |
Net asset value, beginning of period | | | | | |
Income from investment operations: | | | | | |
Net investment income (loss) | | | | | |
Net realized and unrealized gain (loss) | | | | | |
Total from investment operations | | | | | |
Distributions paid to shareholders from: | | | | | |
| | | | | |
Net asset value, end of period | | | | | |
| | | | | |
|
Ratios to average net assets/supplemental data: | | | | | |
Net assets, end of period (in 000’s) | | | | | |
Ratio of total expenses to average net assets | | | | | |
Ratio of net investment income (loss) to average net assets | | | | | |
Portfolio turnover rate (d) | | | | | |
| Based on average shares outstanding. |
| Total return is calculated assuming an initial investment made at the net asset value at the beginning of the period, reinvestment of all distributions at net asset value during the period, and redemption at net asset value on the last day of the period. The returns presented do not reflect the deduction of taxes that a shareholder would pay on Fund distributions or the redemption or sale of Fund shares. Total return is calculated for the time period presented and is not annualized for periods of less than a year. |
| Ratio of total expenses to average net assets and ratio of net investment income (loss) to average net assets do not reflect the Fund’s proportionate share of expenses and income of underlying investment companies in which the Fund invests. |
| Portfolio turnover is calculated for the time period presented and is not annualized for periods of less than a year and does not include securities received or delivered from processing creations or redemptions and in-kind transactions. |
See Notes to Financial Statements
First Trust Exchange-Traded FundFinancial Highlights (Continued)
For a share outstanding throughout each period First Trust NYSE® Arca® Biotechnology Index Fund (FBT)
| |
| | | | | |
Net asset value, beginning of period | | | | | |
Income from investment operations: | | | | | |
Net investment income (loss) | | | | | |
Net realized and unrealized gain (loss) | | | | | |
Total from investment operations | | | | | |
Distributions paid to shareholders from: | | | | | |
| | | | | |
Net asset value, end of period | | | | | |
| | | | | |
|
Ratios to average net assets/supplemental data: | | | | | |
Net assets, end of period (in 000’s) | | | | | |
Ratio of total expenses to average net assets | | | | | |
Ratio of net investment income (loss) to average net assets | | | | | |
Portfolio turnover rate (c) | | | | | |
| Based on average shares outstanding. |
| Total return is calculated assuming an initial investment made at the net asset value at the beginning of the period, reinvestment of all distributions at net asset value during the period, and redemption at net asset value on the last day of the period. The returns presented do not reflect the deduction of taxes that a shareholder would pay on Fund distributions or the redemption or sale of Fund shares. Total return is calculated for the time period presented and is not annualized for periods of less than a year. |
| Portfolio turnover is calculated for the time period presented and is not annualized for periods of less than a year and does not include securities received or delivered from processing creations or redemptions and in-kind transactions. |
See Notes to Financial Statements
First Trust Exchange-Traded FundFinancial Highlights (Continued)
For a share outstanding throughout each period First Trust Dow Jones Internet Index Fund (FDN)
| |
| | | | | |
Net asset value, beginning of period | | | | | |
Income from investment operations: | | | | | |
Net investment income (loss) | | | | | |
Net realized and unrealized gain (loss) | | | | | |
Total from investment operations | | | | | |
Net asset value, end of period | | | | | |
| | | | | |
|
Ratios to average net assets/supplemental data: | | | | | |
Net assets, end of period (in 000’s) | | | | | |
Ratio of total expenses to average net assets | | | | | |
Ratio of net investment income (loss) to average net assets | | | | | |
Portfolio turnover rate (c) | | | | | |
| Based on average shares outstanding. |
| Total return is calculated assuming an initial investment made at the net asset value at the beginning of the period, reinvestment of all distributions at net asset value during the period, and redemption at net asset value on the last day of the period. The returns presented do not reflect the deduction of taxes that a shareholder would pay on Fund distributions or the redemption or sale of Fund shares. Total return is calculated for the time period presented and is not annualized for periods of less than a year. |
| Portfolio turnover is calculated for the time period presented and is not annualized for periods of less than a year and does not include securities received or delivered from processing creations or redemptions and in-kind transactions. |
See Notes to Financial Statements
First Trust Exchange-Traded FundFinancial Highlights (Continued)
For a share outstanding throughout each period First Trust Capital Strength® ETF (FTCS)
| |
| | | | | |
Net asset value, beginning of period | | | | | |
Income from investment operations: | | | | | |
Net investment income (loss) | | | | | |
Net realized and unrealized gain (loss) | | | | | |
Total from investment operations | | | | | |
Distributions paid to shareholders from: | | | | | |
| | | | | |
Net asset value, end of period | | | | | |
| | | | | |
|
Ratios to average net assets/supplemental data: | | | | | |
Net assets, end of period (in 000’s) | | | | | |
Ratio of total expenses to average net assets | | | | | |
Ratio of net investment income (loss) to average net assets | | | | | |
Portfolio turnover rate (c) | | | | | |
| Based on average shares outstanding. |
| Total return is calculated assuming an initial investment made at the net asset value at the beginning of the period, reinvestment of all distributions at net asset value during the period, and redemption at net asset value on the last day of the period. The returns presented do not reflect the deduction of taxes that a shareholder would pay on Fund distributions or the redemption or sale of Fund shares. Total return is calculated for the time period presented and is not annualized for periods of less than a year. |
| Portfolio turnover is calculated for the time period presented and is not annualized for periods of less than a year and does not include securities received or delivered from processing creations or redemptions and in-kind transactions. |
See Notes to Financial Statements
First Trust Exchange-Traded FundFinancial Highlights (Continued)
For a share outstanding throughout each period First Trust Value Line® Dividend Index Fund (FVD)
| |
| | | | | |
Net asset value, beginning of period | | | | | |
Income from investment operations: | | | | | |
Net investment income (loss) | | | | | |
Net realized and unrealized gain (loss) | | | | | |
Total from investment operations | | | | | |
Distributions paid to shareholders from: | | | | | |
| | | | | |
Net asset value, end of period | | | | | |
| | | | | |
|
Ratios to average net assets/supplemental data: | | | | | |
Net assets, end of period (in 000’s) | | | | | |
Ratio of total expenses to average net assets | | | | | |
Ratio of net investment income (loss) to average net assets | | | | | |
Portfolio turnover rate (c) | | | | | |
| Based on average shares outstanding. |
| Total return is calculated assuming an initial investment made at the net asset value at the beginning of the period, reinvestment of all distributions at net asset value during the period, and redemption at net asset value on the last day of the period. The returns presented do not reflect the deduction of taxes that a shareholder would pay on Fund distributions or the redemption or sale of Fund shares. Total return is calculated for the time period presented and is not annualized for periods of less than a year. |
| Portfolio turnover is calculated for the time period presented and is not annualized for periods of less than a year and does not include securities received or delivered from processing creations or redemptions and in-kind transactions. |
See Notes to Financial Statements
First Trust Exchange-Traded FundFinancial Highlights (Continued)
For a share outstanding throughout each period First Trust Growth StrengthTM ETF (FTGS)
| | Period
Ended
12/31/2022 (a) |
| | |
Net asset value, beginning of period | | | |
Income from investment operations: | | | |
Net investment income (loss) | | | |
Net realized and unrealized gain (loss) | | | |
Total from investment operations | | | |
Distributions paid to shareholders from: | | | |
| | | |
| | | |
| | | |
Net asset value, end of period | | | |
| | | |
|
Ratios to average net assets/supplemental data: | | | |
Net assets, end of period (in 000’s) | | | |
Ratio of total expenses to average net assets | | | |
Ratio of net investment income (loss) to average net assets | | | |
Portfolio turnover rate (f) | | | |
| Inception date is October 25, 2022, which is consistent with the commencement of investment operations and is the date the initial creation units were established. |
| Based on average shares outstanding. |
| Amount represents less than $0.01. |
| Total return is calculated assuming an initial investment made at the net asset value at the beginning of the period, reinvestment of all distributions at net asset value during the period, and redemption at net asset value on the last day of the period. The returns presented do not reflect the deduction of taxes that a shareholder would pay on Fund distributions or the redemption or sale of Fund shares. Total return is calculated for the time period presented and is not annualized for periods of less than a year. |
| |
| Portfolio turnover is calculated for the time period presented and is not annualized for periods of less than a year and does not include securities received or delivered from processing creations or redemptions and in-kind transactions. |
See Notes to Financial Statements
First Trust Exchange-Traded FundFinancial Highlights (Continued)
For a share outstanding throughout each period First Trust Indxx Aerospace & Defense ETF (MISL)
| | Period
Ended
12/31/2022 (a) |
| | |
Net asset value, beginning of period | | | |
Income from investment operations: | | | |
Net investment income (loss) | | | |
Net realized and unrealized gain (loss) | | | |
Total from investment operations | | | |
Distributions paid to shareholders from: | | | |
| | | |
| | | |
| | | |
Net asset value, end of period | | | |
| | | |
|
Ratios to average net assets/supplemental data: | | | |
Net assets, end of period (in 000’s) | | | |
Ratio of total expenses to average net assets | | | |
Ratio of net investment income (loss) to average net assets | | | |
Portfolio turnover rate (f) | | | |
| Inception date is October 25, 2022, which is consistent with the commencement of investment operations and is the date the initial creation units were established. |
| Based on average shares outstanding. |
| Amount represents less than $0.01. |
| Total return is calculated assuming an initial investment made at the net asset value at the beginning of the period, reinvestment of all distributions at net asset value during the period, and redemption at net asset value on the last day of the period. The returns presented do not reflect the deduction of taxes that a shareholder would pay on Fund distributions or the redemption or sale of Fund shares. Total return is calculated for the time period presented and is not annualized for periods of less than a year. |
| |
| Portfolio turnover is calculated for the time period presented and is not annualized for periods of less than a year and does not include securities received or delivered from processing creations or redemptions and in-kind transactions. |
See Notes to Financial Statements
First Trust Exchange-Traded FundFinancial Highlights (Continued)
For a share outstanding throughout each period First Trust Bloomberg Inflation Sensitive Equity ETF (FTIF)
| | Period
Ended
12/31/2023 (a) |
|
Net asset value, beginning of period | | |
Income from investment operations: | | |
Net investment income (loss) (b) | | |
Net realized and unrealized gain (loss) | | |
Total from investment operations | | |
Distributions paid to shareholders from: | | |
| | |
Net asset value, end of period | | |
| | |
|
Ratios to average net assets/supplemental data: | | |
Net assets, end of period (in 000’s) | | |
Ratio of total expenses to average net assets | | |
Ratio of net investment income (loss) to average net assets | | |
Portfolio turnover rate (e) | | |
| Inception date is March 13, 2023, which is consistent with the commencement of investment operations and is the date the initial creation units were established. |
| Based on average shares outstanding. |
| Total return is calculated assuming an initial investment made at the net asset value at the beginning of the period, reinvestment of all distributions at net asset value during the period, and redemption at net asset value on the last day of the period. The returns presented do not reflect the deduction of taxes that a shareholder would pay on Fund distributions or the redemption or sale of Fund shares. Total return is calculated for the time period presented and is not annualized for periods of less than a year. |
| |
| Portfolio turnover is calculated for the time period presented and is not annualized for periods of less than a year and does not include securities received or delivered from processing creations or redemptions and in-kind transactions. |
See Notes to Financial Statements
Notes to Financial Statements
First Trust Exchange-Traded FundDecember 31, 2024
1. Organization
First Trust Exchange-Traded Fund (the “Trust”) is an open-end management investment company organized as a Massachusetts business trust on August 8, 2003, and is registered with the Securities and Exchange Commission under the Investment Company Act of 1940, as amended (the “1940 Act”).
This report covers the ten funds (each a “Fund” and collectively, the “Funds”) listed below:
First Trust Dow Jones Select MicroCap Index Fund – (NYSE Arca, Inc. (“NYSE Arca”) ticker “FDM”) |
First Trust Morningstar Dividend Leaders Index Fund – (NYSE Arca ticker “FDL”) |
First Trust US Equity Opportunities ETF – (NYSE Arca ticker “FPX”) |
First Trust NYSE® Arca® Biotechnology Index Fund – (NYSE Arca ticker “FBT”) |
First Trust Dow Jones Internet Index Fund – (NYSE Arca ticker “FDN”) |
First Trust Capital Strength® ETF – (Nasdaq, Inc. (“Nasdaq”) ticker “FTCS”) |
First Trust Value Line® Dividend Index Fund – (NYSE Arca ticker “FVD”) |
First Trust Growth StrengthTM ETF – (Nasdaq ticker “FTGS”) |
First Trust Indxx Aerospace & Defense ETF – (NYSE Arca ticker “MISL”) |
First Trust Bloomberg Inflation Sensitive Equity ETF – (NYSE Arca ticker “FTIF”) |
Each of FDN, FDL, FPX, FTGS, MISL and FTIF operates as a non-diversified series of the Trust. Each of FDM, FBT, FTCS and FVD operates as a diversified open-end management investment company as defined in section 5(b) of the 1940 Act. Each Fund represents a separate series of shares of beneficial interest in the Trust. Unlike conventional mutual funds, each Fund issues and redeems shares on a continuous basis at net asset value (“NAV”), only in large blocks of shares known as “Creation Units.” The investment objective of each Fund is to seek investment results that correspond generally to the price and yield (before the Fund’s fees and expenses) of the following indices:
| |
First Trust Dow Jones Select MicroCap Index Fund | Dow Jones Select MicroCap IndexSM |
First Trust Morningstar Dividend Leaders Index Fund | Morningstar® Dividend Leaders IndexSM |
First Trust US Equity Opportunities ETF | |
First Trust NYSE® Arca® Biotechnology Index Fund | NYSE® Arca® Biotechnology Index |
First Trust Dow Jones Internet Index Fund | Dow Jones Internet Composite IndexSM |
First Trust Capital Strength® ETF | The Capital StrengthTM Index |
First Trust Value Line® Dividend Index Fund | Value Line® Dividend Index |
First Trust Growth StrengthTM ETF | The Growth StrengthTM Index |
First Trust Indxx Aerospace & Defense ETF | Indxx US Aerospace & Defense Index |
First Trust Bloomberg Inflation Sensitive Equity ETF | Bloomberg Inflation Sensitive Equity Index |
2. Significant Accounting Policies
The Funds are each considered an investment company and follow accounting and reporting guidance under Financial Accounting Standards Board (“FASB”) Accounting Standards Codification Topic 946, “Financial Services-Investment Companies.” The following is a summary of significant accounting policies consistently followed by the Funds in the preparation of the financial statements. The preparation of the financial statements in accordance with accounting principles generally accepted in the United States of America (“U.S. GAAP”) requires management to make estimates and assumptions that affect the reported amounts and disclosures in the financial statements. Actual results could differ from those estimates.
Each Fund’s NAV is determined daily as of the close of regular trading on the New York Stock Exchange (“NYSE”), normally 4:00 p.m. Eastern time, on each day the NYSE is open for trading. If the NYSE closes early on a valuation day, the NAV is determined as of that time. Each Fund’s NAV is calculated by dividing the value of all assets of each Fund (including accrued interest and dividends), less all liabilities (including accrued expenses and dividends declared but unpaid), by the total number of shares outstanding.
Each Fund’s investments are valued daily at market value or, in the absence of market value with respect to any portfolio securities, at fair value. Market value prices represent readily available market quotations such as last sale or official closing prices from a national
Notes to Financial Statements (Continued)
First Trust Exchange-Traded FundDecember 31, 2024 or foreign exchange (i.e., a regulated market) and are primarily obtained from third-party pricing services. Fair value prices represent any prices not considered market value prices and are either obtained from a third-party pricing service or are determined by the Pricing Committee of the Funds’ investment advisor, First Trust Advisors L.P. (“First Trust” or the “Advisor”), in accordance with valuation procedures approved by the Trust’s Board of Trustees, and in accordance with provisions of the 1940 Act and rules thereunder. Investments valued by the Advisor’s Pricing Committee, if any, are footnoted as such in the footnotes to the Portfolio of Investments. Each Fund’s investments are valued as follows:
Common stocks and other equity securities listed on any national or foreign exchange (excluding Nasdaq and the London Stock Exchange Alternative Investment Market (“AIM”)) are valued at the last sale price on the exchange on which they are principally traded or, for Nasdaq and AIM securities, the official closing price. Securities traded on more than one securities exchange are valued at the last sale price or official closing price, as applicable, at the close of the securities exchange representing the primary exchange for such securities.
Shares of open-end funds are valued based on NAV per share.
Equity securities traded in an over-the-counter market are valued at the close price or the last trade price.
Overnight repurchase agreements are valued at amortized cost when it represents the most appropriate reflection of fair market value.
Certain securities may not be able to be priced by pre-established pricing methods. Such securities may be valued by the Advisor’s Pricing Committee at fair value. These securities generally include, but are not limited to, restricted securities (securities which may not be publicly sold without registration under the Securities Act of 1933, as amended) for which a third-party pricing service is unable to provide a market price; securities whose trading has been formally suspended; a security whose market or fair value price is not available from a pre-established pricing source; a security with respect to which an event has occurred that is likely to materially affect the value of the security after the market has closed but before the calculation of a Fund’s NAV or make it difficult or impossible to obtain a reliable market quotation; and a security whose price, as provided by the third-party pricing service, does not reflect the security’s fair value. As a general principle, the current fair value of a security would appear to be the amount which the owner might reasonably expect to receive for the security upon its current sale. When fair value prices are used, generally they will differ from market quotations or official closing prices on the applicable exchanges. A variety of factors may be considered in determining the fair value of such securities, including, but not limited to, the following:
1)
the last sale price on the exchange on which they are principally traded or, for Nasdaq and AIM securities, the official closing price;
3)
the size of the holding;
4)
the initial cost of the security;
5)
transactions in comparable securities;
6)
price quotes from dealers and/or third-party pricing services;
7)
relationships among various securities;
8)
information obtained by contacting the issuer, analysts, or the appropriate stock exchange;
9)
an analysis of the issuer’s financial statements;
10)
the existence of merger proposals or tender offers that might affect the value of the security; and
11)
other relevant factors.
In addition, differences between the prices used to calculate a Fund’s NAV and the prices used by such Fund’s corresponding index could result in a difference between a Fund’s performance and the performance of its underlying index.
The Funds are subject to fair value accounting standards that define fair value, establish the framework for measuring fair value and provide a three-level hierarchy for fair valuation based upon the inputs to the valuation as of the measurement date. The three levels of the fair value hierarchy are as follows:
Notes to Financial Statements (Continued)
First Trust Exchange-Traded FundDecember 31, 2024 • Level 1 – Level 1 inputs are quoted prices in active markets for identical investments. An active market is a market in which transactions for the investment occur with sufficient frequency and volume to provide pricing information on an ongoing basis.
• Level 2 – Level 2 inputs are observable inputs, either directly or indirectly, and include the following:
o Quoted prices for similar investments in active markets.
o Quoted prices for identical or similar investments in markets that are non-active. A non-active market is a market where there are few transactions for the investment, the prices are not current, or price quotations vary substantially either over time or among market makers, or in which little information is released publicly.
o Inputs other than quoted prices that are observable for the investment (for example, interest rates and yield curves observable at commonly quoted intervals, volatilities, prepayment speeds, loss severities, credit risks, and default rates).
o Inputs that are derived principally from or corroborated by observable market data by correlation or other means.
• Level 3 – Level 3 inputs are unobservable inputs. Unobservable inputs may reflect the reporting entity’s own assumptions about the assumptions that market participants would use in pricing the investment.
The inputs or methodologies used for valuing investments are not necessarily an indication of the risk associated with investing in those investments. A summary of the inputs used to value each Fund’s investments as of December 31, 2024, is included with each Fund’s Portfolio of Investments.
B. Securities Transactions and Investment Income
Securities transactions are recorded as of the trade date. Realized gains and losses from securities transactions are recorded on the identified cost basis. Dividend income is recorded on the ex-dividend date. Interest income, if any, is recorded on the accrual basis.
Withholding taxes and tax reclaims on foreign dividends have been provided for in accordance with each Fund’s understanding of the applicable country’s tax rules and rates.
Distributions received from a Fund’s investments in real estate investment trusts (“REITs”) may be comprised of return of capital, capital gains, and income. The actual character of the amounts received during the year are not known until after the REITs’ fiscal year end. A Fund records the character of distributions received from the REITs during the year based on estimates available. The characterization of distributions received by a Fund may be subsequently revised based on information received from the REITs after their tax reporting periods conclude.
C. Offsetting on the Statements of Assets and Liabilities
Offsetting assets and liabilities requires entities to disclose both gross and net information about instruments and transactions eligible for offset on the Statements of Assets and Liabilities and disclose instruments and transactions subject to master netting or similar agreements. These disclosure requirements are intended to help investors and other financial statement users better assess the effect or potential effect of offsetting arrangements on a Fund’s financial position. The transactions subject to offsetting disclosures are derivative instruments, repurchase agreements and reverse repurchase agreements, and securities borrowing and securities lending transactions.
This disclosure, if applicable, is included within each Fund’s Portfolio of Investments under the heading “Offsetting Assets and Liabilities.” For financial reporting purposes, the Funds do not offset financial assets and financial liabilities that are subject to master netting arrangements (“MNAs”) or similar agreements on the Statements of Assets and Liabilities. MNAs provide the right, in the event of default (including bankruptcy and insolvency), for the non-defaulting counterparty to liquidate the collateral and calculate the net exposure to the defaulting party or request additional collateral.
The Funds may lend securities representing up to 33 1/3% of the value of their total assets to broker-dealers, banks and other institutions to generate additional income. When a Fund loans its portfolio securities, it will receive, at the inception of each loan, collateral equal to at least 102% (for domestic securities) or 105% (for international securities) of the market value of the loaned securities. The collateral amount is valued at the beginning of each business day and is compared to the market value of the loaned securities from the prior business day to determine if additional collateral is required. If additional collateral is required, a request is sent to the borrower. Securities lending involves the risk that the Fund may lose money because the borrower of the Fund’s loaned securities fails to return the securities in a timely manner or at all. The Fund could also lose money in the event of (i) a decline in the value of the collateral provided for the loaned securities, (ii) a decline in the value of any investments made with cash collateral or (iii)
Notes to Financial Statements (Continued)
First Trust Exchange-Traded FundDecember 31, 2024 an increase in the value of the loaned securities if the borrower does not increase the collateral accordingly and the borrower fails to return the securities. These events could also trigger adverse tax consequences for the Funds.
Under the Funds’ Securities Lending Agency Agreement, the securities lending agent will generally bear the risk that a borrower may default on its obligation to return loaned securities. Brown Brother Harriman & Co. (“BBH”) was the securities lending agent for FDM, FBT and FDN prior to June 10, 2024 and for FDL, FTCS and FVD prior to November 14, 2024. The Bank of New York Mellon (“BNY”) acts as the Funds’ securities lending agent and is responsible for executing the lending of the portfolio securities to creditworthy borrowers for FPX. BNY is also the securities lending agent for FDM, FBT and FDN effective June 10, 2024 and for FDL effective November 14, 2024. The Funds, however, will be responsible for the risks associated with the investment of cash collateral. A Fund may lose money on its investment of cash collateral, which may affect its ability to repay the collateral to the borrower without the use of other Fund assets. Each Fund that engages in securities lending receives compensation (net of any rebate and securities lending agent fees) for lending its securities. Compensation can be in the form of fees received from the securities lending agent or dividends or interest earned from the investment of cash collateral. The fees received from the securities lending agent are accrued daily. The dividend and interest earned on the securities loaned is accounted for in the same manner as other dividend and interest income. At December 31, 2024, only FDM, FPX, and FDN had securities in the securities lending program. During the fiscal year ended December 31, 2024, FDM, FDL, FPX, FBT, and FDN participated in the securities lending program.
In the event of a default by a borrower with respect to any loan, BNY will exercise any and all remedies provided under the applicable borrower agreement to make the Funds whole. These remedies include purchasing replacement securities by applying the collateral held from the defaulting broker against the purchase cost of the replacement securities. If, despite such efforts by BNY to exercise these remedies, a Fund sustains losses as a result of a borrower’s default, BNY will indemnify the Fund by purchasing replacement securities at its own expense, or paying the Fund an amount equal to the market value of the replacement securities, subject to certain limitations which are set forth in detail in the Securities Lending Agency Agreement between the Trust on behalf of the Funds and BNY.
Repurchase agreements involve the purchase of securities subject to the seller’s agreement to repurchase the securities at a mutually agreed upon date and price, under the terms of a Master Repurchase Agreement (“MRA”). During the term of a repurchase agreement, the value of the underlying securities held as collateral on behalf of a Fund, including accrued interest, is required to exceed the value of the repurchase agreement, including accrued interest. The underlying securities for all repurchase agreements are held at the Funds’ custodian or designated sub-custodians under tri-party repurchase agreements.
MRAs govern transactions between a Fund and select counterparties. The MRAs contain provisions for, among other things, initiation, income payments, events of default, and maintenance of collateral for repurchase agreements.
Repurchase agreements received for lending securities are collateralized by U.S. Treasury securities. The U.S. Treasury securities are held in a joint custody account at BNY on behalf of the Funds participating in the securities lending program. In the event the counterparty defaults on the repurchase agreement, the U.S. Treasury securities can either be maintained as part of a Fund’s portfolio or sold for cash. A Fund could suffer a loss to the extent that the proceeds from the sale of the underlying collateral held by the Fund are less than the repurchase price and the Fund’s costs associated with the delay and enforcement of the MRA.
While the Funds may invest in repurchase agreements, any repurchase agreements held by the Funds during the fiscal year ended December 31, 2024, were received as collateral for lending securities.
F. Dividends and Distributions to Shareholders
Dividends from net investment income of each Fund, if any, are declared and paid quarterly, or as the Board of Trustees may determine from time to time. Distributions of net realized capital gains earned by each Fund, if any, are distributed at least annually. Each Fund may also designate a portion of the amount paid to redeeming shareholders as a distribution for tax purposes.
Distributions from net investment income and realized capital gains are determined in accordance with federal income tax regulations, which may differ from U.S. GAAP. Certain capital accounts in the financial statements are periodically adjusted for permanent differences in order to reflect their tax character. These permanent differences are primarily due to the varying treatment of income and gain/loss on portfolio securities held by the Funds and have no impact on net assets or NAV per share. Temporary differences, which arise from recognizing certain items of income, expense and gain/loss in different periods for financial statement and tax purposes, will reverse at some time in the future.
Notes to Financial Statements (Continued)
First Trust Exchange-Traded FundDecember 31, 2024 The tax character of distributions paid by each Fund during the fiscal year ended December 31, 2024 were as follows:
| Distributions
paid from
Ordinary
Income | Distributions
paid from
Capital
Gains | Distributions
paid from
Return of
Capital |
First Trust Dow Jones Select MicroCap Index Fund | | | |
First Trust Morningstar Dividend Leaders Index Fund | | | |
First Trust US Equity Opportunities ETF | | | |
First Trust NYSE® Arca® Biotechnology Index Fund | | | |
First Trust Dow Jones Internet Index Fund | | | |
First Trust Capital Strength® ETF | | | |
First Trust Value Line® Dividend Index Fund | | | |
First Trust Growth StrengthTM ETF | | | |
First Trust Indxx Aerospace & Defense ETF | | | |
First Trust Bloomberg Inflation Sensitive Equity ETF | | | |
The tax character of distributions paid by each Fund during the fiscal period ended December 31, 2023 were as follows:
| Distributions
paid from
Ordinary
Income | Distributions
paid from
Capital
Gains | Distributions
paid from
Return of
Capital |
First Trust Dow Jones Select MicroCap Index Fund | | | |
First Trust Morningstar Dividend Leaders Index Fund | | | |
First Trust US Equity Opportunities ETF | | | |
First Trust NYSE® Arca® Biotechnology Index Fund | | | |
First Trust Dow Jones Internet Index Fund | | | |
First Trust Capital Strength® ETF | | | |
First Trust Value Line® Dividend Index Fund | | | |
First Trust Growth StrengthTM ETF | | | |
First Trust Indxx Aerospace & Defense ETF | | | |
First Trust Bloomberg Inflation Sensitive Equity ETF | | | |
As of December 31, 2024, the components of distributable earnings on a tax basis for each Fund were as follows:
| Undistributed
Ordinary
Income | Accumulated
Capital and
Other
Gain (Loss) | Net
Unrealized
Appreciation
(Depreciation) |
First Trust Dow Jones Select MicroCap Index Fund | | | |
First Trust Morningstar Dividend Leaders Index Fund | | | |
First Trust US Equity Opportunities ETF | | | |
First Trust NYSE® Arca® Biotechnology Index Fund | | | |
First Trust Dow Jones Internet Index Fund | | | |
First Trust Capital Strength® ETF | | | |
First Trust Value Line® Dividend Index Fund | | | |
First Trust Growth StrengthTM ETF | | | |
First Trust Indxx Aerospace & Defense ETF | | | |
First Trust Bloomberg Inflation Sensitive Equity ETF | | | |
Each Fund intends to continue to qualify as a regulated investment company by complying with the requirements under Subchapter M of the Internal Revenue Code of 1986, as amended, which includes distributing substantially all of its net investment income and net realized gains to shareholders. Accordingly, no provision has been made for federal and state income taxes. However, due to the
Notes to Financial Statements (Continued)
First Trust Exchange-Traded FundDecember 31, 2024 timing and amount of distributions, each Fund may be subject to an excise tax of 4% of the amount by which approximately 98% of each Fund’s taxable income exceeds the distributions from such taxable income for the calendar year.
The Funds are subject to accounting standards that establish a minimum threshold for recognizing, and a system for measuring, the benefits of a tax position taken or expected to be taken in a tax return. For all Funds except FTGS, MISL, and FTIF, the taxable years ended 2021, 2022, 2023, and 2024 remain open to federal and state audit. For FTGS and MISL, the taxable period ended 2022 and years ended 2023 and 2024 remain open to federal and state audit. For FTIF, the taxable period ended 2023 and year ended 2024 remain open to federal and state audit. As of December 31, 2024, management has evaluated the application of these standards to the Funds and has determined that no provision for income tax is required in the Funds’ financial statements for uncertain tax positions.
Each Fund intends to utilize provisions of the federal income tax laws, which allow it to carry a realized capital loss forward indefinitely following the year of the loss and offset such loss against any future realized capital gains. Each Fund is subject to certain limitations under U.S. tax rules on the use of capital loss carryforwards and net unrealized built-in losses. These limitations apply when there has been a 50% change in ownership. At December 31, 2024, for federal income tax purposes, each applicable Fund had a capital loss carryforward available that is shown in the following table, to the extent provided by regulations, to offset future capital gains. To the extent that these loss carryforwards are used to offset future capital gains, it is probable that the capital gains so offset will not be distributed to each applicable Fund’s shareholders.
| Non-Expiring
Capital Loss
Carryforwards |
First Trust Dow Jones Select MicroCap Index Fund | |
First Trust Morningstar Dividend Leaders Index Fund | |
First Trust US Equity Opportunities ETF | |
First Trust NYSE® Arca® Biotechnology Index Fund | |
First Trust Dow Jones Internet Index Fund | |
First Trust Capital Strength® ETF | |
First Trust Value Line® Dividend Index Fund* | |
First Trust Growth StrengthTM ETF | |
First Trust Indxx Aerospace & Defense ETF | |
First Trust Bloomberg Inflation Sensitive Equity ETF | |
| $11,007,161 of First Trust Value Line® Dividend Index Fund’s non-expiring net capital losses is subject to loss limitation resulting from reorganization activity. This limitation generally reduces the utilization of these losses to a maximum of $364,518 per year. |
During the taxable year ended December 31, 2024, the following Fund utilized capital loss carryforwards in the following amount:
| |
First Trust US Equity Opportunities ETF | |
Certain losses realized during the current fiscal year may be deferred and treated as occurring on the first day of the following fiscal year for federal income tax purposes. For the fiscal year ended December 31, 2024, the Funds had no net late year ordinary or capital losses.
In order to present paid-in capital and accumulated distributable earnings (loss) (which consists of accumulated net investment income (loss), accumulated net realized gain (loss) on investments and net unrealized appreciation (depreciation) on investments) on the Statements of Assets and Liabilities that more closely represent their tax character, certain adjustments have been made to paid-in capital, accumulated net investment income (loss) and accumulated net realized gain (loss) on investments. These adjustments are primarily due to the difference between book and tax treatments of income and gains on various investment securities held by the Funds and in-kind transactions. The results of operations and net assets were not affected by these adjustments. For the fiscal year ended December 31, 2024, the adjustments for each Fund were as follows:
Notes to Financial Statements (Continued)
First Trust Exchange-Traded FundDecember 31, 2024 | Accumulated
Net Investment
Income (Loss) | Accumulated
Net Realized
Gain (Loss)
on Investments | |
First Trust Dow Jones Select MicroCap Index Fund | | | |
First Trust Morningstar Dividend Leaders Index Fund | | | |
First Trust US Equity Opportunities ETF | | | |
First Trust NYSE® Arca® Biotechnology Index Fund | | | |
First Trust Dow Jones Internet Index Fund | | | |
First Trust Capital Strength® ETF | | | |
First Trust Value Line® Dividend Index Fund | | | |
First Trust Growth StrengthTM ETF | | | |
First Trust Indxx Aerospace & Defense ETF | | | |
First Trust Bloomberg Inflation Sensitive Equity ETF | | | |
As of December 31, 2024, the aggregate cost, gross unrealized appreciation, gross unrealized depreciation, and net unrealized appreciation/(depreciation) on investments (including short positions and derivatives, if any) for federal income tax purposes were as follows:
| | Gross Unrealized
Appreciation | Gross Unrealized
(Depreciation) | Net Unrealized
Appreciation
(Depreciation) |
First Trust Dow Jones Select MicroCap Index Fund | | | | |
First Trust Morningstar Dividend Leaders Index Fund | | | | |
First Trust US Equity Opportunities ETF | | | | |
First Trust NYSE® Arca® Biotechnology Index Fund | | | | |
First Trust Dow Jones Internet Index Fund | | | | |
First Trust Capital Strength® ETF | | | | |
First Trust Value Line® Dividend Index Fund | | | | |
First Trust Growth StrengthTM ETF | | | | |
First Trust Indxx Aerospace & Defense ETF | | | | |
First Trust Bloomberg Inflation Sensitive Equity ETF | | | | |
Expenses that are directly related to one of the Funds are charged directly to the respective Fund, except for First Trust Growth StrengthTM ETF, First Trust Indxx Aerospace & Defense ETF, and First Trust Bloomberg Inflation Sensitive Equity ETF (the “Unitary Fee Funds”), for which expenses other than excluded expenses (discussed in Note 3) are paid by the Advisor. General expenses of the Trust are allocated to all the Funds based upon the net assets of each Fund.
First Trust has entered into licensing agreements with each of the following “Licensors” for the respective Funds:
| |
First Trust Dow Jones Select MicroCap Index Fund | S&P Dow Jones Indices, LLC |
First Trust Morningstar Dividend Leaders Index Fund | |
First Trust US Equity Opportunities ETF | |
First Trust NYSE® Arca® Biotechnology Index Fund | |
First Trust Dow Jones Internet Index Fund | S&P Dow Jones Indices, LLC |
First Trust Capital Strength® ETF | |
First Trust Value Line® Dividend Index Fund | Value Line Publishing, LLC |
First Trust Growth StrengthTM ETF | |
First Trust Indxx Aerospace & Defense ETF | |
First Trust Bloomberg Inflation Sensitive Equity ETF | Bloomberg Index Services Limited |
The respective license agreements allow for the use by First Trust of certain trademarks and trade names of the respective Licensors. The Funds are sub-licensees to the applicable license agreement. The respective Funds are required to pay licensing fees, which are shown on the Statements of Operations.
Notes to Financial Statements (Continued)
First Trust Exchange-Traded FundDecember 31, 2024 I. Segment Reporting
Each Fund has adopted FASB Accounting Standards Update 2023-07, Segment Reporting (Topic 280) - Improvements to Reportable Segment Disclosures (“ASU 2023-07”). Adoption of the standard impacted financial statement disclosures only and did not affect each Fund’s financial position or the results of its operations. An operating segment is defined in Topic 280 as a component of a public entity that engages in business activities from which it may recognize revenues and incur expenses, has operating results that are regularly reviewed by the public entity’s chief operating decision maker (“CODM”) to make decisions about resources to be allocated to the segment and assess its performance, and has discrete financial information available. The CODM is the President and Chief Executive Officer of each Fund. Each Fund operates as a single operating segment. Each Fund’s income, expenses, assets, changes in net assets resulting from operations and performance are regularly monitored and assessed as a whole by the CODM responsible for oversight functions of the Fund, using the information presented in the financial statements and financial highlights.
3. Investment Advisory Fee, Affiliated Transactions and Other Fee Arrangements
First Trust, the investment advisor to the Funds, is a limited partnership with one limited partner, Grace Partners of DuPage L.P., and one general partner, The Charger Corporation. The Charger Corporation is an Illinois corporation controlled by James A. Bowen, Chief Executive Officer of First Trust. First Trust is responsible for the selection and ongoing monitoring of the securities in each Fund’s portfolio, managing the Funds’ business affairs and providing certain administrative services necessary for the management of the Funds.
For the Unitary Fee Funds, First Trust is paid an annual unitary management fee based on a percentage of each Fund’s average daily net assets and is responsible for the expenses of such Fund including the cost of transfer agency, custody, fund administration, legal, audit, license and other services, and excluding fee payments under the Investment Management Agreement, distribution and service fees pursuant to a Rule 12b-1 plan, if any, brokerage expenses, acquired fund fees and expenses, taxes, interest, and extraordinary expenses. The annual unitary management fee payable by each Fund to First Trust for these services will be reduced at certain levels of each Fund’s net assets (“breakpoints”) and calculated pursuant to the following schedule:
| | | |
Fund net assets up to and including $2.5 billion | | | |
Fund net assets greater than $2.5 billion up to and including $5 billion | | | |
Fund net assets greater than $5 billion up to and including $7.5 billion | | | |
Fund net assets greater than $7.5 billion up to and including $10 billion | | | |
Fund net assets greater than $10 billion up to and including $15 billion | | | |
Fund net assets greater than $15 billion | | | |
For the First Trust Dow Jones Select MicroCap Index Fund, First Trust Morningstar Dividend Leaders Index Fund, First Trust US Equity Opportunities ETF, First Trust NYSE® Arca® Biotechnology Index Fund, First Trust Dow Jones Internet Index Fund, First Trust Capital Strength® ETF and First Trust Value Line Dividend Index Fund (such Funds, the “Expense Cap Funds”), First Trust is paid an annual management fee based on a percentage of each Fund’s average daily net assets and calculated pursuant to the following schedule:
| | | | | | | |
Fund net assets up to and including $2.5 billion | | | | | | | |
Fund net assets greater than $2.5 billion up to and including $5 billion | | | | | | | |
Fund net assets greater than $5 billion up to and including $7.5 billion | | | | | | | |
Fund net assets greater than $7.5 billion up to and including $10 billion | | | | | | | |
Fund net assets greater than $10 billion up to and including $15 billion | | | | | | | |
Fund net assets greater than $15 billion | | | | | | | |
Notes to Financial Statements (Continued)
First Trust Exchange-Traded FundDecember 31, 2024 For the Expense Cap Funds, the Trust and the Advisor have entered into an Expense Reimbursement and Fee Waiver Agreement (“Agreement”) in which First Trust has agreed to waive fees and/or reimburse Fund expenses to the extent that the operating expenses of each Fund (excluding interest expense, brokerage commissions and other trading expenses, acquired fund fees and expenses, taxes and extraordinary expenses) exceed the following amount as a percentage of average daily net assets per year (the “Expense Cap”). The Expense Cap will be in effect until at least April 30, 2026.
| |
First Trust Dow Jones Select MicroCap Index Fund | |
First Trust Morningstar Dividend Leaders Index Fund | |
First Trust US Equity Opportunities ETF | |
First Trust NYSE® Arca® Biotechnology Index Fund | |
First Trust Dow Jones Internet Index Fund | |
First Trust Capital Strength® ETF | |
First Trust Value Line® Dividend Index Fund | |
The Trust has multiple service agreements with BNY. Under the service agreements, BNY performs custodial, fund accounting, certain administrative services, and transfer agency services for each Fund. As custodian, BNY is responsible for custody of each Fund’s assets. As fund accountant and administrator, BNY is responsible for maintaining the books and records of each Fund’s securities and cash. As transfer agent, BNY is responsible for maintaining shareholder records for each Fund. BNY is a subsidiary of The Bank of New York Mellon Corporation, a financial holding company.
Each Trustee who is not an officer or employee of First Trust, any sub-advisor or any of their affiliates (“Independent Trustees”) is paid a fixed annual retainer that is allocated equally among each fund in the First Trust Fund Complex. Each Independent Trustee is also paid an annual per fund fee that varies based on whether the fund is a closed-end or other actively managed fund, a target outcome fund or an index fund.
Additionally, the Chairs of the Audit Committee, Nominating and Governance Committee and Valuation Committee, the Vice Chair of the Audit Committee, the Lead Independent Trustee and the Vice Lead Independent Trustee are paid annual fees to serve in such capacities, with such compensation allocated pro rata among each fund in the First Trust Fund Complex based on net assets. Independent Trustees are reimbursed for travel and out-of-pocket expenses in connection with all meetings. The Committee Chairs, the Audit Committee Vice Chair, the Lead Independent Trustee and the Vice Lead Independent Trustee rotate periodically in serving in such capacities. The officers and “Interested” Trustee receive no compensation from the Trust for acting in such capacities.
4. Purchases and Sales of Securities
For the fiscal year ended December 31, 2024, the cost of purchases and proceeds from sales of investments for each Fund, excluding short-term investments and in-kind transactions, were as follows:
| | |
First Trust Dow Jones Select MicroCap Index Fund | | |
First Trust Morningstar Dividend Leaders Index Fund | | |
First Trust US Equity Opportunities ETF | | |
First Trust NYSE® Arca® Biotechnology Index Fund | | |
First Trust Dow Jones Internet Index Fund | | |
First Trust Capital Strength® ETF | | |
First Trust Value Line® Dividend Index Fund | | |
First Trust Growth StrengthTM ETF | | |
First Trust Indxx Aerospace & Defense ETF | | |
First Trust Bloomberg Inflation Sensitive Equity ETF | | |
For the fiscal year ended December 31, 2024, the cost of in-kind purchases and proceeds from in-kind sales for each Fund were as follows:
| | |
First Trust Dow Jones Select MicroCap Index Fund | | |
First Trust Morningstar Dividend Leaders Index Fund | | |
Notes to Financial Statements (Continued)
First Trust Exchange-Traded FundDecember 31, 2024 | | |
First Trust US Equity Opportunities ETF | | |
First Trust NYSE® Arca® Biotechnology Index Fund | | |
First Trust Dow Jones Internet Index Fund | | |
First Trust Capital Strength® ETF | | |
First Trust Value Line® Dividend Index Fund | | |
First Trust Growth StrengthTM ETF | | |
First Trust Indxx Aerospace & Defense ETF | | |
First Trust Bloomberg Inflation Sensitive Equity ETF | | |
5. Creations, Redemptions and Transaction Fees
Each Fund generally issues and redeems its shares in primary market transactions through a creation and redemption mechanism and does not sell or redeem individual shares. Instead, financial entities known as “Authorized Participants” have contractual arrangements with a Fund or one of the Fund’s service providers to purchase and redeem Fund shares directly with the Fund in Creation Units. Prior to the start of trading on every business day, a Fund publishes through the National Securities Clearing Corporation the “basket” of securities, cash or other assets that it will accept in exchange for a Creation Unit of the Fund’s shares. An Authorized Participant that wishes to effectuate a creation of a Fund’s shares deposits with the Fund the “basket” of securities, cash or other assets identified by the Fund that day, and then receives the Creation Unit of the Fund’s shares in return for those assets. After purchasing a Creation Unit, the Authorized Participant may continue to hold the Fund’s shares or sell them in the secondary market. The redemption process is the reverse of the purchase process: the Authorized Participant redeems a Creation Unit of a Fund’s shares for a basket of securities, cash or other assets. The combination of the creation and redemption process with secondary market trading in a Fund’s shares and underlying securities provides arbitrage opportunities that are designed to help keep the market price of a Fund’s shares at or close to the NAV per share of the Fund.
Each Fund imposes fees in connection with the purchase of Creation Units. These fees may vary based upon various fact-based circumstances, including, but not limited to, the composition of the securities included in the Creation Unit or the countries in which the transactions are settled. The price for each Creation Unit will equal the daily NAV per share of a Fund times the number of shares in a Creation Unit, plus the fees described above and, if applicable, any operational processing and brokerage costs, transfer fees, stamp taxes and part or all of the spread between the expected bid and offer side of the market related to the securities comprising the creation basket.
Each Fund also imposes fees in connection with the redemption of Creation Units. These fees may vary based upon various fact-based circumstances, including, but not limited to, the composition of the securities included in the Creation Unit or the countries in which the transactions are settled. The price received for each Creation Unit will equal the daily NAV per share of a Fund times the number of shares in a Creation Unit, minus the fees described above and, if applicable, any operational processing and brokerage costs, transfer fees, stamp taxes and part or all of the spread between the expected bid and offer side of the market related to the securities comprising the redemption basket. Investors who use the services of a broker or other such intermediary in addition to an Authorized Participant to effect a redemption of a Creation Unit may also be assessed an amount to cover the cost of such services. The redemption fee charged by a Fund will comply with Rule 22c-2 of the 1940 Act which limits redemption fees to no more than 2% of the value of the shares redeemed.
The Board of Trustees adopted a Distribution and Service Plan pursuant to Rule 12b-1 under the 1940 Act. In accordance with the Rule 12b-1 plan, the Funds are authorized to pay an amount up to 0.25% of their average daily net assets each year to reimburse First Trust Portfolios L.P. (“FTP”), the distributor of the Funds, for amounts expended to finance activities primarily intended to result in the sale of Creation Units or the provision of investor services. FTP may also use this amount to compensate securities dealers or other persons that are Authorized Participants for providing distribution assistance, including broker-dealer and shareholder support and educational and promotional services.
No 12b-1 fees are currently paid by the Funds, and pursuant to a contractual arrangement, no 12b-1 fees will be paid any time before April 30, 2026.
Notes to Financial Statements (Continued)
First Trust Exchange-Traded FundDecember 31, 2024 7. Indemnification
The Trust, on behalf of the Funds, has a variety of indemnification obligations under contracts with its service providers. The Trust’s maximum exposure under these arrangements is unknown. However, the Trust has not had prior claims or losses pursuant to these contracts and expects the risk of loss to be remote.
Management has evaluated the impact of all subsequent events on the Funds through the date the financial statements were issued and has determined that there were no subsequent events requiring recognition or disclosure in the financial statements that have not already been disclosed.
Report of Independent Registered Public Accounting Firm
To the Shareholders and the Board of Trustees of First Trust Exchange-Traded Fund:
Opinion on the Financial Statements and Financial Highlights
We have audited the accompanying statements of assets and liabilities of First Trust Dow Jones Select MicroCap Index Fund, First Trust Morningstar Dividend Leaders Index Fund, First Trust US Equity Opportunities ETF, First Trust NYSE® Arca® Biotechnology Index Fund, First Trust Dow Jones Internet Index Fund, First Trust Capital Strength® ETF, First Trust Value Line® Dividend Index Fund, First Trust Growth StrengthTM ETF, First Trust Indxx Aerospace & Defense ETF, and First Trust Bloomberg Inflation Sensitive Equity ETF (the “Funds”), each a series of First Trust Exchange-Traded Fund, including the portfolios of investments, as of December 31, 2024, the related statements of operations, the statements of changes in net assets, and the financial highlights for the periods indicated in the table below; and the related notes. In our opinion, the financial statements and financial highlights present fairly, in all material respects, the financial position of each of the Funds as of December 31, 2024, and the results of their operations, the changes in their net assets, and the financial highlights for the periods listed in the table below in conformity with accounting principles generally accepted in the United States of America.
Individual Fund
Comprising the Trust | | Statements of
Changes in Net Assets | |
First Trust Dow Jones Select MicroCap Index Fund | For the year ended December 31, 2024 | For the years ended December 31, 2024 and 2023 | For the years ended December 31, 2024, 2023, 2022, 2021, and 2020 |
First Trust Morningstar Dividend Leaders Index Fund |
First Trust US Equity Opportunities ETF |
First Trust NYSE® Arca® Biotechnology Index Fund |
First Trust Dow Jones Internet Index Fund |
First Trust Capital Strength® ETF |
First Trust Value Line® Dividend Index Fund |
First Trust Growth StrengthTM ETF | For the year ended December 31, 2024 | For the years ended December 31, 2024 and 2023 | For the years ended December 31, 2024 and 2023, and for the period from October 25, 2022 (commencement of investment operations) through December 31, 2022 |
First Trust Indxx Aerospace & Defense ETF |
First Trust Bloomberg Inflation Sensitive Equity ETF | For the year ended December 31, 2024 | For the year ended December 31, 2024, and for the period from March 13, 2023 (commencement of investment operations) through December 31, 2023 |
These financial statements and financial highlights are the responsibility of the Funds’ management. Our responsibility is to express an opinion on the Funds’ financial statements and financial highlights based on our audits. We are a public accounting firm registered with the Public Company Accounting Oversight Board (United States) (PCAOB) and are required to be independent with respect to the Funds in accordance with the U.S. federal securities laws and the applicable rules and regulations of the Securities and Exchange Commission and the PCAOB.
We conducted our audits in accordance with the standards of the PCAOB. Those standards require that we plan and perform the audit to obtain reasonable assurance about whether the financial statements and financial highlights are free of material misstatement, whether due to error or fraud. The Funds are not required to have, nor were we engaged to perform, an audit of their internal control over financial reporting. As part of our audits, we are required to obtain an understanding of internal control over financial reporting but not for the purpose of expressing an opinion on the effectiveness of the Funds’ internal control over financial reporting. Accordingly, we express no such opinion.
Our audits included performing procedures to assess the risks of material misstatement of the financial statements and financial highlights, whether due to error or fraud, and performing procedures that respond to those risks. Such procedures included examining, on a test basis, evidence regarding the amounts and disclosures in the financial statements and financial highlights. Our audits also
Report of Independent Registered Public Accounting Firm (Continued)
included evaluating the accounting principles used and significant estimates made by management, as well as evaluating the overall presentation of the financial statements and financial highlights. Our procedures included confirmation of securities owned as of December 31, 2024, by correspondence with the custodian and brokers; when replies were not received from brokers, we performed other auditing procedures. We believe that our audits provide a reasonable basis for our opinion.
/s/ Deloitte & Touche, LLP
Chicago, Illinois
February 21, 2025
We have served as the auditor of one or more First Trust investment companies since 2001.
First Trust Exchange-Traded FundDecember 31, 2024 (Unaudited)
Changes in and Disagreements with Accountants (Item 8 of Form N-CSR)
There were no changes in or disagreements with the Funds’ accountants during the fiscal year ended December 31, 2024.
Proxy Disclosures (Item 9 of Form N-CSR)
There were no matters submitted for vote by shareholders of any Fund during the fiscal year ended December 31, 2024.
Remuneration Paid to Directors, Officers, and Others (Item 10 of Form N-CSR)
For the Expense Cap Funds (as defined in the Notes to Financial Statements), the applicable aggregate remuneration paid by each Fund during the period covered by the report is included in the Statements of Operations. For the Unitary Fee Funds (as defined in the Notes to Financial Statements), Independent Trustees and any member of any advisory board of each Fund are compensated through the unitary management fee paid by each Fund to the advisor and not directly by each Fund. The investment advisory fee paid is included in the Statements of Operations.
Statement Regarding the Basis for the Board’s Approval of Investment Advisory Contract (Item 11 of Form N-CSR)
Remuneration Disclosure Under the Alternative Investment Fund Managers Directive
First Trust Advisors L.P. (“First Trust”) is authorised and regulated by the U.S. Securities and Exchange Commission and is entitled to market shares of certain First Trust Exchange-Traded Fund funds it manages (the “Funds”) in certain member states in the European Economic Area in accordance with the cooperation arrangements in Article 42 of the Alternative Investment Fund Managers Directive (the “Directive”). First Trust is required under the Directive to make disclosures in respect of remuneration. The following disclosures are made in line with First Trust’s interpretation of currently available regulatory guidance on remuneration disclosures.
During the year ended December 31, 2024, the amount of remuneration paid (or to be paid) by First Trust Advisors L.P. in respect of the Funds is $13,153,856. This figure is comprised of $530,198 paid (or to be paid) in fixed compensation and $12,623,658 paid (or to be paid) in variable compensation. There were a total of 24 beneficiaries of the remuneration described above. Those amounts include $6,895,327 paid (or to be paid) to senior management of First Trust Advisors L.P. and $6,258,529 paid (or to be paid) to other employees whose professional activities have a material impact on the risk profiles of First Trust Advisors L.P. or the Funds (collectively, “Code Staff”).
Code Staff included in the aggregated figures disclosed above are rewarded in line with First Trust’s remuneration policy (the “Remuneration Policy”) which is determined and implemented by First Trust’s senior management. The Remuneration Policy reflects First Trust’s ethos of good governance and encapsulates the following principal objectives:
i.
to provide a clear link between remuneration and performance of First Trust and to avoid rewarding for failure;
ii.
to promote sound and effective risk management consistent with the risk profiles of the funds managed by First Trust; and
iii.
to remunerate staff in line with the business strategy, objectives, values and interests of First Trust and the funds managed by First Trust in a manner that avoids conflicts of interest.
First Trust assesses various risk factors which it is exposed to when considering and implementing remuneration for Code Staff and considers whether any potential award to such person(s) would give rise to a conflict of interest. First Trust does not reward failure, or consider the taking of risk or failure to take risk in its remuneration of Code Staff.
First Trust assesses performance for the purposes of determining payments in respect of performance-related remuneration of Code Staff by reference to a broad range of measures including (i) individual performance (using financial and non-financial criteria), and (ii) the overall performance of First Trust. Remuneration is not based upon the performance of the Funds.
The elements of remuneration are balanced between fixed and variable and the senior management sets fixed salaries at a level sufficient to ensure that variable remuneration incentivises and rewards strong individual performance but does not encourage excessive risk taking.
No individual is involved in setting his or her own remuneration.
Other Information (Continued)
First Trust Exchange-Traded FundDecember 31, 2024 (Unaudited) Federal Tax Information
For the taxable year ended December 31, 2024, the following percentages of income dividends paid by the Funds qualify for the dividends received deduction available to corporations:
| Dividends Received
Deduction |
First Trust Dow Jones Select MicroCap Index Fund | |
First Trust Morningstar Dividend Leaders Index Fund | |
First Trust US Equity Opportunities ETF | |
First Trust NYSE® Arca® Biotechnology Index Fund | |
First Trust Dow Jones Internet Index Fund | |
First Trust Capital Strength® ETF | |
First Trust Value Line® Dividend Index Fund | |
First Trust Growth StrengthTM ETF | |
First Trust Indxx Aerospace & Defense ETF | |
First Trust Bloomberg Inflation Sensitive Equity ETF | |
For the taxable year ended December 31, 2024, the following percentages of income dividends paid by the Funds are hereby designated as qualified dividend income:
| |
First Trust Dow Jones Select MicroCap Index Fund | |
First Trust Morningstar Dividend Leaders Index Fund | |
First Trust US Equity Opportunities ETF | |
First Trust NYSE® Arca® Biotechnology Index Fund | |
First Trust Dow Jones Internet Index Fund | |
First Trust Capital Strength® ETF | |
First Trust Value Line® Dividend Index Fund | |
First Trust Growth StrengthTM ETF | |
First Trust Indxx Aerospace & Defense ETF | |
First Trust Bloomberg Inflation Sensitive Equity ETF | |
A portion of each of the Funds’ 2024 ordinary dividends (including short-term capital gains) paid to its shareholders during the fiscal year ended December 31, 2024, may be eligible for the Qualified Business Income (QBI) Deduction under the Internal Revenue Code of 1986, as amended, Section 199A for the aggregate dividends each Fund received from the underlying Real Estate Investment Trusts (REITs) these Funds invest in.
Dow Jones®, Dow Jones Internet Composite IndexSM and Dow Jones Select MicroCap IndexSM (“S&P Dow Jones Indexes”) are products of S&P Dow Jones Indices LLC or its affiliates (“SPDJI”) and have been licensed for use by First Trust. S&P® is a registered trademark of Standard & Poor’s Financial Services LLC (“S&P”); Dow Jones® is a registered trademark of Dow Jones Trademark Holdings LLC (“Dow Jones”); and these trademarks have been licensed for use by SPDJI and sublicensed for certain purposes by First Trust. The Funds are not sponsored, endorsed, sold or promoted by SPDJI, Dow Jones, S&P, or their respective affiliates and none of such parties make any representation regarding the advisability of investing in such products nor do they have any liability for any errors, omissions, or interruptions of the S&P Dow Jones Indexes.
Morningstar® and Morningstar® Dividend Leaders IndexSM are registered trademarks and service marks of Morningstar, Inc. (“Morningstar”) and have been licensed for use by First Trust on behalf of the Fund. The Fund is not sponsored, endorsed, issued, sold or promoted by Morningstar and Morningstar makes no representation regarding the advisability of investing in the Fund.
IPOX® and IPOX®-100 U.S. Index are registered international trademarks and service marks of IPOX® Schuster LLC (“IPOX”) and have been licensed for use by First Trust. The Fund is not sponsored, endorsed, sold or promoted by IPOX, and IPOX makes no
Other Information (Continued)
First Trust Exchange-Traded FundDecember 31, 2024 (Unaudited) representation regarding the advisability of trading in such Fund. IPOX® is an international trademark of IPOX Schuster LLC. Index of Initial Public Offerings (IPOX) and IPOX Derivatives Patent No. US 7,698,197.
Source ICE Data Indices, LLC (“ICE Data”), is used with permission. “NYSE®” and “NYSE® Arca®” are service/trademarks of ICE Data Indices, LLC or its affiliates. These trademarks have been licensed, along with the NYSE® Arca® Biotechnology Index (the “Index”) for use by First Trust Advisors L.P. in connection with First Trust NYSE® Arca® Biotechnology Index Fund (the “Product”). Neither First Trust Advisors L.P., First Trust Exchange-Traded Fund (the “Trust”) nor the Product, as applicable, is sponsored, endorsed, sold or promoted by ICE Data Indices, LLC, its affiliates or its Third Party Suppliers (“ICE Data and its Suppliers”). ICE Data and its Suppliers make no representations or warranties regarding the advisability of investing in securities generally, in the Product particularly, the Trust or the ability of the Index to track general market performance. Past performance of an Index is not an indicator of or a guarantee of future results.
ICE DATA AND ITS SUPPLIERS DISCLAIM ANY AND ALL WARRANTIES AND REPRESENTATIONS, EXPRESS AND/OR IMPLIED, INCLUDING ANY WARRANTIES OF MERCHANTABILITY OR FITNESS FOR A PARTICULAR PURPOSE OR USE, INCLUDING THE INDICES, INDEX DATA AND ANY INFORMATION INCLUDED IN, RELATED TO, OR DERIVED THEREFROM (“INDEX DATA”). ICE DATA AND ITS SUPPLIERS SHALL NOT BE SUBJECT TO ANY DAMAGES OR LIABILITY WITH RESPECT TO THE ADEQUACY, ACCURACY, TIMELINESS OR COMPLETENESS OF THE INDICES AND THE INDEX DATA, WHICH ARE PROVIDED ON AN “AS IS” BASIS AND YOUR USE IS AT YOUR OWN RISK.
Nasdaq®, The Capital StrengthTM Index and The Growth StrengthTM Index are registered trademarks and service marks of Nasdaq, Inc. (together with its affiliates hereinafter referred to as the “Corporations”) and are licensed for use by First Trust. The Funds have not been passed on by the Corporations as to their legality or suitability. The Funds are not issued, endorsed, sold or promoted by the Corporations. THE CORPORATIONS MAKE NO WARRANTIES AND BEAR NO LIABILITY WITH RESPECT TO THE FUNDS.
Value Line® and Value Line® Dividend Index are trademarks or registered trademarks of Value Line, Inc. (“Value Line”) and have been licensed for use for certain purposes by First Trust. The Fund is not sponsored, endorsed, recommended, sold or promoted by Value Line and Value Line makes no representation regarding the advisability of investing in products utilizing such strategy.
Indxx and Indxx US Aerospace & Defense Index (“Index”) are trademarks of Indxx, Inc. (“Indxx”) and have been licensed for use for certain purposes by First Trust. The Fund is not sponsored, endorsed, sold or promoted by Indxx and Indxx makes no representation regarding the advisability of trading in such products. The Index is determined, composed and calculated by Indxx without regard to First Trust or the Fund.
Bloomberg® and Bloomberg Inflation Sensitive Equity Index licensed herein (the “Indices”) are service marks of Bloomberg Finance L.P. and its affiliates, including Bloomberg Index Services Limited (“BISL”), the administrator of the Indices (collectively, “Bloomberg”), and have been licensed for use for certain purposes by First Trust Advisors L.P. (the “Licensee”). Bloomberg is not affiliated with the Licensee, and Bloomberg does not approve, endorse, review, or recommend the financial products referenced herein (the “Financial Products”). Bloomberg does not guarantee the timeliness, accurateness, or completeness of any data or information relating to the Index or the Financial Products.
Annual Financial
Statements and
Other Information |
For the Year Ended
December 31, 2024 |
First Trust Exchange-Traded Fund
First Trust NASDAQ-100 Equal Weighted Index Fund (QQEW) |
First Trust NASDAQ-100-Technology Sector Index Fund (QTEC) |
First Trust NASDAQ-100 Ex-Technology Sector Index Fund (QQXT) |
First Trust NASDAQ® Clean Edge® Green Energy Index Fund (QCLN) |
First Trust S&P REIT Index Fund (FRI) |
First Trust Water ETF (FIW) |
First Trust Natural Gas ETF (FCG) |
First Trust NASDAQ® ABA Community Bank Index Fund (QABA) |
First Trust Exchange-Traded Fund
Annual Financial Statements and Other Information
December 31, 2024
Performance and Risk Disclosure
There is no assurance that any series of First Trust Exchange-Traded Fund (the “Trust”) described in this report (each such series is referred to as a “Fund” and collectively, as the “Funds”) will achieve its investment objective. Each Fund is subject to market risk, which is the possibility that the market values of securities owned by the Fund will decline and that the value of the Fund’s shares may therefore be less than what you paid for them. Accordingly, you can lose money by investing in a Fund.
Performance data quoted represents past performance, which is no guarantee of future results, and current performance may be lower or higher than the figures shown. For the most recent month-end performance figures, please visit www.ftportfolios.com or speak with your financial advisor. Investment returns, net asset value and share price will fluctuate and Fund shares, when sold, may be worth more or less than their original cost.
First Trust Advisors L.P., the Funds’ advisor, may also periodically provide additional information on Fund performance on each Fund’s webpage at www.ftportfolios.com.
This report contains information that may help you evaluate your investment. It includes details about each Fund and presents data that provides insight into each Fund’s performance and investment approach.
The material risks of investing in each Fund are spelled out in its prospectus, statement of additional information, and other Fund regulatory filings.
First Trust NASDAQ-100 Equal Weighted Index Fund (QQEW)Portfolio of InvestmentsDecember 31, 2024
| | |
|
| Aerospace & Defense — 1.0% | |
| Axon Enterprise, Inc. (a) | |
| | |
| | |
| | |
| Coca-Cola Europacific Partners PLC | |
| | |
| Monster Beverage Corp. (a) | |
| | |
| | |
| | |
| | |
| | |
| | |
| Regeneron Pharmaceuticals, Inc. (a) | |
| Vertex Pharmaceuticals, Inc. (a) | |
| | |
| | |
| | |
| | |
| PDD Holdings, Inc., ADR (a) | |
| | |
| | |
| | |
| | |
| | |
| | |
| | |
| | |
| | |
| Consumer Staples Distribution | |
| | |
| Electric Utilities — 4.1% | |
| American Electric Power Co., Inc. | |
| Constellation Energy Corp. | |
| | |
| | |
| | |
| Electronic Equipment, Instruments & Components | |
| | |
| | |
|
| Energy Equipment & Services | |
| | |
| | |
| | |
| | |
| Take-Two Interactive Software, Inc. (a) | |
| Warner Bros. Discovery, Inc. (a) | |
| | |
| Financial Services — 1.0% | |
| PayPal Holdings, Inc. (a) | |
| | |
| | |
| Mondelez International, Inc., Class A | |
| | |
| | |
| | |
| Old Dominion Freight Line, Inc. | |
| | |
| | |
| | |
| GE HealthCare Technologies, Inc. | |
| IDEXX Laboratories, Inc. (a) | |
| Intuitive Surgical, Inc. (a) | |
| | |
| Hotels, Restaurants & Leisure | |
| Airbnb, Inc., Class A (a) | |
| | |
| DoorDash, Inc., Class A (a) | |
| Marriott International, Inc., Class A | |
| | |
| | |
| Industrial Conglomerates — | |
| Honeywell International, Inc. | |
| Interactive Media & Services | |
| | |
| | |
| Meta Platforms, Inc., Class A | |
| | |
See Notes to Financial Statements
First Trust NASDAQ-100 Equal Weighted Index Fund (QQEW)Portfolio of Investments (Continued)December 31, 2024 | | |
COMMON STOCKS (Continued) |
| | |
| Cognizant Technology Solutions Corp., Class A | |
| | |
| | |
| | |
| | |
| | |
| Charter Communications, Inc., Class A (a) | |
| | |
| Trade Desk (The), Inc., Class A (a) | |
| | |
| Oil, Gas & Consumable Fuels | |
| | |
| | |
| | |
| Professional Services — 3.0% | |
| Automatic Data Processing, Inc. | |
| | |
| | |
| | |
| | |
| | |
| Semiconductors & Semiconductor Equipment | |
| Advanced Micro Devices, Inc. (a) | |
| | |
| | |
| ARM Holdings PLC, ADR (a) | |
| | |
| | |
| GLOBALFOUNDRIES, Inc. (a) | |
| | |
| | |
| | |
| | |
| Microchip Technology, Inc. | |
| | |
| | |
| | |
| ON Semiconductor Corp. (a) | |
| | |
| | |
| | |
| | |
|
| | |
| | |
| | |
| AppLovin Corp., Class A (a) | |
| Atlassian Corp., Class A (a) | |
| | |
| Cadence Design Systems, Inc. (a) | |
| CrowdStrike Holdings, Inc., Class A (a) | |
| Datadog, Inc., Class A (a) | |
| | |
| | |
| | |
| MicroStrategy, Inc., Class A (a) | |
| Palantir Technologies, Inc., Class A (a) | |
| Palo Alto Networks, Inc. (a) | |
| | |
| | |
| Workday, Inc., Class A (a) | |
| | |
| | |
| | |
| O’Reilly Automotive, Inc. (a) | |
| | |
| | |
| Technology Hardware, Storage | |
| | |
| Textiles, Apparel & Luxury | |
| Lululemon Athletica, Inc. (a) | |
| | |
| | |
| Wireless Telecommunication | |
| | |
| | |
| | |
MONEY MARKET FUNDS — 0.1% |
| Dreyfus Government Cash Management Fund, Institutional Shares - 4.36% (b) | |
| | |
See Notes to Financial Statements
First Trust NASDAQ-100 Equal Weighted Index Fund (QQEW)Portfolio of Investments (Continued)December 31, 2024 | | |
REPURCHASE AGREEMENTS — 0.0% |
| Bank of America Corp., 4.45% (b), dated 12/31/24, due 01/02/25, with a maturity value of $58,886. Collateralized by U.S. Treasury Securities, interest rates of 0.00% to 3.63%, due 05/31/28 to 05/15/54. The value of the collateral including accrued interest is $60,048. (c) | |
| | |
|
|
| Total Investments — 100.0% | |
| | |
| Net Other Assets and Liabilities — (0.0)% | |
| | |
| Non-income producing security. |
| Rate shown reflects yield as of December 31, 2024. |
| This security serves as collateral for securities on loan. |
Abbreviations throughout the Portfolio of Investments: |
| – American Depositary Receipt |
Valuation InputsA summary of the inputs used to value the Fund’s investments as of December 31, 2024 is as follows (see Note 2A - Portfolio Valuation in the Notes to Financial Statements):
| | | Level 2
Significant
Observable
Inputs | Level 3
Significant
Unobservable
Inputs |
| | | | |
| | | | |
| | | | |
| | | | |
| See Portfolio of Investments for industry breakout. |
The Fund’s investments in repurchase agreements were all subject to an enforceable Master Repurchase Agreement. Repurchase Agreements on a gross basis were as follows:
|
Total gross amount presented on the Statements
of Assets and Liabilities(1) | |
| |
| |
| The amount is included in “Investments, at value” on the Statements of Assets and Liabilities. |
| At December 31, 2024, the value of the collateral received from each seller exceeded the value of the repurchase agreements. |
See Notes to Financial Statements
First Trust NASDAQ-100-Technology Sector Index Fund (QTEC)Portfolio of InvestmentsDecember 31, 2024
| | |
|
| | |
| PDD Holdings, Inc., ADR (a) | |
| Electronic Equipment, Instruments & Components | |
| | |
| Hotels, Restaurants & Leisure | |
| DoorDash, Inc., Class A (a) | |
| Interactive Media & Services | |
| | |
| | |
| Meta Platforms, Inc., Class A | |
| | |
| | |
| Cognizant Technology Solutions Corp., Class A | |
| | |
| | |
| Semiconductors & Semiconductor Equipment | |
| Advanced Micro Devices, Inc. (a) | |
| | |
| | |
| ARM Holdings PLC, ADR (a) | |
| | |
| | |
| GLOBALFOUNDRIES, Inc. (a) (b) | |
| | |
| | |
| | |
| | |
| Microchip Technology, Inc. | |
| | |
| | |
| | |
| ON Semiconductor Corp. (a) | |
| | |
| | |
| | |
| | |
| | |
| | |
| AppLovin Corp., Class A (a) | |
| Atlassian Corp., Class A (a) | |
| | |
| | |
|
| | |
| Cadence Design Systems, Inc. (a) | |
| CrowdStrike Holdings, Inc., Class A (a) | |
| Datadog, Inc., Class A (a) | |
| | |
| | |
| | |
| MicroStrategy, Inc., Class A (a) (b) | |
| Palantir Technologies, Inc., Class A (a) | |
| Palo Alto Networks, Inc. (a) | |
| | |
| | |
| Workday, Inc., Class A (a) | |
| | |
| | |
| Technology Hardware, Storage | |
| | |
| | |
| | |
MONEY MARKET FUNDS — 0.1% |
| Dreyfus Government Cash Management Fund, Institutional Shares - 4.36% (c) | |
| | |
See Notes to Financial Statements
First Trust NASDAQ-100-Technology Sector Index Fund (QTEC)Portfolio of Investments (Continued)December 31, 2024 | | |
REPURCHASE AGREEMENTS — 1.1% |
| Bank of America Corp., 4.45% (c), dated 12/31/24, due 01/02/25, with a maturity value of $21,424,800. Collateralized by U.S. Treasury Securities, interest rates of 0.00% to 3.63%, due 05/31/28 to 05/15/54. The value of the collateral including accrued interest is $21,847,895. (d) | |
| RBC Dominion Securities, Inc., 4.50% (c), dated 12/31/24, due 01/02/25, with a maturity value of $22,307,363. Collateralized by U.S. Treasury Securities, interest rates of 0.00% to 4.88%, due 11/30/25 to 11/15/54. The value of the collateral including accrued interest is $22,747,825. (d) | |
| Total Repurchase Agreements | |
| | |
|
|
| Total Investments — 101.2% | |
| | |
| Net Other Assets and Liabilities — (1.2)% | |
| | |
| Non-income producing security. |
| All or a portion of this security is on loan (see Note 2D - Securities Lending in the Notes to Financial Statements). The remaining contractual maturity of all of the securities lending transactions is overnight and continuous. The aggregate value of such securities is $42,090,094 and the total value of the collateral held by the Fund, including for securities sold and pending settlement, is $43,721,293. |
| Rate shown reflects yield as of December 31, 2024. |
| This security serves as collateral for securities on loan. |
Abbreviations throughout the Portfolio of Investments: |
| – American Depositary Receipt |
Valuation InputsA summary of the inputs used to value the Fund’s investments as of December 31, 2024 is as follows (see Note 2A - Portfolio Valuation in the Notes to Financial Statements):
| | | Level 2
Significant
Observable
Inputs | Level 3
Significant
Unobservable
Inputs |
| | | | |
| | | | |
| | | | |
| | | | |
| See Portfolio of Investments for industry breakout. |
Offsetting Assets and Liabilities
Offsetting assets and liabilities requires entities to disclose both gross and net information about instruments and transactions eligible for offset, and to disclose instruments and transactions subject to master netting or similar agreements (see Note 2C - Offsetting on the Statements of Assets and Liabilities in the Notes to Financial Statements).
The Fund’s loaned securities were all subject to an enforceable Securities Lending Agency Agreement. Securities lent in accordance with the Securities Lending Agency Agreement on a gross basis were as follows:
Securities Lending Agency Agreement |
Total gross amount presented on the Statements of Assets and Liabilities(1) | |
| |
| |
| The amount presented on the Statements of Assets and Liabilities, which is included in “Investments, at value,” is not offset and is shown on a gross basis. |
| At December 31, 2024, the value of the collateral received from each borrower exceeded the value of the related securities loaned. This amount is disclosed on the Portfolio of Investments. |
See Notes to Financial Statements
First Trust NASDAQ-100-Technology Sector Index Fund (QTEC)Portfolio of Investments (Continued)December 31, 2024 The Fund’s investments in repurchase agreements were all subject to an enforceable Master Repurchase Agreement. Repurchase Agreements on a gross basis were as follows:
|
Total gross amount presented on the Statements of Assets and Liabilities(3) | |
| |
| |
| The amount is included in “Investments, at value” on the Statements of Assets and Liabilities. |
| At December 31, 2024, the value of the collateral received from each seller exceeded the value of the repurchase agreements. |
See Notes to Financial Statements
First Trust NASDAQ-100 Ex-Technology Sector Index Fund (QQXT)Portfolio of InvestmentsDecember 31, 2024
| | |
COMMON STOCKS (a) — 99.9% |
| Aerospace & Defense — 1.7% | |
| Axon Enterprise, Inc. (b) | |
| | |
| | |
| | |
| Coca-Cola Europacific Partners PLC | |
| | |
| Monster Beverage Corp. (b) | |
| | |
| | |
| | |
| | |
| | |
| | |
| Regeneron Pharmaceuticals, Inc. (b) | |
| Vertex Pharmaceuticals, Inc. (b) | |
| | |
| | |
| | |
| | |
| | |
| | |
| | |
| | |
| | |
| | |
| | |
| | |
| | |
| Consumer Staples Distribution | |
| | |
| Electric Utilities — 7.2% | |
| American Electric Power Co., Inc. | |
| Constellation Energy Corp. | |
| | |
| | |
| | |
| Energy Equipment & Services | |
| | |
| | |
| | |
| | |
| | |
|
| Entertainment (Continued) | |
| Take-Two Interactive Software, Inc. (b) | |
| Warner Bros. Discovery, Inc. (b) | |
| | |
| Financial Services — 1.8% | |
| PayPal Holdings, Inc. (b) | |
| | |
| | |
| Mondelez International, Inc., Class A | |
| | |
| | |
| | |
| Old Dominion Freight Line, Inc. | |
| | |
| | |
| | |
| GE HealthCare Technologies, Inc. | |
| IDEXX Laboratories, Inc. (b) | |
| Intuitive Surgical, Inc. (b) | |
| | |
| Hotels, Restaurants & Leisure | |
| Airbnb, Inc., Class A (b) | |
| | |
| Marriott International, Inc., Class A | |
| | |
| | |
| Industrial Conglomerates — | |
| Honeywell International, Inc. | |
| | |
| | |
| | |
| Charter Communications, Inc., Class A (b) | |
| | |
| Trade Desk (The), Inc., Class A (b) | |
| | |
| Oil, Gas & Consumable Fuels | |
| | |
| | |
| | |
See Notes to Financial Statements
First Trust NASDAQ-100 Ex-Technology Sector Index Fund (QQXT)Portfolio of Investments (Continued)December 31, 2024 | | |
COMMON STOCKS (a) (Continued) |
| Professional Services — 5.4% | |
| Automatic Data Processing, Inc. | |
| | |
| | |
| | |
| | |
| | |
| | |
| O’Reilly Automotive, Inc. (b) | |
| | |
| | |
| Textiles, Apparel & Luxury | |
| Lululemon Athletica, Inc. (b) | |
| | |
| | |
| Wireless Telecommunication | |
| | |
| | |
| | |
MONEY MARKET FUNDS — 0.1% |
| Morgan Stanley Institutional Liquidity Funds - Treasury Portfolio - Institutional Class - 4.37% (c) | |
| | |
|
|
| Total Investments — 100.0% | |
| | |
| Net Other Assets and Liabilities — (0.0)% | |
| | |
| The industry allocation is based on Standard & Poor’s Global Industry Classification Standard (GICS), and is different than the industry sector classification system used by the Index to select securities, which is the Industry Classification Benchmark (ICB) system, which is maintained by FTSE International Limited. |
| Non-income producing security. |
| Rate shown reflects yield as of December 31, 2024. |
Abbreviations throughout the Portfolio of Investments: |
| – American Depositary Receipt |
Valuation InputsA summary of the inputs used to value the Fund’s investments as of December 31, 2024 is as follows (see Note 2A - Portfolio Valuation in the Notes to Financial Statements):
| | | Level 2
Significant
Observable
Inputs | Level 3
Significant
Unobservable
Inputs |
| | | | |
| | | | |
| | | | |
| See Portfolio of Investments for industry breakout. |
See Notes to Financial Statements
First Trust NASDAQ® Clean Edge® Green Energy Index Fund (QCLN)Portfolio of InvestmentsDecember 31, 2024
| | |
|
| | |
| | |
| Lucid Group, Inc. (a) (b) | |
| Polestar Automotive Holding UK PLC, Class A, ADR (a) (b) | |
| Rivian Automotive, Inc., Class A (a) (b) | |
| | |
| | |
| | |
| | |
| | |
| Sociedad Quimica y Minera de Chile S.A., ADR (b) | |
| | |
| | |
| LanzaTech Global, Inc. (a) | |
| Construction & Engineering | |
| Ameresco, Inc., Class A (a) | |
| Electrical Equipment — 20.1% | |
| | |
| American Superconductor Corp. (a) | |
| Array Technologies, Inc. (a) | |
| Ballard Power Systems, Inc. (a) | |
| Blink Charging Co. (a) (b) | |
| Bloom Energy Corp., Class A (a) (b) | |
| ChargePoint Holdings, Inc. (a) (b) | |
| | |
| Eos Energy Enterprises, Inc. (a) (b) | |
| | |
| | |
| NEXTracker, Inc., Class A (a) | |
| | |
| Shoals Technologies Group, Inc., Class A (a) | |
| | |
| TPI Composites, Inc. (a) (b) | |
| | |
| | |
| | |
| | |
|
| Electronic Equipment, Instruments & Components | |
| Advanced Energy Industries, Inc. | |
| | |
| | |
| Financial Services — 1.9% | |
| HA Sustainable Infrastructure Capital, Inc. | |
| Independent Power and Renewable Electricity | |
| | |
| Brookfield Renewable Partners, L.P. (c) | |
| Clearway Energy, Inc., Class C | |
| Montauk Renewables, Inc. (a) | |
| NextEra Energy Partners, L.P. (c) (d) | |
| | |
| ReNew Energy Global PLC, Class A (a) | |
| Sunnova Energy International, Inc. (a) (b) | |
| | |
| | |
| | |
| Oil, Gas & Consumable Fuels | |
| Clean Energy Fuels Corp. (a) | |
| Professional Services — 0.3% | |
| | |
| Semiconductors & Semiconductor Equipment | |
| Allegro MicroSystems, Inc. (a) | |
| | |
| | |
| Navitas Semiconductor Corp. (a) (b) | |
| ON Semiconductor Corp. (a) | |
| | |
| SolarEdge Technologies, Inc. (a) (b) | |
| | |
| | |
| | |
| | |
| | |
| | |
| | |
See Notes to Financial Statements
First Trust NASDAQ® Clean Edge® Green Energy Index Fund (QCLN)Portfolio of Investments (Continued)December 31, 2024 | | |
MONEY MARKET FUNDS — 0.1% |
| Dreyfus Government Cash Management Fund, Institutional Shares - 4.36% (e) | |
| | |
| | |
REPURCHASE AGREEMENTS — 8.5% |
| Bank of America Corp., 4.45% (e), dated 12/31/24, due 01/02/25, with a maturity value of $22,885,835. Collateralized by U.S. Treasury Securities, interest rates of 0.00% to 3.63%, due 05/31/28 to 05/15/54. The value of the collateral including accrued interest is $23,337,783. (f) | |
| RBC Dominion Securities, Inc., 4.50% (e), dated 12/31/24, due 01/02/25, with a maturity value of $23,829,488. Collateralized by U.S. Treasury Securities, interest rates of 0.00% to 4.88%, due 11/30/25 to 11/15/54. The value of the collateral including accrued interest is $24,300,004. (f) | |
| Total Repurchase Agreements | |
| | |
|
|
| Total Investments — 108.4% | |
| | |
| Net Other Assets and Liabilities — (8.4)% | |
| | |
| Non-income producing security. |
| All or a portion of this security is on loan (see Note 2D - Securities Lending in the Notes to Financial Statements). The remaining contractual maturity of all of the securities lending transactions is overnight and continuous. The aggregate value of such securities is $43,582,953 and the total value of the collateral held by the Fund, including for securities sold and pending settlement, is $46,703,711. |
| Security is a Master Limited Partnership (“MLP”). |
| This security is taxed as a “C” corporation for federal income tax purposes. |
| Rate shown reflects yield as of December 31, 2024. |
| This security serves as collateral for securities on loan. |
Abbreviations throughout the Portfolio of Investments: |
| – American Depositary Receipt |
Valuation InputsA summary of the inputs used to value the Fund’s investments as of December 31, 2024 is as follows (see Note 2A - Portfolio Valuation in the Notes to Financial Statements):
| | | Level 2
Significant
Observable
Inputs | Level 3
Significant
Unobservable
Inputs |
| | | | |
| | | | |
| | | | |
| | | | |
| See Portfolio of Investments for industry breakout. |
Offsetting Assets and Liabilities
Offsetting assets and liabilities requires entities to disclose both gross and net information about instruments and transactions eligible for offset, and to disclose instruments and transactions subject to master netting or similar agreements (see Note 2C - Offsetting on the Statements of Assets and Liabilities in the Notes to Financial Statements).
The Fund’s loaned securities were all subject to an enforceable Securities Lending Agency Agreement. Securities lent in accordance with the Securities Lending Agency Agreement on a gross basis were as follows:
Securities Lending Agency Agreement |
Total gross amount presented on the Statements of Assets and Liabilities(1) | |
| |
| |
| The amount presented on the Statements of Assets and Liabilities, which is included in “Investments, at value,” is not offset and is shown on a gross basis. |
| At December 31, 2024, the value of the collateral received from each borrower exceeded the value of the related securities loaned. This amount is disclosed on the Portfolio of Investments. |
See Notes to Financial Statements
First Trust NASDAQ® Clean Edge® Green Energy Index Fund (QCLN)Portfolio of Investments (Continued)December 31, 2024 The Fund’s investments in repurchase agreements were all subject to an enforceable Master Repurchase Agreement. Repurchase Agreements on a gross basis were as follows:
|
Total gross amount presented on the Statements of Assets and Liabilities(3) | |
| |
| |
| The amount is included in “Investments, at value” on the Statements of Assets and Liabilities. |
| At December 31, 2024, the value of the collateral received from each seller exceeded the value of the repurchase agreements. |
See Notes to Financial Statements
First Trust S&P REIT Index Fund (FRI)Portfolio of InvestmentsDecember 31, 2024
| | |
|
| Data Center REITs — 12.5% | |
| Digital Realty Trust, Inc. | |
| | |
| | |
| | |
| Alexander & Baldwin, Inc. | |
| Alpine Income Property Trust, Inc. | |
| American Assets Trust, Inc. | |
| Armada Hoffler Properties, Inc. | |
| Broadstone Net Lease, Inc. | |
| | |
| Empire State Realty Trust, Inc., Class A | |
| Essential Properties Realty Trust, Inc. | |
| Gladstone Commercial Corp. | |
| | |
| | |
| NexPoint Diversified Real Estate Trust | |
| One Liberty Properties, Inc. | |
| | |
| | |
| Health Care REITs — 14.7% | |
| Alexandria Real Estate Equities, Inc. | |
| American Healthcare REIT, Inc. | |
| | |
| Community Healthcare Trust, Inc. | |
| Diversified Healthcare Trust | |
| Global Medical REIT, Inc. | |
| Healthcare Realty Trust, Inc. | |
| Healthpeak Properties, Inc. | |
| | |
| Medical Properties Trust, Inc. | |
| National Health Investors, Inc. | |
| Omega Healthcare Investors, Inc. | |
| Sabra Health Care REIT, Inc. | |
| | |
| Universal Health Realty Income Trust | |
| | |
| | |
| | |
| Hotel & Resort REITs — 3.1% | |
| Apple Hospitality REIT, Inc. | |
| Braemar Hotels & Resorts, Inc. | |
| | |
| DiamondRock Hospitality Co. | |
| | |
|
| Hotel & Resort REITs (Continued) | |
| Host Hotels & Resorts, Inc. | |
| Park Hotels & Resorts, Inc. | |
| | |
| | |
| Ryman Hospitality Properties, Inc. | |
| | |
| Summit Hotel Properties, Inc. | |
| Sunstone Hotel Investors, Inc. | |
| Xenia Hotels & Resorts, Inc. | |
| | |
| | |
| Americold Realty Trust, Inc. | |
| EastGroup Properties, Inc. | |
| First Industrial Realty Trust, Inc. | |
| Industrial Logistics Properties Trust | |
| Innovative Industrial Properties, Inc. | |
| | |
| | |
| Plymouth Industrial REIT, Inc. | |
| | |
| Rexford Industrial Realty, Inc. | |
| | |
| | |
| | |
| | |
| Apartment Investment and Management Co., Class A (a) | |
| AvalonBay Communities, Inc. | |
| | |
| | |
| | |
| | |
| | |
| Essex Property Trust, Inc. | |
| Independence Realty Trust, Inc. | |
| Mid-America Apartment Communities, Inc. | |
| NexPoint Residential Trust, Inc. | |
| | |
| | |
| | |
| | |
| | |
| | |
| | |
| | |
See Notes to Financial Statements
First Trust S&P REIT Index Fund (FRI)Portfolio of Investments (Continued)December 31, 2024 | | |
COMMON STOCKS (Continued) |
| | |
| | |
| | |
| Easterly Government Properties, Inc. | |
| | |
| Franklin Street Properties Corp. | |
| Highwoods Properties, Inc. | |
| Hudson Pacific Properties, Inc. | |
| | |
| | |
| NET Lease Office Properties (a) | |
| Office Properties Income Trust | |
| | |
| | |
| | |
| Piedmont Office Realty Trust, Inc., Class A | |
| Postal Realty Trust, Inc., Class A | |
| | |
| | |
| | |
| Other Specialized REITs — | |
| | |
| | |
| Four Corners Property Trust, Inc. | |
| Gaming and Leisure Properties, Inc. | |
| | |
| | |
| Lamar Advertising Co., Class A | |
| | |
| | |
| | |
| | |
| | |
| | |
| | |
| | |
| | |
| Brixmor Property Group, Inc. | |
| CBL & Associates Properties, Inc. | |
| Curbline Properties Corp. | |
| Federal Realty Investment Trust | |
| | |
| InvenTrust Properties Corp. | |
| | |
| | |
| | |
| | |
|
| | |
| | |
| | |
| Phillips Edison & Co., Inc. | |
| | |
| | |
| Retail Opportunity Investments Corp. | |
| | |
| Simon Property Group, Inc. | |
| | |
| | |
| | |
| | |
| | |
| Self-Storage REITs — 7.9% | |
| | |
| Extra Space Storage, Inc. | |
| National Storage Affiliates Trust | |
| | |
| | |
| Single-Family Residential | |
| American Homes 4 Rent, Class A | |
| Equity LifeStyle Properties, Inc. | |
| | |
| | |
| | |
| | |
| | |
| | |
MONEY MARKET FUNDS — 0.3% |
| Morgan Stanley Institutional Liquidity Funds - Treasury Portfolio - Institutional Class - 4.37% (b) | |
| | |
|
|
| Total Investments — 99.7% | |
| | |
| Net Other Assets and Liabilities — 0.3% | |
| | |
| Non-income producing security. |
| Rate shown reflects yield as of December 31, 2024. |
Abbreviations throughout the Portfolio of Investments: |
| – Real Estate Investment Trusts |
See Notes to Financial Statements
First Trust S&P REIT Index Fund (FRI)Portfolio of Investments (Continued)December 31, 2024
Valuation InputsA summary of the inputs used to value the Fund’s investments as of December 31, 2024 is as follows (see Note 2A - Portfolio Valuation in the Notes to Financial Statements):
| | | Level 2
Significant
Observable
Inputs | Level 3
Significant
Unobservable
Inputs |
| | | | |
| | | | |
| | | | |
| See Portfolio of Investments for sub-industry breakout. |
See Notes to Financial Statements
First Trust Water ETF (FIW)Portfolio of InvestmentsDecember 31, 2024
| | |
|
| | |
| | |
| | |
| | |
| Advanced Drainage Systems, Inc. | |
| Zurn Elkay Water Solutions Corp. | |
| | |
| | |
| | |
| | |
| | |
| | |
| Montrose Environmental Group, Inc. (a) | |
| | |
| | |
| | |
| Construction & Engineering | |
| | |
| | |
| | |
| | |
| Electronic Equipment, Instruments & Components | |
| | |
| | |
| | |
| | |
| IDEXX Laboratories, Inc. (a) | |
| Life Sciences Tools & Services | |
| Agilent Technologies, Inc. | |
| | |
| | |
| | |
| Franklin Electric Co., Inc. | |
| | |
| | |
| | |
| Mueller Water Products, Inc., Class A | |
| | |
| | |
|
| | |
| Watts Water Technologies, Inc., Class A | |
| | |
| | |
| | |
| Algonquin Power & Utilities Corp. | |
| | |
| | |
| | |
| Core & Main, Inc., Class A (a) | |
| Ferguson Enterprises, Inc. | |
| | |
| | |
| American States Water Co. | |
| American Water Works Co., Inc. | |
| California Water Service Group | |
| Cia de Saneamento Basico do Estado de Sao Paulo SABESP, ADR | |
| Essential Utilities, Inc. | |
| | |
| | |
| | |
| | |
| | |
MONEY MARKET FUNDS — 0.1% |
| Morgan Stanley Institutional Liquidity Funds - Treasury Portfolio - Institutional Class - 4.37% (c) | |
| | |
See Notes to Financial Statements
First Trust Water ETF (FIW)Portfolio of Investments (Continued)December 31, 2024 | | |
REPURCHASE AGREEMENTS — 0.0% |
| Bank of America Corp., 4.45% (c), dated 12/31/24, due 01/02/25, with a maturity value of $168,637. Collateralized by U.S. Treasury Securities, interest rates of 0.00% to 3.63%, due 05/31/28 to 05/15/54. The value of the collateral including accrued interest is $171,967. (d) | |
| | |
|
|
| Total Investments — 100.0% | |
| | |
| Net Other Assets and Liabilities — 0.0% | |
| | |
| Non-income producing security. |
| All or a portion of this security is on loan (see Note 2D - Securities Lending in the Notes to Financial Statements). The remaining contractual maturity of all of the securities lending transactions is overnight and continuous. The aggregate value of such securities is $164,745 and the total value of the collateral held by the Fund, including for securities sold and pending settlement, is $168,595. |
| Rate shown reflects yield as of December 31, 2024. |
| This security serves as collateral for securities on loan. |
Abbreviations throughout the Portfolio of Investments: |
| – American Depositary Receipt |
Valuation InputsA summary of the inputs used to value the Fund’s investments as of December 31, 2024 is as follows (see Note 2A - Portfolio Valuation in the Notes to Financial Statements):
| | | Level 2
Significant
Observable
Inputs | Level 3
Significant
Unobservable
Inputs |
| | | | |
| | | | |
| | | | |
| | | | |
| See Portfolio of Investments for industry breakout. |
Offsetting Assets and Liabilities
Offsetting assets and liabilities requires entities to disclose both gross and net information about instruments and transactions eligible for offset, and to disclose instruments and transactions subject to master netting or similar agreements (see Note 2C - Offsetting on the Statements of Assets and Liabilities in the Notes to Financial Statements).
The Fund’s loaned securities were all subject to an enforceable Securities Lending Agency Agreement. Securities lent in accordance with the Securities Lending Agency Agreement on a gross basis were as follows:
Securities Lending Agency Agreement |
Total gross amount presented on the Statements of Assets and Liabilities(1) | |
| |
| |
| The amount presented on the Statements of Assets and Liabilities, which is included in “Investments, at value,” is not offset and is shown on a gross basis. |
| At December 31, 2024, the value of the collateral received from each borrower exceeded the value of the related securities loaned. This amount is disclosed on the Portfolio of Investments. |
The Fund’s investments in repurchase agreements were all subject to an enforceable Master Repurchase Agreement. Repurchase Agreements on a gross basis were as follows:
|
Total gross amount presented on the Statements of Assets and Liabilities(3) | |
| |
| |
| The amount is included in “Investments, at value” on the Statements of Assets and Liabilities. |
| At December 31, 2024, the value of the collateral received from each seller exceeded the value of the repurchase agreements. |
See Notes to Financial Statements
First Trust Natural Gas ETF (FCG)Portfolio of InvestmentsDecember 31, 2024
| | |
|
| | |
| | |
| Oil, Gas & Consumable Fuels | |
| | |
| Antero Resources Corp. (a) | |
| | |
| | |
| California Resources Corp. | |
| | |
| | |
| | |
| Comstock Resources, Inc. (a) (b) | |
| | |
| | |
| Crescent Energy Co., Class A | |
| | |
| | |
| | |
| | |
| | |
| Granite Ridge Resources, Inc. | |
| Gulfport Energy Corp. (a) | |
| Hess Midstream, L.P., Class A (c) (d) | |
| | |
| Magnolia Oil & Gas Corp., Class A | |
| | |
| | |
| | |
| | |
| Occidental Petroleum Corp. | |
| | |
| | |
| | |
| Riley Exploration Permian, Inc. | |
| | |
| | |
| | |
| | |
| Vermilion Energy, Inc. (b) | |
| | |
| | |
| | |
| | |
|
| Oil, Gas & Consumable Fuels (Continued) | |
| Western Midstream Partners, L.P. (d) | |
| Woodside Energy Group Ltd., ADR (b) | |
| | |
| | |
| | |
MONEY MARKET FUNDS — 0.1% |
| Morgan Stanley Institutional Liquidity Funds - Treasury Portfolio - Institutional Class - 4.37% (e) | |
| | |
| | |
REPURCHASE AGREEMENTS — 1.7% |
| Mizuho Financial Group, Inc., 4.45% (e), dated 12/31/24, due 01/02/25, with a maturity value of $3,525,838. Collateralized by U.S. Treasury Securities, interest rates of 0.63% to 5.00%, due 10/31/25 to 06/30/30. The value of the collateral including accrued interest is $3,595,468. (f) | |
| RBC Dominion Securities, Inc., 4.50% (e), dated 12/31/24, due 01/02/25, with a maturity value of $3,387,204. Collateralized by U.S. Treasury Securities, interest rates of 0.00% to 4.88%, due 11/30/25 to 11/15/54. The value of the collateral including accrued interest is $3,454,084. (f) | |
| Total Repurchase Agreements | |
| | |
|
|
| Total Investments — 101.7% | |
| | |
| Net Other Assets and Liabilities — (1.7)% | |
| | |
See Notes to Financial Statements
First Trust Natural Gas ETF (FCG)Portfolio of Investments (Continued)December 31, 2024 | Non-income producing security. |
| All or a portion of this security is on loan (see Note 2D - Securities Lending in the Notes to Financial Statements). The remaining contractual maturity of all of the securities lending transactions is overnight and continuous. The aggregate value of such securities is $6,834,573 and the total value of the collateral held by the Fund, including for securities sold and pending settlement, is $6,911,324. |
| This security is taxed as a “C” corporation for federal income tax purposes. |
| Security is a Master Limited Partnership (“MLP”). |
| Rate shown reflects yield as of December 31, 2024. |
| This security serves as collateral for securities on loan. |
Abbreviations throughout the Portfolio of Investments: |
| – American Depositary Receipt |
Valuation InputsA summary of the inputs used to value the Fund’s investments as of December 31, 2024 is as follows (see Note 2A - Portfolio Valuation in the Notes to Financial Statements):
| | | Level 2
Significant
Observable
Inputs | Level 3
Significant
Unobservable
Inputs |
| | | | |
| | | | |
| | | | |
| | | | |
| See Portfolio of Investments for industry breakout. |
Offsetting Assets and Liabilities
Offsetting assets and liabilities requires entities to disclose both gross and net information about instruments and transactions eligible for offset, and to disclose instruments and transactions subject to master netting or similar agreements (see Note 2C - Offsetting on the Statements of Assets and Liabilities in the Notes to Financial Statements).
The Fund’s loaned securities were all subject to an enforceable Securities Lending Agency Agreement. Securities lent in accordance with the Securities Lending Agency Agreement on a gross basis were as follows:
Securities Lending Agency Agreement |
Total gross amount presented on the Statements of Assets and Liabilities(1) | |
| |
| |
| The amount presented on the Statements of Assets and Liabilities, which is included in “Investments, at value,” is not offset and is shown on a gross basis. |
| At December 31, 2024, the value of the collateral received from each borrower exceeded the value of the related securities loaned. This amount is disclosed on the Portfolio of Investments. |
The Fund’s investments in repurchase agreements were all subject to an enforceable Master Repurchase Agreement. Repurchase Agreements on a gross basis were as follows:
|
Total gross amount presented on the Statements of Assets and Liabilities(3) | |
| |
| |
| The amount is included in “Investments, at value” on the Statements of Assets and Liabilities. |
| At December 31, 2024, the value of the collateral received from each seller exceeded the value of the repurchase agreements. |
See Notes to Financial Statements
First Trust NASDAQ® ABA Community Bank Index Fund (QABA)Portfolio of InvestmentsDecember 31, 2024
| | |
|
| | |
| | |
| | |
| Amalgamated Financial Corp. | |
| | |
| | |
| | |
| | |
| | |
| | |
| | |
| | |
| | |
| | |
| | |
| Bridgewater Bancshares, Inc. (a) | |
| | |
| Burke & Herbert Financial Services Corp. | |
| Business First Bancshares, Inc. | |
| | |
| | |
| | |
| | |
| Capital City Bank Group, Inc. | |
| Capitol Federal Financial, Inc. | |
| Carter Bankshares, Inc. (a) | |
| | |
| | |
| ChoiceOne Financial Services, Inc. | |
| Citizens Financial Services, Inc. | |
| | |
| | |
| | |
| Coastal Financial Corp. (a) | |
| Columbia Financial, Inc. (a) | |
| Commerce Bancshares, Inc. | |
| Community Trust Bancorp, Inc. | |
| Community West Bancshares | |
| | |
| | |
| Dime Community Bancshares, Inc. | |
| | |
| | |
| | |
| Enterprise Financial Services Corp. | |
| Esquire Financial Holdings, Inc. | |
| | |
|
| | |
| Farmers & Merchants Bancorp, Inc. | |
| Farmers National Banc Corp. | |
| Financial Institutions, Inc. | |
| | |
| | |
| | |
| First Business Financial Services, Inc. | |
| First Community Bankshares, Inc. | |
| | |
| First Financial Bankshares, Inc. | |
| | |
| First Financial Northwest, Inc. | |
| | |
| | |
| First Interstate BancSystem, Inc., Class A | |
| | |
| First Mid Bancshares, Inc. | |
| First of Long Island (The) Corp. | |
| | |
| First Western Financial, Inc. (a) | |
| | |
| | |
| | |
| | |
| German American Bancorp, Inc. | |
| Great Southern Bancorp, Inc. | |
| | |
| | |
| | |
| | |
| | |
| | |
| Hingham Institution for Savings (The) (b) | |
| | |
| | |
| HomeTrust Bancshares, Inc. | |
| | |
| | |
| | |
| | |
| International Bancshares Corp. | |
| | |
| | |
| | |
| | |
| Metrocity Bankshares, Inc. | |
| | |
See Notes to Financial Statements
First Trust NASDAQ® ABA Community Bank Index Fund (QABA)Portfolio of Investments (Continued)December 31, 2024 | | |
COMMON STOCKS (Continued) |
| | |
| Midland States Bancorp, Inc. | |
| MidWestOne Financial Group, Inc. | |
| | |
| | |
| | |
| | |
| Northeast Community Bancorp, Inc. | |
| | |
| | |
| Northwest Bancshares, Inc. | |
| OceanFirst Financial Corp. | |
| | |
| Orange County Bancorp, Inc. | |
| Orrstown Financial Services, Inc. | |
| Pacific Premier Bancorp, Inc. | |
| | |
| | |
| Peapack-Gladstone Financial Corp. | |
| | |
| Peoples Financial Services Corp. | |
| | |
| Ponce Financial Group, Inc. (a) | |
| | |
| | |
| | |
| | |
| Red River Bancshares, Inc. | |
| Republic Bancorp, Inc., Class A | |
| | |
| Sandy Spring Bancorp, Inc. | |
| Seacoast Banking Corp. of Florida | |
| | |
| | |
| Simmons First National Corp., Class A | |
| South Plains Financial, Inc. | |
| Southern First Bancshares, Inc. (a) | |
| Southern Missouri Bancorp, Inc. | |
| Southern States Bancshares, Inc. | |
| Stock Yards Bancorp, Inc. (b) | |
| Texas Capital Bancshares, Inc. (a) | |
| | |
| Third Coast Bancshares, Inc. (a) | |
| | |
| | |
| | |
|
| | |
| Triumph Financial, Inc. (a) | |
| | |
| | |
| | |
| | |
| | |
| | |
| | |
| | |
| | |
| Washington Trust Bancorp, Inc. | |
| | |
| | |
| | |
| | |
| | |
| | |
| Financial Services — 1.4% | |
| Cass Information Systems, Inc. | |
| | |
| | |
| Waterstone Financial, Inc. | |
| | |
| | |
| | |
MONEY MARKET FUNDS — 0.0% |
| Dreyfus Government Cash Management Fund, Institutional Shares - 4.36% (c) | |
| | |
See Notes to Financial Statements
First Trust NASDAQ® ABA Community Bank Index Fund (QABA)Portfolio of Investments (Continued)December 31, 2024 | | |
REPURCHASE AGREEMENTS — 1.2% |
| Mizuho Financial Group, Inc., 4.45% (c), dated 12/31/24, due 01/02/25, with a maturity value of $1,000,247. Collateralized by U.S. Treasury Securities, interest rates of 0.63% to 5.00%, due 10/31/25 to 06/30/30. The value of the collateral including accrued interest is $1,020,000. (d) | |
| RBC Dominion Securities, Inc., 4.50% (c), dated 12/31/24, due 01/02/25, with a maturity value of $462,417. Collateralized by U.S. Treasury Securities, interest rates of 0.00% to 4.88%, due 11/30/25 to 11/15/54. The value of the collateral including accrued interest is $471,547. (d) | |
| Total Repurchase Agreements | |
| | |
|
|
| Total Investments — 101.1% | |
| | |
| Net Other Assets and Liabilities — (1.1)% | |
| | |
| Non-income producing security. |
| All or a portion of this security is on loan (see Note 2D - Securities Lending in the Notes to Financial Statements). The remaining contractual maturity of all of the securities lending transactions is overnight and continuous. The aggregate value of such securities is $1,424,694 and the total value of the collateral held by the Fund, including for securities sold and pending settlement, is $1,462,301. |
| Rate shown reflects yield as of December 31, 2024. |
| This security serves as collateral for securities on loan. |
Valuation InputsA summary of the inputs used to value the Fund’s investments as of December 31, 2024 is as follows (see Note 2A - Portfolio Valuation in the Notes to Financial Statements):
| | | Level 2
Significant
Observable
Inputs | Level 3
Significant
Unobservable
Inputs |
| | | | |
| | | | |
| | | | |
| | | | |
| See Portfolio of Investments for industry breakout. |
Offsetting Assets and Liabilities
Offsetting assets and liabilities requires entities to disclose both gross and net information about instruments and transactions eligible for offset, and to disclose instruments and transactions subject to master netting or similar agreements (see Note 2C - Offsetting on the Statements of Assets and Liabilities in the Notes to Financial Statements).
The Fund’s loaned securities were all subject to an enforceable Securities Lending Agency Agreement. Securities lent in accordance with the Securities Lending Agency Agreement on a gross basis were as follows:
Securities Lending Agency Agreement |
Total gross amount presented on the Statements of Assets and Liabilities(1) | |
| |
| |
| The amount presented on the Statements of Assets and Liabilities, which is included in “Investments, at value,” is not offset and is shown on a gross basis. |
| At December 31, 2024, the value of the collateral received from each borrower exceeded the value of the related securities loaned. This amount is disclosed on the Portfolio of Investments. |
See Notes to Financial Statements
First Trust NASDAQ® ABA Community Bank Index Fund (QABA)Portfolio of Investments (Continued)December 31, 2024 The Fund’s investments in repurchase agreements were all subject to an enforceable Master Repurchase Agreement. Repurchase Agreements on a gross basis were as follows:
|
Total gross amount presented on the Statements of Assets and Liabilities(3) | |
| |
| |
| The amount is included in “Investments, at value” on the Statements of Assets and Liabilities. |
| At December 31, 2024, the value of the collateral received from each seller exceeded the value of the repurchase agreements. |
See Notes to Financial Statements
This page intentionally left blank.
First Trust Exchange-Traded FundStatements of Assets and Liabilities
December 31, 2024
| First Trust NASDAQ-100 Equal Weighted Index Fund
(QQEW) | First Trust NASDAQ-100- Technology Sector Index Fund
(QTEC) | First Trust NASDAQ-100 Ex-Technology Sector Index Fund
(QQXT) |
| | | |
| | | |
| | | |
| | | |
Investment securities sold | | | |
| | | |
| | | |
Securities lending income | | | |
| | | |
| | | |
|
| | | |
| | | |
| | | |
| | | |
| | | |
Collateral for securities on loan | | | |
Shareholder reporting fees | | | |
| | | |
| | | |
| | | |
| | | |
| | | |
|
| | | |
| | | |
| | | |
Accumulated distributable earnings (loss) | | | |
| | | |
NET ASSET VALUE, per share | | | |
Number of shares outstanding (unlimited number of shares authorized, par value $0.01 per share) | | | |
| | | |
Securities on loan, at value | | | |
See Notes to Financial Statements
First Trust NASDAQ® Clean Edge® Green Energy Index Fund
(QCLN) | First Trust S&P REIT Index Fund
(FRI) | First Trust Water ETF
(FIW) | First Trust Natural Gas ETF
(FCG) | First Trust NASDAQ® ABA Community Bank Index Fund
(QABA) |
| | | | |
| | | | |
| | | | |
| | | | |
| | | | |
| | | | |
| | | | |
| | | | |
| | | | |
| | | | |
|
| | | | |
| | | | |
| | | | |
| | | | |
| | | | |
| | | | |
| | | | |
| | | | |
| | | | |
| | | | |
| | | | |
| | | | |
|
| | | | |
| | | | |
| | | | |
| | | | |
| | | | |
| | | | |
| | | | |
| | | | |
| | | | |
See Notes to Financial Statements
First Trust Exchange-Traded FundStatements of Operations
For the Year Ended December 31, 2024
| First Trust NASDAQ-100 Equal Weighted Index Fund
(QQEW) | First Trust NASDAQ-100- Technology Sector Index Fund
(QTEC) | First Trust NASDAQ-100 Ex-Technology Sector Index Fund
(QQXT) |
| | | |
| | | |
Securities lending income (net of fees) | | | |
| | | |
| | | |
|
| | | |
| | | |
| | | |
Accounting and administration fees | | | |
Shareholder reporting fees | | | |
| | | |
| | | |
| | | |
| | | |
Trustees’ fees and expenses | | | |
| | | |
| | | |
| | | |
Less fees waived by the investment advisor | | | |
| | | |
NET INVESTMENT INCOME (LOSS) | | | |
|
NET REALIZED AND UNREALIZED GAIN (LOSS): | | | |
Net realized gain (loss) on: | | | |
| | | |
| | | |
Foreign currency transactions | | | |
| | | |
Net change in unrealized appreciation (depreciation) on: | | | |
| | | |
Foreign currency translation | | | |
Net change in unrealized appreciation (depreciation) | | | |
NET REALIZED AND UNREALIZED GAIN (LOSS) | | | |
NET INCREASE (DECREASE) IN NET ASSETS RESULTING FROM OPERATIONS | | | |
See Notes to Financial Statements
First Trust NASDAQ® Clean Edge® Green Energy Index Fund
(QCLN) | First Trust S&P REIT Index Fund
(FRI) | First Trust Water ETF
(FIW) | First Trust Natural Gas ETF
(FCG) | First Trust NASDAQ® ABA Community Bank Index Fund
(QABA) |
| | | | |
| | | | |
| | | | |
| | | | |
| | | | |
|
| | | | |
| | | | |
| | | | |
| | | | |
| | | | |
| | | | |
| | | | |
| | | | |
| | | | |
| | | | |
| | | | |
| | | | |
| | | | |
| | | | |
| | | | |
| | | | |
|
| | | | |
| | | | |
| | | | |
| | | | |
| | | | |
| | | | |
| | | | |
| | | | |
| | | | |
| | | | |
| | | | |
| | | | |
See Notes to Financial Statements
First Trust Exchange-Traded FundStatements of Changes in Net Assets
| First Trust NASDAQ-100 Equal Weighted Index Fund (QQEW) | First Trust NASDAQ-100- Technology Sector Index Fund (QTEC) |
| | | | |
| | | | |
Net investment income (loss) | | | | |
| | | | |
Net change in unrealized appreciation (depreciation) | | | | |
Net increase (decrease) in net assets resulting from operations | | | | |
|
DISTRIBUTIONS TO SHAREHOLDERS FROM: | | | | |
| | | | |
|
SHAREHOLDER TRANSACTIONS: | | | | |
Proceeds from shares sold | | | | |
| | | | |
Net increase (decrease) in net assets resulting from shareholder transactions | | | | |
Total increase (decrease) in net assets | | | | |
|
| | | | |
| | | | |
| | | | |
|
CHANGES IN SHARES OUTSTANDING: | | | | |
Shares outstanding, beginning of period | | | | |
| | | | |
| | | | |
Shares outstanding, end of period | | | | |
See Notes to Financial Statements
First Trust NASDAQ-100 Ex- Technology Sector Index Fund (QQXT) | First Trust NASDAQ® Clean Edge® Green Energy Index Fund (QCLN) | First Trust S&P REIT Index Fund (FRI) | First Trust Water ETF (FIW) |
| | | | | | | |
| | | | | | | |
| | | | | | | |
| | | | | | | |
| | | | | | | |
| | | | | | | |
|
| | | | | | | |
| | | | | | | |
|
| | | | | | | |
| | | | | | | |
| | | | | | | |
| | | | | | | |
| | | | | | | |
|
| | | | | | | |
| | | | | | | |
| | | | | | | |
|
| | | | | | | |
| | | | | | | |
| | | | | | | |
| | | | | | | |
| | | | | | | |
See Notes to Financial Statements
First Trust Exchange-Traded FundStatements of Changes in Net Assets (Continued)
| First Trust Natural Gas ETF (FCG) | First Trust NASDAQ® ABA Community Bank Index Fund (QABA) |
| | | | |
| | | | |
Net investment income (loss) | | | | |
| | | | |
Net change in unrealized appreciation (depreciation) | | | | |
Net increase (decrease) in net assets resulting from operations | | | | |
|
DISTRIBUTIONS TO SHAREHOLDERS FROM: | | | | |
| | | | |
|
SHAREHOLDER TRANSACTIONS: | | | | |
Proceeds from shares sold | | | | |
| | | | |
Net increase (decrease) in net assets resulting from shareholder transactions | | | | |
Total increase (decrease) in net assets | | | | |
|
| | | | |
| | | | |
| | | | |
|
CHANGES IN SHARES OUTSTANDING: | | | | |
Shares outstanding, beginning of period | | | | |
| | | | |
| | | | |
Shares outstanding, end of period | | | | |
See Notes to Financial Statements
First Trust Exchange-Traded FundFinancial Highlights
For a share outstanding throughout each period First Trust NASDAQ-100 Equal Weighted Index Fund (QQEW)
| |
| | | | | |
Net asset value, beginning of period | | | | | |
Income from investment operations: | | | | | |
Net investment income (loss) | | | | | |
Net realized and unrealized gain (loss) | | | | | |
Total from investment operations | | | | | |
Distributions paid to shareholders from: | | | | | |
| | | | | |
Net asset value, end of period | | | | | |
| | | | | |
|
Ratios to average net assets/supplemental data: | | | | | |
Net assets, end of period (in 000’s) | | | | | |
Ratio of total expenses to average net assets | | | | | |
Ratio of net investment income (loss) to average net assets | | | | | |
Portfolio turnover rate (c) | | | | | |
| Based on average shares outstanding. |
| Total return is calculated assuming an initial investment made at the net asset value at the beginning of the period, reinvestment of all distributions at net asset value during the period, and redemption at net asset value on the last day of the period. The returns presented do not reflect the deduction of taxes that a shareholder would pay on Fund distributions or the redemption or sale of Fund shares. Total return is calculated for the time period presented and is not annualized for periods of less than a year. |
| Portfolio turnover is calculated for the time period presented and is not annualized for periods of less than a year and does not include securities received or delivered from processing creations or redemptions and in-kind transactions. |
See Notes to Financial Statements
First Trust Exchange-Traded FundFinancial Highlights (Continued)
For a share outstanding throughout each period First Trust NASDAQ-100-Technology Sector Index Fund (QTEC)
| |
| | | | | |
Net asset value, beginning of period | | | | | |
Income from investment operations: | | | | | |
Net investment income (loss) | | | | | |
Net realized and unrealized gain (loss) | | | | | |
Total from investment operations | | | | | |
Distributions paid to shareholders from: | | | | | |
| | | | | |
Net asset value, end of period | | | | | |
| | | | | |
|
Ratios to average net assets/supplemental data: | | | | | |
Net assets, end of period (in 000’s) | | | | | |
Ratio of total expenses to average net assets | | | | | |
Ratio of net investment income (loss) to average net assets | | | | | |
Portfolio turnover rate (e) | | | | | |
| Amount represents less than $0.01. |
| Based on average shares outstanding. |
| Total return is calculated assuming an initial investment made at the net asset value at the beginning of the period, reinvestment of all distributions at net asset value during the period, and redemption at net asset value on the last day of the period. The returns presented do not reflect the deduction of taxes that a shareholder would pay on Fund distributions or the redemption or sale of Fund shares. Total return is calculated for the time period presented and is not annualized for periods of less than a year. |
| Amount is less than 0.01%. |
| Portfolio turnover is calculated for the time period presented and is not annualized for periods of less than a year and does not include securities received or delivered from processing creations or redemptions and in-kind transactions. |
See Notes to Financial Statements
First Trust Exchange-Traded FundFinancial Highlights (Continued)
For a share outstanding throughout each period First Trust NASDAQ-100 Ex-Technology Sector Index Fund (QQXT)
| |
| | | | | |
Net asset value, beginning of period | | | | | |
Income from investment operations: | | | | | |
Net investment income (loss) | | | | | |
Net realized and unrealized gain (loss) | | | | | |
Total from investment operations | | | | | |
Distributions paid to shareholders from: | | | | | |
| | | | | |
Net asset value, end of period | | | | | |
| | | | | |
|
Ratios to average net assets/supplemental data: | | | | | |
Net assets, end of period (in 000’s) | | | | | |
Ratio of total expenses to average net assets | | | | | |
Ratio of net expenses to average net assets | | | | | |
Ratio of net investment income (loss) to average net assets | | | | | |
Portfolio turnover rate (c) | | | | | |
| Based on average shares outstanding. |
| Total return is calculated assuming an initial investment made at the net asset value at the beginning of the period, reinvestment of all distributions at net asset value during the period, and redemption at net asset value on the last day of the period. The returns presented do not reflect the deduction of taxes that a shareholder would pay on Fund distributions or the redemption or sale of Fund shares. Total return is calculated for the time period presented and is not annualized for periods of less than a year. The total returns would have been lower if certain fees had not been waived and expenses reimbursed by the investment advisor. |
| Portfolio turnover is calculated for the time period presented and is not annualized for periods of less than a year and does not include securities received or delivered from processing creations or redemptions and in-kind transactions. |
See Notes to Financial Statements
First Trust Exchange-Traded FundFinancial Highlights (Continued)
For a share outstanding throughout each period First Trust NASDAQ® Clean Edge® Green Energy Index Fund (QCLN)
| |
| | | | | |
Net asset value, beginning of period | | | | | |
Income from investment operations: | | | | | |
Net investment income (loss) | | | | | |
Net realized and unrealized gain (loss) | | | | | |
Total from investment operations | | | | | |
Distributions paid to shareholders from: | | | | | |
| | | | | |
Net asset value, end of period | | | | | |
| | | | | |
|
Ratios to average net assets/supplemental data: | | | | | |
Net assets, end of period (in 000’s) | | | | | |
Ratio of total expenses to average net assets | | | | | |
Ratio of net expenses to average net assets | | | | | |
Ratio of net investment income (loss) to average net assets | | | | | |
Portfolio turnover rate (c) | | | | | |
| Based on average shares outstanding. |
| Total return is calculated assuming an initial investment made at the net asset value at the beginning of the period, reinvestment of all distributions at net asset value during the period, and redemption at net asset value on the last day of the period. The returns presented do not reflect the deduction of taxes that a shareholder would pay on Fund distributions or the redemption or sale of Fund shares. Total return is calculated for the time period presented and is not annualized for periods of less than a year. The total returns would have been lower if certain fees had not been waived and expenses reimbursed by the investment advisor. |
| Portfolio turnover is calculated for the time period presented and is not annualized for periods of less than a year and does not include securities received or delivered from processing creations or redemptions and in-kind transactions. |
See Notes to Financial Statements
First Trust Exchange-Traded FundFinancial Highlights (Continued)
For a share outstanding throughout each period First Trust S&P REIT Index Fund (FRI)
| |
| | | | | |
Net asset value, beginning of period | | | | | |
Income from investment operations: | | | | | |
Net investment income (loss) | | | | | |
Net realized and unrealized gain (loss) | | | | | |
Total from investment operations | | | | | |
Distributions paid to shareholders from: | | | | | |
| | | | | |
Net asset value, end of period | | | | | |
| | | | | |
|
Ratios to average net assets/supplemental data: | | | | | |
Net assets, end of period (in 000’s) | | | | | |
Ratio of total expenses to average net assets | | | | | |
Ratio of net expenses to average net assets | | | | | |
Ratio of net investment income (loss) to average net assets | | | | | |
Portfolio turnover rate (c) | | | | | |
| Based on average shares outstanding. |
| Total return is calculated assuming an initial investment made at the net asset value at the beginning of the period, reinvestment of all distributions at net asset value during the period, and redemption at net asset value on the last day of the period. The returns presented do not reflect the deduction of taxes that a shareholder would pay on Fund distributions or the redemption or sale of Fund shares. Total return is calculated for the time period presented and is not annualized for periods of less than a year. The total returns would have been lower if certain fees had not been waived and expenses reimbursed by the investment advisor. |
| Portfolio turnover is calculated for the time period presented and is not annualized for periods of less than a year and does not include securities received or delivered from processing creations or redemptions and in-kind transactions. |
See Notes to Financial Statements
First Trust Exchange-Traded FundFinancial Highlights (Continued)
For a share outstanding throughout each period First Trust Water ETF (FIW)
| |
| | | | | |
Net asset value, beginning of period | | | | | |
Income from investment operations: | | | | | |
Net investment income (loss) | | | | | |
Net realized and unrealized gain (loss) | | | | | |
Total from investment operations | | | | | |
Distributions paid to shareholders from: | | | | | |
| | | | | |
Net asset value, end of period | | | | | |
| | | | | |
|
Ratios to average net assets/supplemental data: | | | | | |
Net assets, end of period (in 000’s) | | | | | |
Ratio of total expenses to average net assets | | | | | |
Ratio of net investment income (loss) to average net assets | | | | | |
Portfolio turnover rate (c) | | | | | |
| Based on average shares outstanding. |
| Total return is calculated assuming an initial investment made at the net asset value at the beginning of the period, reinvestment of all distributions at net asset value during the period, and redemption at net asset value on the last day of the period. The returns presented do not reflect the deduction of taxes that a shareholder would pay on Fund distributions or the redemption or sale of Fund shares. Total return is calculated for the time period presented and is not annualized for periods of less than a year. |
| Portfolio turnover is calculated for the time period presented and is not annualized for periods of less than a year and does not include securities received or delivered from processing creations or redemptions and in-kind transactions. |
See Notes to Financial Statements
First Trust Exchange-Traded FundFinancial Highlights (Continued)
For a share outstanding throughout each period First Trust Natural Gas ETF (FCG)
| |
| | | | | |
Net asset value, beginning of period | | | | | |
Income from investment operations: | | | | | |
Net investment income (loss) | | | | | |
Net realized and unrealized gain (loss) | | | | | |
Total from investment operations | | | | | |
Distributions paid to shareholders from: | | | | | |
| | | | | |
| | | | | |
| | | | | |
Net asset value, end of period | | | | | |
| | | | | |
|
Ratios to average net assets/supplemental data: | | | | | |
Net assets, end of period (in 000’s) | | | | | |
Ratio of total expenses to average net assets | | | | | |
Ratio of net expenses to average net assets | | | | | |
Ratio of net investment income (loss) to average net assets | | | | | |
Portfolio turnover rate (d) | | | | | |
| Based on average shares outstanding. |
| Total return is calculated assuming an initial investment made at the net asset value at the beginning of the period, reinvestment of all distributions at net asset value during the period, and redemption at net asset value on the last day of the period. The returns presented do not reflect the deduction of taxes that a shareholder would pay on Fund distributions or the redemption or sale of Fund shares. Total return is calculated for the time period presented and is not annualized for periods of less than a year. The total returns would have been lower if certain fees had not been waived and expenses reimbursed by the investment advisor. |
| For the year ended December 31, 2021, ratio reflects excise tax of 0.01%, which is not included in the expense cap. |
| Portfolio turnover is calculated for the time period presented and is not annualized for periods of less than a year and does not include securities received or delivered from processing creations or redemptions and in-kind transactions. |
See Notes to Financial Statements
First Trust Exchange-Traded FundFinancial Highlights (Continued)
For a share outstanding throughout each period First Trust NASDAQ® ABA Community Bank Index Fund (QABA)
| |
| | | | | |
Net asset value, beginning of period | | | | | |
Income from investment operations: | | | | | |
Net investment income (loss) | | | | | |
Net realized and unrealized gain (loss) | | | | | |
Total from investment operations | | | | | |
Distributions paid to shareholders from: | | | | | |
| | | | | |
Net asset value, end of period | | | | | |
| | | | | |
|
Ratios to average net assets/supplemental data: | | | | | |
Net assets, end of period (in 000’s) | | | | | |
Ratio of total expenses to average net assets | | | | | |
Ratio of net expenses to average net assets | | | | | |
Ratio of net investment income (loss) to average net assets | | | | | |
Portfolio turnover rate (c) | | | | | |
| Based on average shares outstanding. |
| Total return is calculated assuming an initial investment made at the net asset value at the beginning of the period, reinvestment of all distributions at net asset value during the period, and redemption at net asset value on the last day of the period. The returns presented do not reflect the deduction of taxes that a shareholder would pay on Fund distributions or the redemption or sale of Fund shares. Total return is calculated for the time period presented and is not annualized for periods of less than a year. The total returns would have been lower if certain fees had not been waived and expenses reimbursed by the investment advisor. |
| Portfolio turnover is calculated for the time period presented and is not annualized for periods of less than a year and does not include securities received or delivered from processing creations or redemptions and in-kind transactions. |
See Notes to Financial Statements
Notes to Financial Statements
First Trust Exchange-Traded FundDecember 31, 2024
1. Organization
First Trust Exchange-Traded Fund (the “Trust”) is an open-end management investment company organized as a Massachusetts business trust on August 8, 2003, and is registered with the Securities and Exchange Commission under the Investment Company Act of 1940, as amended (the “1940 Act”).
This report covers the eight funds (each a “Fund” and collectively, the “Funds”) listed below:
First Trust NASDAQ-100 Equal Weighted Index Fund – (Nasdaq, Inc. (“Nasdaq”) ticker “QQEW”) |
First Trust NASDAQ-100-Technology Sector Index Fund – (Nasdaq ticker “QTEC”) |
First Trust NASDAQ-100 Ex-Technology Sector Index Fund – (Nasdaq ticker “QQXT”) |
First Trust NASDAQ® Clean Edge® Green Energy Index Fund – (Nasdaq ticker “QCLN”) |
First Trust S&P REIT Index Fund – (NYSE Arca, Inc. (“NYSE Arca”) ticker “FRI”) |
First Trust Water ETF – (NYSE Arca ticker “FIW”) |
First Trust Natural Gas ETF – (NYSE Arca ticker “FCG”) |
First Trust NASDAQ® ABA Community Bank Index Fund – (Nasdaq ticker “QABA”) |
QCLN operates as a non-diversified series of the Trust. Each of QQEW, QTEC, QQXT, FRI, FIW, FCG and QABA operates as a diversified open-end management investment company as defined in Section 5(b) of the 1940 Act. Each Fund represents a separate series of shares of beneficial interest in the Trust. Unlike conventional mutual funds, each Fund issues and redeems shares on a continuous basis at net asset value (“NAV”), only in large blocks of shares known as “Creation Units.” The investment objective of each Fund is to seek investment results that correspond generally to the price and yield (before the Fund’s fees and expenses) of the following indices:
| |
First Trust NASDAQ-100 Equal Weighted Index Fund | Nasdaq-100 Equal WeightedTM Index |
First Trust NASDAQ-100-Technology Sector Index Fund | Nasdaq-100 Technology SectorTM Index |
First Trust NASDAQ-100 Ex-Technology Sector Index Fund | Nasdaq-100 Ex-Tech SectorTM Index |
First Trust NASDAQ® Clean Edge® Green Energy Index Fund | Nasdaq® Clean Edge® Green EnergyTM Index |
First Trust S&P REIT Index Fund | S&P United States REIT Index |
| ISE Clean Edge WaterTM Index |
First Trust Natural Gas ETF | ISE-Revere Natural GasTM Index |
First Trust NASDAQ® ABA Community Bank Index Fund | Nasdaq OMX® ABA Community BankTM Index |
2. Significant Accounting Policies
The Funds are each considered an investment company and follow accounting and reporting guidance under Financial Accounting Standards Board (“FASB”) Accounting Standards Codification Topic 946, “Financial Services-Investment Companies.” The following is a summary of significant accounting policies consistently followed by the Funds in the preparation of the financial statements. The preparation of the financial statements in accordance with accounting principles generally accepted in the United States of America (“U.S. GAAP”) requires management to make estimates and assumptions that affect the reported amounts and disclosures in the financial statements. Actual results could differ from those estimates.
Each Fund’s NAV is determined daily as of the close of regular trading on the New York Stock Exchange (“NYSE”), normally 4:00 p.m. Eastern time, on each day the NYSE is open for trading. If the NYSE closes early on a valuation day, the NAV is determined as of that time. Each Fund’s NAV is calculated by dividing the value of all assets of each Fund (including accrued interest and dividends), less all liabilities (including accrued expenses and dividends declared but unpaid), by the total number of shares outstanding.
Each Fund’s investments are valued daily at market value or, in the absence of market value with respect to any portfolio securities, at fair value. Market value prices represent readily available market quotations such as last sale or official closing prices from a national or foreign exchange (i.e., a regulated market) and are primarily obtained from third-party pricing services. Fair value prices represent any prices not considered market value prices and are either obtained from a third-party pricing service or are determined by the Pricing Committee of the Funds’ investment advisor, First Trust Advisors L.P. (“First Trust” or the “Advisor”), in accordance with valuation procedures approved by the Trust’s Board of Trustees, and in accordance with provisions of the 1940 Act and rules
Notes to Financial Statements (Continued)
First Trust Exchange-Traded FundDecember 31, 2024 thereunder. Investments valued by the Advisor’s Pricing Committee, if any, are footnoted as such in the footnotes to the Portfolio of Investments. Each Fund’s investments are valued as follows:
Common stocks and other equity securities listed on any national or foreign exchange (excluding Nasdaq and the London Stock Exchange Alternative Investment Market (“AIM”)) are valued at the last sale price on the exchange on which they are principally traded or, for Nasdaq and AIM securities, the official closing price. Securities traded on more than one securities exchange are valued at the last sale price or official closing price, as applicable, at the close of the securities exchange representing the primary exchange for such securities.
Shares of open-end funds are valued based on NAV per share.
Equity securities traded in an over-the-counter market are valued at the close price or the last trade price.
Overnight repurchase agreements are valued at amortized cost when it represents the most appropriate reflection of fair market value.
Certain securities may not be able to be priced by pre-established pricing methods. Such securities may be valued by the Advisor’s Pricing Committee at fair value. These securities generally include, but are not limited to, restricted securities (securities which may not be publicly sold without registration under the Securities Act of 1933, as amended) for which a third-party pricing service is unable to provide a market price; securities whose trading has been formally suspended; a security whose market or fair value price is not available from a pre-established pricing source; a security with respect to which an event has occurred that is likely to materially affect the value of the security after the market has closed but before the calculation of a Fund’s NAV or make it difficult or impossible to obtain a reliable market quotation; and a security whose price, as provided by the third-party pricing service, does not reflect the security’s fair value. As a general principle, the current fair value of a security would appear to be the amount which the owner might reasonably expect to receive for the security upon its current sale. When fair value prices are used, generally they will differ from market quotations or official closing prices on the applicable exchanges. A variety of factors may be considered in determining the fair value of such securities, including, but not limited to, the following:
1)
the last sale price on the exchange on which they are principally traded or, for Nasdaq and AIM securities, the official closing price;
3)
the size of the holding;
4)
the initial cost of the security;
5)
transactions in comparable securities;
6)
price quotes from dealers and/or third-party pricing services;
7)
relationships among various securities;
8)
information obtained by contacting the issuer, analysts, or the appropriate stock exchange;
9)
an analysis of the issuer’s financial statements;
10)
the existence of merger proposals or tender offers that might affect the value of the security; and
11)
other relevant factors.
In addition, differences between the prices used to calculate a Fund’s NAV and the prices used by such Fund’s corresponding index could result in a difference between a Fund’s performance and the performance of its underlying index.
The Funds are subject to fair value accounting standards that define fair value, establish the framework for measuring fair value and provide a three-level hierarchy for fair valuation based upon the inputs to the valuation as of the measurement date. The three levels of the fair value hierarchy are as follows:
• Level 1 – Level 1 inputs are quoted prices in active markets for identical investments. An active market is a market in which transactions for the investment occur with sufficient frequency and volume to provide pricing information on an ongoing basis.
• Level 2 – Level 2 inputs are observable inputs, either directly or indirectly, and include the following:
o Quoted prices for similar investments in active markets.
o Quoted prices for identical or similar investments in markets that are non-active. A non-active market is a market where there are few transactions for the investment, the prices are not current, or price quotations vary substantially either over time or among market makers, or in which little information is released publicly.
Notes to Financial Statements (Continued)
First Trust Exchange-Traded FundDecember 31, 2024 o Inputs other than quoted prices that are observable for the investment (for example, interest rates and yield curves observable at commonly quoted intervals, volatilities, prepayment speeds, loss severities, credit risks, and default rates).
o Inputs that are derived principally from or corroborated by observable market data by correlation or other means.
• Level 3 – Level 3 inputs are unobservable inputs. Unobservable inputs may reflect the reporting entity’s own assumptions about the assumptions that market participants would use in pricing the investment.
The inputs or methodologies used for valuing investments are not necessarily an indication of the risk associated with investing in those investments. A summary of the inputs used to value each Fund’s investments as of December 31, 2024, is included with each Fund’s Portfolio of Investments.
B. Securities Transactions and Investment Income
Securities transactions are recorded as of the trade date. Realized gains and losses from securities transactions are recorded on the identified cost basis. Dividend income is recorded on the ex-dividend date. Interest income, if any, is recorded on the accrual basis.
Withholding taxes and tax reclaims on foreign dividends have been provided for in accordance with each Fund’s understanding of the applicable country’s tax rules and rates.
Distributions received from a Fund’s investments in master limited partnerships (“MLPs”) generally are comprised of return of capital and investment income. A Fund records estimated return of capital and investment income based on historical information available from each MLP. These estimates may subsequently be revised based on information received from the MLPs after their tax reporting periods are concluded.
Distributions received from a Fund’s investments in real estate investment trusts (“REITs”) may be comprised of return of capital, capital gains, and income. The actual character of the amounts received during the year are not known until after the REITs’ fiscal year end. A Fund records the character of distributions received from the REITs during the year based on estimates available. The characterization of distributions received by a Fund may be subsequently revised based on information received from the REITs after their tax reporting periods conclude.
C. Offsetting on the Statements of Assets and Liabilities
Offsetting assets and liabilities requires entities to disclose both gross and net information about instruments and transactions eligible for offset on the Statements of Assets and Liabilities and disclose instruments and transactions subject to master netting or similar agreements. These disclosure requirements are intended to help investors and other financial statement users better assess the effect or potential effect of offsetting arrangements on a Fund’s financial position. The transactions subject to offsetting disclosures are derivative instruments, repurchase agreements and reverse repurchase agreements, and securities borrowing and securities lending transactions.
This disclosure, if applicable, is included within each Fund’s Portfolio of Investments under the heading “Offsetting Assets and Liabilities.” For financial reporting purposes, the Funds do not offset financial assets and financial liabilities that are subject to master netting arrangements (“MNAs”) or similar agreements on the Statements of Assets and Liabilities. MNAs provide the right, in the event of default (including bankruptcy and insolvency), for the non-defaulting counterparty to liquidate the collateral and calculate the net exposure to the defaulting party or request additional collateral.
The Funds may lend securities representing up to 33 1/3% of the value of their total assets to broker-dealers, banks and other institutions to generate additional income. When a Fund loans its portfolio securities, it will receive, at the inception of each loan, collateral equal to at least 102% (for domestic securities) or 105% (for international securities) of the market value of the loaned securities. The collateral amount is valued at the beginning of each business day and is compared to the market value of the loaned securities from the prior business day to determine if additional collateral is required. If additional collateral is required, a request is sent to the borrower. Securities lending involves the risk that the Fund may lose money because the borrower of the Fund’s loaned securities fails to return the securities in a timely manner or at all. The Fund could also lose money in the event of (i) a decline in the value of the collateral provided for the loaned securities, (ii) a decline in the value of any investments made with cash collateral or (iii) an increase in the value of the loaned securities if the borrower does not increase the collateral accordingly and the borrower fails to return the securities. These events could also trigger adverse tax consequences for the Funds.
Notes to Financial Statements (Continued)
First Trust Exchange-Traded FundDecember 31, 2024 Under the Funds’ Securities Lending Agency Agreement, the securities lending agent will generally bear the risk that a borrower may default on its obligation to return loaned securities. Prior to June 10, 2024, FIW, FCG, and QABA’s securities lending agent was Brown Brothers Harriman & Co. (“BBH”). Prior to November 14, 2024, QQEW, QCLN, QQXT, and QTEC’s securities lending agent was BBH. Effective June 10, 2024, for FIW, FCG, and QABA, and effective November 14, 2024, for QQEW, QCLN, QQXT, and QTEC, the Bank of New York Mellon (“BNY”) acts as the Funds’ securities lending agent and is responsible for executing the lending of the portfolio securities to creditworthy borrowers. The Funds, however, will be responsible for the risks associated with the investment of cash collateral. A Fund may lose money on its investment of cash collateral, which may affect its ability to repay the collateral to the borrower without the use of other Fund assets. Each Fund that engages in securities lending receives compensation (net of any rebate and securities lending agent fees) for lending its securities. Compensation can be in the form of fees received from the securities lending agent or dividends or interest earned from the investment of cash collateral. The fees received from the securities lending agent are accrued daily. The dividend and interest earned on the securities loaned is accounted for in the same manner as other dividend and interest income. At December 31, 2024, QTEC, QCLN, FIW, FCG, and QABA had securities in the securities lending program. During the fiscal year ended December 31, 2024, all the Funds, except FRI, participated in the securities lending program.
In the event of a default by a borrower with respect to any loan, BNY will exercise any and all remedies provided under the applicable borrower agreement to make the Funds whole. These remedies include purchasing replacement securities by applying the collateral held from the defaulting broker against the purchase cost of the replacement securities. If, despite such efforts by BNY to exercise these remedies, a Fund sustains losses as a result of a borrower’s default, BNY will indemnify the Fund by purchasing replacement securities at its own expense, or paying the Fund an amount equal to the market value of the replacement securities, subject to certain limitations which are set forth in detail in the Securities Lending Agency Agreement between the Trust on behalf of the Funds and BNY.
Repurchase agreements involve the purchase of securities subject to the seller’s agreement to repurchase the securities at a mutually agreed upon date and price, under the terms of a Master Repurchase Agreement (“MRA”). During the term of a repurchase agreement, the value of the underlying securities held as collateral on behalf of a Fund, including accrued interest, is required to exceed the value of the repurchase agreement, including accrued interest. The underlying securities for all repurchase agreements are held at the Funds’ custodian or designated sub-custodians under tri-party repurchase agreements.
MRAs govern transactions between a Fund and select counterparties. The MRAs contain provisions for, among other things, initiation, income payments, events of default, and maintenance of collateral for repurchase agreements.
Repurchase agreements received for lending securities are collateralized by U.S. Treasury securities. The U.S. Treasury securities are held in a joint custody account at BNY on behalf of the Funds participating in the securities lending program. In the event the counterparty defaults on the repurchase agreement, the U.S. Treasury securities can either be maintained as part of a Fund’s portfolio or sold for cash. A Fund could suffer a loss to the extent that the proceeds from the sale of the underlying collateral held by the Fund are less than the repurchase price and the Fund’s costs associated with the delay and enforcement of the MRA.
While the Funds may invest in repurchase agreements, any repurchase agreements held by the Funds during the fiscal year ended December 31, 2024, were received as collateral for lending securities.
F. Dividends and Distributions to Shareholders
Dividends from net investment income of each Fund, if any, are declared and paid quarterly, or as the Board of Trustees may determine from time to time. Distributions of net realized capital gains earned by each Fund, if any, are distributed at least annually. Each Fund may also designate a portion of the amount paid to redeeming shareholders as a distribution for tax purposes.
Distributions from net investment income and realized capital gains are determined in accordance with federal income tax regulations, which may differ from U.S. GAAP. Certain capital accounts in the financial statements are periodically adjusted for permanent differences in order to reflect their tax character. These permanent differences are primarily due to the varying treatment of income and gain/loss on portfolio securities held by the Funds and have no impact on net assets or NAV per share. Temporary differences, which arise from recognizing certain items of income, expense and gain/loss in different periods for financial statement and tax purposes, will reverse at some time in the future.
Notes to Financial Statements (Continued)
First Trust Exchange-Traded FundDecember 31, 2024 The tax character of distributions paid by each Fund during the fiscal year ended December 31, 2024 were as follows:
| Distributions
paid from
Ordinary
Income | Distributions
paid from
Capital
Gains | Distributions
paid from
Return of
Capital |
First Trust NASDAQ-100 Equal Weighted Index Fund | | | |
First Trust NASDAQ-100-Technology Sector Index Fund | | | |
First Trust NASDAQ-100 Ex-Technology Sector Index Fund | | | |
First Trust NASDAQ® Clean Edge® Green Energy Index Fund | | | |
First Trust S&P REIT Index Fund | | | |
| | | |
First Trust Natural Gas ETF | | | |
First Trust NASDAQ® ABA Community Bank Index Fund | | | |
The tax character of distributions paid by each Fund during the fiscal year ended December 31, 2023 were as follows:
| Distributions
paid from
Ordinary
Income | Distributions
paid from
Capital
Gains | Distributions
paid from
Return of
Capital |
First Trust NASDAQ-100 Equal Weighted Index Fund | | | |
First Trust NASDAQ-100-Technology Sector Index Fund | | | |
First Trust NASDAQ-100 Ex-Technology Sector Index Fund | | | |
First Trust NASDAQ® Clean Edge® Green Energy Index Fund | | | |
First Trust S&P REIT Index Fund | | | |
| | | |
First Trust Natural Gas ETF | | | |
First Trust NASDAQ® ABA Community Bank Index Fund | | | |
As of December 31, 2024, the components of distributable earnings on a tax basis for each Fund were as follows:
| Undistributed
Ordinary
Income | Accumulated
Capital and
Other
Gain (Loss) | Net
Unrealized
Appreciation
(Depreciation) |
First Trust NASDAQ-100 Equal Weighted Index Fund | | | |
First Trust NASDAQ-100-Technology Sector Index Fund | | | |
First Trust NASDAQ-100 Ex-Technology Sector Index Fund | | | |
First Trust NASDAQ® Clean Edge® Green Energy Index Fund | | | |
First Trust S&P REIT Index Fund | | | |
| | | |
First Trust Natural Gas ETF | | | |
First Trust NASDAQ® ABA Community Bank Index Fund | | | |
Each Fund intends to continue to qualify as a regulated investment company by complying with the requirements under Subchapter M of the Internal Revenue Code of 1986, as amended, which includes distributing substantially all of its net investment income and net realized gains to shareholders. Accordingly, no provision has been made for federal and state income taxes. However, due to the timing and amount of distributions, each Fund may be subject to an excise tax of 4% of the amount by which approximately 98% of each Fund’s taxable income exceeds the distributions from such taxable income for the calendar year.
The Funds are subject to accounting standards that establish a minimum threshold for recognizing, and a system for measuring, the benefits of a tax position taken or expected to be taken in a tax return. The taxable years ended 2021, 2022, 2023, and 2024 remain open to federal and state audit. As of December 31, 2024, management has evaluated the application of these standards to the Funds and has determined that no provision for income tax is required in the Funds’ financial statements for uncertain tax positions.
Notes to Financial Statements (Continued)
First Trust Exchange-Traded FundDecember 31, 2024 Each Fund intends to utilize provisions of the federal income tax laws, which allow it to carry a realized capital loss forward indefinitely following the year of the loss and offset such loss against any future realized capital gains. Each Fund is subject to certain limitations under U.S. tax rules on the use of capital loss carryforwards and net unrealized built-in losses. These limitations apply when there has been a 50% change in ownership. At December 31, 2024, for federal income tax purposes, each applicable Fund had a capital loss carryforward available that is shown in the following table, to the extent provided by regulations, to offset future capital gains. To the extent that these loss carryforwards are used to offset future capital gains, it is probable that the capital gains so offset will not be distributed to each applicable Fund’s shareholders.
| Non-Expiring
Capital Loss
Carryforwards |
First Trust NASDAQ-100 Equal Weighted Index Fund | |
First Trust NASDAQ-100-Technology Sector Index Fund | |
First Trust NASDAQ-100 Ex-Technology Sector Index Fund | |
First Trust NASDAQ® Clean Edge® Green Energy Index Fund | |
First Trust S&P REIT Index Fund | |
| |
First Trust Natural Gas ETF | |
First Trust NASDAQ® ABA Community Bank Index Fund | |
During the taxable year ended December 31, 2024, the following Fund utilized capital loss carryforwards in the following amount:
| |
First Trust S&P REIT Index Fund | |
Certain losses realized during the current fiscal year may be deferred and treated as occurring on the first day of the following fiscal year for federal income tax purposes. For the fiscal year ended December 31, 2024, the Funds had no net late year ordinary or capital losses.
In order to present paid-in capital and accumulated distributable earnings (loss) (which consists of accumulated net investment income (loss), accumulated net realized gain (loss) on investments and net unrealized appreciation (depreciation) on investments) on the Statements of Assets and Liabilities that more closely represent their tax character, certain adjustments have been made to paid-in capital, accumulated net investment income (loss) and accumulated net realized gain (loss) on investments. These adjustments are primarily due to the difference between book and tax treatments of income and gains on various investment securities held by the Funds and in-kind transactions. The results of operations and net assets were not affected by these adjustments. For the fiscal year ended December 31, 2024, the adjustments for each Fund were as follows:
| Accumulated
Net Investment
Income (Loss) | Accumulated
Net Realized
Gain (Loss)
on Investments | |
First Trust NASDAQ-100 Equal Weighted Index Fund | | | |
First Trust NASDAQ-100-Technology Sector Index Fund | | | |
First Trust NASDAQ-100 Ex-Technology Sector Index Fund | | | |
First Trust NASDAQ® Clean Edge® Green Energy Index Fund | | | |
First Trust S&P REIT Index Fund | | | |
| | | |
First Trust Natural Gas ETF | | | |
First Trust NASDAQ® ABA Community Bank Index Fund | | | |
Notes to Financial Statements (Continued)
First Trust Exchange-Traded FundDecember 31, 2024 As of December 31, 2024, the aggregate cost, gross unrealized appreciation, gross unrealized depreciation, and net unrealized appreciation/(depreciation) on investments (including short positions and derivatives, if any) for federal income tax purposes were as follows:
| | Gross Unrealized
Appreciation | Gross Unrealized
(Depreciation) | Net Unrealized
Appreciation
(Depreciation) |
First Trust NASDAQ-100 Equal Weighted Index Fund | | | | |
First Trust NASDAQ-100-Technology Sector Index Fund | | | | |
First Trust NASDAQ-100 Ex-Technology Sector Index Fund | | | | |
First Trust NASDAQ® Clean Edge® Green Energy Index Fund | | | | |
First Trust S&P REIT Index Fund | | | | |
| | | | |
First Trust Natural Gas ETF | | | | |
First Trust NASDAQ® ABA Community Bank Index Fund | | | | |
Expenses that are directly related to one of the Funds are charged directly to the respective Fund. General expenses of the Trust are allocated to all the Funds based upon the net assets of each Fund.
First Trust has entered into licensing agreements with each of the following “Licensors” for the respective Funds:
| |
First Trust NASDAQ-100 Equal Weighted Index Fund | |
First Trust NASDAQ-100-Technology Sector Index Fund | |
First Trust NASDAQ-100 Ex-Technology Sector Index Fund | |
First Trust NASDAQ® Clean Edge® Green Energy Index Fund | Nasdaq, Inc. and Clean Edge® |
First Trust S&P REIT Index Fund | S&P Dow Jones Indices LLC |
| |
First Trust Natural Gas ETF | |
First Trust NASDAQ® ABA Community Bank Index Fund | Nasdaq, Inc. and American Bankers Association |
The respective license agreements allow for the use by First Trust of certain trademarks and trade names of the respective Licensors. The Funds are sub-licensees to the applicable license agreement. The respective Funds are required to pay licensing fees, which are shown on the Statements of Operations.
Each Fund has adopted FASB Accounting Standards Update 2023-07, Segment Reporting (Topic 280) - Improvements to Reportable Segment Disclosures (“ASU 2023-07”). Adoption of the standard impacted financial statement disclosures only and did not affect each Fund’s financial position or the results of its operations. An operating segment is defined in Topic 280 as a component of a public entity that engages in business activities from which it may recognize revenues and incur expenses, has operating results that are regularly reviewed by the public entity’s chief operating decision maker (“CODM”) to make decisions about resources to be allocated to the segment and assess its performance, and has discrete financial information available. The CODM is the President and Chief Executive Officer of each Fund. Each Fund operates as a single operating segment. Each Fund’s income, expenses, assets, changes in net assets resulting from operations and performance are regularly monitored and assessed as a whole by the CODM responsible for oversight functions of the Fund, using the information presented in the financial statements and financial highlights.
3. Investment Advisory Fee, Affiliated Transactions and Other Fee Arrangements
First Trust, the investment advisor to the Funds, is a limited partnership with one limited partner, Grace Partners of DuPage L.P., and one general partner, The Charger Corporation. The Charger Corporation is an Illinois corporation controlled by James A. Bowen,
Notes to Financial Statements (Continued)
First Trust Exchange-Traded FundDecember 31, 2024 Chief Executive Officer of First Trust. First Trust is responsible for the selection and ongoing monitoring of the securities in each Fund’s portfolio, managing the Funds’ business affairs and providing certain administrative services necessary for the management of the Funds.
The management fee payable by each Fund to First Trust for these services will be reduced at certain levels of each Fund’s net assets (“breakpoints”) and calculated pursuant to the following schedule:
| | | | | | | | |
Fund net assets up to and including $2.5 billion | | | | | | | | |
Fund net assets greater than $2.5 billion up to and including $5 billion | | | | | | | | |
Fund net assets greater than $5 billion up to and including $7.5 billion | | | | | | | | |
Fund net assets greater than $7.5 billion up to and including $10 billion | | | | | | | | |
Fund net assets greater than $10 billion up to and including $15 billion | | | | | | | | |
Fund net assets greater than $15 billion | | | | | | | | |
The Trust and the Advisor have entered into an Expense Reimbursement and Fee Waiver Agreement (“Agreement”) in which First Trust has agreed to waive fees and/or reimburse Fund expenses to the extent that the operating expenses of each Fund (excluding interest expense, brokerage commissions and other trading expenses, acquired fund fees and expenses, taxes and extraordinary expenses) exceed the following amount as a percentage of average daily net assets per year (the “Expense Cap”). The Expense Cap will be in effect until at least April 30, 2026.
| |
First Trust NASDAQ-100 Equal Weighted Index Fund | |
First Trust NASDAQ-100-Technology Sector Index Fund | |
First Trust NASDAQ-100 Ex-Technology Sector Index Fund | |
First Trust NASDAQ® Clean Edge® Green Energy Index Fund | |
First Trust S&P REIT Index Fund | |
| |
First Trust Natural Gas ETF | |
First Trust NASDAQ® ABA Community Bank Index Fund | |
The Trust has multiple service agreements with BNY. Under the service agreements, BNY performs custodial, fund accounting, certain administrative services, and transfer agency services for each Fund. As custodian, BNY is responsible for custody of each Fund’s assets. As fund accountant and administrator, BNY is responsible for maintaining the books and records of each Fund’s securities and cash. As transfer agent, BNY is responsible for maintaining shareholder records for each Fund. BNY is a subsidiary of The Bank of New York Mellon Corporation, a financial holding company.
Each Trustee who is not an officer or employee of First Trust, any sub-advisor or any of their affiliates (“Independent Trustees”) is paid a fixed annual retainer that is allocated equally among each fund in the First Trust Fund Complex. Each Independent Trustee is also paid an annual per fund fee that varies based on whether the fund is a closed-end or other actively managed fund, a target outcome fund or an index fund.
Additionally, the Chairs of the Audit Committee, Nominating and Governance Committee and Valuation Committee, the Vice Chair of the Audit Committee, the Lead Independent Trustee and the Vice Lead Independent Trustee are paid annual fees to serve in such capacities, with such compensation allocated pro rata among each fund in the First Trust Fund Complex based on net assets. Independent Trustees are reimbursed for travel and out-of-pocket expenses in connection with all meetings. The Committee Chairs, the Audit Committee Vice Chair, the Lead Independent Trustee and the Vice Lead Independent Trustee rotate periodically in serving in such capacities. The officers and “Interested” Trustee receive no compensation from the Trust for acting in such capacities.
Notes to Financial Statements (Continued)
First Trust Exchange-Traded FundDecember 31, 2024 4. Purchases and Sales of Securities
For the fiscal year ended December 31, 2024, the cost of purchases and proceeds from sales of investments for each Fund, excluding short-term investments and in-kind transactions, were as follows:
| | |
First Trust NASDAQ-100 Equal Weighted Index Fund | | |
First Trust NASDAQ-100-Technology Sector Index Fund | | |
First Trust NASDAQ-100 Ex-Technology Sector Index Fund | | |
First Trust NASDAQ® Clean Edge® Green Energy Index Fund | | |
First Trust S&P REIT Index Fund | | |
| | |
First Trust Natural Gas ETF | | |
First Trust NASDAQ® ABA Community Bank Index Fund | | |
For the fiscal year ended December 31, 2024, the cost of in-kind purchases and proceeds from in-kind sales for each Fund were as follows:
| | |
First Trust NASDAQ-100 Equal Weighted Index Fund | | |
First Trust NASDAQ-100-Technology Sector Index Fund | | |
First Trust NASDAQ-100 Ex-Technology Sector Index Fund | | |
First Trust NASDAQ® Clean Edge® Green Energy Index Fund | | |
First Trust S&P REIT Index Fund | | |
| | |
First Trust Natural Gas ETF | | |
First Trust NASDAQ® ABA Community Bank Index Fund | | |
5. Creations, Redemptions and Transaction Fees
Each Fund generally issues and redeems its shares in primary market transactions through a creation and redemption mechanism and does not sell or redeem individual shares. Instead, financial entities known as “Authorized Participants” have contractual arrangements with a Fund or one of the Fund’s service providers to purchase and redeem Fund shares directly with the Fund in Creation Units. Prior to the start of trading on every business day, a Fund publishes through the National Securities Clearing Corporation the “basket” of securities, cash or other assets that it will accept in exchange for a Creation Unit of the Fund’s shares. An Authorized Participant that wishes to effectuate a creation of a Fund’s shares deposits with the Fund the “basket” of securities, cash or other assets identified by the Fund that day, and then receives the Creation Unit of the Fund’s shares in return for those assets. After purchasing a Creation Unit, the Authorized Participant may continue to hold the Fund’s shares or sell them in the secondary market. The redemption process is the reverse of the purchase process: the Authorized Participant redeems a Creation Unit of a Fund’s shares for a basket of securities, cash or other assets. The combination of the creation and redemption process with secondary market trading in a Fund’s shares and underlying securities provides arbitrage opportunities that are designed to help keep the market price of a Fund’s shares at or close to the NAV per share of the Fund.
Each Fund imposes fees in connection with the purchase of Creation Units. These fees may vary based upon various fact-based circumstances, including, but not limited to, the composition of the securities included in the Creation Unit or the countries in which the transactions are settled. The price for each Creation Unit will equal the daily NAV per share of a Fund times the number of shares in a Creation Unit, plus the fees described above and, if applicable, any operational processing and brokerage costs, transfer fees, stamp taxes and part or all of the spread between the expected bid and offer side of the market related to the securities comprising the creation basket.
Each Fund also imposes fees in connection with the redemption of Creation Units. These fees may vary based upon various fact-based circumstances, including, but not limited to, the composition of the securities included in the Creation Unit or the countries in which the transactions are settled. The price received for each Creation Unit will equal the daily NAV per share of a Fund times the number of shares in a Creation Unit, minus the fees described above and, if applicable, any operational processing and brokerage costs, transfer fees, stamp taxes and part or all of the spread between the expected bid and offer side of the market related to the securities comprising the redemption basket. Investors who use the services of a broker or other such intermediary in addition to an Authorized
Notes to Financial Statements (Continued)
First Trust Exchange-Traded FundDecember 31, 2024 Participant to effect a redemption of a Creation Unit may also be assessed an amount to cover the cost of such services. The redemption fee charged by a Fund will comply with Rule 22c-2 of the 1940 Act which limits redemption fees to no more than 2% of the value of the shares redeemed.
The Board of Trustees adopted a Distribution and Service Plan pursuant to Rule 12b-1 under the 1940 Act. In accordance with the Rule 12b-1 plan, the Funds are authorized to pay an amount up to 0.25% of their average daily net assets each year to reimburse First Trust Portfolios L.P. (“FTP”), the distributor of the Funds, for amounts expended to finance activities primarily intended to result in the sale of Creation Units or the provision of investor services. FTP may also use this amount to compensate securities dealers or other persons that are Authorized Participants for providing distribution assistance, including broker-dealer and shareholder support and educational and promotional services.
No 12b-1 fees are currently paid by the Funds, and pursuant to a contractual arrangement, no 12b-1 fees will be paid any time before April 30, 2026.
The Trust, on behalf of the Funds, has a variety of indemnification obligations under contracts with its service providers. The Trust’s maximum exposure under these arrangements is unknown. However, the Trust has not had prior claims or losses pursuant to these contracts and expects the risk of loss to be remote.
Management has evaluated the impact of all subsequent events on the Funds through the date the financial statements were issued and has determined that there were no subsequent events requiring recognition or disclosure in the financial statements that have not already been disclosed.
Report of Independent Registered Public Accounting Firm
To the Shareholders and the Board of Trustees of First Trust Exchange-Traded Fund:
Opinion on the Financial Statements and Financial Highlights
We have audited the accompanying statements of assets and liabilities of First Trust NASDAQ-100 Equal Weighted Index Fund, First Trust NASDAQ-100-Technology Sector Index Fund, First Trust NASDAQ-100 Ex-Technology Sector Index Fund, First Trust NASDAQ® Clean Edge® Green Energy Index Fund, First Trust S&P REIT Index Fund, First Trust Water ETF, First Trust Natural Gas ETF, and First Trust NASDAQ® ABA Community Bank Index Fund (the “Funds”), each a series of First Trust Exchange-Traded Fund, including the portfolios of investments, as of December 31, 2024, the related statements of operations for the year then ended, the statements of changes in net assets for each of the two years in the period then ended, the financial highlights for each of the five years in the period then ended, and the related notes. In our opinion, the financial statements and financial highlights present fairly, in all material respects, the financial position of each of the Funds as of December 31, 2024, and the results of their operations for the year then ended, the changes in their net assets for each of the two years in the period then ended, and the financial highlights for each of the five years in the period then ended in conformity with accounting principles generally accepted in the United States of America.
These financial statements and financial highlights are the responsibility of the Funds’ management. Our responsibility is to express an opinion on the Funds’ financial statements and financial highlights based on our audits. We are a public accounting firm registered with the Public Company Accounting Oversight Board (United States) (PCAOB) and are required to be independent with respect to the Funds in accordance with the U.S. federal securities laws and the applicable rules and regulations of the Securities and Exchange Commission and the PCAOB.
We conducted our audits in accordance with the standards of the PCAOB. Those standards require that we plan and perform the audit to obtain reasonable assurance about whether the financial statements and financial highlights are free of material misstatement, whether due to error or fraud. The Funds are not required to have, nor were we engaged to perform, an audit of their internal control over financial reporting. As part of our audits, we are required to obtain an understanding of internal control over financial reporting but not for the purpose of expressing an opinion on the effectiveness of the Funds’ internal control over financial reporting. Accordingly, we express no such opinion.
Our audits included performing procedures to assess the risks of material misstatement of the financial statements and financial highlights, whether due to error or fraud, and performing procedures that respond to those risks. Such procedures included examining, on a test basis, evidence regarding the amounts and disclosures in the financial statements and financial highlights. Our audits also included evaluating the accounting principles used and significant estimates made by management, as well as evaluating the overall presentation of the financial statements and financial highlights. Our procedures included confirmation of securities owned as of December 31, 2024, by correspondence with the custodian and brokers; when replies were not received from brokers, we performed other auditing procedures. We believe that our audits provide a reasonable basis for our opinion.
/s/ Deloitte & Touche, LLP
Chicago, Illinois
February 21, 2025
We have served as the auditor of one or more First Trust investment companies since 2001.
First Trust Exchange-Traded FundDecember 31, 2024 (Unaudited)
Changes in and Disagreements with Accountants (Item 8 of Form N-CSR)
There were no changes in or disagreements with the Funds’ accountants during the fiscal year ended December 31, 2024.
Proxy Disclosures (Item 9 of Form N-CSR)
There were no matters submitted for vote by shareholders of any Fund during the fiscal year ended December 31, 2024.
Remuneration Paid to Directors, Officers, and Others (Item 10 of Form N-CSR)
The applicable aggregate remuneration paid by each Fund during the period covered by the report is included in the Statements of Operations.
Statement Regarding the Basis for the Board’s Approval of Investment Advisory Contract (Item 11 of Form N-CSR)
Remuneration Disclosure Under the Alternative Investment Fund Managers Directive
First Trust Advisors L.P. (“First Trust”) is authorised and regulated by the U.S. Securities and Exchange Commission and is entitled to market shares of certain First Trust Exchange-Traded Fund funds it manages (the “Funds”) in certain member states in the European Economic Area in accordance with the cooperation arrangements in Article 42 of the Alternative Investment Fund Managers Directive (the “Directive”). First Trust is required under the Directive to make disclosures in respect of remuneration. The following disclosures are made in line with First Trust’s interpretation of currently available regulatory guidance on remuneration disclosures.
During the year ended December 31, 2024, the amount of remuneration paid (or to be paid) by First Trust Advisors L.P. in respect of the Funds is $3,831,220. This figure is comprised of $154,427 paid (or to be paid) in fixed compensation and $3,676,793 paid (or to be paid) in variable compensation. There were a total of 24 beneficiaries of the remuneration described above. Those amounts include $2,008,347 paid (or to be paid) to senior management of First Trust Advisors L.P. and $1,822,873 paid (or to be paid) to other employees whose professional activities have a material impact on the risk profiles of First Trust Advisors L.P. or the Funds (collectively, “Code Staff”).
Code Staff included in the aggregated figures disclosed above are rewarded in line with First Trust’s remuneration policy (the “Remuneration Policy”) which is determined and implemented by First Trust’s senior management. The Remuneration Policy reflects First Trust’s ethos of good governance and encapsulates the following principal objectives:
i.
to provide a clear link between remuneration and performance of First Trust and to avoid rewarding for failure;
ii.
to promote sound and effective risk management consistent with the risk profiles of the funds managed by First Trust; and
iii.
to remunerate staff in line with the business strategy, objectives, values and interests of First Trust and the funds managed by First Trust in a manner that avoids conflicts of interest.
First Trust assesses various risk factors which it is exposed to when considering and implementing remuneration for Code Staff and considers whether any potential award to such person(s) would give rise to a conflict of interest. First Trust does not reward failure, or consider the taking of risk or failure to take risk in its remuneration of Code Staff.
First Trust assesses performance for the purposes of determining payments in respect of performance-related remuneration of Code Staff by reference to a broad range of measures including (i) individual performance (using financial and non-financial criteria), and (ii) the overall performance of First Trust. Remuneration is not based upon the performance of the Funds.
The elements of remuneration are balanced between fixed and variable and the senior management sets fixed salaries at a level sufficient to ensure that variable remuneration incentivises and rewards strong individual performance but does not encourage excessive risk taking.
No individual is involved in setting his or her own remuneration.
Other Information (Continued)
First Trust Exchange-Traded FundDecember 31, 2024 (Unaudited) Federal Tax Information
For the taxable year ended December 31, 2024, the following percentages of income dividends paid by the Funds qualify for the dividends received deduction available to corporations:
| Dividends Received
Deduction |
First Trust NASDAQ-100 Equal Weighted Index Fund | |
First Trust NASDAQ-100-Technology Sector Index Fund | |
First Trust NASDAQ-100 Ex-Technology Sector Index Fund | |
First Trust NASDAQ® Clean Edge® Green Energy Index Fund | |
First Trust S&P REIT Index Fund | |
| |
First Trust Natural Gas ETF | |
First Trust NASDAQ® ABA Community Bank Index Fund | |
For the taxable year ended December 31, 2024, the following percentages of income dividends paid by the Funds are hereby designated as qualified dividend income:
| |
First Trust NASDAQ-100 Equal Weighted Index Fund | |
First Trust NASDAQ-100-Technology Sector Index Fund | |
First Trust NASDAQ-100 Ex-Technology Sector Index Fund | |
First Trust NASDAQ® Clean Edge® Green Energy Index Fund | |
First Trust S&P REIT Index Fund | |
| |
First Trust Natural Gas ETF | |
First Trust NASDAQ® ABA Community Bank Index Fund | |
A portion of each of the Funds’ 2024 ordinary dividends (including short-term capital gains) paid to its shareholders during the fiscal year ended December 31, 2024, may be eligible for the Qualified Business Income (QBI) Deduction under the Internal Revenue Code of 1986, as amended, Section 199A for the aggregate dividends each Fund received from the underlying Real Estate Investment Trusts (REITs) these Funds invest in.
Nasdaq®, Nasdaq-100®, Nasdaq-100 Index®, Clean Edge®, OMX®, Nasdaq OMX®, Nasdaq-100 Equal WeightedTM Index,
Nasdaq-100 Technology SectorTM Index, Nasdaq-100 Ex-Tech SectorTM Index, Nasdaq® Clean Edge® Green EnergyTM Index, ISE Clean Edge WaterTM Index, ISE-Revere Natural GasTM Index and Nasdaq OMX® ABA Community BankTM Index (“the Nasdaq Indexes”) are registered trademarks and service marks of Nasdaq, Inc., Clean Edge, Inc., and American Bankers Association, respectively, (together with their affiliates hereinafter referred to as the “Corporations”), and are licensed for use by First Trust. The Funds have not been passed on by the Corporations as to their legality or suitability. The Funds are not issued, endorsed, sold or promoted by the Corporations. THE CORPORATIONS MAKE NO WARRANTIES AND BEAR NO LIABILITY WITH RESPECT TO THE FUNDS.
S&P United States REIT Index (“Index”) is a product of S&P Dow Jones Indices LLC or its affiliates (“SPDJI”) and has been licensed for use by First Trust. S&P® is a registered trademark of Standard & Poor’s Financial Services LLC (“S&P”); Dow Jones® is a registered trademark of Dow Jones Trademark Holdings LLC (“Dow Jones”); and these trademarks have been licensed for use by SPDJI and sublicensed for certain purposes by First Trust. The Fund is not sponsored, endorsed, sold or promoted by SPDJI, Dow Jones, S&P on their respective affiliates and none of such parties make any representation regarding the advisability of investing in such product nor do they have any liability for the errors, omissions or interruptions of the Index.
Annual Financial
Statements and
Other Information |
For the Year Ended
December 31, 2024 |
First Trust Exchange-Traded Fund
First Trust Dividend StrengthTM ETF (FTDS) |
First Trust Dow 30 Equal Weight ETF (EDOW) |
First Trust Lunt U.S. Factor Rotation ETF (FCTR) |
First Trust S&P 500 Diversified Free Cash Flow ETF (FCFY) |
First Trust Exchange-Traded Fund
Annual Financial Statements and Other Information
December 31, 2024
Performance and Risk Disclosure
There is no assurance that any series of First Trust Exchange-Traded Fund (the “Trust”) described in this report (each such series is referred to as a “Fund” and collectively, as the “Funds”) will achieve its investment objective. Each Fund is subject to market risk, which is the possibility that the market values of securities owned by the Fund will decline and that the value of the Fund’s shares may therefore be less than what you paid for them. Accordingly, you can lose money by investing in a Fund.
Performance data quoted represents past performance, which is no guarantee of future results, and current performance may be lower or higher than the figures shown. For the most recent month-end performance figures, please visit www.ftportfolios.com or speak with your financial advisor. Investment returns, net asset value and share price will fluctuate and Fund shares, when sold, may be worth more or less than their original cost.
First Trust Advisors L.P., the Funds’ advisor, may also periodically provide additional information on Fund performance on each Fund’s webpage at www.ftportfolios.com.
This report contains information that may help you evaluate your investment. It includes details about each Fund and presents data that provides insight into each Fund’s performance and investment approach.
The material risks of investing in each Fund are spelled out in its prospectus, statement of additional information, and other Fund regulatory filings.
First Trust Dividend StrengthTM ETF (FTDS)Portfolio of InvestmentsDecember 31, 2024
| | |
|
| Aerospace & Defense — 5.0% | |
| | |
| Huntington Ingalls Industries, Inc. | |
| | |
| | |
| | |
| Commerce Bancshares, Inc. | |
| Cullen/Frost Bankers, Inc. | |
| | |
| | |
| | |
| | |
| | |
| Brown-Forman Corp., Class B | |
| | |
| Air Products and Chemicals, Inc. | |
| CF Industries Holdings, Inc. | |
| | |
| | |
| | |
| | |
| Consumer Staples Distribution | |
| | |
| | |
| | |
| Electronic Equipment, Instruments & Components | |
| | |
| Energy Equipment & Services | |
| | |
| Financial Services — 6.0% | |
| | |
| | |
| | |
| | |
| | |
| Archer-Daniels-Midland Co. | |
| | |
| Lamb Weston Holdings, Inc. | |
| | |
| | |
| | |
| | |
|
| | |
| | |
| Hotels, Restaurants & Leisure | |
| Wyndham Hotels & Resorts, Inc. | |
| Household Durables — 2.6% | |
| | |
| Industrial Conglomerates — | |
| Honeywell International, Inc. | |
| | |
| | |
| Cincinnati Financial Corp. | |
| | |
| Hanover Insurance Group (The), Inc. | |
| Old Republic International Corp. | |
| | |
| | |
| | |
| | |
| | |
| | |
| | |
| | |
| | |
| | |
| Interpublic Group of Cos. (The), Inc. | |
| Oil, Gas & Consumable Fuels | |
| | |
| | |
| | |
| | |
| | |
| | |
| | |
| Semiconductors & Semiconductor Equipment | |
| | |
| | |
| | |
| | |
| Dick’s Sporting Goods, Inc. | |
| | |
| | |
See Notes to Financial Statements
First Trust Dividend StrengthTM ETF (FTDS)Portfolio of Investments (Continued)December 31, 2024 | | |
MONEY MARKET FUNDS — 0.2% |
| Morgan Stanley Institutional Liquidity Funds - Treasury Portfolio - Institutional Class - 4.37% (a) | |
| | |
|
|
| Total Investments — 100.0% | |
| | |
| Net Other Assets and Liabilities — (0.0)% | |
| | |
| Rate shown reflects yield as of December 31, 2024. |
Valuation InputsA summary of the inputs used to value the Fund’s investments as of December 31, 2024 is as follows (see Note 2A - Portfolio Valuation in the Notes to Financial Statements):
| | | Level 2
Significant
Observable
Inputs | Level 3
Significant
Unobservable
Inputs |
| | | | |
| | | | |
| | | | |
| See Portfolio of Investments for industry breakout. |
See Notes to Financial Statements
First Trust Dow 30 Equal Weight ETF (EDOW)Portfolio of InvestmentsDecember 31, 2024
| | |
|
| Aerospace & Defense — 3.6% | |
| | |
| | |
| | |
| | |
| | |
| | |
| | |
| | |
| | |
| | |
| Goldman Sachs Group (The), Inc. | |
| | |
| Sherwin-Williams (The) Co. | |
| | |
| | |
| | |
| | |
| Consumer Staples Distribution | |
| | |
| Diversified Telecommunication | |
| Verizon Communications, Inc. | |
| | |
| | |
| Financial Services — 3.4% | |
| | |
| | |
| | |
| Hotels, Restaurants & Leisure | |
| | |
| Household Products — 3.4% | |
| Procter & Gamble (The) Co. | |
| Industrial Conglomerates — | |
| | |
| Honeywell International, Inc. | |
| | |
| | |
| Travelers (The) Cos., Inc. | |
| | |
| International Business Machines Corp. | |
| | |
|
| | |
| | |
| Oil, Gas & Consumable Fuels | |
| | |
| | |
| | |
| | |
| | |
| Semiconductors & Semiconductor Equipment | |
| | |
| | |
| | |
| | |
| | |
| | |
| | |
| Technology Hardware, Storage | |
| | |
| Textiles, Apparel & Luxury | |
| | |
| | |
| | |
MONEY MARKET FUNDS — 0.1% |
| Dreyfus Government Cash Management Fund, Institutional Shares - 4.36% (b) | |
| | |
|
|
| Total Investments — 100.0% | |
| | |
| Net Other Assets and Liabilities — 0.0% | |
| | |
| Non-income producing security. |
| Rate shown reflects yield as of December 31, 2024. |
See Notes to Financial Statements
First Trust Dow 30 Equal Weight ETF (EDOW)Portfolio of Investments (Continued)December 31, 2024
Valuation InputsA summary of the inputs used to value the Fund’s investments as of December 31, 2024 is as follows (see Note 2A - Portfolio Valuation in the Notes to Financial Statements):
| | | Level 2
Significant
Observable
Inputs | Level 3
Significant
Unobservable
Inputs |
| | | | |
| | | | |
| | | | |
| See Portfolio of Investments for industry breakout. |
See Notes to Financial Statements
First Trust Lunt U.S. Factor Rotation ETF (FCTR)Portfolio of InvestmentsDecember 31, 2024
| | |
|
| Aerospace & Defense — 3.0% | |
| Axon Enterprise, Inc. (a) | |
| | |
| | |
| | |
| | |
| | |
| | |
| | |
| | |
| | |
| | |
| | |
| | |
| | |
| Citizens Financial Group, Inc. | |
| First Citizens BancShares, Inc., Class A | |
| | |
| | |
| | |
| | |
| | |
| | |
| | |
| Monster Beverage Corp. (a) | |
| | |
| | |
| | |
| | |
| | |
| Lennox International, Inc. | |
| | |
| | |
| | |
| Ares Management Corp., Class A | |
| | |
| | |
| FactSet Research Systems, Inc. | |
| Intercontinental Exchange, Inc. | |
| | |
| Robinhood Markets, Inc., Class A (a) | |
| | |
| | |
| | |
| | |
|
| | |
| LyondellBasell Industries N.V., Class A | |
| | |
| | |
| | |
| | |
| | |
| | |
| | |
| | |
| | |
| Arista Networks, Inc. (a) | |
| | |
| | |
| | |
| Construction & Engineering | |
| | |
| | |
| | |
| | |
| | |
| Capital One Financial Corp. | |
| | |
| | |
| Consumer Staples Distribution | |
| | |
| | |
| | |
| | |
| Diversified Telecommunication | |
| | |
| Electric Utilities — 4.1% | |
| | |
| American Electric Power Co., Inc. | |
| | |
| | |
| | |
| | |
| | |
| | |
| | |
| | |
See Notes to Financial Statements
First Trust Lunt U.S. Factor Rotation ETF (FCTR)Portfolio of Investments (Continued)December 31, 2024 | | |
COMMON STOCKS (Continued) |
| Electrical Equipment — 0.5% | |
| | |
| | |
| | |
| | |
| | |
| Financial Services — 4.9% | |
| Apollo Global Management, Inc. | |
| Berkshire Hathaway, Inc., Class B (a) | |
| Corebridge Financial, Inc. | |
| | |
| | |
| Mastercard, Inc., Class A | |
| | |
| | |
| | |
| Archer-Daniels-Midland Co. | |
| | |
| | |
| | |
| | |
| Lamb Weston Holdings, Inc. | |
| Mondelez International, Inc., Class A | |
| Tyson Foods, Inc., Class A | |
| | |
| | |
| | |
| | |
| | |
| Boston Scientific Corp. (a) | |
| Intuitive Surgical, Inc. (a) | |
| | |
| | |
| | |
| | |
| | |
| | |
| | |
| | |
| | |
| | |
| Tenet Healthcare Corp. (a) | |
| | |
| Hotels, Restaurants & Leisure | |
| | |
| | |
|
| Hotels, Restaurants & Leisure (Continued) | |
| Chipotle Mexican Grill, Inc. (a) | |
| | |
| DoorDash, Inc., Class A (a) | |
| | |
| Royal Caribbean Cruises Ltd. | |
| | |
| | |
| Household Durables — 2.4% | |
| | |
| | |
| | |
| | |
| | |
| | |
| Household Products — 2.2% | |
| Church & Dwight Co., Inc. | |
| | |
| | |
| Procter & Gamble (The) Co. | |
| | |
| Independent Power and Renewable Electricity | |
| | |
| Industrial Conglomerates — | |
| Honeywell International, Inc. | |
| | |
| | |
| American International Group, Inc. | |
| | |
| | |
| | |
| Cincinnati Financial Corp. | |
| Erie Indemnity Co., Class A | |
| | |
| Hartford Financial Services Group (The), Inc. | |
| | |
| Marsh & McLennan Cos., Inc. | |
| | |
| Principal Financial Group, Inc. | |
| | |
| Prudential Financial, Inc. | |
| Travelers (The) Cos., Inc. | |
| | |
See Notes to Financial Statements
First Trust Lunt U.S. Factor Rotation ETF (FCTR)Portfolio of Investments (Continued)December 31, 2024 | | |
COMMON STOCKS (Continued) |
| Interactive Media & Services | |
| Meta Platforms, Inc., Class A | |
| | |
| | |
| | |
| Illinois Tool Works, Inc. | |
| Lincoln Electric Holdings, Inc. | |
| | |
| | |
| | |
| | |
| | |
| | |
| | |
| | |
| | |
| | |
| | |
| | |
| | |
| Consolidated Edison, Inc. | |
| | |
| | |
| | |
| | |
| | |
| Oil, Gas & Consumable Fuels | |
| | |
| | |
| | |
| | |
| | |
| | |
| | |
| | |
| Passenger Airlines — 2.1% | |
| | |
| United Airlines Holdings, Inc. (a) | |
| | |
| | |
| | |
| | |
| | |
| Professional Services — 5.2% | |
| Automatic Data Processing, Inc. | |
| | |
|
| Professional Services (Continued) | |
| Broadridge Financial Solutions, Inc. | |
| | |
| | |
| | |
| | |
| | |
| AvalonBay Communities, Inc. | |
| | |
| | |
| | |
| | |
| Semiconductors & Semiconductor Equipment | |
| | |
| | |
| AppLovin Corp., Class A (a) | |
| | |
| Manhattan Associates, Inc. (a) | |
| | |
| Palantir Technologies, Inc., Class A (a) | |
| | |
| | |
| | |
| Gaming and Leisure Properties, Inc. | |
| | |
| | |
| | |
| | |
| O’Reilly Automotive, Inc. (a) | |
| | |
| | |
| | |
| Technology Hardware, Storage | |
| | |
| Hewlett Packard Enterprise Co. | |
| | |
| | |
| | |
| | |
| | |
| | |
See Notes to Financial Statements
First Trust Lunt U.S. Factor Rotation ETF (FCTR)Portfolio of Investments (Continued)December 31, 2024 | | |
COMMON STOCKS (Continued) |
| | |
| American Water Works Co., Inc. | |
| | |
| | |
MONEY MARKET FUNDS — 0.2% |
| Morgan Stanley Institutional Liquidity Funds - Treasury Portfolio - Institutional Class - 4.37% (b) | |
| | |
|
|
| Total Investments — 100.0% | |
| | |
| Net Other Assets and Liabilities — 0.0% | |
| | |
| Non-income producing security. |
| Rate shown reflects yield as of December 31, 2024. |
Abbreviations throughout the Portfolio of Investments: |
| – Real Estate Investment Trusts |
Valuation InputsA summary of the inputs used to value the Fund’s investments as of December 31, 2024 is as follows (see Note 2A - Portfolio Valuation in the Notes to Financial Statements):
| | | Level 2
Significant
Observable
Inputs | Level 3
Significant
Unobservable
Inputs |
| | | | |
| | | | |
| | | | |
| See Portfolio of Investments for industry breakout. |
See Notes to Financial Statements
First Trust S&P 500 Diversified Free Cash Flow ETF (FCFY)Portfolio of InvestmentsDecember 31, 2024
| | |
|
| Aerospace & Defense — 0.8% | |
| | |
| | |
| | |
| Air Freight & Logistics — | |
| Expeditors International of Washington, Inc. | |
| | |
| | |
| | |
| | |
| | |
| Citizens Financial Group, Inc. | |
| Huntington Bancshares, Inc. | |
| | |
| | |
| | |
| | |
| Molson Coors Beverage Co., Class B | |
| | |
| | |
| | |
| | |
| | |
| Builders FirstSource, Inc. (a) | |
| | |
| | |
| | |
| | |
| | |
| | |
| | |
| | |
| | |
| LyondellBasell Industries N.V., Class A | |
| | |
| | |
| | |
| | |
| | |
| | |
| | |
| Capital One Financial Corp. | |
| | |
|
| Consumer Finance (Continued) | |
| Discover Financial Services | |
| | |
| | |
| Consumer Staples Distribution | |
| | |
| | |
| | |
| Diversified Telecommunication | |
| | |
| Electric Utilities — 1.9% | |
| | |
| | |
| | |
| Electrical Equipment — 1.0% | |
| | |
| Generac Holdings, Inc. (a) | |
| | |
| Electronic Equipment, Instruments & Components | |
| | |
| | |
| | |
| Energy Equipment & Services | |
| | |
| | |
| Warner Bros. Discovery, Inc. (a) | |
| Financial Services — 1.0% | |
| Fidelity National Information Services, Inc. | |
| | |
| Archer-Daniels-Midland Co. | |
| | |
| | |
| | |
| | |
| | |
| | |
| | |
| | |
| | |
| | |
See Notes to Financial Statements
First Trust S&P 500 Diversified Free Cash Flow ETF (FCFY)Portfolio of Investments (Continued)December 31, 2024 | | |
COMMON STOCKS (Continued) |
| Health Care Providers & Services (Continued) | |
| | |
| | |
| | |
| | |
| | |
| | |
| | |
| Alexandria Real Estate Equities, Inc. | |
| Healthpeak Properties, Inc. | |
| | |
| Hotel & Resort REITs — 0.4% | |
| Host Hotels & Resorts, Inc. | |
| Hotels, Restaurants & Leisure | |
| Airbnb, Inc., Class A (a) | |
| | |
| | |
| Household Durables — 1.7% | |
| | |
| Mohawk Industries, Inc. (a) | |
| | |
| Household Products — 0.5% | |
| | |
| Independent Power and Renewable Electricity | |
| | |
| Industrial Conglomerates — | |
| | |
| | |
| | |
| | |
| | |
| Prudential Financial, Inc. | |
| | |
| Interactive Media & Services | |
| | |
| | |
| Akamai Technologies, Inc. (a) | |
| | |
| International Business Machines Corp. | |
| | |
| | |
|
| | |
| | |
| | |
| | |
| | |
| | |
| | |
| Stanley Black & Decker, Inc. | |
| Westinghouse Air Brake Technologies Corp. | |
| | |
| | |
| Interpublic Group of Cos. (The), Inc. | |
| | |
| | |
| | |
| | |
| | |
| | |
| | |
| | |
| Oil, Gas & Consumable Fuels | |
| | |
| | |
| | |
| | |
| | |
| | |
| | |
| | |
| | |
| Professional Services — 1.0% | |
| | |
| | |
| | |
| | |
| | |
| Simon Property Group, Inc. | |
| | |
| Semiconductors & Semiconductor Equipment | |
| | |
| | |
| | |
| | |
| | |
See Notes to Financial Statements
First Trust S&P 500 Diversified Free Cash Flow ETF (FCFY)Portfolio of Investments (Continued)December 31, 2024 | | |
COMMON STOCKS (Continued) |
| | |
| | |
| | |
| | |
| Technology Hardware, Storage | |
| Hewlett Packard Enterprise Co. | |
| | |
| | |
| | |
| Textiles, Apparel & Luxury | |
| | |
| | |
| | |
| | |
| | |
| | |
| | |
MONEY MARKET FUNDS — 0.2% |
| Dreyfus Government Cash Management Fund, Institutional Shares - 4.36% (b) | |
| | |
|
|
| Total Investments — 99.9% | |
| | |
| Net Other Assets and Liabilities — 0.1% | |
| | |
| Non-income producing security. |
| Rate shown reflects yield as of December 31, 2024. |
Abbreviations throughout the Portfolio of Investments: |
| – Real Estate Investment Trusts |
Valuation InputsA summary of the inputs used to value the Fund’s investments as of December 31, 2024 is as follows (see Note 2A - Portfolio Valuation in the Notes to Financial Statements):
| | | Level 2
Significant
Observable
Inputs | Level 3
Significant
Unobservable
Inputs |
| | | | |
| | | | |
| | | | |
| See Portfolio of Investments for industry breakout. |
See Notes to Financial Statements
First Trust Exchange-Traded FundStatements of Assets and Liabilities
December 31, 2024
| First Trust Dividend StrengthTM ETF
(FTDS) | First Trust Dow 30 Equal Weight ETF
(EDOW) | First Trust Lunt U.S. Factor Rotation ETF
(FCTR) | First Trust S&P 500 Diversified Free Cash Flow ETF
(FCFY) |
| | | | |
| | | | |
| | | | |
| | | | |
| | | | |
| | | | |
| | | | |
|
| | | | |
| | | | |
| | | | |
| | | | |
Shareholder reporting fees | | | | |
| | | | |
| | | | |
| | | | |
| | | | |
| | | | |
|
| | | | |
| | | | |
| | | | |
Accumulated distributable earnings (loss) | | | | |
| | | | |
NET ASSET VALUE, per share | | | | |
Number of shares outstanding (unlimited number of shares authorized, par value $0.01 per share) | | | | |
| | | | |
See Notes to Financial Statements
First Trust Exchange-Traded FundStatements of Operations
For the Year Ended December 31, 2024
| First Trust Dividend StrengthTM ETF
(FTDS) | First Trust Dow 30 Equal Weight ETF
(EDOW) | First Trust Lunt U.S. Factor Rotation ETF
(FCTR) | First Trust S&P 500 Diversified Free Cash Flow ETF
(FCFY) |
| | | | |
| | | | |
| | | | |
| | | | |
|
| | | | |
| | | | |
| | | | |
Accounting and administration fees | | | | |
| | | | |
Shareholder reporting fees | | | | |
Trustees’ fees and expenses | | | | |
| | | | |
| | | | |
| | | | |
| | | | |
| | | | |
| | | | |
Less fees waived by the investment advisor | | | | |
| | | | |
NET INVESTMENT INCOME (LOSS) | | | | |
|
NET REALIZED AND UNREALIZED GAIN (LOSS): | | | | |
Net realized gain (loss) on: | | | | |
| | | | |
| | | | |
| | | | |
Net change in unrealized appreciation (depreciation) on investments | | | | |
NET REALIZED AND UNREALIZED GAIN (LOSS) | | | | |
NET INCREASE (DECREASE) IN NET ASSETS RESULTING FROM OPERATIONS | | | | |
| Fund is subject to a unitary fee (see Note 3 in the Notes to Financial Statements). |
See Notes to Financial Statements
First Trust Exchange-Traded FundStatements of Changes in Net Assets
| First Trust Dividend StrengthTM ETF (FTDS) | First Trust Dow 30 Equal Weight ETF (EDOW) |
| | | | |
| | | | |
Net investment income (loss) | | | | |
| | | | |
Net increase from payment by the advisor | | | | |
Net change in unrealized appreciation (depreciation) | | | | |
Net increase (decrease) in net assets resulting from operations | | | | |
|
DISTRIBUTIONS TO SHAREHOLDERS FROM: | | | | |
| | | | |
|
SHAREHOLDER TRANSACTIONS: | | | | |
Proceeds from shares sold | | | | |
| | | | |
Net increase (decrease) in net assets resulting from shareholder transactions | | | | |
Total increase (decrease) in net assets | | | | |
|
| | | | |
| | | | |
| | | | |
|
CHANGES IN SHARES OUTSTANDING: | | | | |
Shares outstanding, beginning of period | | | | |
| | | | |
| | | | |
Shares outstanding, end of period | | | | |
| Inception date is August 23, 2023, which is consistent with the commencement of investment operations and is the date the initial creation units were established. |
See Notes to Financial Statements
First Trust Lunt U.S. Factor Rotation ETF (FCTR) | First Trust S&P 500 Diversified Free Cash Flow ETF (FCFY) |
| | | Period
Ended
12/31/2023 (a) |
| | | |
| | | |
| | | |
| | | |
| | | |
| | | |
|
| | | |
| | | |
|
| | | |
| | | |
| | | |
| | | |
| | | |
|
| | | |
| | | |
| | | |
|
| | | |
| | | |
| | | |
| | | |
| | | |
See Notes to Financial Statements
First Trust Exchange-Traded FundFinancial Highlights
For a share outstanding throughout each period First Trust Dividend StrengthTM ETF (FTDS)
| |
| | | | | |
Net asset value, beginning of period | | | | | |
Income from investment operations: | | | | | |
Net investment income (loss) | | | | | |
Net realized and unrealized gain (loss) | | | | | |
Total from investment operations | | | | | |
Distributions paid to shareholders from: | | | | | |
| | | | | |
Net asset value, end of period | | | | | |
| | | | | |
|
Ratios to average net assets/supplemental data: | | | | | |
Net assets, end of period (in 000’s) | | | | | |
Ratio of total expenses to average net assets | | | | | |
Ratio of net expenses to average net assets | | | | | |
Ratio of net investment income (loss) to average net assets | | | | | |
Portfolio turnover rate (c) | | | | | |
| Based on average shares outstanding. |
| Total return is calculated assuming an initial investment made at the net asset value at the beginning of the period, reinvestment of all distributions at net asset value during the period, and redemption at net asset value on the last day of the period. The returns presented do not reflect the deduction of taxes that a shareholder would pay on Fund distributions or the redemption or sale of Fund shares. Total return is calculated for the time period presented and is not annualized for periods of less than a year. The total returns would have been lower if certain fees had not been waived and expenses reimbursed by the investment advisor. |
| Portfolio turnover is calculated for the time period presented and is not annualized for periods of less than a year and does not include securities received or delivered from processing creations or redemptions and in-kind transactions. |
| The variation in the portfolio turnover rate is due to the change in the Fund’s underlying index effective April 29, 2022, which resulted in a complete rebalance of the Fund’s portfolio. |
See Notes to Financial Statements
First Trust Exchange-Traded FundFinancial Highlights (Continued)
For a share outstanding throughout each period First Trust Dow 30 Equal Weight ETF (EDOW)
| |
| | | | | |
Net asset value, beginning of period | | | | | |
Income from investment operations: | | | | | |
Net investment income (loss) | | | | | |
Net realized and unrealized gain (loss) | | | | | |
Total from investment operations | | | | | |
Distributions paid to shareholders from: | | | | | |
| | | | | |
Net asset value, end of period | | | | | |
| | | | | |
|
Ratios to average net assets/supplemental data: | | | | | |
Net assets, end of period (in 000’s) | | | | | |
Ratio of total expenses to average net assets | | | | | |
Ratio of net investment income (loss) to average net assets | | | | | |
Portfolio turnover rate (c) | | | | | |
| Based on average shares outstanding. |
| Total return is calculated assuming an initial investment made at the net asset value at the beginning of the period, reinvestment of all distributions at net asset value during the period, and redemption at net asset value on the last day of the period. The returns presented do not reflect the deduction of taxes that a shareholder would pay on Fund distributions or the redemption or sale of Fund shares. Total return is calculated for the time period presented and is not annualized for periods of less than a year. |
| Portfolio turnover is calculated for the time period presented and is not annualized for periods of less than a year and does not include securities received or delivered from processing creations or redemptions and in-kind transactions. |
See Notes to Financial Statements
First Trust Exchange-Traded FundFinancial Highlights (Continued)
For a share outstanding throughout each period First Trust Lunt U.S. Factor Rotation ETF (FCTR)
| |
| | | | | |
Net asset value, beginning of period | | | | | |
Income from investment operations: | | | | | |
Net investment income (loss) | | | | | |
Net realized and unrealized gain (loss) | | | | | |
Total from investment operations | | | | | |
Distributions paid to shareholders from: | | | | | |
| | | | | |
Net asset value, end of period | | | | | |
| | | | | |
|
Ratios to average net assets/supplemental data: | | | | | |
Net assets, end of period (in 000’s) | | | | | |
Ratio of total expenses to average net assets | | | | | |
Ratio of net investment income (loss) to average net assets | | | | | |
Portfolio turnover rate (d) | | | | | |
| Based on average shares outstanding. |
| The Fund received a payment from the advisor in the amount of $25,082, which represents $0.01 per share. Since the advisor reimbursed the Fund, there was no effect on the Fund’s total return. |
| Total return is calculated assuming an initial investment made at the net asset value at the beginning of the period, reinvestment of all distributions at net asset value during the period, and redemption at net asset value on the last day of the period. The returns presented do not reflect the deduction of taxes that a shareholder would pay on Fund distributions or the redemption or sale of Fund shares. Total return is calculated for the time period presented and is not annualized for periods of less than a year. |
| Portfolio turnover is calculated for the time period presented and is not annualized for periods of less than a year and does not include securities received or delivered from processing creations or redemptions and in-kind transactions. |
See Notes to Financial Statements
First Trust Exchange-Traded FundFinancial Highlights (Continued)
For a share outstanding throughout each period First Trust S&P 500 Diversified Free Cash Flow ETF (FCFY)
| Year Ended December 31,
2024 | Period
Ended
12/31/2023 (a) |
|
Net asset value, beginning of period | | |
Income from investment operations: | | |
Net investment income (loss) (b) | | |
Net realized and unrealized gain (loss) | | |
Total from investment operations | | |
Distributions paid to shareholders from: | | |
| | |
Net asset value, end of period | | |
| | |
|
Ratios to average net assets/supplemental data: | | |
Net assets, end of period (in 000’s) | | |
Ratio of total expenses to average net assets | | |
Ratio of net investment income (loss) to average net assets | | |
Portfolio turnover rate (e) | | |
| Inception date is August 23, 2023, which is consistent with the commencement of investment operations and is the date the initial creation units were established. |
| Based on average shares outstanding. |
| Total return is calculated assuming an initial investment made at the net asset value at the beginning of the period, reinvestment of all distributions at net asset value during the period, and redemption at net asset value on the last day of the period. The returns presented do not reflect the deduction of taxes that a shareholder would pay on Fund distributions or the redemption or sale of Fund shares. Total return is calculated for the time period presented and is not annualized for periods of less than a year. |
| |
| Portfolio turnover is calculated for the time period presented and is not annualized for periods of less than a year and does not include securities received or delivered from processing creations or redemptions and in-kind transactions. |
See Notes to Financial Statements
Notes to Financial Statements
First Trust Exchange-Traded FundDecember 31, 2024
1. Organization
First Trust Exchange-Traded Fund (the “Trust”) is an open-end management investment company organized as a Massachusetts business trust on August 8, 2003, and is registered with the Securities and Exchange Commission under the Investment Company Act of 1940, as amended (the “1940 Act”).
This report covers the four funds (each a “Fund” and collectively, the “Funds”) listed below:
First Trust Dividend StrengthTM ETF – (Nasdaq, Inc. (“Nasdaq”) ticker “FTDS”) |
First Trust Dow 30 Equal Weight ETF – (NYSE Arca, Inc. (“NYSE Arca”) ticker “EDOW”) |
First Trust Lunt U.S. Factor Rotation ETF – (Cboe BZX Exchange, Inc. ticker “FCTR”) |
First Trust S&P 500 Diversified Free Cash Flow ETF – (NYSE Arca ticker “FCFY”) |
FCFY operates as a non-diversified series of the Trust. Each of FTDS, EDOW and FCTR operates as a diversified open-end management investment company as defined in Section 5(b) of the 1940 Act. Each Fund represents a separate series of shares of beneficial interest in the Trust. Unlike conventional mutual funds, each Fund issues and redeems shares on a continuous basis at net asset value (“NAV”), only in large blocks of shares known as “Creation Units.” The investment objective of each Fund is to seek investment results that correspond generally to the price and yield (before the Fund’s fees and expenses) of the following indices:
| |
First Trust Dividend StrengthTM ETF | The Dividend StrengthTM Index |
First Trust Dow 30 Equal Weight ETF | Dow Jones Industrial Average® Equal Weight Index |
First Trust Lunt U.S. Factor Rotation ETF | Lunt Capital Large Cap Factor Rotation Index |
First Trust S&P 500 Diversified Free Cash Flow ETF | S&P 500® Sector-Neutral FCF Index |
2. Significant Accounting Policies
The Funds are each considered an investment company and follow accounting and reporting guidance under Financial Accounting Standards Board (“FASB”) Accounting Standards Codification Topic 946, “Financial Services-Investment Companies.” The following is a summary of significant accounting policies consistently followed by the Funds in the preparation of the financial statements. The preparation of the financial statements in accordance with accounting principles generally accepted in the United States of America (“U.S. GAAP”) requires management to make estimates and assumptions that affect the reported amounts and disclosures in the financial statements. Actual results could differ from those estimates.
Each Fund’s NAV is determined daily as of the close of regular trading on the New York Stock Exchange (“NYSE”), normally 4:00 p.m. Eastern time, on each day the NYSE is open for trading. If the NYSE closes early on a valuation day, the NAV is determined as of that time. Each Fund’s NAV is calculated by dividing the value of all assets of each Fund (including accrued interest and dividends), less all liabilities (including accrued expenses and dividends declared but unpaid), by the total number of shares outstanding.
Each Fund’s investments are valued daily at market value or, in the absence of market value with respect to any portfolio securities, at fair value. Market value prices represent readily available market quotations such as last sale or official closing prices from a national or foreign exchange (i.e., a regulated market) and are primarily obtained from third-party pricing services. Fair value prices represent any prices not considered market value prices and are either obtained from a third-party pricing service or are determined by the Pricing Committee of the Funds’ investment advisor, First Trust Advisors L.P. (“First Trust” or the “Advisor”), in accordance with valuation procedures approved by the Trust’s Board of Trustees, and in accordance with provisions of the 1940 Act and rules thereunder. Investments valued by the Advisor’s Pricing Committee, if any, are footnoted as such in the footnotes to the Portfolio of Investments. Each Fund’s investments are valued as follows:
Common stocks and other equity securities listed on any national or foreign exchange (excluding Nasdaq and the London Stock Exchange Alternative Investment Market (“AIM”)) are valued at the last sale price on the exchange on which they are principally traded or, for Nasdaq and AIM securities, the official closing price. Securities traded on more than one securities exchange are valued at the last sale price or official closing price, as applicable, at the close of the securities exchange representing the primary exchange for such securities.
Shares of open-end funds are valued based on NAV per share.
Notes to Financial Statements (Continued)
First Trust Exchange-Traded FundDecember 31, 2024 Equity securities traded in an over-the-counter market are valued at the close price or the last trade price.
Certain securities may not be able to be priced by pre-established pricing methods. Such securities may be valued by the Advisor’s Pricing Committee at fair value. These securities generally include, but are not limited to, restricted securities (securities which may not be publicly sold without registration under the Securities Act of 1933, as amended) for which a third-party pricing service is unable to provide a market price; securities whose trading has been formally suspended; a security whose market or fair value price is not available from a pre-established pricing source; a security with respect to which an event has occurred that is likely to materially affect the value of the security after the market has closed but before the calculation of a Fund’s NAV or make it difficult or impossible to obtain a reliable market quotation; and a security whose price, as provided by the third-party pricing service, does not reflect the security’s fair value. As a general principle, the current fair value of a security would appear to be the amount which the owner might reasonably expect to receive for the security upon its current sale. When fair value prices are used, generally they will differ from market quotations or official closing prices on the applicable exchanges. A variety of factors may be considered in determining the fair value of such securities, including, but not limited to, the following:
1)
the last sale price on the exchange on which they are principally traded or, for Nasdaq and AIM securities, the official closing price;
3)
the size of the holding;
4)
the initial cost of the security;
5)
transactions in comparable securities;
6)
price quotes from dealers and/or third-party pricing services;
7)
relationships among various securities;
8)
information obtained by contacting the issuer, analysts, or the appropriate stock exchange;
9)
an analysis of the issuer’s financial statements;
10)
the existence of merger proposals or tender offers that might affect the value of the security; and
11)
other relevant factors.
In addition, differences between the prices used to calculate a Fund’s NAV and the prices used by such Fund’s corresponding index could result in a difference between a Fund’s performance and the performance of its underlying index.
The Funds are subject to fair value accounting standards that define fair value, establish the framework for measuring fair value and provide a three-level hierarchy for fair valuation based upon the inputs to the valuation as of the measurement date. The three levels of the fair value hierarchy are as follows:
• Level 1 – Level 1 inputs are quoted prices in active markets for identical investments. An active market is a market in which transactions for the investment occur with sufficient frequency and volume to provide pricing information on an ongoing basis.
• Level 2 – Level 2 inputs are observable inputs, either directly or indirectly, and include the following:
o Quoted prices for similar investments in active markets.
o Quoted prices for identical or similar investments in markets that are non-active. A non-active market is a market where there are few transactions for the investment, the prices are not current, or price quotations vary substantially either over time or among market makers, or in which little information is released publicly.
o Inputs other than quoted prices that are observable for the investment (for example, interest rates and yield curves observable at commonly quoted intervals, volatilities, prepayment speeds, loss severities, credit risks, and default rates).
o Inputs that are derived principally from or corroborated by observable market data by correlation or other means.
• Level 3 – Level 3 inputs are unobservable inputs. Unobservable inputs may reflect the reporting entity’s own assumptions about the assumptions that market participants would use in pricing the investment.
The inputs or methodologies used for valuing investments are not necessarily an indication of the risk associated with investing in those investments. A summary of the inputs used to value each Fund’s investments as of December 31, 2024, is included with each Fund’s Portfolio of Investments.
B. Securities Transactions and Investment Income
Securities transactions are recorded as of the trade date. Realized gains and losses from securities transactions are recorded on the identified cost basis. Dividend income is recorded on the ex-dividend date. Interest income, if any, is recorded on the accrual basis.
Notes to Financial Statements (Continued)
First Trust Exchange-Traded FundDecember 31, 2024 Withholding taxes and tax reclaims on foreign dividends have been provided for in accordance with each Fund’s understanding of the applicable country’s tax rules and rates.
Distributions received from a Fund’s investments in real estate investment trusts (“REITs”) may be comprised of return of capital, capital gains, and income. The actual character of the amounts received during the year are not known until after the REITs’ fiscal year end. A Fund records the character of distributions received from the REITs during the year based on estimates available. The characterization of distributions received by a Fund may be subsequently revised based on information received from the REITs after their tax reporting periods conclude.
C. Dividends and Distributions to Shareholders
Dividends from net investment income of each Fund, if any, are declared and paid quarterly, or as the Board of Trustees may determine from time to time. Distributions of net realized capital gains earned by each Fund, if any, are distributed at least annually. Each Fund may also designate a portion of the amount paid to redeeming shareholders as a distribution for tax purposes.
Distributions from net investment income and realized capital gains are determined in accordance with federal income tax regulations, which may differ from U.S. GAAP. Certain capital accounts in the financial statements are periodically adjusted for permanent differences in order to reflect their tax character. These permanent differences are primarily due to the varying treatment of income and gain/loss on portfolio securities held by the Funds and have no impact on net assets or NAV per share. Temporary differences, which arise from recognizing certain items of income, expense and gain/loss in different periods for financial statement and tax purposes, will reverse at some time in the future.
The tax character of distributions paid by each Fund during the fiscal year ended December 31, 2024 were as follows:
| Distributions
paid from
Ordinary
Income | Distributions
paid from
Capital
Gains | Distributions
paid from
Return of
Capital |
First Trust Dividend StrengthTM ETF | | | |
First Trust Dow 30 Equal Weight ETF | | | |
First Trust Lunt U.S. Factor Rotation ETF | | | |
First Trust S&P 500 Diversified Free Cash Flow ETF | | | |
The tax character of distributions paid by each Fund during the fiscal period ended December 31, 2023 were as follows:
| Distributions
paid from
Ordinary
Income | Distributions
paid from
Capital
Gains | Distributions
paid from
Return of
Capital |
First Trust Dividend StrengthTM ETF | | | |
First Trust Dow 30 Equal Weight ETF | | | |
First Trust Lunt U.S. Factor Rotation ETF | | | |
First Trust S&P 500 Diversified Free Cash Flow ETF | | | |
As of December 31, 2024, the components of distributable earnings on a tax basis for each Fund were as follows:
| Undistributed
Ordinary
Income | Accumulated
Capital and
Other
Gain (Loss) | Net
Unrealized
Appreciation
(Depreciation) |
First Trust Dividend StrengthTM ETF | | | |
First Trust Dow 30 Equal Weight ETF | | | |
First Trust Lunt U.S. Factor Rotation ETF | | | |
First Trust S&P 500 Diversified Free Cash Flow ETF | | | |
Notes to Financial Statements (Continued)
First Trust Exchange-Traded FundDecember 31, 2024 D. Income Taxes
Each Fund intends to continue to qualify as a regulated investment company by complying with the requirements under Subchapter M of the Internal Revenue Code of 1986, as amended, which includes distributing substantially all of its net investment income and net realized gains to shareholders. Accordingly, no provision has been made for federal and state income taxes. However, due to the timing and amount of distributions, each Fund may be subject to an excise tax of 4% of the amount by which approximately 98% of each Fund’s taxable income exceeds the distributions from such taxable income for the calendar year.
The Funds are subject to accounting standards that establish a minimum threshold for recognizing, and a system for measuring, the benefits of a tax position taken or expected to be taken in a tax return. For FTDS, EDOW, and FCTR, the taxable years ended 2021, 2022, 2023, and 2024 remain open to federal and state audit. For FCFY, the taxable period ended 2023 and taxable year ended 2024 remain open to federal and state audit. As of December 31, 2024, management has evaluated the application of these standards to the Funds and has determined that no provision for income tax is required in the Funds’ financial statements for uncertain tax positions.
Each Fund intends to utilize provisions of the federal income tax laws, which allow it to carry a realized capital loss forward indefinitely following the year of the loss and offset such loss against any future realized capital gains. Each Fund is subject to certain limitations under U.S. tax rules on the use of capital loss carryforwards and net unrealized built-in losses. These limitations apply when there has been a 50% change in ownership. At December 31, 2024, for federal income tax purposes, each applicable Fund had a capital loss carryforward available that is shown in the following table, to the extent provided by regulations, to offset future capital gains. To the extent that these loss carryforwards are used to offset future capital gains, it is probable that the capital gains so offset will not be distributed to each applicable Fund’s shareholders.
| Non-Expiring
Capital Loss
Carryforwards |
First Trust Dividend StrengthTM ETF | |
First Trust Dow 30 Equal Weight ETF* | |
First Trust Lunt U.S. Factor Rotation ETF | |
First Trust S&P 500 Diversified Free Cash Flow ETF | |
| $3,196,504 of First Trust Dow 30 Equal Weight ETF’s non-expiring net capital losses is subject to loss limitation resulting from reorganization activity. This limitation generally reduces the utilization of these losses to a maximum of $212,620 per year. |
During the taxable year ended December 31, 2024, the following Fund utilized capital loss carryforwards in the following amount:
| |
First Trust Lunt U.S. Factor Rotation ETF | |
Certain losses realized during the current fiscal year may be deferred and treated as occurring on the first day of the following fiscal year for federal income tax purposes. For the fiscal year ended December 31, 2024, the Funds had no net late year ordinary or capital losses.
In order to present paid-in capital and accumulated distributable earnings (loss) (which consists of accumulated net investment income (loss), accumulated net realized gain (loss) on investments and net unrealized appreciation (depreciation) on investments) on the Statements of Assets and Liabilities that more closely represent their tax character, certain adjustments have been made to paid-in capital, accumulated net investment income (loss) and accumulated net realized gain (loss) on investments. These adjustments are primarily due to the difference between book and tax treatments of income and gains on various investment securities held by the Funds and in-kind transactions. The results of operations and net assets were not affected by these adjustments. For the fiscal year ended December 31, 2024, the adjustments for each Fund were as follows:
| Accumulated
Net Investment
Income (Loss) | Accumulated
Net Realized
Gain (Loss)
on Investments | |
First Trust Dividend StrengthTM ETF | | | |
Notes to Financial Statements (Continued)
First Trust Exchange-Traded FundDecember 31, 2024 | Accumulated Net Investment Income (Loss) | Accumulated Net Realized Gain (Loss) on Investments | |
First Trust Dow 30 Equal Weight ETF | | | |
First Trust Lunt U.S. Factor Rotation ETF | | | |
First Trust S&P 500 Diversified Free Cash Flow ETF | | | |
As of December 31, 2024, the aggregate cost, gross unrealized appreciation, gross unrealized depreciation, and net unrealized appreciation/(depreciation) on investments (including short positions and derivatives, if any) for federal income tax purposes were as follows:
| | Gross Unrealized
Appreciation | Gross Unrealized
(Depreciation) | Net Unrealized
Appreciation
(Depreciation) |
First Trust Dividend StrengthTM ETF | | | | |
First Trust Dow 30 Equal Weight ETF | | | | |
First Trust Lunt U.S. Factor Rotation ETF | | | | |
First Trust S&P 500 Diversified Free Cash Flow ETF | | | | |
Expenses that are directly related to First Trust Dividend StrengthTM ETF (the “Non-Unitary Fee Fund”) are charged directly to the Fund. Expenses for First Trust Dow 30 Equal Weight ETF, First Trust Lunt U.S. Factor Rotation ETF, and First Trust S&P 500 Diversified Free Cash Flow ETF (the “Unitary Fee Funds”), other than excluded expenses (discussed in Note 3), are paid by the Advisor. General expenses of the Trust are allocated to all the Funds based upon the net assets of each Fund.
First Trust has entered into licensing agreements with each of the following “Licensors” for the respective Funds:
| |
First Trust Dividend StrengthTM ETF | |
First Trust Dow 30 Equal Weight ETF | S&P Dow Jones Indices LLC |
First Trust Lunt U.S. Factor Rotation ETF | Lunt Capital Management, Inc. |
First Trust S&P 500 Diversified Free Cash Flow ETF | S&P Dow Jones Indices LLC |
The respective license agreements allow for the use by First Trust of each Fund’s respective index and of certain trademarks and trade names of the respective Licensors. The Funds are sub-licensees to the applicable license agreements. The Funds, except for the Unitary Fee Funds, are required to pay licensing fees, which are shown on the Statements of Operations. The licensing fees for the Unitary Fee Funds are paid by First Trust from the unitary investment advisory fees it receives from each of these Funds.
Each Fund has adopted FASB Accounting Standards Update 2023-07, Segment Reporting (Topic 280) - Improvements to Reportable Segment Disclosures (“ASU 2023-07”). Adoption of the standard impacted financial statement disclosures only and did not affect each Fund’s financial position or the results of its operations. An operating segment is defined in Topic 280 as a component of a public entity that engages in business activities from which it may recognize revenues and incur expenses, has operating results that are regularly reviewed by the public entity’s chief operating decision maker (“CODM”) to make decisions about resources to be allocated to the segment and assess its performance, and has discrete financial information available. The CODM is the President and Chief Executive Officer of each Fund. Each Fund operates as a single operating segment. Each Fund’s income, expenses, assets, changes in net assets resulting from operations and performance are regularly monitored and assessed as a whole by the CODM responsible for oversight functions of the Fund, using the information presented in the financial statements and financial highlights.
3. Investment Advisory Fee, Affiliated Transactions and Other Fee Arrangements
First Trust, the investment advisor to the Funds, is a limited partnership with one limited partner, Grace Partners of DuPage L.P., and one general partner, The Charger Corporation. The Charger Corporation is an Illinois corporation controlled by James A. Bowen,
Notes to Financial Statements (Continued)
First Trust Exchange-Traded FundDecember 31, 2024 Chief Executive Officer of First Trust. First Trust is responsible for the selection and ongoing monitoring of the securities in each Fund’s portfolio, managing the Funds’ business affairs and providing certain administrative services necessary for the management of the Funds.
The management fee payable by First Trust Dividend StrengthTM ETF to First Trust for these services will be reduced at certain levels of First Trust Dividend StrengthTM ETF’s net assets (“breakpoints”) and calculated pursuant to the following schedule:
| |
Fund net assets up to and including $2.5 billion | |
Fund net assets greater than $2.5 billion up to and including $5 billion | |
Fund net assets greater than $5 billion up to and including $7.5 billion | |
Fund net assets greater than $7.5 billion up to and including $10 billion | |
Fund net assets greater than $10 billion up to and including $15 billion | |
Fund net assets greater than $15 billion | |
For the First Trust Dividend StrengthTM ETF, the Trust and the Advisor have entered into an Expense Reimbursement and Fee Waiver Agreement (“Agreement”) in which First Trust has agreed to waive fees and/or reimburse Fund expenses to the extent that the operating expenses of the Fund (excluding interest expense, brokerage commissions and other trading expenses, acquired fund fees and expenses, taxes and extraordinary expenses) exceed 0.70% of average daily net assets per year (the “Expense Cap”). The Expense Cap will be in effect until at least April 30, 2026.
For the Unitary Fee Funds, First Trust is paid an annual unitary management fee of such Fund’s average daily net assets and is responsible for the expenses of such Fund including the cost of transfer agency, custody, fund administration, legal, audit, licensing and other services, but excluding fee payments under the Investment Management Agreement, distribution and service fees pursuant to a Rule 12b-1 plan, if any, brokerage commissions and other expenses connected with the execution of portfolio transactions, acquired fund fees and expenses, taxes, interest, and extraordinary expenses. The annual unitary management fee payable by each Fund to First Trust for these services will be reduced at certain levels of each Fund’s net assets (“breakpoints”) and calculated pursuant to the following schedule:
| | | |
Fund net assets up to and including $2.5 billion | | | |
Fund net assets greater than $2.5 billion up to and including $5 billion | | | |
Fund net assets greater than $5 billion up to and including $7.5 billion | | | |
Fund net assets greater than $7.5 billion up to and including $10 billion | | | |
Fund net assets greater than $10 billion up to and including $15 billion | | | |
Fund net assets greater than $15 billion | | | |
For the fiscal year ended December 31, 2023, FCTR received a payment from the Advisor in the amount of $25,082 in connection with a trade error.
The Trust has multiple service agreements with The Bank of New York Mellon (“BNY”). Under the service agreements, BNY performs custodial, fund accounting, certain administrative services, and transfer agency services for each Fund. As custodian, BNY is responsible for custody of each Fund’s assets. As fund accountant and administrator, BNY is responsible for maintaining the books and records of each Fund’s securities and cash. As transfer agent, BNY is responsible for maintaining shareholder records for each Fund. BNY is a subsidiary of The Bank of New York Mellon Corporation, a financial holding company.
Each Trustee who is not an officer or employee of First Trust, any sub-advisor or any of their affiliates (“Independent Trustees”) is paid a fixed annual retainer that is allocated equally among each fund in the First Trust Fund Complex. Each Independent Trustee is also paid an annual per fund fee that varies based on whether the fund is a closed-end or other actively managed fund, a target outcome fund or an index fund.
Additionally, the Chairs of the Audit Committee, Nominating and Governance Committee and Valuation Committee, the Vice Chair of the Audit Committee, the Lead Independent Trustee and the Vice Lead Independent Trustee are paid annual fees to serve in such capacities, with such compensation allocated pro rata among each fund in the First Trust Fund Complex based on net assets. Independent Trustees are reimbursed for travel and out-of-pocket expenses in connection with all meetings. The Committee Chairs,
Notes to Financial Statements (Continued)
First Trust Exchange-Traded FundDecember 31, 2024 the Audit Committee Vice Chair, the Lead Independent Trustee and the Vice Lead Independent Trustee rotate periodically in serving in such capacities. The officers and “Interested” Trustee receive no compensation from the Trust for acting in such capacities.
4. Purchases and Sales of Securities
For the fiscal year ended December 31, 2024, the cost of purchases and proceeds from sales of investments for each Fund, excluding short-term investments and in-kind transactions, were as follows:
| | |
First Trust Dividend StrengthTM ETF | | |
First Trust Dow 30 Equal Weight ETF | | |
First Trust Lunt U.S. Factor Rotation ETF | | |
First Trust S&P 500 Diversified Free Cash Flow ETF | | |
For the fiscal year ended December 31, 2024, the cost of in-kind purchases and proceeds from in-kind sales for each Fund were as follows:
| | |
First Trust Dividend StrengthTM ETF | | |
First Trust Dow 30 Equal Weight ETF | | |
First Trust Lunt U.S. Factor Rotation ETF | | |
First Trust S&P 500 Diversified Free Cash Flow ETF | | |
5. Creations, Redemptions and Transaction Fees
Each Fund generally issues and redeems its shares in primary market transactions through a creation and redemption mechanism and does not sell or redeem individual shares. Instead, financial entities known as “Authorized Participants” have contractual arrangements with a Fund or one of the Fund’s service providers to purchase and redeem Fund shares directly with the Fund in Creation Units. Prior to the start of trading on every business day, a Fund publishes through the National Securities Clearing Corporation the “basket” of securities, cash or other assets that it will accept in exchange for a Creation Unit of the Fund’s shares. An Authorized Participant that wishes to effectuate a creation of a Fund’s shares deposits with the Fund the “basket” of securities, cash or other assets identified by the Fund that day, and then receives the Creation Unit of the Fund’s shares in return for those assets. After purchasing a Creation Unit, the Authorized Participant may continue to hold the Fund’s shares or sell them in the secondary market. The redemption process is the reverse of the purchase process: the Authorized Participant redeems a Creation Unit of a Fund’s shares for a basket of securities, cash or other assets. The combination of the creation and redemption process with secondary market trading in a Fund’s shares and underlying securities provides arbitrage opportunities that are designed to help keep the market price of a Fund’s shares at or close to the NAV per share of the Fund.
Each Fund imposes fees in connection with the purchase of Creation Units. These fees may vary based upon various fact-based circumstances, including, but not limited to, the composition of the securities included in the Creation Unit or the countries in which the transactions are settled. The price for each Creation Unit will equal the daily NAV per share of a Fund times the number of shares in a Creation Unit, plus the fees described above and, if applicable, any operational processing and brokerage costs, transfer fees, stamp taxes and part or all of the spread between the expected bid and offer side of the market related to the securities comprising the creation basket.
Each Fund also imposes fees in connection with the redemption of Creation Units. These fees may vary based upon various fact-based circumstances, including, but not limited to, the composition of the securities included in the Creation Unit or the countries in which the transactions are settled. The price received for each Creation Unit will equal the daily NAV per share of a Fund times the number of shares in a Creation Unit, minus the fees described above and, if applicable, any operational processing and brokerage costs, transfer fees, stamp taxes and part or all of the spread between the expected bid and offer side of the market related to the securities comprising the redemption basket. Investors who use the services of a broker or other such intermediary in addition to an Authorized Participant to effect a redemption of a Creation Unit may also be assessed an amount to cover the cost of such services. The redemption fee charged by a Fund will comply with Rule 22c-2 of the 1940 Act which limits redemption fees to no more than 2% of the value of the shares redeemed.
Notes to Financial Statements (Continued)
First Trust Exchange-Traded FundDecember 31, 2024 6. Distribution Plan
The Board of Trustees adopted a Distribution and Service Plan pursuant to Rule 12b-1 under the 1940 Act. In accordance with the Rule 12b-1 plan, the Funds are authorized to pay an amount up to 0.25% of their average daily net assets each year to reimburse First Trust Portfolios L.P. (“FTP”), the distributor of the Funds, for amounts expended to finance activities primarily intended to result in the sale of Creation Units or the provision of investor services. FTP may also use this amount to compensate securities dealers or other persons that are Authorized Participants for providing distribution assistance, including broker-dealer and shareholder support and educational and promotional services.
No 12b-1 fees are currently paid by the Funds, and pursuant to a contractual arrangement, no 12b-1 fees will be paid any time before April 30, 2026.
The Trust, on behalf of the Funds, has a variety of indemnification obligations under contracts with its service providers. The Trust’s maximum exposure under these arrangements is unknown. However, the Trust has not had prior claims or losses pursuant to these contracts and expects the risk of loss to be remote.
Management has evaluated the impact of all subsequent events on the Funds through the date the financial statements were issued and has determined that there were no subsequent events requiring recognition or disclosure in the financial statements that have not already been disclosed.
Report of Independent Registered Public Accounting Firm
To the Shareholders and the Board of Trustees of First Trust Exchange-Traded Fund:
Opinion on the Financial Statements and Financial Highlights
We have audited the accompanying statements of assets and liabilities of First Trust Dividend StrengthTM ETF, First Trust Dow 30 Equal Weight ETF, First Trust Lunt U.S. Factor Rotation ETF, and First Trust S&P 500 Diversified Free Cash Flow ETF (the “Funds”), each a series of First Trust Exchange-Traded Fund, including the portfolios of investments, as of December 31, 2024, the related statements of operations, the statements of changes in net assets, and the financial highlights for the periods indicated in the table below; and the related notes. In our opinion, the financial statements and financial highlights present fairly, in all material respects, the financial position of each of the Funds as of December 31, 2024, and the results of their operations, the changes in their net assets, and the financial highlights for the periods listed in the table below in conformity with accounting principles generally accepted in the United States of America.
Individual Funds
Included in the Trust | | Statements of
Changes in Net Assets | |
First Trust Dividend StrengthTM ETF | For the year ended December 31, 2024 | For the years ended December 31, 2024 and 2023 | For the years ended December 31, 2024, 2023, 2022, 2021, and 2020 |
First Trust Dow 30 Equal Weight ETF |
First Trust Lunt U.S. Factor Rotation ETF |
First Trust S&P 500 Diversified Free Cash Flow ETF | For the year ended December 31, 2024 | For the year ended December 31, 2024, and the period from August 23, 2023 (commencement of investment operations) through December 31, 2023 |
These financial statements and financial highlights are the responsibility of the Funds’ management. Our responsibility is to express an opinion on the Funds’ financial statements and financial highlights based on our audits. We are a public accounting firm registered with the Public Company Accounting Oversight Board (United States) (PCAOB) and are required to be independent with respect to the Funds in accordance with the U.S. federal securities laws and the applicable rules and regulations of the Securities and Exchange Commission and the PCAOB.
We conducted our audits in accordance with the standards of the PCAOB. Those standards require that we plan and perform the audit to obtain reasonable assurance about whether the financial statements and financial highlights are free of material misstatement, whether due to error or fraud. The Funds are not required to have, nor were we engaged to perform, an audit of their internal control over financial reporting. As part of our audits, we are required to obtain an understanding of internal control over financial reporting but not for the purpose of expressing an opinion on the effectiveness of the Funds’ internal control over financial reporting. Accordingly, we express no such opinion.
Our audits included performing procedures to assess the risks of material misstatement of the financial statements and financial highlights, whether due to error or fraud, and performing procedures that respond to those risks. Such procedures included examining, on a test basis, evidence regarding the amounts and disclosures in the financial statements and financial highlights. Our audits also included evaluating the accounting principles used and significant estimates made by management, as well as evaluating the overall presentation of the financial statements and financial highlights. Our procedures included confirmation of securities owned as of December 31, 2024, by correspondence with the custodian and brokers; when replies were not received from brokers, we performed other auditing procedures. We believe that our audits provide a reasonable basis for our opinion.
/s/ Deloitte & Touche, LLP
Chicago, Illinois
February 24, 2025
We have served as the auditor of one or more First Trust investment companies since 2001.
First Trust Exchange-Traded FundDecember 31, 2024 (Unaudited)
Changes in and Disagreements with Accountants (Item 8 of Form N-CSR)
There were no changes in or disagreements with the Funds’ accountants during the fiscal year ended December 31, 2024.
Proxy Disclosures (Item 9 of Form N-CSR)
There were no matters submitted for vote by shareholders of any Fund during the fiscal year ended December 31, 2024.
Remuneration Paid to Directors, Officers, and Others (Item 10 of Form N-CSR)
For the Non-Unitary Fee Fund (as defined in the Notes to Financial Statements), the applicable aggregate remuneration paid by the Fund during the period covered by the report is included in the Statements of Operations. For the Unitary Fee Funds (as defined in the Notes to Financial Statements), Independent Trustees and any member of any advisory board of each Fund are compensated through the unitary management fee paid by each Fund to the advisor and not directly by each Fund. The investment advisory fee paid is included in the Statements of Operations.
Statement Regarding the Basis for the Board’s Approval of Investment Advisory Contract (Item 11 of Form N-CSR)
For the taxable year ended December 31, 2024, the following percentages of income dividends paid by the Funds qualify for the dividends received deduction available to corporations:
| Dividends Received
Deduction |
First Trust Dividend StrengthTM ETF | |
First Trust Dow 30 Equal Weight ETF | |
First Trust Lunt U.S. Factor Rotation ETF | |
First Trust S&P 500 Diversified Free Cash Flow ETF | |
For the taxable year ended December 31, 2024, the following percentages of income dividends paid by the Funds are hereby designated as qualified dividend income:
| |
First Trust Dividend StrengthTM ETF | |
First Trust Dow 30 Equal Weight ETF | |
First Trust Lunt U.S. Factor Rotation ETF | |
First Trust S&P 500 Diversified Free Cash Flow ETF | |
A portion of each of the Funds’ 2024 ordinary dividends (including short-term capital gains) paid to its shareholders during the fiscal year ended December 31, 2024, may be eligible for the Qualified Business Income (QBI) Deduction under the Internal Revenue Code of 1986, as amended, Section 199A for the aggregate dividends each Fund received from the underlying Real Estate Investment Trusts (REITs) these Funds invest in.
Nasdaq® and The Dividend StrengthTM Index are registered trademarks and service marks of Nasdaq, Inc. (together with its affiliates hereinafter referred to as the “Corporations”) and are licensed for use by First Trust. The Funds have not been passed on by the Corporations as to their legality or suitability. The Funds are not issued, endorsed, sold or promoted by the Corporations. THE CORPORATIONS MAKE NO WARRANTIES AND BEAR NO LIABILITY WITH RESPECT TO THE FUNDS.
Dow Jones Industrial Average® Equal Weight Index and S&P 500® Sector-Neutral FCF Index are products of S&P Dow Jones Indices LLC or its affiliates (“SPDJI”) and have been licensed for use by First Trust. S&P® is a registered trademark of Standard & Poor’s Financial Services LLC (“S&P”); Dow Jones® is a registered trademark of Dow Jones Trademark Holdings LLC (“Dow Jones”); and these trademarks have been licensed for use by SPDJI and sublicensed for certain purposes by First Trust. The Funds are
Other Information (Continued)
First Trust Exchange-Traded FundDecember 31, 2024 (Unaudited) not sponsored, endorsed, sold or promoted by SPDJI, Dow Jones, S&P, or their respective affiliates and none of such parties make any representation regarding the advisability of investing in such products nor do they have any liability for any errors, omissions, or interruptions of the S&P Dow Jones Indexes.
Lunt Capital Management, Inc. (“Lunt”) and the Lunt Capital Large Cap Factor Rotation Index (“Lunt Index”) are trademarks of Lunt and have been licensed for use for certain purposes by First Trust. The First Trust Lunt U.S. Factor Rotation ETF is based on the Lunt Index and is not sponsored, endorsed, sold or promoted by Lunt, and Lunt makes no representation regarding the advisability of trading in such fund. Lunt has contracted with Nasdaq, Inc. to calculate and maintain the Lunt Index. The Fund is not sponsored, endorsed, sold or promoted by Nasdaq, Inc. or its affiliates (Nasdaq, with its affiliates, hereinafter referred to as the “Corporations”). The Corporations have not passed on the legality or suitability of, or the accuracy or adequacy of descriptions and disclosures relating to, the Fund. The Corporations make no representation or warranty, express or implied to the owners of the fund or any member of the public regarding the advisability of investing in securities generally or in the fund particularly, or the ability of the Lunt Index to track general stock performance.
Annual Consolidated
Financial Statements
and Other Information |
For the Year Ended
December 31, 2024 |
First Trust Exchange-Traded Fund
FT Vest Gold Strategy Quarterly Buffer ETF (BGLD) |
FT Vest Gold Strategy Quarterly Buffer ETF (BGLD)
Annual Consolidated Financial Statements and Other Information
December 31, 2024
Performance and Risk Disclosure
There is no assurance that FT Vest Gold Strategy Quarterly Buffer ETF (the “Fund”) will achieve its investment objective. The Fund is subject to market risk, which is the possibility that the market values of securities owned by the Fund will decline and that the value of the Fund’s shares may therefore be less than what you paid for them. Accordingly, you can lose money by investing in the Fund.
Performance data quoted represents past performance, which is no guarantee of future results, and current performance may be lower or higher than the figures shown. For the most recent month-end performance figures, please visit www.ftportfolios.com or speak with your financial advisor. Investment returns, net asset value and share price will fluctuate and Fund shares, when sold, may be worth more or less than their original cost.
First Trust Advisors L.P., the Fund’s advisor, may also periodically provide additional information on Fund performance on the Fund’s webpage at www.ftportfolios.com.
This report contains information that may help you evaluate your investment in the Fund. It includes details about the Fund and presents data that provides insight into the Fund’s performance and investment approach.
The material risks of investing in the Fund are spelled out in its prospectus, statement of additional information, and other Fund regulatory filings.
FT Vest Gold Strategy Quarterly Buffer ETF (BGLD)Consolidated Portfolio of InvestmentsDecember 31, 2024
| | | | |
U.S. TREASURY BILLS — 94.8% |
| | | | |
| | | | |
| | |
MONEY MARKET FUNDS — 0.5% |
| Dreyfus Government Cash Management Fund, Institutional Shares - 4.36% (c) | |
| | |
| Total Investments — 95.3% | |
| | |
| | | | | |
|
| Call Options Purchased — 4.9% | |
| | | | | |
| | | | | |
|
| Call Options Written — (0.2)% | |
| | | | | |
| (Premiums received $176,929) | | | | |
| Put Options Written — (0.1)% | |
| | | | | |
| (Premiums received $223,342) | | | | |
| | |
| (Premiums received $400,271) | |
| Net Other Assets and Liabilities — 0.1% | |
| | |
| All or a portion of this security is segregated as collateral for the options written. At December 31, 2024, the segregated value of this security amounts to $9,239,132. |
| |
| Rate shown reflects yield as of December 31, 2024. |
See Notes to Consolidated Financial Statements
FT Vest Gold Strategy Quarterly Buffer ETF (BGLD)Consolidated Portfolio of Investments (Continued)December 31, 2024
Valuation InputsA summary of the inputs used to value the Fund’s investments as of December 31, 2024 is as follows (see Note 2A - Portfolio Valuation in the Notes to Consolidated Financial Statements):
|
| | | Level 2
Significant
Observable
Inputs | Level 3
Significant
Unobservable
Inputs |
| | | | |
| | | | |
| | | | |
| | | | |
| | | | |
|
| | | Level 2
Significant
Observable
Inputs | Level 3
Significant
Unobservable
Inputs |
| | | | |
See Notes to Consolidated Financial Statements
FT Vest Gold Strategy Quarterly Buffer ETF (BGLD)Consolidated Statement of Assets and Liabilities
December 31, 2024
| |
| |
Options contracts purchased, at value | |
| |
| |
Cash segregated as collateral | |
| |
| |
|
| |
Options contracts written, at value | |
Investment advisory fees payable | |
| |
| |
|
| |
| |
| |
Accumulated distributable earnings (loss) | |
| |
NET ASSET VALUE, per share | |
Number of shares outstanding (unlimited number of shares authorized, par value $0.01 per share) | |
| |
Premiums paid on options contracts purchased | |
Premiums received on options contracts written | |
See Notes to Consolidated Financial Statements
FT Vest Gold Strategy Quarterly Buffer ETF (BGLD)Consolidated Statement of Operations
For the Year Ended December 31, 2024
| |
| |
| |
| |
|
| |
| |
| |
NET INVESTMENT INCOME (LOSS) | |
|
NET REALIZED AND UNREALIZED GAIN (LOSS): | |
Net realized gain (loss) on: | |
| |
Purchased options contracts | |
Written options contracts | |
| |
Net change in unrealized appreciation (depreciation) on: | |
| |
Purchased options contracts | |
Written options contracts | |
Net change in unrealized appreciation (depreciation) | |
NET REALIZED AND UNREALIZED GAIN (LOSS) | |
NET INCREASE (DECREASE) IN NET ASSETS RESULTING FROM OPERATIONS | |
See Notes to Consolidated Financial Statements
FT Vest Gold Strategy Quarterly Buffer ETF (BGLD)Consolidated Statements of Changes in Net Assets
| | |
| | |
Net investment income (loss) | | |
| | |
Net change in unrealized appreciation (depreciation) | | |
Net increase (decrease) in net assets resulting from operations | | |
|
DISTRIBUTIONS TO SHAREHOLDERS FROM: | | |
| | |
| | |
Total distributions to shareholders | | |
|
SHAREHOLDER TRANSACTIONS: | | |
Proceeds from shares sold | | |
| | |
Net increase (decrease) in net assets resulting from shareholder transactions | | |
Total increase (decrease) in net assets | | |
|
| | |
| | |
| | |
|
CHANGES IN SHARES OUTSTANDING: | | |
Shares outstanding, beginning of period | | |
| | |
| | |
Shares outstanding, end of period | | |
See Notes to Consolidated Financial Statements
FT Vest Gold Strategy Quarterly Buffer ETF (BGLD)Consolidated Financial Highlights
For a share outstanding throughout each period
| | Period
Ended
12/31/2021 (a) |
| | | |
Net asset value, beginning of period | | | | |
Income from investment operations: | | | | |
Net investment income (loss) | | | | |
Net realized and unrealized gain (loss) | | | | |
Total from investment operations | | | | |
Distributions paid to shareholders from: | | | | |
| | | | |
| | | | |
| | | | |
Net asset value, end of period | | | | |
| | | | |
|
Ratios to average net assets/supplemental data: | | | | |
Net assets, end of period (in 000’s) | | | | |
Ratio of total expenses to average net assets | | | | |
Ratio of net investment income (loss) to average net assets | | | | |
Portfolio turnover rate (f) | | | | |
| Inception date is January 20, 2021, which is consistent with the commencement of investment operations and is the date the initial creation units were established. |
| Based on average shares outstanding. |
| Total return is calculated assuming an initial investment made at the net asset value at the beginning of the period, reinvestment of all distributions at net asset value during the period, and redemption at net asset value on the last day of the period. The returns presented do not reflect the deduction of taxes that a shareholder would pay on Fund distributions or the redemption or sale of Fund shares. Total return is calculated for the time period presented and is not annualized for periods of less than a year. |
| Ratio of total expenses to average net assets and ratio of net investment income (loss) to average net assets do not reflect the Fund’s proportionate share of expenses and income of underlying investment companies in which the Fund invests. |
| |
| Portfolio turnover is calculated for the time period presented and is not annualized for periods of less than a year and does not include securities received or delivered from processing creations or redemptions, derivatives and in-kind transactions. |
See Notes to Consolidated Financial Statements
Notes to Consolidated Financial Statements
FT Vest Gold Strategy Quarterly Buffer ETF (BGLD)December 31, 2024
1. Organization
First Trust Exchange-Traded Fund (the “Trust”) is an open-end management investment company organized as a Massachusetts business trust on August 8, 2003, and is registered with the Securities and Exchange Commission under the Investment Company Act of 1940, as amended (the “1940 Act”).
This report covers the FT Vest Gold Strategy Quarterly Buffer ETF (the “Fund”), a non-diversified series of the Trust, which trades under the ticker “BGLD” on Cboe BZX Exchange, Inc. The Fund represents a separate series of shares of beneficial interest in the Trust. Unlike conventional mutual funds, the Fund issues and redeems shares on a continuous basis, at net asset value (“NAV”), only in large blocks of shares known as “Creation Units.”
The Fund is an actively managed exchange-traded fund. The Fund’s investment objective is to seek to provide investors with returns (before fees and expenses) that match the price return of the SPDR® Gold Trust (the “Underlying ETF”), up to a predetermined upside cap of 8.64% while providing a buffer (before fees and expenses) against Underlying ETF losses between -5% and -15% over the period from December 2, 2024 to February 28, 2025 (the “Target Outcome Period”). Prior to December 2, 2024, the Fund’s investment objective included an upside cap of 10.50%, 9.27%, 9.70% and 8.77% and a Target Outcome Period of December 1, 2023 to February 29, 2024, March 1, 2024 to May 31, 2024, June 3, 2024 to August 30, 2024 and September 3, 2024 to November 29, 2024, respectively. Under normal market conditions, the Fund will invest substantially all of its assets in U.S. Treasury securities, cash and cash equivalents, and in the shares of a wholly-owned subsidiary (the “Subsidiary”) that holds FLexible EXchange® Options (“FLEX Options”) that reference the price performance of the Underlying ETF. The Subsidiary is wholly-owned by the Fund and is organized under the laws of the Cayman Islands. The Fund does not invest directly in FLEX Options on the Underlying ETF. The Fund gains exposure to these investments exclusively by investing in the Subsidiary. The Fund will invest up to approximately 25% of its total assets in the Subsidiary. As of December 31, 2024 the Fund invested 22.76% of the Fund’s total assets in the Subsidiary. There can be no assurance that the Fund will achieve its investment objective. The Fund may not be appropriate for all investors.
2. Significant Accounting Policies
The Fund is considered an investment company and follows accounting and reporting guidance under Financial Accounting Standards Board (“FASB”) Accounting Standards Codification Topic 946, “Financial Services-Investment Companies.” The consolidated financial statements include the accounts on a consolidated basis of the Subsidiary. All intercompany accounts and transactions have been eliminated in consolidation. The following is a summary of significant accounting policies consistently followed by the Fund in the preparation of the consolidated financial statements. The preparation of the consolidated financial statements in accordance with accounting principles generally accepted in the United States of America (“U.S. GAAP”) requires management to make estimates and assumptions that affect the reported amounts and disclosures in the consolidated financial statements. Actual results could differ from those estimates.
The Fund’s NAV is determined daily as of the close of regular trading on the New York Stock Exchange (“NYSE”), normally 4:00 p.m. Eastern time, on each day the NYSE is open for trading. If the NYSE closes early on a valuation day, the NAV is determined as of that time. The Fund’s NAV is calculated by dividing the value of all assets of the Fund (including accrued interest and dividends), less all liabilities (including accrued expenses and dividends declared but unpaid), by the total number of shares outstanding.
The Fund’s investments are valued daily at market value or, in the absence of market value with respect to any portfolio securities, at fair value. Market value prices represent readily available market quotations such as last sale or official closing prices from a national or foreign exchange (i.e., a regulated market) and are primarily obtained from third-party pricing services. Fair value prices represent any prices not considered market value prices and are either obtained from a third-party pricing service or are determined by the Pricing Committee of the Fund’s investment advisor, First Trust Advisors L.P. (“First Trust” or the “Advisor”), in accordance with valuation procedures approved by the Trust’s Board of Trustees, and in accordance with provisions of the 1940 Act and rules thereunder. Investments valued by the Advisor’s Pricing Committee, if any, are footnoted as such in the footnotes to the Consolidated Portfolio of Investments. The Fund’s investments are valued as follows:
Exchange-traded options contracts (other than FLEX Option contracts) are valued at the closing price in the market where such contracts are principally traded. If no closing price is available, exchange-traded options contracts are valued at the mean of their most recent bid and ask price, if both are available. Over-the-counter options contracts are valued as follows, depending on the market in which the instrument trades: (1) the mean of their most recent bid and ask price, if available; or (2) a price based on
Notes to Consolidated Financial Statements (Continued)
FT Vest Gold Strategy Quarterly Buffer ETF (BGLD)December 31, 2024 the equivalent exchange-traded option. FLEX Option contracts are normally valued using a model-based price provided by a third-party pricing vendor. On days when a trade in a FLEX Option contract occurs, the trade price will be used to value such FLEX Option contracts in lieu of the model price.
U.S. Treasuries are valued on the basis of valuations provided by a third-party pricing service approved by the Trust’s Board of Trustees.
Shares of open-end funds are valued based on NAV per share.
If the Fund’s investments are not able to be priced by pre-established pricing methods, such investments may be valued by the Trust’s Board of Trustees or its delegate, the Advisor’s Pricing Committee, at fair value. A variety of factors may be considered in determining the fair value of such investments.
Valuing the Fund’s holdings using fair value pricing will result in using prices for those holdings that may differ from current market valuations. The Subsidiary’s holdings will be valued in the same manner as the Fund’s holdings.
The Fund is subject to fair value accounting standards that define fair value, establish the framework for measuring fair value and provide a three-level hierarchy for fair valuation based upon the inputs to the valuation as of the measurement date. The three levels of the fair value hierarchy are as follows:
• Level 1 – Level 1 inputs are quoted prices in active markets for identical investments. An active market is a market in which transactions for the investment occur with sufficient frequency and volume to provide pricing information on an ongoing basis.
• Level 2 – Level 2 inputs are observable inputs, either directly or indirectly, and include the following:
o Quoted prices for similar investments in active markets.
o Quoted prices for identical or similar investments in markets that are non-active. A non-active market is a market where there are few transactions for the investment, the prices are not current, or price quotations vary substantially either over time or among market makers, or in which little information is released publicly.
o Inputs other than quoted prices that are observable for the investment (for example, interest rates and yield curves observable at commonly quoted intervals, volatilities, prepayment speeds, loss severities, credit risks, and default rates).
o Inputs that are derived principally from or corroborated by observable market data by correlation or other means.
• Level 3 – Level 3 inputs are unobservable inputs. Unobservable inputs may reflect the reporting entity’s own assumptions about the assumptions that market participants would use in pricing the investment.
The inputs or methodologies used for valuing investments are not necessarily an indication of the risk associated with investing in those investments. A summary of the inputs used to value the Fund’s investments as of December 31, 2024, is included with the Fund’s Consolidated Portfolio of Investments.
B. Investment Transactions and Investment Income
Investment transactions are recorded as of the trade date. Realized gains and losses from investment transactions are recorded on the identified cost basis. Dividend income is recorded on the ex-dividend date. Interest income, if any, is recorded daily on the accrual basis. Amortization of premiums and accretion of discounts are recorded using the effective interest method.
FLEX Options are customized equity or index option contracts that trade on an exchange, but provide investors with the ability to customize key contract terms like exercise prices, styles and expiration dates. FLEX Options are guaranteed for settlement by the Options Clearing Corporation.
The Fund, through the Subsidiary, purchases and sells call and put FLEX Options based on the performance of the Underlying ETF. The FLEX Options that the Subsidiary holds that reference the Underlying ETF will give the Subsidiary the right to receive or deliver shares of the Underlying ETF on the option expiration date at a strike price, depending on whether the option is a put or call option and whether the Subsidiary purchases or sells the option. The FLEX Options held by the Subsidiary are European style options, which are exercisable at the strike price only on the FLEX Option expiration date.
When the Subsidiary writes (sells) an option, an amount equal to the premium received by the Subsidiary is included in “Options contracts written, at value” on the Consolidated Statement of Assets and Liabilities. Gain or loss on written options is presented
Notes to Consolidated Financial Statements (Continued)
FT Vest Gold Strategy Quarterly Buffer ETF (BGLD)December 31, 2024 separately as “Net realized gain (loss) on written options contracts” on the Consolidated Statement of Operations. When the Subsidiary purchases a call or put option, the premium paid represents the cost of the call or put option, which is included in “Options contracts purchased, at value” on the Consolidated Statement of Assets and Liabilities. Gain or loss on purchased options is included in “Net realized gain (loss) on purchased options contracts” on the Consolidated Statement of Operations.
D. Dividends and Distributions to Shareholders
Dividends from net investment income of the Fund, if any, are declared and paid annually, or as the Board of Trustees may determine from time to time. Distributions of net realized capital gains earned by the Fund, if any, are distributed at least annually. The Fund may also designate a portion of the amount paid to redeeming shareholders as a distribution for tax purposes.
Distributions from net investment income and realized capital gains are determined in accordance with federal income tax regulations, which may differ from U.S. GAAP. Certain capital accounts in the consolidated financial statements are periodically adjusted for permanent differences in order to reflect their tax character. These permanent differences are primarily due to the varying treatment of income and gain/loss on significantly modified portfolio securities held by the Fund and have no impact on net assets or NAV per share. Temporary differences, which arise from recognizing certain items of income, expense and gain/loss in different periods for consolidated financial statement and tax purposes, will reverse at some time in the future.
The tax character of distributions paid during the fiscal years ended December 31, 2024 and 2023 was as follows:
As of December 31, 2024, the components of distributable earnings on a tax basis for the Fund were as follows:
Undistributed ordinary income | |
Accumulated capital and other gain (loss) | |
Net unrealized appreciation (depreciation) | |
The Fund intends to continue to qualify as a regulated investment company by complying with the requirements under Subchapter M of the Internal Revenue Code of 1986, as amended (the “Code”), which includes distributing substantially all of its net investment income and net realized gains to shareholders. Accordingly, no provision has been made for federal and state income taxes. However, due to the timing and amount of distributions, the Fund may be subject to an excise tax of 4% of the amount by which approximately 98% of the Fund’s taxable income exceeds the distributions from such taxable income for the calendar year.
The Subsidiary is classified as a controlled foreign corporation under Subchapter N of the Code. Therefore, the Fund is required to increase its taxable income by its share of the Subsidiary’s income, whether or not such earnings are distributed by the Subsidiary to the Fund. Net investment losses of the Subsidiary cannot be deducted by the Fund in the current period nor carried forward to offset taxable income in future periods.
The Fund is subject to accounting standards that establish a minimum threshold for recognizing, and a system for measuring, the benefits of a tax position taken or expected to be taken in a tax return. The taxable years ended 2021, 2022, 2023, and 2024 remain open to federal and state audit. As of December 31, 2024, management has evaluated the application of these standards to the Fund and has determined that no provision for income tax is required in the Fund’s consolidated financial statements for uncertain tax positions.
The Fund intends to utilize provisions of the federal income tax laws, which allow it to carry a realized capital loss forward indefinitely following the year of the loss and offset such loss against any future realized capital gains. The Fund is subject to certain limitations under U.S. tax rules on the use of capital loss carryforwards and net unrealized built-in losses. These limitations apply when there has been a 50% change in ownership. At December 31, 2024, for federal income tax purposes, the Fund had $492 of non-expiring capital loss carryforwards available, to the extent provided by regulations, to offset future capital gains. To the extent that these loss carryforwards are used to offset future capital gains, it is probable that the capital gains so offset will not be distributed to the Fund’s shareholders.
Notes to Consolidated Financial Statements (Continued)
FT Vest Gold Strategy Quarterly Buffer ETF (BGLD)December 31, 2024 During the fiscal year ended December 31, 2024, the Fund utilized $127 of non-expiring capital loss carryforwards.
Certain losses realized during the current fiscal year may be deferred and treated as occurring on the first day of the following fiscal year for federal income tax purposes. For the fiscal year ended December 31, 2024, the Fund had no net late year ordinary or capital losses.
In order to present paid-in capital and accumulated distributable earnings (loss) (which consists of accumulated net investment income (loss), accumulated net realized gain (loss) on investments and net unrealized appreciation (depreciation) on investments) on the Consolidated Statement of Assets and Liabilities that more closely represent their tax character, certain adjustments have been made to paid-in capital, accumulated net investment income (loss) and accumulated net realized gain (loss) on investments. These adjustments are primarily due to the difference between book and tax treatment of net investment income from the Subsidiary. The results of operations and net assets were not affected by these adjustments. For the fiscal year ended December 31, 2024, the adjustments for the Fund were as follows:
Accumulated
Net Investment
Income (Loss) | Accumulated
Net Realized
Gain (Loss)
on Investments | |
| | |
As of December 31, 2024, the aggregate cost, gross unrealized appreciation, gross unrealized depreciation, and net unrealized appreciation/(depreciation) on investments (including short positions and derivatives, if any) for federal income tax purposes were as follows:
| Gross Unrealized
Appreciation | Gross Unrealized
(Depreciation) | Net Unrealized
Appreciation
(Depreciation) |
| | | |
Expenses, other than the investment advisory fee and other excluded expenses, are paid by the Advisor (see Note 3).
The Fund has adopted FASB Accounting Standards Update 2023-07, Segment Reporting (Topic 280) - Improvements to Reportable Segment Disclosures (“ASU 2023-07”). Adoption of the standard impacted financial statement disclosures only and did not affect the Fund’s financial position or the results of its operations. An operating segment is defined in Topic 280 as a component of a public entity that engages in business activities from which it may recognize revenues and incur expenses, has operating results that are regularly reviewed by the public entity’s chief operating decision maker (“CODM”) to make decisions about resources to be allocated to the segment and assess its performance, and has discrete financial information available. The CODM is the President and Chief Executive Officer of the Fund. The Fund operates as a single operating segment. The Fund’s income, expenses, assets, changes in net assets resulting from operations and performance are regularly monitored and assessed as a whole by the CODM responsible for oversight functions of the Fund, using the information presented in the financial statements and financial highlights.
3. Investment Advisory Fee, Affiliated Transactions and Other Fee Arrangements
First Trust, the investment advisor to the Fund, is a limited partnership with one limited partner, Grace Partners of DuPage L.P., and one general partner, The Charger Corporation. The Charger Corporation is an Illinois corporation controlled by James A. Bowen, Chief Executive Officer of First Trust. First Trust is responsible for the ongoing monitoring of the Fund’s and the Subsidiary’s investment portfolios, managing the Fund’s business affairs and providing certain administrative services necessary for the management of the Fund.
First Trust is responsible for the expenses of the Fund and the Subsidiary including the cost of transfer agency, sub-advisory, custody, fund administration, legal, audit and other services, but excluding fee payments under the Investment Management Agreement, interest, taxes, acquired fund fees and expenses, if any, brokerage commissions and other expenses connected with the execution of portfolio transactions, distribution and service fees payable pursuant to a Rule 12b-1 plan, if any, and extraordinary expenses. The
Notes to Consolidated Financial Statements (Continued)
FT Vest Gold Strategy Quarterly Buffer ETF (BGLD)December 31, 2024 annual unitary management fee payable by the Fund to First Trust for these services will be reduced at certain levels of the Fund’s net assets (“breakpoints”) and calculated pursuant to the following schedule:
| |
Fund net assets up to and including $2.5 billion | |
Fund net assets greater than $2.5 billion up to and including $5 billion | |
Fund net assets greater than $5 billion up to and including $7.5 billion | |
Fund net assets greater than $7.5 billion up to and including $10 billion | |
Fund net assets greater than $10 billion | |
The Subsidiary does not pay First Trust a separate management fee.
Vest Financial LLC (“Vest”), an affiliate of First Trust, serves as the Fund’s sub-advisor and manages the Fund’s portfolio subject to First Trust’s supervision. Pursuant to the Investment Management Agreement, between the Trust, on behalf of the Fund, and the Advisor, and the Investment Sub-Advisory Agreement among the Trust, on behalf of the Fund, the Advisor and Vest, First Trust will supervise Vest and its management of the investment of the Fund’s assets and will pay Vest for its services as the Fund’s sub-advisor a sub-advisory fee equal to 50% of any remaining monthly unitary management fee paid to the Advisor after the average Fund’s expenses accrued during the most recent twelve months are subtracted from the unitary management fee for that month.
The Trust has multiple service agreements with The Bank of New York Mellon (“BNY”). Under the service agreements, BNY performs custodial, fund accounting, certain administrative services, and transfer agency services for the Fund. As custodian, BNY is responsible for custody of the Fund’s assets. As fund accountant and administrator, BNY is responsible for maintaining the books and records of the Fund’s securities and cash. As transfer agent, BNY is responsible for maintaining shareholder records for the Fund. BNY is a subsidiary of The Bank of New York Mellon Corporation, a financial holding company.
Each Trustee who is not an officer or employee of First Trust, any sub-advisor or any of their affiliates (“Independent Trustees”) is paid a fixed annual retainer that is allocated equally among each fund in the First Trust Fund Complex. Each Independent Trustee is also paid an annual per fund fee that varies based on whether the fund is a closed-end or other actively managed fund, a target outcome fund or an index fund.
Additionally, the Chairs of the Audit Committee, Nominating and Governance Committee and Valuation Committee, the Vice Chair of the Audit Committee, the Lead Independent Trustee and the Vice Lead Independent Trustee are paid annual fees to serve in such capacities, with such compensation allocated pro rata among each fund in the First Trust Fund Complex based on net assets. Independent Trustees are reimbursed for travel and out-of-pocket expenses in connection with all meetings. The Committee Chairs, the Audit Committee Vice Chair, the Lead Independent Trustee and the Vice Lead Independent Trustee rotate periodically in serving in such capacities. The officers and “Interested” Trustee receive no compensation from the Trust for acting in such capacities.
4. Purchases and Sales of Securities
For the fiscal year ended December 31, 2024, the cost of purchases and proceeds from sales of investments, excluding short-term investments, derivatives, and in-kind transactions, were $0 and $0, respectively.
For the fiscal year ended December 31, 2024, the Fund had no in-kind transactions.
5. Derivative Transactions
The following table presents the types of derivatives held by the Subsidiary at December 31, 2024, the primary underlying risk exposure and the location of these instruments as presented on the Consolidated Statement of Assets and Liabilities.
| | | |
| | Consolidated
Statement of Assets and
Liabilities Location | | Consolidated
Statement of Assets and
Liabilities Location | |
| | Options contracts purchased, at value | | Options contracts written, at value | |
Notes to Consolidated Financial Statements (Continued)
FT Vest Gold Strategy Quarterly Buffer ETF (BGLD)December 31, 2024 The following table presents the amount of net realized gain (loss) and change in net unrealized appreciation (depreciation) recognized for the fiscal year ended December 31, 2024, on derivative instruments, as well as the primary underlying risk exposure associated with the instruments.
Consolidated Statement of Operations Location |
| |
Net realized gain (loss) on: | |
Purchased options contracts | |
Written options contracts | |
Net change in unrealized appreciation (depreciation) on: | |
Purchased options contracts | |
Written options contracts | |
During the fiscal year ended December 31, 2024, the premiums for purchased options contracts opened were $10,173,589 and the premiums for purchased options contracts closed, exercised and expired were $8,938,666.
During the fiscal year ended December 31, 2024, the premiums for written options contracts opened were $1,148,623 and the premiums for written options contracts closed, exercised and expired were $1,071,505.
The Fund does not have the right to offset financial assets and financial liabilities related to options contracts on the Consolidated Statement of Assets and Liabilities.
6. Creations, Redemptions and Transaction Fees
The Fund generally issues and redeems its shares in primary market transactions through a creation and redemption mechanism and does not sell or redeem individual shares. Instead, financial entities known as “Authorized Participants” have contractual arrangements with the Fund or one of the Fund’s service providers to purchase and redeem Fund shares directly with the Fund in Creation Units. Prior to the start of trading on every business day, the Fund publishes through the National Securities Clearing Corporation the “basket” of securities, cash or other assets that it will accept in exchange for a Creation Unit of the Fund’s shares. An Authorized Participant that wishes to effectuate a creation of the Fund’s shares deposits with the Fund the “basket” of securities, cash or other assets identified by the Fund that day, and then receives the Creation Unit of the Fund’s shares in return for those assets. After purchasing a Creation Unit, the Authorized Participant may continue to hold the Fund’s shares or sell them in the secondary market. The redemption process is the reverse of the purchase process: the Authorized Participant redeems a Creation Unit of the Fund’s shares for a basket of securities, cash or other assets. The combination of the creation and redemption process with secondary market trading in the Fund’s shares and underlying securities provides arbitrage opportunities that are designed to help keep the market price of the Fund’s shares at or close to the NAV per share of the Fund.
The Fund imposes fees in connection with the purchase of Creation Units. These fees may vary based upon various fact-based circumstances, including, but not limited to, the composition of the securities included in the Creation Unit or the countries in which the transactions are settled. The price for each Creation Unit will equal the daily NAV per share of the Fund times the number of shares in a Creation Unit, plus the fees described above and, if applicable, any operational processing and brokerage costs, transfer fees, stamp taxes and part or all of the spread between the expected bid and offer side of the market related to the securities comprising the creation basket.
The Fund also imposes fees in connection with the redemption of Creation Units. These fees may vary based upon various fact-based circumstances, including, but not limited to, the composition of the securities included in the Creation Unit or the countries in which the transactions are settled. The price received for each Creation Unit will equal the daily NAV per share of the Fund times the number of shares in a Creation Unit, minus the fees described above and, if applicable, any operational processing and brokerage costs, transfer fees, stamp taxes and part or all of the spread between the expected bid and offer side of the market related to the securities comprising the redemption basket. Investors who use the services of a broker or other such intermediary in addition to an Authorized Participant to effect a redemption of a Creation Unit may also be assessed an amount to cover the cost of such services. The redemption fee charged by the Fund will comply with Rule 22c-2 of the 1940 Act which limits redemption fees to no more than 2% of the value of the shares redeemed.
Notes to Consolidated Financial Statements (Continued)
FT Vest Gold Strategy Quarterly Buffer ETF (BGLD)December 31, 2024 7. Distribution Plan
The Board of Trustees adopted a Distribution and Service Plan pursuant to Rule 12b-1 under the 1940 Act. In accordance with the Rule 12b-1 plan, the Fund is authorized to pay an amount up to 0.25% of its average daily net assets each year to reimburse First Trust Portfolios L.P. (“FTP”), the distributor of the Fund, for amounts expended to finance activities primarily intended to result in the sale of Creation Units or the provision of investor services. FTP may also use this amount to compensate securities dealers or other persons that are Authorized Participants for providing distribution assistance, including broker-dealer and shareholder support and educational and promotional services.
No 12b-1 fees are currently paid by the Fund, and pursuant to a contractual arrangement, no 12b-1 fees will be paid any time before April 30, 2026.
The Trust, on behalf of the Fund, has a variety of indemnification obligations under contracts with its service providers. The Trust’s maximum exposure under these arrangements is unknown. However, the Trust has not had prior claims or losses pursuant to these contracts and expects the risk of loss to be remote.
Management has evaluated the impact of all subsequent events on the Fund through the date the consolidated financial statements were issued and has determined that there were no subsequent events requiring recognition or disclosure in the consolidated financial statements that have not already been disclosed.
Report of Independent Registered Public Accounting Firm
To the Shareholders and the Board of Trustees of First Trust Exchange-Traded Fund:
Opinion on the Financial Statements and Financial Highlights
We have audited the accompanying consolidated statement of assets and liabilities, including the consolidated portfolio of investments, of FT Vest Gold Strategy Quarterly Buffer ETF (the “Fund”), one of the funds constituting the First Trust Exchange-Traded Fund, as of December 31, 2024, the related consolidated statement of operations for the year then ended, the consolidated statements of changes in net assets for each of the two years in the period then ended, and the consolidated financial highlights for the years ended December 31, 2024, 2023, and 2022, and the period from January 20, 2021 (commencement of investment operations) through December 31, 2021, and the related notes. In our opinion, the financial statements and financial highlights present fairly, in all material respects, the financial position of the Fund as of December 31, 2024, and the results of its operations for the year then ended, and the changes in its net assets for each of the two years in the period then ended, and the financial highlights for the years ended December 31, 2024, 2023, and 2022, and the period from January 20, 2021 (commencement of investment operations) through December 31, 2021 in conformity with accounting principles generally accepted in the United States of America.
These financial statements and financial highlights are the responsibility of the Fund’s management. Our responsibility is to express an opinion on the Fund’s financial statements and financial highlights based on our audits. We are a public accounting firm registered with the Public Company Accounting Oversight Board (United States) (PCAOB) and are required to be independent with respect to the Fund in accordance with the U.S. federal securities laws and the applicable rules and regulations of the Securities and Exchange Commission and the PCAOB.
We conducted our audits in accordance with the standards of the PCAOB. Those standards require that we plan and perform the audit to obtain reasonable assurance about whether the financial statements and financial highlights are free of material misstatement, whether due to error or fraud. The Fund is not required to have, nor were we engaged to perform, an audit of its internal control over financial reporting. As part of our audits, we are required to obtain an understanding of internal control over financial reporting but not for the purpose of expressing an opinion on the effectiveness of the Fund’s internal control over financial reporting. Accordingly, we express no such opinion.
Our audits included performing procedures to assess the risks of material misstatement of the financial statements and financial highlights, whether due to error or fraud, and performing procedures that respond to those risks. Such procedures included examining, on a test basis, evidence regarding the amounts and disclosures in the financial statements and financial highlights. Our audits also included evaluating the accounting principles used and significant estimates made by management, as well as evaluating the overall presentation of the financial statements and financial highlights. Our procedures included confirmation of securities owned as of December 31, 2024, by correspondence with the custodian and brokers; when replies were not received from brokers, we performed other auditing procedures. We believe that our audits provide a reasonable basis for our opinion.
/s/ Deloitte & Touche, LLP
Chicago, Illinois
February 24, 2025
We have served as the auditor of one or more First Trust investment companies since 2001.
FT Vest Gold Strategy Quarterly Buffer ETF (BGLD)December 31, 2024 (Unaudited)
Changes in and Disagreements with Accountants (Item 8 of Form N-CSR)
There were no changes in or disagreements with the Fund’s accountants during the fiscal year ended December 31, 2024.
Proxy Disclosures (Item 9 of Form N-CSR)
There were no matters submitted for vote by shareholders of the Fund during the fiscal year ended December 31, 2024.
Remuneration Paid to Directors, Officers, and Others (Item 10 of Form N-CSR)
Independent Trustees and any member of any advisory board of the Fund are compensated through the unitary management fee paid by the Fund to the advisor and not directly by the Fund. The investment advisory fee paid is included in the Consolidated Statement of Operations.
Statement Regarding the Basis for the Board’s Approval of Investment Advisory Contract (Item 11 of Form N-CSR)
Remuneration Disclosure Under the Alternative Investment Fund Managers Directive
First Trust Advisors L.P. (“First Trust”) is authorised and regulated by the U.S. Securities and Exchange Commission and is entitled to market shares of certain funds it manages, including FT Vest Gold Strategy Quarterly Buffer ETF (the “Fund”), in certain member states in the European Economic Area in accordance with the cooperation arrangements in Article 42 of the Alternative Investment Fund Managers Directive (the “Directive”). First Trust is required under the Directive to make disclosures in respect of remuneration. The following disclosures are made in line with First Trust’s interpretation of currently available regulatory guidance on remuneration disclosures.
During the year ended December 31, 2024, the amount of remuneration paid (or to be paid) by First Trust Advisors L.P. in respect of the Fund is $13,005. This figure is comprised of $524 paid (or to be paid) in fixed compensation and $12,481 paid (or to be paid) in variable compensation. There were a total of 24 beneficiaries of the remuneration described above. Those amounts include $6,817 paid (or to be paid) to senior management of First Trust Advisors L.P. and $6,188 paid (or to be paid) to other employees whose professional activities have a material impact on the risk profiles of First Trust Advisors L.P. or the Fund (collectively, “Code Staff”).
Code Staff included in the aggregated figures disclosed above are rewarded in line with First Trust’s remuneration policy (the “Remuneration Policy”) which is determined and implemented by First Trust’s senior management. The Remuneration Policy reflects First Trust’s ethos of good governance and encapsulates the following principal objectives:
i.
to provide a clear link between remuneration and performance of First Trust and to avoid rewarding for failure;
ii.
to promote sound and effective risk management consistent with the risk profiles of the funds managed by First Trust; and
iii.
to remunerate staff in line with the business strategy, objectives, values and interests of First Trust and the funds managed by First Trust in a manner that avoids conflicts of interest.
First Trust assesses various risk factors which it is exposed to when considering and implementing remuneration for Code Staff and considers whether any potential award to such person(s) would give rise to a conflict of interest. First Trust does not reward failure, or consider the taking of risk or failure to take risk in its remuneration of Code Staff.
First Trust assesses performance for the purposes of determining payments in respect of performance-related remuneration of Code Staff by reference to a broad range of measures including (i) individual performance (using financial and non-financial criteria), and (ii) the overall performance of First Trust. Remuneration is not based upon the performance of the Fund.
The elements of remuneration are balanced between fixed and variable and the senior management sets fixed salaries at a level sufficient to ensure that variable remuneration incentivises and rewards strong individual performance but does not encourage excessive risk taking.
No individual is involved in setting his or her own remuneration.
Other Information (Continued)
FT Vest Gold Strategy Quarterly Buffer ETF (BGLD)December 31, 2024 (Unaudited) Federal Tax Information
For the taxable year ended December 31, 2024, the following percentages of income dividends paid by the Fund qualify for the dividends received deduction available to corporations and are hereby designated as qualified dividend income:
Dividends Received Deduction | Qualified Dividend Income |
| |
Distributions paid to foreign shareholders during the Fund’s fiscal year ended December 31, 2024 that were properly designated by the Fund as “interest-related dividends” or “short-term capital gain dividends,” may not be subject to federal income tax provided that the income was earned directly by such foreign shareholders.
The Fund is not sponsored, endorsed, sold or promoted by SPDR® Gold Trust and World Gold Trust Services, LLC, (together with their affiliates hereinafter referred to as the “Corporations”). The Corporations have not passed on the legality or suitability of, or the accuracy or adequacy of, descriptions and disclosures relating to the Fund or the FLEX Options. The Corporations make no representations or warranties, express or implied, regarding the advisability of investing in the Fund or the FLEX Options or results to be obtained by the Fund or the FLEX Options, shareholders or any other person or entity from use of the Underlying ETF. The Corporations have no liability in connection with the management, administration, marketing or trading of the Fund or the FLEX Options.
Annual Consolidated
Financial Statements
and Other Information |
For the Year Ended
December 31, 2024 |
First Trust Exchange-Traded Fund
FT Vest Gold Strategy Target Income ETF® (IGLD) |
FT Vest Gold Strategy Target Income ETF® (IGLD)
Annual Consolidated Financial Statements and Other Information
December 31, 2024
Performance and Risk Disclosure
There is no assurance that FT Vest Gold Strategy Target Income ETF® (the “Fund”) will achieve its investment objective. The Fund is subject to market risk, which is the possibility that the market values of securities owned by the Fund will decline and that the value of the Fund’s shares may therefore be less than what you paid for them. Accordingly, you can lose money by investing in the Fund.
Performance data quoted represents past performance, which is no guarantee of future results, and current performance may be lower or higher than the figures shown. For the most recent month-end performance figures, please visit www.ftportfolios.com or speak with your financial advisor. Investment returns, net asset value and share price will fluctuate and Fund shares, when sold, may be worth more or less than their original cost.
First Trust Advisors L.P., the Fund’s advisor, may also periodically provide additional information on Fund performance on the Fund’s webpage at www.ftportfolios.com.
This report contains information that may help you evaluate your investment in the Fund. It includes details about the Fund and presents data that provides insight into the Fund’s performance and investment approach.
The material risks of investing in the Fund are spelled out in its prospectus, statement of additional information, and other Fund regulatory filings.
FT Vest Gold Strategy Target Income ETF® (IGLD)Consolidated Portfolio of InvestmentsDecember 31, 2024
| | | | |
U.S. TREASURY BILLS — 145.3% |
| | | | |
| | | | |
| | |
MONEY MARKET FUNDS — 2.4% |
| Dreyfus Government Cash Management Fund, Institutional Shares - 4.36% (c) | |
| | |
| Total Investments — 147.7% | |
| | |
| | | | | |
|
| Call Options Purchased — 0.3% | |
| | | | | |
| | | | | |
WRITTEN OPTIONS — (46.7)% |
| Call Options Written — (0.7)% | |
| | | | | |
| (Premiums received $896,680) | | | | |
| Put Options Written — (46.0)% | |
| | | | | |
| (Premiums received $57,750,649) | | | | |
| | |
| (Premiums received $58,647,329) | |
| Net Other Assets and Liabilities — (1.3)% | |
| | |
| All or a portion of this security is segregated as collateral for the options written. At December 31, 2024, the segregated value of this security amounts to $84,891,705. |
| |
| Rate shown reflects yield as of December 31, 2024. |
See Notes to Consolidated Financial Statements
FT Vest Gold Strategy Target Income ETF® (IGLD)Consolidated Portfolio of Investments (Continued)December 31, 2024
Valuation InputsA summary of the inputs used to value the Fund’s investments as of December 31, 2024 is as follows (see Note 2A - Portfolio Valuation in the Notes to Consolidated Financial Statements):
|
| | | Level 2
Significant
Observable
Inputs | Level 3
Significant
Unobservable
Inputs |
| | | | |
| | | | |
| | | | |
| | | | |
| | | | |
|
| | | Level 2
Significant
Observable
Inputs | Level 3
Significant
Unobservable
Inputs |
| | | | |
See Notes to Consolidated Financial Statements
FT Vest Gold Strategy Target Income ETF® (IGLD)Consolidated Statement of Assets and Liabilities
December 31, 2024
| |
| |
Options contracts purchased, at value | |
| |
| |
Cash segregated as collateral | |
| |
Investment securities sold | |
| |
| |
| |
|
| |
Options contracts written, at value | |
| |
Investment securities purchased | |
| |
| |
| |
| |
|
| |
| |
| |
Accumulated distributable earnings (loss) | |
| |
NET ASSET VALUE, per share | |
Number of shares outstanding (unlimited number of shares authorized, par value $0.01 per share) | |
| |
Premiums paid on options contracts purchased | |
Premiums received on options contracts written | |
See Notes to Consolidated Financial Statements
FT Vest Gold Strategy Target Income ETF® (IGLD)Consolidated Statement of Operations
For the Year Ended December 31, 2024
| |
| |
| |
| |
|
| |
| |
| |
NET INVESTMENT INCOME (LOSS) | |
|
NET REALIZED AND UNREALIZED GAIN (LOSS): | |
Net realized gain (loss) on: | |
| |
Purchased options contracts | |
Written options contracts | |
| |
Net change in unrealized appreciation (depreciation) on: | |
| |
Purchased options contracts | |
Written options contracts | |
Net change in unrealized appreciation (depreciation) | |
NET REALIZED AND UNREALIZED GAIN (LOSS) | |
NET INCREASE (DECREASE) IN NET ASSETS RESULTING FROM OPERATIONS | |
See Notes to Consolidated Financial Statements
FT Vest Gold Strategy Target Income ETF® (IGLD)Consolidated Statements of Changes in Net Assets
| | |
| | |
Net investment income (loss) | | |
| | |
Net change in unrealized appreciation (depreciation) | | |
Net increase (decrease) in net assets resulting from operations | | |
|
DISTRIBUTIONS TO SHAREHOLDERS FROM: | | |
| | |
| | |
Total distributions to shareholders | | |
|
SHAREHOLDER TRANSACTIONS: | | |
Proceeds from shares sold | | |
| | |
Net increase (decrease) in net assets resulting from shareholder transactions | | |
Total increase (decrease) in net assets | | |
|
| | |
| | |
| | |
|
CHANGES IN SHARES OUTSTANDING: | | |
Shares outstanding, beginning of period | | |
| | |
| | |
Shares outstanding, end of period | | |
See Notes to Consolidated Financial Statements
FT Vest Gold Strategy Target Income ETF® (IGLD)Consolidated Financial Highlights
For a share outstanding throughout each period
| | Period
Ended
12/31/2021 (a) |
| | | |
Net asset value, beginning of period | | | | |
Income from investment operations: | | | | |
Net investment income (loss) | | | | |
Net realized and unrealized gain (loss) | | | | |
Total from investment operations | | | | |
Distributions paid to shareholders from: | | | | |
| | | | |
| | | | |
| | | | |
Net asset value, end of period | | | | |
| | | | |
|
Ratios to average net assets/supplemental data: | | | | |
Net assets, end of period (in 000’s) | | | | |
Ratio of total expenses to average net assets | | | | |
Ratio of net investment income (loss) to average net assets | | | | |
Portfolio turnover rate (e) | | | | |
| Inception date is March 2, 2021, which is consistent with the commencement of investment operations and is the date the initial creation units were established. |
| Based on average shares outstanding. |
| Total return is calculated assuming an initial investment made at the net asset value at the beginning of the period, reinvestment of all distributions at net asset value during the period, and redemption at net asset value on the last day of the period. The returns presented do not reflect the deduction of taxes that a shareholder would pay on Fund distributions or the redemption or sale of Fund shares. Total return is calculated for the time period presented and is not annualized for periods of less than a year. |
| |
| Portfolio turnover is calculated for the time period presented and is not annualized for periods of less than a year and does not include securities received or delivered from processing creations or redemptions, derivatives and in-kind transactions. |
See Notes to Consolidated Financial Statements
Notes to Consolidated Financial Statements
FT Vest Gold Strategy Target Income ETF® (IGLD)December 31, 2024
1. Organization
First Trust Exchange-Traded Fund (the “Trust”) is an open-end management investment company organized as a Massachusetts business trust on August 8, 2003, and is registered with the Securities and Exchange Commission under the Investment Company Act of 1940, as amended (the “1940 Act”).
This report covers the FT Vest Gold Strategy Target Income ETF® (the “Fund”), a non-diversified series of the Trust, which trades under the ticker “IGLD” on Cboe BZX Exchange, Inc. The Fund represents a separate series of shares of beneficial interest in the Trust. Unlike conventional mutual funds, the Fund issues and redeems shares on a continuous basis, at net asset value (“NAV”), only in large blocks of shares known as “Creation Units.”
The Fund is an actively managed exchange-traded fund. The Fund’s investment objective is to seek to deliver participation in the price returns of the SPDR® Gold Trust (the “Underlying ETF”) while providing a consistent level of income. The Fund’s investments principally include short-term U.S. Treasury securities, cash and cash equivalents, and the shares of a wholly-owned subsidiary (the “Subsidiary”) that holds FLexible EXchange® Options (“FLEX Options”) that reference the price performance of the Underlying ETF. In seeking to achieve its objective, the Fund, through the Subsidiary, will generally purchase or sell FLEX Options. In combination, the purchased call and sold put options generally provide exposure to price returns of the Underlying ETF both on the upside and downside. The Subsidiary is wholly-owned by the Fund and is organized under the laws of the Cayman Islands. The Fund may invest up to 25% of its total assets in the Subsidiary. As of December 31, 2024, the Fund invested 19.22% of the Fund’s total assets in the Subsidiary. There can be no assurance that the Fund will achieve its investment objective. The Fund may not be appropriate for all investors.
2. Significant Accounting Policies
The Fund is considered an investment company and follows accounting and reporting guidance under Financial Accounting Standards Board (“FASB”) Accounting Standards Codification Topic 946, “Financial Services-Investment Companies.” The consolidated financial statements include the accounts on a consolidated basis of the Subsidiary. All intercompany accounts and transactions have been eliminated in consolidation. The following is a summary of significant accounting policies consistently followed by the Fund in the preparation of the consolidated financial statements. The preparation of the consolidated financial statements in accordance with accounting principles generally accepted in the United States of America (“U.S. GAAP”) requires management to make estimates and assumptions that affect the reported amounts and disclosures in the consolidated financial statements. Actual results could differ from those estimates.
The Fund’s NAV is determined daily as of the close of regular trading on the New York Stock Exchange (“NYSE”), normally 4:00 p.m. Eastern time, on each day the NYSE is open for trading. If the NYSE closes early on a valuation day, the NAV is determined as of that time. The Fund’s NAV is calculated by dividing the value of all assets of the Fund (including accrued interest and dividends), less all liabilities (including accrued expenses and dividends declared but unpaid), by the total number of shares outstanding.
The Fund’s investments are valued daily at market value or, in the absence of market value with respect to any portfolio securities, at fair value. Market value prices represent readily available market quotations such as last sale or official closing prices from a national or foreign exchange (i.e., a regulated market) and are primarily obtained from third-party pricing services. Fair value prices represent any prices not considered market value prices and are either obtained from a third-party pricing service or are determined by the Pricing Committee of the Fund’s investment advisor, First Trust Advisors L.P. (“First Trust” or the “Advisor”), in accordance with valuation procedures approved by the Trust’s Board of Trustees, and in accordance with provisions of the 1940 Act and rules thereunder. Investments valued by the Advisor’s Pricing Committee, if any, are footnoted as such in the footnotes to the Consolidated Portfolio of Investments. The Fund’s investments are valued as follows:
Exchange-traded options contracts (other than FLEX Option contracts) are valued at the closing price in the market where such contracts are principally traded. If no closing price is available, exchange-traded options contracts are valued at the mean of their most recent bid and ask price, if both are available. Over-the-counter options contracts are valued as follows, depending on the market in which the instrument trades: (1) the mean of their most recent bid and ask price, if available; or (2) a price based on the equivalent exchange-traded option. FLEX Option contracts are normally valued using a model-based price provided by a third-party pricing vendor. On days when a trade in a FLEX Option contract occurs, the trade price will be used to value such FLEX Option contracts in lieu of the model price.
Notes to Consolidated Financial Statements (Continued)
FT Vest Gold Strategy Target Income ETF® (IGLD)December 31, 2024 U.S. Treasuries are valued on the basis of valuations provided by a third-party pricing service approved by the Trust’s Board of Trustees.
Shares of open-end funds are valued based on NAV per share.
If the Fund’s investments are not able to be priced by pre-established pricing methods, such investments may be valued by the Trust’s Board of Trustees or its delegate, the Advisor’s Pricing Committee, at fair value. A variety of factors may be considered in determining the fair value of such investments.
Valuing the Fund’s holdings using fair value pricing will result in using prices for those holdings that may differ from current market valuations. The Subsidiary’s holdings will be valued in the same manner as the Fund’s holdings.
The Fund is subject to fair value accounting standards that define fair value, establish the framework for measuring fair value and provide a three-level hierarchy for fair valuation based upon the inputs to the valuation as of the measurement date. The three levels of the fair value hierarchy are as follows:
• Level 1 – Level 1 inputs are quoted prices in active markets for identical investments. An active market is a market in which transactions for the investment occur with sufficient frequency and volume to provide pricing information on an ongoing basis.
• Level 2 – Level 2 inputs are observable inputs, either directly or indirectly, and include the following:
o Quoted prices for similar investments in active markets.
o Quoted prices for identical or similar investments in markets that are non-active. A non-active market is a market where there are few transactions for the investment, the prices are not current, or price quotations vary substantially either over time or among market makers, or in which little information is released publicly.
o Inputs other than quoted prices that are observable for the investment (for example, interest rates and yield curves observable at commonly quoted intervals, volatilities, prepayment speeds, loss severities, credit risks, and default rates).
o Inputs that are derived principally from or corroborated by observable market data by correlation or other means.
• Level 3 – Level 3 inputs are unobservable inputs. Unobservable inputs may reflect the reporting entity’s own assumptions about the assumptions that market participants would use in pricing the investment.
The inputs or methodologies used for valuing investments are not necessarily an indication of the risk associated with investing in those investments. A summary of the inputs used to value the Fund’s investments as of December 31, 2024, is included with the Fund’s Consolidated Portfolio of Investments.
B. Investment Transactions and Investment Income
Investment transactions are recorded as of the trade date. Realized gains and losses from investment transactions are recorded on the identified cost basis. Dividend income is recorded on the ex-dividend date. Interest income, if any, is recorded daily on the accrual basis. Amortization of premiums and accretion of discounts are recorded using the effective interest method.
FLEX Options are customized equity or index option contracts that trade on an exchange, but provide investors with the ability to customize key contract terms like exercise prices, styles and expiration dates. FLEX Options are guaranteed for settlement by the Options Clearing Corporation.
The Fund, through the Subsidiary, purchases and sells call and put FLEX Options based on the performance of the Underlying ETF. The FLEX Options that the Subsidiary holds that reference the Underlying ETF will give the Subsidiary the right to receive or deliver shares of the Underlying ETF on the option expiration date at a strike price, depending on whether the option is a put or call option and whether the Subsidiary purchases or sells the option. The FLEX Options held by the Subsidiary are European style options, which are exercisable at the strike price only on the FLEX Option expiration date.
When the Subsidiary writes (sells) an option, an amount equal to the premium received by the Subsidiary is included in “Options contracts written, at value” on the Consolidated Statement of Assets and Liabilities. Gain or loss on written options is presented separately as “Net realized gain (loss) on written options contracts” on the Consolidated Statement of Operations. When the Subsidiary purchases a call or put option, the premium paid represents the cost of the call or put option, which is included in “Options
Notes to Consolidated Financial Statements (Continued)
FT Vest Gold Strategy Target Income ETF® (IGLD)December 31, 2024 contracts purchased, at value” on the Consolidated Statement of Assets and Liabilities. Gain or loss on purchased options is included in “Net realized gain (loss) on purchased options contracts” on the Consolidated Statement of Operations.
D. Dividends and Distributions to Shareholders
Dividends from net investment income of the Fund, if any, are declared and paid monthly, or as the Board of Trustees may determine from time to time. Distributions of net realized capital gains earned by the Fund, if any, are distributed at least annually. The Fund may also designate a portion of the amount paid to redeeming shareholders as a distribution for tax purposes.
Distributions from net investment income and realized capital gains are determined in accordance with federal income tax regulations, which may differ from U.S. GAAP. Certain capital accounts in the consolidated financial statements are periodically adjusted for permanent differences in order to reflect their tax character. These permanent differences are primarily due to the varying treatment of income and gain/loss on portfolio securities held by the Fund and have no impact on net assets or NAV per share. Temporary differences, which arise from recognizing certain items of income, expense and gain/loss in different periods for consolidated financial statement and tax purposes, will reverse at some time in the future.
The tax character of distributions paid during the fiscal years ended December 31, 2024 and 2023 was as follows:
As of December 31, 2024, the components of distributable earnings on a tax basis for the Fund were as follows:
Undistributed ordinary income | |
Accumulated capital and other gain (loss) | |
Net unrealized appreciation (depreciation) | |
The Fund intends to continue to qualify as a regulated investment company by complying with the requirements under Subchapter M of the Internal Revenue Code of 1986, as amended (the “Code”), which includes distributing substantially all of its net investment income and net realized gains to shareholders. Accordingly, no provision has been made for federal and state income taxes. However, due to the timing and amount of distributions, the Fund may be subject to an excise tax of 4% of the amount by which approximately 98% of the Fund’s taxable income exceeds the distributions from such taxable income for the calendar year.
The Subsidiary is classified as a controlled foreign corporation under Subchapter N of the Code. Therefore, the Fund is required to increase its taxable income by its share of the Subsidiary’s income, whether or not such earnings are distributed by the Subsidiary to the Fund. Net investment losses of the Subsidiary cannot be deducted by the Fund in the current period nor carried forward to offset taxable income in future periods.
The Fund is subject to accounting standards that establish a minimum threshold for recognizing, and a system for measuring, the benefits of a tax position taken or expected to be taken in a tax return. The taxable years ended 2021, 2022, 2023, and 2024 remain open to federal and state audit. As of December 31, 2024, management has evaluated the application of these standards to the Fund and has determined that no provision for income tax is required in the Fund’s consolidated financial statements for uncertain tax positions.
The Fund intends to utilize provisions of the federal income tax laws, which allow it to carry a realized capital loss forward indefinitely following the year of the loss and offset such loss against any future realized capital gains. The Fund is subject to certain limitations under U.S. tax rules on the use of capital loss carryforwards and net unrealized built-in losses. These limitations apply when there has been a 50% change in ownership. At December 31, 2024, for federal income tax purposes, the Fund had $32,339 of non-expiring capital loss carryforwards available, to the extent provided by regulations, to offset future capital gains. To the extent that these loss carryforwards are used to offset future capital gains, it is probable that the capital gains so offset will not be distributed to the Fund’s shareholders.
Notes to Consolidated Financial Statements (Continued)
FT Vest Gold Strategy Target Income ETF® (IGLD)December 31, 2024 Certain losses realized during the current fiscal year may be deferred and treated as occurring on the first day of the following fiscal year for federal income tax purposes. For the fiscal year ended December 31, 2024, the Fund had no net late year ordinary or capital losses.
In order to present paid-in capital and accumulated distributable earnings (loss) (which consists of accumulated net investment income (loss), accumulated net realized gain (loss) on investments and net unrealized appreciation (depreciation) on investments) on the Consolidated Statement of Assets and Liabilities that more closely represent their tax character, certain adjustments have been made to paid-in capital, accumulated net investment income (loss) and accumulated net realized gain (loss) on investments. These adjustments are primarily due to the difference between book and tax treatment of net investment income from the Subsidiary. The results of operations and net assets were not affected by these adjustments. For the fiscal year ended December 31, 2024, the adjustments for the Fund were as follows:
Accumulated
Net Investment
Income (Loss) | Accumulated
Net Realized
Gain (Loss)
on Investments | |
| | |
As of December 31, 2024, the aggregate cost, gross unrealized appreciation, gross unrealized depreciation, and net unrealized appreciation/(depreciation) on investments (including short positions and derivatives, if any) for federal income tax purposes were as follows:
| Gross Unrealized
Appreciation | Gross Unrealized
(Depreciation) | Net Unrealized
Appreciation
(Depreciation) |
| | | |
Expenses, other than the investment advisory fee and other excluded expenses, are paid by the Advisor (see Note 3).
The Fund has adopted FASB Accounting Standards Update 2023-07, Segment Reporting (Topic 280) - Improvements to Reportable Segment Disclosures (“ASU 2023-07”). Adoption of the standard impacted financial statement disclosures only and did not affect the Fund’s financial position or the results of its operations. An operating segment is defined in Topic 280 as a component of a public entity that engages in business activities from which it may recognize revenues and incur expenses, has operating results that are regularly reviewed by the public entity’s chief operating decision maker (“CODM”) to make decisions about resources to be allocated to the segment and assess its performance, and has discrete financial information available. The CODM is the President and Chief Executive Officer of the Fund. The Fund operates as a single operating segment. The Fund’s income, expenses, assets, changes in net assets resulting from operations and performance are regularly monitored and assessed as a whole by the CODM responsible for oversight functions of the Fund, using the information presented in the financial statements and financial highlights.
3. Investment Advisory Fee, Affiliated Transactions and Other Fee Arrangements
First Trust, the investment advisor to the Fund, is a limited partnership with one limited partner, Grace Partners of DuPage L.P., and one general partner, The Charger Corporation. The Charger Corporation is an Illinois corporation controlled by James A. Bowen, Chief Executive Officer of First Trust. First Trust is responsible for the ongoing monitoring of the Fund’s and the Subsidiary’s investment portfolios, managing the Fund’s business affairs and providing certain administrative services necessary for the management of the Fund.
First Trust is responsible for the expenses of the Fund and the Subsidiary including the cost of transfer agency, sub-advisory, custody, fund administration, legal, audit and other services, but excluding fee payments under the Investment Management Agreement, interest, taxes, acquired fund fees and expenses, if any, brokerage commissions and other expenses connected with the execution of portfolio transactions, distribution and service fees payable pursuant to a Rule 12b-1 plan, if any, and extraordinary expenses. The annual unitary management fee payable by the Fund to First Trust for these services will be reduced at certain levels of the Fund’s net assets (“breakpoints”) and calculated pursuant to the following schedule:
Notes to Consolidated Financial Statements (Continued)
FT Vest Gold Strategy Target Income ETF® (IGLD)December 31, 2024 | |
Fund net assets up to and including $2.5 billion | |
Fund net assets greater than $2.5 billion up to and including $5 billion | |
Fund net assets greater than $5 billion up to and including $7.5 billion | |
Fund net assets greater than $7.5 billion up to and including $10 billion | |
Fund net assets greater than $10 billion | |
The Subsidiary does not pay First Trust a separate management fee.
Vest Financial LLC (“Vest”), an affiliate of First Trust, serves as the Fund’s sub-advisor and manages the Fund’s portfolio subject to First Trust’s supervision. Pursuant to the Investment Management Agreement, between the Trust, on behalf of the Fund, and the Advisor, and the Investment Sub-Advisory Agreement among the Trust, on behalf of the Fund, the Advisor and Vest, First Trust will supervise Vest and its management of the investment of the Fund’s assets and will pay Vest for its services as the Fund’s sub-advisor a sub-advisory fee equal to 50% of any remaining monthly unitary management fee paid to the Advisor after the average Fund’s expenses accrued during the most recent twelve months are subtracted from the unitary management fee for that month.
The Trust has multiple service agreements with The Bank of New York Mellon (“BNY”). Under the service agreements, BNY performs custodial, fund accounting, certain administrative services, and transfer agency services for the Fund. As custodian, BNY is responsible for custody of the Fund’s assets. As fund accountant and administrator, BNY is responsible for maintaining the books and records of the Fund’s securities and cash. As transfer agent, BNY is responsible for maintaining shareholder records for the Fund. BNY is a subsidiary of The Bank of New York Mellon Corporation, a financial holding company.
Each Trustee who is not an officer or employee of First Trust, any sub-advisor or any of their affiliates (“Independent Trustees”) is paid a fixed annual retainer that is allocated equally among each fund in the First Trust Fund Complex. Each Independent Trustee is also paid an annual per fund fee that varies based on whether the fund is a closed-end or other actively managed fund, a target outcome fund or an index fund.
Additionally, the Chairs of the Audit Committee, Nominating and Governance Committee and Valuation Committee, the Vice Chair of the Audit Committee, the Lead Independent Trustee and the Vice Lead Independent Trustee are paid annual fees to serve in such capacities, with such compensation allocated pro rata among each fund in the First Trust Fund Complex based on net assets. Independent Trustees are reimbursed for travel and out-of-pocket expenses in connection with all meetings. The Committee Chairs, the Audit Committee Vice Chair, the Lead Independent Trustee and the Vice Lead Independent Trustee rotate periodically in serving in such capacities. The officers and “Interested” Trustee receive no compensation from the Trust for acting in such capacities.
4. Purchases and Sales of Securities
For the fiscal year ended December 31, 2024, the cost of purchases and proceeds from sales of investments, excluding short-term investments, derivatives, and in-kind transactions, were $0 and $0, respectively.
For the fiscal year ended December 31, 2024, the Fund had no in-kind transactions.
5. Derivative Transactions
The following table presents the types of derivatives held by the Subsidiary at December 31, 2024, the primary underlying risk exposure and the location of these instruments as presented on the Consolidated Statement of Assets and Liabilities.
| | | |
| | Consolidated
Statement of Assets and
Liabilities Location | | Consolidated
Statement of Assets and
Liabilities Location | |
| | Options contracts purchased, at value | | Options contracts written, at value | |
Notes to Consolidated Financial Statements (Continued)
FT Vest Gold Strategy Target Income ETF® (IGLD)December 31, 2024 The following table presents the amount of net realized gain (loss) and change in net unrealized appreciation (depreciation) recognized for the fiscal year ended December 31, 2024, on derivative instruments, as well as the primary underlying risk exposure associated with the instruments.
Consolidated Statement of Operations Location |
| |
Net realized gain (loss) on: | |
Purchased options contracts | |
Written options contracts | |
Net change in unrealized appreciation (depreciation) on: | |
Purchased options contracts | |
Written options contracts | |
During the fiscal year ended December 31, 2024, the premiums for purchased options contracts opened were $815,476 and the premiums for purchased options contracts closed, exercised and expired were $620,697.
During the fiscal year ended December 31, 2024, the premiums for written options contracts opened were $82,145,304 and the premiums for written options contracts closed, exercised and expired were $60,084,936.
The Fund does not have the right to offset financial assets and financial liabilities related to options contracts on the Consolidated Statement of Assets and Liabilities.
6. Creations, Redemptions and Transaction Fees
The Fund generally issues and redeems its shares in primary market transactions through a creation and redemption mechanism and does not sell or redeem individual shares. Instead, financial entities known as “Authorized Participants” have contractual arrangements with the Fund or one of the Fund’s service providers to purchase and redeem Fund shares directly with the Fund in Creation Units. Prior to the start of trading on every business day, the Fund publishes through the National Securities Clearing Corporation the “basket” of securities, cash or other assets that it will accept in exchange for a Creation Unit of the Fund’s shares. An Authorized Participant that wishes to effectuate a creation of the Fund’s shares deposits with the Fund the “basket” of securities, cash or other assets identified by the Fund that day, and then receives the Creation Unit of the Fund’s shares in return for those assets. After purchasing a Creation Unit, the Authorized Participant may continue to hold the Fund’s shares or sell them in the secondary market. The redemption process is the reverse of the purchase process: the Authorized Participant redeems a Creation Unit of the Fund’s shares for a basket of securities, cash or other assets. The combination of the creation and redemption process with secondary market trading in the Fund’s shares and underlying securities provides arbitrage opportunities that are designed to help keep the market price of the Fund’s shares at or close to the NAV per share of the Fund.
The Fund imposes fees in connection with the purchase of Creation Units. These fees may vary based upon various fact-based circumstances, including, but not limited to, the composition of the securities included in the Creation Unit or the countries in which the transactions are settled. The price for each Creation Unit will equal the daily NAV per share of the Fund times the number of shares in a Creation Unit, plus the fees described above and, if applicable, any operational processing and brokerage costs, transfer fees, stamp taxes and part or all of the spread between the expected bid and offer side of the market related to the securities comprising the creation basket.
The Fund also imposes fees in connection with the redemption of Creation Units. These fees may vary based upon various fact-based circumstances, including, but not limited to, the composition of the securities included in the Creation Unit or the countries in which the transactions are settled. The price received for each Creation Unit will equal the daily NAV per share of the Fund times the number of shares in a Creation Unit, minus the fees described above and, if applicable, any operational processing and brokerage costs, transfer fees, stamp taxes and part or all of the spread between the expected bid and offer side of the market related to the securities comprising the redemption basket. Investors who use the services of a broker or other such intermediary in addition to an Authorized Participant to effect a redemption of a Creation Unit may also be assessed an amount to cover the cost of such services. The redemption fee charged by the Fund will comply with Rule 22c-2 of the 1940 Act which limits redemption fees to no more than 2% of the value of the shares redeemed.
Notes to Consolidated Financial Statements (Continued)
FT Vest Gold Strategy Target Income ETF® (IGLD)December 31, 2024 7. Distribution Plan
The Board of Trustees adopted a Distribution and Service Plan pursuant to Rule 12b-1 under the 1940 Act. In accordance with the Rule 12b-1 plan, the Fund is authorized to pay an amount up to 0.25% of its average daily net assets each year to reimburse First Trust Portfolios L.P. (“FTP”), the distributor of the Fund, for amounts expended to finance activities primarily intended to result in the sale of Creation Units or the provision of investor services. FTP may also use this amount to compensate securities dealers or other persons that are Authorized Participants for providing distribution assistance, including broker-dealer and shareholder support and educational and promotional services.
No 12b-1 fees are currently paid by the Fund, and pursuant to a contractual arrangement, no 12b-1 fees will be paid any time before April 30, 2026.
The Trust, on behalf of the Fund, has a variety of indemnification obligations under contracts with its service providers. The Trust’s maximum exposure under these arrangements is unknown. However, the Trust has not had prior claims or losses pursuant to these contracts and expects the risk of loss to be remote.
Management has evaluated the impact of all subsequent events on the Fund through the date the consolidated financial statements were issued and has determined that there were no subsequent events requiring recognition or disclosure in the consolidated financial statements that have not already been disclosed.
Report of Independent Registered Public Accounting Firm
To the Shareholders and the Board of Trustees of First Trust Exchange-Traded Fund:
Opinion on the Financial Statements and Financial Highlights
We have audited the accompanying consolidated statement of assets and liabilities, including the consolidated portfolio of investments, of FT Vest Gold Strategy Target Income ETF® (the “Fund”), one of the funds constituting the First Trust Exchange-Traded Fund, as of December 31, 2024, the related consolidated statement of operations for the year then ended, the consolidated statements of changes in net assets for each of the two years in the period then ended, and the consolidated financial highlights for the years ended December 31, 2024, 2023, and 2022, and the period from March 2, 2021 (commencement of investment operations) through December 31, 2021, and the related notes. In our opinion, the financial statements and financial highlights present fairly, in all material respects, the financial position of the Fund as of December 31, 2024, and the results of its operations for the year then ended, and the changes in its net assets for each of the two years in the period then ended, and the financial highlights for the years ended December 31, 2024, 2023, and 2022, and the period from March 2, 2021 (commencement of investment operations) through December 31, 2021 in conformity with accounting principles generally accepted in the United States of America.
These financial statements and financial highlights are the responsibility of the Fund’s management. Our responsibility is to express an opinion on the Fund’s financial statements and financial highlights based on our audits. We are a public accounting firm registered with the Public Company Accounting Oversight Board (United States) (PCAOB) and are required to be independent with respect to the Fund in accordance with the U.S. federal securities laws and the applicable rules and regulations of the Securities and Exchange Commission and the PCAOB.
We conducted our audits in accordance with the standards of the PCAOB. Those standards require that we plan and perform the audit to obtain reasonable assurance about whether the financial statements and financial highlights are free of material misstatement, whether due to error or fraud. The Fund is not required to have, nor were we engaged to perform, an audit of its internal control over financial reporting. As part of our audits, we are required to obtain an understanding of internal control over financial reporting but not for the purpose of expressing an opinion on the effectiveness of the Fund’s internal control over financial reporting. Accordingly, we express no such opinion.
Our audits included performing procedures to assess the risks of material misstatement of the financial statements and financial highlights, whether due to error or fraud, and performing procedures that respond to those risks. Such procedures included examining, on a test basis, evidence regarding the amounts and disclosures in the financial statements and financial highlights. Our audits also included evaluating the accounting principles used and significant estimates made by management, as well as evaluating the overall presentation of the financial statements and financial highlights. Our procedures included confirmation of securities owned as of December 31, 2024, by correspondence with the custodian and brokers; when replies were not received from brokers, we performed other auditing procedures. We believe that our audits provide a reasonable basis for our opinion.
/s/ Deloitte & Touche, LLP
Chicago, Illinois
February 24, 2025
We have served as the auditor of one or more First Trust investment companies since 2001.
FT Vest Gold Strategy Target Income ETF® (IGLD)December 31, 2024 (Unaudited)
Changes in and Disagreements with Accountants (Item 8 of Form N-CSR)
There were no changes in or disagreements with the Fund’s accountants during the fiscal year ended December 31, 2024.
Proxy Disclosures (Item 9 of Form N-CSR)
There were no matters submitted for vote by shareholders of the Fund during the fiscal year ended December 31, 2024.
Remuneration Paid to Directors, Officers, and Others (Item 10 of Form N-CSR)
Independent Trustees and any member of any advisory board of the Fund are compensated through the unitary management fee paid by the Fund to the advisor and not directly by the Fund. The investment advisory fee paid is included in the Consolidated Statement of Operations.
Statement Regarding the Basis for the Board’s Approval of Investment Advisory Contract (Item 11 of Form N-CSR)
Remuneration Disclosure Under the Alternative Investment Fund Managers Directive
First Trust Advisors L.P. (“First Trust”) is authorised and regulated by the U.S. Securities and Exchange Commission and is entitled to market shares of certain funds it manages, including FT Vest Gold Strategy Target Income ETF® (the “Fund”), in certain member states in the European Economic Area in accordance with the cooperation arrangements in Article 42 of the Alternative Investment Fund Managers Directive (the “Directive”). First Trust is required under the Directive to make disclosures in respect of remuneration. The following disclosures are made in line with First Trust’s interpretation of currently available regulatory guidance on remuneration disclosures.
During the year ended December 31, 2024, the amount of remuneration paid (or to be paid) by First Trust Advisors L.P. in respect of the Fund is $44,261. This figure is comprised of $1,784 paid (or to be paid) in fixed compensation and $42,477 paid (or to be paid) in variable compensation. There were a total of 24 beneficiaries of the remuneration described above. Those amounts include $23,202 paid (or to be paid) to senior management of First Trust Advisors L.P. and $21,059 paid (or to be paid) to other employees whose professional activities have a material impact on the risk profiles of First Trust Advisors L.P. or the Fund (collectively, “Code Staff”).
Code Staff included in the aggregated figures disclosed above are rewarded in line with First Trust’s remuneration policy (the “Remuneration Policy”) which is determined and implemented by First Trust’s senior management. The Remuneration Policy reflects First Trust’s ethos of good governance and encapsulates the following principal objectives:
i.
to provide a clear link between remuneration and performance of First Trust and to avoid rewarding for failure;
ii.
to promote sound and effective risk management consistent with the risk profiles of the funds managed by First Trust; and
iii.
to remunerate staff in line with the business strategy, objectives, values and interests of First Trust and the funds managed by First Trust in a manner that avoids conflicts of interest.
First Trust assesses various risk factors which it is exposed to when considering and implementing remuneration for Code Staff and considers whether any potential award to such person(s) would give rise to a conflict of interest. First Trust does not reward failure, or consider the taking of risk or failure to take risk in its remuneration of Code Staff.
First Trust assesses performance for the purposes of determining payments in respect of performance-related remuneration of Code Staff by reference to a broad range of measures including (i) individual performance (using financial and non-financial criteria), and (ii) the overall performance of First Trust. Remuneration is not based upon the performance of the Fund.
The elements of remuneration are balanced between fixed and variable and the senior management sets fixed salaries at a level sufficient to ensure that variable remuneration incentivises and rewards strong individual performance but does not encourage excessive risk taking.
No individual is involved in setting his or her own remuneration.
Other Information (Continued)
FT Vest Gold Strategy Target Income ETF® (IGLD)December 31, 2024 (Unaudited) Federal Tax Information
For the taxable year ended December 31, 2024, the following percentages of income dividends paid by the Fund qualify for the dividends received deduction available to corporations and are hereby designated as qualified dividend income:
Dividends Received Deduction | Qualified Dividend Income |
| |
Distributions paid to foreign shareholders during the Fund’s fiscal year ended December 31, 2024 that were properly designated by the Fund as “interest-related dividends” or “short-term capital gain dividends,” may not be subject to federal income tax provided that the income was earned directly by such foreign shareholders.
The Fund is not sponsored, endorsed, sold or promoted by SPDR® Gold Trust and World Gold Trust Services, LLC, (together with their affiliates hereinafter referred to as the “Corporations”). The Corporations have not passed on the legality or suitability of, or the accuracy or adequacy of, descriptions and disclosures relating to the Fund or the FLEX Options. The Corporations make no representations or warranties, express or implied, regarding the advisability of investing in the Fund or the FLEX Options or results to be obtained by the Fund or the FLEX Options, shareholders or any other person or entity from use of the Underlying ETF. The Corporations have no liability in connection with the management, administration, marketing or trading of the Fund or the FLEX Options.
Annual Financial
Statements and
Other Information |
For the Year Ended
December 31, 2024 |
First Trust Exchange-Traded Fund
First Trust WCM Developing World Equity ETF (WCME) |
First Trust WCM International Equity ETF (WCMI) |
First Trust Exchange-Traded Fund
Annual Financial Statements and Other Information
December 31, 2024
Performance and Risk Disclosure
There is no assurance that any series of First Trust Exchange-Traded Fund (the “Trust”) described in this report (each such series is referred to as a “Fund” and collectively, as the “Funds”) will achieve its investment objective. Each Fund is subject to market risk, which is the possibility that the market values of securities owned by the Fund will decline and that the value of the Fund’s shares may therefore be less than what you paid for them. Accordingly, you can lose money by investing in a Fund.
Performance data quoted represents past performance, which is no guarantee of future results, and current performance may be lower or higher than the figures shown. For the most recent month-end performance figures, please visit www.ftportfolios.com or speak with your financial advisor. Investment returns, net asset value and share price will fluctuate and Fund shares, when sold, may be worth more or less than their original cost.
First Trust Advisors L.P., the Funds’ advisor, may also periodically provide additional information on Fund performance on each Fund’s webpage at www.ftportfolios.com.
This report contains information that may help you evaluate your investment. It includes details about each Fund and presents data that provides insight into each Fund’s performance and investment approach.
The material risks of investing in each Fund are spelled out in its prospectus, statement of additional information, and other Fund regulatory filings.
First Trust WCM Developing World Equity ETF (WCME)Portfolio of InvestmentsDecember 31, 2024
| | |
COMMON STOCKS (a) (b) — 99.1% |
| | |
| | |
| | |
| B3 S.A. - Brasil Bolsa Balcao (BRL) | |
| Hapvida Participacoes e Investimentos S.A. (BRL) (c) (d) (e) | |
| | |
| | |
| | |
| | |
| Ivanhoe Mines Ltd., Class A (CAD) (d) | |
| | |
| Shenzhou International Group Holdings Ltd. (HKD) | |
| Tencent Holdings Ltd. (HKD) | |
| | |
| | |
| | |
| Hong Kong Exchanges & Clearing Ltd. (HKD) | |
| | |
| | |
| Richter Gedeon Nyrt (HUF) | |
| | |
| | |
| | |
| | |
| | |
| Bank Central Asia Tbk PT (IDR) | |
| | |
| Nippon Paint Holdings Co., Ltd. (JPY) | |
| | |
| | |
| | |
| | |
| | |
| Grupo Aeroportuario del Pacifico S.A.B. de C.V., Class B (MXN) | |
| Megacable Holdings S.A.B. de C.V. (MXN) | |
| | |
| | |
|
| | |
| Adyen N.V. (EUR) (c) (d) (e) | |
| ASM International N.V. (EUR) | |
| | |
| | |
| Copa Holdings S.A., Class A | |
| | |
| United Overseas Bank Ltd. (SGD) | |
| | |
| | |
| | |
| Samsung Electronics Co., Ltd., GDR (e) | |
| | |
| | |
| | |
| Feng TAY Enterprise Co., Ltd. (TWD) | |
| Taiwan Semiconductor Manufacturing Co., Ltd. (TWD) | |
| | |
| | |
| | |
| | |
| | |
| | |
| | |
| | |
|
|
| Total Investments — 99.1% | |
| | |
| Net Other Assets and Liabilities — 0.9% | |
| | |
| Portfolio securities are categorized based upon their country of incorporation. |
| Securities are issued in U.S. dollars unless otherwise indicated in the security description. |
| This security is exempt from registration upon resale under Rule 144A of the Securities Act of 1933, as amended (the “1933 Act”) and may be resold in transactions exempt from registration, normally to qualified institutional buyers. This security is not restricted on the foreign exchange where it trades freely without any additional registration. |
| Non-income producing security. |
| This security may be resold to qualified foreign investors and foreign institutional buyers under Regulation S of the 1933 Act. |
See Notes to Financial Statements
First Trust WCM Developing World Equity ETF (WCME)Portfolio of Investments (Continued)December 31, 2024 Abbreviations throughout the Portfolio of Investments: |
| – American Depositary Receipt |
| |
| |
| |
| |
| – Global Depositary Receipt |
| |
| |
| |
| |
| |
| |
| |
| |
| |
| |
| |
Currency Exposure Diversification | |
| |
| |
| |
| |
| |
| |
| |
| |
| |
| |
| |
| |
| |
| |
| |
| |
Valuation InputsA summary of the inputs used to value the Fund’s investments as of December 31, 2024 is as follows (see Note 2A - Portfolio Valuation in the Notes to Financial Statements):
| | | Level 2
Significant
Observable
Inputs | Level 3
Significant
Unobservable
Inputs |
| | | | |
| See Portfolio of Investments for country breakout. |
See Notes to Financial Statements
First Trust WCM International Equity ETF (WCMI)Portfolio of InvestmentsDecember 31, 2024
| | |
COMMON STOCKS (a) (b) — 97.1% |
| | |
| B3 S.A. - Brasil Bolsa Balcao (BRL) | |
| | |
| | |
| | |
| Canadian National Railway Co. (CAD) | |
| Ivanhoe Mines Ltd., Class A (CAD) (c) | |
| | |
| | |
| | |
| Shenzhou International Group Holdings Ltd. (HKD) | |
| | |
| | |
| LVMH Moet Hennessy Louis Vuitton SE (EUR) | |
| | |
| Sartorius Stedim Biotech (EUR) | |
| | |
| | |
| | |
| Siemens Healthineers AG (EUR) (d) (e) | |
| | |
| | |
| | |
| | |
| | |
| | |
| | |
| | |
| GMO Payment Gateway, Inc. (JPY) | |
| | |
| Nippon Paint Holdings Co., Ltd. (JPY) | |
| | |
| | |
| Grupo Aeroportuario del Pacifico S.A.B. de C.V., Class B (MXN) | |
| Megacable Holdings S.A.B. de C.V. (MXN) | |
| | |
| | |
|
| | |
| Adyen N.V. (EUR) (c) (d) (e) | |
| ASM International N.V. (EUR) | |
| | |
| | |
| United Overseas Bank Ltd. (SGD) | |
| | |
| | |
| | |
| Bravida Holding AB (SEK) (d) (e) | |
| | |
| | |
| | |
| Taiwan Semiconductor Manufacturing Co., Ltd. (TWD) | |
| | |
| | |
| | |
| | |
| | |
| London Stock Exchange Group PLC (GBP) | |
| | |
| | |
| Wise PLC, Class A (GBP) (c) | |
| | |
| | |
| | |
| Mastercard, Inc., Class A | |
| Veeva Systems, Inc., Class A (c) | |
| | |
|
|
| Total Investments — 97.1% | |
| | |
| Net Other Assets and Liabilities — 2.9% | |
| | |
| Portfolio securities are categorized based upon their country of incorporation. |
| Securities are issued in U.S. dollars unless otherwise indicated in the security description. |
| Non-income producing security. |
See Notes to Financial Statements
First Trust WCM International Equity ETF (WCMI)Portfolio of Investments (Continued)December 31, 2024 | This security is exempt from registration upon resale under Rule 144A of the Securities Act of 1933, as amended (the “1933 Act”) and may be resold in transactions exempt from registration, normally to qualified institutional buyers. This security is not restricted on the foreign exchange where it trades freely without any additional registration. |
| This security may be resold to qualified foreign investors and foreign institutional buyers under Regulation S of the 1933 Act. |
Abbreviations throughout the Portfolio of Investments: |
| – American Depositary Receipt |
| |
| |
| |
| |
| |
| |
| |
| |
| |
| |
| |
Currency Exposure Diversification | |
| |
| |
| |
| |
| |
| |
| |
| |
| |
| |
| |
| |
Valuation InputsA summary of the inputs used to value the Fund’s investments as of December 31, 2024 is as follows (see Note 2A - Portfolio Valuation in the Notes to Financial Statements):
| | | Level 2
Significant
Observable
Inputs | Level 3
Significant
Unobservable
Inputs |
| | | | |
| See Portfolio of Investments for country breakout. |
See Notes to Financial Statements
First Trust Exchange-Traded FundStatements of Assets and Liabilities
December 31, 2024
| First Trust WCM Developing World Equity ETF
(WCME) | First Trust WCM International Equity ETF
(WCMI) |
| | |
| | |
| | |
Due from authorized participant | | |
| | |
| | |
| | |
Investment securities sold | | |
| | |
| | |
|
| | |
Due to custodian foreign currency | | |
| | |
| | |
Investment securities purchased | | |
| | |
| | |
| | |
|
| | |
| | |
| | |
Accumulated distributable earnings (loss) | | |
| | |
NET ASSET VALUE, per share | | |
Number of shares outstanding (unlimited number of shares authorized, par value $0.01 per share) | | |
| | |
Foreign currency, at cost (proceeds) | | |
| First Trust WCM Developing World Equity ETF (the “Fund”) acquired all of the assets and liabilities of the WCM Developing World Equity Fund (“Predecessor Fund”) in a reorganization that occurred as of the close of business on October 4, 2024. Performance and financial history of the Predecessor Fund’s Institutional Class Shares have been adopted by the Fund and will be used going forward. As a result, the financial highlight information reflects that of the Predecessor Fund’s Institutional Class Shares for the period January 1, 2024 up through the reorganization. Prior to the reorganization on October 7, 2024, the Fund converted all Investor Class Shares to Institutional Class Shares. This was a tax-free exchange. The Investor Class Shares were terminated. |
| First Trust WCM International Equity ETF (the “Fund”) acquired all of the assets and liabilities of the WCM International Equity Fund (“Predecessor Fund”) in a reorganization that occurred as of the close of business on October 4, 2024. Performance and financial history of the Predecessor Fund’s Institutional Class Shares have been adopted by the Fund and will be used going forward. As a result, the financial highlight information reflects that of the Predecessor Fund’s Institutional Class Shares for the period January 1, 2024 up through the reorganization. Prior to the reorganization on October 7, 2024, the Fund converted all Investor Class Shares to Institutional Class Shares. This was a tax-free exchange. The Investor Class Shares were terminated. |
See Notes to Financial Statements
First Trust Exchange-Traded FundStatements of Operations
For the Year Ended December 31, 2024
| First Trust WCM Developing World Equity ETF
(WCME) (a) | First Trust WCM International Equity ETF
(WCMI) (b) |
| | |
| | |
| | |
| | |
| | |
|
| | |
Accounting and administration fees | | |
Registration and filing fees | | |
| | |
| | |
| | |
| | |
Shareholder reporting fees | | |
Trustees’ fees and expenses | | |
| | |
| | |
| | |
| | |
| | |
| | |
Less fees waived by the investment advisor | | |
| | |
NET INVESTMENT INCOME (LOSS) | | |
|
NET REALIZED AND UNREALIZED GAIN (LOSS): | | |
Net realized gain (loss) on: | | |
| | |
| | |
Foreign currency transactions | | |
Foreign capital gains tax | | |
| | |
Net change in unrealized appreciation (depreciation) on: | | |
| | |
Foreign currency translation | | |
Deferred foreign capital gains tax | | |
Net change in unrealized appreciation (depreciation) | | |
NET REALIZED AND UNREALIZED GAIN (LOSS) | | |
NET INCREASE (DECREASE) IN NET ASSETS RESULTING FROM OPERATIONS | | |
| Results for periods prior to October 7, 2024 are for WCM Developing World Equity Fund - Institutional Class. See Note 4 in the Notes to Financial Statements. |
| Results for periods prior to October 7, 2024 are for WCM International Equity Fund - Institutional Class. See Note 4 in the Notes to Financial Statements. |
See Notes to Financial Statements
First Trust Exchange-Traded FundStatements of Changes in Net Assets
| First Trust WCM Developing World Equity ETF (WCME) | First Trust WCM International Equity ETF (WCMI) |
| | | | |
| | | | |
Net investment income (loss) | | | | |
| | | | |
Net change in unrealized appreciation (depreciation) | | | | |
Net increase (decrease) in net assets resulting from operations | | | | |
|
DISTRIBUTIONS TO SHAREHOLDERS FROM: | | | | |
| | | | |
|
SHAREHOLDER TRANSACTIONS: | | | | |
Proceeds from shares sold | | | | |
Reinvestment of distributions | | | | |
| | | | |
Proceeds from shares sold (Investor Class) | | | | |
Reinvestment of distributions (Investor Class) | | | | |
Cost of shares redeemed (Investor Class) | | | | |
Net increase (decrease) in net assets resulting from shareholder transactions | | | | |
Total increase (decrease) in net assets | | | | |
|
| | | | |
| | | | |
| | | | |
|
CHANGES IN SHARES OUTSTANDING: | | | | |
Shares outstanding, beginning of period | | | | |
| | | | |
| | | | |
| | | | |
Shares outstanding, end of period | | | | |
Shares outstanding, beginning of period (Investor Class) | | | | |
Shares sold (Investor Class) | | | | |
Shares reinvested (Investor Class) | | | | |
Shares redeemed (Investor Class) | | | | |
Shares outstanding, end of period (Investor Class) | | | | |
Total Shares outstanding, end of period | | | | |
| First Trust WCM Developing World Equity ETF (the “Fund”) acquired all of the assets and liabilities of the WCM Developing World Equity Fund (“Predecessor Fund”) in a reorganization that occurred as of the close of business on October 4, 2024. Performance and financial history of the Predecessor Fund’s Institutional Class Shares have been adopted by the Fund and will be used going forward. As a result, the financial highlight information reflects that of the Predecessor Fund’s Institutional Class Shares for the period January 1, 2024 up through the reorganization. Prior to the reorganization on October 7, 2024, the Fund converted all Investor Class Shares into Institutional Class Shares. This was a tax-free exchange. The Investor Class Shares were terminated. |
| First Trust WCM International Equity ETF (the “Fund”) acquired all of the assets and liabilities of the WCM International Equity Fund (“Predecessor Fund”) in a reorganization that occurred as of the close of business on October 4, 2024. Performance and financial history of the Predecessor Fund’s Institutional Class Shares have been adopted by the Fund and will be used going forward. As a result, the financial highlight information reflects that of the Predecessor Fund’s Institutional Class Shares for the period January 1, 2024 up through the reorganization. Prior to the reorganization on October 7, 2024, the Fund converted all Investor Class Shares into Institutional Class Shares. This was a tax-free exchange. The Investor Class Shares were terminated. |
See Notes to Financial Statements
First Trust Exchange-Traded FundFinancial Highlights
For a share outstanding throughout each period First Trust WCM Developing World Equity ETF (WCME)
| | For the Period
5/1/2022
through
12/31/2022(a) (b) | | Period
Ended
4/30/2020(a) (c) |
| | | | |
| | | | | | |
Net asset value, beginning of period | | | | | | |
Income from investment operations: | | | | | | |
Net investment income (loss) (d) | | | | | | |
Net realized and unrealized gain (loss) | | | | | | |
Total from investment operations | | | | | | |
Distributions paid to shareholders from: | | | | | | |
From net investment income | | | | | | |
| | | | | | |
| | | | | | |
Net asset value, end of period | | | | | | |
| | | | | | |
|
Ratios to average net assets/supplemental data: | | | | | | |
Net assets, end of period (in 000’s) | | | | | | |
Ratio of total expenses to average net assets | | | | | | |
Ratio of net expenses to average net assets | | | | | | |
Ratio of net investment income (loss) to average net assets | | | | | | |
Portfolio turnover rate (j) | | | | | | |
| Results for periods prior to October 7, 2024 are for WCM Developing World Equity Fund - Institutional Class. See Note 4 in the Notes to Financial Statements. The advisor prior to October 7, 2024 was WCM Investment Management, LLC. |
| Fiscal year end changed to December 31, effective December 14, 2022. |
| Commenced investment operations on March 31, 2020. |
| Based on average shares outstanding. |
| Total return is calculated assuming an initial investment made at the net asset value at the beginning of the period, reinvestment of all distributions at net asset value during the period, and redemption at net asset value on the last day of the period. The returns presented do not reflect the deduction of taxes that a shareholder would pay on Fund distributions or the redemption or sale of Fund shares. Total return is calculated for the time period presented and is not annualized for periods of less than a year. The total returns would have been lower if certain fees had not been waived and expenses reimbursed by the investment advisor. |
| If tax expense had been excluded, the expense ratios would have been lowered by 0.00% for the year ended December 31, 2023. |
| |
| Effective October 7, 2024, there is no longer a fee waiver. |
| Effective October 1, 2023, the investment advisor to the Predecessor Funds contractually agreed to limit the annual operating expenses to 0.95%. Prior to October 1, 2023, the investment advisor to the Predecessor Funds had contractually agreed to limit the annual operating expenses to 1.25%. |
| Portfolio turnover is calculated for the time period presented and is not annualized for periods of less than a year and does not include securities received or delivered from processing creations or redemptions and in-kind transactions. |
See Notes to Financial Statements
First Trust Exchange-Traded FundFinancial Highlights (Continued)
For a share outstanding throughout each period First Trust WCM International Equity ETF (WCMI)
| | For the Period
5/1/2022
through
12/31/2022(a) (b) | | Period
Ended
4/30/2020(a) (c) |
| | | | |
| | | | | | |
Net asset value, beginning of period | | | | | | |
Income from investment operations: | | | | | | |
Net investment income (loss) (d) | | | | | | |
Net realized and unrealized gain (loss) | | | | | | |
Total from investment operations | | | | | | |
Distributions paid to shareholders from: | | | | | | |
From net investment income | | | | | | |
| | | | | | |
| | | | | | |
Net asset value, end of period | | | | | | |
| | | | | | |
|
Ratios to average net assets/supplemental data: | | | | | | |
Net assets, end of period (in 000’s) | | | | | | |
Ratio of total expenses to average net assets | | | | | | |
Ratio of net expenses to average net assets excluding interest expense | | | | | | |
Ratio of net investment income (loss) to average net assets | | | | | | |
Portfolio turnover rate (k) | | | | | | |
| Results for periods prior to October 7, 2024 are for WCM International Equity Fund - Institutional Class. See Note 4 in the Notes to Financial Statements. The advisor prior to October 7, 2024 was WCM Investment Management, LLC. |
| Fiscal year end changed to December 31, effective December 14, 2022. |
| Commenced investment operations on March 31, 2020. |
| Based on average shares outstanding. |
| Amount represents less than $0.01. |
| Total return is calculated assuming an initial investment made at the net asset value at the beginning of the period, reinvestment of all distributions at net asset value during the period, and redemption at net asset value on the last day of the period. The returns presented do not reflect the deduction of taxes that a shareholder would pay on Fund distributions or the redemption or sale of Fund shares. Total return is calculated for the time period presented and is not annualized for periods of less than a year. The total returns would have been lower if certain fees had not been waived and expenses reimbursed by the investment advisor. |
| |
| Effective October 7, 2024, there is no longer a fee waiver. |
| Effective October 1, 2023, the investment advisor to the Predecessor Funds contractually agreed to limit the annual operating expenses to 0.85%. Prior to October 1, 2023, the investment advisor to the Predecessor Funds had contractually agreed to limit the annual operating expenses to 1.10%. |
| Effective December 31, 2022, the investment advisor to the Predecessor Funds contractually agreed to limit the annual operating expenses to 1.10%. Prior to December 31, 2022, the investment advisor to the Predecessor Funds had contractually agreed to limit the annual operating expenses to 1.25%. |
| Portfolio turnover is calculated for the time period presented and is not annualized for periods of less than a year and does not include securities received or delivered from processing creations or redemptions and in-kind transactions. |
See Notes to Financial Statements
Notes to Financial Statements
First Trust Exchange-Traded FundDecember 31, 2024
1. Organization
First Trust Exchange-Traded Fund (the “Trust”) is an open-end management investment company organized as a Massachusetts business trust on August 8, 2003, and is registered with the Securities and Exchange Commission under the Investment Company Act of 1940, as amended (the “1940 Act”).
This report covers the two Funds (each a “Fund” and collectively, the “Funds”) listed below. The shares of each Fund are listed and traded on the NYSE Arca, Inc.
First Trust WCM Developing World Equity ETF – (ticker “WCME”) |
First Trust WCM International Equity ETF – (ticker “WCMI”) |
On September 27, 2024, First Trust Advisors L.P. (“First Trust” or the “Advisor”) and WCM Investment Managmement, LLC (“WCM” or the “Sub-Advisor”) jointly announced the reorganizations of WCM Developing World Equity Fund and WCM International Equity Fund (the “Predecessor Funds” and each, a “Predecessor Fund”), into corresponding newly created series of the Trust, First Trust WCM Developing World Equity ETF and First Trust WCM International Equity ETF (the “Acquiring Funds” and each, an “Acquiring Fund”), respectively. Effective October 7, 2024, each Acquiring Fund acquired all of the assets and assumed all of the liabilities of its respective Predecessor Fund pursuant to an agreement and plan of reorganization approved by the Board of Trustees of the Fund on June 3, 2024.
WCME operates as a non-diversified series of the Trust. WCMI operates as a diversified open-end management investment company as defined in Section 5(b) of the 1940 Act. Each Fund is an actively managed exchange-traded fund representing a separate series of shares of beneficial interest in the Trust. Unlike conventional mutual funds, each Fund issues and redeems shares on a continuous basis, at net asset value (“NAV”), only in large blocks of shares known as “Creation Units.”
WCME’s investment objective is to seek to provide investors with long-term capital appreciation. Under normal circumstances, the Fund will invest at least 80% of its net assets (plus any borrowings for investment purposes) in equity securities of companies located in developing countries.
WCMI’s investment objective is to seek to provide investors with long-term capital appreciation. Under normal circumstances, the Fund invests at least 80% of its net assets (plus any borrowings for investment purposes) in equity securities of non-U.S. domiciled companies / companies not located in the U.S.
2. Significant Accounting Policies
The Funds are each considered an investment company and follow accounting and reporting guidance under Financial Accounting Standards Board (“FASB”) Accounting Standards Codification Topic 946, “Financial Services-Investment Companies.” The following is a summary of significant accounting policies consistently followed by the Funds in the preparation of the financial statements. The preparation of the financial statements in accordance with accounting principles generally accepted in the United States of America (“U.S. GAAP”) requires management to make estimates and assumptions that affect the reported amounts and disclosures in the financial statements. Actual results could differ from those estimates.
Each Fund’s NAV is determined daily as of the close of regular trading on the New York Stock Exchange (“NYSE”), normally 4:00 p.m. Eastern time, on each day the NYSE is open for trading. If the NYSE closes early on a valuation day, the NAV is determined as of that time. Each Fund’s NAV is calculated by dividing the value of all assets of each Fund (including accrued interest and dividends), less all liabilities (including accrued expenses and dividends declared but unpaid), by the total number of shares outstanding.
Each Fund’s investments are valued daily at market value or, in the absence of market value with respect to any portfolio securities, at fair value. Market value prices represent readily available market quotations such as last sale or official closing prices from a national or foreign exchange (i.e., a regulated market) and are primarily obtained from third-party pricing services. Fair value prices represent any prices not considered market value prices and are either obtained from a third-party pricing service or are determined by the Advisor’s Pricing Committee in accordance with valuation procedures approved by the Trust’s Board of Trustees, and in accordance with provisions of the 1940 Act and rules thereunder. Investments valued by the Advisor’s Pricing Committee, if any, are footnoted as such in the footnotes to the Portfolio of Investments. Each Fund’s investments are valued as follows:
Notes to Financial Statements (Continued)
First Trust Exchange-Traded FundDecember 31, 2024 Common stocks and other equity securities listed on any national or foreign exchange (excluding Nasdaq, Inc. (“Nasdaq”) and the London Stock Exchange Alternative Investment Market (“AIM”)) are valued at the last sale price on the exchange on which they are principally traded or, for Nasdaq and AIM securities, the official closing price. Securities traded on more than one securities exchange are valued at the last sale price or official closing price, as applicable, at the close of the securities exchange representing the primary exchange for such securities.
Securities trading on foreign exchanges or over-the-counter markets that close prior to the NYSE close may be valued using a systematic fair valuation model provided by a third-party pricing service. If these foreign securities meet certain criteria in relation to the valuation model, their valuation is systematically adjusted to reflect the impact of movement in the U.S. market after the close of the foreign markets.
Equity securities traded in an over-the-counter market are valued at the close price or the last trade price.
Certain securities may not be able to be priced by pre-established pricing methods. Such securities may be valued by the Advisor’s Pricing Committee at fair value. These securities generally include, but are not limited to, restricted securities (securities which may not be publicly sold without registration under the Securities Act of 1933, as amended) for which a third-party pricing service is unable to provide a market price; securities whose trading has been formally suspended; a security whose market or fair value price is not available from a pre-established pricing source; a security with respect to which an event has occurred that is likely to materially affect the value of the security after the market has closed but before the calculation of a Fund’s NAV or make it difficult or impossible to obtain a reliable market quotation; and a security whose price, as provided by the third-party pricing service, does not reflect the security’s fair value. As a general principle, the current fair value of a security would appear to be the amount which the owner might reasonably expect to receive for the security upon its current sale. When fair value prices are used, generally they will differ from market quotations or official closing prices on the applicable exchanges. A variety of factors may be considered in determining the fair value of such securities, including, but not limited to, the following:
1)
the last sale price on the exchange on which they are principally traded or, for Nasdaq and AIM securities, the official closing price;
3)
the size of the holding;
4)
the initial cost of the security;
5)
transactions in comparable securities;
6)
price quotes from dealers and/or third-party pricing services;
7)
relationships among various securities;
8)
information obtained by contacting the issuer, analysts, or the appropriate stock exchange;
9)
an analysis of the issuer’s financial statements;
10)
the existence of merger proposals or tender offers that might affect the value of the security; and
11)
other relevant factors.
If the securities in question are foreign securities, the following additional information may be considered:
1)
the last sale price on the exchange on which they are principally traded;
2)
the value of similar foreign securities traded on other foreign markets;
3)
ADR trading of similar securities;
4)
closed-end fund or exchange-traded fund trading of similar securities;
5)
foreign currency exchange activity;
6)
the trading prices of financial products that are tied to baskets of foreign securities;
7)
factors relating to the event that precipitated the pricing problem;
8)
whether the event is likely to recur;
9)
whether the effects of the event are isolated or whether they affect entire markets, countries or regions; and
10)
other relevant factors.
Because foreign markets may be open on different days than the days during which investors may transact in the shares of a Fund, the value of the Fund’s securities may change on the days when investors are not able to transact in the shares of the Fund. The value of the securities denominated in foreign currencies is converted into U.S. dollars using exchange rates determined daily as of the close of regular trading on the NYSE.
Notes to Financial Statements (Continued)
First Trust Exchange-Traded FundDecember 31, 2024 The Funds are subject to fair value accounting standards that define fair value, establish the framework for measuring fair value and provide a three-level hierarchy for fair valuation based upon the inputs to the valuation as of the measurement date. The three levels of the fair value hierarchy are as follows:
• Level 1 – Level 1 inputs are quoted prices in active markets for identical investments. An active market is a market in which transactions for the investment occur with sufficient frequency and volume to provide pricing information on an ongoing basis.
• Level 2 – Level 2 inputs are observable inputs, either directly or indirectly, and include the following:
o Quoted prices for similar investments in active markets.
o Quoted prices for identical or similar investments in markets that are non-active. A non-active market is a market where there are few transactions for the investment, the prices are not current, or price quotations vary substantially either over time or among market makers, or in which little information is released publicly.
o Inputs other than quoted prices that are observable for the investment (for example, interest rates and yield curves observable at commonly quoted intervals, volatilities, prepayment speeds, loss severities, credit risks, and default rates).
o Inputs that are derived principally from or corroborated by observable market data by correlation or other means.
• Level 3 – Level 3 inputs are unobservable inputs. Unobservable inputs may reflect the reporting entity’s own assumptions about the assumptions that market participants would use in pricing the investment.
The inputs or methodologies used for valuing investments are not necessarily an indication of the risk associated with investing in those investments. A summary of the inputs used to value each Fund’s investments as of December 31, 2024, is included with each Fund’s Portfolio of Investments.
B. Securities Transactions and Investment Income
Securities transactions are recorded as of the trade date. Realized gains and losses from securities transactions are recorded on the identified cost basis. Dividend income is recorded on the ex-dividend date except that certain dividends from foreign securities are recorded as soon as the information becomes available after the ex-dividend date. Interest income, if any, is recorded on the accrual basis.
Withholding taxes and tax reclaims on foreign dividends have been provided for in accordance with each Fund’s understanding of the applicable country’s tax rules and rates.
The books and records of the Funds are maintained in U.S. dollars. Foreign currencies, investments and other assets and liabilities are translated into U.S. dollars at the exchange rates prevailing at the end of the period. Purchases and sales of investments and items of income and expense are translated on the respective dates of such transactions. Unrealized gains and losses on assets and liabilities, other than investments in securities, which result from changes in foreign currency exchange rates have been included in “Net change in unrealized appreciation (depreciation) on foreign currency translation” on the Statements of Operations. Unrealized gains and losses on investments in securities which result from changes in foreign exchange rates are included with fluctuations arising from changes in market price and are shown in “Net change in unrealized appreciation (depreciation) on investments” on the Statements of Operations. Net realized foreign currency gains and losses include the effect of changes in exchange rates between trade date and settlement date on investment security transactions, foreign currency transactions and interest and dividends received and are included in “Net realized gain (loss) on foreign currency transactions” on the Statements of Operations. The portion of foreign currency gains and losses related to fluctuations in exchange rates between the initial purchase settlement date and subsequent sale trade date is included in “Net realized gain (loss) on investments” on the Statements of Operations.
D. Dividends and Distributions to Shareholders
Dividends from net investment income of each Fund, if any, are declared and paid semi-annually, or as the Board of Trustees may determine from time to time. Distributions of net realized capital gains earned by each Fund, if any, are distributed at least annually. Each Fund may also designate a portion of the amount paid to redeeming shareholders as a distribution for tax purposes.
Distributions from net investment income and realized capital gains are determined in accordance with federal income tax regulations, which may differ from U.S. GAAP. Certain capital accounts in the financial statements are periodically adjusted for permanent differences in order to reflect their tax character. These permanent differences are primarily due to the varying treatment of income and gain/loss on portfolio securities held by the Funds and have no impact on net assets or NAV per share. Temporary differences,
Notes to Financial Statements (Continued)
First Trust Exchange-Traded FundDecember 31, 2024 which arise from recognizing certain items of income, expense and gain/loss in different periods for financial statement and tax purposes, will reverse at some time in the future.
The tax character of distributions paid by each Fund during the fiscal year ended December 31, 2024 were as follows:
| Distributions
paid from
Ordinary
Income | Distributions
paid from
Capital
Gains | Distributions
paid from
Return of
Capital |
First Trust WCM Developing World Equity ETF | | | |
First Trust WCM International Equity ETF | | | |
The tax character of distributions paid by each Fund during the fiscal year ended December 31, 2023 were as follows:
| Distributions
paid from
Ordinary
Income | Distributions
paid from
Capital
Gains | Distributions
paid from
Return of
Capital |
First Trust WCM Developing World Equity ETF | | | |
First Trust WCM International Equity ETF | | | |
As of December 31, 2024, the components of distributable earnings on a tax basis for each Fund were as follows:
| Undistributed
Ordinary
Income | Accumulated
Capital and
Other
Gain (Loss) | Net
Unrealized
Appreciation
(Depreciation) |
First Trust WCM Developing World Equity ETF | | | |
First Trust WCM International Equity ETF | | | |
E. Income and Other Taxes
Each Fund intends to qualify as a regulated investment company by complying with the requirements under Subchapter M of the Internal Revenue Code of 1986, as amended, which includes distributing substantially all of its net investment income and net realized gains to shareholders. Accordingly, no provision has been made for federal and state income taxes. However, due to the timing and amount of distributions, each Fund may be subject to an excise tax of 4% of the amount by which approximately 98% of each Fund’s taxable income exceeds the distributions from such taxable income for the calendar year.
Certain countries assess a capital gains tax on securities sold in their local markets. This tax is accrued as the securities in these foreign markets appreciate in value and is paid at the time of sale to the extent a capital gain is realized. Taxes accrued on securities in an unrealized appreciation position are included in “Net change in unrealized appreciation (depreciation) on deferred foreign capital gains tax” on the Statements of Operations. The capital gains tax paid on securities sold, if any, is included in “Net realized gain (loss) on foreign capital gains tax” on the Statements of Operations.
Capital Gains. India’s Finance Act, 2024 (“Finance Act, 2024”) was enacted into law on July 23, 2024, and amongst the other provisions, it increased long-term and short-term capital gain rates on sales of Indian securities, effective that date. As per the amended provisions, the long-term capital gains on the sale of listed shares (sold on a recognized stock exchange and where Securities Transaction Tax (“STT”) is paid) in excess of INR 0.125 million are taxed at the rate of 12.5% (plus applicable surcharge and cess), increased from 10% (plus applicable surcharge and cess), subject to satisfaction of certain conditions. As a grandfathering measure, the cost of acquisition for the purpose of calculation of long-term capital asset acquired before February 1, 2018 shall be deemed to be the higher of the following: (a) the actual cost of acquisition of such asset; and (b) lower of (i) the fair market value of such asset as on January 31, 2018 and (ii) full value of consideration as received on its transfer/disposal of the equity shares. The highest effective tax rate on long-term capital gains earned by a Fund could be 14.95% in the case of a non-corporate entity and 13.65% in the case of a corporate entity.
In the case of the sale of listed shares (sold on a recognized stock exchange and where STT is paid) held by a Fund for one year or less, the income is classified as short-term capital gains and is taxable at 20% (plus applicable surcharge and cess), increased from
Notes to Financial Statements (Continued)
First Trust Exchange-Traded FundDecember 31, 2024 15% (plus applicable surcharge and cess), provided the shares are sold on the stock exchange and subjected to STT. The highest effective tax rate on short-term capital gains earned by a Fund could be 23.92% in the case of a non-corporate entity and 21.84% in the case of a corporate entity.
Short-term capital loss can be set-off against both short-term capital gains and long-term capital gains. However, long-term capital loss can be set-off only against long-term capital gains. The unabsorbed (remaining loss after setting off loss during the year against income of the year) short-term and long-term capital loss can be carried forward for immediately succeeding 8 (eight) assessment years.
Buy back. Finance Act, 2024 has amended the provisions for taxation of buyback of shares and provided that the gains arising on buyback of shares will be considered as deemed dividend in the hands of the shareholder and taxed accordingly. (Prior to enactment of Finance Act, 2024, the shareholders were exempt from tax on any income arising on buyback and distribution tax at the rate of 20% plus applicable surcharge and cess was payable by the Indian Company on buyback of shares). Further, the cost of acquisition in relation to buyback of shares shall be considered as capital loss in the hands of shareholder and the capital loss can be set off against the capital gain income.
Where the sale of shares is outside the stock exchange and not subject to STT, the long-term capital gains continue to be taxed at 10% (plus applicable surcharge and cess) and short-term capital gains are taxed at 30% (plus applicable surcharge and cess).
Dividend income. The dividend income earned by a Fund from Indian Companies shall be chargeable to tax at the rate of 20% (plus applicable surcharge and cess). The highest effective tax rate on dividend income arising to a Fund could be 23.92% in the case of a non-corporate entity and 21.84% in the case of a corporate entity. Note that a Fund will not obtain relief under the US-India tax treaty as the treaty rate of 25% is higher than the domestic rate. Any excess taxes withheld can be offset against capital gains tax liability during the year or claimed as a refund in the annual tax return.
Interest income. Interest Income received from the Indian Investee Company shall be continued to be chargeable to tax at the rate of 20% (plus applicable surcharge and cess).
Other income. Any other income (other than capital gain, dividend, interest) earned by a Fund shall be chargeable to tax at the rate of 35% (earlier taxable at the rate of 40%) (plus applicable surcharge and cess).
Please note that the above description is based on current provisions of Indian law, and any change or modification made by subsequent legislation, regulation, or administrative or judicial decision could increase the Indian tax liability of a Fund and thus reduce the return to a Fund’s shareholders. There can be no assurance that the Indian tax authorities and/or regulators will not take a position contrary to the views expressed herein. If the Indian tax authorities and/or regulators take a position contrary to the views expressed herein, adverse unpredictable consequences may follow.
The Funds are subject to accounting standards that establish a minimum threshold for recognizing, and a system for measuring, the benefits of a tax position taken or expected to be taken in a tax return. The taxable periods April 30, 2021 and 2022, and December 31, 2022, 2023 and 2024 remain open to federal and state audit. As of December 31, 2024, management has evaluated the application of these standards to the Funds and has determined that no provision for income tax is required in the Funds’ financial statements for uncertain tax positions.
Each Fund intends to utilize provisions of the federal income tax laws, which allow it to carry a realized capital loss forward indefinitely following the year of the loss and offset such loss against any future realized capital gains. Each Fund is subject to certain limitations under U.S. tax rules on the use of capital loss carryforwards and net unrealized built-in losses. These limitations apply when there has been a 50% change in ownership. At December 31, 2024, for federal income tax purposes, each applicable Fund had a capital loss carryforward available that is shown in the following table, to the extent provided by regulations, to offset future capital gains. To the extent that these loss carryforwards are used to offset future capital gains, it is probable that the capital gains so offset will not be distributed to each applicable Fund’s shareholders.
| Non-Expiring
Capital Loss
Carryforwards |
First Trust WCM Developing World Equity ETF | |
First Trust WCM International Equity ETF | |
Notes to Financial Statements (Continued)
First Trust Exchange-Traded FundDecember 31, 2024 During the taxable year ended December 31, 2024, the following Fund utilized capital loss carryforwards in the following amount:
| |
First Trust WCM Developing World Equity ETF | |
Certain losses realized during the current fiscal year may be deferred and treated as occurring on the first day of the following fiscal year for federal income tax purposes. For the fiscal year ended December 31, 2024, the following Fund incurred and elected to defer net late year ordinary or capital losses as follows:
| Qualified Late Year Losses |
| | |
First Trust WCM International Equity ETF | | |
| | |
In order to present paid-in capital and accumulated distributable earnings (loss) (which consists of accumulated net investment income (loss), accumulated net realized gain (loss) on investments and net unrealized appreciation (depreciation) on investments) on the Statements of Assets and Liabilities that more closely represent their tax character, certain adjustments have been made to paid-in capital, accumulated net investment income (loss) and accumulated net realized gain (loss) on investments. These adjustments are primarily due to the difference between book and tax treatments of income and gains on various investment securities held by the Funds and in-kind transactions. The results of operations and net assets were not affected by these adjustments. For the fiscal year ended December 31, 2024, the adjustments for each Fund were as follows:
| Accumulated
Net Investment
Income (Loss) | Accumulated
Net Realized
Gain (Loss)
on Investments | |
First Trust WCM Developing World Equity ETF | | | |
First Trust WCM International Equity ETF | | | |
As of December 31, 2024, the aggregate cost, gross unrealized appreciation, gross unrealized depreciation, and net unrealized appreciation/(depreciation) on investments (including short positions and derivatives, if any) for federal income tax purposes were as follows:
| | Gross Unrealized
Appreciation | Gross Unrealized
(Depreciation) | Net Unrealized
Appreciation
(Depreciation) |
First Trust WCM Developing World Equity ETF | | | | |
First Trust WCM International Equity ETF | | | | |
Effective October 7, 2024, expenses, other than the investment advisory fee and other excluded expenses, are paid by the Advisor (see Note 3).
Prior to October 7, 2024, expenses of each Predecessor Fund were allocated on a pro rata basis to each class of shares, except for distribution and service (12b-1) fees and incremental transfer agency costs which are unique to each class of shares.
Each Fund has adopted FASB Accounting Standards Update 2023-07, Segment Reporting (Topic 280) - Improvements to Reportable Segment Disclosures (“ASU 2023-07”). Adoption of the standard impacted financial statement disclosures only and did not affect each Fund’s financial position or the results of its operations. An operating segment is defined in Topic 280 as a component of a public entity that engages in business activities from which it may recognize revenues and incur expenses, has operating results that are regularly reviewed by the public entity’s chief operating decision maker (“CODM”) to make decisions about resources to be allocated to the segment and assess its performance, and has discrete financial information available. The CODM is the President and Chief Executive Officer of each Fund. Each Fund operates as a single operating segment. Each Fund’s income, expenses, assets, changes in
Notes to Financial Statements (Continued)
First Trust Exchange-Traded FundDecember 31, 2024 net assets resulting from operations and performance are regularly monitored and assessed as a whole by the CODM responsible for oversight functions of the Fund, using the information presented in the financial statements and financial highlights.
3. Investment Advisory Fee, Affiliated Transactions and Other Fee Arrangements
Effective October 7, 2024, First Trust serves as the investment advisor to the Funds. Prior to October 7, 2024, WCM served as investment advisor to the Predecessor Funds. First Trust is a limited partnership with one limited partner, Grace Partners of DuPage L.P., and one general partner, The Charger Corporation. The Charger Corporation is an Illinois corporation controlled by James A. Bowen, Chief Executive Officer of First Trust. First Trust is responsible for the selection and ongoing monitoring of the securities in each Fund’s portfolio, managing the Funds’ business affairs and providing certain administrative services necessary for the management of the Funds.
Pursuant to the Investment Management Agreement between the Trust and the Advisor, First Trust manages the investment of each Fund’s assets and is responsible for the expenses of each Fund, including the cost of transfer agency, sub-advisory, custody, fund administration, legal, audit, and other services, but excluding fee payments under the Investment Management Agreement, interest, taxes, acquired fund fees and expenses, if any, brokerage commissions and other expenses connected with the execution of portfolio transactions, distribution and service fees payable pursuant to a Rule 12b-1 plan, if any, and extraordinary expenses, which are paid by each respective Fund. The annual unitary management fee payable by each Fund to First Trust for these services will be reduced at certain levels of each Fund’s net assets (“breakpoints”) and calculated pursuant to the following schedule:
| | |
Fund net assets up to and including $2.5 billion | | |
Fund net assets greater than $2.5 billion up to and including $5 billion | | |
Fund net assets greater than $5 billion up to and including $7.5 billion | | |
Fund net assets greater than $7.5 billion up to and including $10 billion | | |
Fund net assets greater than $10 billion | | |
Prior to October 7, 2024, WCM served as each Predecessor Fund’s investment advisor. Under the terms of the investment advisory agreement with WCM, the Predecessor Funds paid a monthly investment advisory fee to WCM of 0.95% and 0.85% of the Predecessor Funds, respectively, average daily net assets. Effective October 7, 2024, WCM serves as each Fund’s sub-advisor and manages each Fund’s portfolio subject to First Trust’s supervision. Pursuant to the Investment Management Agreement, between the Trust, on behalf of each Fund, and the Advisor, and the Investment Sub-Advisory Agreement among the Trust, on behalf of each Fund, the Advisor and WCM, First Trust will supervise WCM and its management of the investment of each Fund’s assets and will pay WCM for its services as each Fund’s sub-advisor a sub-advisory fee equal to 50% of the monthly management fee paid to the Advisor, less its share of each Fund’s expenses.
Prior to October 7, 2024, WCM agreed to waive fees and/or pay for operating expenses of the Predecessor Funds to limit the total annual fund operating expenses (excluding taxes, leverage interest, brokerage commissions, dividend and interest expenses on short sales, acquired fund fees and expenses as determined in accordance with Form N-1A, professional fees related to services for the collection of foreign tax reclaims, expenses incurred in connection with any merger or reorganization, or extraordinary expenses such as litigation expenses) from exceeding 1.20% and 1.10% of average daily net assets for the Investor Class shares of the Predecessor Funds, respectively, and 0.95% and 0.85% of average daily net assets for the Institutional Class shares of the the Predecessor Funds, respectively. Any fees previously waived cannot be recovered.
Effective October 7, 2024, the Trust has multiple service agreements with The Bank of New York Mellon (“BNY”). Under the service agreements, BNY performs custodial, fund accounting, certain administrative services, and transfer agency services for each Fund. As custodian, BNY is responsible for custody of each Fund’s assets. As fund accountant and administrator, BNY is responsible for maintaining the books and records of each Fund’s securities and cash. As transfer agent, BNY is responsible for maintaining shareholder records for each Fund. BNY is a subsidiary of The Bank of New York Mellon Corporation, a financial holding company.
Prior to October 7, 2024, UMB Fund Services, Inc. (“UMBFS”) served as each Predecessor Fund’s fund accountant, transfer agent and co-administrator; and Mutual Fund Administration, LLC (“MFAC”) served as each Predecessor Fund’s other co-administrator. UMB Bank, n.a., an affiliate of UMBFS, served as each Predecessor Fund’s custodian.
Notes to Financial Statements (Continued)
First Trust Exchange-Traded FundDecember 31, 2024 Prior to October 7, 2024, certain trustees and officers were employees of UMBFS or MFAC. Each Predecessor Fund did not compensate trustees and officers affiliated with each Fund’s co-administrators. Each Predecessor Fund allocated fees incurred to Trustees who were not affiliated with each Fund’s co-administrators.
Effective October 7, 2024, each Trustee who is not an officer or employee of First Trust, any sub-advisor or any of their affiliates (“Independent Trustees”) is paid a fixed annual retainer that is allocated equally among each fund in the First Trust Fund Complex. Each Independent Trustee is also paid an annual per fund fee that varies based on whether the fund is a closed-end or other actively managed fund, a target outcome fund or an index fund.
Additionally, the Chairs of the Audit Committee, Nominating and Governance Committee and Valuation Committee, the Vice Chair of the Audit Committee, the Lead Independent Trustee and the Vice Lead Independent Trustee are paid annual fees to serve in such capacities, with such compensation allocated pro rata among each fund in the First Trust Fund Complex based on net assets. Independent Trustees are reimbursed for travel and out-of-pocket expenses in connection with all meetings. The Committee Chairs, the Audit Committee Vice Chair, the Lead Independent Trustee and the Vice Lead Independent Trustee rotate periodically in serving in such capacities. The officers and “Interested” Trustee receive no compensation from the Trust for acting in such capacities.
On April 29, 2024, the Board of Trustees of the Predecessor Funds approved reorganizations into the Acquiring Funds, each an actively managed exchange-traded fund managed by First Trust and sub-advised by WCM. Effective October 7, 2024, each Fund acquired all of the assets and assumed all of the liabilities of its respective Predecessor Fund pursuant to an agreement and plan of reorganization approved by the Board of Trustees of the Fund on June 3, 2024. Prior to the reorganization, each Predecessor Fund converted all Investor Class Shares into Institutional Class Shares. This was a tax-free exchange. The Investor Class Shares were terminated. The Predecessor Funds are the accounting survivors. As a result, the historical information received from each of the Predecessor Funds was carried forward to the applicable Fund for U.S. GAAP and tax purposes.
Under the terms of reorganizations, which were tax-free, the assets of each Predecessor Fund were transferred to, and the liabilities of each Predecessor Fund were assumed by, the respective Acquiring Fund. The shareholders of each Predecessor Fund received shares of the respective Acquiring Fund with a value equal to the aggregate net asset value of the shares of the Predecessor Fund held by them.
5. Purchases and Sales of Securities
For the fiscal year ended December 31, 2024, the cost of purchases and proceeds from sales of investments for each Fund, excluding short-term investments and in-kind transactions, were as follows:
| | |
First Trust WCM Developing World Equity ETF | | |
First Trust WCM International Equity ETF | | |
For the fiscal year ended December 31, 2024, the cost of in-kind purchases and proceeds from in-kind sales for each Fund were as follows:
| | |
First Trust WCM Developing World Equity ETF | | |
First Trust WCM International Equity ETF | | |
6. Creations, Redemptions and Transaction Fees
Each Fund generally issues and redeems its shares in primary market transactions through a creation and redemption mechanism and does not sell or redeem individual shares. Instead, financial entities known as “Authorized Participants” have contractual arrangements with a Fund or one of the Fund’s service providers to purchase and redeem Fund shares directly with the Fund in Creation Units. Prior to the start of trading on every business day, a Fund publishes through the National Securities Clearing Corporation the “basket” of securities, cash or other assets that it will accept in exchange for a Creation Unit of the Fund’s shares. An Authorized Participant that wishes to effectuate a creation of a Fund’s shares deposits with the Fund the “basket” of securities, cash or other assets identified by the Fund that day, and then receives the Creation Unit of the Fund’s shares in return for those assets. After purchasing a Creation Unit, the Authorized Participant may continue to hold the Fund’s shares or sell them in the secondary market. The redemption process is the reverse of the purchase process: the Authorized Participant redeems a Creation Unit of a Fund’s shares for a basket of securities, cash
Notes to Financial Statements (Continued)
First Trust Exchange-Traded FundDecember 31, 2024 or other assets. The combination of the creation and redemption process with secondary market trading in a Fund’s shares and underlying securities provides arbitrage opportunities that are designed to help keep the market price of a Fund’s shares at or close to the NAV per share of the Fund.
Each Fund imposes fees in connection with the purchase of Creation Units. These fees may vary based upon various fact-based circumstances, including, but not limited to, the composition of the securities included in the Creation Unit or the countries in which the transactions are settled. The price for each Creation Unit will equal the daily NAV per share of a Fund times the number of shares in a Creation Unit, plus the fees described above and, if applicable, any operational processing and brokerage costs, transfer fees, stamp taxes and part or all of the spread between the expected bid and offer side of the market related to the securities comprising the creation basket.
Each Fund also imposes fees in connection with the redemption of Creation Units. These fees may vary based upon various fact-based circumstances, including, but not limited to, the composition of the securities included in the Creation Unit or the countries in which the transactions are settled. The price received for each Creation Unit will equal the daily NAV per share of a Fund times the number of shares in a Creation Unit, minus the fees described above and, if applicable, any operational processing and brokerage costs, transfer fees, stamp taxes and part or all of the spread between the expected bid and offer side of the market related to the securities comprising the redemption basket. Investors who use the services of a broker or other such intermediary in addition to an Authorized Participant to effect a redemption of a Creation Unit may also be assessed an amount to cover the cost of such services. The redemption fee charged by a Fund will comply with Rule 22c-2 of the 1940 Act which limits redemption fees to no more than 2% of the value of the shares redeemed.
Effective October 7, 2024, the Board of Trustees adopted a Distribution and Service Plan pursuant to Rule 12b-1 under the 1940 Act. In accordance with the Rule 12b-1 plan, the Funds are authorized to pay an amount up to 0.25% of their average daily net assets each year to reimburse First Trust Portfolios L.P. (“FTP”), the distributor of the Funds, for amounts expended to finance activities primarily intended to result in the sale of Creation Units or the provision of investor services. FTP may also use this amount to compensate securities dealers or other persons that are Authorized Participants for providing distribution assistance, including broker-dealer and shareholder support and educational and promotional services.
Prior to October 7, 2024, Natixis Distribution, LLC, an affiliate of WCM Investment Management, served as each Predecessor Fund’s distributor (the “Distributor”). Each Predecessor Fund had a Distribution Plan (the “Plan”) pursuant to Rule 12b-1 under the 1940 Act, which allowed each Predecessor Fund to pay distribution fees for the sale and distribution of its Investor Class shares. The Plan provided for the payment of distribution fees at the annual rate of up to 0.25% of each Predecessor Fund’s average daily net assets attributable to Investor Class shares, payable to the Distributor. The Institutional Class shares did not pay any distribution fees.
No 12b-1 fees are currently paid by the Funds, and pursuant to a contractual arrangement, no 12b-1 fees will be paid any time before October 2, 2026. Prior to their conversion to Institutional Class Shares, the Investor Class Shares of each Acquired Fund paid 12b-1 fees.
The Trust, on behalf of the Funds, has a variety of indemnification obligations under contracts with its service providers. The Trust’s maximum exposure under these arrangements is unknown. However, the Trust has not had prior claims or losses pursuant to these contracts and expects the risk of loss to be remote.
Management has evaluated the impact of all subsequent events on the Funds through the date the financial statements were issued and has determined that there were no subsequent events requiring recognition or disclosure in the financial statements that have not already been disclosed.
Report of Independent Registered Public Accounting Firm
To the Shareholders and the Board of Trustees of First Trust Exchange-Traded Fund:
Opinion on the Financial Statements and Financial Highlights
We have audited the accompanying statements of assets and liabilities of First Trust WCM Developing World Equity ETF and First Trust WCM International Equity ETF (the “Funds”), each a series of the First Trust Exchange-Traded Fund, including the portfolios of investments, as of December 31, 2024, the related statements of operations, statements of changes in net assets, and financial highlights for the year then ended, and the related notes. In our opinion, the financial statements and financial highlights present fairly, in all material respects, the financial position of the Funds as of December 31, 2024, and the results of their operations, changes in their net assets, and financial highlights for the year then ended, in conformity with accounting principles generally accepted in the United States of America. The statement of changes in net assets for the year ended December 31, 2023, and the financial highlights for the year ended December 31, 2023, for the eight months period ended December 31, 2022, and for each of the two years in the period ended April 30, 2022, and the period March 31, 2020 (commencement of investment operations) through April 30, 2020, were audited by other auditors whose report dated February 29, 2024, expressed an unqualified opinion on such statement of changes in net assets and financial highlights.
These financial statements and financial highlights are the responsibility of the Funds’ management. Our responsibility is to express an opinion on the Funds’ financial statements and financial highlights based on our audits. We are a public accounting firm registered with the Public Company Accounting Oversight Board (United States) (PCAOB) and are required to be independent with respect to the Funds in accordance with the U.S. federal securities laws and the applicable rules and regulations of the Securities and Exchange Commission and the PCAOB.
We conducted our audits in accordance with the standards of the PCAOB. Those standards require that we plan and perform the audit to obtain reasonable assurance about whether the financial statements and financial highlights are free of material misstatement, whether due to error or fraud. The Funds are not required to have, nor were we engaged to perform, an audit of their internal control over financial reporting. As part of our audits, we are required to obtain an understanding of internal control over financial reporting but not for the purpose of expressing an opinion on the effectiveness of the Funds’ internal control over financial reporting. Accordingly, we express no such opinion.
Our audits included performing procedures to assess the risks of material misstatement of the financial statements and financial highlights, whether due to error or fraud, and performing procedures that respond to those risks. Such procedures included examining, on a test basis, evidence regarding the amounts and disclosures in the financial statements and financial highlights. Our audits also included evaluating the accounting principles used and significant estimates made by management, as well as evaluating the overall presentation of the financial statements and financial highlights. Our procedures included confirmation of securities owned as of December 31, 2024, by correspondence with the custodian and brokers; when replies were not received from brokers, we performed other auditing procedures. We believe that our audits provide a reasonable basis for our opinion.
/s/ Deloitte & Touche, LLP
Chicago, Illinois
February 25, 2025
We have served as the auditor of one or more First Trust investment companies since 2001.
First Trust Exchange-Traded FundDecember 31, 2024 (Unaudited)
Changes in and Disagreements with Accountants (Item 8 of Form N-CSR)
There were no changes in or disagreements with the Funds’ accountants from the Funds’ reorganization on October 7, 2024 through December 31, 2024.
Proxy Disclosures (Item 9 of Form N-CSR)
There were no matters submitted for vote by shareholders of any Fund from the Funds’ reorganization on October 7, 2024 through December 31, 2024.
Remuneration Paid to Directors, Officers, and Others (Item 10 of Form N-CSR)
Independent Trustees and any member of any advisory board of each Fund are compensated through the unitary management fee paid by each Fund to the advisor and not directly by each Fund. The investment advisory fee paid is included in the Statements of Operations.
Statement Regarding the Basis for the Board’s Approval of Investment Advisory Contract (Item 11 of Form N-CSR)
The Board of Trustees of First Trust Exchange-Traded Fund (the “Trust”), including the Independent Trustees, approved the Investment Management Agreement (the “Advisory Agreement”) with First Trust Advisors L.P. (the “Advisor”) and the Investment Sub-Advisory Agreement (the “Sub-Advisory Agreement” and together with the Advisory Agreement, the “Agreements”) among the Trust, the Advisor and WCM Investment Management, LLC (the “Sub-Advisor”) on behalf of the following series of the Trust (each a “Fund” and collectively, the “Funds”):
First Trust WCM Developing World Equity ETF (WCME)
First Trust WCM International Equity ETF (WCMI)
The Board approved the Agreements for each Fund for an initial two-year term at a meeting held on March 11, 2024. The Board determined for each Fund that the Agreements are in the best interests of the Fund in light of the nature, extent and quality of the services expected to be provided and such other matters as the Board considered to be relevant in the exercise of its business judgment.
To reach this determination for each Fund, the Board considered its duties under the Investment Company Act of 1940, as amended (the “1940 Act”), as well as under the general principles of state law, in reviewing and approving advisory contracts; the requirements of the 1940 Act in such matters; the fiduciary duty of investment advisors with respect to advisory agreements and compensation; the standards used by courts in determining whether investment company boards have fulfilled their duties; and the factors to be considered by the Board in voting on such agreements. To assist the Board in its evaluation of the Agreements for each Fund, the Independent Trustees received a separate report from each of the Advisor and the Sub-Advisor in advance of the Board meeting responding to requests for information from counsel to the Independent Trustees, submitted on behalf of the Independent Trustees, that, among other things, outlined: the services to be provided by the Advisor and the Sub-Advisor to each Fund (including the relevant personnel responsible for these services and their experience); the proposed unitary fee rate schedule payable by each Fund as compared to fees charged to a peer group of funds (the “Expense Group”) and a broad peer universe of funds (the “Expense Universe”), each assembled by Broadridge Financial Solutions, Inc. (“Broadridge”), an independent source, and as compared to fees charged to other exchange-traded funds (“ETFs”) managed by the Advisor; the proposed sub-advisory fee as compared to fees charged to other clients of the Sub-Advisor; the estimated expense ratio of each Fund as compared to expense ratios of the funds in the Fund’s Expense Group and Expense Universe; the nature of expenses to be incurred in providing services to each Fund and the potential for the Advisor and the Sub-Advisor to realize economies of scale, if any; profitability and other financial data for the Advisor; financial data for the Sub-Advisor; any indirect benefits to the Advisor and its affiliate, First Trust Portfolios L.P. (“FTP”), and the Sub-Advisor; and information on the Advisor’s and the Sub-Advisor’s compliance programs. The Independent Trustees and their counsel also met separately to discuss the information provided by the Advisor and the Sub-Advisor. The Board applied its business judgment to determine whether the arrangements between the Trust and the Advisor and among the Trust, the Advisor and the Sub-Advisor are reasonable business arrangements from each Fund’s perspective.
In evaluating whether to approve the Agreements for each Fund, the Board considered the nature, extent and quality of the services to be provided by the Advisor and the Sub-Advisor under the Agreements. With respect to the Advisory Agreement, the Board considered that the Advisor will be responsible for the overall management and administration of each Fund and reviewed all of the services to be provided by the Advisor to the Funds, including the oversight of the Sub-Advisor, as well as the background and
Other Information (Continued)
First Trust Exchange-Traded FundDecember 31, 2024 (Unaudited) experience of the persons responsible for such services. The Board considered that each Fund will be an actively-managed ETF and will employ an advisor/sub-advisor management structure and considered that the Advisor manages other ETFs with a similar structure in the First Trust Fund Complex. The Board noted that the Advisor will oversee the Sub-Advisor’s day-to-day management of each Fund’s investments, including portfolio risk monitoring and performance review. In reviewing the services to be provided, the Board noted the compliance program that had been developed by the Advisor and considered that it includes a robust program for monitoring the Advisor’s, the Sub-Advisor’s and each Fund’s compliance with the 1940 Act, as well as each Fund’s compliance with its investment objective, policies and restrictions. The Board noted that employees of the Advisor provide management services to other ETFs and to other funds in the First Trust Fund Complex with diligence and care. With respect to the Sub-Advisory Agreement, in addition to the written materials provided by the Sub-Advisor, at the March 11, 2024 meeting, the Board also received a presentation from representatives of the Sub-Advisor, who discussed the services that the Sub-Advisor will provide to the Funds, and the Trustees were able to ask questions about the proposed investment strategies for the Funds. The Board considered that the Funds were being proposed in connection with reorganization transactions, pursuant to which each Fund would acquire the assets of an existing mutual fund advised by the Sub-Advisor with the same investment objective, strategies and policies and portfolio management team as proposed for the Fund (each a “Predecessor Fund” and collectively, the “Predecessor Funds”). The Board noted the background and experience of the Sub-Advisor’s portfolio management team and the Sub-Advisor’s investment style. The Board considered the historical investment performance of the Predecessor Funds, noting that each Fund would adopt the performance of its respective Predecessor Fund as a result of the reorganization transactions. In light of the information presented and the considerations made, the Board concluded that the nature, extent and quality of the services to be provided to each Fund by the Advisor and the Sub-Advisor under the Agreements are expected to be satisfactory.
The Board considered the proposed unitary fee rate schedule payable by each Fund under the Advisory Agreement for the services to be provided. The Board noted that, under the unitary fee arrangements, WCME and WCMI would pay the Advisor a unitary fee starting at an annual rate of 0.95% and 0.85%, respectively, of its respective average daily net assets, subject to a breakpoint schedule pursuant to which the unitary fee rate would be reduced as assets of the Fund meet certain thresholds. The Board considered that, from the unitary fee for each Fund, the Advisor would pay the Sub-Advisor a sub-advisory fee equal to 50% of the Fund’s unitary fee less one-half of the Fund’s expenses and that the sub-advisory fee would be reduced consistent with the breakpoints in the unitary fee rate schedule. The Board noted that the Advisor and the Sub-Advisor would be responsible for each Fund’s expenses, including the cost of sub-advisory, transfer agency, custody, fund administration, legal, audit and other services and license fees, if any, but excluding the fee payment under the Advisory Agreement and interest, taxes, acquired fund fees and expenses, if any, brokerage commissions and other expenses connected with the execution of portfolio transactions, distribution and service fees pursuant to a Rule 12b-1 plan, if any, and extraordinary expenses, if any. The Board received and reviewed information showing the fee rates and expense ratios of the peer funds in the Expense Group, as well as advisory and unitary fee rates charged by the Advisor and the Sub-Advisor to other fund (including ETF) and non-fund clients, as applicable. Because each Fund will pay a unitary fee, the Board determined that expense ratios were the most relevant comparative data point. Based on the information provided, the Board noted that the total (net) expense ratio for each Fund was above the median total (net) expense ratio of the peer funds in its Expense Group. With respect to the Expense Groups, the Board discussed with representatives of the Advisor how the Expense Groups were assembled and how each Fund compared and differed from the peer funds. The Board took this information into account in considering the peer data. With respect to fees charged to other clients, the Board considered the Advisor’s statements that each Fund will be unique to the ETF market and the First Trust Fund Complex, but WCME will be most similar to another actively-managed ETF in the First Trust Fund Complex that has a unitary fee rate schedule starting at an annual rate of 0.95% of its average daily net assets and WCMI will be most similar to two other actively-managed ETFs in the First Trust Fund Complex that have unitary fee rate schedules starting at annual rates that range from 0.83% to 0.85% of their respective average daily net assets. In light of the information considered and the nature, extent and quality of the services expected to be provided to each Fund under the Agreements, the Board determined that, for each Fund, the proposed unitary fee, including the sub-advisory fee to be paid by the Advisor to the Sub-Advisor from the unitary fee, was fair and reasonable.
The Board considered whether there are any potential economies of scale to be achieved in connection with the Advisor providing investment advisory services to the Funds and whether the Funds may benefit from any economies of scale. The Board noted that the proposed unitary fee rate schedule for each Fund includes breakpoints pursuant to which the unitary fee rate would be reduced as assets of the Fund meet certain thresholds. The Board considered that the Advisor has continued to build infrastructure and add new staff to improve the services to the funds in the First Trust Fund Complex. The Board also noted that under the unitary fee structure, any reduction in expenses associated with the management and operations of the Funds generally would benefit the Advisor and the Sub-Advisor, but that the unitary fee structure provides a level of certainty in expenses for shareholders of the Funds. The Board concluded that the proposed unitary fee rate schedule for each Fund reflects an appropriate level of sharing of any economies of scale
Other Information (Continued)
First Trust Exchange-Traded FundDecember 31, 2024 (Unaudited) that may be realized in the management of the Fund at reasonably foreseeable future asset levels. The Board considered that the Sub-Advisor would be paid by the Advisor from each Fund’s unitary fee, that the sub-advisory fee for each Fund would be reduced consistent with the breakpoints in the Fund’s unitary fee rate schedule and its understanding that the sub-advisory fee for each Fund was the product of an arm’s length negotiation. The Board took into consideration the types of costs to be borne by the Advisor in connection with its services to be performed for each Fund under the Advisory Agreement. The Board considered the Advisor’s estimate of the asset level for each Fund at which the Advisor expects the Advisory Agreement for the Fund to be profitable to the Advisor, noting that the assets to be acquired by WCMI from its Predecessor Fund currently exceed that level, and the Advisor’s estimate of the profitability of the Advisory Agreement for each Fund if its assets reach $100 million. The Board noted the inherent limitations in the profitability analysis and concluded that, based on the information provided, the Advisor’s estimated profitability level for each Fund was not unreasonable. The Board reviewed financial information provided by the Sub-Advisor, but did not review any potential profitability of the Sub-Advisory Agreement for each Fund to the Sub-Advisor. The Board concluded that the profitability analysis for the Advisor was more relevant. In addition, the Board considered indirect benefits described by the Advisor that may be realized from its relationship with the Funds. The Board considered that the Advisor had identified as an indirect benefit to the Advisor and FTP their exposure to investors and brokers who, absent their exposure to the Funds, may have had no dealings with the Advisor or FTP. The Board considered indirect benefits that may be realized by the Sub-Advisor from its relationship with the Funds, including soft-dollar arrangements, and considered a summary of such arrangements. The Board concluded that the character and amount of potential indirect benefits to the Advisor and the Sub-Advisor were not unreasonable.
Based on all of the information considered and the conclusions reached, the Board, including the Independent Trustees, determined that the terms of the Agreements are fair and reasonable and that the approval of the Agreements is in the best interests of each Fund. No single factor was determinative in the Board’s analysis.
For the taxable period ended December 31, 2024, the following percentages of income dividends paid by the Funds qualify for the dividends received deduction available to corporations:
| Dividends Received
Deduction |
First Trust WCM Developing World Equity ETF | |
First Trust WCM International Equity ETF | |
For the taxable period ended December 31, 2024, the following percentages of income dividends paid by the Funds are hereby designated as qualified dividend income:
| |
First Trust WCM Developing World Equity ETF | |
First Trust WCM International Equity ETF | |
Long-term capital gain distributions designated by the Funds are taxable at the applicable capital gain tax rates for federal income tax purposes. For the fiscal period ended December 31, 2024, the below Fund designated long-term capital gain distributions in the following amount:
| Long-Term Capital
Gain Distribution |
First Trust WCM International Equity ETF | |
Other Information (Continued)
First Trust Exchange-Traded FundDecember 31, 2024 (Unaudited) The following Funds meet the requirements of Section 853 of the Internal Revenue Code of 1986, as amended, and elect to pass through to their shareholders credit for foreign taxes paid. For the taxable period ended December 31, 2024, the total amounts of income received by the Funds from sources within foreign countries and possessions of the United States and of taxes paid to such countries are as follows:
| | |
| | | | |
First Trust WCM Developing World Equity ETF | | | | |
First Trust WCM International Equity ETF | | | | |
(b) The Financial Highlights is included in the Financial Statements and Other Information filed under Item 7(a) of this Form N-CSR.
Item 8. Changes in and Disagreements with Accountants for Open-End Management Investment Companies.
Not applicable to the Registrant.
Item 9. Proxy Disclosures for Open-End Management Investment Companies.
Not applicable to the Registrant.
Item 10. Remuneration Paid to Directors, Officers, and Others of Open-End Management Investment Companies
This information is included in the Financial Statements and Other Information filed under Item 7(a) of this Form N-CSR.
Item 11. Statement Regarding Basis for Approval of Investment Advisory Contract.
This statement is included in the Financial Statements and Other Information filed under Item 7(a) of this Form N-CSR.
Item 12. Disclosure of Proxy Voting Policies and Procedures for Closed-End Management Investment Companies.
Not applicable to the Registrant.
Item 13. Portfolio Managers of Closed-End Management Investment Companies.
Not applicable to the Registrant.
Item 14. Purchases of Equity Securities by Closed-End Management Investment Company and Affiliated Purchasers.
Not applicable to the Registrant.
Item 15. Submission of Matters to a Vote of Security Holders.
There have been no material changes to the procedures by which the shareholders may recommend nominees to the Registrant’s board of directors, where those changes were implemented after the Registrant last provided disclosure in response to the requirements of Item 407(c)(2)(iv) of Regulation S-K (17 CFR 229.407) (as required by Item 22(b)(15) of Schedule 14A (17 CFR 240.14a-101)), or this Item.
Item 16. Controls and Procedures.
| (a) | The Registrant’s principal executive and principal financial officers, or persons performing similar functions, have concluded that the Registrant’s disclosure controls and procedures (as defined in Rule 30a-3(c) under the Investment Company Act of 1940, as amended (the “1940 Act”) (17 CFR 270.30a-3(c))) are effective, as of a date within 90 days of the filing date of the report that includes the disclosure required by this paragraph, based on their evaluation of these controls and procedures required by Rule 30a-3(b) under the 1940 Act (17 CFR 270.30a-3(b)) and Rules 13a-15(b) or 15d-15(b) under the Securities Exchange Act of 1934, as amended (17 CFR 240.13a-15(b) or 240.15d-15(b)). |
| (b) | There were no changes in the Registrant’s internal control over financial reporting (as defined in Rule 30a-3(d) under the 1940 Act (17 CFR 270.30a-3(d)) that occurred during the period covered by this report that has materially affected, or is reasonably likely to materially affect, the Registrant’s internal control over financial reporting. |
Item 17. Disclosure of Securities Lending Activities for Closed-End Management Investment Companies.
| (a) | Not applicable to the Registrant. |
| (b) | Not applicable to the Registrant. |
Item 18. Recovery of Erroneously Awarded Compensation.
| (a) | Not applicable to the Registrant. |
| (b) | Not applicable to the Registrant. |
Item 19. Exhibits.
| (a)(2) | Not applicable to the Registrant. |
| (a)(4) | Not applicable to the Registrant. |
| (a)(5) | Not applicable to the Registrant. |
SIGNATURES
Pursuant to the requirements of the Securities Exchange Act of 1934 and the Investment Company Act of 1940, the registrant has duly caused this report to be signed on its behalf by the undersigned, thereunto duly authorized.
| (registrant) | | First Trust Exchange-Traded Fund |
| By (Signature and Title)* | | /s/ James M. Dykas |
| | | James M. Dykas, President and Chief Executive Officer
(principal executive officer) |
Pursuant to the requirements of the Securities Exchange Act of 1934 and the Investment Company Act of 1940, this report has been signed below by the following persons on behalf of the registrant and in the capacities and on the dates indicated.
| By (Signature and Title)* | | /s/ James M. Dykas |
| | | James M. Dykas, President and Chief Executive Officer
(principal executive officer) |
| By (Signature and Title)* | | /s/ Derek D. Maltbie |
| | | Derek D. Maltbie, Treasurer, Chief Financial Officer
and Chief Accounting Officer
(principal financial officer) |
* Print the name and title of each signing officer under his or her signature.