UNITED STATES
SECURITIES AND EXCHANGE COMMISSION
Washington, DC 20549
FORM 10-K
(Mark One)
| x | ANNUAL REPORT PURSUANT TO SECTION 13 OR 15(d) OF THE SECURITIES EXCHANGE ACT OF 1934 |
For the fiscal year ended December 31, 2006
OR
| ¨ | TRANSITION REPORT PURSUANT TO SECTION 13 OR 15(d) OF THE SECURITIES EXCHANGE ACT OF 1934 |
Commission file number: 000-51406
FEDERAL HOME LOAN BANK OF SEATTLE
(Exact Name of Registrant as Specified in Its Charter)
| | |
| Federally chartered corporation | | 91-0852005 |
| (State or Other Jurisdiction of Incorporation or Organization) | | (I.R.S. Employer Identification No.) |
| |
| 1501 Fourth Avenue, Suite 1800, Seattle, WA | | 98101-1693 |
| (Address of Principal Executive Offices) | | (Zip Code) |
Registrant’s telephone number, including area code: (206) 340-2300
Securities registered pursuant to Section 12(b) of the Act: None
Title of Each Class: None
| | |
Securities registered pursuant to Section 12(g) of the Act: | | Name of Each Exchange on Which Registered: |
Class B Common Stock, $100 par value per share (Title of class) | | N/A |
Indicate by check mark if the registrant is a well-known seasoned issuer, as defined in Rule 405 of the Securities Act. Yes ¨ No x
Indicate by check mark if the registrant is not required to file reports pursuant to Section 13 or Section 15(d) of the Act. Yes ¨ No x
Indicate by check mark whether the registrant (1) has filed all reports required to be filed by Section 13 or 15(d) of the Securities Exchange Act of 1934 during the preceding 12 months (or for such shorter period that the registrant was required to file such reports), and (2) has been subject to such filing requirements for the past 90 days. Yes x No ¨
Indicate by check mark if disclosure of delinquent filers pursuant to Item 405 of Regulation S-K is not contained herein, and will not be contained, to the best of registrant’s knowledge, in definitive proxy or information statements incorporated by reference in Part III of this Form 10-K or any amendment to this Form 10-K. x
Indicate by check mark whether the registrant is a large accelerated filer, an accelerated filer, or a non-accelerated filer. See definition of “accelerated filer and large accelerated filer” in Rule 12b-2 of the Exchange Act. (Check one):
Large Accelerated Filer ¨ Accelerated Filer ¨ Non-accelerated Filer x
Indicate by Check mark whether the registrant is a shell company (as defined in Rule 12b-2 of the Exchange Act.) Yes ¨ No x
Registrant’s stock is not publicly traded and is only issued to members of the registrant. Such stock is issued and redeemed at par value, $100 per share, subject to certain regulatory and statutory limits. As of June 30, 2006, the aggregate par value of the shares of capital stock of the registrant was $2,210,219,000. As of February 28, 2007, Seattle Bank had outstanding 3,650 shares of its Class A stock and 22,105,793 shares of its Class B stock.
FEDERAL HOME LOAN BANK OF SEATTLE
Form 10-K for the Fiscal Year Ended December 31, 2006
i
Forward-looking Statements
This report contains forward-looking statements that are subject to risk and uncertainty. These statements describe the expectations of the Federal Home Loan Bank of Seattle, or the Seattle Bank, regarding future events and developments, including future operating results, growth in assets, and continued success of our products. These statements include, without limitation, statements as to future expectations, beliefs, plans, strategies, objectives, events, conditions, and financial performance. The words “will,” “believe,” “expect,” “intend,” “may,” “could,” “should,” “anticipate,” and words of similar nature are intended in part to help identify forward-looking statements.
Future results, events, and developments are difficult to predict, and the expectations described in this report, including any forward-looking statements, are subject to risk and uncertainty that may cause actual results to differ materially from those we currently anticipate. Consequently, there is no assurance that the expected events and developments will occur. See “Part I. Item 1A. Risk Factors,” for additional information on risks and uncertainties.
Factors that may cause actual results, events, and developments to differ materially from those discussed in this report include, among others, the following:
| | • | | a significant change in interest rates; |
| | • | | withdrawal of one or more large members or consolidation among our members; |
| | • | | competition from other alternative sources of funding available to our members, including other Federal Home Loan Banks, or FHLBanks; |
| | • | | adverse changes in the market prices of our financial instruments, or our failure to effectively hedge these instruments; |
| | • | | changes in investor demand for consolidated obligations or changes in our ability to participate in the issuance of consolidated obligations; |
| | • | | effects of the recent amendments to our capital plan, as amended, which we refer to as our Capital Plan, including amendments regarding the creation of an excess stock pool and authorization of Class A stock to support new advances; |
| | • | | our members’ willingness to do business with us despite limitations on our payment of dividends and continuing restrictions on repurchases of excess Class B stock; |
| | • | | failure to satisfy hedge accounting criteria under the accounting principles generally accepted in the United States, or U.S. GAAP, in hedging our interest-rate risk; |
| | • | | legislative or regulatory changes or actions initiated by the Federal Housing Finance Board, or the Finance Board, or other body, that could cause us to modify our current structure, policies, or business operations; |
| | • | | changes in accounting rules or in the interpretation of existing accounting rules; |
| | • | | negative changes in our credit agency ratings or ratings applicable to the FHLBanks, the Finance Board, and the Office of Finance, or collectively the FHLBank System; |
| | • | | the need to make principal or interest payments on behalf of another FHLBank as a result of the joint and several liability of all FHLBanks for consolidated obligations; |
| | • | | adverse changes in local and national economic conditions; and |
| | • | | events such as terrorism, natural disasters, or other catastrophic events that could disrupt the financial markets where we obtain funding, our borrowers’ ability to repay advances, or the value of the collateral that we hold. |
1
These cautionary statements apply to all related forward-looking statements, wherever they appear in this report. We do not undertake to update any forward-looking statements that we make in this report or that we may make from time to time.
PART I.
ITEM 1. BUSINESS
Overview
The Seattle Bank, a federally chartered corporation organized in 1964, is a member-owned cooperative. Our mission is to provide liquidity, funding, and services to enhance our members’ success and the availability of affordable homes and economic development in their communities. Our core business is traditional member finance, which includes making advances, providing letters of credit, accepting deposits, and providing securities safekeeping and other services. Historically, we offered products and services through two operating segments, traditional member finance and the Mortgage Purchase Program, or MPP. The MPP segment included mortgage loans held for portfolio as a result of purchases from participating members. During the first quarter of 2005, we decided to exit the MPP.
We conduct most of our business with or through our members, and we do not conduct our business directly with the general public. For the year ended December 31, 2006, we reported net income of $25.8 million, and as of December 31, 2006, we had total assets of $53.5 billion, total deposits of $1.0 billion, and retained earnings of $92.4 million.
We also work with our members and a variety of other entities, including non-profit organizations, to provide affordable housing and community economic development funds through direct subsidy grants and low- or no-interest loans, for individuals and communities in need. We fund these grants and loans through the Affordable Housing Program, or AHP, and a number of other community investment programs.
The Seattle Bank is one of 12 FHLBanks that, along with the Finance Board and the Office of Finance, comprise the FHLBank System. The FHLBank System was created by Congress under the authority of the Federal Home Loan Bank Act of 1932, as amended, or the FHLBank Act, to ensure the availability of housing funds to expand home ownership throughout the nation. The 12 FHLBanks are government-sponsored enterprises, or GSEs, of the United States of America. Each FHLBank is a separate entity with its own board of directors, management, and employees. The 12 FHLBanks are located throughout the United States, with each FHLBank responsible for a particular district. The Seattle Bank is responsible for the Twelfth District, which includes the states of Alaska, Hawaii, Idaho, Montana, Oregon, Utah, Washington, and Wyoming, as well as the U.S. territories of American Samoa, Guam, and the Northern Mariana Islands.
The primary sources of funding for all of the FHLBanks consist of consolidated obligation bonds and discount notes, which are referred to collectively as consolidated obligations. The Office of Finance, a joint office of the FHLBanks created by the Finance Board, acts as an authorized agent of the FHLBanks, facilitating and executing the issuance of consolidated obligations on behalf of the FHLBanks. The U.S. government does not guarantee, directly or indirectly, the consolidated obligations or other obligations of any of the FHLBanks. Consolidated obligations are the joint and several obligations of the 12 FHLBanks. As of December 31, 2006, the aggregate par value of consolidated obligations outstanding for the FHLBank System was $952.0 billion; however, individual banks are primarily liable for an allocated portion of the consolidated obligations in which they participate. As of December 31, 2006, the Seattle Bank was the primary obligor on $49.7 billion par value of consolidated obligations.
In 2006, the Seattle Bank’s annual net income increased to $25.8 million, reversing a trend of declining net income that occurred from 2001 through 2005. Due to actions we initiated at the end of 2004, and which were substantially implemented during 2005 and 2006, we have now refocused our business on providing advances to our members and no longer purchase mortgage loans through the MPP. In changing the direction of our business,
2
we reviewed and improved our operations and reduced our expenses substantially. As a result of these factors, and assuming the interest-rate environment remains substantially unchanged, we anticipate continued improvement in net income. See “Part II. Item 7. Management’s Discussion and Analysis of Financial Condition and Results of Operations—Overview.”
As of December 31, 2006, 2005, and 2004, we had net unrealized market value losses of $245.0 million, $363.1 million, and $257.3 million, which are not reflected in our December 31, 2006, 2005, or 2004 Statements of Condition and which are likely to depress our net income over future periods. Because of these net unrealized market value losses, the ratio of the market value of our equity to the book value of our equity was 89.0%, 83.5%, and 87.8% as of December 31, 2006, 2005, and 2004. We measure the market value of our equity as the present value of the expected net cash flows from all our existing assets, liabilities, and commitments. The amount of our net unrealized market value losses involves estimates of the market values of our assets, liabilities, and commitments, which we discuss in greater depth in Note 17 in “Part II. Item 8. Financial Statements and Supplementary Data—Audited Financial Statements—Notes to Financial Statements.”
As a result of our 2004 Finance Board examination, we entered into an agreement with the Finance Board in December 2004, which we refer to as the Written Agreement. The Written Agreement required us to develop a three-year business and capital management plan and submit it to the Finance Board’s Office of Supervision, and imposed certain other requirements and limitations. In May 2005, the Finance Board accepted our three-year business and capital management plan, subject to our adoption of certain dividend and stock repurchase restrictions. On January 11, 2007, due to, among other things, our successful progress on the implementation of our business plan, the Finance Board terminated the Written Agreement. We refer to the three-year business and capital management plan, as updated from time to time, as the business plan.
To implement the business plan, we undertook significant changes to our business, operations, and capital policies, including refocusing our strategic direction and marketing efforts on advances, beginning our exit from the MPP, and substantially reducing our operating expenses, primarily through reductions in staff and facilities costs. To lead the Seattle Bank in refocusing our business, our Board of Directors, or Board, appointed James E. Gilleran as our president and chief executive officer effective June 2005, appointed Richard M. Riccobono as our executive vice president, chief operating officer effective August 2005, and appointed Mark R. Szczepaniak as our chief financial officer effective July 2005. In February 2007, Mr. Gilleran announced his resignation effective April 30, 2007, and the Board appointed Mr. Riccobono as our president and chief executive officer effective May 1, 2007. For more information regarding these matters, see “—Regulation—Written Agreement and Business Plan,” and “Part II. Item 7. Management’s Discussion and Analysis of Financial Condition and Results of Operations—Overview—Historical Operations,” and “Part III. Item 10. Directors, Executive Officers and Corporate Governance.”
Membership and Market
The Seattle Bank is a cooperative that is owned by member financial institutions located within our district. All federally insured depository institutions and insurance companies engaged in residential housing finance and community financial institutions located in the Seattle Bank’s district are eligible to apply for membership. Eligible institutions must purchase capital stock in the Seattle Bank as a condition of membership. Members generally are assigned a credit line at the time they join, based on our evaluation of their financial condition, and are eligible to receive dividends, when and if payable, on their capital stock investment. Members are subject to activity-based capital stock requirements, which may require them to purchase additional stock if the amount of business they do with us increases. All of our outstanding capital stock is owned by our members, except in limited circumstances, for example, for a period after a member is acquired by a nonmember.
As of December 31, 2006, the Seattle Bank had 379 members, which represented approximately 38% of the financial institutions in our district eligible for membership. We also had six stockholders that were nonmembers
3
holding capital stock as a result of acquisitions that are awaiting redemption of their stock by us. Additionally, we had six approved housing associates that were not required to purchase our stock to use our services within the parameters of our regulations and policies. As of December 31, 2006, 10 of our members had requested withdrawal from membership. On March 27, 2007, one member rescinded its withdrawal request.
Since 1999, membership has grown from 336, although our membership growth has slowed in recent years. The composition of our membership has remained essentially the same during that time, with commercial banks and thrifts comprising between 77% and 86% and credit unions between 14% and 22% of our membership. The following tables show the capital stock holdings and the geographic locations of our stockholders, by type, as of December 31, 2006.
| | | | | |
Type of Institution | | Number of
Institutions | | Total Value
of Capital
Stock Held* |
| (dollars in thousands) | | | | |
Commercial banks | | 253 | | $ | 1,042,050 |
Thrifts | | 37 | | | 1,016,881 |
Credit unions | | 84 | | | 141,679 |
Insurance companies | | 5 | | | 9,609 |
| | | | | |
Total | | 379 | | $ | 2,210,219 |
| | | | | |
| * | Includes $69.2 million in mandatorily redeemable Class B stock. See “Part II. Item 7. Management’s Discussion and Analysis of Financial Condition and Results of Operations—Capital Resources and Liquidity–Capital Resources–Seattle Bank Stock.” |
| | | | | | | | | | |
State or Territory | | Commercial
Banks | | Thrifts | | Credit
Unions | | Insurance
Companies | | Total |
Alaska | | 6 | | 1 | | 5 | | | | 12 |
American Samoa | | 1 | | | | | | | | 1 |
Guam | | 2 | | 1 | | 1 | | | | 4 |
Hawaii | | 5 | | 2 | | 5 | | | | 12 |
Idaho | | 12 | | 3 | | 2 | | 1 | | 18 |
Montana | | 61 | | 2 | | 7 | | | | 70 |
Ohio* | | 1 | | | | | | | | 1 |
Oregon | | 30 | | 2 | | 18 | | 1 | | 51 |
Utah | | 35 | | 3 | | 12 | | 1 | | 51 |
Washington | | 66 | | 20 | | 30 | | 2 | | 118 |
Wyoming | | 34 | | 3 | | 4 | | | | 41 |
| | | | | | | | | | |
Total | | 253 | | 37 | | 84 | | 5 | | 379 |
| | | | | | | | | | |
| * | Out-of-district nonmember stockholder holding capital stock as a result of an acquisition, pending redemption. |
The Seattle Bank’s market area is the same as its membership district. Institutions that are members of the Seattle Bank must have their principal places of business within this market area but may also operate elsewhere. The value of membership in the Seattle Bank has historically been derived primarily from the following aspects of our business:
| | • | | the relatively low rates at which members can borrow from us, which stems from our ability to raise funds in the financial markets at favorable interest rates through consolidated obligations, due primarily to the FHLBank System’s “AAA” credit rating; |
| | • | | the access we provide to readily available funding for liquidity purposes; |
| | • | | the access we provide to grants and below-market-rate loans for affordable housing and economic development; |
4
| | • | | the access we historically provided as a competitively priced secondary mortgage market alternative; and |
| | • | | the dividends that we have paid to members until recently, which historically have represented a significant portion of our earnings. |
To provide value to our members, we leverage our capital stock through the issuance of FHLBank System debt in the form of consolidated obligations. We have used a majority of the proceeds from the sale of consolidated obligations on which we are the primary obligor to provide advances to member and approved nonmember borrowers and historically to purchase mortgage loans under the MPP. We have also used the proceeds from consolidated obligations on which we are the primary obligor to purchase investments in high-quality financial instruments, including consolidated obligations on which other FHLBanks are the primary obligors, with the goal of achieving market-rate returns on our investments. Interest income from our credit products, mortgage loans, and investments is used to pay our interest expenses, operating expenses, other costs, and dividends to our members.
Our Business
We manage and report our operations as a single business segment, traditional member finance, which includes making advances, providing letters of credit, accepting deposits, and providing securities safekeeping and other services. Historically, we offered products and services through two operating segments, traditional member finance and the MPP. The MPP segment consisted of mortgage loans held for portfolio as a result of purchases from participating members. During the first quarter of 2005, we decided to exit the MPP. As a result of this decision, Seattle Bank management no longer manages the business using separate operating segments and the operating results of the former MPP segment are aggregated with the traditional member finance segment for decision-making purposes. See “Segment Disclosure” in Note 1 in “Part II. Item 8. Financial Statements and Supplementary Data—Audited Financial Statements—Notes to Financial Statements.”
Products and Services
Advances
We make advances to our member and approved nonmember borrowers at competitive rates, with maturities ranging from overnight to 30 years. Advances can be customized to meet a borrower’s special funding needs, using a variety of interest-rate indices, maturities, amortization schedules, and embedded options such as call or put options. Borrowers pledge mortgage loans and other eligible collateral, such as U.S. Treasury or agency securities, to secure these advances. With the exception of overnight and other very short-term advances, we generally do not make advances of less than $100,000.
As of December 31, 2006, we had 222 member borrowers with outstanding advances totaling $28.0 billion, and two approved nonmember borrower with outstanding advances totaling $7.9 million.
Advances to Members. Advances generally support our members’ mortgage lending activities. In addition, advances made to member community financial institutions may be used for the purpose of providing loans to small businesses, small farms, and small agribusinesses. Community financial institutions are financial institutions that, in 2006, had average assets over the last three years of no more than $587.0 million.
Advances help our members manage their assets and liabilities and serve as a funding source for a variety of member uses, including mortgage loans that members may be unable or unwilling to sell in the secondary mortgage market. Advances matched to the maturity and prepayment characteristics of mortgage loans can reduce a member’s interest-rate risk associated with holding mortgage loans. Accordingly, advances support important housing markets, including those focused on low- and moderate-income households. In addition, advances provide members with a low-cost source of liquidity, reducing their need to hold low-yielding liquid assets financed with longer-term, more expensive debt, and provide long-term financing to support our members’ balance sheet management strategies. For example, for members that choose to sell their mortgage loans in the
5
secondary mortgage markets, advances can provide funding for temporary liquidity needs. Advances also provide competitively priced wholesale funding to smaller community lenders that typically do not have access to many of the funding alternatives available to larger financial organizations, such as repurchase agreements, commercial paper, and brokered deposits.
Advances to Nonmembers. Under the FHLBank Act, we are permitted to make advances to nonmembers that are approved under Title II of the National Housing Act, which we also refer to as approved nonmember borrowers. These approved nonmember borrowers are not subject to all of the provisions of the FHLBank Act that apply to our members. For example, they have no capital stock purchase requirements, although the same regulatory lending requirements generally apply to them as apply to members. An approved nonmember borrower must be a government agency or be chartered under federal or state law with rights and powers similar to those of a corporation, and it must lend its own funds as its principal activity in the mortgage lending field. The financial condition of an approved nonmember borrower must be such that, in our sole opinion, we can safely make advances to the approved nonmember borrower.
Types of Advances. The Seattle Bank offers a variety of advances, including variable interest-rate, fixed interest-rate, and structured advances. Structured advances are either fixed interest-rate or variable interest-rate advances that include certain options that are affected by interest rates or that alter the cash flows.
Variable Interest-Rate Advances
Cash Management Advances. Cash management advances are short-term, variable interest-rate advances designed to provide immediate and flexible funding to meet borrowers’ daily liquidity needs. A cash management advance is an open-note program, similar to a revolving line of credit or a federal funds line. Outstanding cash management advance balances are automatically renewed unless paid off by the borrower. Borrowers can increase or decrease cash management advance balances daily. Cash management advance rates are based on overnight federal funds rates and are reset daily. There are no minimum dollar amounts for cash management advances.
Adjustable Advances. Adjustable advances are variable interest-rate, fixed-term advances with interest rates based on a spread to a specified market interest-rate index, such as the London Interbank Offered Rate, known as LIBOR, or prime. Maturities range from one to five years. Adjustable advances are subject to prepayment fees. The prepayment fee requirement is intended to make us economically indifferent to a borrower’s decision to prepay an advance. However, because interest rates on adjustable advances track interest rates in the financial markets, prepayment fees are generally minimal.
Fixed Interest-Rate Advances
Fixed Interest-Rate Advances. Fixed interest-rate advances include short-term advances with maturities from seven days to one year and long-term, fixed interest-rate advances with maturities from one year to 30 years. In both cases, principal is due at maturity. Principal may be prepaid prior to maturity, subject to a prepayment fee. We determine the amount of fees charged for prepayments using the interest rate, the amount, the remaining time to maturity of the prepaid advance, and our cost of funds at the time the advance is prepaid. The prepayment fee requirement is intended to make us economically indifferent to a borrower’s decision to prepay an advance.
Amortizing Advances. Amortizing advances are fixed interest-rate, fixed-term advances, where the principal is repaid over the term of the advance, generally on a straight-line basis. Maturities range from two to 30 years. Amortizing advances allow borrowers to reduce the principal level of their advances in tandem with their funded assets, such as mortgage loans.
Structured Advances
Putable Advances. Putable advances have a fixed interest rate and include an option for us to terminate the advance on specific dates throughout the term of the advance following a specified period of time, which we
6
refer to as a lock-out period. In exchange for our option, the borrower pays a lower interest rate on the advance. Maturities range from one to 10 years, with lock-out periods from three months to five years or longer. At the end of the lock-out period, and on a periodic basis thereafter, we may terminate the advance at our discretion. If we elect to terminate the advance, the member may apply for a new advance at the then-current advance rates, subject to all applicable credit requirements.
Knockout Advances. Knockout advances are a type of putable advance that is automatically canceled by the Seattle Bank in the event LIBOR exceeds a pre-determined interest rate on set future dates. If the advance is canceled, the member may apply for a new advance at the then-current advance rates, subject to all applicable credit requirements.
Capped Floater Advances. A capped floater advance is an adjustable interest-rate advance that is capped at a pre-determined interest rate. The funding structure allows the borrower to benefit from lower borrowing costs should interest rates decline, while offering protection against a significant increase in interest rates.
Floored Advances. A floored advance is an adjustable interest-rate advance that contains a long position in an interest- rate floor that is based on a benchmark index rate such as LIBOR. If interest rates decline below a pre-determined interest rate, the borrower’s rate will be reduced to an interest rate that reflects the lower index rate less the difference between the pre-determined interest rate and the index rate. This advance offers the borrower protection from exposure to falling interest rates.
Floating-to-Fixed Convertible Advances. A blend of an adjustable interest-rate advance and a putable advance, the floating-to-fixed convertible, or FFC, advance initially has a floating or variable interest rate, which “flips” to a fixed rate of interest on a pre-determined date if we do not exercise our option to cancel the advance on that date. In addition, the FFC advance has an option for us to cancel the advance on specific dates throughout the term of the advance, including the “flip” date, following the lock-out period. The FFC advance offers sub-LIBOR, variable interest-rate funding in exchange for selling the Seattle Bank the right to cancel the advance on pre-determined dates.
Returnable Advances. This fixed interest-rate advance gives the borrower the right to prepay the advance to the Seattle Bank on pre-determined dates without a prepayment penalty. The cost of purchasing the option is reflected in an interest rate that is higher than that of a standard fixed-rate advance.
The types of advances outstanding as of December 31, 2006 and the amount of income generated by each advance type for the year ended December 31, 2006 are described in the table below.
| | | | | | | | | | | | |
| | | As of December 31, 2006 | | | For the Year Ended
December 31, 2006 | |
Advance Type | | Advances
Outstanding | | Percent of Total
Advances
Outstanding | | | Advances
Income* | | Percent of Total
Advances
Income | |
| (dollars in thousands) | | | |
Variable interest-rate advances | | | | | | | | | | | | |
Cash management advances | | $ | 1,151,020 | | 4.11 | % | | $ | 76,007 | | 6.06 | % |
Adjustable advances | | | 10,891,978 | | 38.93 | | | | 322,713 | | 25.72 | |
Fixed interest-rate advances | | | | | | | | | | | | |
Fixed interest-rate advances | | | 11,792,206 | | 42.13 | | | | 658,751 | | 52.51 | |
Amortizing advances | | | 675,669 | | 2.41 | | | | 36,090 | | 2.88 | |
Structured advances | | | | | | | | | | | | |
Putable advances | | | 3,195,946 | | 11.42 | | | | 153,772 | | 12.25 | |
Capped floater advances | | | 140,000 | | 0.50 | | | | 5,381 | | 0.43 | |
Floating-to-fixed convertible advances | | | 140,000 | | 0.50 | | | | 1,912 | | 0.15 | |
| | | | | | | | | | | | |
Total par value of advances | | $ | 27,986,819 | | 100.00 | % | | $ | 1,254,626 | | 100.00 | % |
| | | | | | | | | | | | |
| * | Advances income excludes hedging adjustments, amortization of discounts on AHP advances, commitment fees, and amortization of prepayment fees. |
7
Security Interests.We are required under the FHLBank Act to obtain and maintain a security interest in eligible collateral at the time we originate or renew an advance. Eligible collateral for member borrowers includes:
| | • | | whole first mortgage loans on improved residential property or securities representing a whole interest in the mortgage loans; |
| | • | | securities issued, insured, or guaranteed by the U.S. government or any of its agencies, such as mortgage-backed securities issued or guaranteed by the Government National Mortgage Association, or Ginnie Mae; |
| | • | | mortgage-backed securities issued or guaranteed by Federal National Mortgage Association, or Fannie Mae, or Federal Home Loan Mortgage Corporation, or Freddie Mac, neither of which are guaranteed, directly or indirectly, by the U.S. government; |
| | • | | cash or other deposits in the Seattle Bank; and |
| | • | | other acceptable real estate-related collateral that has a readily ascertainable value, can be liquidated in due course, and in which we can perfect a security interest. |
As additional security for a member borrower’s indebtedness, we have a statutory lien on our member borrowers’ capital stock in the Seattle Bank. Community financial institutions have the benefit of expanded statutory collateral provisions dealing with small business, small farm, or small agribusiness loans.
Nonmember borrowers are subject to more stringent collateral requirements than are member borrowers. For example, collateral generally is limited to whole first mortgage loans on improved residential real estate that are insured by the Federal Housing Administration, or FHA, of the U.S. Department of Housing and Urban Development under Title II of the National Housing Act. Securities that represent a whole interest in the principal and interest payments due on a pool of FHA mortgage loans also are eligible. Collateral for nonmember borrowers is maintained in the physical possession of the Seattle Bank.
We use three basic categories of collateral control arrangements to secure our interests: blanket pledge, segregation/listing, and physical possession.
| | | | |
Control Category | | Physical Delivery
(Yes / No) | | Summary Description |
Blanket Pledge | | Loans: No Securities: Yes | | Members are not required to physically deliver loan documents to us. Instead, we monitor estimated collateral levels from regulatory financial reports filed quarterly with the member’s regulator or, for types of collateral not readily ascertainable from the regulatory financial reports, from specific member-prepared schedules provided to us on a periodic basis. All securities collateral must be specifically pledged and delivered to a controlled account at either the Seattle Bank or a third-party custodian approved by us. |
| | |
Segregation/Listing | | Loans: No Securities: Yes | | Members are required to periodically submit a listing of their pledged loan collateral and must be prepared to deliver the collateral to us if requested to do so. All securities collateral must be specifically pledged and delivered to a controlled account at either the Seattle Bank or a third-party custodian approved by us. |
| | |
Physical Possession | | Loans: Yes Securities: Yes | | All collateral used in determining borrowing capacity is delivered to us. Securities pledged are delivered to a controlled account at either the Seattle Bank or a third-party custodian approved by us. |
We determine the appropriate collateral control category based on a risk analysis of the member borrower, using regulatory financial reports and other information. In general, collateral needed to meet minimum
8
requirements must be owned by the member borrower, or in certain cases, a member’s affiliate approved by us, and must be identified on the member’s or affiliate’s books and records as being pledged to us. Member borrowers must comply with collateral requirements before we fund an advance. Member borrowers are required to maintain eligible collateral, free and clear of pledges, liens, or other encumbrances of third parties, in an amount that covers outstanding indebtedness due to us. Member borrowers must maintain appropriate tracking controls and reports to ensure compliance with this requirement.
The Competitive Equality Banking Act of 1987 affords priority to any security interest granted to us by any of our member borrowers over the claims and rights of any party, including any receiver, conservator, trustee, or similar party having rights as a lien creditor. The only two exceptions to this priority are claims and rights that would be entitled to priority under otherwise applicable law or that are held by actual bona fide purchasers for value or by parties that have actual perfected security interests in the collateral. In addition, our claims are given certain preferences pursuant to the receivership provisions in the Federal Deposit Insurance Act. Most member borrowers grant us a blanket lien covering substantially all of the member borrower’s assets and consent to our filing a financing statement evidencing the blanket lien, which we do as a standard practice.
Based on the security provided by the blanket lien, the financing statement, and the statutory preferences, we do not take control of the collateral, other than securities collateral, pledged by member borrowers under the blanket pledge or segregation/listing categories. We generally will further secure our security interests by taking physical possession (or control) of the supporting collateral if we determine the financial or other condition of a particular member borrower so warrants. In addition, we generally take physical possession of collateral pledged by non-depository institutions (e.g., insurance companies and approved nonmember borrowers) to ensure that an advance is as secure as the security interest in collateral pledged by depository institutions.
Typically, we charge collateral management and safekeeping fees on collateral delivered to the Seattle Bank or its custodians.
Borrowing Capacity.Borrowing capacity depends on the type of collateral provided by a borrower, whether a member or a nonmember. The following table shows, for each type of collateral, the borrowing capacity as a percentage of the collateral’s value. To determine the value against which we apply these specified discounts, we generally use discounted cash flows for mortgage loans and a third-party pricing source for securities for which there is an established market.
| | |
Type of Collateral | | Borrowing Capacity |
U.S. Treasury and other government agency* securities | | 95 – 97% |
| |
U.S. Treasury and other government agency* debentures and non-agency-rated mortgage-backed securities | | 80 – 87% |
| |
Eligible first-lien single or multi-family mortgage loans | | 80 – 83% |
| |
Other eligible collateral and community financial institution collateral | | 50 – 75% |
| * | Includes GSEs such as Fannie Mae, Freddie Mac, and other FHLBanks, as well as other U.S. agencies such as Ginnie Mae, the Farm Services Agency, Small Business Administration, Bureau of Indian Affairs, and the United States Department of Agriculture. |
On a case-by-case basis, we accept certain categories of first-lien single-family subprime mortgage loans as collateral under our subprime collateral program. Prior to being approved for this program, members must complete a separate application process which includes a thorough assessment of their credit and collateral administration policies and procedures for subprime lending. Also, our credit department staff reviews individual subprime loans for compliance with the policies and also tests for loans with predatory characteristics and compliance with our responsible lending policy. Borrowing capacity rates for approved subprime loans vary from 50% to 75%, according to loan characteristics. The policy adopted by our Board to govern the subprime collateral program prohibits as eligible collateral: loans delinquent more than sixty days, second liens, loans
9
with a debt-to-income ratio in excess of 49%, and non-owner occupied properties. In addition, certain state concentration limits were established. The market value of the subprime loans is determined regularly by a third-party expert in mortgage valuation, contracted by the Seattle Bank.
Management of Credit Risk. In order to manage the credit risk of our advances, we monitor our member borrowers’ financial condition using quarterly reports submitted by our members to their regulators. We perform quarterly analyses and reviews of member borrowers whose financial performance does not fall within the key performance parameters defined in our credit monitoring system. For example, member borrowers falling within the following performance categories will be analyzed and reviewed:
| | • | | member borrowers that report a net operating loss for the quarter; |
| | • | | member borrowers that report a ratio of nonperforming assets to equity and loss reserves in excess of 20%; |
| | • | | member borrowers with a composite CAMELS score of 3 or worse; or |
| | • | | member borrowers with: (1) a quarterly Portfolio Analysis and Monitoring System, or PAMS, score of 15 or less on a scale of 50 points, (2) a quarterly PAMS score decline of 10 points or more during the most recent quarter, or (3) a 10-point drop in weighted-average PAMS score over two quarters. |
The CAMELS rating system generates a regulatory rating of a financial institution’s overall condition, based on on-site examinations of six factors: capital adequacy, asset quality, management quality, earnings, liquidity, and sensitivity to market risk. Each financial institution’s regulator assigns the institution a score on a scale of 1 (best) to 5 (worst) for each of the six factors, along with a composite or overall rating for a financial institution that is based on a combination of the factors’ scores and an overall evaluation. Financial institutions with a composite rating of 1 or 2 are considered to be high-quality institutions that present few, if any, supervisory concerns. PAMS is an internal scoring system we use to evaluate and classify various credit risks associated with members. We use a number of credit quality ratios, such as non-performing loans to total loans, as well as profitability, capital, and liquidity ratios to determine a member borrower’s score.
We review and validate collateral pledged by member borrowers on a risk-based schedule, according to the member’s financial condition, collateral quality, or other credit considerations. Member borrowers who fully collateralize their indebtedness with marketable securities in a pledged account under the control of the Seattle Bank are generally not subject to collateral verifications.
Financial information on nonmember borrowers is generally limited to annual reports, which include fiscal year-end financial data. Nonmember borrowers that request recurring borrowing facilities are reviewed periodically. Certifications relating to their status as an eligible nonmember borrower, use of proceeds, and eligibility of collateral are required with each advance. Nonmember borrowers must provide current financial statements and meet all eligibility tests prior to consideration of borrowing requests.
Concentration and Pricing of Advances.Our advance balances are concentrated with commercial banks and thrift institutions. As of December 31, 2006, five members held 69.5% of the par value of our outstanding advances, with two of these members holding 56.8% of the par value of our outstanding advances. No borrower other than Bank of America Oregon, N.A. and Washington Mutual Bank, F.S.B., held more than 10% of the par value of our total advances outstanding as of December 31, 2006.
10
The following table identifies our top five borrowers’ advance balances and their percentage of our total par value of advances, as well as the income and percentage of our total advance income from these advances for the year ended December 31, 2006.
| | | | | | | | | | | | |
| | | As of December 31, 2006 | | | For the Year Ended
December 31, 2006 | |
Name | | Advances at
Par Value | | Percent
of Total
Advances | | | Advances
Income | | Percent
of Total
Advances
Income | |
| (dollars in thousands) | | | | | | | | | | |
Bank of America Oregon, N.A. | | $ | 10,060,394 | | 36.0 | % | | $ | 400,472 | | 31.1 | % |
Portland, OR | | | | | | | | | | | | |
| | | | |
Washington Mutual Bank, F.S.B. | | | 5,821,822 | | 20.8 | | | | 216,143 | | 16.8 | |
Seattle, WA | | | | | | | | | | | | |
| | | | |
Washington Federal Savings Bank | | | 1,500,000 | | 5.4 | | | | 69,654 | | 5.4 | |
Seattle, WA | | | | | | | | | | | | |
| | | | |
Sterling Savings Bank | | | 1,306,008 | | 4.7 | | | | 59,896 | | 4.6 | |
Spokane, WA | | | | | | | | | | | | |
| | | | |
American Savings Bank, F.S.B. | | | 730,000 | | 2.6 | | | | 39,980 | | 3.1 | |
Honolulu, HI | | | | | | | | | | | | |
We are not subject to any regulatory or other restrictions on concentrations of advances with particular categories of institutions or with individual borrowers. Nevertheless, we monitor our advance activity and provide a variety of information to our Board regarding advance balances and activity trends by type of advance, customer, and other relevant measures. Because a large concentration of our advances is held by only a few members, changes in their borrowing decisions can significantly affect the amount of our advances outstanding. We expect that the concentration of advances with our largest borrowers will remain significant for at least 2007 and several years thereafter.
There are three primary means of pricing advances:
| | • | | Advance window. All borrowers receive the same pricing, which is posted on our website. |
| | • | | Auction funding. Through this alternative, borrowers can generally save five or more basis points on advance rates. Auction funding is available two times per week when the Seattle Bank participates in consolidated obligation discount note issuances from the Office of Finance. Borrowers do not know the interest rate of the advance until the auction is complete. |
| | • | | Differential pricing. Borrowers can request a lower advance rate and, subject to specific criteria and delegated authority, certain staff members may adjust the pricing levels. |
We significantly increased our use of differential pricing in 2006 and 2005 as we refocused our business on advances. The differential pricing option is administered by specified employees within parameters established by our asset and liability management committee (consisting of Seattle Bank employees) under authority delegated by our president and chief executive officer and overseen by the Board. For the year ended December 31, 2006, the amount of differentially priced advances accounted for 79.5% of new advances, compared to 46.0% for the year ended December 31, 2005. The amount of window advances and auction-priced advances accounted for 10.0% and 10.5% of new advances made for the year ended December 31, 2006, compared to 45.5% and 8.5% of advances made for the year ended December 31, 2005.
We believe that the use of differential pricing gives us greater flexibility to compete with regard to rates for more advance business. This means that rates on advances may be lower for some members than for others in order to be competitive with lower rates available to those members that have alternative funding sources. In
11
general, our larger members have more alternative funding sources and are able to access funding at lower rates than our smaller members. We believe that the use of differential pricing has increased our advance balance and will continue to do so in the future, and that the increased volume compensates us for any reduction in overall yield due to differential pricing. For additional discussion on advances, see “Part II. Item 7. Management’s Discussion and Analysis of Financial Condition and Results of Operations—Financial Condition—Advances—Member Demand for Advances.”
The weighted-average interest rates of advances are highly dependent upon origination date and time to maturity. The federal funds rate increased by 100 basis points during 2006, 200 basis points during 2005, and 125 basis points during 2004, from historically low levels in 2003 and 2002. As a result, shorter-term, fixed interest-rate advances have higher weighted-average interest rates than those with longer terms. The table below provides information on the type, weighted-average interest rates, and terms of advances held by our five largest borrowers and all other borrowers as of December 31, 2006.
| | | | | | | | | | | | | | | | | | | | |
| | | Top Five Borrowers | | All Other Borrowers |
Advance Type | | Advances
Outstanding | | Weighted-
Average
Percent
Interest
Rate | | | Weighted-
Average
Term
(months) | | Weighted-
Average
Remaining
Term
(months) | | Advances
Outstanding | | Weighted-
Average
Percent
Interest
Rate | | | Weighted-
Average
Term
(months) | | Weighted-
Average
Remaining
Terms
(months) |
| (dollars in thousands) | | | | | | | | | | | | | | | | | | |
Variable interest-rate advances | | | | | | | | | | | | | | | | | | | | |
Cash management advances | | $ | 17,256 | | 5.63 | % | | 11.97 | | 3.39 | | $ | 1,133,764 | | 5.63 | % | | 11.98 | | 5.96 |
Adjustable advances | | | 9,883,000 | | 5.32 | | | 20.81 | | 12.72 | | | 1,008,978 | | 5.53 | | | 24.53 | | 16.48 |
Fixed interest-rate advances | | | | | | | | | | | | | | | | | | | | |
Fixed interest-rate advances | | | 7,379,752 | | 5.24 | | | 9.56 | | 3.28 | | | 4,412,454 | | 4.71 | | | 36.38 | | 18.72 |
Amortizing advances | | | 322,466 | | 5.45 | | | 178.86 | | 119.97 | | | 353,203 | | 4.79 | | | 128.40 | | 82.55 |
Structured advances | | | | | | | | | | | | | | | | | | | | |
Putable advances | | | 1,815,750 | | 4.71 | | | 116.42 | | 72.72 | | | 1,380,196 | | 4.62 | | | 106.98 | | 70.51 |
Capped floater advances | | | | | | | | | | | | | 140,000 | | 5.63 | | | 44.60 | | 32.15 |
Floating-to-fixed convertible advances | | | | | | | | | | | | | 140,000 | | 4.22 | | | 114.25 | | 110.47 |
| | | | | | | | | | | | | | | | | | | | |
Total par value of advances | | $ | 19,418,224 | | 5.24 | | | 28.09 | | 16.51 | | $ | 8,568,595 | | 4.93 | | | 48.16 | | 29.34 |
| | | | | | | | | | | | | | | | | | | | |
Other Mission-Related Community Investment Programs.We provide direct and indirect support for programs designed to make communities better places to work and live. We assist members in meeting their Community Reinvestment Act responsibilities through a variety of specialized funding programs. Through our AHP and our other community investment programs, members have access to grants and subsidized and other low-cost funding to help them provide affordable rental and home ownership opportunities and take part in commercial and economic development activities that benefit low- and moderate-income neighborhoods. We also provide subsidy grants and loans to members for community and economic development. We administer and fund the programs described below.
Affordable Housing Program. Through the AHP, we offer grants and discounted advances to member financial institutions that partner with community sponsors to stimulate affordable rental and home ownership opportunities for low- or moderate-income households, which are defined as households with income below 80% of the area’s median income adjusted for family size. AHP grants can be used to fund the acquisition, rehabilitation, or construction of housing, to reduce principal or interest rates on loans, or to assist in covering down payments or closing costs. We fund this program with approximately 10% of our net income each year. Over the last 16 years, the AHP has provided significant resources to members for housing development across the Seattle Bank’s district to assist in the purchase, construction, and rehabilitation of housing for low- and moderate-income households. We awarded AHP grants of $4.2 million, net of withdrawals, in 2006, funding over 1,006 housing units in 13 states or territories. From the inception of the program in 1990 through the end of 2006, we awarded $167.6 million in AHP grants to facilitate development of projects to create more than 33,450 housing units.
The Home$tart Program. The Home$tart Program is a subprogram of the AHP that, through our members, provides first-time home buyers with down payment and closing cost assistance by matching financial contributions made by the home buyers. We match $3 for every $1 put up by the home buyer, up to $5,000.
12
| | For home buyers already receiving public housing assistance, we match $2 for every $1 put up by the home buyer, up to $10,000. In 2006, $2.0 million was distributed as part of the Home$tart program. |
Community Investment Program/Economic Development Fund. In addition to the AHP, we offer two programs, the Community Investment Program and the Economic Development Fund, through which our members can apply for advances to support affordable housing initiatives or fund economic development. These programs provide advance funding with interest rates 10 to 25 basis points below our regular advance rates, for terms of five to 30 years. Rate locks are also available for periods of up to 24 months. These advances are especially effective when they support housing and commercial development in distressed or rural areas where financial resources are scarce. Our Community Investment Program/Economic Development Fund advances have been used to build affordable homes, fund multi-family rental projects, construct new roads and bridges, create sewage treatment plants, and finance new small businesses. As of December 31, 2006, we had $671.0 million in advances outstanding under these programs.
ACCESS Fund. Between 2000 and 2004, we set aside up to $200,000 per year to fund ACCESS, a recoverable loan fund that covers predevelopment costs associated with community-based economic development projects and loan loss reserves of community-based financial intermediaries. ACCESS granted $1.1 million in support of 24 projects between 2000 and 2005. In 2005, we suspended making contributions to this program. Our Board may consider reinstituting this or a similar program once we have established a trend of consistent profitability.
Challenge Fund. The Challenge Fund is a revolving fund that provides grants of up to $20,000 to subsidize predevelopment expenses associated with affordable housing projects. When a project moves forward, the grant is repaid. If a project does not move forward, the grant may be forgiven. In 2005, we suspended this program. Our Board may consider reinstituting this or a similar program once we have established a trend of consistent profitability.
Letters of Credit
The Seattle Bank issues letters of credit that provide members an efficient and low-cost vehicle to secure contractual agreements, enhance credit profiles, improve asset and liability management, and collateralize public deposits. Terms are individually structured to meet member needs. As of December 31, 2006, our outstanding letters of credit totaled approximately $135.6 million.
Mortgage Loans Held for Portfolio
Many of our members originate mortgage loans. However, for a variety of reasons, including liquidity, mortgage servicing, and risk management purposes, our members often sell their mortgage loans into the secondary mortgage market rather than holding them in their portfolios. We designed the MPP in collaboration with certain other FHLBanks to provide participating members with: (i) an alternative to the sale of whole mortgage loans into the traditional secondary mortgage market, and (ii) an enhanced ability to provide attractive financing to home buyers in their communities. Under the MPP, we purchased loans directly from our members, without the use of any intermediary, such as an intervening trust. The MPP was designed as a risk-sharing arrangement under which we would manage the liquidity, interest rate, and prepayment risk of purchased mortgage loans, while members would retain the primary credit risk. Since the inception of the MPP in 2001, we generally operated our MPP independently without participation from other FHLBanks, except for certain coordination and limited cost-sharing arrangements relating to software enhancements and upgrades and, when beneficial to the FHLBanks that offer an MPP, joint negotiation with common vendors, such as master servicing providers and supplemental mortgage insurance companies.
In March 2005, we announced that we were refocusing our business on advances, and in our business plan, we outlined a strategy to exit the MPP. We ceased entering into new master commitment contracts in 2005 and have terminated all open contracts. In August 2005, we sold $1.4 billion of government-insured mortgage loans
13
to Bank of America, N.A., an affiliate of one of our members, Bank of America Oregon, N.A. In September 2005, we reclassified the remaining government-insured mortgages as held for portfolio. We expect that the balance of our mortgage loans held for portfolio will continue to decrease as those loans are paid off.
Our MPP business was concentrated among a small number of participating members as the following table shows, and we were not subject to any regulatory or other restrictions on concentrations of MPP business with particular categories of institutions or with individual customers. The following table presents our historical purchases from our three largest MPP participating members through December 31, 2006.
| | | | | | |
| | | Through December 31, 2006 | |
Name | | Par Value of
Purchases | | Percent of Total
Par Value of
MPP Purchases | |
| (dollars in thousands) | | | | | |
Washington Mutual Bank, F.S.B. Seattle, WA | | $ | 15,200,050 | | 83.5 | % |
| | |
Wells Fargo Bank Northwest, N.A Salt Lake City, UT | | | 1,491,887 | | 8.2 | |
| | |
Bank of America Oregon, N.A. Portland, OR | | | 923,209 | | 5.1 | |
Eligible Loans. Through the MPP, we purchased directly from participating members fixed interest-rate, fully amortizing, government-insured mortgage loans and conventional, one- to four-family residential mortgage loans with principal balances that would have made them eligible for purchase by Fannie Mae and Freddie Mac. The government-insured mortgage loans we purchased are insured by the FHA. As of December 31, 2006, our mortgage loan portfolio was composed of government-insured mortgage loans with a par value totaling $292.1 million and conventional mortgage loans with a par value totaling $6.0 billion. As of December 31, 2006, the MPP portfolio consisted of 38,711 mortgage loans, which were originated throughout the United States. For additional information regarding mortgage loan holdings by state and geographic concentration, see “Part II. Item 8. Financial Statements and Supplementary Data—Unaudited Supplementary Data—Geographic Concentration of Mortgage Loans.”
We do not service the mortgage loans we purchased from our participating members. Under the MPP, participating members that sold mortgage loans to us could either continue to service the mortgage loans or independently sell the servicing rights to a service provider acceptable to us. If the participating member released its servicing rights to another service provider on our pre-approved list, the member typically received a servicing released premium for selling the servicing under the servicing released option.
Management of Credit Risk. To ensure member retention of most of the credit risk and to cover, at a minimum, the expected losses on the conventional mortgage loans originated or acquired by a member and purchased under the MPP, we require the member to fund a lender risk account. The lender risk account is funded in one of two ways: (i) historically, by an up-front reduction to the proceeds paid to the member for its mortgage loans; or (ii) by an additional modification to the yield on the mortgage loans purchased such that a portion of the amount paid by the member each month is designated for the lender risk account. The lender risk account is used to cover potential mortgage loan losses in excess of the homeowner’s equity in the underlying collateral and any private mortgage insurance for the mortgage loan. This account is established to conform to federal regulation covering acquired member asset programs. These regulations stipulate that a member is responsible for all expected losses on the mortgage loans it sells to an FHLBank. The participating member’s master commitment contract relating to the MPP specifies the funding level required for the member’s lender risk account. In accordance with the applicable contract, either the purchase price for the mortgage loans purchased under a member’s master commitment contract was discounted or the amount paid monthly by the member is increased to fund the lender risk account. If the member’s lender risk account is funded through monthly
14
payments, the member remains obligated under the master commitment contract to pay the monthly amounts that fund the lender risk account whether or not any of the purchased mortgage loans are in default.
We require each member that sold conventional mortgage loans to us to provide additional credit enhancements that, combined with the lender risk account, effectively make the purchased mortgage loan portfolio equivalent to an investment that has been highly rated by Moody’s Investor’s Service, or Moody’s, or Fitch Investor’s Service, or Fitch. This was accomplished, in part, through the participating member’s purchase of supplemental mortgage insurance. We evaluated the proposed conventional mortgage loans to be purchased (either the specific portfolio or a representative sample) to determine the amount of expected losses from the mortgage loans. The amount funded into the lender risk account by the member was the greater of these expected losses or the minimum required by the supplemental mortgage insurance provider in order to provide supplemental mortgage insurance. As with some of the funding of the lender risk account, a portion of the monthly interest was set aside to fund the supplemental mortgage premium. If the lender risk account and the standard supplemental mortgage insurance policy did not combine to provide sufficient loss protection to support the equivalent of an investment-grade rating, the member was required to purchase additional supplemental mortgage insurance coverage called SMI Plus. This policy provides additional credit enhancement coverage to achieve an equivalent of an investment-grade rating.
The lender risk account funds and any payments made under supplemental mortgage insurance may be used to offset any losses that may occur over the life of the mortgage loans. To the extent that amounts deposited in the lender risk account exceed losses on the purchased mortgage loans, we return the remaining lender risk account funds to the participating member in accordance with the release schedule in the participating member’s master commitment contract. No lender risk account or other enhanced credit feature is required on U.S. government-insured mortgage loans that we purchased from our participating members.
15
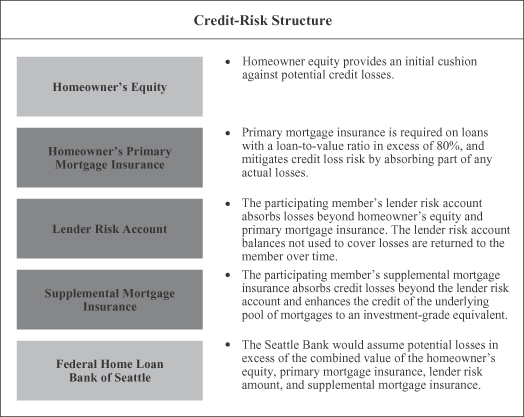
As a result of the credit enhancements described above, we and our participating members share the credit risk of the mortgage loans sold to us under the MPP. The participating member assumes a first-loss obligation in the event of a mortgage borrower default equivalent to a minimum of the expected losses through its lender risk account after the exhaustion of the borrower’s equity and any primary mortgage insurance coverage, if required. If the participating member’s lender risk account is insufficient to cover any losses, then the supplemental mortgage insurance coverage is used. Only after exhausting the supplemental mortgage insurance coverage will the Seattle Bank absorb any potential losses. Under this credit enhancement structure, the value of a foreclosed property must fall below 50% of the outstanding mortgage loan balance to result in a loss to us. The following table sets out the credit-risk structure described above.
To date, all supplemental mortgage insurance has been underwritten by one mortgage insurance company. This company has the following claims-paying ability ratings: Standard & Poor’s, “AA,” Moodys, “Aa2,” Fitch, “AA+.” We monitor the claims-paying ability ratings of this insurance company as part of our overall credit rating monitoring processes. We have approved other mortgage insurance companies to supply supplemental mortgage insurance, but do not expect to utilize those companies because of our exit from the MPP.
Management of Interest-Rate and Prepayment Risk. The market value of the fixed interest-rate mortgage loans that we purchased changes as interest rates change. Typically, when interest rates rise, the market value of a fixed interest-rate mortgage loan depreciates, and as interest rates fall, the value of a fixed interest-rate mortgage loan appreciates. However, because borrowers can prepay the loans with no penalty, mortgage loans have inherent prepayment risk. Borrowers may prepay their mortgage loans for a variety of reasons, including refinancing their mortgage loans at a lower rate or sale of their homes. As a result of a borrower’s option to repay a mortgage loan at any time, the term of our investment in a mortgage loan is less predictable. We estimate the propensity of borrowers to prepay their mortgage loans using a third-party vendor prepayment model. The model
16
estimates, using a variety of market variables, the expected cash flows of the mortgage loans under various interest-rate environments.
Our primary method of managing interest-rate risk for our MPP portfolio is to finance the mortgage loans with fixed interest-rate consolidated obligation debt of varying terms and maturities to simulate the expected cash flows of the underlying mortgage loans. The market value of the fixed interest-rate debt typically appreciates when rates rise, moving in the opposite direction of the mortgage loans, which generally depreciate under a rising interest-rate environment. Likewise, the fixed interest-rate debt typically depreciates when rates fall, whereas the mortgage loans may appreciate in such an environment.
We manage prepayment risk by financing the mortgage loans with callable debt where we have the option to call or repay the debt prior to the stated maturity date with no penalty. We generally repay or refinance the callable debt when interest rates fall, mirroring the prepayment option held by the borrower. Likewise, the callable debt may be extended to its maturity date when interest rates rise.
We also enter into interest-rate exchange agreements, such as interest-rate caps, floors, and options to purchase interest-rate exchange agreements, or swaptions, to further limit the interest-rate and prepayment risk inherent in mortgage loans. When interest rates are volatile, the prepayment option in a mortgage loan is less predictable and therefore the value of a mortgage loan depreciates. We offset this volatility risk by issuing callable debt and purchasing swaptions or interest-rate caps or floors. Interest-rate caps and payer swaptions appreciate in value as interest rates rise and as interest-rate volatility increases, offsetting the decrease in market value of the mortgage loans. Interest-rate floors and receiver swaptions appreciate in value as interest rates fall and as interest-rate volatility increases, offsetting the prepayment risk of the mortgage loans, which increases when rates fall.
We manage and measure the interest-rate and prepayment risk exposures of the mortgage loans and the associated debt and other financial obligations on an overall basis with all other assets, liabilities, and other financial obligations. We use a variety of risk measurement methods and techniques, including duration of equity, key-rate duration-of-equity mismatch, convexity of equity, and market value of equity sensitivity. Each of these methods provides different analytical information that we use to manage our interest-rate risks. We take rebalancing actions based on a number of factors that include these measurement methods. For further discussion, see “Part II. Item 7A. Quantitative and Qualitative Disclosures About Market Risk.”
Although we utilized a variety of measures, including some of those described above, to manage both the interest-rate risk and the prepayment risk on the mortgage loans we purchased under the MPP, we were only partially successful in managing these risks. As we describe in more detail under “Part II. Item 7. Management’s Discussion and Analysis of Financial Condition and Results of Operations—Overview—Historical Operations,” we did not successfully anticipate either the interest-rate volatility or the rapid rate of prepayments that we experienced in 2004 and 2003. The fact that the MPP exposed us to these risks accounted in part for the decline in our earnings in 2005 and 2004 and contributed to our decision to exit the MPP. The sale of $1.4 billion of government-insured mortgage loans in August 2005 reduced both our interest-rate risk and our prepayment risk on our mortgage loans held for portfolio.
Investments
We maintain a portfolio of short- and long-term-to-maturity investments for liquidity purposes and to generate income on member capital. Our liquidity portfolio consists of short-term investments issued by highly rated institutions. Our short-term investments generally include overnight and term federal funds, repurchase agreements, interest-bearing certificates of deposit, and commercial paper. We also maintain a longer-term investment portfolio, which includes consolidated obligations of other FHLBanks, securities issued by U.S. government agencies, and debentures and mortgage-backed securities that are issued by other GSEs or that carry the highest credit ratings from Moody’s or Standard & Poor’s. The U.S. government does not guarantee,
17
directly or indirectly, the consolidated obligations or other obligations of any of the FHLBanks, or the securities or debt obligations of other GSEs such as Fannie Mae and Freddie Mac.
The Seattle Bank does not have any specific policy covering the level of investments it may make in its members or their affiliates compared to nonmembers. In general, the Seattle Bank makes investment decisions as to securities of members and their affiliates in accordance with its policies applicable to all investments, which reflect the regulatory restrictions and the credit-risk management policies described below. For short-term investments only, our credit-risk management policies permit the Seattle Bank to require a higher standard of credit quality for nonmembers and affiliates of members than for members. For example, for short-term investments in nonmembers or affiliates of members we may require higher minimum long-term credit ratings than for counterparties that are members, and require nonmembers or affiliates of members to hold higher amounts of tier-one capital (or equivalent capital measurement) than counterparties that are members. The Seattle Bank believes that the difference in these criteria for short-term investments in members is justified by the fact that the Seattle Bank has a blanket security interest in certain assets of its members.
When we refer to mortgage-backed securities in this report, we mean both collateralized mortgage obligations and mortgage-backed pass-through securities. Mortgage-backed pass-through securities are securities issued by Fannie Mae, Freddie Mac, or Ginnie Mae. Collateralized mortgage obligations are mortgage-backed securities where the underlying pools of mortgage loans have been separated into different maturity classes. Collateralized mortgage obligations may be issued by the above GSEs, Ginnie Mae, or private issuers. When we refer to mortgage-based assets, we mean mortgage-backed securities as defined above, plus mortgage loans purchased through the MPP.
As of December 31, 2006, our long-term investment portfolio totaled $13.7 billion. The table below provides our investments by type and credit rating as of December 31, 2006.
| | | | | | | | | | | | |
| | | Long-Term Rating | | Total |
As of December 31, 2006 | | AAA or
Government
Agency | | AA | | Unrated | |
| (dollars in thousands) | | | | | | | | |
Consolidated obligation bonds of other FHLBanks | | $ | 4,224,959 | | $ | | | $ | | | $ | 4,224,959 |
Other U.S. agency obligations | | | 146,298 | | | | | | | | | 146,298 |
Government-sponsored enterprise obligations (excluding consolidated obligations of other FHLBanks and mortgage-backed securities)* | | | 2,661,622 | | | | | | 29,616 | | | 2,691,238 |
State or local housing investments | | | 4,987 | | | 7,080 | | | | | | 12,067 |
Mortgage-backed securities | | | 6,613,347 | | | | | | | | | 6,613,347 |
| | | | | | | | | | | | |
Total long-term investment securities | | $ | 13,651,213 | | $ | 7,080 | | $ | 29,616 | | $ | 13,687,909 |
| | | | | | | | | | | | |
Further detail of mortgage-backed securities | | | | | | | | | | | | |
Collateralized mortgage obligations: | | | | | | | | | | | | |
Fannie Mae | | | 666,378 | | | | | | | | | 666,378 |
Freddie Mac | | | 1,004,330 | | | | | | | | | 1,004,330 |
Private issuer | | | 4,826,508 | | | | | | | | | 4,826,508 |
| | | | | | | | | | | | |
Subtotal | | $ | 6,497,216 | | | | | | | | $ | 6,497,216 |
| | | | | | | | | | | | |
Mortgage-backed pass-through securities | | | | | | | | | | | | |
Fannie Mae | | | 91,761 | | | | | | | | | 91,761 |
Freddie Mac | | | 17,407 | | | | | | | | | 17,407 |
Ginnie Mae | | | 6,963 | | | | | | | | | 6,963 |
| | | | | | | | | | | | |
Subtotal | | | 116,131 | | | | | | | | | 116,131 |
| | | | | | | | | | | | |
Total mortgage-backed securities | | $ | 6,613,347 | | | | | | | | $ | 6,613,347 |
| | | | | | | | | | | | |
| * | These primarily include Fannie Mae and Freddie Mac debentures. |
18
Prohibited Investments. Under federal regulation, we are prohibited from investing in certain types of securities, including:
| | • | | instruments, such as common stock, that represent an ownership in an entity, other than stock in small business investment companies or certain investments targeted to low-income persons or communities; |
| | • | | instruments issued by non-U.S. entities, other than those issued by U.S. branches and agency offices of foreign commercial banks; |
| | • | | non-investment-grade debt instruments, other than certain investments targeted to low-income persons or communities and instruments that were downgraded after purchase by the Seattle Bank; |
| | • | | whole mortgages or other whole loans, other than: |
| | o | those acquired under the MPP, |
| | o | certain investments targeted to low-income persons or communities, |
| | o | certain marketable direct obligations of state, local, or tribal government units or agencies, having at least the second-highest credit rating from a nationally recognized statistical rating organization, or NRSRO, such as Moody’s or Standard & Poor’s, at the time of purchase, |
| | o | mortgage-based securities or asset-backed securities backed by manufactured housing loans or home equity loans, and |
| | o | certain foreign housing loans authorized under section 12(b) of the FHLBank Act; and |
| | • | | non-U.S. dollar denominated securities. |
Finance Board regulations further limit our investment in mortgage-backed securities and mortgage-related asset-backed securities (such as those backed by home equity loans or Small Business Administration loans) by requiring that the total book value of such securities owned by us not exceed 300% of our previous month-end capital on the day we purchase the securities. In addition, we are prohibited from purchasing:
| | • | | interest-only or principal-only mortgage-backed securities; |
| | • | | residual-interest or interest-accrual classes of collateralized mortgage obligations and real estate mortgage investment companies; and |
| | • | | fixed interest-rate or variable interest-rate mortgage-backed securities at interest rates equal to their contractual cap that, on the trade date, have average lives that vary by more than six years under an assumed instantaneous interest-rate change of 300 basis points. |
Additional Restrictions. Money market issuers and obligors must have long-term ratings of at least “A3” by Moody’s or “A-” by Standard & Poor’s and maintain certain capital measurements. Member bank counterparties must have a minimum long-term credit rating of “Baa” by Moody’s or “BBB-” by Standard & Poor’s and meet other capital measurements.
Our investments in direct obligations of U.S. government-sponsored agencies or instrumentalities other than the other FHLBanks are limited to the lower of 100% of our total capital or the issuer’s total capital.
Pursuant to a regulatory interpretation issued by the Finance Board in March 2005, the Finance Board clarified that it generally prohibits a FHLBank from purchasing any FHLBank consolidated obligation as part of the consolidated obligation’s initial issuance, either directly from the Office of Finance or indirectly through an underwriter. In 2004 and 2003, we purchased consolidated obligations of other FHLBanks with funds received primarily from the issuance of consolidated obligations on which we are the primary obligor and from accumulated cash from the maturity and nonrenewal of advances and the prepayment of mortgage-backed assets. By issuing debt with differing maturities and payment terms from the investments we were contemporaneously purchasing, we attempted to earn a favorable spread over our cost of funding on these investments. Nearly 90% of the aggregate amount of the consolidated obligations of other FHLBanks that we purchased was callable, but the debt issued contemporaneously was largely noncallable.
19
Of the $9.0 billion in callable debt of other FHLBanks that we purchased in 2004 and 2003, $4.8 billion had matured, had been called, or had been sold as of December 31, 2006. Although in 2006 we extinguished $283.1 million of the long-term fixed interest-rate debt that had been issued contemporaneously with the bond investments that were called, we continue to carry much of that debt at interest rates that, in some cases, are above our current cost for issuing such debt. We are unable to reasonably allocate all of the debt issuances that may have been used to fund the purchase of consolidated obligations of other FHLBanks to the purchased debt in order to calculate the actual spreads that resulted from this investment strategy. However, due to the market factors that significantly increased our borrowing cost to replace the short-term debt that funded those investments, and the loss of the favorable interest rate on the portion of the callable debt that was actually called, we believe that any favorable spreads we may have generated at the inception of this strategy are now mostly negative. Accordingly, this investment strategy contributed to the $245.0 million and $363.1 million in unrealized market value losses that we reported as of December 31, 2006 and 2005. The amount of these unrealized losses involves estimates of the market values of our assets, liabilities, and commitments, which we discuss in greater depth in Note 17 in “Part II. Item 8. Financial Statements and Supplementary Data—Audited Financial Statements—Notes to Financial Statements.”
The following table summarizes the outstanding balance of our consolidated obligations on which another FHLBank is the primary obligor as of December 31, 2006.
| | | | | | | | | | |
Time Period of Purchase | | Purchase
Amount | | Amount
Maturing in
2007 | | Type of
Consolidated
Obligation | | Initial Funding Source |
| (dollars in thousands) | | | | | | | | |
Q3 2003 – Q3 2004 | | $ | 2,649,959 | | $ | 869,000 | | Callable | | Bullet consolidated obligation bonds |
Q4 2003 – Q3 2004 | | | 744,000 | | | 741,000 | | Callable | | Cash and consolidated obligation discount notes |
Q3 2004 | | | 331,000 | | | 90,000 | | Callable | | Callable consolidated obligation bonds |
Q3 2004 | | | 500,000 | | | | | Non-callable | | Bullet consolidated obligation bonds |
| | | | | | | | | | |
Total | | $ | 4,224,959 | | $ | 1,700,000 | | | | |
| | | | | | | | | | |
Management of Credit Risk. We periodically review the financial condition of unsecured investment counterparties to verify that our investments and asset classifications are appropriate from our risk management perspective. For domestic banks and thrifts, this process includes monitoring and analysis of earnings, asset quality, regulatory leverage ratios, stock prices, and credit spread. These institutions are also evaluated with a statistically based default probability model. A securities broker-dealer with whom we transact business must be listed as a Federal Reserve Bank of New York Primary Dealer or as an FHLBank Approved Underwriter, or be an affiliate of a Seattle Bank member with capital in excess of $100 million. The financial performance of other institutions, such as foreign banks or commercial paper counterparties, is monitored using the credit watch lists of Moody’s, Standard & Poor’s, and Fitch ratings services. In addition, we receive daily information on credit rating actions, watch-list status changes, and other pertinent data to ensure that changes in our investment counterparties’ financial condition are monitored in a timely manner.
Interest-Rate Exchange Agreements
Finance Board regulations establish guidelines for use of interest-rate exchange agreements by FHLBanks. These regulations generally enable the FHLBanks to enter into interest-rate exchange agreements only to reduce the market-risk exposures inherent in otherwise unhedged assets and funding positions. Accordingly, we can use interest-rate swaps, swaptions, interest-rate cap and floor agreements, futures and forward contracts, and options on futures and forward contracts (collectively, interest-rate exchange agreements) in our interest-rate risk management strategies. Finance Board regulations prohibit trading of or the speculative use of these instruments and limit our ability to incur credit risk through use of these instruments.
20
We generally enter into interest-rate exchange agreements to manage our exposure to changes in interest rates, and these agreements are an integral component of our risk management activities. Interest-rate exchange agreements provide a flexible and cost-effective means to adjust our risk profile in response to changing market conditions. The majority of our interest-rate exchange agreements are putable or callable swaps that are provided by numerous swap counterparties.
We use interest-rate exchange agreements to manage our risk in two ways:
| | • | | As fair value hedges of underlying financial instruments, including advances and consolidated obligations. A fair value hedge is a transaction where, assuming specific criteria identified in U.S. GAAP are met, the changes in fair value of a derivative instrument and a corresponding hedged item are recorded to income. For example, we use interest-rate exchange agreements to adjust the interest-rate sensitivity of consolidated obligations to approximate more closely the interest-rate sensitivity of assets, including advances. |
| | • | | To manage risks in a group of assets or liabilities. For example, we purchase interest-rate caps as insurance for our consolidated obligations to protect against rising interest rates. As short-term interest rates rise, the cost of issuing short-term consolidated obligations increases. We begin to receive payments from our counterparty when interest rates rise above a pre-defined rate, thereby “capping” the effective cost of issuing the consolidated obligations. |
Our interest-rate exchange agreement counterparties are highly regulated financial institutions or broker-dealers with a credit rating of at least “A” or equivalent from Moody’s or Standard & Poor’s. We also have collateral agreements and bilateral netting arrangements with all of our swap counterparties. In the event the market value exposure of an interest-rate swap exceeds a predetermined amount, based on the counterparty’s credit rating, the counterparty is required to collateralize the excess amount. Similarly, we must post collateral in the event the counterparty is exposed to us in excess of a pre-determined amount. Only cash and highly liquid securities are eligible to be used as collateral for interest-rate exchange agreements. We receive daily information on rating actions, watch-list status changes, and other pertinent data to help us monitor changes in the financial condition of the counterparties to our interest-rate exchange agreements. In addition, on a quarterly basis, we monitor the credit watch lists of Moody’s, Standard & Poor’s, and Fitch to determine the status of any of our counterparties on these lists.
For more information about the interest-rate exchange agreements and related instruments we use, see “Part II. Item 7. Management’s Discussion and Analysis of Financial Condition and Results of Operations—Summary of Critical Accounting Policies and Estimates” and “Part II. Item 7A. Quantitative and Qualitative Disclosures About Market Risk.”
Deposits
The FHLBank Act allows us to accept deposits from: (i) our members, (ii) any institution for which we provide correspondent services, such as safekeeping services, (iii) other FHLBanks, and (iv) other government instrumentalities. Deposit programs provide some of our funding resources, while giving our members and certain other eligible depositors a low-risk earning asset that helps to satisfy their regulatory liquidity requirements. We offer demand and term deposit programs to our members and to other eligible depositors, such as approved nonmember borrowers. Demand deposits comprised 92.2% of our $1.0 billion of total deposits as of December 31, 2006.
As of December 31, 2006, we were in compliance with the FHLBank Act, which requires us to have an amount equal to our current deposits invested in obligations of the U.S. government, deposits in eligible banks or trust companies, or advances with a maturity not exceeding five years.
21
Other Fee-Based Services
We offer a number of fee-based services to our members, including securities safekeeping, and other miscellaneous services. These services do not generate material amounts of income and are primarily performed as ancillary services to our members.
Sales and Marketing
We market traditional member finance products and services to our members through a direct sales force of relationship managers, who build consultative partnerships with members to improve the profitability of both our members and the Seattle Bank. Our relationship managers meet with assigned members to understand their short- and long-term business needs, and then provide information and make suggestions about the Seattle Bank’s products and tools that can help members attain their business goals. As of December 31, 2006, we had four relationship managers.
Debt Financing
Consolidated Obligations
Federal regulation governs the issuance of debt on behalf of the Seattle Bank and the other FHLBanks and authorizes the FHLBanks to issue debt through the Office of Finance. FHLBanks are not permitted to issue individual debt without Finance Board approval.
Our primary source of funds is the issuance of consolidated obligations by the Office of Finance on behalf of the FHLBanks. The Office of Finance issues two primary types of consolidated obligations: (i) consolidated obligation bonds with maturities of four months to 30 years and (ii) consolidated obligation discount notes with maturities up to 365 days. Although individual FHLBanks are primarily liable for the portion of consolidated obligations corresponding to the proceeds received by that FHLBank, each FHLBank is also jointly and severally liable with the other 11 FHLBanks for the payment of principal and interest on all consolidated obligations. Under Finance Board regulations, if the principal or interest on any consolidated obligation issued on behalf of one of the FHLBanks is not paid in full when due, then the FHLBank responsible for the payment may not pay dividends to, or redeem or repurchase shares of stock from, any member of the FHLBank. The Finance Board, at its discretion, may require any FHLBank to make principal or interest payments due on any consolidated obligations, whether or not the primary obligor FHLBank has defaulted on the payment of that obligation.
To the extent that an FHLBank makes any payment on a consolidated obligation on behalf of another FHLBank, the paying FHLBank shall be entitled to reimbursement from the FHLBank otherwise responsible for the payment. However, if the Finance Board determines that an FHLBank is unable to satisfy its obligations, then the Finance Board may allocate the outstanding liability among the remaining FHLBanks on a pro rata basis in proportion to each FHLBank’s participation in all consolidated obligations outstanding, or on any other basis the Finance Board may determine. The Finance Board has never required the Seattle Bank to repay obligations in excess of our participation nor have they allocated to the Seattle Bank any outstanding liability of any other FHLBank’s consolidated obligations. Consolidated obligations are not obligations of the United States, and the U.S. government does not guarantee them, directly or indirectly.
In addition, in June 2006, the FHLBanks entered into the Federal Home Loan Banks P&I Funding and Contingency Plan Agreement, or the Contingency Agreement, effective as of July 20, 2006. The FHLBanks and the Office of Finance entered into the Contingency Agreement in response to the Board of Governors of the Federal Reserve System revising its Policy Statement on Payments System Risk concerning the disbursement by the Federal Reserve Banks of interest and principal payments on securities issued by GSEs, such as the FHLBanks. Under the Contingency Agreement, in the event that one or more FHLBanks does not fund its principal and interest payments under a consolidated obligation by deadlines agreed upon by the FHLBanks, the
22
other FHLBanks will be responsible for those payments in the manner described in the Contingency Agreement. We have not funded any consolidated obligation principal and interest payments under the Contingency Agreement.
Consolidated obligation amounts on which we are primarily liable are recorded as liabilities on our Statements of Condition. Consolidated obligations on which we are the primary obligor outstanding as of December 31, 2006 and 2005, are shown in the table below.
| | | | | | |
| | | As of December 31, |
Consolidated Obligation Balances | | 2006 | | 2005 |
| (dollars in thousands) | | |
Consolidated Obligations | | | | | | |
Bonds | | $ | 48,040,715 | | $ | 37,881,557 |
Discount notes | | | 1,495,861 | | | 10,620,951 |
| | | | | | |
Total | | $ | 49,536,576 | | $ | 48,502,508 |
| | | | | | |
Federal regulation requires each FHLBank to maintain the following types of assets, free from any lien or pledge, in an amount at least equal to its consolidated obligations outstanding:
| | • | | obligations of, or fully guaranteed by, the United States; |
| | • | | mortgage loans that have any guaranty, insurance, or commitment from the United States or any U.S. agency; |
| | • | | investments described in Section 16(a) of the FHLBank Act, which, among other items, include securities that a fiduciary or trust fund may purchase under the laws of the state in which the FHLBank is located; and |
| | • | | other securities that are rated “AAA” or equivalent by an NRSRO. |
The following table presents our compliance with this requirement as of December 31, 2006 and 2005.
| | | | | | |
| | | As of December 31, |
Aggregate Qualifying Assets | | 2006 | | 2005 |
| (dollars in thousands) | | |
Outstanding debt | | $ | 49,536,576 | | $ | 48,502,508 |
Aggregate qualifying assets | | | 53,337,012 | | | 52,083,267 |
23
The following table presents the ratio of our earnings to our fixed charges for the five years ended December 31, 2006.
| | | | | | | | | | | | | | | |
| | | For Years Ended December 31, |
Computation of Earnings to Fixed Charges | | 2006 | | 2005 | | 2004 | | 2003 | | 2002 |
| (dollars in thousands) | | |
Earnings | | | | | | | | | | | | | | | |
Income before assessments and cumulative effect of change in accounting principle | | $ | 35,087 | | $ | 2,512 | | $ | 112,591 | | $ | 195,686 | | $ | 200,187 |
Fixed charges | | | 2,456,559 | | | 1,865,428 | | | 1,518,087 | | | 1,365,595 | | | 1,421,910 |
| | | | | | | | | | | | | | | |
Earnings available for fixed charges | | $ | 2,491,646 | | $ | 1,867,940 | | $ | 1,630,678 | | $ | 1,561,281 | | $ | 1,622,097 |
| | | | | |
Fixed Charges | | | | | | | | | | | | | | | |
Interest expense on consolidated obligations | | $ | 2,413,097 | | $ | 1,822,266 | | $ | 1,502,956 | | $ | 1,346,725 | | $ | 1,390,605 |
Interest expense on deposits and borrowings | | | 42,876 | | | 41,863 | | | 14,387 | | | 18,408 | | | 30,848 |
Interest portion of rental expense* | | | 586 | | | 1,299 | | | 764 | | | 462 | | | 457 |
| | | | | | | | | | | | | | | |
Fixed charges | | $ | 2,456,559 | | $ | 1,865,428 | | $ | 1,518,107 | | $ | 1,365,595 | | $ | 1,421,910 |
Ratio of earnings to fixed charges | | | 1.01 | | | 1.00 | | | 1.07 | | | 1.14 | | | 1.14 |
| * | The interest portion of rental expense does not include a write-off of lease abandonment costs of $5.4 million in 2005 or a $1.0 million recovery in 2006 of the 2005 lease abandonment costs due to adjustments in projected future rental rates. |
Office of Finance
As set forth by federal regulation, the Office of Finance, a joint office of the FHLBanks created by the Finance Board, has responsibility for facilitating and approving the issuance of consolidated obligations on behalf of and as agent for the FHLBanks. The Office of Finance also:
| | • | | services all outstanding consolidated obligations; |
| | • | | serves as a source of information for FHLBanks on capital market developments; |
| | • | | markets the FHLBank System’s debt on behalf of the FHLBanks; |
| | • | | selects and evaluates underwriters; |
| | • | | prepares annual and quarterly reports of the FHLBanks’ combined financial results; |
| | • | | administers the Resolution Funding Corporation, or REFCORP, and the Financing Corporation, the entity that services REFCORP’s debt instruments; and |
| | • | | manages the FHLBanks’ relationships with the rating agencies with regard to consolidated obligations. |
24
Types of Consolidated Obligations
Consolidated Obligation Bonds
We use the proceeds from our allocated portion of consolidated obligation bonds primarily to provide advances to members and to fund our investment portfolio, and we used them historically to fund our MPP. Typically, the maturities of these bonds range from one to 30 years, although the maturities are not subject to any statutory or regulatory limits. The bonds can have fixed or adjustable interest rates and can be callable or non-callable. In the event that the interest rate of a bond is swapped with an interest-rate exchange agreement, the interest-rate exchange agreement is the sole responsibility of the specific FHLBank and is not a joint and several obligation of the FHLBank System.
Consolidated obligation bonds are issued in a variety of ways.
Daily Auction. Bonds may be competitively auctioned on a daily basis through a dealer network either in a callable auction for fixed interest-rate, continuously callable (American-style) bonds or through the TAP issue program for non-callable bullet bonds. The TAP issue program aggregates smaller issues with the same maturities into a larger bond issue that reopens or “taps” into the CUSIP number of a previously issued group of bonds. Bonds issued in daily auctions are generally in at least $10 million increments, although smaller issuances may be permitted.
Negotiation. Bonds can be individually negotiated transactions, using the services of one or more underwriters. Typically, negotiated bonds are European-style or Bermudan-style callable (one-time or periodic calls) or structured bonds that may be issued simultaneously with an interest-rate exchange agreement. Structured bonds include bonds with customized features, such as coupons that step up, or increase, in the future or bonds whose principal payment is indexed to the principal payment of a specified mortgage-backed security.
Global Debt Program. The FHLBank System has a global debt program in which bonds are issued through a syndicate of dealers, or a single dealer, to domestic and international investors in issue sizes ranging from $500 million to $5 billion.
The majority of our consolidated obligation bonds are fixed interest-rate, non-callable bonds sold through the TAP issue program, or negotiated callable consolidated obligations. At times, rather than auctioning new debt on which we are primarily liable, we may negotiate with another FHLBank to transfer existing debt to us. We may do so when the terms or yield of the transferred debt are more favorable than we can obtain through the daily auction process. For example, this may occur when the type of consolidated obligation bond available from another FHLBank is issued in the lower-cost global debt program, where the bonds trade in a more liquid market than exists for other FHLBank programs, or when the term to maturity on a consolidated obligation bond available from another FHLBank matches more closely the term of the asset to be funded than those of the consolidation obligation bonds available in the daily auction.
Because each FHLBank seeks to manage its market risk within its risk management framework, the opportunity to acquire debt from other FHLBanks on favorable terms is generally limited. If a FHLBank finds that it is primarily liable for a type of consolidated obligation bond with terms that do not meet its risk management objectives, it may inquire whether any other FHLBank requires the particular type of consolidated obligation bond. For example, if a FHLBank has ten-year non-callable consolidated obligation bonds in excess of the advances or mortgages loans that it funded with the proceeds because a portion of the related advances or mortgage loans was repaid, it may inquire whether any other FHLBank requires this type of consolidated obligation bond. If the current yield on the bond is attractive, a second FHLBank may enter into a transfer transaction with the first FHLBank rather than having the FHLBank System issue additional ten-year non-callable debt on its behalf. Our ability to acquire transferred debt depends entirely upon circumstances at other FHLBanks, therefore we cannot predict when this funding alternative may be available to us.
25
In circumstances where we acquire transferred debt from another FHLBank, we negotiate a transfer price directly with the transferring FHLBank. We generally acquire transferred debt with a two-day forward settlement. At settlement, we assume the payment obligations on the transferred debt and receive a cash payment equal to the net settlement value of par, discount or premium, and accrued interest, and notify the Office of Finance of a change in primary obligor for the transferred debt. In 2006, we did not participate in the transfer of consolidated obligation bonds. In 2005, consolidated obligation bond transfers from other FHLBanks totaled $1.4 billion of par value, with $31.6 million of associated bond discount. In general, we acquired the transferred debt at spreads between zero and seven basis points below the costs we would have incurred to have new debt issued on our behalf at the time of the debt transfer transaction. We believe that the transfer price paid by the transferring FHLBank takes into account its related costs, including any hedge termination fees that it may incur. We do not receive any additional amounts relating to hedge termination fees. In addition, it has not been our practice to assume any associated interest-rate exchange agreements in conjunction with our consolidated obligation bond transfers.
We use fixed interest-rate, callable and non-callable bonds to fund our fixed interest-rate assets, such as advances, MPP, and investments. We also participate in callable debt that is simultaneously swapped to LIBOR, resulting in low-cost financing to support advances. For swapped debt, we negotiate directly with one or more underwriters and swap counterparties and present the debt to the Office of Finance for their approval and issuance. Due to the increase in our mortgage-based assets in previous years, we increased our reliance on unswapped callable debt in 2005 to hedge the prepayment risk embedded in our mortgage-based assets.
Consolidated Obligation Discount Notes
We generally use the proceeds of our allocated portion of consolidated discount notes to provide short-term funds for advances to members for short-term investments, and other funding needs. These securities are sold at a discount and mature at par, with maturities up to 365 days.
Discount notes can be issued in three ways:
| | • | | through bi-weekly competitive auctions of one-, two-, three-, and six-month terms administered by the Office of Finance, where any FHLBank can request an amount to be issued and the price is determined by the market; |
| | • | | through the Office of Finance’s window program, where any FHLBank can offer a specified amount of discount notes at a maximum rate and a specified term of up to 365 days through a 16-member consolidated obligation discount-note selling group of broker-dealers; and |
| | • | | through reverse inquiry, where a dealer requests a specified amount of discount notes be issued for a specific date and price. In the case of reverse inquiries, the Office of Finance discloses these inquiries to the FHLBanks, which may or may not choose to issue the discount notes with the requested terms. |
26
Liability for Consolidated Obligations
The consolidated obligations on which we are the primary obligor represented the following amounts and percentages of the aggregate par value of outstanding consolidated obligations for the FHLBank System as of December 31, 2006 and 2005.
| | | | | | | | |
| | | As of December 31, | |
FHLBank System and Seattle Bank Consolidated Obligations | | 2006 | | | 2005 | |
| (dollars in millions) | | | | | | |
Aggregate par value of FHLBank System consolidated obligation bonds | | $ | 793,868 | | | $ | 757,024 | |
Par value of consolidated obligation bonds for which the Seattle Bank is the primary obligator | | $ | 48,221 | | | $ | 38,086 | |
Percentage of consolidated obligation bonds for which the Seattle Bank is the primary obligator | | | 6.07 | % | | | 5.03 | % |
Aggregate par value of FHLBank System consolidated obligation discount notes | | $ | 158,122 | | | $ | 180,350 | |
Par value of consolidated obligation discount notes for which the Seattle Bank is the primary obligator | | $ | 1,497 | | | $ | 10,646 | |
Percentage of consolidated obligation discount notes for which the Seattle Bank is the primary obligator | | | 0.95 | % | | | 5.90 | % |
Rating Agency Actions
In December 2004, Standard & Poor’s lowered our long-term counterparty rating from “AAA” to “AA+,” citing concerns about the Written Agreement, our lower profitability, and the impact of growing mortgage-based asset portfolios on our risk profile. This rating was reaffirmed in April 2005, and, at the same time, Standard & Poor’s changed our ratings outlook from stable to negative, citing our lower profitability as a key reason for the outlook adjustment. Although Standard and Poor’s revised our outlook to stable from negative in January 2007, it has maintained a negative outlook rating and long-term counterparty credit rating of AA+ for certain other FHLBanks. Individual FHLBank ratings do not necessarily impact the credit rating of the consolidated obligations issued by the Office of Finance on behalf of the FHLBanks. Currently, Standard & Poor’s rates the FHLBank System’s long-term and short-term consolidated obligations “AAA/A-1+” and Moody’s rates them “Aaa/P-1.”
Rating agencies may, from time to time, change a rating because of various factors, including operating results or actions taken, business developments, or changes in their opinion regarding, among other things, the general outlook for a particular industry or the economy. We cannot provide assurance that Standard & Poor’s, Moody’s, or other rating agencies will not reduce our ratings or those of the FHLBank System or any other FHLBank in the future.
Regulation
General
We are supervised and regulated by the Finance Board, which is an independent agency in the executive branch of the U.S. government. We are subject to the FHLBank Act and the rules and regulations promulgated under that Act and issued by the Finance Board.
Oversight, Audits and Examinations
Oversight
The Finance Board, the FHLBanks’ supervisor and regulator, is charged with ensuring that we carry out our housing and community development finance mission and remain adequately capitalized, and are able to raise funds in the financial markets and to operate in a safe and sound manner. The Finance Board has five members.
27
Four Finance Board members are appointed by the President of the United States, with the advice and consent of the U.S. Senate, to serve seven-year terms. The fifth member of the Finance Board is the Secretary of the Department of Housing and Urban Development, or the Secretary’s designee. The Finance Board is supported by assessments paid by the 12 FHLBanks. No tax revenues or other appropriations support operations of the Finance Board or the FHLBanks.
In carrying out its responsibilities, the Finance Board establishes rules and regulations governing the operations of FHLBanks. To assess our safety and soundness, the Finance Board conducts on-site examinations, at least annually, as well as other periodic reviews. Additionally, we are required to submit monthly information on our financial condition and results of operations to the Finance Board.
Audits and Examinations
As required by federal regulation, we have an internal audit department and an audit committee of our Board. An independent registered public accounting firm registered with the Public Company Accounting Oversight Board, or the PCAOB, audits our annual financial statements. Our independent registered public accounting firm must adhere to PCAOB and Government Auditing Standards, as issued by the U.S. Comptroller General, when conducting our audits. Our Board, our senior management, and the Finance Board all receive these audit reports. In addition, we must submit annual management reports to Congress, the President of the United States, the Office of Management and Budget, and the Comptroller General. These reports contain a statement of financial condition, a statement of operations, a statement of cash flows, a statement of internal accounting and administrative control systems, and the report of the independent registered public accountants on the financial statements.
The Comptroller General has authority under the FHLBank Act to audit or examine the Finance Board and any FHLBank, and to decide the extent to which these entities fairly and effectively fulfill their purposes under the FHLBank Act. Furthermore, the Government Corporations Control Act provides that the Comptroller General may review any audit of the financial statements conducted by an independent public accounting firm. If the Comptroller General conducts such a review, then it must report the results and provide recommendations to Congress, the Office of Management and Budget, and the FHLBank in question. The Comptroller General also may conduct an audit of any financial statements of a FHLBank.
Written Agreement and Business Plan
On December 10, 2004, under the oversight of a special committee of our Board and with our Board’s approval, we entered into the Written Agreement with the Finance Board that imposed certain requirements on us intended to strengthen our risk management, capital structure, corporate governance, and Capital Plan. We operated under the Written Agreement until the Office of Supervision Director, or OS Director, terminated the agreement on January 11, 2007.
Our Board was responsible for monitoring and coordinating our compliance with the terms of the Finance Board agreement. The Written Agreement required us to:
| | • | | develop an action plan, which had to be acceptable to the Office of Supervision, to address findings presented by the Finance Board during its 2004 annual examination of the Seattle Bank; |
| | • | | submit to the Office of Supervision monthly reports on our progress in addressing the requirements of the action plan; |
| | • | | develop a business plan acceptable to the Office of Supervision and that, among other things: |
| | ¡ | | did not increase the market, credit, or operational risk profiles of the Seattle Bank, |
| | ¡ | | specified a minimum regulatory capital-to-assets ratio that was consistent with the business strategy presented in the business plan, and |
| | ¡ | | established appropriate capital stock, retained earnings, and dividend policies; |
28
| | • | | engage a consultant to conduct an independent review of the Seattle Bank’s senior management and the Board’s oversight and respond to any recommendations of the independent consultant; and |
| | • | | engage a consultant to conduct an independent review of our risk management policies, procedures, and practices and respond to any recommendations of the independent consultant. |
In addition, the Written Agreement:
| | • | | provided that, during the term of the agreement, the Office of Supervision could reject our hiring of any senior management candidate; |
| | • | | prohibited us from increasing our mortgage loan assets held for portfolio (i.e., purchased from our members through the MPP) by an amount in excess of 10% of the net book value of such assets as of November 18, 2004, which was $10.6 billion, unless the Office of Supervision agrees otherwise; and |
| | • | | prohibited us from acquiring any additional consolidated obligations for which another FHLBank is the primary obligor without Finance Board approval. |
Pursuant to the Written Agreement, in April 2005, we submitted our business plan to the Finance Board. In May 2005, the Finance Board accepted our business plan, subject to our adoption of certain dividend and stock repurchase restrictions. See “Part II. Item 7. Management’s Discussion and Analysis of Financial Condition and Results of Operations–Capital Resources and Liquidity—Capital Resources—Seattle Bank Stock,” for more information regarding dividend limitations and stock repurchase restrictions.
To implement the business plan, we undertook significant changes to our business, operations and capital policies, including:
| | • | | replacing our senior management team; |
| | • | | refocusing our strategic direction and marketing efforts on advances; |
| | • | | beginning our exit from the MPP; |
| | • | | substantially upgrading our tools, personnel and processes for managing risk; |
| | • | | substantially reducing our operating expenses primarily through reductions in staff and facilities costs; |
| | • | | implementing a hedging program to manage the risks inherent in our business; and |
| | • | | adopting changes to our Capital Plan to encourage members to take out advances by providing flexibility in the capital stock they can use to support advances. |
Although the Written Agreement was terminated in January 2007, we continue to operate under certain parts of the business plan and various related Board resolutions, including certain dividend limitations and Class B stock repurchase restrictions. Consistent with those limitations and based on our operating results, in December 2006 we paid our first dividend since early 2005. See “Part II. Item 7. Management’s Discussion and Analysis of Financial Condition and Results of Operations—Capital Resources and Liquidity—Capital Resources,” and “Item 1A. Risk Factors,” for more information.
Capital Requirements
For details regarding our capital requirements, see “Part II. Item 7. Management’s Discussion and Analysis of Financial Condition and Results of Operations—Capital Resources and Liquidity—Capital Resources—Statutory Capital Requirements.”
Liquidity Requirements
We are required to maintain liquidity in accordance with federal law and regulations and policies established by our Board. These regulations establish two liquidity requirements: a deposit liquidity requirement and a contingency liquidity requirement.
29
Statutory Deposit Reserve Requirement. The FHLBank Act requires us to hold: (i) investments in obligations of the U.S. government and its agencies, (ii) deposits in eligible banks or trust companies, or (iii) advances with a maturity not exceeding five years, the sum of which must equal or exceed the amount of our current deposits. The following table shows the minimum amounts required to be held, which we refer to as member demand deposits, under this requirement and the amounts we actually maintained, which we refer to as deposit reserves, as of December 31, 2006 and 2005.
| | | | | | |
| | | As of December 31, |
Statutory Deposit Reserve Requirement | | 2006 | | 2005 |
| (dollars in thousands) | | | | |
Deposit reserves | | $ | 25,488,713 | | $ | 19,450,489 |
Member demand deposits | | | 1,003,960 | | | 800,820 |
Contingency Liquidity Requirements. Contingency liquidity requirements are intended to ensure that we have sufficient sources of funding to meet our operations requirements when our access to consolidated obligations is impeded for a maximum of five business days. We calculate our net contingency liquidity position as the difference between contingency liquidity sources and contingency liquidity needs. Contingency liquidity sources include: (i) cash, (ii) self-liquidating assets, (iii) the borrowing capacity of securities available for repurchase or sale, and (iv) irrevocable lines of credit from financial institutions rated not lower than the second highest NRSRO credit rating. Contingent liquidity needs include: (i) advance commitments, (ii) maturing federal funds and repurchase agreement liabilities, (iii) maturing consolidated obligations, (iv) callable consolidated obligations that are “in-the-money,” (v) mortgage loan commitments, (vi) securities settlements, and (vii) a forecast of other contingent obligations. We have satisfied our contingency liquidity requirements if the contingent liquidity sources exceed or equal the contingent liquidity needs for at least five consecutive business days. We met our contingency liquidity requirements as of December 31, 2006 and 2005.
Operational Liquidity Requirement. Finance Board regulations also require us to establish a day-to-day operational liquidity policy, including a methodology to be used for determining our operational liquidity needs and an enumeration of specific types of investments to be held for such liquidity purposes. Unlike contingency liquidity, operational liquidity includes ongoing access to the capital markets.
Our primary source of liquidity is our ability to participate in the issuance of the FHLBank System’s consolidated obligations. We measure our capacity to participate in consolidated obligations by forecasting our capital-to-assets ratio (or operating leverage ratio), implying that we will likely have access to the capital markets to the extent we meet or exceed our regulatory capital-to-assets ratio. We forecast our daily operating leverage ratio for 30 business days, taking into account our operational liquidity needs and operational liquidity sources.
Operational liquidity needs may include: (i) advance commitments, (ii) maturing federal funds and repurchase agreement liabilities, (iii) maturing consolidated obligations, (iv) callable consolidated obligations that are “in-the-money,” (v) mortgage loan commitments, (vi) securities settlements, and (vii) a forecast of other contingent obligations. Operational liquidity sources include: (i) cash, (ii) self-liquidating assets, (iii) consolidated obligations, (iv) interbank borrowings, (v) maturing advances, and (vi) securities available for repurchase or sale.
We are in compliance with our operational liquidity requirement as long as our forecasted capital divided by our forecast of total assets is greater than or equal to 4.25% for 30 consecutive business days. We met this operational liquidity requirement as of December 31, 2006 and 2005.
30
Resolution Funding Corporation (REFCORP) and Affordable Housing Program (AHP)
Although we are exempt from all federal, state, and local taxation other than real property tax, the Financial Institutions Reform, Recovery and Enforcement Act and the Gramm-Leach-Bliley Act, or GLB Act, require that we, along with the other 11 FHLBanks, support the payment of part of the interest on bonds previously issued by REFCORP. The REFCORP assessment amount is determined by calculating U.S. GAAP net income before the AHP and REFCORP assessments minus the AHP assessment, then multiplying that amount by 20%. The FHLBanks must make REFCORP payments until the total amount of REFCORP assessment payments made is equivalent to a $300 million annual (or $75 million per quarter) annuity that has a final maturity date of April 15, 2030. The Finance Board will shorten or lengthen the period during which the FHLBanks must make payments to REFCORP, depending on actual payments relative to the referenced annuity. In addition, the Finance Board, with the Secretary of the Treasury, selects the appropriate discounting factors used in calculating the annuity.
Any FHLBank with a net loss for a quarter is not required to pay the REFCORP assessment for that quarter. The amount by which the REFCORP payment for any quarter exceeds the $75 million benchmark payment is used to simulate the purchase of zero-coupon Treasury bonds to “defease” all or a portion of the most-distant remaining quarterly benchmark payment. The defeased benchmark payments (or portions thereof) can be reinstated if future actual REFCORP payments fall short of the $75 million benchmark payment in any quarter. If total FHLBank System earnings are insufficient in a quarter to meet the $75 million quarterly benchmark payment, previous quarters’ payments that were used to defease future payment requirements could be used to satisfy the current quarter’s obligation. The FHLBank System has historically exceeded its minimum quarterly obligations. As a result of the REFCORP payments of $684 million made by the FHLBanks in 2006, the overall period during which the FHLBanks must continue to make quarterly payments was shortened to July 15, 2015, effective as of December 31, 2006.
In addition, the FHLBank System must annually set aside for the AHP the greater of $100 million or 10% of its current year’s aggregate regulatory net income. Regulatory net income for AHP assessment purposes is determined by the Finance Board, and is equal to net income reported in accordance with U.S. GAAP before mandatorily redeemable capital stock-related interest expense and AHP assessment, but after REFCORP assessment. In annual periods where a FHLBank’s regulatory net income is zero or less, the FHLBank’s assessment is zero. However, if the total annual 10% contribution provided by the individual FHLBanks is less than the minimum $100 million contribution required for FHLBanks as a whole, the shortfall is allocated among the FHLBanks based upon the ratio of each FHLBank’s income before AHP and REFCORP to the sum of the income before AHP and REFCORP of the 12 FHLBanks combined. REFCORP determines allocation of this shortfall. There was no such shortfall in any of the preceding three years.
In September 2006, the Finance Board adopted a final rule modifying the calculations for the FHLBanks’ required annual AHP contributions. Under the final rule, which became effective on January 1, 2007, each FHLBank’s required annual AHP contribution is limited to its annual net income. Under existing regulation, each FHLBank contributes annually to its AHP program the greater of 10% of its annual net earnings or its pro-rata share of an aggregate of $100 million contributed by all of the FHLBanks, such proration being made on the basis of each FHLBank’s annual net income in relation to all FHLBanks’ annual net income.
The actual amount of the AHP contribution is dependent upon both our regulatory net income minus payments to REFCORP and the income of the other FHLBanks, thus future contributions are not determinable.
Historically, our combined annual assessments for REFCORP and the AHP have been the equivalent of an effective tax rate of 26.5%. As a result of the FHLBank System’s decision to exclude interest expense on mandatorily redeemable Class B stock from the AHP assessment calculation, the effective tax rate could rise slightly, depending on the amount of our mandatorily redeemable Class B stock outstanding and our related interest expense, which is determined based on our Class B dividend rates. We recorded $2.9 million and $6.4 million in our assessments for AHP and REFCORP for the year ended December 31, 2006. The Seattle Bank is entitled to a refund of amounts paid in assessments during a full year that were in excess of its calculated annual
31
obligation at year end. See “Part II. Item 7. Financial Information—Management’s Discussion and Analysis of Financial Condition and Results of Operations—Results of Operations—For the Years Ended December 31, 2006, 2005, and 2004—Assessments,” and Notes 8 and 9 in “Part II. Item 8. Financial Statements and Supplementary Data—Audited Financial Statements—Notes to Financial Statements,” for more information on AHP and REFCORP assessments.
Competition
Advances
Demand for our advances is primarily affected by the cost of other available sources of liquidity for our members. We compete for advance business with other sources of wholesale funding, both secured and unsecured. Other sources of wholesale funding may include investment banks, commercial banks, and other FHLBanks. Smaller members may have limited access to alternative funding sources, such as repurchase agreements, while larger members may have access to a wider range of funding sources such as repurchase agreements, brokered deposits, commercial paper and other funding sources. Larger members also may have independent access to the national and global financial markets. The availability of alternative funding sources to members can vary as a result of a number of factors, including, among others, market conditions, members’ creditworthiness, and availability of collateral. We compete for advances on the basis of the total cost of our products to our members, which includes the rates we charge, the structures of available products, our collateral requirements, and the dividends we pay.
Mortgage Loans Held for Portfolio
Through early March 2005 when we announced that the Seattle Bank would be exiting the MPP, we competed for the purchase of mortgage loans with other secondary market participants, such as Fannie Mae and Freddie Mac. We primarily competed on the basis of transaction structure, price, products, and services offered. We no longer purchase mortgage loans from the members participating in the MPP.
Debt Issuance
We compete with the U.S. government, Fannie Mae, Freddie Mac, and other GSEs, including other FHLBanks, as well as corporate, sovereign, and supranational entities, including the World Bank, for funds raised through the issuance of unsecured debt in the national and global debt markets. Although our debt products have tax-free status to their purchasers, increases in the supply of competing debt products (with or without similar tax-free status) may, in the absence of increases in demand, result in higher debt costs or lower amounts of debt issued at the same cost than otherwise would be the case. In addition, regulatory initiatives, which may to reduce investments by certain depository institutions in unsecured debt with greater price volatility or interest-rate sensitivity than fixed interest-rate, fixed-maturity instruments of the same maturity, may adversely affect the availability and cost of funds raised through the issuance of certain types of unsecured debt. Although the available supply of funds from the FHLBank System’s debt issuances has kept pace with the funding requirements of our members, there can be no assurance that this will continue to be the case.
The sale of callable debt and the simultaneous execution of callable interest-rate exchange agreements that mirror the debt sold has been an important source of competitive funding for us. Accordingly, the availability of markets for callable debt and interest-rate exchange agreements may be an important factor in determining our relative cost of funds. There is considerable competition in the markets for callable debt and for interest-rate exchange agreements among issuers of high credit quality. There can be no assurance that the current breadth and depth of these markets will be sustained.
Employees
As of December 31, 2006, we had 118 full-time employees. We decreased our staffing by eight employees from December 31, 2005, as we continued to focus our business on our advances and reduced overall operating
32
costs. Our employees are not represented by a collective bargaining unit, and we believe that we have a good relationship with our employees.
ITEM 1A. RISK FACTORS
The following factors are some of the more important risks and uncertainties that we face in our business. These risks and uncertainties are not the only risks and uncertainties that we may encounter, as others not now known to us or currently deemed immaterial may also impair our business. If any of these or other risks or uncertainties do come about, our business, including our financial condition and results of operations, could suffer, which could affect, among other things, our ability to provide our members with advances at competitive rates, dividends, and services as we have previously provided. The risks and uncertainties discussed below also include forward-looking statements, and our actual financial condition and results of operations may differ substantially from those discussed in such statements.
Seattle Bank Risks
Our limitations on the payment of dividends and restrictions on Class B stock repurchases, together with other capital management requirements, have limited, and may continue to limit, member demand for advances and may limit our ability to attract new members.
In May 2005, in connection with the Finance Board’s acceptance of our business plan, our Board adopted policies suspending indefinitely the declaration or payment of any dividends and the repurchase of any Class B stock, subject to certain exceptions. In December 2006, the OS Director granted us a waiver of certain restrictions on our ability to pay dividends on our capital stock, and our Board adopted a new policy that, among other things, limits our payment of quarterly dividends to no greater than 50% of our year-to-date net income. These dividend limitations will remain in effect until we receive written approval from the OS Director to exceed the limitations.
Further, although our longer-term goal is to pay members a dividend based on a variable short-term interest rate such as the federal funds rate or three-month LIBOR, subject to applicable dividend restrictions and capital requirements, future dividends may not be consistent with the dividends that we paid prior to suspending our payment of dividends in May 2005. See “Part II. Item 7. Management’s Discussion and Analysis of Financial Condition and Results of Operations—Capital Resources and Liquidity—Capital Resources.”
Our members must comply with our activity-based stock purchase requirements. Consequently, new members are required to purchase our capital stock to obtain advances, and existing members may be required to purchase additional stock to increase their advance borrowings. Although our Capital Plan was amended in December 2006 to allow for: (i) the creation of an excess stock pool, which may be used to support certain additional advances without requiring a member to purchase additional stock, and (ii) the creation of Class A stock, which may be used to satisfy a member’s activity-based stock purchase requirement and may be redeemed upon six months’ notice, the Seattle Bank is still restricted from repurchasing Class B stock without obtaining a waiver from the OS Director. For the foreseeable future, we do not expect to obtain a waiver from the Finance Board for the repurchase of Class B stock prior to the end of the statutory five-year redemption period. We cannot predict with certainty whether the limitations on the payment of dividends or the restrictions on the repurchase of Class B stock will continue to negatively affect demand for advances or new membership. See “Part II. Item 7. Management’s Discussion and Analysis of Financial Condition and Results of Operations—Capital Resources and Liquidity—Capital Resources—Seattle Bank Stock,” for additional information on the Capital Plan amendments.
The loss of large members with significant amounts of advance business or the loss of substantial advance business from those members could have a negative effect on our results of operations.
Our advance balance is concentrated with commercial banks and thrift institutions. As of December 31, 2006, five of our members held 69.5% of the par value of our outstanding advances, with two of those members
33
holding 56.8% (one holding 36.0% and another holding 20.8%) of the par value of our outstanding advances. Changes in their borrowing decisions for whatever reason, including their reluctance to borrow if it would require purchasing more of our capital stock, can significantly affect the amount of our advances outstanding. As we have refocused our business on our advances, we expect that the concentration of advances with our largest borrowers will continue to remain significant, and accordingly, the loss of any of these members or the loss of a substantial amount of their business could have a negative effect on our business, including our income.
Our use of differential pricing to make advances more attractive to members may reduce our net income.
As part of the business plan, we have refocused our business on advances, using differential pricing to increase our advance activity. This means that rates on advances may be lower for some members than for others in order to be competitive with lower rates available to those members that have alternative funding sources. We anticipate that the use of differential pricing will increase our advance volume in the future and that the increased volume will compensate for any reduction in overall yield due to differential pricing. Although our advance volume increased in both 2005 and 2006, largely due to our use of differential pricing, there can be no assurance that we will achieve the necessary advance volume to compensate for the reduction in overall yield due to differential pricing. Our use of differential pricing to increase our advance business will narrow our spreads on advances due to the lower spreads we generally offer to borrowers that take out large advances or meet high-volume criteria. Lower spreads due to differential pricing could result in lower net income in future periods.
We face competition for advances, which could adversely affect our net income.
We compete for advances business with other sources of wholesale funding, both secured and unsecured. Demand for our advances is primarily affected by the cost of other available sources of liquidity for our members. Other sources of wholesale funding may include investment banks, commercial banks, and other FHLBanks. The availability of alternative funding sources to members can vary as a result of a number of factors, including, among others, market conditions, members’ creditworthiness, and availability of collateral. We compete for advances on the basis of the total cost of our products to our members, which includes the rates we charge, as well as the dividends we pay. A decrease in the demand for our advances or a decrease in our profitability on advances could negatively affect our financial condition and results of operations, particularly net income.
Although our net income increased and our net unrealized market value loss improved in 2006 compared to recent years, the consequences of past financial management decisions will continue to depress our net income and negatively affect our net unrealized market value in 2007 and beyond.
In late 2002 and early 2003, the Seattle Bank made large purchases of MPP assets and mortgage-backed securities. In 2003, when interest rates declined to historic lows, mortgage prepayments accelerated to a much faster pace, and we were not able to effectively match the cash flows of our debt with the cash flows of the mortgage-based assets. We did not effectively hedge the debt, nor did we refinance or retire the debt when the mortgage-based assets were prepaid. In 2003 and 2004, we purchased consolidated obligations of other FHLBanks with funds generated primarily by the issuance of consolidated obligations on which we are the primary obligor. By issuing debt with differing maturities and payment terms from the investments we were purchasing, we attempted to generate a favorable spread over our cost of funding on these investments. During 2004, short-term interest rates increased, and as the short-term instruments issued to acquire these investments matured, we replaced them with new debt at higher interest rates, reducing the initially favorable spreads. These decisions contributed to our net unrealized market value loss of approximately $245.0 million, $363.1 million, and $257.3 million, as of December 31, 2006, 2005, and 2004. Although a significant portion of our investments in the consolidated obligations of other FHLBanks, with yields substantially below current-market interest rates, will mature in 2007, the effect of these past financial management decisions will continue to depress our net income and our unrealized market value in 2007 and beyond, as we continue to hold a significant amount of the below-market yielding investments and relatively high-cost debt.
34
Fluctuations in interest rates could adversely affect our net income if we do not manage our interest-rate risk effectively.
Our net interest income is affected by fluctuations in interest rates. Interest-rate changes may be driven by economic factors or by changes in our products or services. We manage the interest-rate risk of our assets with a combination of debt issuance and derivatives, including interest-rate swaps, interest-rate caps and floors, forward purchase and sale agreements, and swaptions. Our effective management of interest-rate risk depends upon our ability, given prevailing and anticipated market conditions, to evaluate and execute appropriate funding strategies and hedging positions for our assets and liabilities. In the past, we have not always effectively managed our interest-rate risk, especially the interest-rate risk associated with the MPP mortgage loans and our investment in the consolidated obligations of other FHLBanks. See “Part II. Item 7. Management’s Discussion and Analysis of Financial Condition and Results of Operations—Overview,” which discusses, among other things, the changes in interest rates in recent years and their effects on our business. We believe that the steps we have taken to implement our business plan, including significantly increasing our focus on market-risk measurement, monitoring, and management, will enable us to manage interest-rate risk more effectively. Nevertheless, a rapid or significant drop in long-term interest rates could result in faster-than-expected prepayments, lower-than-expected yields on mortgage-based assets, and higher than expected hedging costs, which could contribute to lower net income. In addition, a rapid or significant drop in short-term interest rates could contribute to lower net income because of the amount of our capital invested in short-term instruments.
We rely heavily upon effective information systems and other technology, and failures in maintenance or other interruptions in these systems could adversely affect our business.
We rely heavily upon maintaining effective information systems and other technology to conduct and manage our business, including systems and other technology provided by third-party providers. Maintaining effective information systems and technologies is dependent on appropriate implementation and may require substantial capital expenditures from time to time. To the extent that we experience a significant failure or interruption in any of these systems or other technology, including due to actions by third parties, we may be unable to conduct and manage our business effectively. In addition, although we have established and maintain disaster recovery plans, we can provide no assurance that they will be able to prevent, or timely and adequately address or mitigate, the negative effects of any failure or interruption in our information systems and other technology. A natural or other catastrophe, an act of terrorism, or a third-party service provider’s error could cause such a failure or interruption. Any significant failure or interruption could harm our customer relations, risk management, and profitability, which could negatively affect our financial condition and results of operations.
We may not be able to manage expenses effectively, which could adversely affect our profitability and our ability to achieve retained earnings goals and pay dividends.
Our favorable financial results in 2006 were attributable in large part to our ability to reduce our operating and other expenses, including hedging costs, compared to prior years, and managing expenses effectively will continue to be important to maintaining and increasing our net income growth in 2007 and beyond. If we are unable to execute effectively on our business plan to maintain operating efficiencies, it could adversely affect our ability to increase our net income, achieve our retained earnings goals, and pay dividends to our members.
Exposure to credit risk could have a negative impact on our financial condition and results of operations.
We are subject to credit risk from our advances to members, secured and unsecured investments in our investment portfolio, mortgage loans held for portfolio, and derivative contracts and hedging activities. Severe economic downturns, declining real estate values (both residential and non-residential), changes in monetary policy or other events that could have a negative impact on the capital markets could lead to member or counterparty defaults or losses on our investments or mortgage loans held for portfolio that could have a negative impact on our financial condition and results of operations.
35
Our reputation could be negatively impacted if a member pledging subprime mortgage loans as collateral to secure advances was found to be in violation of anti-predatory lending laws.
On a case-by-case basis, following thorough application and assessment procedures, we accept certain categories of first-lien single-family subprime mortgage loans as collateral under our subprime collateral program. If a member was found to be in violation of anti-predatory lending laws, and some of the illegal loans had been pledged to us, consumer advocacy groups or others could assert that advances extended by us enhanced the member’s ability to make illegal loans, which could damage our reputation.
FHLBanks and FHLBank System Risks that Affect the Seattle Bank
Our access to funding depends upon demand for the FHLBank System’s debt issuances.
Our primary source of funding is the issuance of consolidated obligations by the Office of Finance on behalf of the FHLBanks. We compete with Fannie Mae, Freddie Mac, and other GSEs, including other FHLBanks, as well as corporate, sovereign, and supranational entities, including the World Bank, for funds raised through the issuance of unsecured debt in the national and global debt markets. Increases in the supply of competing debt products may, in the absence of increases in demand, result in higher debt costs or lower amounts of debt issued at the same cost than otherwise would be the case. In addition, the availability and cost of funds raised through issuance of certain types of unsecured debt may be adversely affected by regulatory initiatives. Although the available supply of funds from the FHLBank System’s debt issuances has kept pace with the funding requirements of our members, there can be no assurance that this will continue to be the case.
Furthermore, our borrowing costs and access to funds could be adversely affected by changes in investor perception of the FHLBank System’s debt issuances. For example, negative public policy views on the systemic risks presented by GSEs and accounting and other announcements by Fannie Mae, Freddie Mac, and the FHLBanks have, at times, created pressure on debt pricing, as investors apparently perceive such obligations as bearing greater risk than some other debt products. Any additional similar announcements may contribute to further pressure on debt pricing. As a result of the perception of higher risk relating to GSE debt products, as well as GSE growth, the FHLBank System could be required to pay higher interest rates on its consolidated obligations to make them attractive to investors.
Downgrades in our credit agency ratings or those of the FHLBank System or of other FHLBanks could adversely impact the marketability of our consolidated obligations, products, or services.
In December 2004, Standard & Poor’s lowered our long-term counterparty rating from “AAA” to “AA+,” citing concerns about the Written Agreement, our lower profitability, and the impact of growing mortgage-based asset portfolios on our risk profile. This rating was reaffirmed in April 2005, and, at the same time, Standard & Poor’s changed our ratings outlook from stable to negative, citing our lower profitability as a key reason for the outlook adjustment. Although Standard and Poor’s revised our outlook to stable from negative in January 2007, it has maintained a negative outlook rating and long-term counterparty credit rating AA+ for certain other FHLBanks. Individual FHLBank ratings do not necessarily impact the credit rating of the consolidated obligations issued by the Office of Finance on behalf of the FHLBanks. Currently, Standard & Poor’s rates the FHLBank System’s long-term and short-term consolidated obligations “AAA/A-1+” and Moody’s rates them “Aaa/P-1.” However, adverse credit agency ratings actions or negative guidance regarding the Seattle Bank or other FHLBanks could adversely affect the FHLBanks’ cost of funds and the FHLBank System’s ability to issue consolidated obligations on acceptable terms, which could negatively affect our financial condition and results of operations.
The Seattle Bank and the other FHLBanks are governed by laws and regulations relating to the FHLBank System, changes to which could negatively impact our business.
The FHLBanks are GSEs supervised and regulated by the Finance Board under the FHLBank Act and the rules and regulations promulgated by the Finance Board. From time to time, Congress has amended the
36
FHLBank Act in ways that have significantly affected the rights and obligations of the FHLBanks and the manner in which the FHLBanks carry out their housing-finance mission and business operations. Furthermore, actions by the Finance Board regarding the FHLBank System or the Seattle Bank can specifically affect the Seattle Bank’s operations. For example, the Finance Board must approve amendments to our Capital Plan and may impose various restrictions and limitations to our business, such as increasing our minimum capital-to-assets ratio requirement.
In recent years, there has been increased congressional scrutiny of GSEs, including the FHLBanks. For example, various bills that would, among other things, create a new regulator for Fannie Mae, Freddie Mac, and the FHLBanks and address other GSE reform issues have been considered over the last several years, but no such legislation has been enacted. At this time, it is impossible to predict what, if any, provisions affecting the FHLBanks and their regulation may ultimately be included and enacted in legislation or when any changes would go into effect.
Any new or amended legislation enacted by Congress or new regulatory requirements adopted by the Finance Board, as well as failure of anticipated changes or interpretations to take effect, could have a negative effect on our ability to conduct our business, including the costs, size, and scope of our operations.
An agreement with other FHLBanks could make us liable for principal and interest payment obligations of other FHLBanks, increasing our short-term borrowing costs.
The Federal Reserve Board in September 2004 announced that it had revised its Policy Statement on Payments System Risk concerning interest and redemption payments on securities issued by FHLBanks and certain other organizations. Under the revised policy, which became effective in July 2006, the Federal Reserve Board no longer allows these organizations to incur an intraday overdraft on their accounts with the Federal Reserve Banks. This requires that the affected organizations maintain adequate collected balances with the Federal Reserve Banks before the Federal Reserve Banks will transfer amounts on behalf of these organizations, including principal and interest to FHLBank debtholders. In June 2006, the FHLBanks entered into the Contingency Agreement, effective as of July 20, 2006. Under the Contingency Agreement, in the event that one or more FHLBanks does not fund its principal and interest payments under a consolidated obligation by deadlines agreed upon by the FHLBanks, the other FHLBanks will be responsible for those payments as described in the Contingency Agreement. Although no FHLBank has failed to timely fund its principal and interest payments since the Federal Reserve Board changed its policy, we could incur increased short-term borrowing costs if we should be required to participate in making such payments under the Contingency Agreement.
The Finance Board could make us liable for all or a portion of the consolidated obligations of any or all of the FHLBanks.
Although we are primarily liable for the allocated portion of consolidated obligations issued on our behalf by the Office of Finance, we also are jointly and severally liable with the other 11 FHLBanks for the payment of principal and interest on all of the consolidated obligations of the FHLBank System. The Finance Board, at its discretion, may require any FHLBank to make the principal or interest payments due on any FHLBank’s consolidated obligation, even in the absence of a default of an FHLBank. Although no FHLBank has ever defaulted on a consolidated obligation and the joint and several requirements have never been invoked, we could incur significant liability beyond our primary obligations under consolidated obligations if the Finance Board should decide to make us liable for another FHLBank’s consolidated obligations, which would negatively affect our financial condition and results of operations, as well as limit our ability to pay dividends or repurchase member stock in the future.
We could be negatively affected by local and national business and economic conditions, as well other events that are outside of our control.
Local and national economic conditions could be less favorable than expected or could have a more direct and pronounced effect on our business than expected. For example, conditions affecting interest rates, money
37
supply, inflation, and debt and capital markets, including those stemming from policies of governmental entities such as the Federal Reserve Board, have a significant impact on our operations. Changes in these conditions could adversely affect our ability to increase and maintain the quality of our interest-earning assets and increase the costs of our interest-bearing liabilities. For example, an economic downturn or declining property values could cause higher delinquency and default rates on our outstanding advances and mortgage loans.
Furthermore, natural disasters, acts of terrorism, and other events outside of our control, especially if they occur in our region, could negatively affect us, including by damaging our members’ businesses, our real property, the collateral for our advances and mortgage loans, and in other ways. For example, should there be a natural disaster or other event, such as the terrorist attacks of September 11, 2001, that limits or prevents the FHLBank System from accessing the public debt markets for a period of time, our business would be significantly affected, including our ability to provide advances to our members.
ITEM 1B. UNRESOLVED STAFF COMMENTS
None.
ITEM 2. PROPERTIES
We occupy 36,934 square feet of leased space at our headquarters in Seattle, Washington. Our total leased space at this location is 91,374 square feet under a ten-year lease, which expires in April 2013. During 2005, we terminated our lease obligation relating to an additional 8,849 square feet of space. On December 21, 2006, we executed a sublease for 21,430 square feet of unused space at our headquarters beginning on April 1, 2007 and expiring on April 30, 2013. On March 22, 2007, we executed a sublease for an additional 7,406 square feet of unused office space at our headquarters beginning on November 1, 2007 and expiring on April 30, 2013. We are actively working to identify subtenants and sublease our remaining leased but unused space at our headquarters. We also lease 2,920 square feet of space at a second location in the Seattle area, as a disaster recovery facility, under a ten-year lease, which expires in February 2013.
In addition, we previously leased 17,302 square feet of space in another office building (initially covered by a five-year lease expiring in January 2009), which we terminated effective February 2007.
ITEM 3. LEGAL PROCEEDINGS
From time to time, the Seattle Bank is subject to legal proceedings arising in the normal course of business. After consultations with legal counsel, we do not anticipate that the ultimate liability, if any, arising out of any current matters will have a material impact on our financial condition, results of operations, or cash flows.
ITEM 4. SUBMISSION OF MATTERS TO A VOTE OF SECURITY HOLDERS
Under the FHLBank Act, no matters are submitted to stockholders for a vote except the election of the Seattle Bank’s elected directors. See “Part III. Item 10. Directors, Executive Officers and Corporate Governance—Corporate Governance” for a discussion of the election process. See our Current Report on Form 8-K filed with the SEC on October 20, 2006, for more information relating to the election of Craig E. Dahl, Michael A. DeVico, and Russell J. Lau during the fourth quarter of 2006.
38
PART II.
ITEM 5. MARKET FOR REGISTRANT’S COMMON EQUITY, RELATED STOCKHOLDER MATTERS AND ISSUER PURCHASES OF EQUITY SECURITIES
Market Information
All of our outstanding capital stock is owned by our members, except in limited circumstances, for example, for a period after a member is acquired by a nonmember. We conduct our business almost exclusively with our members. Our members purchase shares of our capital stock at its $100 par value per share to meet membership and activity-based purchase requirements. There is no market for our capital stock, and our capital stock is not publicly traded. We may be required to redeem capital stock at $100 par value per share five years after receipt of a written request from a member, subject to regulatory, Board, and Capital Plan limitations.
Pursuant to amendments to our Capital Plan, our current Capital Plan provides for two classes of stock, Class A stock and Class B stock, each of which has a par value of $100 per share. Each class of stock can be issued, redeemed, and repurchased only at par value. During 2005 and the majority of 2006, we had two classes of capital stock, Class B(1) stock and Class B(2) stock. The Class B(1) stock represented the stock that members were required to hold based on their membership and activity-based requirements and the Class B(2) stock represented stock that a member was no longer required to hold or that exceeded the amount of allowable excess Class B(1) stock that a member could hold. In December 2006, the Class B(1) and Class B(2) stock were converted into a single class of Class B stock. See “Item 7. Management’s Discussion and Analysis of Financial Condition and Results of Operations—Capital Resources and Liquidity—Capital Resources—Seattle Bank Stock.”
As of December 31, 2006, we had 379 stockholders holding 22,102,184 shares of our Class B stock. Of these shares, 692,217 were shares of Class B stock reclassified for financial reporting purposes from equity to mandatorily redeemable Class B stock. There were no shares of Class A stock outstanding as of December 31, 2006.
Dividends
Under our Capital Plan, our Board generally can declare and pay dividends, in either cash or capital stock, only from retained earnings or current net earnings, at its discretion. However, in September 2006, the Board adopted a resolution limiting dividends on Class A stock to cash. On December 28, 2006, the Finance Board adopted a resolution limiting an FHLBank from issuing stock dividends, if, after the issuance, the outstanding excess stock at the FHLBank would be greater than 1.0% of its total assets. As of December 31, 2006, we had excess stock of $902.2 million or 1.7% of our total assets.
On December 8, 2006, the OS Director granted us a waiver, at the request of our Board, to resume paying quarterly dividends subject to certain limitations. The waiver related to dividend limitations imposed by our Board as a condition to the Finance Board’s acceptance in 2005 of our business plan. The dividend limitation identified in the waiver generally provides that dividend payments may not exceed 50% of year-to-date U.S. GAAP net income. See “Item 7. Management’s Discussion and Analysis of Financial Condition and Results of Operations—Capital Resources and Liquidity—Capital Resources—Capital Plan Amendments and Board Policies Regarding Seattle Bank Stock,” for additional detail regarding the dividend limitations and the waiver.
In the fourth quarter of 2006, pursuant to the waiver described above, our Board declared a dividend of $0.10 per share on our Class B stock based upon the average amount of such stock outstanding during the third quarter of 2006. Based upon Board approval, we paid a $2.1 million cash dividend in December 2006. We had no Class A stock outstanding during 2006 and therefore, no dividends were declared on Class A stock. During the first quarter of 2005, our Board declared dividends in the form of capital stock only. We did not declare dividends in the first, second, or third quarter of 2006 or in the second, third, or fourth quarter of 2005. We do
39
not issue fractional shares and when a dividend calculation would result in fractional shares, a payment equivalent to the fractional amount is paid in cash. The following tables represent the stock dividends paid in 2006 and 2005 on our Class B stock, as well as on our Class B(1) stock and Class B(2) stock for the periods prior to the amendments to our Capital Plan in the fourth quarter of 2006 which converted the Class B(1) stock and Class B(2) stock into a single class of Class B stock.
| | | | | | | | | | | | |
| | | 2006 | | | 2005 | |
Class B/Class B(1) Stock | | Amount | | Annualized
Dividend
Rate | | | Amount | | Annualized
Dividend
Rate | |
| (dollars in thousands) | | | | | | | | | | |
First quarter | | $ | | | | % | | $ | 8,244 | | 1.63 | % |
Second quarter | | | | | | | | | | | | |
Third quarter | | | | | | | | | | | | |
Fourth quarter | | | 2,135 | | 0.40 | | | | | | | |
| | | | | | | | | | | | |
Total | | $ | 2,135 | | 0.10 | % | | $ | 8,244 | | 0.41 | % |
| | | | | | | | | | | | |
| | |
| | | 2006 | | | 2005 | |
Class B(2) Stock | | Amount | | Annualized
Dividend
Rate | | | Amount | | Annualized
Dividend
Rate | |
| (dollars in thousands) | | | | | | | | | | |
First quarter | | $ | | | | % | | $ | 234 | | 1.5 | % |
Second quarter | | | | | | | | | | | | |
Third quarter | | | | | | | | | | | | |
Fourth quarter | | | | | | | | | | | | |
| | | | | | | | | | | | |
Total | | $ | | | | % | | $ | 234 | | 0.38 | % |
| | | | | | | | | | | | |
Payment of future dividends will be subject to the requirements, limitations, the policies described above, the discretion of our Board, and satisfaction of regulatory and capital plan requirements. In addition, the amount and timing of dividends will depend on many factors, including our financial condition, earnings, capital requirements, retained earnings policy, regulatory constraints, legal requirements, and other factors that our Board deems relevant.
Issuer Purchases of Equity Securities
In accordance with correspondence from the Office of Chief Counsel of the Division of Corporation Finance of the U.S. Securities and Exchange Commission dated May 23, 2006, we are exempt from disclosure of unregistered sales of common equity securities or securities issued through the Office of Finance that otherwise would have been required under Item 701 of the SEC’s Regulation S-K. By the same no-action letter, we are also exempt from disclosure of securities repurchases by the issuer that otherwise would have been required under Item 703 of Regulation S-K.
40
ITEM 6. SELECTED FINANCIAL DATA
The following selected financial data of the Seattle Bank should be read in conjunction with our audited financial statements and related Notes for the year ended December 31, 2006 and “Item 7. Management’s Discussion and Analysis of Financial Condition and Results of Operations.” included elsewhere in this report.
| | | | | | | | | | | | | | | | | | | | |
| | | December 31, | |
| | | 2006 | | | 2005 | | | 2004 | | | 2003 | | | 2002 | |
| (in millions, except percentages) | | | | | | | | | | | | | | | |
Statement of Condition (at year end) | | | | | | | | | | | | | | | | | | | | |
Total assets | | $ | 53,515 | | | $ | 52,542 | | | $ | 48,086 | | | $ | 51,164 | | | $ | 46,684 | |
Cash and investments(1) | | | 18,686 | | | | 23,590 | | | | 22,428 | | | | 20,052 | | | | 17,189 | |
Advances | | | 27,961 | | | | 21,435 | | | | 14,897 | | | | 19,653 | | | | 20,036 | |
Mortgage loans held for portfolio | | | 6,367 | | | | 7,216 | | | | 10,446 | | | | 11,172 | | | | 9,112 | |
Deposits and other borrowings | | | 1,004 | | | | 1,194 | | | | 1,093 | | | | 1,317 | | | | 1,755 | |
Primary obligations on consolidated obligations(2) | | | 49,537 | | | | 48,503 | | | | 44,106 | | | | 46,518 | | | | 41,569 | |
Payable to AHP | | | 23 | | | | 31 | | | | 44 | | | | 48 | | | | 53 | |
Payable to (Receivable from) REFCORP | | | 2 | | | | (3 | ) | | | 4 | | | | 9 | | | | 11 | |
Class B/B(1)/B(2)—putable or capital stock—putable | | | 2,141 | | | | 2,133 | | | | 2,027 | | | | 2,399 | | | | 2,345 | |
Total capital | | | 2,231 | | | | 2,201 | | | | 2,102 | | | | 2,456 | | | | 2,382 | |
| | | | | |
Statement of Income (for the year ending) | | | | | | | | | | | | | | | | | | | | |
Interest income | | | 2,533 | | | | 1,961 | | | | 1,673 | | | | 1,583 | | | | 1,674 | |
Net interest income | | | 77 | | | | 97 | | | | 156 | | | | 218 | | | | 253 | |
Other income | | | 3 | | | | (28 | ) | | | 4 | | | | 11 | | | | (27 | ) |
Other expense | | | 45 | | | | 66 | | | | 47 | | | | 33 | | | | 26 | |
Income before AHP and REFCORP assessments | | | 35 | | | | 3 | | | | 113 | | | | 196 | | | | 200 | |
AHP and REFCORP assessments | | | 9 | | | | 1 | | | | 30 | | | | 52 | | | | 53 | |
Income before cumulative change in accounting principles | | | 26 | | | | 2 | | | | 83 | | | | 144 | | | | 147 | |
Net income | | | 26 | | | | 2 | | | | 83 | | | | 144 | | | | 147 | |
| | | | | |
Dividends (for the year ending) | | | | | | | | | | | | | | | | | | | | |
Dividends paid in cash and stock(3) | | | 2 | | | | 8 | | | | 64 | | | | 123 | | | | 145 | |
Annualized dividend rate(4) | | | 0.10 | % | | | 0.41 | % | | | 2.75 | % | | | 5.15 | % | | | 5.97 | % |
Capital stock(4)(5) | | | N/A | | | | N/A | | | | N/A | | | | N/A | | | | 6.00 | % |
Class B(1) stock(4)(5) | | | N/A | | | | 0.41 | % | | | 2.87 | % | | | 5.56 | % | | | 6.38 | % |
Class B(2) stock(4)(5) | | | N/A | | | | 0.38 | % | | | 0.63 | % | | | 0.71 | % | | | 1.05 | % |
Class B stock(4)(5) | | | 0.10 | % | | | N/A | | | | N/A | | | | N/A | | | | N/A | |
Dividend payout ratio(6)(7) | | | 8.28 | % | | | 494.63 | % | | | 77.64 | % | | | 85.65 | % | | | 98.70 | % |
| | | | | |
Financial Statistics (for the year ending) | | | | | | | | | | | | | | | | | | | | |
Return on average equity | | | 1.16 | % | | | 0.08 | % | | | 3.44 | % | | | 5.86 | % | | | 5.93 | % |
Return on average assets | | | 0.05 | % | | | 0.00 | % | | | 0.17 | % | | | 0.31 | % | | | 0.33 | % |
Equity-to-assets ratio(8) | | | 4.17 | % | | | 4.05 | % | | | 4.82 | % | | | 5.24 | % | | | 5.63 | % |
Total capital-to-assets ratio(9) | | | 4.30 | % | | | 4.32 | % | | | 4.50 | % | | | 4.80 | % | | | 5.10 | % |
Net interest margin(10) | | | 0.15 | % | | | 0.19 | % | | | 0.31 | % | | | 0.47 | % | | | 0.57 | % |
| (1) | Investments also include interest-bearing deposits in banks, securities purchased under agreement to resell, and federal funds sold. |
| (2) | Consolidated obligations are the joint and several obligations of all the FHLBanks. The total amount of the FHLBanks’ outstanding consolidated obligations, net of interbank holdings, was approximately $947.3 billion, $931.7 billion, $860.4 billion, $740.9 billion, and $673.7 billion as of December 31, 2006, 2005, 2004, 2003, and 2002. |
| (3) | Cash paid of $2.1 million, $23,000, $66,000, $87,000, and $82,000 for the years ended December 31, 2006, 2005, 2004, 2003, and 2002. The remainder of the dividends were paid in capital stock. |
| (4) | Annualized dividend rates are dividends paid in cash and stock, divided by the average balance of capital stock eligible of dividends during the year. |
41
| (5) | Capital stock, Class B stock, Class B(1) stock, and Class B(2) stock dividend rates are the sum of the dividends paid per average share of stock for the years ended December 31, 2006, 2005, 2004, 2003, and 2002. We amended our Capital Plan in December, 2006 and outstanding Class B(1) stock and Class B(2) stock were converted into Class B stock. In addition, we converted to a new capital structure on June 30, 2002, and outstanding capital stock was converted to Class B(1) stock. For the year ended December 31, 2002, the dividend rates per share of capital stock, Class B(1) stock and Class B(2) stock have been annualized by taking the sum of the dividends paid per share during the two quarters that each class of stock was outstanding, multiplied by two. |
| (6) | Dividend payout ratio is dividends paid in cash and stock divided by net income. |
| (7) | Dividend payout ratio for the year ended December 31, 2004, included the fourth quarter dividends of $8.5 million that were paid in the first quarter of 2005. The Seattle Bank did not declare any dividends based on earnings for the year ended December 31, 2005. |
| (8) | Equity-to-assets ratio is average capital stock, retained earnings, and accumulated other comprehensive income divided by the total average assets. |
| (9) | Total capital-to-assets ratio is capital stock plus retained earnings and accumulated other comprehensive income divided by the total assets at the end of the period. |
| (10) | Net interest margin is net interest income divided by the average earning assets. |
ITEM 7. MANAGEMENT’S DISCUSSION AND ANALYSIS OF FINANCIAL CONDITION AND RESULTS OF OPERATIONS
This discussion and analysis reviews our financial condition as of December 31, 2006 and 2005, and our results of operations for the years ended December 31, 2006, 2005, and 2004. This discussion and analysis should be read in conjunction with our audited financial statements and related notes for the year ended December 31, 2006, included in “Item 8. Financial Statements and Supplementary Data—Audited Financial Statements.”
Overview
Structure
The Seattle Bank, a federally chartered corporation and one of 12 FHLBanks, is a cooperative that is owned by member financial institutions located within our district, which includes Alaska, Hawaii, Idaho, Montana, Oregon, Utah, Washington, and Wyoming, as well as the U.S. territories of American Samoa, Guam, and the Northern Mariana Islands. All federally insured depository institutions and insurance companies engaged in residential housing finance and community financial institutions located in the Seattle Bank’s district are eligible to apply for membership. Eligible institutions must purchase specified amounts of capital stock in the Seattle Bank as a condition of membership. Members generally are assigned a credit line at the time they join, based on our evaluation of their financial condition, and are eligible to receive dividends, if and when payable, on their capital stock holdings. Members are also subject to activity-based capital stock purchase requirements, which may require them to purchase additional stock if the amount of business they do with us increases. All of our outstanding capital stock is owned by our members, except in limited circumstances, for example, for a period following the acquisition of a member by a nonmember.
Our mission is to provide liquidity, funding, and services to enhance our members’ success and the availability of affordable homes and economic development in their communities. We also work with our members and a variety of other entities, including non-profit organizations, to provide affordable housing and community economic development funds through direct subsidy grants and low- or no-interest loans, to individuals and communities in need. We fund these grants and loans through the AHP and a number of other community investment programs.
Historical Operations
During the three-year period from 2004 through 2006, we significantly restructured our business and operations. As a result of this restructuring, we reported increased net income for 2006 that reversed a trend of declining net income begun in 2003. In 2004, we had two principal lines of business: our advances business and our MPP. Due to actions we initiated at the end of 2004, and which were substantially implemented during 2005 and 2006, we have now refocused our business on providing advances to our members and no longer purchase
42
mortgage loans through the MPP. In changing the direction of our business, we reviewed and improved our operations and reduced our expenses substantially.
The change in our business strategy was driven by declining net income, which fell from $147.1 million in 2002 to $82.7 million in 2004, and by issues raised in our 2004 Finance Board examination, which focused on, among other factors, our risk management practices.
During 2003 and 2004, we had accumulated excess cash due to faster-than-expected prepayments of existing mortgage-based assets, decreases in new advances because of noncompetitive rates, and internal limits on acquiring MPP mortgage loans. We had to either reinvest our excess cash in higher-yield investments in order to produce a higher return on capital or return it to our members by repurchasing their stock. Our members had historically received dividends at favorable rates—for example, ranging from 6.88% in 2001 to 5.15% in 2003—and preferred to hold our stock in order to continue to receive attractive dividends. Seeking to earn additional interest income to continue paying dividends at close to historical rates, we invested our excess cash primarily in mortgage-backed securities and callable debt of GSEs such as other FHLBanks, Fannie Mae, and Freddie Mac. We significantly increased our investment portfolio in late 2003 through August 2004, primarily by acquiring the consolidated obligations of other FHLBanks. We funded most of these purchases with our own contemporaneously issued consolidated obligations, primarily consisting of short- and long-term bullet debt, but we did not match the prepayment options and maturities of the investments we purchased with the maturities and call options of the debt issued.
During 2004, short-term interest rates began to steadily increase and long-term interest rates did not correspondingly increase, causing a decrease in our net interest income as the average cost of our interest-bearing liabilities increased without a corresponding increase in income from our interest-earning assets. These changes in interest rates also caused the market value of our investments to decline and the market value of the contemporaneously issued long-term debt to increase. Consequently, our market value of equity also declined in 2004.
As a result of the 2004 Finance Board examination, we entered into the Written Agreement with the Finance Board in December 2004. The Written Agreement required us to develop a three-year business and capital management plan and submit it to the Finance Board’s Office of Supervision, and imposed certain other requirements and limitations. In May 2005, the Finance Board accepted our business plan, subject to our adoption of certain dividend and stock repurchase restrictions. See “—Capital Resources and Liquidity—Capital Resources—Capital Plan Amendments and Board Policies Regarding Seattle Bank Stock” for more information.
To implement the business plan, we undertook significant changes to our business, operations and capital policies, including:
| | • | | replacing our senior management team; |
| | • | | refocusing our strategic direction and marketing efforts on advances; |
| | • | | beginning our exit from the MPP; |
| | • | | substantially upgrading our tools, personnel and processes for managing risk; |
| | • | | substantially reducing our operating expenses primarily through reductions in staff and facilities costs; |
| | • | | implementing a hedging program to manage the risks inherent in our business; and |
| | • | | adopting changes to our Capital Plan to encourage members to take out advances by providing flexibility in the capital stock they can use to support advances. |
The flattening trend in the interest-rate yield curve that began in 2004 continued through 2005 and 2006, reducing our net interest income in both years. In addition, during 2005, we incurred significant expenses
43
associated with implementing the business plan, which, together with our reduced net interest income, caused our overall net income to decline in 2005. For example, we incurred $15.8 million of expenses associated with holding swaptions, which we purchased as economic hedges to protect against the potential of additional large unrealized losses in market value of equity. We also incurred consulting fees related to complying with the Written Agreement, termination-related expenses associated with downsizing our staff, and facilities abandonment fees, all of which contributed to the decline in our net income in 2005.
In 2006, we continued to expand our advance business as part of our business plan. Advances increased to 52.2% of our assets as of December 31, 2006, from 40.8% of our assets as of December 31, 2005, and our interest income from advances nearly doubled in that same period. Concurrently, through the sales of government-insured mortgage loans in 2005 and the receipt of principal payments on mortgage loans, we reduced our mortgage loans held for portfolio to 11.9% of our total assets as of the end of 2006, from 13.7% as of the end of 2005. Despite the continuing flat interest-rate yield curve and declining interest income from our reduced mortgage loans held for portfolio, we increased our net income by $24.1 million from 2005 to 2006 by significantly reducing our operating expenses, our hedging costs and the losses associated with hedging activities, and realizing gains on the early extinguishment of certain of our consolidated obligations.
As of December 31, 2006, 2005, and 2004, we disclosed net unrealized market value losses of $245.0 million, $363.1 million, and $257.3 million, which, in accordance with U.S. GAAP, are not reflected in our December 31, 2006, 2005, or 2004 financial position and operating results. Because of our net unrealized market value losses, the ratio of the market value of our equity to the book value of our equity was estimated at 89.0%, 83.5%, and 87.8% as of December 31, 2006, 2005, and 2004. The amount of our net unrealized market value loss involves estimates of the market values of our assets, liabilities, and commitments, which we discuss in greater depth in Note 17 in “Item 8. Financial Statements and Supplementary Data—Audited Financial Statements—Notes to Financial Statements.”
On January 11, 2007, the Written Agreement was terminated by the OS Director. The termination of the Written Agreement does not affect certain dividend limitations and Class B stock repurchase restrictions imposed by our Board. Consistent with those limitations, however, and based on our third quarter 2006 operating results, in December 2006, we paid dividends for the first time since early 2005. See “—Capital Resources and Liquidity—Capital Resources—Retained Earnings and Dividends” for additional information.
Trends
In 2007, we expect to continue to increase our advance balance and our interest income from advances through additional advance product offerings, continued use of differential pricing, and through our members making use of certain changes to our Capital Plan that were adopted to encourage increased advance activity. The balance of our mortgage loans held for portfolio will continue to decrease, largely through principal repayments. A significant portion of our investments in the consolidated obligations of other FHLBanks, with yields substantially below current-market interest rates, will mature in 2007. As a result of these factors, and assuming the interest-rate environment remains substantially unchanged, we anticipate continued improvement in net income and further decreases in our unrealized market value losses in 2007 and later years.
Financial Condition
Our assets principally consist of advances, investments, and mortgage loans held for portfolio. The composition of our assets changed during 2006 from year-end 2005, primarily reflecting our continued emphasis on our advances. During 2005, the change in the composition of our assets from year-end 2004 primarily reflected our decisions to emphasize our advances, exit the MPP, and increase our short-term investments in order to more fully use our capital. During both 2006 and 2005, we increased advances by $6.5 billion, with advances increasing to 52.2% and 40.8% of our total assets as of December 31, 2006 and 2005. We seek to
44
continue to increase our advances by offering additional advance products, using differential pricing, offering the purchase of Class A stock with a six-month redemption period, and, for a limited time, permitting the use of an excess stock pool to support additional advances. We anticipate that our advances will continue to increase, our mortgage loan portfolio will continue to decrease as mortgage loans are paid off, and our investments will decrease as a percentage of our total assets.
The following table summarizes our major asset classes as a percentage of our total assets for the years ended December 31, 2006, 2005, and 2004.
| | | | | | | | | |
| | | As of December 31, | |
Major Asset Classes as a Percentage of Total Assets | | 2006 | | | 2005 | | | 2004 | |
Advances | | 52.2 | % | | 40.8 | % | | 31.0 | % |
Investments | | 34.9 | | | 44.9 | | | 46.6 | |
Mortgage loans held for portfolio | | 11.9 | | | 13.7 | | | 21.7 | |
Other assets | | 1.0 | | | 0.6 | | | 0.7 | |
| | | | | | | | | |
Total | | 100.0 | % | | 100.0 | % | | 100.0 | % |
| | | | | | | | | |
We obtain funding to support our business primarily through the issuance, by the Office of Finance on our behalf, of debt securities in the form of consolidated obligations. We also rely on member deposits and on the issuance of our equity securities to our members in connection with their membership and their utilization of our products, such as advances. Restrictions on our ability to repurchase our capital stock prior to the end of the five-year redemption period and previous restrictions and current limitations to pay dividends on our capital stock have reduced our members’ willingness to purchase our stock and, therefore, have limited the amount of capital we receive from the issuance of stock.
We report our assets, liabilities, and commitments in accordance with U.S. GAAP, including the market value of our assets, liabilities, and commitments, which we also review for purposes of risk management. The differences between the carrying value and market value of our assets, liabilities, and commitments are unrealized market value gains or losses. As of December 31, 2006 and 2005, we had net unrealized market value losses of $245.0 million and $363.1 million. Because of these net unrealized market value losses, the ratio of the market value of our equity to the book value of our equity was 89.0% and 83.5% as of December 31, 2006 and 2005. Our net unrealized market value losses decreased $118.1 million as of December 31 2006, compared to 2005, and increased $105.8 million as of December 31, 2005, compared to 2004. The decrease in 2006 was largely due to the maturity of a portion of our lower-yield investments with maturities of three years or less, partially offset by rising short-term interest rates. The increase in 2005 was largely due to rising long-term interest rates which resulted in significant unrealized market value losses on our mortgage based assets, partially offset by an unrealized market value gain on our consolidated obligations. We measure the market value of our equity as the present value of the expected net cash flows from all our existing assets, liabilities, and commitments. Our calculation of market values involves estimates of the market value of our assets, liabilities, and commitments, which may add imprecision into any unrealized market-value gains or losses that we report.
We discuss the material changes in each of our principal categories of assets and liabilities and our capital stock in more detail below.
Advances
Advances increased by $6.5 billion, to $28.0 billion, as of December 31, 2006, compared to December 31, 2005. This increase was primarily the result of our continued emphasis on our advance business. For the year ended December 31, 2006, new advances totaled $105.2 billion, while maturing advances totaled $98.7 billion. This level of activity was significantly higher than that of the same period of 2005, when new advances totaled $85.5 billion and maturing advances totaled $79.0 billion. The increase in advance activity during 2006 was primarily attributable to advances made to our larger members.
45
For 2005, advances increased by $6.5 billion, to $21.4 billion, primarily as a result of our renewed emphasis on our advance business. This compares favorably to 2004, when advance levels fell by $4.8 billion, with new advances totaling $42.8 billion and maturing advances totaling $47.5 billion. The increase in our advance balance as of December 31, 2005 reversed a trend in year-over-year declines that began in 2001. The increase in advances during 2005 was primarily attributable to advances made to our larger members and to our increased use of differential pricing.
As of December 31, 2006, five members held 69.5% of the par value of outstanding advances, compared to 65.2% as of December 31, 2005. Two of these members, Bank of America Oregon, N.A. and Washington Mutual Bank, F.S.B., had advances totaling 56.8% of the par value of outstanding advances as of December 31, 2006 (Bank of America Oregon, N.A. with 36.0% and Washington Mutual Bank, F.S.B. with 20.8%), compared to those members holding 48.0% of the par value of our outstanding advances as of December 31, 2005 (Bank of America Oregon, N.A. with 28.0% and Washington Mutual, F.S.B. with 20.0%). No other borrower held over 10% of the par value of outstanding advances as of December 31, 2006 or 2005. Because a large concentration of our advances is held by only a few members, changes in their borrowing decisions can significantly affect the amount of our advances outstanding. As we refocus our business on our advances, we expect that the concentration of advances with our largest borrowers will remain significant for at least 2007 and several years beyond.
As of December 31, 2006, 57.7% of our par value of our advance portfolio had a remaining term to maturity of one year or less, compared to 52.5% as of December 31, 2005 and 42.9% as of December 31, 2004. The increases in these shorter-term to maturity advances as of December 31, 2006, compared to 2005 and 2004, were primarily due to additional advances made to our largest borrowers as the result of differential pricing. The total weighted-average interest rate on the par value of our advance portfolio as of December 31, 2006 was 5.14%, compared to 4.30% and 3.70% as of December 31, 2005 and 2004. During 2006 and 2005, short-term interest rates increased substantially, while, in general, long-term interest rates modestly increased. As a result, the weighted-average interest rates on our advances with maturities within this period increased faster than the weighted-average interest rates on advances with maturities of three years or more, and the total weighted-average interest rate increased on our advance portfolio. For additional information on advances, see Note 7 in “Item 8. Financial Statements and Supplementary Data—Audited Financial Statements—Notes to Financial Statements.”
46
The following table summarizes our advance portfolio by remaining term-to-maturity and weighted-average interest rate as of December 31, 2006 and 2005.
| | | | | | | | | | | | | | |
| | | As of December 31, 2006 | | | As of December 31, 2005 | |
Term-to-Maturity and Weighted-Average Interest Rates | | Amount | | | Weighted
Average
Interest Rate
Percentage | | | Amount | | | Weighted
Average
Interest Rate
Percentage | |
| (dollars in thousands) | | | | | | | | | | | | |
2006 | | $ | | | | | % | | $ | 11,259,608 | | | 4.21 | % |
2007 | | | 16,139,522 | | | 5.24 | | | | 1,508,481 | | | 3.93 | |
2008 | | | 6,425,043 | | | 5.21 | | | | 3,868,399 | | | 4.40 | |
2009 | | | 1,238,398 | | | 4.63 | | | | 1,069,882 | | | 4.12 | |
2010 | | | 902,522 | | | 5.09 | | | | 889,719 | | | 4.93 | |
2011 | | | 782,108 | | | 4.97 | | | | 1,020,638 | | | 4.90 | |
Thereafter | | | 2,499,226 | | | 4.62 | | | | 1,838,070 | | | 4.42 | |
| | | | | | | | | | | | | | |
Total par value | | $ | 27,986,819 | | | 5.14 | | | $ | 21,454,797 | | | 4.30 | |
Overdrawn demand deposit accounts | | | 2,361 | | | | | | | 275 | | | | |
Discounts on advances | | | (6,708 | ) | | | | | | (8,536 | ) | | | |
Commitment fees | | | (1,020 | ) | | | | | | (1,017 | ) | | | |
Discount on AHP advances | | | (285 | ) | | | | | | (352 | ) | | | |
Derivatives hedging adjustments | | | (20,173 | ) | | | | | | (9,675 | ) | | | |
| | | | | | | | | | | | | | |
Total | | $ | 27,960,994 | | | | | | $ | 21,435,492 | | | | |
| | | | | | | | | | | | | | |
The percentage of variable interest-rate advances as a portion of our total advance balance as of December 31, 2006 increased to 44.0%, compared to 21.9% as of December 31, 2005. We believe the increase in variable interest-rate advances primarily resulted from our borrowers’ expectations that short-term interest rates were unlikely to increase in the near future.
The following table summarizes our advance portfolio by interest-rate payment terms as of December 31, 2006, 2005 and 2004.
| | | | | | | | | |
| | | As of December 31, | |
Advance Portfolio by Interest-Rate Payment Terms | | 2006 | | | 2005 | | | 2004 | |
Fixed interest rate | | 56.0 | % | | 78.1 | % | | 80.1 | % |
Variable interest rate | | 44.0 | | | 21.9 | | | 19.9 | |
| | | | | | | | | |
Total | | 100.0 | % | | 100.0 | % | | 100.0 | % |
| | | | | | | | | |
Member Demand for Advances. Many factors affect the demand for advances, including changes in interest rates and changes in member funding needs. Members regularly evaluate financing options relative to our advance products and pricing. The Seattle Bank’s pricing alternatives include: (i) differential pricing, through which a member can obtain lower advance rates on large transactions, as set within parameters established by our asset and liability management committee under authority delegated by our chief executive officer and overseen by our Board; (ii) advance window daily market pricing; and (iii) auction funding, through which borrowers can generally save five basis points or more, but which is offered only two times per week. Our additional advance products, increased use of differential pricing, and enhanced marketing efforts, have all contributed to the increase in advance balances. For the year ended December 31, 2006, the amount of differentially priced advances accounted for 79.5% of new advances, compared to 46.0% for the year ended December 31, 2005. The amount of window advances and auction-priced advances accounted for 10.0% and 10.5% of the new advances made for 2006, compared to 45.5% and 8.5% of advances made for 2005.
We believe that the use of differential pricing gives us greater flexibility to compete with regard to rates for more advance business. This means that rates on advances may be lower for some members than for others in
47
order to be competitive with lower rates available to those members that have alternative funding sources. In general, our larger members have more alternative funding sources and are able to access funding at lower rates than our smaller members. We believe that the use of differential pricing has increased our advance balance and will continue to do so in the future, and that the increased volume compensates us for any reduction in overall yield due to differential pricing.
The demand for advances may be affected by the manner in which we may pay dividends on the stock our members are required to purchase in connection with such advances and any applicable restrictions on their ability to have that stock redeemed or repurchased by us. In 2006 and 2005, demand for advances, particularly those that required new stock purchases, was limited as a result of our action in May 2005 to suspend the declaration or payment of dividends and to suspend the repurchase of Class B stock prior to the end of the statutory five-year redemption period, without prior approval of the OS Director in each case. On December 8, 2006, the OS Director granted us a waiver, at the request of our Board, allowing us to resume declaring and paying quarterly dividends beginning in the fourth quarter of 2006, subject to certain limitations. In December 2006, we paid a cash dividend based on the average Class B stock balance outstanding during the third quarter of 2006. We believe that our resumption of dividend payments may contribute to increased advances, particularly those that may require new stock purchases.
In June 2005, our Board approved the implementation of a change to our Capital Plan that allowed our members to support new advances with their outstanding membership stock, which is stock that a member is required to hold in order to maintain its membership. This change effectively allowed members access to additional advances, making borrowing more attractive to our members, especially those with large membership stock balances that would otherwise have been required to purchase additional capital stock in order to increase the amount of their advances.
In October 2006, the Finance Board approved amendments to our Capital Plan as proposed by our Board, which went into effect in December 2006. Our Board approved the amendments with the expectation that they would encourage new borrowing by members of the Seattle Bank and simplify the terms and provisions of the Capital Plan. Key amendments to the Capital Plan included: (i) the creation of an excess stock pool that allows a member, for new or renewing advance activity, to satisfy its total stock purchase requirement by relying on Seattle Bank capital that is associated with total outstanding excess stock, and (ii) the creation of a Class A stock with terms consistent with the Capital Plan. We believe that the creation of the excess stock pool and a Class A stock will contribute to the continued growth of our advance portfolio, notwithstanding the current restrictions relating to our repurchase of Class B stock and limitations on the payment of dividends, because members will have greater borrowing and investment flexibility. As of December 31, 2006, 4.7% of our members were using stock from the excess stock pool to support $533.1 million in additional advances. One consequence of this change, however, is that our capital will not increase as a result of the increase in advances supported by the excess stock pool. Because we must maintain a minimum regulatory capital-to-assets ratio of 4.00%, this lack of growth in capital could constrain the growth of our advances from time to time. See “—Capital Resources and Liquidity—Capital Resources—Capital Plan Amendments and Board Policies Regarding Seattle Bank Stock,” for additional information regarding the amendments to the Capital Plan and related limitations and restrictions that may affect member demand for advances.
Credit Risk. Our credit risk from advances is concentrated in commercial banks and savings institutions. As of December 31, 2006 and 2005, we had advances of $15.9 billion and $10.3 billion outstanding to two members, which represented 56.8% and 48.0% of the total advances outstanding. We held sufficient collateral to fully secure the advances to these members, and, as a result, we do not expect to incur any credit losses on these advances.
As of December 31, 2006, we had $21.6 million of outstanding advances to two borrowers that we classified as substandard. These advances are fully collateralized with high-grade, marketable securities, and rights to proceeds from mortgage loans in our possession. In January 2007, one of these borrowers paid off the $14.0 million balance of its advances. Because the remaining borrower continues to pay according to contractual
48
requirements, and because of our collateral position, we continue to accrue interest and do not expect to incur any credit losses on these advances.
In of December 2006, the Board approved the use of first lien, owner-occupied single family residential properties with FICO scores of 660 or less, as collateral for advances. To qualify as collateral, both the borrower and the loans must undergo collateral reviews and meet certain eligibility standards as set by the Board. The collateral reviews include testing for compliance with the Seattle Bank’s responsible lending policy.
Investments
We maintain a portfolio of short-term investments and a portfolio of long-term investments for liquidity purposes and to generate returns on our capital. Short-term investments generally include federal funds sold and other money market instruments, and long-term investments generally include mortgage-backed securities and agency obligations. During the second half of 2005, we increased our short-term investments in order to more fully use our capital and provide liquidity for funding advances growth. However, as our advance balance continued to increase during 2006, we significantly reduced our short-term investments accordingly. We expect investments to continue to decline as a percentage of our total assets in the future.
The following table summarizes our investments, both short- and long-term, as of December 31, 2006, 2005, and 2004.
| | | | | | | | | |
Short- and Long-Term Investments | | As of December 31, |
| (dollars in thousands) | | 2006 | | 2005 | | 2004 |
Short-Term Investments | | | | | | | | | |
Federal funds sold | | $ | 2,832,000 | | $ | 6,428,000 | | $ | 1,679,500 |
Interest-bearing deposits | | | 2,165,000 | | | 1,415,007 | | | 200,000 |
Securities purchased under agreements to resell | | | | | | 850,000 | | | |
Commercial paper | | | | | | 194,106 | | | |
Trading securities | | | | | | | | | 255,680 |
| | | | | | | | | |
Total short-term investments | | $ | 4,997,000 | | $ | 8,887,113 | | $ | 2,135,180 |
| | | | | | | | | |
Long-Term Investments | | | | | | | | | |
Consolidated obligations of other FHLBanks | | | 4,224,959 | | | 5,274,944 | | | 8,025,248 |
Mortgage-backed securities | | | 6,613,347 | | | 6,471,324 | | | 6,932,029 |
Other U.S. agency obligations | | | 146,298 | | | 221,671 | | | 387,330 |
Government-sponsored enterprise obligations | | | 2,691,238 | | | 2,698,649 | | | 4,658,793 |
State or local housing agency obligations | | | 12,067 | | | 16,900 | | | 29,100 |
Other | | | | | | | | | 255,352 |
| | | | | | | | | |
Total long-term investments | | $ | 13,687,909 | | $ | 14,683,488 | | $ | 20,287,852 |
| | | | | | | | | |
During 2006, our short-term investments decreased by $3.9 billion, primarily because we shifted proceeds from maturing investments to fund our growing advance portfolio. During 2005 (primarily the second half), we increased our balance of short-term investments by $6.8 billion to more fully use our capital and to provide liquidity to fund advances, while staying within our Board-approved minimum capital-to-assets ratio, which was 4.25%.
As of December 31, 2006, 2005, and 2004, we held $10.5 billion, $7.9 billion, and $1.4 billion in held-to-maturity investments with unrealized losses of $238.6 million, $250.1 million, and $52.8 million that had been in an unrealized loss position for over 12 months. The unrealized losses relating to our held-to-maturity investments as of December 31, 2006, 2005, and 2004 were related to declining market values as a result of overall increases in market interest rates and not to underlying credit concerns relating to the investments. Based on the creditworthiness of the issuers and underlying collateral, we believe that these unrealized losses represent
49
temporary impairments. See Note 6 in “Item 8. Financial Statements and Supplementary Data—Audited Financial Statements—Notes to Financial Statements” for additional information.
Consolidated Obligation Bonds of Other FHLBanks. As of December 31, 2006, 2005, and 2004, we held $4.2 billion, $5.3 billion, and $8.0 billion in investments in other FHLBanks’ consolidated obligation bonds. During 2006 and 2005, we sold certain of these low-yielding consolidated obligation bonds that were within three months of maturity. Our December 31, 2006 balance of these bonds decreased $1.1 billion from December 31, 2005, and we realized $6.5 million in losses on the 2006 sales. Our investment in other FHLBanks’ consolidated obligation bonds as of December 31, 2005 decreased by $2.7 billion from December 31, 2004, primarily due to maturities of and calls on the consolidated obligation bonds, but also as a result of the sale in 2005 of $250.0 million of consolidated obligation bonds. We realized a $1.2 million loss on the 2005 sale. In a regulatory interpretation issued by the Finance Board in March 2005, the Finance Board clarified that it generally prohibits an FHLBank from purchasing any consolidated obligation as part of the consolidated obligation’s initial issuance, either directly from the Office of Finance or indirectly through an underwriter.
Mortgage-Backed Securities. Our investment in mortgage-backed securities increased by $142.0 million to $6.6 billion as of December 31, 2006 from December 31, 2005, due to our strategy to increase investment income while staying within the Finance Board’s maximum limit regarding investment in these higher-yield securities. The decrease of $460.7 million in our investment in mortgage-backed securities as of December 31, 2005 from December 31, 2004 was due to maturities and principal payments. Finance Board regulations limit each FHLBank’s investment in mortgage-backed securities, at the time a security is purchased, to 300% of a bank’s regulatory capital, which in our case is comprised of capital stock, retained earnings, and mandatorily redeemable capital stock. Our investment in mortgage-backed securities represented 287.2%, 285.0%, and 320.0% of our regulatory capital as of December 31, 2006, 2005, and 2004. Although the percentage of investments in these mortgage-backed securities to our total capital was greater than 300% as of December 31, 2004, we were in compliance with the regulation due to the level of our capital at the time of each of our purchases of the securities. Our investment in mortgage-backed securities as of December 31, 2006, 2005, and 2004 included $1.0 billion, $1.1 billion, and $1.4 billion in Freddie Mac mortgage-backed securities, and $758.1 million, $1.1 billion, and $1.4 billion of investments in Fannie Mae mortgage-backed securities. The remaining investment in mortgage-backed securities is rated “AAA” (or its equivalent) by a NRSRO, such as Moody’s and Standard & Poor’s.
Other U.S. Agency Obligations. Our investments in other U.S. agency obligations consist primarily of debt securities of government agencies whose debt is guaranteed, directly or indirectly, by the U.S. government. Our investments in other U.S. agency obligations declined by $75.4 million, or 34.0%, to $146.3 million in 2006, and by $165.7 million, or 42.8%, to $221.7 million in 2005, primarily due to principal repayments from maturing securities.
Government-Sponsored Enterprises. Our held-to-maturity investments in GSEs, excluding our investments in the consolidated obligations of other FHLBanks, consist primarily of unsecured debt securities of Fannie Mae and Freddie Mac. These securities are not guaranteed, directly or indirectly, by the U.S. government. Fannie Mae securities totaled $908.5 million, $910.7 million, and $2.5 billion, and Freddie Mac securities totaled $1.5 billion, $1.5 billion, and $2.5 billion, as of December 31, 2006, 2005, and 2004. These securities represented 12.8%, 10.2%, and 21.9% of total investments as of such dates. Finance Board regulations limit any investments in the debt of any one GSE to the lower of 100% of our capital or the capital of the GSE, with the exception of the investment in other FHLBank consolidated obligations, in which we can no longer invest without Finance Board approval.
Trading Securities. As of December 31, 2004, our trading securities of $255.7 million consisted of one unsecured debt obligation of another GSE. This investment was sold in December 2005, and we have not held trading securities since such sale.
50
Mortgage Loans Held for Portfolio
The par balance of our mortgage loans held for portfolio consisted of $6.0 billion, $6.8 billion, and $8.1 billion in conventional mortgage loans and $292.1 million, $383.4 million, and $2.3 billion in government-insured mortgage loans as of December 31, 2006, 2005, and 2004. The decrease in 2006 was due to our receipt of $845.4 million in principal payments and the fact that we made no additional purchases. In 2005, we received principal payments of $1.9 billion and purchased only $89.6 million in mortgage loans. In August 2005, we also sold $1.4 billion of government-insured mortgage loans to an affiliate of one of our members. We realized a gain of $7.1 million on the sale of these mortgage loans.
In September 2005, we reclassified the remaining $424.8 million of government-insured mortgage loans as held for portfolio. During the time such mortgage loans were classified as held for sale, they were measured at the lower of cost or market value. We incurred a loss of $1.1 million, which was reported in other income (loss) in 2005, when we reclassified the unsold mortgage loans as held for portfolio. We ceased entering into new master commitment contracts in 2005 and have terminated all open contracts.
As of December 31, 2006 and 2005, 88.8% and 88.5% of our outstanding mortgage loans held for portfolio had been purchased from one participating member, Washington Mutual Bank, F.S.B.
The following table summarizes the activity and other information related to our mortgage loan portfolio as of December 31, 2006, 2005, and 2004.
| | | | | | | | | | | | |
| | | As of December 31, | |
Mortgage Loan Portfolio Activity | | 2006 | | | 2005 | | | 2004 | |
| (dollars in thousands) | | | | | | | | | |
Mortgage loan par balance at beginning of the year | | $ | 7,182,542 | | | $ | 10,375,000 | | | $ | 11,081,180 | |
Purchases | | | | | | | 89,194 | | | | 1,561,652 | |
Mortgage loans transferred to real estate owned | | | (373 | ) | | | | | | | | |
Maturities and principal amount sold | | | (845,537 | ) | | | (3,281,652 | ) | | | (2,267,832 | ) |
| | | | | | | | | | | | |
Mortgage loan par balance at period end | | | 6,336,632 | | | | 7,182,542 | | | | 10,375,000 | |
| | | | | | | | | | | | |
Mortgage loan net premium balance at beginning of the year | | | 33,065 | | | | 70,876 | | | | 90,337 | |
Net premium (discount) on purchases | | | | | | | 812 | | | | 20,572 | |
Net premium recovery from repurchases | | | (92 | ) | | | | | | | | |
Net premium amortization* | | | (2,957 | ) | | | (38,623 | ) | | | (40,033 | ) |
| | | | | | | | | | | | |
Mortgage loan net premium balance at period end | | | 30,016 | | | | 33,065 | | | | 70,876 | |
| | | | | | | | | | | | |
Total mortgage loans held for portfolio | | $ | 6,366,648 | | | $ | 7,215,607 | | | $ | 10,445,876 | |
| | | | | | | | | | | | |
Premium balance as a percent of mortgage loan par amounts | | | 0.47 | % | | | 0.46 | % | | | 0.68 | % |
Average FICO score** at origination | | | 745 | | | | 744 | | | | 743 | |
Average loan-to-value ratio at origination | | | 64.81 | % | | | 64.99 | % | | | 65.22 | % |
| * | Included in net premium amortization for 2005 are $15.4 million in net premium allocated to sold government-insured mortgage loans and an unrealized loss in fair value of $1.1 million, which was recognized on the transfer of $424.8 million of government-insured loans from held for sale to held for portfolio. |
| ** | The Fair Isaac Credit Organization, or FICO, score, is a standardized credit score used as an indicator of consumer financial responsibility, based on credit history. |
Derivative Assets and Liabilities
As of December 31, 2006, 2005, and 2004, we held derivative assets, including associated accrued interest receivable and interest payable, of $146.9 million, $13.2 million, and $24.5 million and derivative liabilities of $46.8 million, $133.8 million, and $274.8 million. The changes in these balances reflect the effect of interest-rate changes on the fair value of our derivatives, as well as expirations and terminations of outstanding interest-rate exchange agreements and entry into new interest-rate exchange agreements between December 31, 2006 and
51
December 31, 2004. The differentials between accruals of interest receivable and interest payable on derivatives are recognized as adjustments to the income or expense of the designated underlying investment securities, advances, consolidated obligations, or other financial instruments. We record all derivative financial instruments in the Statements of Condition at fair value, with changes in the fair value reported in earnings. See “—Summary of Critical Accounting Policies and Estimates—Derivatives and Hedging” for additional information.
We have traditionally used derivatives to hedge advances and consolidated obligations, as well as mortgage loans under our MPP and intermediary swaps for members. The principal derivative instruments we use are interest-rate exchange agreements such as interest-rate swaps, interest-rate caps, interest-rate floors, forward contracts, and swaptions. We classify these types of interest-rate exchange agreements as derivative assets or liabilities according to the net fair value of the derivatives and associated accrued interest receivable and interest payable by counterparty, when appropriate under individual master netting agreements. Subject to a master netting agreement, if the net fair value of the derivatives by counterparty is positive, the net fair value is reported as an asset, and if negative, the net fair value is reported as a liability. Changes in the fair value of interest-rate exchange agreements are recorded directly through earnings.
The notional amount of interest-rate exchange agreements increased by $14.7 billion, to $33.2 billion, as of December 31, 2006, compared to December 31, 2005, and increased by $2.6 billion, to $18.5 billion as of December 31, 2005, compared to December 31, 2004. These increases were primarily related to our increased use of interest-rate exchange agreements to lower our cost of funds and reduce our interest-rate risk. Notional amounts are used to calculate the periodic amounts to be received and paid under interest-rate exchange agreements and do not represent actual amounts to be exchanged or directly reflect our exposure to credit risk. Notional amounts are not recorded as assets or liabilities in our Statements of Condition. For additional information, see “—Summary of Critical Accounting Policies and Estimates—Derivatives and Hedging” and “Item 7A. Quantitative and Qualitative Disclosures About Market Risk.”
The total notional amount of intermediary swaps decreased by $167.3 million, to $605.5 million, as of December 31, 2006, compared to December 31, 2005, and decreased by $84.0 million, to $772.8 million, as of December 31, 2005, compared to December 31, 2004. As of December 31, 2006, $111.0 million of the total notional amount outstanding on intermediary swaps was related to member intermediary swaps, a decline of $10.0 million from the December 31, 2005 amount. Due to low transaction volumes, we discontinued offering member intermediary swaps as a standard product in 2004. Our smaller members generally did not have the resources required to utilize and manage the interest-rate exposure associated with interest-rate swaps and our larger members were able to directly access the swap market. Although we have discontinued entering into new member intermediary swaps, we are maintaining our existing transactions until maturity. We also enter into swap transactions that are deemed to be intermediary swaps to offset swap transactions that were previously in hedge relationships where the hedged item has been terminated. The notional amount of these intermediary swap transactions decreased by $157.3 million, to $494.5 million as of December 31, 2006, from December 31, 2005, and increased by $416.0 million, to $651.8 million as of December 31, 2005, from December 31, 2004.
Consolidated Obligations and Other Funding Sources
Our principal liabilities are the consolidated obligation discount notes and bonds issued on our behalf by the Office of Finance, and to a significantly lesser degree, a variety of other funding sources such as our member deposits. Although we are jointly and severally liable for all consolidated obligations issued by the Office of Finance on behalf of all of the FHLBanks, we report only the portion of consolidated obligations issued on our behalf for which we are the primary obligor. As of December 31, 2006, Standard and Poor’s outlook for the Seattle Bank was negative and Moody’s outlook was stable. On January 19, 2007, Standard and Poor’s revised its outlook to stable. See “Part I. Item 1. Business—Debt Financing,” for information about the FHLBanks’ joint and several liability and rating agency actions related to the Seattle Bank.
Consolidated Obligation Discount Notes.Our allocated portion of the FHLBank System’s combined consolidated obligation discount notes outstanding was a par amount of $1.5 billion, $10.6 billion, and $2.8
52
billion as of December 31, 2006, 2005, and 2004. Consolidated obligation discount notes represented 3.0%, 21.8%, and 6.4% of our outstanding consolidated obligations as of December 31, 2006, 2005, and 2004. Discount notes are primarily used to finance short-term advances and short-term investments. The balance of discount notes decreased $9.1 billion as of December 31, 2006, compared to December 31, 2005, primarily due to the increase in our use of interest-rate swapped consolidated obligation bonds with option features, or structured funding, to reduce our funding cost and manage our liquidity, and the decrease in our short-term investments portfolio. The balance of discount notes increased $7.8 billion as of December 31, 2005 from December 31, 2004, largely because we used discount notes to fund $6.8 billion in additional short-term investments made to more fully use our capital and to provide liquidity for advances growth.
Consolidated Obligation Bonds. Our allocated portion of the FHLBank System’s combined consolidated obligation bonds outstanding was a par amount of $48.2 billion, $38.1 billion, and $41.4 billion as of December 31, 2006, 2005, and 2004. Consolidated obligation bonds are primarily used to finance advances and investments, both short-term and long-term. Consolidated obligation bonds represented 97.0%, 78.2%, and 93.6% of our total outstanding consolidated obligations as of December 31, 2006, 2005, and 2004. The increase in our consolidated obligation bonds as of December 31, 2006, compared to December 31, 2005, was primarily the result of an increase in our use of structured funding rather than the use of consolidated obligation discount notes. The decrease in our consolidated obligation bonds as of December 31, 2005, compared to December 31, 2004, was the result of declines in our funding of the MPP and long-term investments during 2005.
We seek to manage our consolidated obligation portfolio by matching the anticipated cash flows of our debt to the anticipated cash flows of our assets. The cash flows of mortgage-based assets are largely dependent on the prepayment behavior of borrowers. When interest rates rise, and all other factors remain unchanged, borrowers (and issuers of callable investments) tend to refinance their debts more slowly than originally anticipated, while when interest rates fall, borrowers tend to refinance their debts more rapidly than originally anticipated. We use a combination of bullet and callable debt in seeking to match the anticipated cash flows of our mortgage-based assets and callable investments, using a variety of prepayment scenarios.
With callable debt, we have the option to repay the obligation, without penalty, prior to the contractual maturity date of the debt obligation, while with bullet debt we repay the obligation at maturity. Our callable debt is predominantly fixed interest-rate debt that may be used to fund our mortgage-based assets or that may be swapped to LIBOR and used to fund variable interest-rate advances and investments. The call feature embedded in our debt is typically matched with a call feature in the swap, giving the swap counterparty the right to cancel the swap under certain circumstances. In a falling interest-rate environment, the swap counterparty typically exercises its call option on the swap and we, in turn, call the debt. To the extent we continue to have variable interest-rate advances or investments, or other short-term-to-maturity assets, we replace the called debt with new callable debt that is swapped to LIBOR. This strategy is typically less expensive than borrowing through the issuance of discount notes; however, we must still use discount notes because this callable-debt strategy is not practical for funding some short-term investments, such as overnight federal funds.
Our callable debt increased by $5.3 billion, to $24.5 billion, as of December 31, 2006, compared to December 31, 2005, primarily due to growth in our structured funding portfolio. This relative increase in our use of callable debt reflects more favorable pricing of callable consolidated obligation bonds with associated interest-rate exchange agreements relative to unswapped consolidated discount notes. Our callable debt increased by $2.1 billion as of December 31, 2005, compared to December 31, 2004, principally due to growth in our long-term advances. In 2005, we also implemented a strategy to hedge MPP mortgage loans, investments, and advances primarily with callable consolidated obligations in order to decrease our reliance on stand-alone interest-rate exchange agreements and reduce our hedge expense going forward. We continue to classify our debt as callable after the last call date has passed.
During 2006, we repurchased $283.1 million in fixed interest-rate debt with a weighted-average interest rate of 5.95%, resulting in a net gain of $6.6 million. The gains from these repurchases were used to offset the losses associated with selling low-yielding held-to-maturity securities that were within 90 days of maturity. In addition,
53
we had a $669,000 net gain associated with extinguishing consolidated obligations by exercising our call options on those bonds. During 2005, we repurchased $335.4 million of fixed interest-rate bullet debt with a weighted-average interest rate of 6.10%, resulting in a net loss of $9.4 million. We repurchased this debt primarily to economically lower the cost of our debt in future years, as the future cash outflows of the replacement debt is lower than the cash outflows scheduled for the repurchased debt. We continue to review our consolidated obligation portfolio for opportunities to extinguish debt, lower our interest expense, and better match the duration of our liabilities to that of our assets.
Other Funding Sources. Deposits are a source of funds that give members a liquid, low-risk investment. We offer demand and term deposit programs to our members and to other eligible depositors. There is no requirement for members or other eligible depositors to maintain balances with us, and, as a result, these balances fluctuate. Deposits increased by $203.1 million to $1.0 billion as of December 31, 2006 from December 31, 2005, primarily due to a $208.4 million increase in demand and overnight deposits. Deposits decreased by $212.5 million to $800.8 million, as of December 31, 2005 from December 31, 2004. Demand deposits comprised the largest percentage of deposits, representing 92.2%, 89.6%, and 85.6% of deposits as of December 31, 2006, 2005, and 2004. In addition, to provide short-term, low-cost liquidity, we sell securities under agreements to repurchase the securities. There were no transactions outstanding under repurchase agreements as of December 31, 2006. Transactions outstanding under agreements to repurchase securities were $393.5 million and $79.3 million as of December 31, 2005 and 2004.
Other Liabilities
Other liabilities totaled $35.0 million as of December 31, 2006 and 2005. Other liabilities increased by $12.3 million in 2005, compared to December 31, 2004, primarily due to $5.4 million of lease abandonment costs and additions of $4.4 million to the lender risk account.
Capital Resources and Liquidity
Our capital resources consist of capital stock held by our members and nonmember stockholders’ retained earnings, and other comprehensive income. The amount of our capital resources does not take into account our joint and several liability for the consolidated obligations of other FHLBanks. See Note 13 in “Item 8. Financial Statements and Supplementary Data—Audited Financial Statements—Notes to Financial Statements” for additional information. Our principal sources of liquidity are the proceeds from the issuance of consolidated obligations and our short-term investments.
Capital Resources
Our capital resources increased $30.0 million, or 1.4%, as of December 31, 2006, from December 31, 2005. The changes during 2006 were driven by changes in the amount of our capital stock, our retained earnings, and the amount of our other accumulated comprehensive income, which included an adjustment of $2.1 million to other accumulated comprehensive loss due to the recognition of unfunded post-retirement benefit plan obligations in accordance with our adoption of SFAS 158 (as defined below) as of December 31, 2006.
Seattle Bank Stock. Prior to the implementation of the Capital Plan amendments described below, the Seattle Bank had two classes of capital stock, Class B(1) stock and Class B(2) stock. Each class of stock could be issued, redeemed, and repurchased only at par value, $100 per share. Class B(1) stock represented the stock that members were required to hold based on minimum membership requirements, the volume of their business activity with us, and, in some instances, a certain amount of excess stock that a member was allowed to hold that exceeded the stock required for membership or business activity. Class B(2) stock represented stock that a member was no longer required to hold, generally as a result of a decline in its activity with us, that exceeded the amount of allowable excess Class B (1) stock.
In October 2006, the Finance Board approved amendments to our Capital Plan that simplified its terms and provisions, and the amendments became effective in December 2006. Included in the amendments to the Capital
54
Plan were the conversions of our Class B(1) stock and Class B(2) stock into a single Class B stock. As with the previous classes of Class B stock, Class B stock can be issued, redeemed, and repurchased only at par value, $100 per share. Class B stock is redeemable five years after: (1) written notice from the member; (2) consolidation or merger of a member with a nonmember; or (3) withdrawal or termination of membership. All stock redemptions are subject to restrictions set forth in the FHLBank Act, Finance Board regulations, our Capital Plan, and resolutions adopted by our Board. Historically, we have elected to repurchase stock that was subject to redemption prior to the expiration of the five-year redemption period that applies to each outstanding redemption request. However, as further described below, our Board has adopted limitations on our ability to repurchase capital stock from members. As of December 31, 2006 and 2005, Class B stock (for 2005, Class B(1) stock and Class B(2) stock are combined) totaled $2.2 billion, with $207.5 million and $188.2 million in Class B stock redemption requests and requests to withdraw from membership. All of the Class B stock related to member withdrawals has been classified as mandatorily redeemable Class B stock in our Statement of Condition.
Capital Plan Amendments and Board Policies Regarding Seattle Bank Stock.The Board approved the December 2006 amendments to our Capital Plan with the expectation that they would encourage new borrowing by members of the Seattle Bank and simplify the terms and provisions of the Capital Plan. Other than the conversion of the two classes of Class B stock into a single class of Class B stock, the key amendments made to the Capital Plan included provisions for:
Class A Stock. Class A stock, may be issued, redeemed, and repurchased only at a par value of $100 per share. Class A stock may only be issued to members to satisfy a member’s advance stock purchase requirement for: (i) a new advance or (ii) renewal of an existing advance initially supported by the excess stock pool, and only in the case where a member has no excess stock available to support a new advance or to renew an existing advance. Class A stock is redeemable in cash on six months’ written notice to the Seattle Bank and can only be repurchased by the Seattle Bank pursuant to the terms of the Capital Plan. The Board adopted a resolution limiting dividends on Class A stock, if any, to cash payments, subject to any applicable restrictions, and dividends on Class A stock will not necessarily be paid at the same rate as dividends, if any, on Class B stock. A member can only use Class A stock to meet its member advance stock purchase requirement and can not use it to meet its other requirements relating to stockholdings.
Excess Stock Pool. The excess stock pool allows a member, when receiving advances from us, to satisfy its advance stock purchase requirement by relying on Seattle Bank capital that is associated with total outstanding excess stock. Excess stock is the amount of stock held by a member in excess of its total stock purchase requirement, which is the greater of the member’s membership stock purchase requirement or the sum of: (i) the member’s advance stock purchase requirement and (ii) the member’s mortgage purchase plan stock purchase requirement. There are certain limitations relating to the Seattle Bank’s use of the excess stock pool, including among others, restricting the aggregate use of the excess stock pool to 50% of the total amount of all excess stock and the ability of the Board to suspend the use of the excess stock pool at any time. There are also per-member limitations that include: (i) a maturity limit of one year on advances supported by the excess stock pool, (ii) a per-member usage limit of 25% of the total amount of the excess stock pool, and (iii) a maximum dollar threshold whereby a member cannot use the excess stock pool to support additional advances if, on the date the advance would be received by the member, the member’s total outstanding advances exceed $11.0 billion. The authority to use the excess stock pool to support additional advances terminates on October 1, 2008, unless extended by our Board following approval by the Finance Board.
Additional significant changes to our Capital Plan from the December 2006 amendments include:
| | • | | providing that dividends on Class A and Class B stock shall be set and paid as determined by the Board, on a pro rata basis as to amount and character with respect to each class (subject to the Seattle Bank’s current limitations on payment of dividends); and |
| | • | | streamlining the formulas for calculating various requirements, including a member’s total stock purchase requirement. |
55
In actions relating to approval of the December 2006 amendments, our Board resolved that the Seattle Bank would maintain a 4.00% member advance stock purchase requirement and would not repurchase Class B stock during the period the excess stock pool is in effect and would seek prior written authorization of the OS Director if the Seattle Bank wished to lower that requirement or repurchase Class B stock thereafter.
In May 2005, the Finance Board accepted the business plan which was initially implemented under the terms of the Written Agreement and subject to our adoption of certain dividend and stock repurchase restrictions. To meet the Finance Board conditions, our Board adopted these policies:
| | • | | suspending indefinitely the declaration or payment of any dividend and providing that any future dividend declaration or payment may be made only after prior approval of the OS Director, and |
| | • | | suspending indefinitely the repurchase of any Class B(1) or Class B(2) stock, except that a limited amount of Class B(2) stock repurchases may be made after prior approval of the OS Director. |
The Finance Board’s termination of the Written Agreement in January, 2007 did not affect the above-described restrictions on Class B stock repurchases. However, in December 2006, the OS Director did grant to the Seattle Bank a waiver of certain restrictions on the authority of the Seattle Bank to pay dividends. See “—Retained Earnings and Dividends” for additional information related to this waiver.
In June 2005, to encourage members to increase their advance borrowings, our Board implemented a change to our Capital Plan that allows our members to use their outstanding membership stock to support advances. Previously, members were required to purchase additional stock, in addition to their membership requirements, in order to increase their advance balances. Membership stock is a requirement to maintain membership in the FHLBank.
In addition, in March 2006, to address members’ concerns about purchasing additional shares of our capital stock in order to meet their membership stock requirements, our Board reduced the membership stock requirement for 2006 from the greater of $500 or 0.75% of a member’s mortgage loans and mortgage-loan pass-through securities to the greater of $500 or 0.50% of such loans and securities.
Retained Earnings and Dividends. In general, our retained earnings represent our net income after the payment of any dividends to our members. During 2006, our net income increased $24.1 million, to $25.8 million, compared to 2005, and decreased by $81.0 million in 2005, compared to 2004.
Generally under our Capital Plan, our Board can declare and pay dividends, in either cash or capital stock, only from retained earnings or current net earnings. However, the Board adopted a resolution limiting dividends on Class A stock to cash in September 2006. Prior to the cash dividend in late December 2006, we had only declared dividends in the form of capital stock since 1986, except for immaterial cash payments relating to dividends on fractional shares of stock of a member that cannot be rounded to the nearest 100.
Pursuant to a waiver received from the OS Director in December 2006 relating to payment of dividends, as further described in the table below, the Board declared and paid in December 2006 a cash dividend of $2.1 million, or $0.10 per share, on our Class B stock based upon the average amount of such stock outstanding during the third quarter of 2006. In January 2007, the Board declared a cash dividend of $2.2 million, or $.10 per share, on our Class B stock based upon the average amount of such stock outstanding during the fourth quarter of 2006. The dividend was paid in February 2007.
| | | | | | | | | | |
| | | For the Years Ended December 31, | |
Cash and Stock Issued as Dividends | | 2006 | | 2005 | | 2004 | |
| (dollars in millions, except percentages) | | | | | | | |
Stock issued as dividends | | $ | | | $ | 8.5 | | $ | 64.2 | |
Stock issued as dividends, and repurchased | | | | | | | | | 15.3 | |
Cash paid as dividends | | | 2.1 | | | | | | | |
Percentage of stock issued as dividends, and repurchased | | | | | | | | | 23.7 | % |
56
In September 2004, our Board adopted a revised retained earnings policy in accordance with Finance Board guidance. Under this policy, we establish retained earnings targets each quarter, and we plan to adjust the target level of retained earnings over time as determined by the Board or to any higher level that may be required in the future by regulation. As of December 31, 2006, the target was set at $102.0 million. We reported retained earnings of $92.4 million and $68.8 million as of December 31, 2006 and December 31, 2005.
In November 2004, our Board adopted a new dividend policy regarding the declaration and payment of dividends, which became effective for the fourth quarter of 2004. Under the new policy, dividend declarations, if any, during a quarter are based on the earnings of the previous quarter. In the first quarter of 2005, we declared and paid a member dividend based on average capital stock outstanding and earnings for the fourth quarter of 2004, subject to our then-current capital requirements, retained earnings policy, and dividend limits.
Under a Board policy adopted in December 2006, we are limited to paying dividends no greater than 50% of our current-period earnings until our retained earnings target has been met. Our longer term goal is to pay members a dividend based on a variable short-term interest rate, such as the federal funds rate or three-month LIBOR, subject to applicable dividend restrictions and capital requirements.
Under the December 2006 waiver from the OS Director that was requested by our Board, the Seattle Bank was given the ability to pay quarterly cash dividends to our members within the following parameters:
| | • | | Dividends paid during the fourth quarter of 2006 could not exceed 50% of third quarter 2006 net income, as calculated pursuant to U.S. GAAP; |
| | • | | Total dividends paid during the fourth quarter of 2006 and the first quarter of 2007 could not exceed 50% of combined third quarter and fourth quarter 2006 net income, as calculated pursuant to U.S. GAAP; |
| | • | | Total dividends paid during the second, third and fourth quarters of any calendar year (any such calendar year being referred to as “Year N”) and the first quarter of the immediately following calendar year (the four quarters being the “Year N Quarters”) cannot exceed 50% of net income for Year N, as calculated pursuant to U.S. GAAP net income; |
| | • | | After the first quarter of 2007, dividends paid during any particular Year N Quarter can exceed 50% of the net income for the immediately preceding Year N Quarter, but only if and to the extent that the aggregate amount of dividends paid with respect to earlier Year N Quarters does not exceed 50% of aggregate year-to-date net income, as calculated pursuant to U.S. GAAP, through the end of the immediately preceding Year N Quarter. |
Prior to the receipt of the waiver described above, since May 2005, our Board had indefinitely suspended the declaration and payment of dividends on capital stock without prior approval by the OS Director, in connection with the Finance Board approval of the initial business plan.
In December 2006, the Finance Board issued a final rule that prohibits an FHLBank from declaring and paying stock dividends if its excess stock balance is greater than one percent of its total assets. As of December 31, 2006, the Seattle Bank had excess stock of $902.2 million, or 1.7% of total assets, and is currently prohibited from issuing stock dividends.
Statutory Capital Requirements. The Gramm-Leach-Bliley Act of 1999, or the GLB Act, required each FHLBank to adopt a capital plan and convert to a new capital structure. The Finance Board’s capital rule, which implemented the capital provisions of the GLB Act, required each FHLBank to submit a Capital Plan to the Finance Board by October 29, 2001. The Finance Board approved our Capital Plan and we converted to our new capital structure during 2002. The conversion was considered a capital transaction and was accounted for at par value.
We are subject to three capital requirements under our Capital Plan and the Finance Board rules and regulations: (1) risk-based capital, (2) total capital, and (3) leverage capital.
57
First, under the risk-based capital requirement, we must maintain at all times permanent capital in an amount at least equal to the sum of our credit risk, market risk, and operations risk capital requirements, all of which are calculated in accordance with the rules and regulations of the Finance Board.
| | • | | Credit risk is the potential for financial loss because of the failure of a borrower or counterparty to perform on an obligation. The credit-risk requirement is determined by adding the credit-risk capital charges for assets, off-balance sheet items, and derivative contracts based on, among other things, the credit percentages assigned to each item as required by federal law and regulations. |
| | • | | Market risk is the potential for financial losses due to the increase or decrease in the value or price of an asset or liability resulting from broad movements in prices, such as interest rates. The market-risk requirement is determined by adding the market value of the portfolio at risk from movements in interest-rate fluctuations that could occur during times of market stress and the amount, if any, by which the current market value of our total capital is less than 85% of the book value of our total capital. We calculate the market value of our portfolio at risk and the current market value of our total capital by using an internal model. Our modeling approach and underlying assumptions are subject to Finance Board review and approval on an ongoing basis. |
| | • | | Operations risk is the potential for unexpected financial losses due to inadequate information systems, operational problems, breaches in internal controls, or fraud. The operations risk requirement is determined as a percentage of the market-risk and credit risk requirements. The Finance Board has determined this risk requirement to be 30% of the sum of the credit-risk and market-risk requirements described above. |
The Finance Board has the authority to require us to maintain a greater amount of permanent capital than is required by the risk-based capital requirement, but to date has not exercised such authority. Only permanent capital, defined as retained earnings and Class B stock, can satisfy the risk-based capital requirement. Mandatorily redeemable Class B stock is included in our permanent capital based on a directive from the Finance Board. Class A stock and accumulated other comprehensive income are considered nonpermanent capital.
Second, we are required to maintain at all times a total regulatory capital-to-assets ratio of at least 4.00%. Total capital is the sum of permanent capital, Class A stock, other comprehensive income, any general loss allowance, if consistent with U.S. GAAP and not established for specific assets, and other amounts from sources determined by the Finance Board as available to absorb losses. However, as described below, we are subject to a higher Board-approved minimum capital requirement. For the purposes of the capital-to-assets ratio, capital is defined as permanent capital plus non-permanent capital, divided by total assets.
The following table presents our permanent capital and risk-based capital requirements as of December 31, 2006 and 2005.
| | | | | | |
| | | As of December 31, |
Permanent and Risk-Based Capital Requirements | | 2006 | | 2005 |
| (dollars in thousands) | | | | |
Permanent Capital | | | | | | |
Class B stock * | | $ | 2,140,997 | | $ | 2,132,534 |
Mandatorily redeemable Class B stock | | | 69,222 | | | 66,259 |
Retained earnings | | | 92,397 | | | 68,759 |
| | | | | | |
Permanent capital | | $ | 2,302,616 | | $ | 2,267,552 |
| | | | | | |
Risk-Based Capital Requirement | | | | | | |
Credit risk | | | 140,870 | | | 180,588 |
Market risk | | | 109,732 | | | 174,383 |
Operations risk | | | 75,180 | | | 106,492 |
| | | | | | |
Risk-based capital requirement | | $ | 325,782 | | $ | 461,463 |
| | | | | | |
| * | Pursuant to amendments to our Capital Plan in December 2006, Class B(1) stock and Class B(2) stock were converted into a single class of Class B stock. |
58
Pursuant to action taken by the Board in January 2007, our minimum capital-to-assets ratio is currently 4.05%. From time to time, adherence to our minimum capital-to-assets ratio may constrain our capacity to make advances to members because advances may increase our total assets without increasing our total capital. Between December 2004 and January 2007, under the terms of the business plan, the Board had set our minimum capital-to-assets ratio at 4.25%.
The following table presents our capital-to-assets ratios as of December 31, 2006 and 2005.
| | | | | | | | |
Capital-to-Assets Ratios | | As of December 31, | |
| (dollars in thousands) | | 2006 | | | 2005 | |
Minimum supervisory capital (4.25% of total assets as of December 31, 2006 and 2005) | | $ | 2,274,377 | | | $ | 2,233,017 | |
Total permanent capital | | | 2,302,616 | | | | 2,267,552 | |
Capital-to-assets ratio (total capital as a percentage of total assets) | | | 4.30 | % | | | 4.32 | % |
Third, we are required to maintain a 5.00% minimum leverage ratio based on leverage capital and our total assets. Leverage capital is defined as the sum of permanent capital weighted by a 1.5 multiplier plus nonpermanent capital, divided by total assets. A minimum leverage ratio is intended to ensure that we maintain a sufficient amount of permanent capital.
The following table presents our leverage ratios as of December 31, 2006 and 2005.
| | | | | | | | |
| | | As of December 31, | |
Leverage Ratios | | 2006 | | | 2005 | |
| (dollars in thousands) | | | | | | |
Minimum leverage capital (5.00% of total assets) | | $ | 2,675,737 | | | $ | 2,627,079 | |
Leverage capital (includes 1.5 weighting factor applicable to permanent capital) | | | 3,453,922 | | | | 3,401,328 | |
Leverage ratio (leverage capital as a percentage of total assets) | | | 6.45 | % | | | 6.47 | % |
Liquidity
We are required to maintain liquidity in accordance with federal laws and regulations, and policies established by our Board. In addition, in their asset and liability management planning, members may look to the Seattle Bank as a source of standby liquidity. We seek to meet our members’ credit and liquidity needs, while complying with regulatory requirements and board-established policies, without maintaining excessive holdings of low-yield liquid investments or incurring unnecessarily high borrowing costs. We actively manage our liquidity to preserve stable, reliable, and cost-effective sources of funds to meet all current and future normal operating financial commitments.
Our primary sources of liquidity are short-term investments and the proceeds of new consolidated obligation issuances. Secondary sources of liquidity are other short-term borrowings, including federal funds purchased, and securities sold under agreements to repurchase. Member deposits and capital are also liquidity sources. To ensure that adequate liquidity is available to meet our requirements, we monitor and forecast our future cash flows and anticipated member liquidity needs, and we adjust our funding and investment strategies as needed. Our access to liquidity may be negatively affected by, among other things, rating agency actions and changes in demand for FHLBank System debt or regulatory action that would limit debt issuances.
Federal regulations require the FHLBanks to maintain, in the aggregate, unpledged qualifying assets equal to the consolidated obligations outstanding. Qualifying assets are cash, secured advances, assets with an assessment or rating at least equivalent to the current assessment or rating of the consolidated obligations, mortgage loans or other securities of or issued by the U.S. government or its agencies, and securities that
59
fiduciary and trust funds may invest in under the laws of the state in which the FHLBank is located. The following table presents our compliance with this requirement as of December 31, 2006, 2005, and 2004.
| | | | | | | | | |
| | | As of December 31, |
Unpledged Qualifying Assets | | 2006 | | 2005 | | 2004 |
| (dollars in thousands) | | | | | | |
Outstanding debt | | $ | 49,536,576 | | $ | 48,502,508 | | $ | 44,106,197 |
Aggregate qualifying assets | | | 53,337,012 | | | 52,083,267 | | | 47,907,897 |
We maintain contingency liquidity plans designed to enable us to meet our obligations and the liquidity needs of our members in the event of operational disruptions at the Seattle Bank or the Office of Finance or financial market disruptions. These include back-up funding sources in the repurchase and federal funds markets. In addition, the event of a financial market disruption in which the FHLBank System is not able to issue consolidated obligations, we could pledge our held-to-maturity investment portfolio to borrow funds. Our investment portfolio includes high-quality investment securities that are readily marketable. Our long-term investments include U.S. agency obligations and mortgage-backed securities, of which almost 100% were rated “AA+” by Standard & Poor’s or “Aaa” by Moody’s as of December 31, 2006.
As of December 31, 2006, we also were in compliance with other federal laws and regulations and policies established by our Board relating to liquidity. For additional information on our statutory liquidity requirements, see “Part I. Item 1. Business—Regulation—Liquidity Requirements.”
Contractual Obligations and Other Commitments
The following table presents our contractual obligations and commitments as of December 31, 2006.
| | | | | | | | | | | | | | | |
| | | As of December 31, |
| | | Payment Due by Period |
Contractual Obligations and Commitments | | Less than 1 Year | | 1 to 3 Years | | 3 to 5 Years | | Thereafter | | Total |
| (dollars in thousands) | | | | | | | | | | |
Member term deposits | | $ | 64,499 | | $ | | | $ | | | $ | | | $ | 64,499 |
Securities sold under agreement to repurchase | | | | | | | | | | | | | | | |
Consolidated obligations | | | 20,272,290 | | | 14,792,570 | | | 4,040,165 | | | 9,116,065 | | | 48,221,090 |
Consolidated obligation bonds traded not settled | | | 100,000 | | | 700,000 | | | 50,000 | | | | | | 850,000 |
Derivative liabilities | | | 46,846 | | | | | | | | | | | | 46,846 |
Mandatorily redeemable capital stock | | | | | | 63,622 | | | 5,600 | | | | | | 69,222 |
Operating leases | | | 2,373 | | | 5,750 | | | 6,109 | | | 4,213 | | | 18,445 |
| | | | | | | | | | | | | | | |
Total contractual obligations | | $ | 20,486,008 | | $ | 15,561,942 | | $ | 4,101,874 | | $ | 9,120,278 | | $ | 49,270,102 |
| | | | | | | | | | | | | | | |
Other Commitments | | | | | | | | | | | | | | | |
Commitments for additional advances | | $ | 29,638 | | $ | 16,589 | | $ | | | $ | | | $ | 46,227 |
Standby letters of credit | | | 135,200 | | | | | | 354 | | | 73 | | | 135,627 |
Standby bond purchase agreements | | | | | | 68,855 | | | | | | | | | 68,855 |
Unused lines of credit and other commitments | | | | | | 50,000 | | | | | | | | | 50,000 |
| | | | | | | | | | | | | | | |
Total other commitments | | $ | 164,838 | | $ | 135,444 | | $ | 354 | | $ | 73 | | $ | 300,709 |
| | | | | | | | | | | | | | | |
In June 2006, the FHLBanks entered into the Contingency Agreement, effective in July 2006. The FHLBanks and the Office of Finance entered into the Contingency Agreement in response to the Board of Governors of the Federal Reserve System revising its Policy Statement on Payments System Risk concerning the
60
disbursement by the Federal Reserve Banks of interest and principal payments on securities issued by GSEs, such as the FHLBanks. Under the Contingency Agreement, in the event that one or more FHLBanks does not fund its principal and interest payments under a consolidated obligation by deadlines agreed upon by the FHLBanks, the other FHLBanks will be responsible for those payments in the manner described in the Contingency Agreement. We have not funded any consolidated obligation principal and interest payments under the Contingency Agreement.
Results of Operations
For the Years Ended December 31, 2006, 2005, and 2004
The Seattle Bank’s net income was $25.8 million for 2006, compared to $1.7 million and $82.7 million for 2005 and 2004, increasing 1,403.7% for 2006 from 2005 and decreasing 97.9% for 2005 from 2004.
The operating results for 2006 reflected the continued negative effects of a flattening yield curve, due to significant increases in short-term interest rates, as well as our continued refocus on our advance business. The increase in our net income in 2006, compared to 2005, was primarily due to a net gain of $26.9 million in derivatives and hedging activities, a $21.9 million reduction in operating expenses, and a net gain on early extinguishment of consolidated obligations of $16.7 million, partially offset by a $19.8 million decrease in net interest income, and a $5.3 million increase in losses from sales of held-to-maturity securities.
The decline in operating results for 2005 reflected the negative effects of the flattening yield curve due to significant increases in short-term interest rates, as well as actions we took to refocus our business on advances. Because we held more short-term liabilities than short-term assets, and short-term interest rates increased significantly, driven by a 200 basis point increase in the federal funds rate during 2005, our short-term cost of funds increased more than our short-term asset yields, primarily causing the $58.8 million decline in our net interest income in 2005. In addition, actions taken in accordance with our business plan to refocus our business on advances and to improve our overall level of interest-rate risk negatively affected our earnings in 2005. These actions included recording large nonrecurring charges that increased our other expenses by $17.9 million, and hedging activities and debt extinguishment related to restructuring our balance sheet that decreased our other income by $31.3 million.
Net Interest Income
Net interest income is the primary performance measure for our ongoing operations. Our net interest income consists of interest earned on advances, mortgage loans held for portfolio, and investments, less interest accrued or paid on consolidated obligations, deposits, and other borrowings. Our net interest income is affected by changes in the average balance (volume) of our interest-earning assets and interest-bearing liabilities and changes in the average yield (rate) for both the interest-earning assets and interest-bearing liabilities. These changes are influenced by economic factors and by changes in our products or services. Interest rates are the primary economic factor affecting net interest income. Beginning in 2001 and through 2003, the Federal Reserve Open Market Committee reduced its target for the federal funds rate by 550 basis points. Although the federal funds rate increased by 100 basis points during 2006, 200 basis points during 2005, and 125 basis points during 2004, the historically low interest rates and the sustained period of such low interest rates significantly impacted net interest income in 2005 and 2006, and continue to impact, our net interest income through both our interest income and interest expense.
61
The following table presents the components of our net interest income for the years ended December 31, 2006, 2005, and 2004.
| | | | | | | | | | | | | | | |
| | | For the Years Ended December 31, | |
Net Interest Income | | 2006 | | 2005 | | 2006 v. 2005
Percent
Increase /
(Decrease) | | | 2004 | | 2005 v. 2004
Percent
Increase /
(Decrease) | |
| (dollars in thousands) | | | | | | | | | | | | |
Interest income | | $ | 2,532,993 | | $ | 1,960,919 | | 29.2 | % | | $ | 1,672,959 | | 17.2 | % |
Interest expense | | | 2,455,973 | | | 1,864,129 | | 31.7 | | | | 1,517,323 | | 22.9 | |
| | | | | | | | | | | | | | | |
| Net interest income | | $ | 77,020 | | $ | 96,790 | | (20.4 | )% | | $ | 155,636 | | (37.8 | )% |
| | | | | | | | | | | | | | | |
Both total interest income and total interest expense increased for the years ended December 31, 2006 and 2005, compared to the previous periods, because of the higher prevailing interest rates and increases in advances and the debt required to fund those advances. As discussed in more detail below, our net interest income declined, primarily due to the continuing effects of both the flattened yield curve and our investment in the consolidated obligations of other FHLBanks.
In addition, the requirements of the Written Agreement (which was terminated in January 2007), implementation of the business plan, and changes to our policies relating to retained earnings, dividends, and stock repurchases have had and could in the future have a negative impact on our net interest income.
62
Average Balances, Interest Income and Expense, and Average Yields. The following table presents average balances and yields, and interest income and expense of major categories of interest-earning assets and interest-bearing liabilities, for the years ended December 31, 2006, 2005, and 2004. The table also presents spreads between the average yield on total earning assets and the average cost of interest-bearing liabilities for the years ended December 31, 2006, 2005, and 2004.
| | | | | | | | | | | | | | | | | | | | | | | | | | | | |
| | | For the Years Ended December 31, | |
| | | 2006 | | | 2005 | | | 2004 | |
| | | Average
Balance | | Interest
Income/
Expense | | Average
Yield % | | | Average
Balance | | Interest
Income/
Expense | | | Average
Yield % | | | Average
Balance | | Interest
Income/
Expense | | Average
Yield % | |
| (dollars in thousands) | | | | | | | | | | | | | | | | | | | | | | |
Interest-Earning Assets | | | | | | | | | | | | | | | | | | | | | | | | | | | | |
Advances | | $ | 25,409,288 | | $ | 1,289,740 | | 5.08 | % | | $ | 18,698,724 | | $ | 694,153 | | | 3.71 | % | | $ | 17,102,320 | | $ | 423,526 | | 2.48 | % |
Mortgage loans held for portfolio | | | 6,778,773 | | | 344,234 | | 5.08 | | | | 9,030,375 | | | 446,216 | | | 4.94 | | | | 11,086,825 | | | 540,267 | | 4.87 | |
Investments | | | 20,638,130 | | | 899,000 | | 4.36 | | | | 22,609,113 | | | 820,524 | | | 3.63 | | | | 21,428,116 | | | 709,156 | | 3.31 | |
Other interest-earning assets | | | 376 | | | 19 | | 5.13 | | | | 819 | | | 26 | | | 3.21 | | | | 717 | | | 10 | | 1.38 | |
| | | | | | | | | | | | | | | | | | | | | | | | | | | | |
Total interest-earning assets | | | 52,826,567 | | | 2,532,993 | | 4.79 | | | $ | 50,339,031 | | $ | 1,960,919 | | | 3.89 | | | $ | 49,617,978 | | $ | 1,672,959 | | 3.37 | |
| | | | | | | | | | | | | | | | | | | | | | | | | | | | |
Other assets | | | 348,482 | | | | | | | | | 285,761 | | | | | | | | | | 276,778 | | | | | | |
| | | | | | | | | | | | | | | | | | | | | | | | | | | | |
| Total assets | | $ | 53,175,049 | | | | | | | | $ | 50,624,792 | | | | | | | | | $ | 49,894,756 | | | | | | |
| | | | | | | | | | | | | | | | | | | | | | | | | | | | |
Interest-Bearing Liabilities | | | | | | | | | | | | | | | | | | | | | | | | | | | | |
Consolidated obligations | | $ | 49,367,690 | | $ | 2,413,097 | | 4.89 | | | $ | 46,298,403 | | $ | 1,822,266 | | | 3.93 | | | $ | 45,583,251 | | $ | 1,502,955 | | 3.30 | |
Deposits | | | 714,796 | | | 34,974 | | 4.89 | | | | 840,465 | | | 26,673 | | | 3.17 | | | | 1,118,675 | | | 14,132 | | 1.26 | |
Mandatorily redeemable Class B stock | | | 68,286 | | | 138 | | 0.20 | | | | 186,313 | | | (3 | ) | | 0.00 | | | | 2,078 | | | 225 | | 10.80 | |
Other borrowings | | | 165,211 | | | 7,764 | | 4.70 | | | | 544,639 | | | 15,193 | | | 2.79 | | | | 791 | | | 11 | | 1.40 | |
| | | | | | | | | | | | | | | | | | | | | | | | | | | | |
Total interest-bearing liabilities | | $ | 50,315,983 | | $ | 2,455,973 | | 4.88 | | | $ | 47,869,820 | | $ | 1,864,129 | | | 3.89 | | | $ | 46,704,795 | | $ | 1,517,323 | | 3.25 | |
| | | | | | | | | | | | | | | | | | | | | | | | | | | | |
Other liabilities | | | 641,001 | | | | | | | | | 702,346 | | | | | | | | | | 784,996 | | | | | | |
Capital | | | 2,218,065 | | | | | | | | | 2,052,626 | | | | | | | | | | 2,404,965 | | | | | | |
| | | | | | | | | | | | | | | | | | | | | | | | | | | | |
| Total liabilities and capital | | $ | 53,175,049 | | | | | | | | $ | 50,624,792 | | | | | | | | | $ | 49,894,756 | | | | | | |
| | | | | | | | | | | | | | | | | | | | | | | | | | | | |
Net interest income | | | | | $ | 77,020 | | | | | | | | $ | 96,790 | | | | | | | | | $ | 155,636 | | | |
| | | | | | | | | | | | | | | | | | | | | | | | | | | | |
Interest-rate spread | | | | | | | | (0.09 | ) | | | | | | | | | 0.00 | | | | | | | | | 0.12 | |
Net interest margin | | | | | | | | 0.15 | | | | | | | | | | 0.19 | | | | | | | | | 0.31 | |
The composition of the average balances of our major categories of interest-earning assets and interest-bearing liabilities changed significantly during 2006 and 2005, compared to the previous periods, as we refocused our business on advances, with advances significantly increasing and mortgage loans held for portfolio significantly decreasing.
For 2006, the significant increase in advances largely reflected the results of our efforts to become an advance-focused bank, including our continued use of differential pricing and the lowering of our members’ activity-based stock requirement from 3.50% to 2.50% from April 2006 to December 2006. For 2005, the increase in advances largely reflected our increased use of differential pricing as we refocused our business on advances. The reduction in mortgage loans held for portfolio in both 2006 and 2005, reflected our decision in early 2005 to exit the MPP, which led to our discontinuing the purchase of new mortgage loans and in August 2005, our sale of $1.4 billion of government-insured mortgage loans to an affiliate of one of our members. The decrease in investments in 2006 resulted from our use of funds from maturing investments to make advances, while the increase in investments in 2005 primarily reflected our strategy of managing our business to a capital-to-assets ratio of 4.30% (compared to 4.50% as of December 31, 2004) to fully use our capital and increase our net interest income. We expect our investments and the related interest income to decrease as a percentage of total assets and total interest income as we increase our advance balance.
63
Federal funds rates increased by 100 basis points during 2006 and 200 basis points during 2005. These increases resulted in higher average yields on our interest-earning assets and higher average costs on our interest-bearing liabilities during each of the years ended December 31, 2006 and 2005. During 2006 and 2005, we experienced larger increases in the average cost on our interest-bearing liabilities than in the average yield on our interest-earning assets, compressing our interest-rate spread by 9 basis points to a negative 9 basis points during 2006, and by 12 basis points to zero basis points during 2005. As a result, our net interest income decreased by $19.8 million to $77.0 million for the year ended December 31, 2006, compared to 2005, and by $58.8 million to $96.8 million for the year ended December 31, 2005, compared to 2004. This compression of our interest-rate spread primarily resulted from a mismatch between the timing of interest-rate changes on our interest-earning assets and interest-rate changes on our interest-bearing liabilities, due to the differences in the length of the repricing periods of these assets and liabilities. The mismatches arose primarily from two sources: (i) our investment in the consolidated obligations of other FHLBanks; and (ii) the funding for our mortgage loans held for portfolio. The terms of the consolidated obligations we issued contemporaneously with our investments in the consolidated obligations of other FHLBanks did not match the maturities and call options of the investments. As a result, in a rising short-term interest rate environment, we have experienced negative spread on these investments; however, this effect should have diminishing effects in 2007 and beyond. In addition, we issued short-term consolidated obligations to fund some of our long-term mortgage loans. As the short-term obligations have matured, we have had to replace them with higher-cost short-term debt, which has compressed the spread on the mortgage loan portfolio.
Investing and funding decisions the Seattle Bank made prior to 2005 are described more fully in “—Financial Condition—Investments.”
Changes in Volume and Rate. The following table separates the two principal components of the changes in our net interest income—interest income and interest expense—identifying the amounts due to changes in the volume of interest-earning assets and interest-bearing liabilities and changes in the average interest rate for the years ended December 31, 2006 and 2005.
| | | | | | | | | | | | | | | | | | | | | | | | |
| | | For the Years Ended December 31, | |
| | | 2006 v. 2005 Increase (Decrease) | | | 2005 v. 2004 Increase (Decrease) | |
Change in Volume and Rate | | Volume* | | | Rate* | | | Total | | | Volume* | | | Rate* | | | Total | |
| (dollars in millions) | | | | | | | | | | | | | | | | | | |
Interest Income | | | | | | | | | | | | | | | | | | | | | | | | |
Advances | | $ | 294.32 | | | $ | 301.26 | | | $ | 595.58 | | | $ | 42.60 | | | $ | 228.00 | | | $ | 270.60 | |
Investments | | | (75.88 | ) | | | 154.36 | | | | 78.48 | | | | 40.50 | | | | 70.90 | | | | 111.40 | |
Mortgage loans held for portfolio | | | (114.03 | ) | | | 12.04 | | | | (101.99 | ) | | | (101.50 | ) | | | 7.50 | | | | (94.00 | ) |
| | | | | | | | | | | | | | | | | | | | | | | | |
| Total interest income | | | 104.41 | | | | 467.66 | | | | 572.07 | | | | (18.40 | ) | | | 306.40 | | | | 288.00 | |
| | | | | | | | | | | | | | | | | | | | | | | | |
Interest Expense | | | | | | | | | | | | | | | | | | | | | | | | |
Consolidated obligations | | | 127.08 | | | | 463.81 | | | | 590.89 | | | | 23.90 | | | | 295.30 | | | | 319.20 | |
Deposits and other borrowings | | | (20.82 | ) | | | 21.77 | | | | 0.95 | | | | 7.50 | | | | 20.10 | | | | 27.60 | |
| | | | | | | | | | | | | | | | | | | | | | | | |
| Total interest expense | | | 106.26 | | | | 485.58 | | | | 591.84 | | | | 31.40 | | | | 315.40 | | | | 346.80 | |
| | | | | | | | | | | | | | | | | | | | | | | | |
Change in net interest income | | $ | (1.85 | ) | | $ | (17.92 | ) | | $ | (19.77 | ) | | $ | (49.80 | ) | | $ | (9.00 | ) | | $ | (58.80 | ) |
| | | | | | | | | | | | | | | | | | | | | | | | |
| * | Changes in interest income and interest expense not identifiable as either volume-related or rate-related, but rather equally attributable to both volume and rate changes, are allocated to the volume and rate categories based on the proportion of the absolute value of the volume and rate changes. |
For the years ended December 31, 2006 and 2005, compared to the prior periods, net interest income declined because interest expense on interest-bearing liabilities increased faster than interest income on interest-earning assets for the reasons described in “—Interest Income” and “—Interest Expense.”
64
Interest Income
The following table presents the components of our interest income by category of interest-earning assets for 2006, 2005, and 2004 and the percentage change in each category for the years ended December 31, 2006 and 2005.
| | | | | | | | | | | | | | | |
| | | For the Years Ended December 31, | |
Interest Income | | 2006 | | 2005 | | 2006 v. 2005
Percent
Increase /
(Decrease) | | | 2004 | | 2005 v. 2004
Percent
Increase /
(Decrease) | |
| (dollars in thousands) | | | | | | | | | | | | |
Interest Income | | | | | | | | | | | | | | | |
Advances | | $ | 1,289,132 | | $ | 689,527 | | 87.0 | % | | $ | 422,572 | | 63.2 | % |
Prepayment fees on advances | | | 608 | | | 4,626 | | (86.9 | ) | | | 954 | | 384.9 | |
| | | | | | | | | | | | | | | |
Subtotal | | | 1,289,740 | | | 694,153 | | 85.8 | | | | 423,526 | | 64.0 | |
Investments | | | 899,000 | | | 820,524 | | 9.6 | | | | 709,156 | | 15.7 | |
Mortgage loans held for portfolio* | | | 344,234 | | | 446,216 | | (22.9 | ) | | | 540,267 | | (17.4 | ) |
Other | | | 19 | | | 26 | | (26.9 | ) | | | 10 | | 160.0 | |
| | | | | | | | | | | | | | | |
| Total interest income | | $ | 2,532,993 | | $ | 1,960,919 | | 29.2 | % | | $ | 1,672,959 | | 17.2 | % |
| | | | | | | | | | | | | | | |
| * | 2005 interest income includes interest income on mortgage loans held for sale of $12.2 million during 2005. |
The increases in total interest income for the years ended December 31, 2006 and 2005, compared to the prior periods, were primarily due to the significant increases in both the volume and yield on our advances, and to a lesser extent, the increased yield on our investments. These increases in total interest income were partially offset by significant decreases in the interest income on our mortgage loans held for portfolio, primarily resulting from the decreases in the volume of mortgage loans held for portfolio as we continued to refocus our business on advances.
Advances. Interest income from advances increased 87.0% in 2006, compared to 2005, due to significant increases in both the average advance balance and increases in average yield on advances. The average advance balance increased 35.9%, or $6.7 billion, in 2006, compared to 2005, as we continued to refocus our business on advances. The average yield on advances, including prepayment fees, increased by 137 basis points to 5.08% in 2006, compared to 2005, primarily due to an increase in shorter term-to-maturity advances and significantly higher prevailing short-term interest rates during 2006.
Interest income from advances increased 63.2% in 2005, compared to 2004, due to a combination of increases in interest rates, primarily short-term interest rates, an increase in shorter-term-to-maturity advances, and, to a lesser extent, an increase in average advance volumes. Our average advance balance increased by $1.6 billion, while average yield on advances, including prepayment fees, increased by 123 basis points during 2005 compared to 2004.
We expect to continue to increase our advance business in the future. In refocusing our business on advances, we have offered additional advance products, significantly increased our use of differential pricing, and enhanced our marketing efforts. However, as a result of the use of differential pricing, we expect our overall advance balance to continue to be dependent upon the borrowing decisions of a few large members. We expect that our use of differential pricing will generate spreads similar to those earned on investments in federal funds, while we increase our advance balance. Consequently, we would not expect repayments of advances by these members to unfavorably affect our net interest income because we would likely invest the proceeds of any such advance repayments in federal funds.
Prepayment Fees on Advances.We recorded prepayment fee income of $608,000, $4.6 million, and $954,000 in 2006, 2005, and 2004. The large amount of prepayment fee income in 2005 primarily resulted from one member prepaying a significant amount of advances in the fourth quarter of 2005.
65
Investments. Interest income from investments, which includes short-term investments (e.g., interest-bearing deposits, securities purchased under agreements to resell, and federal funds sold) and long-term investments (e.g., held-to-maturity securities and trading securities), increased 9.6% during 2006, compared to 2005. This increase was primarily due to a 73 basis point increase in our average yield on investments, partially offset by an 8.7% reduction in our average investment portfolio balance.
Interest income from investments increased by 15.7% and average yield on investments increased by 32 basis points, in 2005, compared to 2004. Contributing to the increase in interest income from investments was a $1.2 billion increase in the average investment portfolio balance, which reflected our decision in 2005 to increase net interest income from investments through a strategy of managing our business to a capital-to-assets ratio of 4.30% in order to more fully use our capital and fund advances. During 2005, the composition of our investment portfolio changed, with a significantly larger portion held as short-term investments, particularly federal funds sold. We benefited from the significant increases in short-term interest rates that increased the yields earned on our short-term investments.
Mortgage Loans Held for Portfolio. Interest income from mortgage loans held for portfolio decreased by 22.9% for 2006, compared to 2005, and by 17.4% in 2005, compared to 2004. These decreases were due to significant declines in the average balance of mortgage loans held for portfolio resulting from our decision to exit the MPP in 2005, including our sale of $1.4 billion of our government-insured mortgage loans in August 2005. The average balance of our mortgage loans held for portfolio during 2006 and 2005 were $6.8 billion and $9.0 billion. The declines in our average mortgage loans held for portfolio balances in 2006 and 2005, were partially offset by an increase in the average yield of 14 and 7 basis points on such portfolios compared to the prior periods. The balance of our remaining mortgage loans held for portfolio will continue to decrease as these loans are paid off.
Interest Expense
The following table presents the components of our interest expense by category of interest-bearing liability and the percentage change in each category for the years ended December 31, 2006, 2005, and 2004.
| | | | | | | | | | | | | | | |
| | | For the Years Ended December 31, | |
Interest Expense | | 2006 | | 2005 | | 2006 v. 2005
Percent
Increase /
(Decrease) | | | 2004 | | 2005 v. 2004
Percent
Increase /
(Decrease) | |
| (dollars in thousands) | | | | | | | | | | | | |
Consolidated obligations | | $ | 2,413,097 | | $ | 1,822,266 | | 32.4 | % | | $ | 1,502,955 | | 21.2 | % |
Deposits | | | 34,974 | | | 26,673 | | 31.1 | | | | 14,132 | | 88.7 | |
Securities sold under agreements to repurchase | | | 7,705 | | | 15,162 | | (49.2 | ) | | | 8 | | NA | |
Mandatorily redeemable Class B stock and other borrowings | | | 197 | | | 28 | | 603.6 | | | | 228 | | (87.7 | ) |
| | | | | | | | | | | | | | | |
| Total interest expense | | $ | 2,455,973 | | $ | 1,864,129 | | 31.7 | % | | $ | 1,517,323 | | 22.9 | % |
| | | | | | | | | | | | | | | |
Consolidated Obligations. Interest expense on consolidated obligations increased by $590.8 million, or 32.4%, during 2006, compared to 2005. This increase was primarily the result of a significant increase in the volume of borrowings and an increase in the average yield on our borrowings, which was primarily caused by a 100 basis point increase in the federal funds rates during 2006 and our investment strategy of managing our business to a capital-to-assets ratio of 4.30% to more fully use our capital and fund growth in our advances. The average balance of consolidated obligations increased by $3.1 billion, or 6.6%, during 2006, compared to 2005. The average yield on consolidated obligations increased by 96 basis points for 2006, compared to 2005, due to the addition of new consolidated obligations at generally higher costs than the existing obligations held or the obligations replaced, which was primarily due to the increase in short-term interest rates.
66
The interest expense on consolidated obligations increased by $319.3 million, or 21.2%, during 2005, compared to 2004. This increase was the result of increases in interest rates throughout 2005 and in the second half of 2004. During 2005, the federal funds rate increased by 200 basis points and in the second half of 2004 it increased by 125 basis points. Our funding was primarily short term, with the majority of our debt either repricing or maturing within one year. Consequently, the rising interest-rate environment caused the average cost on our consolidated obligations to increase by 63 basis points for 2005. Also contributing to the increase in interest expense was the $715.2 million growth in the average balance of our consolidated obligations outstanding during 2005. We increased the average balance of our consolidated obligations in order to fund growth in our advances and to purchase short-term investments to increase our net income as part of our strategy of managing our business to more fully use our capital.
We seek to manage our debt portfolio by issuing bullet and callable consolidated obligation bonds, by calling and reissuing consolidated obligation bonds to take advantage of lower interest rates, where possible, and by using a combination of callable consolidated obligation bonds and interest-rate swaps. In 2005, we implemented a strategy to hedge MPP loans, investments, and advances primarily with callable consolidated obligations in order to decrease our reliance on stand-alone interest-rate exchange agreements. This strategy was designed to reduce our hedge expense going forward, but the reduction in hedge expense was partially offset by increased interest expense. During 2005, we also extinguished $335.4 million of high-cost, fixed-rate consolidated obligations that had a weighted-average interest rate of 6.10%. We realized a loss of $9.4 million on that extinguishment.
Deposits. Interest expense on deposits increased by 31.1% in 2006, compared to 2005, due to a 172 basis point increase in the average yield paid to members for the year ended December 31, 2006. This increase was partially offset by a $125.7 million decrease in the average balance of deposits in 2006, compared to 2005.
Interest expense on deposits increased by 88.7% in 2005, driven primarily by a 191 basis point increase in the yield paid to members, which was partially offset by a $278.2 million decrease in the average balance of deposits, compared to 2004.
Mandatorily Redeemable Class B Stock and Other Borrowings.Interest expense on mandatorily redeemable Class B stock increased by $169,000 in 2006, compared to 2005, primarily due to a $138,000 mandatorily redeemable Class B stock interest expense recorded in 2006 as a result of the resumption of dividend payments on Class B stock.
Interest expense on mandatorily redeemable Class B stock and other borrowings decreased by $200,000 in 2005, compared to 2004, primarily due to suspension of dividends.
Effect of Derivatives and Hedging on Net Interest Income
The following table presents the effect of derivatives and hedging on the components of our interest income and interest expense for the years ended December 31, 2006, 2005, and 2004.
| | | | | | | | | | | | |
| | | For the Years Ended December 31, | |
Effect of Derivatives and Hedging on Net Interest Income | | 2006 | | | 2005 | | | 2004 | |
| (dollars in thousands) | | | | | | | | | |
Increase (Decrease) in Interest Income | | | | | | | | | | | | |
Advances | | $ | 33,545 | | | $ | (41,430 | ) | | $ | (113,844 | ) |
Decrease (Increase) in Interest Expense | | | | | | | | | | | | |
Consolidated obligations | | | (108,362 | ) | | | (15,181 | ) | | | 135,864 | |
| | | | | | | | | | | | |
| Increase (decrease) in net interest income | | $ | (74,817 | ) | | $ | (56,611 | ) | | $ | 22,020 | |
| | | | | | | | | | | | |
67
We use derivative instruments to manage our exposure to changes in interest rates and to adjust the effective maturity, repricing frequency, or option characteristics of our assets and liabilities in response to changing market conditions. We often use interest-rate exchange agreements to hedge fixed interest-rate advances and consolidated obligations by effectively converting their fixed interest rates to short-term variable interest rates. For example, when we fund a variable interest-rate advance with a fixed interest-rate consolidated obligation, we may enter into a interest-rate exchange agreement that effectively converts the fixed interest-rate consolidated obligation to a variable interest rate and locks in the spread between the consolidated obligation and the advance. In this example, the table above would reflect only the impact to interest expense as a result of the hedging of the consolidated obligation and would exclude the impact of the changes to interest income as a result of interest rates changes on the variable interest-rate advance because the advance is not hedged. To the extent that we hedge our interest-rate risk on such transactions, only the hedged side of the transaction is reflected in this table. For additional information, see “—Summary of Critical Accounting Policies and Estimates—Derivatives and Hedging.”
Our use of interest-rate exchange agreements had a net unfavorable impact on our net interest income for the years ended December 31, 2006 and 2005, and a favorable impact on our net interest income for the year ended December 31, 2004, primarily because we held higher notional balances of interest-rate exchange agreements hedging consolidated obligations than hedging advances. As a result, the effective conversion of our consolidated obligations to short-term interest floating rates, combined with significant increases in short-term interest rates, contributed to the declines in net interest income for the years ended December 31, 2006 and 2005. However, because of the conversion of our consolidated obligations to short-term floating rates from fixed rates, the low short-term interest rates in 2004 contributed to the favorable impact for the year ended December 31, 2004.
Other Income (Loss)
Other income (loss) includes member service fees, net (loss) gain on sale of held-to-maturity securities, net gain on trading securities, net gain (loss) gain on derivatives and hedging activities, net gain (loss) from early extinguishment of consolidated obligations, net gain on the sale of mortgage loans held for sale, and other miscellaneous (loss) income not included in net interest income. Because of the type of financial activity reported in this category, other income (loss) can be volatile from one period to another. For instance, net gain and loss on derivatives and hedging activities is highly dependent on changes in interest rates and spreads between various interest-rate yield curves.
The following table presents the components of our other income (loss) for the years ended December 31, 2006, 2005, and 2004.
| | | | | | | | | | | | | | | | | | |
| | | For the Years Ended December 31, | |
Other Income (Loss) | | 2006 | | | 2005 | | | 2006 v. 2005
Percent
Increase /
(Decrease) | | | 2004 | | | 2005 v. 2004
Percent
Increase /
(Decrease) | |
| (dollars in thousands) | | | | | | | | | | | | | | | |
Service fees | | $ | 1,691 | | | $ | 2,183 | | | (22.5 | )% | | $ | 2,266 | | | (3.7 | )% |
Net (loss) gain on sale of held-to-maturity securities | | | (6,496 | ) | | | (1,234 | ) | | (426.4 | ) | | | 5,586 | | | (122.1 | ) |
Net gain on trading securities | | | | | | | 1,979 | | | (100.0 | ) | | | 11,493 | | | (82.8 | ) |
Net gain (loss) on derivatives and hedging activities | | | 470 | | | | (26,475 | ) | | 101.8 | | | | (15,583 | ) | | (69.9 | ) |
Net gain (loss) from early extinguishment of consolidated obligation bonds | | | 7,232 | | | | (9,449 | ) | | 176.5 | | | | | | | NA | |
Net gain on the sale of mortgage loans held for sale | | | | | | | 5,940 | | | (100.0 | ) | | | | | | NA | |
Other (loss) income, net | | | (205 | ) | | | (728 | ) | | 71.8 | | | | (252 | ) | | (188.9 | ) |
| | | | | | | | | | | | | | | | | | |
| Total other income (loss) | | $ | 2,692 | | | $ | (27,784 | ) | | 109.7 | % | | $ | 3,510 | | | (891.6 | )% |
| | | | | | | | | | | | | | | | | | |
68
Total other income (loss) increased by $30.5 million in 2006, compared to 2005. The increase was primarily due to a $26.9 million increase in net gain from derivatives and hedging activities and a $16.7 million increase in net gain from early extinguishment of consolidated obligations, partially offset by a $5.3 million increase in net loss on the sale of held-to-maturity securities in 2006 and the one-time sale of government-insured mortgage loans that resulted in a net gain of $5.9 million in 2005 with no comparable activity in 2006.
Total other income (loss) decreased by $31.3 million in 2005, compared to 2004, primarily due to a $10.9 million increase in net loss on derivatives and hedging activities, a $9.5 million reduction in net gain (loss) on trading securities, a $9.4 million loss from extinguishment of consolidated obligation bonds, and a $6.8 million decrease in net realized (loss) gain on sale of held-to-maturity securities, partially offset by a $5.9 million net gain on the sale of government-insured mortgage loans.
These changes are discussed in more detail below.
Net (Loss) Gain on Sale of Held-to-Maturity Securities.In June and July 2006, we sold $1.0 billion of investments in consolidated obligation bonds of other FHLBanks that were within 90 days of maturity, resulting in losses of $6.5 million for the year ended December 31, 2006. These losses were offset by the net gain of $6.6 million from the repurchase of certain of our outstanding consolidated obligation bonds. In December 2005, we sold $250.0 million of low-yield, held-to-maturity consolidated obligation bonds of other FHLBanks that were within 90 days of maturity, resulting in a $1.2 million loss for the year ended December 31, 2005. Under U.S. GAAP, securities that are within 90 days of maturity or have substantially equal installment payments and that have been paid down to less than 15% of their original balances may be sold without calling into question the classification of other securities as “held-to-maturity.”
Net Gain on Trading Securities.As of December 31, 2006 and 2005 we did not hold any trading securities. We held one trading security as of December 31, 2004, which we sold in December 2005. This trading security was economically hedged by an interest-rate exchange agreement that was terminated when we sold the trading security. We recorded the changes in fair value of the trading security and the associated interest-rate exchange agreement as net gain from trading securities and net (loss) gain on derivatives and hedging activities in our Statements of Income. We reported interest income earned on the trading security in interest income and the interest expense on the interest-rate exchange agreements in net (loss) gain on derivatives and hedging activities in our Statements of Income. We had a net gain on the sale of trading securities of $2.0 million for the year ended December 31, 2005.
Net Gain (Loss) on Derivatives and Hedging Activities. In 2006, we had no freestanding swaptions, mortgage commitments, or hedged trading securities, and, accordingly, in 2006, we did not have comparable activity to 2005 and 2004. For 2005, most of the change in our total net loss on derivatives and hedging activities was due to changes in the fair value of mortgage delivery commitments, interest-rate futures and forwards, consolidated obligation bonds and the corresponding interest-rate exchange agreements, and swaptions. For 2004, most of the change in our total net loss on derivatives and hedging activities was due to changes in the fair value of interest-rate exchange agreements that economically hedged our trading security, and accounting adjustments related to the change in the manner of accounting we used to value and measure ineffectiveness for certain highly effective hedging relationship transactions.
69
Mortgage Loans. In June 2005, we restructured our hedges and balance sheet positions to realign our hedge position. We reduced our reliance on swaptions for hedging against long-term decreases in interest rates, and sold mortgage-backed securities to-be-announced, or TBAs, for forward settlement to economically hedge the interest-rate risk allocated to our mortgage loan portfolio. The realized loss on the TBAs was $3.6 million for 2005. There was no comparable activity in 2006.
Consolidated Obligations. For the year ended December 31, 2006, we recognized gains of $1.3 million on interest-rate exchange agreements used to hedge consolidated obligations, compared to a loss of $5.0 million for 2005. In addition, in June 2005, we determined that the method we had used since 2004 for valuing the hedged consolidated obligations was in error. Accordingly, we reassessed the bond valuation using an appropriate method. As a result, in the second quarter of 2005, we recorded an additional loss of $1.7 million relating to the second quarter and prior periods.
Economic Hedges. During the first half of 2005, we purchased swaptions at an approximate cost of $80 million, as economic hedges to protect against the potential of additional large, unrealized losses in market value of equity. We intended to use swaptions to hedge our interest-rate risk until we were able to significantly reduce this risk by restructuring our assets and liabilities. The $15.8 million of expenses associated with holding these swaptions contributed to our lower earnings for 2005. There was no comparable activity in 2006.
As of December 31, 2006 and 2005, we held $300.0 million and $300.0 million notional amount of interest-rate caps and $150.0 million and zero notional amount of interest-rate floors, that were used to economically hedge changes in the fair value of our assets and liabilities caused by changes in the interest rates. Our recorded gains or losses related to interest-rate caps and floors were $517,000 of gains during 2006 and $657,000 of losses during 2005. The changes in the fair value of the interest-rate caps and interest-rate floors are recorded as net gain(loss) on derivatives and hedging activities in the Statement of Income.
70
Net Gain (Loss) on Early Extinguishment of Consolidated Obligation Bonds.During 2006, as part of our efforts to enhance economic value and income, we repurchased $283.1 million in fixed interest-rate debt with a weighted-average interest rate of 5.95%, resulting in a net gain of $6.6 million. The gains from these repurchases were used to offset the losses associated with selling low-yielding held-to-maturity securities that were within 90 days of maturity. In addition, we had a $669,000 net gain associated with extinguishing consolidated obligations by exercising our call options on those bonds. During 2005, we repurchased $335.4 million of fixed-rate bullet debt with a weighted-average interest rate of 6.10%, resulting in a net loss of $9.4 million. We repurchased this debt primarily to economically lower our future costs.
Net Gain on the Sale of Mortgage Loans Held for Sale. In August 2005, we sold $1.4 billion of our $1.9 billion government-insured mortgage loan portfolio to an affiliate of one of our members. We realized a gain of $7.0 million on the sale of these mortgage loans. We also incurred an unrealized loss of $1.1 million on that sale, which was reported in other income (loss), when we reclassified the remaining $424.8 million in unsold mortgage loans as held for portfolio due to our decision in September 2005 not to continue actively marketing the remaining loans. The unrealized loss reduced the net premium associated with the government-insured mortgage loans held for portfolio. The net gain on the August 2005 sale, including the $1.1 million unrealized loss, was $5.9 million. We had no sales of mortgage loans in 2006.
Other Expense
Other expense includes operating expenses, Finance Board and Office of Finance assessments, and other items, which consist primarily of mortgage loan administrative fees paid to vendors related to our mortgage loans held for portfolio. The following table presents the components of our other expense for the years ended December 31, 2006, 2005, and 2004.
| | | | | | | | | | | | | | | |
| | | For the Years Ended December 31, | |
Other Expenses | | 2006 | | 2005 | | Percent
Increase /
(Decrease) | | | 2004 | | Percent
Increase /
(Decrease) | |
| (dollars in thousands) | | | | | | | | | | | | |
Operating expenses | | | | | | | | | | | | | | | |
Compensation and benefits | | $ | 22,521 | | $ | 26,159 | | (13.9 | )% | | $ | 24,088 | | 8.6 | % |
Occupancy cost | | | 3,791 | | | 11,566 | | (67.2 | ) | | | 4,172 | | 177.2 | |
Other operating | | | 14,018 | | | 23,776 | | (41.0 | ) | | | 13,177 | | 80.4 | |
Finance Board | | | 1,599 | | | 1,832 | | (12.7 | ) | | | 1,521 | | 20.4 | |
Office of Finance | | | 1,312 | | | 1,269 | | 3.4 | | | | 1,124 | | 12.9 | |
Other | | | 1,384 | | | 1,892 | | (26.8 | ) | | | 2,473 | | (23.5 | ) |
| | | | | | | | | | | | | | | |
| Total expense | | $ | 44,625 | | $ | 66,494 | | (32.9 | )% | | $ | 46,555 | | 42.8 | % |
| | | | | | | | | | | | | | | |
Operating expenses decreased 32.9% in 2006, primarily due to a reduction in average staff, a decrease in professional and other contractual services costs related to implementation of the Written Agreement and development of the business plan, a leasehold impairment charge of $5.4 million in 2005, and a $1.0 million recovery in 2006 resulting from the receipt of updated lease rates. Operating expenses increased in 2005, primarily due to termination-related expenses, increased occupancy and lease impairment costs, and an increase in professional and other contractual services costs related to implementation of the Written Agreement, development of the business plan, the requirement to register a class of our equity securities with the SEC and to comply with the Sarbanes-Oxley Act and Finance Board requirements.
Compensation and benefits expense decreased 13.9% in 2006, primarily because of the reduction in staff. Compensation and benefits expenses increased 8.6% for 2005, primarily because of $3.4 million in termination-related expenses and increased salaries and benefits for existing employees. As of December 31, 2006, we had 118 employees, compared to 126 and 192 as of December 31, 2005 and 2004.
71
Occupancy cost primarily includes the expenses related to our leases on two offices in downtown Seattle and an emergency back-up facility outside of downtown Seattle. Occupancy cost decreased by 67.2% in 2006, compared to 2005. Although we reflected a 2006 adjustment to our lease abandonment costs of $1.0 million due to the receipt of updated lease rates, occupancy costs in 2005 were significantly impacted by a $5.4 million leasehold impairment, which reflected our vacating leased office space to align with the reduction in staff, primarily due to our exiting the MPP. Occupancy cost increased by 177.2% in 2005, compared to 2004, primarily due to realizing the $5.4 million of abandonment cost.
Other operating expenses decreased by 41.0% in 2006, primarily due to decreases in professional and other contractual services and decreases in certain AHP-related costs. In 2005, other operating expenses increased by 80.4%, primarily due to increases in professional and other contractual services, including $4.0 million in consulting fees in connection with the implementation of the Written Agreement and the business plan, and a $1.6 million expense incurred to replenish the AHP fund.
Finance Board and Office of Finance expenses represent costs allocated to us by the Finance Board and the Office of Finance, calculated through a formula based on our percentage of capital stock, consolidated obligations issued, and consolidated obligations outstanding for the previous month for the FHLBank System as a whole.
Assessments
Although we are exempt from all federal, state, and local taxation other than real property tax, the Financial Institutions Reform, Recovery and Enforcement Act and the GLB Act require that we, along with the other 11 FHLBanks, support the payment of part of the interest on bonds previously issued by REFCORP. The REFCORP assessment amount is determined by calculating U.S. GAAP net income before the AHP and REFCORP assessments minus the AHP assessment, then multiplying that amount by 20%. The FHLBanks must make REFCORP payments until the total amount of REFCORP assessment payments made is equivalent to a $300 million annual (or $75 million per quarter) annuity that has a final maturity date of April 15, 2030. The Finance Board will shorten or lengthen the period during which the FHLBanks must make these payments to REFCORP, depending on actual payments made relative to the referenced annuity. In addition, the Finance Board, with the Secretary of the Treasury, selects the appropriate discounting factors used in the payment calculations relating to the REFCORP assessments.
Annually, the FHLBanks must also set aside for the AHP the greater of $100 million or 10% of their current year’s aggregate regulatory net income. Regulatory net income for AHP assessment purposes is determined by the Finance Board and is equal to net income reported in accordance with U.S. GAAP before mandatorily redeemable capital stock related interest expense and AHP assessment, but after REFCORP assessment.
On September 13, 2006, the Finance Board adopted a final rule modifying the calculations for the FHLBanks’ required annual AHP contributions. Under the final rule, which became effective on January 1, 2007, each FHLBank’s required annual AHP contribution is limited to its annual net income. Under existing regulation, each FHLBank contributes annually to its AHP program the greater of 10% of its annual net earnings or its pro-rata share of an aggregate of $100 million contributed by all of the FHLBanks, such proration being made on the basis of each FHLBank’s annual net income in relation to all FHLBanks’ annual net income.
72
Our assessments for AHP and REFCORP increased in 2006 due to increased net income, compared to 2005. The decrease in assessments for 2005 reflected lower net income compared to 2004. The table below presents our AHP and REFCORP assessments for the three years ended December 31, 2006, 2005, and 2004.
| | | | | | | | | | | | | | | |
| | | For the Years Ended December 31, | |
AHP and REFCORP Assessments | | 2006 | | 2005 | | Percent
Increase /
(Decrease) | | | 2004 | | Percent
Increase /
(Decrease) | |
| (dollars in thousands) | | | | | | | | | | | | |
AHP | | $ | 2,871 | | $ | 370 | | 675.9 | % | | $ | 9,191 | | (96.0 | )% |
REFCORP | | | 6,443 | | | 428 | | 1,405.4 | | | | 20,680 | | (97.9 | ) |
| | | | | | | | | | | | | | | |
| Total assessments | | $ | 9,314 | | $ | 798 | | 1,067.2 | % | | $ | 29,871 | | (97.3 | )% |
| | | | | | | | | | | | | | | |
Segment Information
Our core business is traditional member finance, which includes making advances, providing letters of credit, accepting deposits, and providing securities safekeeping and other services. Historically, we offered products and services through two operating segments, traditional member finance and the MPP. The MPP segment consisted of mortgage loans held for portfolio as a result of purchases from participating members. During the first quarter of 2005, we decided to exit the MPP. As a result of this decision, Seattle Bank management no longer manages the business using separate operating segments. The Seattle Bank now aggregates the operating results of the former MPP segment with the traditional member finance segment for decision-making purposes. Accordingly, we stopped reporting segment information in the third quarter of 2006 and no longer discuss our operations in separate segments. As of December 31, 2006, our MPP balance has declined 36.8% to $6.4 billion from $10.1 billion as of March 31, 2005.
Summary of Critical Accounting Policies and Estimates
Our financial statements and reported results are prepared in accordance with U.S. GAAP, which requires the use of estimates and assumptions that may affect our reported results and disclosures. Several of these accounting policies involve the use of accounting estimates that we consider to be critical as: (i) they are likely to change from period to period because they require significant management judgment and assumptions about highly complex and uncertain matters, and (ii) the use of a different estimate or a change in estimate could have a material impact on our reported results of operations or financial condition. We review our estimates and assumptions frequently. Estimates and assumptions that are significant to our results of operations and financial condition are called critical accounting policies and estimates and are described below. Although management believes these estimates, assumptions, and judgments to be reasonably accurate, actual results could differ significantly.
Assets and Liabilities Reported at Fair Value
We use a variety of means to estimate the fair value of the assets, liabilities, and commitments, including derivatives, reported at fair value on our financial statements, in footnotes to the financial statements and in this management’s discussion and analysis and for purposes of measuring hedge effectiveness. Where available, external pricing sources, including FT Interactive Data, a subsidiary of Interactive Data Corporation, Bloomberg L.P., and investment broker-dealers, are used to estimate the fair value of certain financial instruments. These pricing sources may provide price quotes for the financial instrument itself or for a financial instrument with similar terms or structures. The fair values of certain other instruments are based on pricing models that require the use of assumptions regarding interest rates, prepayment behavior, market volatility, and other factors. Our estimates of interest rates are based on observed LIBOR rates and interest rates on interest-rate exchange agreements. We also use an externally sourced prepayment model that incorporates a number of market factors that is updated as these factors change. In addition, volatility estimates are provided by the Office of Finance and
73
Bloomberg L.P. Changes in the assumptions we use can have a significant effect on the modeled valuation of these financial assets, liabilities, and commitments, thereby affecting income because these fair value changes are recorded as income or expense.
Derivatives and Hedging
We report all derivative financial instruments in the Statements of Condition at their fair value. We classify derivative assets and derivative liabilities according to the net fair value of derivatives with each counterparty. Subject to a master netting agreement, if the net fair value of derivatives with a counterparty is positive, the net amount is classified as an asset; if the net fair value of derivatives with a counterparty is negative, it is classified as a liability. As of December 31, 2006, 2005, and 2004, we held derivative assets of $146.9 million, $13.2 million, and $24.5 million, as well as derivative liabilities of $46.8 million, $133.8 million, and $274.8 million.
The following table categorizes the estimated fair value of derivative financial instruments, excluding accrued interest, by product and type of accounting treatment as of December 31, 2006 and 2005. Under “Fair Value,” we include derivative instruments where hedge accounting is achieved. In a fair value hedge, the changes in fair value of the hedged item and the derivative offset each other, resulting in little or no impact to earnings. Under “Economic,” we include hedge strategies where derivative hedge accounting is not applied and, therefore, changes in the fair value of the derivatives are recorded in current period earnings with no adjustments made to the economically hedged asset or liability. Under “Intermediary Positions,” we include transactions where we act as an intermediary between our member and nonmember counterparties in order to enable our members to access the interest-rate swap market. We discontinued offering member swaps as a standard product in mid-2004, but will continue to maintain the existing products through their maturity.
| | | | | | | | | | | | | | | | | | | | | | |
| | | As of December 31, | |
| | | 2006 | | | 2005 | |
Derivatives and Hedging | | Notional | | Estimated Fair
Value (excludes
accrued interest) | | | Hedged Item -
Cumulative Basis
Adjustment | | | Notional | | Estimated Fair
Value (excludes
accrued interest) | | | Hedged Item -
Cumulative Basis
Adjustment | |
| (dollars in thousands) | | | | | | | | | | | | | | | | |
Advances | | | | | | | | | | | | | | | | | | | | | | |
Fair value—short-cut | | $ | 4,359,901 | | $ | 19,822 | | | $ | (19,822 | ) | | $ | 4,387,229 | | $ | 8,816 | | | $ | (8,816 | ) |
Fair value—long-haul | | | 280,000 | | | 394 | | | | (351 | ) | | | 30,000 | | | 859 | | | | (859 | ) |
Consolidated Obligations | | | | | | | | | | | | | | | | | | | | | | |
Fair value—short-cut | | | 17,887,170 | | | (67,175 | ) | | | 67,175 | | | | 7,312,430 | | | (69,007 | ) | | | 69,007 | |
Fair value—benchmark | | | 9,099,550 | | | (72,655 | ) | | | 66,225 | | | | 5,660,000 | | | (115,693 | ) | | | 109,454 | |
Balance Sheet | | | | | | | | | | | | | | | | | | | | | | |
Economic | | | 1,016,950 | | | 1,427 | | | | | | | | 300,500 | | | 797 | | | | | |
Intermediary Positions | | | | | | | | | | | | | | | | | | | | | | |
Member swaps | | | 111,000 | | | 10 | | | | | | | | 121,000 | | | 38 | | | | | |
Other | | | 494,500 | | | | | | | | | | | 651,800 | | | (1 | ) | | | | |
| | | | | | | | | | | | | | | | | | | | | | |
Total Notional and Fair Value | | $ | 33,249,071 | | $ | (118,177 | ) | | $ | 113,227 | | | $ | 18,462,959 | | $ | (174,191 | ) | | $ | 168,786 | |
| | | | | | | | | | | | | | | | | | | | | | |
Net accrued interest receivable | | | | | | 218,231 | | | | | | | | | | | 53,631 | | | | | |
| | | | | | | | | | | | | | | | | | | | | | |
Net derivative balance | | | | | | 100,054 | | | | | | | | | | | (120,560 | ) | | | | |
| | | | | | | | | | | | | | | | | | | | | | |
Net derivative assets balance | | | | | | 146,900 | | | | | | | | | | | 13,205 | | | | | |
Net derivative liabilities balance | | | | | | (46,846 | ) | | | | | | | | | | (133,765 | ) | | | | |
| | | | | | | | | | | | | | | | | | | | | | |
Net derivative balance | | | | | $ | 100,054 | | | | | | | | | | $ | (120,560 | ) | | | | |
| | | | | | | | | | | | | | | | | | | | | | |
Notional amounts are used to calculate the periodic amounts to be received and paid under interest-rate exchange agreements and generally do not represent actual amounts to be exchanged or directly reflect our exposure to credit risk. Notional amounts are not recorded as assets or liabilities in our Statements of Condition.
74
Accounting Treatment for Hedging Relationships
As part of our risk management strategies, we enter into interest-rate exchange agreements that hedge our exposure to changes in interest rates. Through the use of these instruments, we may adjust the effective maturity, repricing frequency, or option characteristics to achieve our risk management objectives. We have processes in place to ensure that new hedging strategies are fully researched and analyzed prior to implementation. This analysis includes validation of expected accounting treatment under Statement of Financial Accounting Standards No. 133,Accounting for Derivative Instruments and Hedging Activities, or SFAS 133, determination of the effectiveness testing method to be used and preliminary expectations regarding effectiveness, financial instrument valuation sources, and operational procedures and controls, such that, once the hedging strategy is approved, transactions may proceed and be accurately recorded and reported in the financial statements. Once a strategy is approved, but prior to each transaction’s execution:
| | • | | We formally document the hedging relationship, the strategy undertaken, and the risk management objective achieved. Documentation includes identification of the hedged item and hedging derivative instrument, the nature of the risk being hedged and how the hedging instrument’s effectiveness in offsetting the exposure to changes in the hedged item’s fair value attributable to the hedged risk will be assessed. |
| | • | | We perform an assessment to confirm our expectation that the hedging relationship will be highly effective in achieving offsetting changes in the fair value attributable to the hedged risk during the hedge period. |
| | • | | For written options designated as hedging recognized assets or liabilities, we ensure that the combination of the hedged item and the written option provides at least as much potential for gains as a result of a favorable change in the fair value of the combined instruments as exposure to losses from an unfavorable change in their combined fair value. |
During the second quarter of 2005, we adopted trade-date accounting for derivatives and the related hedged items. Under trade-date accounting, hedge accounting commences on the trade date when subsequent changes in the derivative’s fair value are recorded along with the offsetting changes in fair value of the hedged item even though the hedged item has not yet settled and has not yet been recognized. On the settlement date, the adjustments attributed to the hedged item become part of its total carrying amount. Previously, we recorded the initial changes in fair value of both derivatives and the hedged items on their settlement dates. We have evaluated the effect of the differences between the two methods on prior periods and have determined that the effect of the differences is immaterial.
75
The following summarizes our accounting for our principal types of hedging relationships.
Fair Value Hedges. In a fair value hedge, the derivative hedges the exposure to changes in the fair value of an asset or liability that is attributable to a particular risk. We use fair value hedges to mitigate the risk of either changes in the overall fair value of hedged items (full fair value hedges) or changes in the fair value of the hedged items attributable only to changes in the benchmark interest rate (benchmark hedges). Changes in the fair value of a derivative that is effective as, and that is designated and qualifies as, a fair value hedge, along with changes in the fair value of the hedged assets or liabilities that are attributable to the hedged risk, are recorded in current period earnings. The following table details our fair value hedges by accounting designation and type of risk being hedged as of December 31, 2006.
| | | | | | | | | | | |
Hedging Derivative | | Hedged Item | | Accounting
Designation | | Type of Risk Being Hedged | | Method of Assessing
Hedge Effectiveness | | Notional Amount
as of
December 31, 2006 |
| (dollars in thousands) | | | | | | | | | | |
Interest-rate swap | | Advances | | Short-cut | | Benchmark | | Assumption of no ineffectiveness | | $ | 4,359,901 |
Interest-rate swap | | Consolidated Obligation Bonds | | Short-cut | | Benchmark | | Assumption of no ineffectiveness | | $ | 17,887,170 |
Interest-rate swap | | Consolidated Obligation Bonds | | Long haul | | Benchmark | | Rolling regression | | $ | 9,099,550 |
Interest-rate cap | | Capped Advance | | Long haul | | Fair value of
embedded cap | | Rolling regression | | $ | 140,000 |
Interest-rate cap | | FCC Advance | | Long haul | | Benchmark | | Rolling regression | | $ | 140,000 |
The following discussion describes the applicable accounting treatments for fair value hedging relationships under SFAS 133.
Short-Cut Hedge Relationships. A short-cut relationship implies that the hedge between the derivative and hedged item is considered to be perfectly correlated. Therefore, the changes in the fair value of the derivative and hedged item will perfectly offset, as a short-cut relationship assumes no ineffectiveness. To qualify for short-cut accounting treatment, a number of specific conditions must be met, as illustrated in the following example.
In a typical short-cut hedge, we use interest-rate swaps to hedge the changes in fair value of one or more advances or one or more consolidated obligations attributable to changes in the designated benchmark interest rate where: (i) the notional amount of the swap matches the principal amount of the asset or liability, (ii) the fair value of the swap at its inception is zero, (iii) the formula for computing net settlements under the interest-rate swap is the same for each net settlement, (iv) the interest-bearing asset or liability is not prepayable or the interest-rate swap contains the same prepayment criteria, (v) the expiration date of the interest-rate swap matches the maturity date of the asset or liability, (vi) there is no ceiling or floor on the variable interest rate of the swap, and (vii) the interval between repricing periods of the variable interest rate in the swap is no more than six months.
Highly Effective Hedge Relationships. A highly effective hedge relationship indicates that, at hedge inception and on an ongoing basis, both prospective and retrospective effectiveness tests indicate that the derivative and hedged item will be highly effective in achieving offsetting changes in fair value attributable to the hedged risk. The changes in fair value for the derivative and hedged item may or may not perfectly offset, and the difference, if any, will be recognized as a net gain or loss in current period earnings in the Statements of Income. We refer to these types of hedges as fair value long haul or fair value benchmark hedges, depending upon whether we are hedging the entire fair value of the asset or liability or only the changes in fair value due to changes in the benchmark interest rate.
To determine whether a hedging relationship is highly effective, we perform effectiveness testing at the inception of the hedge and on an ongoing basis. We use a statistical method, i.e., rolling regression, to analyze the effectiveness of our long haul or benchmark fair value hedging relationships. The rolling regression method
76
for a full fair value hedge utilizes a simple regression model in which the fair value of the hedging instrument is regressed against the fair value of the hedged item. To perform the regression, we select a statistically significant number of prices that cover the time period of the hedging relationship. If prices associated with the hedging item and prices associated with the hedged item have been, and are expected to continue to be, highly correlated, we may reasonably expect that the changes in the fair value of the hedging item will be highly effective in offsetting the changes in the fair value of the hedged item. Based on our data, we determine if the corresponding changes in cumulative prices meet an acceptable range based on statistical measures to continue to qualify for hedge accounting.
For each of our fair value hedges, we run our effectiveness tests at inception and then at least quarterly to ensure that the hedging instrument’s changes in fair value are offsetting the hedged item’s changes in fair value within the parameters set forth within SFAS 133. When a hedging relationship fails the effectiveness test, we immediately discontinue hedge accounting.
In certain situations, we aggregate advances and hedge them with one or more derivative instruments. We also may aggregate certain consolidated obligations and hedge them with one or more derivative instruments. We follow the requirements set forth in SFAS 133, and these assets or liabilities that are grouped meet the homogeneity requirement for fair value hedges.
Not-Highly Effective Hedge Relationships. If we determine that a hedging relationship is not highly effective, we discontinue the accounting hedge relationship between the derivative and hedged item. This does not imply that there is not an economic hedge relationship between the derivative and hedged item; however, the relationship does not qualify for hedge accounting treatment under SFAS 133 and, therefore, the change in fair value of the hedged item is not recorded in current period earnings. We classify these derivatives as “freestanding” pursuant to SFAS 133. Changes in the fair value of the derivative in a freestanding hedge are recorded as income or expense.
Types of Derivatives and Hedged Items
We incur interest-rate risk on advances, mortgage loans held for portfolio, investments, consolidated obligations, and intermediary positions. The following discussion describes our accounting for our specific derivative instruments and hedges.
Advances. The optionality embedded in certain financial instruments we hold (e.g., the prepayment terms in an advance) can create interest-rate risk. When a borrower prepays an advance, we would suffer lower future income if the prepaid principal portion were invested in lower-yield assets that continued to be funded by higher-cost debt. To protect against this risk, we generally charge a prepayment fee designed to make us financially indifferent to a borrower’s decision to prepay an advance. When we offer advances (other than short-term advances) that a member may prepay without a prepayment fee, which would normally occur in a falling interest-rate environment, we usually finance such advances with callable debt or hedge this prepayment option.
When we make a putable advance, we have a right to terminate the advance at our discretion. We may hedge a putable advance by entering into a cancelable interest-rate exchange agreement where we pay a fixed rate and receive a variable rate based on a market index, typically LIBOR. The swap counterparty can cancel the interest-rate exchange agreement on the put dates, which would normally occur in a rising rate environment, at which time we would generally terminate the advance. This type of hedge is treated as a fair value hedge under SFAS 133.
We also offer our members capped advances, or variable-rate advances with a maximum interest rate. When we make a capped advance, we typically purchase an offsetting interest-rate cap from a broker. This type of hedge is treated as a full fair value hedge under SFAS 133.
Mortgage Loans Held for Portfolio. The prepayment options embedded in mortgage loans can result in extensions or contractions in the expected repayment of these assets, depending on changes in estimated
77
prepayment speeds. In addition, to the extent that we purchased mortgage loans at premiums or discounts, net income is affected by extensions or contractions in the expected maturities of these assets. We seek to manage the interest-rate and prepayment risk associated with mortgage loans primarily through debt issuance. We use both callable and noncallable debt to attempt to achieve cash flow patterns and liability durations similar to those expected on the mortgage loans.
We may also purchase interest-rate exchange agreements to manage the prepayment risk embedded in the mortgage loans. Although these derivatives are valid economic hedges against the prepayment risk of the mortgage loans, they are not specifically linked to individual mortgage loans, and we account for these instruments as freestanding derivatives pursuant to SFAS 133. However, to enable us to lower our overall interest-rate risk profile and reduce our operating costs, including costs associated with managing risks related to our mortgage loans held for portfolio, we are exiting the MPP.
Investments. We currently invest primarily in U.S. agency and GSE obligations, mortgage-backed securities, and the taxable portion of state or local housing finance agency securities. The interest-rate and prepayment risk associated with these investment securities is managed through a combination of debt issuance and derivatives. For investment securities carried at fair value, we may also manage the risk arising from changing market prices by matching the cash outflow on the interest-rate exchange agreements with investment securities carried at fair value. These economic hedges are considered freestanding pursuant to SFAS 133.
Consolidated Obligations. We manage the risk arising from changing market prices of a consolidated obligation by matching the cash outflow on the consolidated obligation with the cash inflow on an interest-rate exchange agreement. In a typical transaction, the Office of Finance issues a fixed-rate consolidated obligation for the Seattle Bank, and we concurrently enter into a matching interest-rate exchange agreement in which the counterparty pays fixed cash flows, designed to mirror in timing and amount the cash outflows we pay on the consolidated obligation. Such transactions are treated as fair value hedges under SFAS 133. The net result of this transaction is that we pay a variable interest rate that closely matches the interest rates we receive on short-term or variable-rate advances. This intermediation within the financial markets permits us to raise funds at lower costs than would otherwise be available through the issuance of simple fixed or variable-rate consolidated obligations in the financial markets.
Intermediation. To assist our members in meeting their hedging needs, we act as an intermediary between members and counterparties by entering into offsetting interest-rate exchange agreements. The notional amounts and settlement, interest payment, and maturity dates are identical in the offsetting interest-rate exchange agreements. Although we discontinued offering member swaps as a standard product in mid-2004, we will continue to maintain the existing transactions through maturity. The derivatives used in intermediary swaps do not qualify for hedge accounting treatment, and the fair value adjustments are recorded separately through current period earnings. The net result of the accounting for these derivatives does not significantly affect our operating results. These amounts are recorded in other income and presented as net loss on derivatives and hedging activities.
78
The following table summarizes the notional amounts of member intermediary swap transactions and gains (losses) on these swap transactions as of December 31, 2006 and 2005.
| | | | | | | | |
| | | As of December 31, | |
Member Intermediary Swap Transactions | | 2006 | | | 2005 | |
| (dollars in thousands) | | | | | | |
Notional Amount | | | | | | | | |
Member swaps | | $ | 55,500 | | | $ | 60,500 | |
Offsetting counterparty swaps | | | 55,500 | | | | 60,500 | |
| | | | | | | | |
Total notional amount | | $ | 111,000 | | | $ | 121,000 | |
| | | | | | | | |
| |
| | | As of December 31, | |
| | | 2006 | | | 2005 | |
Gain (loss) | | | | | | | | |
Member swaps | | $ | 13 | | | $ | 394 | |
Offsetting counterparty swaps | | | (3 | ) | | | (509 | ) |
| | | | | | | | |
Total gain (loss) | | $ | 10 | | | $ | (115 | ) |
| | | | | | | | |
We may enter into interest-rate exchange agreements to offset the economic effect of other derivatives that are no longer designated in a hedge transaction of one or more advances, investments, or consolidated obligations. In these intermediary transactions, maturity dates, call dates, and fixed interest rates match, as do the notional amounts on the de-designated portion of the interest-rate exchange agreement and the intermediary derivative.
The following table summarizes the notional amounts of intermediary swap transactions that offset derivatives that are no longer designated in a hedge transaction as of December 31, 2006 and 2005, and gains (losses) on intermediary swap transactions that offset derivatives that are no longer designated in a hedge transaction in each of the years ended December 31, 2006 and 2005.
| | | | | | | | |
| | | As of December 31, | |
Intermediary Swap Transactions | | 2006 | | | 2005 | |
| (dollars in thousands) | | | | | | |
Notional Amount | | | | | | | | |
De-Designated swaps | | $ | 247,250 | | | $ | 326,000 | |
Offsetting counterparty swaps | | | 247,250 | | | | 325,800 | |
| | | | | | | | |
Total notional amount | | $ | 494,500 | | | $ | 651,800 | |
| | | | | | | | |
| |
| | | As of December 31, | |
| | | 2006 | | | 2005 | |
Gain (loss) | | | | | | | | |
De-Designated swaps | | $ | (4,885 | ) | | $ | (5,746 | ) |
Offsetting counterparty swaps | | | 4,885 | | | | 5,753 | |
| | | | | | | | |
Total gain (loss) | | $ | | | | $ | 7 | |
| | | | | | | | |
79
Amortization of Premiums and Accretion of Discounts
The amount of premium or discount on mortgage-based assets, including mortgage-backed securities, collateralized mortgage obligations, and mortgage loans purchased under the MPP, amortized or accreted into earnings during a period is dependent on our estimate of the remaining lives of these assets and actual prepayment experience. Changes in estimates of prepayment behavior create volatility in interest income because the change to a new expected yield on a pool of mortgage loans or mortgage-backed securities, given the new forecast of prepayment behavior, requires an adjustment to cumulative amortization in order for the financial statements to reflect that yield going forward. For a given change in estimated average maturity for a mortgage loan portfolio or a mortgage-backed security, the retrospective change in yield is dependent on the amount of original purchase premium or discount and the cumulative amortization or accretion at the time the estimate is changed. A change in estimated average maturity has the least effect on mortgage loans or mortgage-backed securities that have either little cumulative amortization or accretion or are nearly fully amortized or accreted. A change in estimated average maturity has its greatest effect on long-term mortgage loans and mortgage-backed securities with cumulative amortization and accretion equal to approximately half of the original purchase premium or discount.
For certain mortgage-based assets, we use a commercially available prepayment model and independent third-party pricing sources, including a source that provides data on cash flows, as the basis for estimated future principal prepayments. This model uses a number of market factors, such as historical mortgage rates and housing turnover ratios, as the basis for the prepayment calculation and we are provided monthly market factor updates from the prepayment model vendor. Use of different prepayment models can result in different amounts of premium amortization and discount accretion. We review the data generated from the model against model data from the previous period as well as against commercially available prepayment rate information and the periodic changes in prepayment rates to ensure the reasonableness of the data in light of market conditions.
Allowances for Credit Losses
We regularly evaluate our requirement for an allowance for credit losses on advances and mortgage loans purchased under the MPP. We would establish an allowance if an event were to occur that would make it probable that all principal and interest due for an advance or mortgage loan would not be collected and the resulting losses were estimable.
Advances. Our advances are fully collateralized by high-quality collateral and the Seattle Bank benefits from statutory preferences as a creditor that, combined with conservative collateral practices, make the likelihood of credit losses negligible. To incur a credit loss on an advance, two credit events must occur: (i) the member or nonmember borrower would have to default, and (ii) the available collateral would have to deteriorate in value prior to liquidation of that collateral. We periodically review the collateral held as security on advances and assess our borrowers’ credit conditions. As of December 31, 2006 and 2005, we had rights to collateral, either loans or securities, on a borrower-by-borrower basis, with an estimated fair value in excess of outstanding advances. We have never experienced a credit loss on our advances, and we do not anticipate any credit losses on advances in the future. Based on the foregoing, we have determined that no provision for credit losses on advances is necessary.
Mortgage Loans. Since the inception of the MPP, we have never experienced a credit loss nor has our supplemental insurance provider ever experienced a loss claim on our mortgage loan portfolio. To ensure member retention of most of the credit risk and to cover, at a minimum, the expected losses on conventional mortgage loans originated or acquired by a member, we required the member to fund a lender risk account either up front as a portion of the purchase proceeds or over time through a portion of the monthly payments. This account is established to conform to Finance Board regulations applicable to all conventional mortgage purchase programs. The Finance Board regulation stipulates that the member is responsible for all expected losses on the mortgage loans sold to us. In order to comply with this regulation, we evaluated the proposed conventional mortgage loans to be sold (either the specific portfolio or a representative sample) to determine the amount of
80
expected losses that would occur. The supplemental mortgage insurance provider determined the minimum amount required in order to issue a policy. The member funds the lender risk account with the greater of the expected losses or the amount required by the supplemental mortgage insurance provider. Each master commitment contract specifies the required funding level for its associated lender risk account. In accordance with the applicable contract, either the purchase price for the mortgage loans purchased under a master commitment contract was discounted, or a portion of the monthly payment collected is set aside, to fund the lender risk account. If the member’s lender risk account is funded through monthly payments, the member remains obligated under the master commitment contract to pay the monthly amounts that fund the lender risk account whether or not any of the purchased mortgage loans are in default. The lender risk account funds are used to offset any losses that may occur, with any excess of required balances distributed to the member in accordance with a step-down schedule that is stipulated in each master commitment contract. The lender risk account balances are not required after 11 years. The lender risk account is recorded in “other liabilities” in the Statements of Condition and totaled $19.8 million and $16.5 million, as of December 31, 2006 and 2005.
In addition to the expected losses covered by the lender risk account, a member selling conventional mortgage loans was required to purchase supplemental mortgage insurance as a credit enhancement to cover losses over and above losses covered by the lender risk account. We are listed as the insured, and this coverage serves to further limit our exposure to losses. As with the funding of the lender risk account, a portion of the monthly interest is set aside to pay the supplemental mortgage insurance premium. The lender risk account and the supplemental mortgage insurance are expected to provide loss protection to support the equivalent of an investment-grade rating. If the lender risk account and the standard supplemental mortgage insurance policy do not provide sufficient loss protection to support the equivalent of an investment-grade rating, the member must purchase additional mortgage insurance coverage called SMI Plus. This policy provides additional credit enhancement coverage to achieve an equivalent of an investment-grade rating. Other than the lender risk account, supplemental mortgage insurance, and if applicable, SMI Plus, we do not charge any other credit enhancement fees to MPP participants.
As a result of the credit enhancements described above, we and our members share the credit risk of the mortgage loans sold to us under the MPP. The member has assumed a first-loss obligation in the event of a mortgage borrower default equivalent to a minimum of the expected losses through its lender risk account after the exhaustion of the borrower’s equity and any primary mortgage insurance coverage, if required. If the member’s lender risk account is insufficient to cover any losses, then the supplemental mortgage insurance coverage is used. Only after exhausting the supplemental mortgage insurance coverage will the Seattle Bank absorb any potential losses. Under the credit enhancement structure of the MPP, the value of the foreclosed property would have to fall below 50% of the outstanding loan amount to result in a loss to us. We regularly monitor delinquency data provided by our members to ensure that mortgage principal and interest are remitted timely, and perform quality control reviews on all individual mortgage loans that become 90 days delinquent. In addition, members are responsible for remitting principal and interest to us, even though there may be individual mortgage loans with delinquent payments to the member. Occasionally, we require our members to repurchase mortgage loans. These instances include failure by a member to comply with MPP requirements, breach of representations and warranties made by a member, noncompliance with final documentation, and servicing errors.
Given the level of credit enhancement available to us, we do not believe an allowance for credit losses on mortgage loans is required. We do not expect that our decision to exit from the MPP will result in increased credit risk or the need for an allowance for credit losses on mortgage loans.
Recently Issued Accounting Standards and Interpretations
SFAS 155
On February 16, 2006, the Financial Accounting Standards Board, or FASB, issued SFAS No. 155,Accounting for Certain Hybrid Financial Instruments, an amendment of FASB Statements No. 133 and 14,or SFAS 155,which resolves issues addressed in Statement 133 Implementation Issue No. D1,Application of Statement 133 toBeneficial Interests in Securitized Financial Assets,or DIG Issue D1. SFAS 155 amends
81
SFAS 133 to simplify the accounting for certain derivatives embedded in other financial instruments (a hybrid financial instrument) by permitting fair value remeasurement for any hybrid financial instrument that contains an embedded derivative that otherwise requires bifurcation, provided that the entire hybrid financial instrument is accounted for on a fair value basis. SFAS 155 also establishes the requirement to evaluate interests in securitized financial assets to identify interests that are freestanding derivatives or that are hybrid financial instruments that contain an embedded derivative requiring bifurcation, which replaces the interim guidance in DIG Issue D1. SFAS 155 amends SFAS 140,Accounting for Transfers and Servicing of Financial Assets and Extinguishment of Liabilities, a replacement of FASB Statement 125,or SFAS 140, to allow a qualifying special-purpose entity to hold a derivative financial instrument that pertains to beneficial interests other than another derivative financial instrument. SFAS 155 is effective for all financial instruments acquired or issued after the beginning of the first fiscal year that begins after September 15, 2006 (January 1, 2007 for the Seattle Bank), with earlier adoption allowed. We do no expect that the implementation of SFAS 155 will have a material impact on our results of operations or financial condition.
SAB 108
On September 13, 2006, the SEC issued SEC Staff Accounting Bulletin No. 108,Considering the Effects of Prior Year Misstatements when Quantifying Misstatements in Current Year Financial Statements,or SAB 108. Traditionally, there have been two widely-recognized methods for quantifying the effects of financial statement restatements: the “roll-over” method and the “iron curtain” method. The roll-over method focuses primarily on the impact of a misstatement on the income statement, which includes the reversing effect of prior year misstatements. The sole use of the roll-over method can lead to the accumulation of misstatements in the balance sheet. The iron curtain method focuses primarily on the effect of correcting the period-end balance sheet, with less emphasis on reversing effects of prior year errors on the income statement.
In SAB 108, the SEC staff established an approach that requires quantification of financial statement misstatements based on the misstatements of each of the FHLBanks’ financial statements and related financial statement disclosures. This model is commonly referred to as a “dual approach” because it requires quantification of errors under both the iron curtain and the roll-over methods.
SAB 108 permits the Seattle Bank to initially apply its provisions by (i) restating prior financial statements as if the dual approach had always been used or (ii) recording the cumulative effect of initially applying the dual approach as adjustments to the carrying values of assets and liabilities as of January 1, 2006, with an offsetting adjustment recorded to the opening balance of retained earnings. It should be noted that misstatements solely related to the 2006 calendar year would not be included in the transition cumulative adjustment. Use of the “cumulative effect” transition method requires a detailed disclosure of the nature and amount of each individual error (regardless of materiality) being corrected through the cumulative adjustment and how and when it arose.
We initially applied the provision of SAB 108 in connection with the preparation of the annual financial statements for the year ended December 31, 2006. SAB 108 did not have a material impact on our results of operations or financial condition as of January 1, 2006, and accordingly, no restatement in prior period or recording of cumulative effect adjustment was required. Furthermore, SAB 108 did not have a material impact on our results of operations or financial condition for the year ended December 31, 2006.
SFAS 157
On September 18, 2006, the FASB issued SFAS No. 157,Fair Value Measurements, or SFAS 157. In defining fair value, SFAS 157 retains the exchange price notion in earlier definitions of fair value. However, the definition focuses on the price that would be received to sell an asset or paid to transfer a liability (an exit price), not the price that would be paid to acquire the asset or received to assume the liability (an entry price). SFAS 157 applies whenever other accounting pronouncements require or permit fair value measurements. Accordingly, SFAS 157 does not expand the use of fair value in any new circumstances. SFAS 157 also establishes a fair value hierarchy that prioritizes the information used to develop assumptions used to determine the exit price. Under the
82
standard, fair value measurements would be separately disclosed by level within the fair value hierarchy. SFAS 157 is effective for financial statements issued for fiscal years beginning after November 15, 2007 (January 1, 2008, for the Seattle Bank), and interim periods within those fiscal years, with early adoption permitted provided the entity has not yet issued financial statements for that fiscal year, including financial statements for an interim period within that fiscal year. We have not yet determined the impact, if any, that the implementation of SFAS 157 will have on our results of operations or financial condition.
SFAS 158
On September 29, 2006, the FASB issued SFAS No. 158,Employers’ Accounting for Defined Benefit Pension and Other Postretirement Plans—an amendment of FASB Statements No. 87, 88, 106 and 132(R), or SFAS 158. SFAS 158 requires that an employer that is a business entity and sponsors one or more single-employer defined benefit plans to:
| | • | | Recognize the funded status of a benefit plan—measured as the difference between plan assets at fair value (with limited exceptions) and the benefit obligation—in its statement of financial position. For a pension plan, the benefit obligation is the projected benefit obligation; for any other post-retirement benefit plan, such as a retiree health care plan, the benefit obligation is the accumulated post-retirement benefit obligation. |
| | • | | Recognize as a component of other comprehensive income, net of tax, the gains or losses and prior service costs or credits that arise during the period but are not recognized as components of net periodic benefit cost pursuant to FASB Statement No. 87,Employers’ Accounting for Pensions,or No. 106,Employers’ Accounting for Postretirement Benefits Other Than Pensions. Amounts recognized in accumulated other comprehensive income, including the gains or losses, prior service costs or credits, and the transition asset or obligation remaining from the initial application of Statements 87 and 106, are adjusted as they are subsequently recognized as components of net periodic benefit cost pursuant to the recognition provisions of those statements. |
| | • | | Measure defined benefit plan assets and obligations as of the date of the employer’s fiscal year-end statement of financial position (with limited exceptions). |
| | • | | Disclose in the notes to the financial statements additional information about certain effects on net periodic benefit cost for the next fiscal year that arise from delayed recognition of the gains or losses, prior service costs or credits, and transition asset or obligation. |
We adopted SFAS 158 as of December 31, 2006. At the time of adoption, we recorded $2.1 million in other liability with an offsetting amount recognized in accumulated other comprehensive loss.
DIG Issue G26
On December 13, 2006, the FASB issued Derivatives Implementation Group, or DIG No. G26,Hedging Interest Cash Flows on Variable-Rate Assets and Liabilities That Are Not Based on a Benchmark Interest Rate,or DIG Issue G26. DIG Issue G26 clarifies when the hedge of a designated risk related to variable—rate financial assets or liabilities qualifies as a cash flow hedge. DIG Issue G26 becomes effective with the first fiscal quarter beginning after January 8, 2007 (April 1, 2007 for the Seattle Bank). We do not expect DIG Issue G26 to have a material impact on our results of operations or financial condition.
DIG Issue B40
On December 20, 2006, the FASB issued DIG No. B40,Application of Paragraph 13(b) to Securitized Interest in Prepayable Financial Assets, or DIG Issue B40. DIG Issue B40 clarifies when a securitized interest in prepayable financial assets is subject to the conditions in paragraph 13(b) of SFAS 133. DIG Issue B40 becomes effective upon initial adoption of SFAS 155 (January 1, 2007 for the Seattle Bank). We have not yet determined the impact, if any, that DIG Issue B40 will have on our results of operations or financial condition.
83
EITF 06-6
On November 29, 2006, the Emerging Issues Task Force ratified its draft abstract,06-06—Debtor’s Accounting for a Modification (or Exchange) of Convertible Debt Instrument, or EITF 06-06. This issue addresses how the modification of a debt instrument affecting the terms of an embedded conversion option should be considered in the issuer’s analysis of whether debt extinguishment accounting should be applied. This issue also addresses how the accounting for a modification of a debt instrument affecting the terms of an embedded option when extinguishment accounting is applied. This issue is effective for interim or annual reporting periods beginning after November 29, 2006 (January 1, 2007, for the Seattle Bank), and we do not expect the issue to have a material impact on our results of operations or financial condition.
EITF 06-07
On November 29, 2006, the Emerging Issues Task Force ratified its draft abstract,06-07—Issuer’s Accounting for a Previously Bifurcated Conversion Option in a Convertible Debt Instrument When the Conversion Option No Longer Meets the Bifurcation Criteria in FAS 133, Accounting for Derivative Instruments and Hedging Activities, or EITF 06-07. This issue addresses the accounting of a previously bifurcated conversion option in a convertible debt instrument if that conversion option no longer meets the bifurcation criteria in SFAS 133. EITF 06-07 also addresses the disclosure when an embedded option previously accounted for as a derivative under SFAS 133 no longer meets the separation criteria of SFAS 133. This issue is effective in interim or annual reporting periods beginning after December 15, 2006 (January 1, 2007 for the Seattle Bank), and we do not expect the issue to have a material impact on our results of operations or financial condition.
SFAS 159
In February 2007 the FASB issued SFAS No. 159,The Fair Value Option for Financial Assets and Financial Liabilities—Including an amendment of FASB Statement No. 115,or SFAS 159, which permits us to choose to measure many financial instruments and certain other items at fair value. The fair value option may be applied, with a few exceptions, on an instrument by instrument basis. The election is irrevocable unless a new election date occurs and the election must be applied to the entire financial instrument and not to only the specified risks, specified cash flows, or portions of that financial instrument. Certain financial instruments, such as deposit liabilities, are not eligible for the fair value option. The difference between the carrying amount and the fair value of eligible items for which the fair value option is elected at the effective date will be removed from the statement of condition and included in the cumulative effect adjustment. Those differences may include, but are not limited to; (i) unamortized concession fees, premiums, and discounts; (ii) allowance for loan losses; and (iii) accrued interest, which would be reported as part of the fair value of the eligible item. Additionally, available-for-sale and held-to-maturity securities held at the effective date are eligible for the fair value option at that date. If the fair value option is elected for any of those securities at the effective date, cumulative unrealized gains and losses at that date should be included in the cumulative-effect adjustment. Upfront costs and fees related to items for which the fair value option is elected will be recognized into operating results as incurred rather than deferred and amortized. SFAS 159 is effective for financial statements issued after November 15, 2007 (January 1, 2008 for the Seattle Bank) and interim periods within those fiscal years. Earlier adoption is permitted if the company also elects to apply the provisions of SFAS 157. We expect to adopt SFAS 159 on January 1, 2008 consistent with our adoption of SFAS 157. We have not yet determined the impact, if any, that the implementation of SFAS 159 will have on our results of operations or financial condition.
ITEM 7A. QUANTITATIVE AND QUALITATIVE DISCLOSURES ABOUT MARKET RISK
Market risk is the risk of loss to the market value of financial instruments—and potential loss of future net interest income—that may result from changes in interest rates and other market factors. Our business model requires us to take on market risks. We measure our sensitivity to changes in interest rates by measuring the effective duration and effective convexity of our financial positions. Effective duration is an approximation of the estimated proportional change in the price of a financial instrument relative to the absolute change in interest
84
rates. Effective convexity is an approximation of the non-proportional change in the price of a financial instrument relative to the absolute change in interest rates. All else equal, the greater the absolute value of an instrument’s effective duration measure, the greater its sensitivity to changes in interest rates. A positive effective convexity measure for an instrument predicts, all else equal, that price increases will exceed the effect predicted by effective duration alone and that price decreases will be less than the effect predicted by effective duration alone. The converse is true for negative convexity. Yield-curve risk refers to changes in the relative relationship among various points of the term structure of interest rates and an instrument’s relative price sensitivity to the various term points. We measure our sensitivity to yield-curve risk by calculating effective key-rate durations. Key-rate durations measure an instrument’s relative sensitivity to various specified points in the term structure of interest rates. These measures can be calculated for individual financial instruments, such as one of our mortgage-backed securities, or for an entire portfolio such as our MPP. We seek to control market risk through our funding and investment decisions, and with interest-rate exchange agreements. Through our market-risk management, we attempt to ensure that we are profitable and to protect net interest income and market value of equity over a wide range of interest-rate environments.
Our general approach to managing market risk is to acquire and maintain a portfolio of assets and liabilities that, together with our associated interest-rate exchange agreements, limits our expected market value and income statement volatility. Our approach complies with Finance Board regulations regarding interest-rate exchange agreements, which enable the FHLBanks to enter into these agreements only to reduce the market-risk exposures inherent in otherwise unhedged assets and funding positions.
Measurement of Market Risk
We monitor our market risk through a variety of measures. Our Board oversees policy and has adopted four primary risk measures—effective duration of equity, effective key-rate duration of equity mismatch, effective convexity of equity, and market value of equity sensitivity. These policy measures are described below. Historically, our risk management policy included two primary measures of market risk—effective duration of equity and market value of equity sensitivity. Based on the decline in our market value of equity since 2002, which was due primarily to mismatches between the terms of certain of our MPP and investment securities (including the consolidated obligations in other FHLBanks) and the debt used to fund those assets as well as our failure to manage the resulting convexity risk, we revised our policy limits at the direction of our Board to more specifically deal with the relevant market risks.
In May 2005, our Board adopted our current risk management policy that added new risk management measures, effective convexity of equity and effective key-rate duration of equity mismatch, to the existing measures of effective duration of equity and market value of equity sensitivity. The new policy established limits for these measures for managing and monitoring our market risk. We quantify and monitor our market risk daily and manage market risk within the policy limits. These measures and other key terms are defined below.
| | • | | Market Value of Equity. Market value of equity is the present value of the expected net cash flows from all our assets, liabilities, and commitments. |
| | • | | Effective Duration. Effective duration represents the estimated change in the value of a financial instrument for a given instantaneous parallel shift in the yield curve. Stated simply, effective duration is a measure of the price sensitivity of a financial instrument to changes in interest rates. Higher duration numbers, whether positive or negative, indicate greater price-sensitivity to changes in interest rates. For example, if a portfolio has an effective duration of two, then the portfolio’s value would be expected to decline about 2% for a 1% increase in interest rates—or rise about 2% for a 1% decrease in interest rates. |
| | • | | Effective Duration of Equity. Effective duration of equity is the market value of assets multiplied by the effective duration of assets minus the market value of liabilities multiplied by the effective duration of liabilities, plus or minus the market value of commitments multiplied by the effective duration of commitments, with the net result divided by the market value of equity. Effective duration of equity |
85
| | measures the sensitivity of the market value of equity to instantaneous changes in interest rates. All else equal, higher effective duration numbers, whether positive or negative, indicate greater market value sensitivity to changes in interest rates. |
| | • | | Market Value of Equity Sensitivity. Market value of equity sensitivity is the change observed in our estimated market value of equity, given an instantaneous parallel increase or decrease in the yield curve. |
| | • | | Effective Convexity. Effective convexity measures the estimated effect of the non-proportional changes in instrument prices that is not incorporated in the proportional effects measured by effective duration. Financial instruments can have positive or negative effective convexity. |
| | • | | Effective Convexity of Equity. Effective convexity of equity is the market value of assets multiplied by the effective convexity of assets minus the market value of liabilities multiplied by the effective convexity of liabilities, plus or minus the market value of commitments multiplied by the effective convexity of commitments, with the net result divided by the market value of equity. |
| | • | | Effective Key-Rate Duration of Equity. Effective key-rate duration of equity disaggregates effective duration of equity into various points on the yield curve to allow us to measure and manage our exposure to changes in the shape of the yield curve. |
| | • | | Effective Key-Rate Duration of Equity Mismatch. This measurement is the difference between the maximum and minimum effective key-rate duration of equity measures. |
Market-Risk Management
Our market-risk measures reflect the sensitivity of our business to changes in interest rates, primarily because of mismatches in the maturities and embedded options associated with our mortgage-based assets and the consolidated obligation bonds we use to fund these assets. The prepayment options embedded in mortgage-based instruments may be exercised at any time, while the call options embedded in our callable debt are exercisable on a set date or series of dates following a lock-out period. These differences in the structure and characteristics of the mortgage prepayment options embedded in our mortgage-based assets and the debt call options in the consolidated obligations sold on our behalf cause the market values of our mortgage-based assets and callable debt to respond differently to changes in interest rates and the shape of the yield curve. For example, a significant drop in interest rates will likely trigger rapid prepayments of our mortgage-based assets, while the debt issued to fund the purchase of those assets may or may not be callable depending on the remaining length of the lock-out periods, the exercise prices of the call options, and whether the options are exercisable continuously, periodically, or on a specific date.
We evaluate our market-risk measures on an ongoing basis, under a variety of parallel and non-parallel shock scenarios. As of December 31, 2006, our market-risk measures were within our policy limits.
The following table summarizes our four primary risk measures and their respective limits and our compliance as of December 31, 2006 and 2005.
| | | | | | | | | |
Primary Risk Measure | | As of
December 31, 2006 | | | As of
December 31, 2005 | | | Risk Measure
Limit | |
Effective duration of equity | | 0.96 | | | (0.36 | ) | | +/-5.00 | |
Effective convexity of equity | | (1.96 | ) | | (2.46 | ) | | +/-5.00 | |
Effective key-rate-duration-of-equity mismatch | | 1.09 | | | 2.60 | | | +/-5.50 | |
Market value of equity sensitivity | | | | | | | | | |
(+ 100 basis point shock scenario) (in percentages) | | (1.87 | )% | | (0.67 | )% | | +/-4.50 | % |
Market value of equity sensitivity | | | | | | | | | |
( -100 basis point shock scenario) (in percentages) | | 0.06 | % | | (1.45 | )% | | +/-4.50 | % |
86
As of December 31, 2006, the effective duration of equity increased 1.32 and the effective convexity of equity increased 0.50, compared to December 31, 2005. The change to the effective duration of equity resulted from a significant change in the composition of our liability structures, which shortened the duration of liabilities causing a lengthening in the effective duration of equity. The change in the effective convexity of equity resulted from a decision by management to target a duration of equity of 1.0 to minimize the impact of rising interest rates on our mortgage loan durations. In addition, the rise in interest rates and the flattening of the yield curve acted to reduce the negative effective convexity of our mortgage-related portfolios relative to the funding used to hedge those mortgage assets. Furthermore, we engaged in some debt restructuring to incrementally decrease our negative effective convexity and key-rate-duration mismatches during 2006.
Instruments That Address Market Risk
We use interest-rate exchange agreements, such as interest-rate swaps, interest-rate caps and floors, forward purchase and sale agreements, and swaptions to manage our exposure to changes in interest rates. This enables us to adjust the effective maturity, repricing frequency, or option characteristics of our assets and liabilities in response to changing market conditions.
Some of the specific types of instruments we use to manage our interest-rate risk are described in the table below.
| | | | |
Hedge Instrument | | Hedged Item | | Purpose of Hedge Transaction |
| | |
| Pay fixed, receive LIBOR swap; we own option to cancel swap if applicable | | Putable or callable advance; fixed-rate advance with option to cancel advance prior to maturity date | | To provide customized advance products to our customers at minimal risk to us |
| | |
| Purchased interest-rate cap | | Capped advance | | To provide customized advance products to our customers at minimal risk to us |
| | |
| Pay fixed, receive LIBOR swap | | Fixed-rate advance | | To provide customized advance products to our customers at minimal risk to us |
| | |
| Pay LIBOR, receive fixed swap; pay LIBOR, receive fixed swap in which counterparty owns options to cancel swap | | Bullet fixed-rate debt; callable fixed-rate debt in which we own option to call debt prior to stated maturity date | | To achieve lower cost funds with minimal risk to us |
| | |
| Payer or receiver swaptions | | Mortgage-backed assets, including MPP mortgage loans and mortgage-backed securities | | To hedge our prepayment risk on our mortgage-backed assets and manage our effective duration of equity |
| | |
| Pay variable until conversion date, then pay fixed, with option to cancel swap prior to maturity date | | Variable-to-fixed advance with option to cancel advance prior to maturity date | | To provide customized advance products to our customers at minimal risk to us |
| | |
| Pay LIBOR, receive floating index | | Floating rate consolidated obligation | | To achieve lower cost of funds with minimal risk to us |
The total notional amount of interest-rate exchange agreements outstanding was $33.2 billion and $18.5 billion as of December 31, 2006 and 2005. The notional amount of interest-rate exchange agreements increased during 2006, primarily due to increases in fair value hedges of consolidated obligations.
87
The notional amount of these agreements serves as a factor in determining periodic interest payments or cash flows received and paid, and does not represent actual amounts exchanged or our exposure to credit or market risk. Therefore, the notional amount is significantly greater than the potential market or credit loss that could result from such transactions. Notional values are not meaningful measures of the risks associated with interest-rate exchange agreements or other derivatives, which can only be meaningfully measured on a market value basis, taking into consideration the cost of replacing interest-rate exchange agreements with similar agreements from a highly-rated counterparty.
Credit-Risk Management
Credit risk is the risk of loss due to default. We face credit risk on advances, certain investments, mortgage loans, interest-rate exchange agreements, and counterparty exposures.
Advances
We have never experienced a credit loss on advances. We protect against credit risk on advances by requiring collateral on all advances we fund. We can also call for additional or substitute collateral during the life of an advance to protect our security interest. The FHLBank Act limits eligible collateral to certain investment securities, residential mortgage loans, deposits with the Seattle Bank, and other real estate-related assets. The GLB Act and other federal regulations allow the FHLBanks to expand eligible collateral for many of their members. Members that qualify as community financial institutions, defined in the GLB Act as FDIC-insured depository institutions with average assets for the past three calendar years totaling no more than $587.0 million, may pledge small-business, small-farm, and small-agribusiness loans as collateral for advances. Advances to community financial institutions secured with expanded collateral represented $133.0 million of the $28.0 billion of advances as of December 31, 2006 and $135.0 million of the $21.4 billion of advances outstanding as of December 31, 2005. We believe that we have the policies and procedures in place to effectively manage this credit risk. Accordingly, we have not provided any allowance for losses on advances, including those referenced above.
Investments
We are subject to credit risk on some investments. We limit our unsecured credit exposure to any counterparty, other than the U.S. government or GSEs, based on the credit quality and capital level of the counterparty and the capital level of the Seattle Bank. As of December 31, 2006 and 2005, our unsecured credit exposure was $12.3 billion and $13.2 billion, primarily consisting of $4.2 billion and $5.3 billion of other FHLBank consolidated obligations and $2.8 billion and $6.3 billion of federal funds sold. This decrease in unsecured credit exposure primarily resulted from a decrease in our short-term investments, including federal funds sold, as advance balances increased. We do not intend to purchase additional investments in the consolidated obligations of other FHLBanks without Finance Board approval.
Mortgage Loans Held for Portfolio
The Seattle Bank has never experienced a credit loss nor has our SMI provider experienced a loss claim on an MPP mortgage loan. Under the MPP, we have purchased mortgage loans from members, and the participating members continue to bear a portion of the credit risk on the outstanding loans. Our total principal of mortgage loans outstanding through the MPP was $6.3 billion and $7.2 billion as of December 31, 2006 and 2005, which comprised $292.1 million and $383.4 million in government-insured mortgage loans and $6.0 billion and $6.8 billion in conventional mortgage loans. The conventional mortgage loans are credit-enhanced by our participating members to a level equivalent to at least an investment-grade rating through the lender risk account and supplemental mortgage insurance. As part of the business plan, we are exiting from the MPP. However, we do not expect that this decision will impact the credit risk of the mortgage loans held for portfolio. We conduct a loss reserve analysis on a quarterly basis and have determined that no loan loss allowance is necessary, and believe that we have the policies and procedures in place to appropriately manage this credit risk.
88
Derivative Credit-Risk Exposure and Counterparty Ratings
The Seattle Bank is subject to credit risk because of the potential nonperformance by a counterparty to an agreement. The degree of counterparty risk on interest-rate exchange agreements and other derivatives depends on our selection of counterparties and the extent to which we use netting procedures and other credit enhancements to mitigate the risk. We manage counterparty credit risk through credit analysis, collateral management, and other credit enhancements. We require agreements to be in place for all counterparties. These agreements must include provisions for netting exposures across all transactions with that counterparty. The agreements also require the counterparties to collateralize exposures with the thresholds for priority collateral tied to the credit risk of the counterparty. For example, a counterparty must deliver collateral to the Seattle Bank if the total market value of our exposure to that counterparty rises above a specific threshold. As a result of these risk mitigation initiatives, we do not currently anticipate any credit losses on our interest-rate exchange agreements.
Our credit risk equals the estimated cost of replacing favorable interest-rate swaps, forward agreements, and purchased caps and floors, if the counterparty defaults, net of the value of related collateral. Our maximum credit risk, taking into consideration master netting agreements but before considering collateral, was $146.9 million and $4.6 million as of December 31, 2006 and 2005. In determining maximum credit risk, we consider accrued interest receivable and payable, and the legal right to offset assets and liabilities by counterparty. Our net exposure after considering collateral was $133.5 million and $4.6 million as of December 31, 2006 and 2005. These increases in credit risk and net exposure after considering collateral were primarily due to changes in market conditions, including the level and slope of the yield curve during the year ended December 31, 2006.
Counterparty Credit Exposure
Our counterparty credit exposure, by credit rating, was as follows as of December 31, 2006 and 2005.
| | | | | | | | | | | | |
| | | As of December 31, 2006 |
Counterparty Credit Exposure by Credit Rating | | Notional
Amount | | Total Net
Exposure
at Fair
Value | | Collateral
Held | | Net
Exposure
After
Collateral |
| (dollars in thousands) | | | | | | | | |
AA+ | | $ | 1,132,780 | | $ | 3,134 | | $ | | | $ | 3,134 |
AA | | | 11,061,155 | | | 82,672 | | | | | | 82,672 |
AA– | | | 17,021,136 | | | 28,811 | | | | | | 28,811 |
A+ | | | 3,978,500 | | | 32,324 | | | 13,438 | | | 18,886 |
A | | | | | | | | | | | | |
Member institutions(1) | | | 55,500 | | | | | | | | | |
| | | | | | | | | | | | |
Total | | $ | 33,249,071 | | $ | 146,941 | | $ | 13,438 | | $ | 133,503 |
| | | | | | | | | | | | |
| |
| | | As of December 31, 2005 |
Counterparty Credit Exposure by Credit Rating | | Notional
Amount | | Total Net
Exposure
at Fair
Value | | Collateral
Held | | Net
Exposure
After
Collateral |
| (dollars in thousands) | | | | | | | | |
AA+ | | $ | 834,130 | | $ | | | $ | | | $ | |
AA | | | 2,626,562 | | | | | | | | | |
AA– | | | 9,887,592 | | | | | | | | | |
A+ | | | 4,914,175 | | | 4,556 | | | | | | 4,556 |
A | | | 140,000 | | | | | | | | | |
Member institutions(1) | | | 60,500 | | | | | | | | | |
| | | | | | | | | | | | |
Total | | $ | 18,462,959 | | $ | 4,556 | | $ | | | $ | 4,556 |
| | | | | | | | | | | | |
| (1) | Collateral held with respect to interest-rate exchange agreements with member institutions represents either collateral physically held by or on behalf of the Seattle Bank or collateral assigned to the Seattle Bank, as evidenced by a written security agreement, and held by the member institution for the benefit of the Seattle Bank. This notional amount excludes stand-alone delivery commitments. |
89
We have never experienced a loss on a derivative transaction due to default by a counterparty. We believe that the credit risk on our interest-rate exchange agreements is low because we contract with counterparties that are of very high credit quality. As of December 31, 2006, 20 counterparties represented the total notional amount of our outstanding interest-rate exchange agreements excluding agreements in which we served as intermediaries. As of December 31, 2006, 87.9% of the total notional amount of our outstanding interest-rate exchange agreements was with 14 counterparties rated AA– or higher. Excluding interest-rate exchange agreements in which we are an intermediary for members and which are fully collateralized, 100.0% as of December 31, 2006 and 2005 of the notional amount of our outstanding interest-rate exchange agreements were with counterparties with credit ratings of “A” or equivalent from an NRSRO, such as Standard & Poor’s or Moody’s.
90
ITEM 8. FINANCIAL STATEMENTS AND SUPPLEMENTARY DATA
Index to Financial Statements and Supplementary Data
| | |
| | | Page |
| Audited Financial Statements | | |
Report of Independent Registered Public Accounting Firm—PricewaterhouseCoopers, LLP | | 92 |
Statements of Condition as of December 31, 2006 and 2005 | | 93 |
Statements of Income for the Years Ended December 31, 2006, 2005, and 2004 | | 94 |
Statements of Capital Accounts for the Years Ended December 31, 2006, 2005, and 2004 | | 95 |
Statements of Cash Flows for the Years Ended December 31, 2006, 2005, and 2004 | | 96-97 |
Notes to Financial Statements | | 98-154 |
| |
| Audited Financial Statements Supplementary Data | | |
Unaudited Supplementary Data | | 155-158 |
91
Report of Independent Registered Public Accounting Firm
To the Board of Directors and Shareholders of
the Federal Home Loan Bank of Seattle:
In our opinion, the accompanying statements of condition and the related statements of income, capital and of cash flows present fairly, in all material respects, the financial position of the Federal Home Loan Bank of Seattle (the “Bank”) at December 31, 2006 and 2005, and the results of its operations and its cash flows for each of the three years in the period ended December 31, 2006, in conformity with accounting principles generally accepted in the United States of America. These financial statements are the responsibility of the Bank’s management. Our responsibility is to express an opinion on these financial statements based on our audits. We conducted our audits of these statements in accordance with the standards of the Public Company Accounting Oversight Board (United States). Those standards require that we plan and perform the audit to obtain reasonable assurance about whether the financial statements are free of material misstatement. An audit includes examining, on a test basis, evidence supporting the amounts and disclosures in the financial statements, assessing the accounting principles used and significant estimates made by management, and evaluating the overall financial statement presentation. We believe that our audits provide a reasonable basis for our opinion.

San Francisco, CA
March 30, 2007
92
Federal Home Loan Bank of Seattle
Statements of Condition
| | | | | | | |
| | | As of December 31, 2006 | | | As of December 31, 2005 |
| | |
| (dollars in thousands, except par value) | | | | | |
Assets | | | | | | | |
Cash and due from banks (Note 3) | | $ | 1,119 | | | $ | 4,124 |
Restricted cash (Note 4) | | | | | | | 15,360 |
Interest-bearing deposits | | | 2,165,000 | | | | 1,415,007 |
Securities purchased under agreements to resell (Note 5) | | | | | | | 850,000 |
Federal funds sold | | | 2,832,000 | | | | 6,428,000 |
Held-to-maturity securities* (Other FHLBanks’ consolidated obligations: $4,224,959 and $5,274,944) (Note 6) | | | 13,687,909 | | | | 14,877,594 |
Advances (Note 7) | | | 27,960,994 | | | | 21,435,492 |
Mortgage loans held for portfolio (Note 10) | | | 6,366,648 | | | | 7,215,607 |
Accrued interest receivable (Other FHLBanks: $51,325 and $ 59,219) | | | 323,342 | | | | 250,943 |
Premises and equipment, net | | | 12,622 | | | | 13,963 |
Derivative assets (Note 16) | | | 146,900 | | | | 13,205 |
Receivable from Resolution Funding Corporation (REFCORP) (Note 9) | | | | | | | 2,528 |
Other assets | | | 18,211 | | | | 19,747 |
| | | | | | | |
Total Assets | | $ | 53,514,745 | | | $ | 52,541,570 |
| | | | | | | |
Liabilities and Capital | | | | | | | |
Liabilities | | | | | | | |
Deposits (Note 11) | | $ | 1,003,960 | | | $ | 800,820 |
Securities sold under agreements to repurchase (Note 12) | | | | | | | 393,500 |
Consolidated obligations, net (Note 13): | | | | | | | |
Discount notes | | | 1,495,861 | | | | 10,620,951 |
Bonds | | | 48,040,715 | | | | 37,881,557 |
| | | | | | | |
Total consolidated obligations, net | | | 49,536,576 | | | | 48,502,508 |
| | | | | | | |
Accrued interest payable | | | 567,585 | | | | 377,236 |
Affordable Housing Program (AHP) (Note 8) | | | 22,759 | | | | 31,235 |
Payable to REFCORP (Note 9) | | | 1,541 | | | | |
Derivative liabilities (Note 16) | | | 46,846 | | | | 133,765 |
Other liabilities | | | 34,952 | | | | 34,954 |
Mandatorily redeemable Class B stock (Note 14) | | | 69,222 | | | | 66,259 |
| | | | | | | |
Total Liabilities | | | 51,283,441 | | | | 50,340,277 |
| | | | | | | |
Commitments and Contingencies (Note 18) | | | | | | | |
Capital | | | | | | | |
Capital Stock ($100 par value), putable, issued and outstanding shares (Note 14) | | | | | | | |
Class B stock: (21,410) | | | 2,140,997 | | | | |
Class B(1) stock: (20,197) | | | | | | | 2,019,731 |
Class B(2) stock: (1,128) | | | | | | | 112,803 |
Retained earnings | | | 92,397 | | | | 68,759 |
Accumulated other comprehensive income/(loss)
Adoption of SFAS 158 to employee retirement plan (Note 15) | | | (2,090 | ) | | | |
| | | | | | | |
Total Capital | | | 2,231,304 | | | | 2,201,293 |
| | | | | | | |
Total Liabilities and Capital | | $ | 53,514,745 | | | $ | 52,541,570 |
| | | | | | | |
| * | Fair values of held-to-maturity securities were $13,474,121 and $14,584,699 as of December 31, 2006 and 2005. |
The accompanying notes are an integral part of these financial statements.
93
Federal Home Loan Bank of Seattle
Statements of Income
| | | | | | | | | | | | |
For the Years Ended December 31, | | 2006 | | | 2005 | | | 2004 | |
| (dollars in thousands) | | | |
Interest Income | | | | | | | | | | | | |
Advances | | $ | 1,289,132 | | | $ | 689,527 | | | $ | 422,572 | |
Prepayment fees on advances | | | 608 | | | | 4,626 | | | | 954 | |
Interest-bearing deposits | | | 59,981 | | | | 22,395 | | | | 14,231 | |
Securities purchased under agreements to resell | | | 12,475 | | | | 4,077 | | | | 655 | |
Federal funds sold | | | 247,960 | | | | 117,547 | | | | 34,890 | |
Trading securities | | | | | | | 13,332 | | | | 14,500 | |
Held-to-maturity securities (Other FHLBank’s consolidated obligations: $166,736, $226,762 and $ 142,948) | | | 578,584 | | | | 663,173 | | | | 644,880 | |
Mortgage loans held for portfolio | | | 344,234 | | | | 446,216 | | | | 540,267 | |
Loans to other FHLBanks | | | 19 | | | | 26 | | | | 10 | |
| | | | | | | | | | | | |
Total interest income | | | 2,532,993 | | | | 1,960,919 | | | | 1,672,959 | |
| | | | | | | | | | | | |
Interest Expense | | | | | | | | | | | | |
Consolidated obligations | | | 2,413,097 | | | | 1,822,266 | | | | 1,502,955 | |
Deposits | | | 34,974 | | | | 26,673 | | | | 14,132 | |
Securities sold under agreements to repurchase | | | 7,705 | | | | 15,162 | | | | 8 | |
Mandatorily redeemable Class B stock and other borrowings | | | 197 | | | | 28 | | | | 228 | |
| | | | | | | | | | | | |
Total interest expense | | | 2,455,973 | | | | 1,864,129 | | | | 1,517,323 | |
| | | | | | | | | | | | |
Net Interest Income | | | 77,020 | | | | 96,790 | | | | 155,636 | |
| | | |
Other Income (Loss) | | | | | | | | | | | | |
Service fees | | | 1,691 | | | | 2,183 | | | | 2,266 | |
Net gain from trading securities | | | | | | | 1,979 | | | | 11,493 | |
Net (loss) gain from sale of held-to-maturity securities | | | (6,496 | ) | | | (1,234 | ) | | | 5,586 | |
Net gain (loss) on derivatives and hedging activities | | | 470 | | | | (26,475 | ) | | | (15,583 | ) |
Net gain (loss) on early extinguishment of consolidated obligations | | | 7,232 | | | | (9,449 | ) | | | | |
Net realized gain on sale of mortgage loans held for sale | | | | | | | 5,940 | | | | | |
Other loss, net | | | (205 | ) | | | (728 | ) | | | (252 | ) |
| | | | | | | | | | | | |
Total other income (loss) | | | 2,692 | | | | (27,784 | ) | | | 3,510 | |
| | | | | | | | | | | | |
Other Expense | | | | | | | | | | | | |
Operating expenses: | | | | | | | | | | | | |
Compensation and benefits | | | 22,521 | | | | 26,159 | | | | 24,088 | |
Other operating | | | 17,809 | | | | 35,342 | | | | 17,349 | |
Federal Housing Finance Board | | | 1,599 | | | | 1,832 | | | | 1,521 | |
Office of Finance | | | 1,312 | | | | 1,269 | | | | 1,124 | |
Other | | | 1,384 | | | | 1,892 | | | | 2,473 | |
| | | | | | | | | | | | |
Total other expense | | | 44,625 | | | | 66,494 | | | | 46,555 | |
| | | | | | | | | | | | |
Income Before Assessments | | | 35,087 | | | | 2,512 | | | | 112,591 | |
Assessments | | | | | | | | | | | | |
Affordable Housing Program (AHP) | | | 2,871 | | | | 370 | | | | 9,191 | |
Resolution Funding Corporation (REFCORP) | | | 6,443 | | | | 428 | | | | 20,680 | |
| | | | | | | | | | | | |
Total assessments | | | 9,314 | | | | 798 | | | | 29,871 | |
| | | | | | | | | | | | |
Net Income | | $ | 25,773 | | | $ | 1,714 | | | $ | 82,720 | |
| | | | | | | | | | | | |
The accompanying notes are an integral part of these financial statements.
94
Federal Home Loan Bank of Seattle
Statement of Capital
| | | | | | | | | | | | | | | | | | | | | | | | | | | | | | | |
| | | Class B Stock – Putable | | Class B(1) Stock –
Putable | | | Class B(2) Stock –
Putable | | | Retained Earnings | | | Accumulated
Other
Comprehensive Income | | | Total Capital | |
For the Years Ended December 31, 2006, 2005 and 2004 | | Shares | | Par Value | | Shares | | | Par Value | | | Shares | | | Par Value | | | | |
(dollars in thousands, except annualized dividend rate data) | | | | | | | | | | | | | | | | | | | | | |
Balance as of December 31, 2003 | | | | | | | 22,850 | | | $ | 2,285,032 | | | 1,134 | | | $ | 113,473 | | | $ | 57,177 | | | $ | (75 | ) | | $ | 2,455,607 | |
Issuance of stock | | | | | | | 944 | | | | 94,388 | | | | | | | | | | | | | | | | | | | 94,388 | |
Transfers | | | | | | | (1,707 | ) | | | (170,697 | ) | | 1,707 | | | | 170,697 | | | | | | | | | | | | | |
Net shares classified as mandatorily redeemable Class B stock | | | | | | | (2,990 | ) | | | (298,982 | ) | | (2,312 | ) | | | (231,241 | ) | | | (378 | ) | | | | | | | (530,601 | ) |
Comprehensive income: | | | | | | | | | | | | | | | | | | | | | | | | | | | | | | | |
Net income | | | | | | | | | | | | | | | | | | | | | | 82,720 | | | | | | | | 82,720 | |
Other comprehensive income: | | | | | | | | | | | | | | | | | | | | | | | | | | | | | | | |
Reclassification adjustment for loss on hedging activities included in net income | | | | | | | | | | | | | | | | | | | | | | | | | | 75 | | | | 75 | |
| | | | | | | | | | | | | | | | | | | | | | | | | | | | | | | |
Total comprehensive income | | | | | | | | | | | | | | | | | | | | | | 82,720 | | | | 75 | | | | 82,795 | |
Dividends on stock: | | | | | | | | | | | | | | | | | | | | | | | | | | | | | | | |
Class B(1) stock (2.87%) and Class B(2) stock (0.63%) | | | | | | | | | | | | | | | | | | | | | | | | | | | | | | | |
Cash | | | | | | | | | | | | | | | | | | | | | | (66 | ) | | | | | | | (66 | ) |
Stock | | | | | | | 629 | | | | 62,853 | | | 13 | | | | 1,304 | | | | (64,157 | ) | | | | | | | | |
| | | | | | | | | | | | | | | | | | | | | | | | | | | | | | | |
Balance as of December 31, 2004 | | | | | | | 19,726 | | | $ | 1,972,594 | | | 542 | | | | 54,233 | | | $ | 75,296 | | | | | | | $ | 2,102,123 | |
Issuance of stock | | | | | | | 1,103 | | | | 110,291 | | | | | | | | | | | | | | | | | | | 110,291 | |
Transfers | | | | | | | (724 | ) | | | (72,374 | ) | | 724 | | | | 72,374 | | | | | | | | | | | | | |
Repurchases | | | | | | | | | | | | | | (104 | ) | | | (10,388 | ) | | | | | | | | | | | (10,388 | ) |
Net shares classified as mandatorily redeemable Class B stock | | | | | | | 10 | | | | 999 | | | (36 | ) | | | (3,650 | ) | | | 227 | | | | | | | | (2,424 | ) |
Comprehensive income: | | | | | | | | | | | | | | | | | | | | | | | | | | | | | | | |
Net income | | | | | | | | | | | | | | | | | | | | | | 1,714 | | | | | | | | 1,714 | |
Dividends on stock: | | | | | | | | | | | | | | | | | | | | | | | | | | | | | | | |
Class B(1) stock (0.41%) and Class B(2) stock (0.38%) | | | | | | | | | | | | | | | | | | | | | | | | | | | | | | | |
Cash | | | | | | | | | | | | | | | | | | | | | | (23 | ) | | | | | | | (23 | ) |
Stock | | | | | | | 82 | | | | 8,221 | | | 2 | | | | 234 | | | | (8,455 | ) | | | | | | | | |
| | | | | | | | | | | | | | | | | | | | | | | | | | | | | | | |
Balance as of December 31, 2005 | | | | | | | 20,197 | | | $ | 2,019,731 | | | 1,128 | | | | 112,803 | | | $ | 68,759 | | | | | | | $ | 2,201,293 | |
Issuance of stock | | 30 | | | 2,983 | | 85 | | | | 8,443 | | | | | | | | | | | | | | | | | | | 11,426 | |
Transfers | | | | | | | (1,424 | ) | | | (142,384 | ) | | 1,424 | | | | 142,384 | | | | | | | | | | | | | |
Net shares classified as mandatorily redeemable Class B stock | | | | | | | (29 | ) | | | (2,865 | ) | | (1 | ) | | | (98 | ) | | | | | | | | | | | (2,963 | ) |
Comprehensive income: | | | | | | | | | | | | | | | | | | | | | | | | | | | | | | | |
Net income | | | | | | | | | | | | | | | | | | | | | | 25,773 | | | | | | | | 25,773 | |
| | | | | | | | | | | | | | | | | | | | | | | | | | | | | | | |
Total comprehensive income | | | | | | | | | | | | | | | | | | | | | | | | | | | | | | | |
Adoption of SFAS 158 to employee retirement plan | | | | | | | | | | | | | | | | | | | | | | | | | | (2,090 | ) | | | (2,090 | ) |
Conversion to Class B Shares | | 21,380 | | | 2,138,014 | | (18,829 | ) | | | (1,882,925 | ) | | (2,551 | ) | | | (255,089 | ) | | | | | | | | | | | | |
Dividends on stock: | | | | | | | | | | | | | | | | | | | | | | | | | | | | | | | |
Class B(1) and Class B(2) stock (at $0.10 per share) | | | | | | | | | | | | | | | | | | | | | | | | | | | | | | | |
Cash | | | | | | | | | | | | | | | | | | | | | | (2,135 | ) | | | | | | | (2,135 | ) |
| | | | | | | | | | | | | | | | | | | | | | | | | | | | | | | |
Balance as of December 31, 2006 | | 21,410 | | $ | 2,140,997 | | | | | $ | | | | | | | $ | | | | $ | 92,397 | | | $ | (2,090 | ) | | $ | 2,231,304 | |
| | | | | | | | | | | | | | | | | | | | | | | | | | | | | | | |
The accompanying notes are an integral part of these financial statements.
95
Federal Home Loan Bank of Seattle
Statements of Cash Flows
| | | | | | | | | | | | |
For the Years Ended December 31, | | 2006 | | | 2005 | | | 2004 | |
| (dollars in thousands) | | | |
Operating Activities | | | | | | | | | | | | |
Net income | | $ | 25,773 | | | $ | 1,714 | | | $ | 82,720 | |
Adjustments to reconcile net income to net cash provided by operating activities: | | | | | | | | | | | | |
Depreciation and amortization: | | | | | | | | | | | | |
Net premiums and discounts on consolidated obligations, investments, and mortgage loans held for portfolio | | | (33,121 | ) | | | 39,600 | | | | 19,230 | |
Concessions on consolidated obligation bonds | | | 5,614 | | | | 6,046 | | | | 8,893 | |
Premises and equipment | | | 3,066 | | | | 2,219 | | | | 1,879 | |
Other | | | (1,818 | ) | | | | | | | 74 | |
Decrease (increase) in trading securities | | | | | | | 255,680 | | | | (11,493 | ) |
Net realized loss (gain) from sale of held-to-maturity securities | | | 6,496 | | | | 1,234 | | | | (5,586 | ) |
Net realized gain on sale of mortgage loans held for sale | | | | | | | (5,940 | ) | | | | |
Net increase in fair value adjustment on derivatives and hedging activities | | | (16,620 | ) | | | (49,412 | ) | | | (1,759 | ) |
(Gain) loss on early extinguishment of debt | | | (7,232 | ) | | | 9,449 | | | | | |
Net loss on disposal of premises and equipment | | | 232 | | | | 812 | | | | 422 | |
(Increase) decrease in accrued interest receivable | | | (72,398 | ) | | | 10,863 | | | | (39,761 | ) |
(Increase) decrease in net accrued interest on derivatives | | | (164,600 | ) | | | (26,251 | ) | | | 5,548 | |
Decrease (Increase) in other assets | | | 541 | | | | (355 | ) | | | (13,138 | ) |
Decrease in AHP liability and discount on AHP advances | | | (8,543 | ) | | | (12,323 | ) | | | (4,810 | ) |
Increase (decrease) in payable to REFCORP | | | 4,069 | | | | (6,832 | ) | | | (4,761 | ) |
Increase in accrued interest payable | | | 190,349 | | | | 2,096 | | | | 1,384 | |
(Decrease) increase in other liabilities | | | (2,090 | ) | | | 12,346 | | | | 7,631 | |
| | | | | | | | | | | | |
Total adjustments | | | (96,055 | ) | | | 239,232 | | | | (36,247 | ) |
| | | | | | | | | | | | |
Net cash (used in) provided by operating activities | | | (70,282 | ) | | | 240,946 | | | | 46,473 | |
| | | | | | | | | | | | |
Investing Activities | | | | | | | | | | | | |
Net (increase) decrease in interest-bearing deposits | | | (734,639 | ) | | | (1,230,360 | ) | | | 570,000 | |
Net decrease (increase) in securities purchased under agreements to resell | | | 850,000 | | | | (850,000 | ) | | | 100,000 | |
Net decrease (increase) in federal funds sold | | | 3,596,000 | | | | (4,748,500 | ) | | | 762,000 | |
Proceeds from maturities and sales of held-to-maturity securities (Other FHLBanks’ consolidated obligations: $1,050,000, $2,750,000, and $ 2,000,000) | | | 2,915,601 | | | | 7,102,022 | | | | 6,517,762 | |
Purchases of held-to-maturity securities (Other FHLBanks’ consolidated obligations: $0, $0, and $ 6,525,000) | | | (1,731,948 | ) | | | (1,686,265 | ) | | | (10,423,139 | ) |
Principal collected on advances | | | 98,677,705 | | | | 78,939,690 | | | | 47,455,260 | |
Advances made | | | (105,211,820 | ) | | | (85,630,554 | ) | | | (42,812,110 | ) |
Principal collections and recoveries on mortgage loans held for portfolio | | | 845,630 | | | | 3,304,113 | | | | 2,267,832 | |
Purchases of mortgage loans held for portfolio | | | | | | | (89,573 | ) | | | (1,568,678 | ) |
Net increase in premises and equipment | | | (1,956 | ) | | | (7,025 | ) | | | (7,011 | ) |
| | | | | | | | | | | | |
Net cash (used in) provided by investment activities | | $ | (795,427 | ) | | $ | (4,896,452 | ) | | $ | 2,861,916 | |
| | | | | | | | | | | | |
The accompanying notes are an integral part of these financial statements
96
Federal Home Loan Bank of Seattle
Statements of Cash Flows—(Continued)
| | | | | | | | | | | | |
For the Years Ended December 31, | | 2006 | | | 2005 | | | 2004 | |
| (dollars in thousands) | | | | | | | | | |
Financing Activities | | | | | | | | | | | | |
Net decrease in deposits | | $ | 203,140 | | | $ | (212,494 | ) | | $ | (303,424 | ) |
Net (decrease) increase in securities purchased under agreements to repurchase | | | (393,500 | ) | | | 314,200 | | | | 79,300 | |
Net proceeds from issuance of consolidated obligations: | | | | | | | | | | | | |
Discount notes | | | 351,198,739 | | | | 450,714,148 | | | | 250,189,434 | |
Bonds (Transfer from other FHLBanks: $0, $93,000, and $ 362,000) | | | 25,502,528 | | | | 9,763,249 | | | | 17,341,515 | |
Payments for maturing and retiring consolidated obligations | | | | | | | | | | | | |
Discount notes | | | (360,290,972 | ) | | | (442,926,907 | ) | | | (253,994,112 | ) |
Bonds | | | (15,366,522 | ) | | | (13,096,593 | ) | | | (15,848,713 | ) |
Proceeds from the sale of Class B stock, formerly B(1) | | | 11,426 | | | | 110,291 | | | | 94,388 | |
Repurchases of Class B(2) stock | | | | | | | (10,388 | ) | | | | |
Retirement of mandatorily redeemable Class B(1) stock | | | | | | | | | | | (235,635 | ) |
Retirement of mandatorily redeemable Class B(2) stock | | | | | | | (415 | ) | | | (230,827 | ) |
Dividends paid | | | (2,135 | ) | | | (23 | ) | | | (66 | ) |
| | | | | | | | | | | | |
Net cash provided by (used in) in financing activities | | | 862,704 | | | | 4,655,068 | | | | (2,908,140 | ) |
| | | | | | | | | | | | |
Net increase (decrease) in cash and cash equivalents | | | (3,005 | ) | | | (438 | ) | | | 249 | |
Cash and cash equivalents at beginning of year | | | 4,124 | | | | 4,562 | | | | 4,313 | |
| | | | | | | | | | | | |
Cash and cash equivalents at end of year | | $ | 1,119 | | | $ | 4,124 | | | $ | 4,562 | |
| | | | | | | | | | | | |
Supplemental Disclosures | | | | | | | | | | | | |
Interest paid | | $ | 2,266,149 | | | $ | 1,862,143 | | | $ | 1,515,939 | |
Affordable Housing Program payments | | | 11,348 | | | | 12,693 | | | | 14,001 | |
Resolution Funding Corporation payments, net | | | 2,402 | | | | 7,260 | | | | 25,442 | |
Real estate owned | | | 373 | | | | | | | | | |
The accompanying notes are an integral part of these financial statements.
97
Federal Home Loan Bank of Seattle
Notes to Financial Statements
BACKGROUND INFORMATION
The Federal Home Loan Bank of Seattle (the Seattle Bank), a federally chartered corporation, is one of 12 district Federal Home Loan Banks (FHLBanks) and was created by Congress under the authority of the Federal Home Loan Bank Act of 1932, as amended, or the FHLBank Act. The FHLBanks serve the public by enhancing the availability of credit for residential mortgages and targeted community development. We provide a readily available, low-cost source of funds to our member institutions. The Seattle Bank is a cooperative, which means that current members own nearly all of our outstanding capital stock and may receive dividends on their investment. Regulated financial depositories and insurance companies engaged in residential housing finance may apply for membership.
All members must purchase stock in the Seattle Bank. Our current capital plan provides for two classes of putable Class A and Class B stock, each of which has a par value of $100. Each class of stock can be issued, redeemed, and repurchased only at par value. For membership requirements, members are required to hold a specified amount of our putable Class B stock, based on the member’s home mortgage loans and mortgage loan pass-through securities. Class A stock can only be purchased to support member advance activity. As a result of these stock ownership requirements, we conduct business with related parties in the normal course of business. For purposes of these financial statements, we consider related parties as those members that own more than 10.0% of our total outstanding capital stock including our mandatorily redeemable Class B stock. See Notes 14 and 21 for additional information regarding membership requirements and related party transactions.
The Federal Housing Finance Board, or Finance Board, an independent agency in the executive branch of the United States Government, supervises and regulates the FHLBanks and the Office of Finance. The Finance Board’s principal purpose is to ensure that the FHLBanks operate in a safe and sound manner. In addition, the Finance Board ensures that the FHLBanks carry out their housing finance mission, remain adequately capitalized, and can raise funds in the capital markets. Also, the Finance Board establishes policies and regulations covering the operations of the FHLBanks. The Seattle Bank operates as a separate entity with its own management, employees, and Board of Directors, or Board. The Seattle Bank does not conduct business through any special purpose entities or any other type of off-balance-sheet conduits.
The FHLBanks’ debt instruments (consolidated obligations) are the joint and several obligations of all the FHLBanks and are the primary source of funds for the FHLBanks. Deposits, other borrowings, and capital stock issued to members also provide funds. We have historically used all these funding sources to provide advances to members and to purchase mortgage loans from members.
• Finance Board Agreement; Three-Year Business and Capital Management Plan •On December 10, 2004, under the oversight of a special committee of our Board of Directors and with our Board’s approval, we entered into a written agreement with the Finance Board, which we refer to as the Written Agreement, and operated under until January, 2007 when the Finance Board terminated such Written Agreement. The Written Agreement imposed certain requirements on us that were intended to strengthen our risk management, capital structure, governance, and capital plan. Our Board of Directors was responsible for monitoring and coordinating our compliance with the terms of the Written Agreement.
On April 5, 2005, as part of the Written Agreement, we submitted our three-year business and capital management plan to the Finance Board, which was accepted by the Finance Board on May18, 2005, subject to our adoption of certain dividend and stock repurchase restrictions. To meet the Finance Board conditions, our Board of Directors adopted policies on May 18, 2005, (i) suspending indefinitely the declaration or payment of any dividends and providing that any future dividend declaration or payment generally may be made only after prior approval of the Director of the Office of Supervision of the Finance Board, referred to as the OS Director,
98
Federal Home Loan Bank of Seattle
Notes to Financial Statements—(Continued)
and (ii) suspending indefinitely the repurchase of any Class B stock, except under limited circumstances, after prior approval of the OS Director.
These policies were to be in effect until formally revoked by our Board of Directors following approval of the OS Director. Our Board of Directors sought a waiver to begin declaring dividends again which was approved by the OS Director in December, 2006 subject to certain restrictions. We have not sought and do not expect to obtain waivers from the Finance Board for the repurchase of Class B stock in the foreseeable future.
Note 1—Summary of Significant Accounting Policies
• Use of Estimates • The preparation of financial statements in accordance with accounting principles generally accepted in the United States of America, or GAAP, requires management to make assumptions and estimates. These assumptions and estimates affect the reported amounts of assets and liabilities, the disclosure of contingent assets and liabilities, and the reported amounts of income and expenses. Actual results could differ from these estimates.
•Accounting Changes and Error Corrections • During 2005, we adopted Statement of Financial Accounting Standards (SFAS) No. 154,Accounting Changes and Error Corrections, a replacement of APB Opinion No. 20 and FASB Statement No. 3, or SFAS 154, and during 2006, we adopted Securities and Exchange Commission Staff Accounting Bulletin No. 108,Considering the Effects of Prior Year Misstatements when Quantifying Misstatements in Current Year Financial Statements,or SAB 108. We account for changes in accounting principle through retrospective application of newly implemented accounting principle to all prior periods, unless it is impractical to do so, or not required in the new pronouncement’s transition requirements. We account for changes in accounting estimates in (a) the period of change if the change affects that period only or (b) the period of change and the future period if the change affects both such periods. We account for corrections of errors in previously issued financial statements as a prior-period adjustment by restating the prior-period financial statements. Restatement may include either reissuance of prior-year financial statements or correction of prior-year results in the current-year financial statements, depending upon the materiality of the error.
• Segment Disclosure • Our core business is traditional member finance, which includes making advances, providing letters of credit, accepting deposits, and providing securities safekeeping and other services. Historically, we offered products and services through two operating segments, traditional member finance and the Mortgage Purchase Program, or MPP. The MPP segment consisted of mortgage loans held for portfolio as a result of purchases from participating members. During the first quarter of 2005, we decided to exit the MPP. As a result of this decision, we no longer manage the business using separate operating segments. We now aggregate the operating results of the former MPP segment with the traditional member finance segment for decision-making purposes. Accordingly, the note containing segment information previously contained in the notes to our financial statements has been removed from these Notes to Financial Statements. Certain amounts from the prior period have been modified to conform to the current presentation.
• Interest-Bearing Deposits in Banks, Securities Purchased Under Agreements to Resell and Federal Funds Sold •These investments provide short-term liquidity and are carried at cost. We treat securities purchased under agreements to resell as collateralized financings.
• Investments •We carry, at cost, investments that we have both the ability and intent to hold to maturity, adjusted for the amortization of premiums and accretion of discounts using the level-yield method. Under
99
Federal Home Loan Bank of Seattle
Notes to Financial Statements—(Continued)
SFAS No. 115,Accounting for Certain Investments in Debt and Equity Securities,or SFAS 115, changes in circumstances may cause us to change our intent to hold a certain security to maturity without calling into question its intent to hold other debt securities to maturity in the future. Thus, the sale or transfer of a held-to-maturity security due to certain changes in circumstances, such as evidence of significant deterioration in the issuer’s creditworthiness or changes in regulatory requirements, is not considered to be inconsistent with its original classification. Other events that are isolated, nonrecurring, and unusual that could not have been reasonably anticipated may cause us to sell or transfer a held-to-maturity security without necessarily calling into question its intent to hold other debt securities to maturity.
In addition and in accordance with SFAS 115, sales of debt securities that meet either of the following two conditions may be considered as maturities for purposes of the classification of securities: (i) the sale occurs near enough to its maturity date (or call date if exercise of the call is probable) that interest rate risk is substantially eliminated as a pricing factor and the changes in market interest rates would not have a significant effect on the security’s fair value; or (ii) the sale of a security occurs after we have already collected a substantial portion (at least 85.0%) of the principal outstanding at acquisition due either to prepayments on the debt security or to scheduled payments on a debt security, payable in equal installments (both principal and interest) over its term.
We compute the amortization and accretion of premiums and discounts on securities using the level-yield method over the historical cash flows and estimated prepayments of the securities. This method requires a retrospective adjustment of the effective yield each time we change the estimated cash flow as if the new estimate had been known since the original acquisition date of the securities. We compute the amortization and accretion of premiums and discounts on other investments using the level-yield method to the contractual maturity of the securities.
We classified certain investments acquired for purposes of liquidity and asset-liability management as trading securities and carried them at fair value. This classification was determined at the time of acquisition, and investments included in this classification were generally debt securities or mortgage-based securities issued by other government-sponsored enterprises, or GSEs. We record changes in the fair value of these investments through current earnings. However, we do not participate in trading practices and had discontinued holding trading securities since the fourth quarter of 2005.
We compute gains and losses on sales of investment securities using the specific identification method and include these gains and losses in other income. We account for securities purchased under agreements to resell as collateralized financing.
We regularly evaluate outstanding investments for changes in fair value and record an impairment loss when a decline in fair value is deemed to be other than temporary. An investment is deemed impaired if the fair value of the investment is less than its amortized cost. After the investment is determined to be impaired, we evaluate whether this decline in value is other than temporary. When evaluating whether the impairment is other than temporary, we take into consideration whether or not we are going to receive all of the investment’s contractual cash flows and our intent and ability to hold the investment for a sufficient amount of time to recover the unrealized losses. In addition, we consider issuer or collateral specific factors, such as rating agency actions and business and financial outlook. We also evaluate broader industry and sector performance indicators. If there is an other-than-temporary impairment in value of an investment, the decline in value is recognized as a loss and presented in the Statement of Income as other expense. We have not experienced any other-than-temporary impairment in value of our investments during the three years ended December 31, 2006, 2005 or 2004.
• Advances • We report advances, net of unearned commitment fees and discounts on advances for the Affordable Housing Program, or AHP, as discussed below. We amortize the premiums and discounts on
100
Federal Home Loan Bank of Seattle
Notes to Financial Statements—(Continued)
advances to interest income using the straight-line method, which produces a result that is expected to be immaterially different from the level-yield method. The results of the two methods are compared at least on an annual basis, and necessary adjustments are made to bring amortization amounts close or equal to level-yield results. We credit interest on advances to income as earned. Following the requirements of the FHLBank Act, we obtain sufficient collateral on advances to protect us from losses. The FHLBank Act limits eligible collateral to certain investment securities, residential mortgage loans, cash or deposits with us, and other eligible real estate-related assets. As Note 7, Advances, more fully describes, Community Financial Institutions (FDIC-insured institutions with average assets over the preceding three-year period of $587.0 million or less during 2006), or CFI’s, are eligible to utilize expanded statutory collateral rules that include secured small business and agricultural loans, and securities representing a whole interest in such secured loans. We have not incurred any credit losses on advances since our inception.
• Mortgage Loans Held for Portfolio •We historically purchased mortgage loans held for portfolio through the MPP. Within the MPP, we invested in government-insured (Federal Home Administration-insured and Veterans’ Administration-guaranteed) and conventional residential mortgage loans purchased directly from our participating members. In March 2005, we announced that we were exiting the MPP in order to lower our overall risk profile and reduce our operating cost structure. As a result, we no longer enter into new master commitment contracts and have closed out all open contracts.
We classify mortgage loans as held for investment and, accordingly, report them at their principal amount outstanding, net of premiums and discounts. We defer and amortize mortgage loan premiums and accrete mortgage loan discounts paid to and received by our members as interest income, using the level-yield method over the estimated life of the related mortgage loans in accordance with SFAS Statement No. 91,Accounting for Nonrefundable Fees and Costs Associated with Originating or Acquiring Loans and Initial Direct Costs of Leases, or SFAS 91. Actual prepayment experience and estimates of future principal prepayments are used in calculating the estimated lives of the mortgage loans. We aggregate the mortgage loans by similar characteristics (i.e., type, maturity, note rate and acquisition date) in determining prepayment estimates. This amortization method requires a retrospective adjustment each time we change the estimated lives, as if the new estimate had been known since the original acquisition date of the mortgage loans.
Under the MPP, we manage the liquidity, interest-rate and prepayment risks of the mortgage loans. Members either retained or released the loan-servicing activities. If participating in the servicing released program, the member concurrently sold the servicing of the mortgage loans to a qualified mortgage service provider. We and the member share in the credit risk on conventional mortgage loans, with the member assuming a first-loss obligation equivalent to the greater of expected losses or the minimum requirement for the supplemental mortgage insurance, or SMI, policy. We assume credit losses in excess of mortgage insurance coverage, SMI coverage, and the member’s obligation.
To ensure the retention of credit risk and to cover the expected losses on conventional mortgage loans originated or acquired by a member, a lender risk account, or LRA, was established either up front as a portion of the purchase proceeds, other credit enhancement fees or by an additional modification to the yield on the mortgage loans purchased such that a portion of the amount paid by the member each month is designated for the LRA. This account was established to conform to regulations as established by the Finance Board for all conventional mortgage purchase programs. The Finance Board regulations stipulate that the member is responsible for all expected losses on the mortgages sold to us. In order to comply with this regulation, we evaluated the proposed conventional mortgages to be sold (either the specific portfolio or a representative sample) to determine the amount of expected losses that would occur. The SMI provider determined the minimum amount required in order to issue a policy. The member funded the LRA with the greater of the
101
Federal Home Loan Bank of Seattle
Notes to Financial Statements—(Continued)
expected losses or the minimum amount required by the SMI provider to provide SMI insurance. Each master commitment contract specifies the required funding level for its associated LRA. In accordance with the applicable contract, either the purchase price for the mortgage loans purchased under a member’s master commitment contract was discounted or the amount paid monthly by the member was increased to fund the LRA. The LRA funds are used to offset any losses that may occur, with any excess of required balances distributed to the member in accordance with a step-down schedule that is stipulated in each master commitment contract. No LRA balance is required after eleven years. The LRA is recorded in “other liabilities” and totaled $19.8 million and $16.5 million as of December 31, 2006 and 2005.
As a result of the credit enhancements described above, we and our participating members share the credit risk of the mortgage loans sold to us under the MPP. The participating member assumed a first-loss obligation equivalent to a minimum of the expected losses through its LRA, and we assumed credit losses in excess of primary mortgage insurance coverage, the participating member’s LRA, and SMI coverage. Under the credit enhancement structure of the MPP, the value of the foreclosed property would have to fall below 50.0% of the outstanding loan amount to result in a loss to us. We regularly monitor delinquency data provided by our participating members to ensure that mortgage principal and interest are remitted timely. In addition, loan servicers are responsible for remitting principal and interest to us, even though there may be individual mortgage loans with delinquent payments owed to the loan servicer.
In addition to the expected losses covered by the LRA, the member who was selling conventional loans to us was required to purchase SMI as an enhancement for losses over and above losses covered by the LRA. We are listed as the insured and this coverage serves to further limit our exposure to losses. The LRA and the SMI are expected to provide the equivalent to an investment-grade rating. As with the funding of the LRA, either the purchase price for the mortgage loans purchased under a member’s master commitment contract was discounted or the amount paid monthly by the member was increased to fund the SMI. In the event the LRA and the standard SMI policy did not provide sufficient loss protection to support the equivalent investment grade rating, additional mortgage insurance coverage called SMI Plus also had to be purchased by the member. This policy covers the expected losses to achieve an investment-grade rating (equivalent to AA) over and above the LRA and SMI. Other than the LRA, SMI, and if applicable, SMI Plus, we do not charge any other credit enhancement fees to MPP participants.
We base the allowance for credit losses on management’s estimate of credit losses inherent in our mortgage loan portfolio as of the Statement of Condition date. We perform periodic reviews of our portfolio to identify the losses inherent within the portfolio and to determine the likelihood of collection of the portfolio. The overall allowance is determined by an analysis that includes consideration of various data observations such as past performance, current performance, loan portfolio characteristics, collateral valuations, industry data, and prevailing economic conditions. As a result of this analysis, we have determined that each member’s obligation for losses and the mortgage insurance coverage exceeds the inherent loss in the portfolio. Accordingly, no allowance for loan losses is considered necessary. Also, because we have never experienced a loss on our mortgage loans held for portfolio and because of the credit enhancements available to us, we continue to accrue interest on loans that are 90 days or more past due.
• Premises and Equipment •We record premises, software, and equipment at cost, less accumulated depreciation and amortization. Our accumulated depreciation and amortization related to premises, software and equipment was $8.1 million and $6.4 million as of December 31, 2006 and 2005. We compute depreciation on the straight-line method over the estimated useful lives of relevant assets, ranging from three to 10 years. We amortize leasehold improvements on the straight-line basis over the shorter of the estimated useful life of the improvement or the remaining term of the lease. We capitalize improvements and major renewals but expense
102
Federal Home Loan Bank of Seattle
Notes to Financial Statements—(Continued)
ordinary maintenance and repairs when incurred. Depreciation and amortization expense for premises, software, and equipment was $3.1 million, $2.2 million, and $1.9 million, for the years ended December 31, 2006, 2005, and 2004. We include gains and losses on disposal of premises, software, and equipment in “other income”. The net realized loss on disposal of premises, software, and equipment was $119,000, $812,000 and $422,000 for the years ended December 31, 2006, 2005, and 2004.
Cost of computer software developed or obtained for internal use is accounted for in accordance with Statement of Position No. 98-1,Accounting for the Costs of Computer Software Developed or Obtained forInternal Use, or SOP 98-1. SOP 98-1 requires the cost of purchased software and certain costs incurred in developing computer software for internal use to be capitalized and amortized over future periods. As of December 31, 2006 and 2005, we had $5.6 million and $6.9 million, in unamortized computer software costs included in our premises, software, and equipment. Amortization of computer software costs charged to expense was $714,000, $664,000, and $492,000 for the years ended December 31, 2006, 2005, and 2004.
• Derivatives •Accounting for derivatives is addressed in SFAS No. 133, Accounting for Derivative Instruments and Hedging Activities, as amended by SFAS No. 137, Accounting for Derivative Instruments and Hedging Activities—Deferral of Effective Date of FASB Statement No. 133, SFAS No. 138, Accounting for Certain Derivative Instruments and Certain Hedging Activities, and SFAS No. 149, Amendment of Statement 133 on Derivative Instruments and Hedging Activities, or SFAS 133. All derivatives are recognized on the Statement of Condition at their fair values. Each derivative is designated as one of the following:
(i) a hedge of the fair value of a recognized asset or liability or an unrecognized firm commitment (a “fair value hedge”);
(ii) a non-qualifying hedge of an asset or liability (“economic hedge”) for asset-liability management purposes; or
(iii) a non-qualifying hedge of another derivative (an “intermediated hedge”) that is offered as a product to members or used to offset other derivatives with non-member counterparties.
Changes in the fair value of a derivative that is designated and qualifies as a fair value hedge, along with changes in the fair value of the hedged asset or liability that are attributable to the hedged risk (including changes that reflect losses or gains on firm commitments), are recorded in other income as “net gain (loss) on derivatives and hedging activities.”
For fair value hedges, any hedge ineffectiveness (which represents the amount by which the change in the fair value of the derivative differs from the change in the fair value of the hedged item) is recorded in other income as net gain (loss) on derivatives and hedging activities. Changes in the fair value of a derivative not qualifying as a hedge are recorded in current period earnings with no fair value adjustment to an asset or liability. Both the net interest on the derivative and the fair value adjustments are recorded in other income as net gain (loss) on derivatives and hedging activities. We did not apply cash-flow hedge accounting to any transactions for the years ended December 31, 2006 and 2005.
We use trade-date accounting for derivatives and hedge accounting activities. Under this convention, hedge accounting commences on the trade date with changes in the derivative’s fair value and with offsetting changes in the fair value of the hedged item recognized in earnings. Assuming the hedge was effective, the hedged item’s carrying amount is adjusted for fair value hedge changes that occurred after the trade date on the hedged item’s settlement date.
The differentials between accruals of interest receivables and payables on derivatives designated as fair value are recognized as adjustments to the income or expense of the designated underlying investment securities,
103
Federal Home Loan Bank of Seattle
Notes to Financial Statements—(Continued)
advances, consolidated obligations, or other financial instruments. The differentials between accruals of interest receivables and payables on intermediated hedges for members and other economic hedges are recognized in other income as “net gain (loss) on derivatives and hedging activities.”
We may issue debt, make advances, or purchase financial instruments in which a derivative instrument is “embedded.” Upon execution of these transactions, we assess whether the economic characteristics of the embedded derivative are clearly and closely related to the economic characteristics of the remaining component of the advance or debt (the host contract) and whether a separate, non-embedded instrument with the same terms as the embedded instrument would meet the definition of a derivative instrument. When we determine that (1) the embedded derivative has economic characteristics that are not clearly and closely related to the economic characteristics of the host contract, and (2) a separate, stand-alone instrument with the same terms would qualify as a derivative instrument, the embedded derivative is separated from the host contract, carried at fair value, and designated as a stand-alone derivative instrument pursuant to an economic hedge. However, if the entire contract (the host contract and the embedded derivative) is to be measured at fair value, with changes in fair value reported in current earnings (such as an investment security classified as trading under SFAS 115), or if we cannot reliably identify and measure the embedded derivative for purposes of separating that derivative from its host contract, the entire contract is carried on the Statement of Condition at fair value and no portion of the contract is designated as a hedging instrument.
If hedging relationships meet certain criteria specified in SFAS 133, they are eligible for hedge accounting and the offsetting changes in fair value of the hedged items may be recorded in earnings. The application of hedge accounting generally requires us to evaluate the effectiveness of the hedging relationships on an ongoing basis and to calculate the changes in fair value of the derivatives and related hedged items independently. This is known as the long-haul method of hedge accounting. Transactions that meet more stringent criteria qualify for the short-cut method of hedge accounting in which an assumption can be made that the change in fair value of a hedged item exactly offsets the change in fair value of the related derivative.
When hedge accounting is discontinued because we determine that the derivative no longer qualifies as an effective fair value hedge of an existing hedged item, we continue to carry the derivative on the Statements of Condition at its fair value, cease to adjust the hedged asset or liability for changes in fair value, and amortize the cumulative basis adjustment on the hedged item into earnings over the remaining life of the hedged item.
Derivatives are typically executed at the same time as the hedged advances or consolidated obligations and we designate the hedged item in a qualifying hedge relationship as of the trade date. In many hedging relationships, we may designate the hedging relationship upon its commitment to disburse an advance or trade a consolidated obligation in which settlement occurs within the shortest period of time possible for the type of instrument based on market settlement conventions.
During the second quarter of 2004, we changed our manner of assessing effectiveness for certain highly-effective hedging relationship transactions used since the adoption of SFAS 133 on January 1, 2001.
•Mandatorily Redeemable Capital Stock •We adopted SFAS No. 150,Accounting for Certain Financial Instruments with Characteristics of both Liabilities and Equity, or SFAS 150, effective as of January 1, 2004. In accordance with SFAS 150, we reclassify from equity to a liability Class B stock, formerly Class B(1) and Class B(2) stock, when a member gives notice of intent to withdraw from membership or attains non-member status by merger or acquisition, charter termination, or involuntary termination from membership and we determine the penalty the member would incur for rescinding the redemption request to be substantive. When the penalty, which is based on dividends paid, for rescinding a redemption request is not substantive, we will not reclassify
104
Federal Home Loan Bank of Seattle
Notes to Financial Statements—(Continued)
the equity stock as a mandatory redeemable liability. However, whenever circumstances change (e.g. a dividend is paid), we will evaluate the rescission penalty and, if necessary, make the appropriate reclassification.
The reclassification is made at fair value. Dividends declared on member shares classified as a liability in accordance with SFAS 150 are accrued at the expected dividend rate and reflected as interest expense in the Statement of Income. The repayment of these mandatorily redeemable financial instruments will be reflected as cash outflows in the financing activities section of the Statement of Cash Flows once redeemed.
If a member cancels its written notice of redemption or notice of withdrawal, we reclassify the mandatorily redeemable capital stock from a liability to equity in compliance with SFAS 150. After the reclassification, dividends on the capital stock will no longer be classified as interest expense. See Note 14 for more information.
• Prepayment Fees • We charge a member a prepayment fee when the member prepays certain advances before the original maturity. We record prepayment fees net of SFAS 133 basis adjustments included in the book basis of the advance as “prepayment fees on advances, net” in the interest income section of the Statements of Income. In cases in which we fund a new advance concurrent with or within a short period of time of the prepayment of an existing advance, we evaluate whether the new advance meets the accounting criteria to qualify as a modification of an existing advance or as a new advance in accordance with EITF Issue No. 01-7,Creditor’s Accounting for a Modification or Exchange of Debt Instruments, and SFAS 91. We initially assume that all advance prepayments are debt extinguishments and record the prepayment fees as interest income from advances. However, if a new advance is taken out by the member within five days immediately preceding or following the date of the advance prepayment, we then analyze whether the advance prepayment should remain reported as an extinguishment or whether it should be reported as a new advance.
If the new advance qualifies as a modification of the existing advance, the net prepayment fee on the prepaid advance is deferred, recorded in the basis of the modified advance, and amortized to advance interest income over the life of the modified advance using the straight-line method which produces a result that is expected to be immaterially different form the level-yield method. The amortization of such basis adjustments increased net interest income $1.6 million for December 31, 2006 and 2005 and $1.1 million for the year ended December 31, 2004. If we determine that a new advance does not qualify as a modification of an existing advance, the repayment of the existing advance is treated as a termination and the net fees are recorded in interest income as “prepayment fees on advances, net.”
• Commitment Fees • We defer commitment fees for advances and amortize them to interest income using the straight-line method. Our amortization of commitment fees is not materially different from the amount that would have been recognized using the level-yield method. Refundable fees are deferred until the commitment expires or until the advance is made. We record commitment fees for standby letters of credit as a deferred credit when we receive the fees and amortize them using the straight-line method over the term of the standby letter of credit. We believe that the likelihood of standby letters of credit being drawn upon is remote based upon past experience.
• Concessions on Consolidated Obligations • We defer and amortize using the level-yield method, concession fees paid to dealers in connection with the sale of consolidated obligations over the terms of the consolidated obligations. We changed to the level-yield method from straight-line method of accounting concession fees on consolidated obligation bonds in the second quarter of 2005. See Note 2 for additional information. The Office of Finance prorates the amount of the concession to us based upon the percentage of the debt issued that is assumed by us. Unamortized concessions were $13.7 million and $15.1 million as of December 31, 2006 and 2005 and are included in other assets on the Statements of Condition. When we call
105
Federal Home Loan Bank of Seattle
Notes to Financial Statements—(Continued)
consolidated obligations, the unamortized concession is charged to current period earnings. Amortization of such concessions is included in consolidated obligation interest expense and totaled $5.6 million, $6.8 million, and $9.4 million for the years ended 2006, 2005, and 2004.
• Discounts and Premiums on Consolidated Obligations • We expense the discounts on consolidated obligation discount notes using the level-yield method which amortizes the discounts and premiums on consolidated bonds to expense over the terms to maturity using estimated cash flows of the consolidated obligation bonds. We changed to the level-yield method from straight-line method of accounting for discounts and premiums and concession fees on consolidated obligation bonds in second quarter of 2005. See Note 2 for additional information.
• Post Retirement Pensions • Accounting for post-retirement pension plans are discussed in SFAS No. 87,Employers’ Accounting for Pensions, SFAS No. 88,Employers’ Accounting for Settlements and Curtailments of Defined-benefit Pension Plans and for Termination of Benefits, and SFAS No. 158,Employers’ Accounting for Defined-benefit Pension and other Postretirement Plans, or SFAS 158.
Our net periodic contributions to the defined-benefit pension plan are recorded as components of other expenses in the Statements of Income based on actuarial calculations performed by an employee benefits consulting firm. Any contribution due but unpaid at the end of a financial reporting period is recognized as a liability on the Statements of Condition. We adopted the newly issued accounting pronouncement, SFAS 158, in 2006. SFAS 158 requires projected benefit obligations to be determined and recognized for single-employer plans as a liability in the Statement of Condition with an offsetting amount in accumulated other comprehensive income. As of December 31, 2006 our accumulated other comprehensive loss balance was $2.1 million as a result of the adoption of SFAS 158.
We recognized periodic pension costs for our two defined-contribution pension plans based on an individual’s contribution to the account made for periods of service rendered. Any contribution due at the end of the financial reporting period is recognized as a liability on the Statement of Condition.
• Finance Board and Office of Finance Expenses • We are assessed for our proportionate share of the costs of operating the Finance Board and the Office of Finance. The Finance Board allocates its operating and capital expenditures to us based on each FHLBank’s percentage of total capital. The Office of Finance allocates its operating and capital expenditures based on each FHLBank’s percentage of capital stock, percentage of consolidated obligations issued and percentage of consolidated obligations outstanding.
• Affordable Housing Program Assessments •The FHLBank Act requires each FHLBank to establish and fund an AHP. We charge the required funding for AHP to earnings and establish a liability. The AHP funds provide subsidies to members to assist in the purchase, construction, or rehabilitation of housing for very low-, low-, and moderate-income households. We issue AHP advances at interest rates below the customary interest rate for non-subsidized advances. When we make an AHP advance, the present value of the variation in the cash flow caused by the difference in the interest rate between the AHP advance rate and our related cost of funds for comparable maturity funding is charged against the AHP liability and recorded as a discount on the AHP advance. As an alternative, we have the authority to make the AHP subsidy available to members as a grant. The discount on AHP advances is accreted to interest income on advances using the straight-line method over the life of the advance. See Note 8 for more information.
• Resolution Funding Corporation Assessments •Although FHLBanks are exempt from ordinary federal, state, and local taxation except for local real estate tax, we are required to make quarterly payments to the
106
Federal Home Loan Bank of Seattle
Notes to Financial Statements—(Continued)
Resolution Funding Corporation, or REFCORP, to pay interest on bonds issued by REFCORP. Officers, employees, and agents of the Office of Finance are authorized to act for and on behalf of REFCORP to carry out the functions of REFCORP. The REFCORP assessment is accrued in income, based on the applicable assessment rate. In no event, however, can our assessment be negative in any calendar year. See Note 9 for more information.
• Estimated Fair Values • Where available, we use quoted market prices from independent third-party sources to determine our estimated fair values. However, many of our financial instruments lack an available trading market characterized by transactions between a willing buyer and a willing seller engaging in an exchange transaction. Therefore, we use internal models employing significant estimates and present-value calculations when disclosing estimated fair values. Note 17 details the estimated fair values of our financial instruments.
• Cash Flows • In the Statements of Cash Flows, we consider cash and due from banks as cash and cash equivalents. Federal funds sold are not treated as cash equivalents for purposes of the Statements of Cash Flows, but are instead treated as short-term investments and are reflected in the investing activities section of the Statements of Cash Flows. As of December 31, 2006 and 2005, there were no investments that had been traded but not settled.
Note 2—Accounting Adjustments, Change in Accounting Principles and Recently Issued Accounting Standards and Interpretations
Accounting Adjustments
• Class B Capital Stock • In the fourth quarter of 2006, we made revisions to our Capital Plan that included converting all outstanding Class B(1) and Class B(2) stock to one Class B stock of equal par value without any action on the part of the members. As a result, a new line item, Class B stock, was created in the capital section of the 2006 Statement of Condition that represents the combined Class B(1) and Class B(2) stock as a single class of stock.
• Concession Fees, Premium and Discount Amortization Related to Consolidated Obligation Bonds •During the second quarter of 2005, we corrected our accounting for premiums, discounts, and concession fees on consolidated obligation bonds to comply with SFAS 91,Accounting for Nonrefundable Fees and Costs Associated with Originating or Acquiring Loans and Initial Direct Cost of Leases. Under our prior approach, we inappropriately applied the straight-line method to amortize premiums, discounts, and concession fees associated with consolidated obligation bonds. The new approach amortizes premiums, discounts, and concessions fees on consolidated obligation bonds using the level-yield method of amortization. Using this new approach, we recorded a cumulative adjustment of $1.1 million to the consolidated obligation interest expense during the second quarter of 2005.
• Mandatorily Redeemable Capital Stock • In May 2003, FASB issued SFAS 150 which establishes that certain financial instruments with characteristics of both liabilities and equity are to be classified in the financial statements as liabilities, including, among other things, mandatorily redeemable financial instruments. We adopted SFAS 150 as of January 1, 2004 based on the characteristics of our stock and the implementation guidance included in SFAS 150 and FASB Staff Position 150-3,Effective Date, Disclosures, and Transition for Mandatorily Redeemable Financial Instruments of Certain Nonpublic Entities and Certain Mandatorily Redeemable Noncontrolling Interests under FASB Statement No. 150, Accounting for Certain Financial Instruments with Characteristics of both Liabilities and Equity,or FASB Staff Position 150-3.
107
Federal Home Loan Bank of Seattle
Notes to Financial Statements—(Continued)
In compliance with SFAS 150, in our initial application of this principle, we reclassified stock subject to redemption from equity to a liability at fair value when a member exercised a written redemption right, gave notice of intent to withdraw from membership, or attain non-member status by merger or acquisition, charter termination, or involuntary termination from membership. Dividends related to Class B stock were classified as a liability, accrued at the expected dividend rate and reported as interest expense in the Statements of Income. The repayment of these mandatorily redeemable financial instruments was reflected as a cash outflow in our financing activities section in the Statements of Cash Flows.
Prior to the second quarter of 2005, we reclassified stock subject to redemption from equity to a liability at fair value once a member notified us in writing of an intent to redeem excess stock or to withdraw from membership, or the member no longer qualified for membership as a result of certain events such as a merger or acquisition, charter termination, or other event causing an involuntary termination. Although members generally have a right to rescind a redemption request, our Capital Plan provides for a rescission penalty calculated using our dividend rate and the length of time between the redemption request and the rescission request. As a result of this rescission penalty, each time we received a redemption request for any of the reasons above, we reclassified the shares as a liability. We believed that this method complied with SFAS 150.
In June 2005, we reviewed the materiality of the rescission penalty and concluded that, since we were then not paying dividends, the penalty would not be considered substantive. As a result, we concluded that, in the specific instance of a written redemption request of excess stock by a member, the reclassification of the stock to a liability as mandatorily redeemable capital stock was an error. Other written redemption requests relate to termination of membership, and we have concluded that the reclassification of the stock to a liability for these requests was correct. The cumulative adjustment resulted in a reclassification from mandatorily redeemable stock to equity of $65.1 million during the second quarter of 2005, but there was no effect on earnings for prior periods. During fourth quarter 2006, we resumed payment of dividends on outstanding Class B stock. Based on this change in circumstances, we assessed the materiality of the resulting penalty if members would rescind outstanding redemption requests. It was determined that the rescission penalty was not material enough to reclassify the stock to a liability account from equity. With the exception of written redemption requests relating to membership termination, none of the redemption requests were deemed to be mandatorily redeemable in 2006.
As of December 31, 2006 and 2005, we had classified $69.2 million and $66.3 million of outstanding Class B stock as mandatorily redeemable Class B stock in the liabilities section in our Statements of Condition. For the year ended December 31, 2006, we recorded an interest expense of $138,000 and for the year ended December 31, 2005, we recorded no interest expense as part of the carrying value of the mandatorily redeemable Class B stock. Although the mandatorily redeemable Class B stock is not included in capital for financial reporting purposes, such outstanding stock is considered capital for regulatory purposes. See Note 14 for additional information, including significant restrictions on stock redemption.
• Operating Leases • During the second quarter of 2005, we corrected our method of accounting for operating leases in compliance with SFAS No. 13,Accounting for Leases, or SFAS 13. Ordinarily, SFAS 13 allows cash payments to the lessor under an operating lease contract to be treated as expenses. However, when the lease contains an escalation clause affecting the minimum rents over the term of the lease, SFAS 13 requires the lessee to average the minimum payments over the term of the lease and report a level rent expense. Under our previous approach, we had inappropriately recorded as rent the actual lease payments. A review of our lease amendments after 2002 revealed that we had agreed to an escalating-rate structure. Averaging the lease payments over the 10-year term of the lease resulted in a difference between straight-line measurement of rent versus recognizing as rent the actual cash payments to the lessor. We recorded a cumulative adjustment of $447,000 to our operating expenses during the second quarter of 2005.
108
Federal Home Loan Bank of Seattle
Notes to Financial Statements—(Continued)
• Miscellaneous Adjustments •Other smaller accounting errors offset the change in the method of accounting for operating leases in operating expense. The net effect was a cumulative adjustment of $15,000 in the second quarter of 2005.
•Consolidated Obligation Hedging Relationships •During the second quarter of 2004, we changed the manner in which we assess effectiveness for certain highly effective consolidated obligation hedging relationships pursuant to our adoption of SFAS 133. Under our prior approach, we inappropriately assumed no ineffectiveness for these hedging transactions, since each consolidated obligation and its designated interest-rate exchange agreement had identical terms, with the exception that the interest-rate exchange agreement used in these relationships was structured with one settlement amount under the receive-side of the interest-rate exchange agreement that differed from all other receive-side settlements by an amount equivalent to the concession cost associated with the consolidated obligation. During 2004, we changed our method of accounting for these relationships to begin measuring effectiveness for such transactions during each reporting period. Changes in the fair value of the hedged consolidated obligations are recorded as an offset to the changes in fair value of the derivatives that hedge them.
We assessed the impact of this change on all prior annual periods since the adoption of SFAS 133 on January 1, 2001, and all prior quarterly periods for 2004 and 2003. We determined that had we applied this approach since January 1, 2001, it would not have had a material impact on the results of our operations or financial condition for any of these prior reporting periods. For the year ended December 31, 2004, we recorded an increase of $2.9 million to net income before assessments, reflecting the accounting as if we had employed the new approach since the date of adoption of SFAS 133 through March 31, 2004. Of this amount, $1.7 million related to prior periods. In addition, as part of the accounting adjustment, we reclassified $3.0 million of deferred interest-rate swap agreement fees from interest expense to “net gain (loss) on derivatives and hedging activities” in the Statement of Income. The reclassification relates to fees recognized on terminated interest-rate exchange agreements hedging consolidated obligations that had been repaid. In June 2005, we determined that the method we had used since 2004 for valuing the hedged consolidated obligations was in error. Accordingly, we reassessed the bond valuation using an appropriate method. As a result, in the second quarter of 2005, we recorded an additional loss of $1.7 million relating to the second quarter and prior periods.
• Premium and Discount Amortization Related to Mortgage-Based Assets • During the fourth quarter of 2004, as part of our efforts to convert to our current investment accounting system for our mortgage-based assets, we determined that our then current methodology for calculating our premium amortization and discount accretion, which relied on sampling of our mortgage-based assets, was less comprehensive than the methodology employed by the new system, which evaluates the entire portfolio of mortgage-based assets. The cumulative difference in premium amortization and discount accretion using the new system’s methodology was a loss of $3.8 million to net income before assessments, of which $2.8 million was included in interest income from mortgage loans held for portfolio and $1.0 million was included in interest income from held-to-maturity securities. The difference related to the correction of calculations performed during 2003 and 2004. The cumulative difference relating to periods prior to January 1, 2004, was $2.2 million. We deemed this difference an accounting error. Based on our analysis of both the quantitative impact on the prior affected periods and other relevant qualitative criteria, we determined that the impact of this accounting error on these prior periods is immaterial. Accordingly, we recorded the cumulative difference in December 2004.
Change in Accounting Principles
• Trade-Date Accounting • During the second quarter of 2005, we began recording the changes in fair value of both derivatives and the related hedged items on their trade dates. Pursuant to this change, hedge accounting commences on the trade date, and subsequent changes in the derivative’s fair value are recorded
109
Federal Home Loan Bank of Seattle
Notes to Financial Statements—(Continued)
along with the offsetting changes in fair value of the hedged item even though the hedged item has not yet settled and has not yet been recognized. On the settlement date, the adjustments attributed to the hedged item become part of its total carrying amount. Previously, we recorded the changes in fair value of both derivatives and the hedged items on their settlement dates. We have evaluated the effect of the differences between the two methods on prior periods and have determined that the effect of the differences is immaterial.
• Defined-Benefit Pension Plans •During the fourth quarter of 2006, we implemented SFAS No. 158,Employers’ Accounting for Defined-benefit Pension and Other Postretirement Plans,amendments of SFAS No. 87, Employers’ Accounting for Pensions,SFAS No. 88, Employers’ Accounting for Settlements and Curtailments of Defined-benefit Pension Plans and for Termination Benefits,SFAS No. 106, Employers’ Accounting for Postretirement Benefits Other Than Pensions, and SFAS No. 132 (revised 2003), Employers’ Disclosures about Pensions and Other Postretirement Benefit,or SFAS 158. SFAS 158 requires employers to recognize the unfunded status of defined-benefit pension plans in the Statement of Condition measured as the difference between the fair value of plan assets and projected benefit obligations. In addition, SFAS 158 requires that we recognize against other comprehensive income prior service cost and gain or loss that were not recognized as components of net periodic benefit cost pursuant to FASB 87,Employers’ Accounting for PensionsImplementation of SFAS 158 on the non-qualified supplemental defined-benefit pension plan resulted in the recognition of a liability of $2.1 million with an offsetting amount in accumulated other comprehensive loss.
Recently Issued Accounting Standards and Interpretations
• SFAS 155 •On February 16, 2006, the FASB issued SFAS No. 155,Accounting for Certain Hybrid Financial Instruments, an amendment of FASB Statements No. 133 and 14,or SFAS 155,which resolves issues addressed in Statement 133 Implementation Issue No. D1,Application of Statement 133 to Beneficial Interests in Securitized Financial Assets,or DIG Issue D1. SFAS 155 amends SFAS 133 to simplify the accounting for certain derivatives embedded in other financial instruments (a hybrid financial instrument) by permitting fair value remeasurement for any hybrid financial instrument that contains an embedded derivative that otherwise required bifurcation, provided that the entire hybrid financial instrument is accounted for on a fair value basis. SFAS 155 also establishes the requirement to evaluate interests in securitized financial assets to identify interests that are freestanding derivatives or that are hybrid financial instruments that contain an embedded derivative requiring bifurcation, which replaces the interim guidance in DIG Issue D1. SFAS 155 amends SFAS 140,Accounting for Transfers and Servicing of Financial Assets and Extinguishment of Liabilities, a replacement of FASB Statement 125,or SFAS 140, to allow a qualifying special-purpose entity to hold a derivative financial instrument that pertains to beneficial interests other than another derivative financial instrument. SFAS 155 is effective for all financial instruments acquired or issued after the beginning of the first fiscal year that begins after September 15, 2006 (January 1, 2007 for the Seattle Bank), with earlier adoption allowed. We do no expect that the implementation of SFAS 155 will have a material impact on our results of operations or financial condition.
•SAB 108 •On September 13, 2006, the SEC issued SEC Staff Accounting Bulletin No. 108,Considering the Effects of Prior Year Misstatements when Quantifying Misstatements in Current Year Financial Statements,or SAB 108. Traditionally, there have been two widely-recognized methods for quantifying the effects of financial statement restatements: the “roll-over” method and the “iron curtain” method. The roll-over method focuses primarily on the impact of a misstatement on the income statement, which includes the reversing effect of prior year misstatements. The sole use of the roll-over method can lead to the accumulation of misstatements in the balance sheet. The iron curtain method focuses primarily on the effect of correcting the period-end balance sheet with less emphasis on reversing effects of prior year errors on the income statement.
In SAB 108, the SEC staff established an approach that requires quantification of financial statement misstatements based on the misstatements of each of the FHLBanks’ financial statements and related financial
110
Federal Home Loan Bank of Seattle
Notes to Financial Statements—(Continued)
statement disclosures. This model is commonly referred to as a “dual approach” because it requires quantification of errors under both the iron curtain and the roll-over methods.
SAB 108 permits the Seattle Bank to initially apply its provisions by (i) restating prior financial statements as if the dual approach had always been used or (ii) recording the cumulative effect of initially applying the dual approach as adjustments to the carrying values of assets and liabilities as of January 1, 2006, with an offsetting adjustment recorded to the opening balance of retained earnings. It should be noted that misstatements solely related to the 2006 calendar year would not be included in the transition cumulative adjustment. Use of the “cumulative effect” transition method requires a detailed disclosure of the nature and amount of each individual error (regardless of materiality) being corrected through the cumulative adjustment and how and when it arose.
We initially applied the provision of SAB 108 in connection with the preparation of the annual financial statements for the year ended December 31, 2006. SAB 108 did not have a material impact on our results of operation or financial condition as of January 1, 2006, and accordingly, no restatement in prior period or recording of cumulative effect adjustment was required. Furthermore, SAB 108 did not have a material impact on our results of operation or financial condition for the year ended December 31, 2006.
• SFAS 157 •On September 18, 2006, the FASB issued SFAS No. 157,Fair Value Measurements, or SFAS 157. In defining fair value, SFAS 157 retains the exchange price notion in earlier definitions of fair value. However, the definition focuses on the price that would be received to sell an asset or paid to transfer a liability (an exit price), not the price that would be paid to acquire the asset or received to assume the liability (an entry price). SFAS 157 applies whenever other accounting pronouncements require or permit fair value measurements. Accordingly, SFAS 157 does not expand the use of fair value in any new circumstances. SFAS 157 also establishes a fair value hierarchy that prioritizes the information used to develop assumptions used to determine the exit price. Under the standard, fair value measurements would be separately disclosed by level within the fair value hierarchy. SFAS 157 is effective for financial statements issued for fiscal years beginning after November 15, 2007 (January 1, 2008, for the Seattle Bank), and interim periods within those fiscal years, with early adoption permitted provided the entity has not yet issued financial statements for that fiscal year, including financial statements for an interim period within that fiscal year. We have not yet determined the impact, if any, that the implementation of SFAS 157 will have on our results of operations or financial condition.
• SFAS 158 • On September 29, 2006, the FASB issued SFAS No. 158,Employers’ Accounting for Defined Benefit Pension and Other Postretirement Plans—an amendment of FASB Statements No. 87, 88, 106 and 132(R) or SFAS 158. SFAS 158 requires that an employer that is a business entity and sponsors one or more single-employer defined benefit plans to:
| | • | | Recognize the funded status of a benefit plan—measured as the difference between plan assets at fair value (with limited exceptions) and the benefit obligation—in its statement of financial position. For a pension plan, the benefit obligation is the projected benefit obligation; for any other postretirement benefit plan, such as a retiree health care plan, the benefit obligation is the accumulated postretirement benefit obligation. |
| | • | | Recognize as a component of other comprehensive income, net of tax, the gains or losses and prior service costs or credits that arise during the period but are not recognized as components of net periodic benefit cost pursuant to FASB Statement No. 87,Employers’ Accounting for Pensions,or No. 106,Employers’ Accounting for Postretirement Benefits Other Than Pensions. Amounts recognized in accumulated other comprehensive income, including the gains or losses, prior service costs or credits, and the transition asset or obligation remaining from the initial application of Statements 87 and 106, are adjusted as they are subsequently recognized as components of net periodic benefit cost pursuant to the recognition provisions of those Statements. |
111
Federal Home Loan Bank of Seattle
Notes to Financial Statements—(Continued)
| | • | | Measure defined benefit plan assets and obligations as of the date of the employer’s fiscal year-end statement of financial position (with limited exceptions). |
| | • | | Disclose in the notes to the financial statements additional information about certain effects on net periodic benefit cost for the next fiscal year that arise from delayed recognition of the gains or losses, prior service costs or credits, and transition asset or obligation. |
We adopted SFAS 158 as of December 31, 2006. At the time of adoption, $2.1 million was recorded in other liability with an offsetting amount recognized in accumulated other comprehensive loss.
• DIG Issue G26 •On December 13, 2006, the FASB issued DIG No. G26,Hedging Interest Cash Flows on Variable-Rate Assets and Liabilities That Are Not Based on a Benchmark Interest Rateor DIG Issue G26. DIG Issue G26 clarifies when the hedge of a designated risk related to variable–rate financial assets or liabilities qualifies as a cash flow hedge. DIG Issue G26 becomes effective with the first fiscal quarter beginning after January 8, 2007 (April 1, 2007 for the Seattle Bank). We do not expect DIG Issue G26 to have a material impact on our results of operations or financial condition.
• DIG Issue B40 •On December 20, 2006, the FASB issued Derivatives Implementation Group (“DIG”) No. B40,Application of Paragraph 13(b) to Securitized Interest in Prepayable Financial Assets or DIG Issue B40. DIG Issue B40 clarifies when a securitized interest in prepayable financial assets is subject to the conditions in paragraph 13(b) of SFAS 133. DIG Issue B40 becomes effective upon initial adoption of SFAS 155 (January 1, 2007 for the Seattle Bank). We do not expect DIG Issue B40 to have a material impact on our results of operations or financial condition.
• EITF 06-6 • On November 29, 2006, the Emerging Issues Task Force ratified its draft abstract,06-06—Debtor’s Accounting for a Modification (or Exchange) of Convertible Debt Instrument or EITF 06-06. This issue addresses how the modification of a debt instrument affecting the terms of an embedded conversion option should be considered in the issuer’s analysis of whether debt extinguishment accounting should be applied. The issue also addresses how the accounting for a modification of a debt instrument affecting the terms of an embedded option when extinguishment accounting is not applied. This issue is effective for interim or annual reporting periods beginning after November 29, 2006 (January 1, 2007, for the Seattle Bank), and is not expected to have a material impact on our results of operations or financial condition.
• EITF 06-07 • On November 29, 2006, the Emerging Issues Task Force ratified its draft abstract,06-07—Issuer’s Accounting for a Previously Bifurcated Conversion Option in a Convertible Debt Instrument When the Conversion Option No Longer Meets the Bifurcation Criteria in FAS 133, Accounting for Derivative Instruments and Hedging Activities or EITF 06-07.This issue addresses the accounting of a previously bifurcated conversion option in a convertible debt instrument if that conversion option no longer meets the bifurcation criteria in SFAS 133. EITF 06-07 also addresses the disclosure when an embedded option previously accounted for as a derivative under SFAS 133 no longer meets the separation criteria of SFAS 133. This issue is effective in interim or annual reporting periods beginning after December 15, 2006 (January 1, 2007, for the Seattle Bank), and is not expected to have a material impact on our results of operations or financial condition.
• SFAS 159 •In February 2007 the FASB issued SFAS No. 159, “The Fair Value Option for Financial Assets and Financial Liabilities—Including an amendment of FASB Statement No. 115,”or SFAS 159, which permits us to choose to measure many financial instruments and certain other items at fair value. The fair value option may be applied, with a few exceptions, on an instrument by instrument basis. The election is irrevocable unless a new election date occurs and the election must be applied to entire financial instrument and not to only the specified risks, specified cash flows, or portions of that financial instrument. Certain financial instruments, such as deposit liabilities, are not eligible for the fair value option. The difference between the carrying amount
112
Federal Home Loan Bank of Seattle
Notes to Financial Statements—(Continued)
and the fair value of eligible items for which the fair value option is elected at the effective date will be removed from the statement of condition and included in the cumulative effect adjustment. Those differences may include, but are not limited to, (a) unamortized concession fees, premiums, and discounts; (b) allowance for loan losses; and (c) accrued interest, which would be reported as part of the fair value of the eligible item. Additionally, available-for-sale and held-to-maturity securities held at the effective date are eligible for the fair value option at that date. If the fair value option is elected for any of those securities at the effective date, cumulative unrealized gains and losses at that date should be in included in the cumulative-effect adjustment. Upfront costs and fees related to items for which the fair value option is elected will be recognized into operating results as incurred rather than deferred and amortized. SFAS 159 is effective for financial statements issued after November 15, 2007, and interim periods within those fiscal years. Earlier adoption is permitted provided we also elect to apply the provisions of SFAS 157. We expect to adopt SFAS 159 on January 1, 2008 consistent with our adoption of SFAS 157. We have not yet determined the impact, if any, that the implementation of SFAS 159 will have on our results of operations or financial condition.
Note 3—Cash and Due From Banks
• Compensating Balances • We maintain collected cash balances with commercial banks in return for certain services. These agreements contain no legal restrictions on the withdrawal of funds. The minimum compensating balances for the years ended December 31, 2006 and 2005, were $100,000 and $126,000.
In addition, we maintained with various Federal Reserve Banks and branches average minimum required clearing balances of $1.0 million and $4.0 million for the years ended December 31, 2006 and 2005. These are required clearing balances and may not be withdrawn; however, we may use earnings credits on these balances to pay for services received from the Federal Reserve Banks.
Note 4—Restricted Cash
We are, under the terms of our agreements with derivatives counterparties, required to pledge cash collateral when the credit exposure we represent to the counterparty exceeds agreed upon thresholds. Cash is released from the account to us in the event that derivatives have fair value changes in our favor or we extinguish derivative liabilities. As of December 31, 2006, we had no deposits in cash in a restricted interest-bearing account with the counterparty, however, as of December 31, 2005, we had deposits of $15.4 million in cash in a restricted account.
Note 5—Securities Purchased Under Agreements to Resell
We periodically hold securities purchased under agreements to resell the securities. These amounts are short-term loans and are reported as assets in the Statements of Condition. Our securities safekeeping agent holds the securities purchased under agreements to resell in the name of the Seattle Bank. Should the market value of the underlying securities decrease below the collateral market value requirement, the counterparty has the option to remit to us an equivalent amount of cash or pledge additional securities with our safekeeping agent. As of December 31, 2006, we held no securities purchased under agreements to resell. As of December 31, 2005, we held $850.0 million in securities purchased under agreements to resell with collateral at a fair value of $1.0 billion, which represented 122.0% of the amount receivable under the agreements.
113
Federal Home Loan Bank of Seattle
Notes to Financial Statements—(Continued)
Note 6—Held-to-Maturity Securities
• Major Security Types •The following tables summarize our held-to-maturity securities as of December 31, 2006 and 2005.
| | | | | | | | | | | | | |
As of December 31, 2006 | | Amortized Cost* | | Gross
Unrealized
Gains | | Gross
Unrealized
Loss | | | Estimated Fair Value |
| (dollars in thousands) | | | |
Non-Mortgage-Backed Securities | | | | | | | | | | | | | |
Other U.S. obligations | | $ | 146,298 | | $ | 3,073 | | $ | | | | $ | 149,371 |
Government-sponsored enterprises | | | 2,691,238 | | | 21,697 | | | (33,725 | ) | | | 2,679,210 |
Other FHLBanks’ consolidated obligation bonds | | | 4,224,959 | | | | | | (73,113 | ) | | | 4,151,846 |
State or local housing agency obligations | | | 12,067 | | | 77 | | | | | | | 12,144 |
| | | | | | | | | | | | | |
Subtotal | | | 7,074,562 | | | 24,847 | | | (106,838 | ) | | | 6,992,571 |
| | | | | | | | | | | | | |
Mortgage-Backed Securities | | | | | | | | | | | | | |
Government-sponsored enterprises | | | 1,779,877 | | | 689 | | | (71,052 | ) | | | 1,709,514 |
Other U.S. obligations | | | 6,963 | | | 102 | | | | | | | 7,065 |
Other | | | 4,826,507 | | | 2,637 | | | (64,173 | ) | | | 4,764,971 |
| | | | | | | | | | | | | |
Subtotal | | | 6,613,347 | | | 3,428 | | | (135,225 | ) | | | 6,481,550 |
| | | | | | | | | | | | | |
Total | | $ | 13,687,909 | | $ | 28,275 | | $ | (242,063 | ) | | $ | 13,474,121 |
| | | | | | | | | | | | | |
| | | | |
As of December 31, 2005 | | Amortized Cost* | | Gross
Unrealized
Gains | | Gross
Unrealized
Loss | | | Estimated
Fair Value |
| (dollars in thousands) | | | |
Non-Mortgage-Backed Securities | | | | | | | | | | | | | |
Commercial Paper | | $ | 194,106 | | $ | 324 | | $ | (324 | ) | | $ | 194,106 |
Other U.S. agency obligations | | | 221,671 | | | 4,932 | | | (1 | ) | | | 226,602 |
Government-sponsored enterprises | | | 2,698,649 | | | 28,764 | | | (63,685 | ) | | | 2,663,728 |
Other FHLBanks’ consolidated obligation bonds | | | 5,274,944 | | | | | | (114,617 | ) | | | 5,160,327 |
State or local housing agency obligations | | | 16,900 | | | 218 | | | | | | | 17,118 |
| | | | | | | | | | | | | |
Subtotal | | | 8,406,270 | | | 34,238 | | | (178,627 | ) | | | 8,261,881 |
| | | | | | | | | | | | | |
Mortgage-Backed Securities | | | | | | | | | | | | | |
Government-sponsored enterprises | | | 2,141,284 | | | 1,584 | | | (79,759 | ) | | | 2,063,109 |
Other | | | 4,330,040 | | | 646 | | | (70,977 | ) | | | 4,259,709 |
| | | | | | | | | | | | | |
Subtotal | | | 6,471,324 | | | 2,230 | | | (150,736 | ) | | | 6,322,818 |
| | | | | | | | | | | | | |
Total | | $ | 14,877,594 | | $ | 36,468 | | $ | (329,363 | ) | | $ | 14,584,699 |
| | | | | | | | | | | | | |
| * | The amortized cost of our mortgage-backed securities classified as held-to-maturity includes net discounts of $35.7 million and $40.9 million as of December 31, 2006 and 2005. |
We generally execute interest-rate exchange agreements with major broker-dealers under bilateral collateral agreements. As of December 31, 2006, we did not have any securities pledged as collateral to broker-dealers which they cannot sell or repledge.
As of December 31, 2006 and 2005, we held $366.8 million and $514.0 million of held-to-maturity securities purchased from members or affiliates of members who own more than 10.0% of our total outstanding Class B stock, or members with representatives serving on our Board, and mandatorily redeemable Class B stock. See Note 19 for additional information.
114
Federal Home Loan Bank of Seattle
Notes to Financial Statements—(Continued)
• Other U.S. Obligations and Government-Sponsored Enterprises• Our investments in other U.S. obligations consist primarily of debt securities and mortgage-backed securities of the Government National Mortgage Agency, or Ginnie Mae, or other government agencies whose debt is guaranteed, either directly or indirectly, by the U.S. government. The U.S. government does not guarantee debt securities and mortgage-backed securities issued by certain GSEs, such as Federal National Mortgage Association, or Fannie Mae, and Federal Home Loan Mortgage Corporation, or Freddie Mac, either directly or indirectly.
• Other Federal Home Loan Bank Consolidated Obligation Bonds • The following table details our other FHLBanks’ consolidated obligation bonds by primary obligor as of December 31, 2006 and 2005.
| | | | | | | | | | | | |
| | | As of December 31, 2006 | | As of December 31, 2005 |
Other FHLBank’s Consolidated Obligation Bonds | | Amortized Costs | | Estimated
Fair Value | | Amortized
Costs | | Estimated
Fair Value |
| (dollars in thousands) |
FHLBank Atlanta | | $ | | | $ | | | $ | 500,000 | | $ | 492,969 |
FHLBank Boston | | | 450,000 | | | 449,419 | | | 500,000 | | | 492,500 |
FHLBank Des Moines | | | 1,879,959 | | | 1,830,756 | | | 2,129,944 | | | 2,075,206 |
FHLBank San Francisco | | | 1,895,000 | | | 1,871,671 | | | 2,145,000 | | | 2,099,652 |
| | | | | | | | | | | | |
Total | | $ | 4,224,959 | | $ | 4,151,846 | | $ | 5,274,944 | | $ | 5,160,327 |
| | | | | | | | | | | | |
• Temporary Impairment •The following tables summarize our held-to-maturity securities with gross unrealized losses, aggregated by major security type and length of time that individual securities have been in a continuous unrealized loss position as of December 31, 2006 and 2005.
| | | | | | | | | | | | | | | | | | | | | |
| | | Less than 12 months | | | 12 months or more | | | Total | |
As of December 31, 2006 | | Estimated
Fair Value | | Gross
Unrealized
Losses | | | Estimated
Fair Value | | Gross
Unrealized
Losses | | | Estimated
Fair Value | | Gross
Unrealized
Losses | |
| (dollars in thousands) | |
Non-Mortgage-Backed Securities | | | | | | | | | | | | | | | | | | | | | |
Government-sponsored enterprises | | $ | | | $ | | | | $ | 2,269,882 | | $ | (33,725 | ) | | $ | 2,269,882 | | $ | (33,725 | ) |
Other FHLBanks’ consolidated obligation bonds | | | | | | | | | | 4,151,846 | | | (73,113 | ) | | | 4,151,846 | | | (73,113 | ) |
| | | | | | | | | | | | | | | | | | | | | |
Subtotal | | | | | | | | | | 6,421,728 | | | (106,838 | ) | | | 6,421,728 | | | (106,838 | ) |
| | | | | | | | | | | | | | | | | | | | | |
Mortgage-Backed Securities | | | | | | | | | | | | | | | | | | | | | |
Government-sponsored enterprises | | | | | | | | | | 1,601,347 | | | (71,052 | ) | | | 1,601,347 | | | (71,052 | ) |
Other | | | 318,767 | | | (3,454 | ) | | | 2,432,972 | | | (60,719 | ) | | | 2,751,739 | | | (64,173 | ) |
| | | | | | | | | | | | | | | | | | | | | |
Subtotal | | | 318,767 | | | (3,454 | ) | | | 4,034,319 | | | (131,771 | ) | | | 4,353,086 | | | (135,225 | ) |
| | | | | | | | | | | | | | | | | | | | | |
Total | | $ | 318,767 | | $ | (3,454 | ) | | $ | 10,456,047 | | $ | (238,609 | ) | | $ | 10,774,814 | | $ | (242,063 | ) |
| | | | | | | | | | | | | | | | | | | | | |
115
Federal Home Loan Bank of Seattle
Notes to Financial Statements—(Continued)
| | | | | | | | | | | | | | | | | | | | | |
| | | Less than 12 months | | | 12 months or more | | | Total | |
As of December 31, 2005 | | Estimated
Fair Value | | Gross
Unrealized
Losses | | | Estimated
Fair Value | | Gross
Unrealized
Losses | | | Estimated
Fair Value | | Gross
Unrealized
Losses | |
| (dollars in thousands) | | | |
Non-Mortgage-Backed Securities | | | | | | | | | | | | | | | | | | | | | |
Commercial Paper | | $ | 99,542 | | $ | (324 | ) | | $ | | | $ | | | | $ | 99,542 | | $ | (324 | ) |
Other U.S. agency obligations | | | 10,734 | | | (1 | ) | | | | | | | | | | 10,734 | | | (1 | ) |
Government-sponsored enterprises | | | 493,055 | | | (6,945 | ) | | | 1,754,354 | | | (56,740 | ) | | | 2,247,409 | | | (63,685 | ) |
Other FHLBanks’ consolidated obligation bonds | | | 1,961,827 | | | (38,173 | ) | | | 3,198,500 | | | (76,444 | ) | | | 5,160,327 | | | (114,617 | ) |
| | | | | | | | | | | | | | | | | | | | | |
Subtotal | | | 2,565,158 | | | (45,443 | ) | | | 4,952,854 | | | (133,184 | ) | | | 7,518,012 | | | (178,627 | ) |
| | | | | | | | | | | | | | | | | | | | | |
Mortgage-Backed Securities | | | | | | | | | | | | | | | | | | | | | |
Government-sponsored enterprises | | | 648,813 | | | (15,105 | ) | | | 1,315,936 | | | (64,654 | ) | | | 1,964,749 | | | (79,759 | ) |
Other | | | 1,734,418 | | | (18,739 | ) | | | 1,677,707 | | | (52,238 | ) | | | 3,412,125 | | | (70,977 | ) |
| | | | | | | | | | | | | | | | | | | | | |
Subtotal | | | 2,383,231 | | | (33,844 | ) | | | 2,993,643 | | | (116,892 | ) | | | 5,376,874 | | | (150,736 | ) |
| | | | | | | | | | | | | | | | | | | | | |
Total | | $ | 4,948,389 | | $ | (79,287 | ) | | $ | 7,946,497 | | $ | (250,076 | ) | | $ | 12,894,886 | | $ | (329,363 | ) |
| | | | | | | | | | | | | | | | | | | | | |
The gross unrealized losses on our held-to-maturity portfolio as of December 31, 2006 were related to declining market values as a result of overall increases in market interest rates and not to underlying credit concerns relating to issuers. As of December 31, 2006, 149 of our investment positions had gross unrealized losses totaling $242.1 million, with the total estimated fair value of these positions being approximately 97.8% of their carrying value. Of these 149 positions, 139 positions had gross unrealized losses for at least 12 months or more.
The gross unrealized losses on our held-to-maturity portfolio as of December 31, 2005 were related to declining market values as a result of overall increases in market interest rates and not to underlying credit concerns relating to issuers. As of December 31, 2005, 159 of our investment positions had gross unrealized losses totaling $329.4 million, with the total estimated fair value of these positions being approximately 97.5% of their carrying value. Of these 159 positions, 93 positions had gross unrealized losses for at least 12 months or more.
We reviewed our investment security holdings as of December 31, 2006 and 2005, and have determined that all unrealized losses reflected above were temporary, based in part on the creditworthiness of the issuers and the underlying collateral. Furthermore, we have both the ability and the intent to hold such securities until we recover all contractual principal and interest payments.
116
Federal Home Loan Bank of Seattle
Notes to Financial Statements—(Continued)
• Redemption Terms • The amortized cost and estimated fair value of held-to-maturity securities by contractual maturity as of December 31, 2006 and 2005 are shown below. Expected maturities of some securities and mortgage-backed securities will differ from contractual maturities because borrowers may have the right to call or prepay obligations with or without call or prepayment fees.
| | | | | | | | | | | | |
| | | As of December 31, 2006 | | As of December 31, 2005 |
Term to Maturity | | Amortized Cost | | Estimated
Fair Value | | Amortized Cost | | Estimated
Fair Value |
| (dollars in thousands) | | |
Non-Mortgage-Backed Securities, excluding Other FHLBanks’ Consolidated Obligation Bonds | | | | | | | | | | | | |
Due in one year or less | | $ | 1,817,899 | | $ | 1,805,823 | | $ | 217,024 | | $ | 217,025 |
Due after one year through five years | | | 576,466 | | | 557,000 | | | 2,342,944 | | | 2,280,089 |
Due after five years through 10 years | | | 388,332 | | | 410,035 | | | 486,095 | | | 518,334 |
Due after 10 years | | | 66,906 | | | 67,867 | | | 85,263 | | | 86,106 |
| | | | | | | | | | | | |
Subtotal | | | 2,849,603 | | | 2,840,725 | | | 3,131,326 | | | 3,101,554 |
| | | | | | | | | | | | |
Other FHLBanks’ Consolidated Obligation Bonds | | | | | | | | | | | | |
Due in one year or less | | | 1,700,000 | | | 1,691,215 | | | 1,000,000 | | | 985,157 |
Due after one year through five years | | | 2,524,959 | | | 2,460,631 | | | 4,274,944 | | | 4,175,170 |
| | | | | | | | | | | | |
Subtotal | | | 4,224,959 | | | 4,151,846 | | | 5,274,944 | | | 5,160,327 |
| | | | | | | | | | | | |
Mortgage-Backed Securities | | | | | | | | | | | | |
Due after one year through five years | | | 2,120 | | | 2,161 | | | 95 | | | 102 |
Due after five years through 10 years | | | 29,267 | | | 28,927 | | | 35,026 | | | 34,704 |
Due after 10 years | | | 6,581,960 | | | 6,450,462 | | | 6,436,203 | | | 6,288,012 |
| | | | | | | | | | | | |
Subtotal | | | 6,613,347 | | | 6,481,550 | | | 6,471,324 | | | 6,322,818 |
| | | | | | | | | | | | |
Total | | $ | 13,687,909 | | $ | 13,474,121 | | $ | 14,877,594 | | $ | 14,584,699 |
| | | | | | | | | | | | |
117
Federal Home Loan Bank of Seattle
Notes to Financial Statements—(Continued)
•Interest Rate Payment Terms • The following table details interest rate payment terms for the amortized cost of investment securities classified as held-to-maturity as of December 31, 2006 and 2005.
| | | | | | |
Interest-Rate Payment Terms | | As of
December 31,
2006 | | As of
December 31,
2005 |
| (dollars in thousands) |
Amortized Cost of Held-To-Maturity Securities: | | | | | | |
| | |
Investments, excluding Other FHLBanks’ Consolidated Obligation Bonds and Mortgage-Backed Securities | | | | | | |
Fixed-Rate | | $ | 2,771,983 | | $ | 2,821,150 |
Variable-Rate | | | 77,620 | | | 310,176 |
| | | | | | |
Subtotal | | | 2,849,603 | | | 3,131,326 |
| | | | | | |
Other FHLBanks’ Consolidated Obligation Bonds | | | | | | |
Fixed-rate | | | 4,224,959 | | | 5,274,944 |
| | | | | | |
Subtotal | | | 4,224,959 | | | 5,274,944 |
| | | | | | |
Mortgage-Backed Securities | | | | | | |
Pass-through securities | | | | | | |
Fixed-rate | | $ | 109,370 | | | 133,154 |
Variable-rate | | | 6,762 | | | 8,674 |
| | | | | | |
Subtotal | | | 116,132 | | | 141,828 |
Collateralized mortgage obligations | | | | | | |
Fixed-rate | | | 3,405,372 | | | 4,041,759 |
Variable-rate | | | 3,091,843 | | | 2,287,737 |
| | | | | | |
Subtotal | | | 6,497,215 | | | 6,329,496 |
| | | | | | |
Total | | $ | 13,687,909 | | $ | 14,877,594 |
| | | | | | |
•Losses on the Sale of Held-to-Maturity Securities • We recorded net realized losses of $6.5 million and $1.2 million on sales of held-to-maturity securities during the years ended December 31, 2006 and 2005. The proceeds received of $1.0 billion and $248.8 million on the sale of held-to-maturity securities in 2006 and 2005 were for securities that were within three months of maturity or had returned at least 85.0% of the principal outstanding from the date of acquisition.
118
Federal Home Loan Bank of Seattle
Notes to Financial Statements—(Continued)
Note 7—Advances
• Redemption Terms • We had advances outstanding, including AHP advances, at interest rates ranging from 1.78% to 8.62% as of December 31, 2006 and 1.60% to 8.62% as of December 31, 2005. Our interest rates on our AHP advances ranged from 2.80% to 5.99% as of December 31, 2006 and 2005.
The following table summarizes the amount and weighted average interest rate of our advances by term to maturity.
| | | | | | | | | | | | |
| | | As of December 31, 2006 | | As of December 31, 2005 |
Term to Maturity | | Amount | | | Weighted Average
Interest Rate % | | Amount | | | Weighted Average
Interest Rate % |
| (dollars in thousands, except interest rates) | | |
2006 | | $ | | | | | | $ | 11,259,608 | | | 4.21 |
2007 | | | 16,139,522 | | | 5.24 | | | 1,508,481 | | | 3.93 |
2008 | | | 6,425,043 | | | 5.21 | | | 3,868,399 | | | 4.40 |
2009 | | | 1,238,398 | | | 4.63 | | | 1,069,882 | | | 4.12 |
2010 | | | 902,522 | | | 5.09 | | | 889,719 | | | 4.93 |
2011 | | | 782,108 | | | 4.97 | | | 1,020,638 | | | 4.90 |
Thereafter | | | 2,499,226 | | | 4.62 | | | 1,838,070 | | | 4.42 |
| | | | | | | | | | | | |
Total par value | | $ | 27,986,819 | | | 5.14 | | $ | 21,454,797 | | | 4.30 |
Overdrawn demand deposit accounts | | | 2,361 | | | | | | 275 | | | |
Discount on advances | | | (6,708 | ) | | | | | (8,536 | ) | | |
Commitment fees | | | (1,020 | ) | | | | | (1,017 | ) | | |
Discount on AHP advances | | | (285 | ) | | | | | (352 | ) | | |
Derivatives hedging adjustments | | | (20,173 | ) | | | | | (9,675 | ) | | |
| | | | | | | | | | | | |
Total | | $ | 27,960,994 | | | | | $ | 21,435,492 | | | |
| | | | | | | | | | | | |
Generally, advances may only be prepaid by the member paying us a prepayment fee that makes us financially indifferent to the prepayment. Prepayment fees received in connection with the restructure of an existing advance are included in “discounts on advances.” We offer callable advances to members, which the member may prepay on certain call dates without incurring prepayment or termination fees. As of December 31, 2006 and 2005, we had no callable advances outstanding. We also make putable advances in which we have a right to terminate the advance at our discretion. We had putable advances outstanding of $3.2 billion and $3.3 billion as of December 31, 2006 and 2005.
In 2006, we began offering floating-to-fixed convertible advances, or FFC. With an FFC, the advance starts as a floating-rate advance and then, on a certain date, converts to a fixed-rate advance. We also have the option on specified dates to cancel the advance with the member. We had FFC balances of $140.0 million outstanding as of December 31, 2006.
119
Federal Home Loan Bank of Seattle
Notes to Financial Statements—(Continued)
The following table summarizes the par value of advances by year of maturity or next put date for putable advances.
| | | | | | |
Year of Maturity or Next Put Date | | 2006 | | 2005 |
| (dollars in thousands) | | |
2006 | | $ | | | $ | 13,657,450 |
2007 | | | 18,281,052 | | | 1,562,969 |
2008 | | | 6,170,343 | | | 3,579,699 |
2009 | | | 1,083,900 | | | 806,384 |
2010 | | | 729,522 | | | 426,719 |
2011 | | | 1,029,180 | | | 363,443 |
Thereafter | | | 692,822 | | | 1,058,133 |
| | | | | | |
Total par value | | $ | 27,986,819 | | $ | 21,454,797 |
| | | | | | |
• Security Terms • We lend to financial institutions involved in housing finance within our district according to federal statutes, including the FHLBank Act. The FHLBank Act requires us to obtain sufficient collateral on advances to protect against losses and to accept only certain U.S. government or government agency securities, residential mortgage loans, cash or member capital stock of or deposits in the Seattle Bank, and other eligible real estate-related assets as collateral on such advances. CFIs are subject to expanded statutory collateral provisions dealing with small business or agricultural loans. As of December 31, 2006 and 2005, we had rights to collateral with an estimated value greater than outstanding advances. Based on a risk analysis of each member, we may: (i) allow a member to retain possession of other than security collateral assigned to us, if the member executes a written security agreement and agrees to hold such collateral for our benefit; or (ii) require the member specifically assign or place physical possession of such collateral with us or our safekeeping agent.
Beyond these provisions, Section 10(e) of the FHLBank Act affords any security interest granted by a member to the Seattle Bank priority over the claims or rights of any other party. The exceptions are claims that would be entitled to priority under otherwise applicable law and are claims by bona fide purchasers for value or by parties that have perfected security interests.
•Credit Risk • We have policies and procedures in place to appropriately manage credit risks that include requirements for physical possession or control of pledged collateral, restrictions on borrowing, specific review of each advance request, verifications of collateral and continuous monitoring of borrowings. Accordingly, we have not provided any allowances for losses on advances.
In addition to collateral held under blanket pledge agreements, we physically held collateral with a fair value of $3.9 billion and $12.3 billion as of December 31, 2006 and 2005. We had additional collateral with a fair value of $20.2 billion and $6.0 billion specifically segregated and pledged to us by members as of December 31, 2006 and 2005. The increase in the specifically segregated and pledged collateral was primarily due to a collateral arrangement for one large member that requires physical possession of collateral that is specifically segregated and pledged to us. As of December 31, 2006 and 2005, we held $21.6 million and $22.3 million of advances to two borrowers that we classified as substandard. These advances are fully collateralized with high-grade, marketable securities and rights to proceeds from mortgage loan collections. Because the borrowers continue to pay according to contractual requirements and because of our collateral position, we continue to accrue interest on the advances.
120
Federal Home Loan Bank of Seattle
Notes to Financial Statements—(Continued)
•Concentration Risk • Our credit risk from advances is concentrated in commercial banks and savings institutions. As of December 31, 2006 and 2005, we had advances of $15.9 billion and $10.3 billion outstanding to two member institutions, Washington Mutual Bank, F.S.B. and Bank of America Oregon, N.A., representing 56.8% and 48.0% of total advances outstanding. The income from advances to these member institutions totaled $616.6 million and $333.5 million for the years ended December 31, 2006 and December 31, 2005. We held sufficient collateral to cover the advances to these institutions, and as a result, we do not expect to incur any credit losses on these advances. These same two members, Washington Mutual Bank, F.S.B. and Bank of American Oregon, N.A., held more than 10.0% of our total outstanding Class B stock, including mandatorily redeemable Class B stock, as of December 31, 2006 and December 31, 2005. See Note 19 for additional information. No other member institutions held advances in excess of 10.0% of our total advances outstanding as of December 31, 2006 and 2005.
• Interest-Rate Payment Terms •The following table summarizes the par value of advances by interest-rate payment terms.
| | | | | | |
Interest-Rate Payment Terms | | As of
December 31,
2006 | | As of
December 31,
2005 |
| (dollars in thousands) | | |
Fixed-rate | | $ | 15,663,821 | | $ | 16,751,372 |
Variable-rate | | | 12,182,998 | | | 4,703,425 |
Floating-to-fixed convertible | | | 140,000 | | | |
| | | | | | |
Total par value | | $ | 27,986,819 | | $ | 21,454,797 |
| | | | | | |
•Prepayment Fees • We record prepayment fees received from members on prepaid advances net of any associated SFAS 133 hedging fair-value adjustments on those advances.
The net amount of prepayment fees is reflected as interest income in our Statements of Income. Gross advance prepayment fees received from members were $495,000, $31.8 million and $8.0 million for the three years ended December 31, 2006, 2005, and 2004.
Note 8—Affordable Housing Program
Section 10(j) of the FHLBank Act requires each FHLBank to establish an AHP. Each FHLBank provides subsidies in the form of direct grants and below-market interest rate advances to members who use the funds to assist in the purchase, construction, or rehabilitation of housing for very low-, low-, and moderate-income households. Annually, the FHLBanks must set aside for the AHP the greater of $100.0 million or 10.0% of regulatory income. Regulatory income is defined as GAAP income before interest expense related to mandatorily redeemable Class B stock under SFAS 150 and the assessment for AHP, but after the assessment for REFCORP. The exclusion of interest expense related to mandatorily redeemable Class B stock is a regulatory calculation determined by the Finance Board. The AHP and REFCORP assessments are calculated simultaneously because of their interdependence on each other. The amount set aside for AHP is charged to expense monthly and recognized as a liability. The AHP liability is released as members use subsidies. Calculation of the REFCORP assessment is discussed in Note 9.
In the event an FHLBank experienced a regulatory loss during a quarter, but still had regulatory income for the year, its obligation to the AHP will be calculated based on its year-to-date regulatory income. If an FHLBank had regulatory income in subsequent quarters, it would be required to contribute additional amounts to meet its calculated annual obligation. If an FHLBank experienced a regulatory loss for a full year, it would have no
121
Federal Home Loan Bank of Seattle
Notes to Financial Statements—(Continued)
obligation to the AHP for the year except in the following circumstance. If the result of the aggregate 10.0% calculation described above is less than $100.0 million for all 12 FHLBanks, then the FHLBank Act requires that each FHLBank contribute such prorated sums as may be required to assure that the FHLBanks’ aggregate contributions equals $100.0 million. Our pro rata contribution would be made on the basis of each FHLBank’s income for the previous year.
There was no shortfall in AHP assessments for 2006, 2005, or 2004 within the FHLBanks. If an FHLBank should become financially unstable, such bank may apply to the Finance Board for a temporary suspension of its contribution requirements.
The following table summarizes our AHP activities for 2006 and 2005:
| | | | | | | | |
For the Years Ending December 31, | | 2006 | | | 2005 | |
| (dollars in thousands) | | | |
AHP liability as of January 1, | | $ | 31,235 | | | $ | 43,558 | |
Additions | | | 2,871 | | | | 1,989 | |
Distributions, net | | | (11,347 | ) | | | (14,312 | ) |
| | | | | | | | |
AHP liability as of December 31, | | $ | 22,759 | | | $ | 31,235 | |
| | | | | | | | |
In addition to AHP grants, we had outstanding principal in AHP-related advances of $2.9 million and $3.0 million as of December 31, 2006 and 2005.
We evaluated our exposure to losses on outstanding AHP projects and as of December 31, 2006, there were no AHP projects that were required to be written off. In 2005, we identified nine AHP projects with grants totaling $1.6 million that did not comply with AHP grant requirements. As a result, we refunded AHP for the previously disbursed grants.
Note 9—Resolution Funding Corporation (REFCORP)
Each FHLBank is required to pay 20.0% of income for REFCORP assessments, as calculated in accordance with GAAP after the assessment for AHP, but before the assessment for the REFCORP. The AHP and REFCORP assessments are calculated simultaneously because of their interdependence on each other. We accrue our REFCORP assessment on a monthly basis. The REFCORP has been designated as the calculation agent for AHP and REFCORP assessments. Each FHLBank provides its net income before AHP and REFCORP to the REFCORP which then performs the calculations for each quarter end. Calculation of the AHP assessment is discussed in Note 8.
The FHLBanks will continue to expense these amounts until the aggregate amounts actually paid by all 12 FHLBanks are equivalent to a $300.0 million annual annuity (or a scheduled payment of $75.0 million per quarter) with a final maturity date of April 15, 2030, at which point the required payment of each FHLBank to the REFCORP will be fully satisfied.The Finance Board, in consultation with the Secretary of the Treasury, selects the appropriate discounting factors to be used in this annuity calculation. The FHLBanks use the actual payments made to determine the amount of the future obligation that has been defeased. The cumulative amount to be paid to the REFCORP by each FHLBank is not determinable at this time because it depends on the future earnings of all FHLBanks and interest rates. If an FHLBank experiences a net loss during a quarter, but still has net income for the year, the FHLBank’s obligation to the REFCORP will be calculated based on the FHLBank’s year-to-date net income. The FHLBank is entitled to a refund of amounts paid for the full year that are in excess of its calculated annual obligation. If the FHLBank has net income in subsequent quarters, it is required to
122
Federal Home Loan Bank of Seattle
Notes to Financial Statements—(Continued)
contribute additional amounts to meet its calculated annual obligation. If the FHLBank experiences a net loss for a full year, the FHLBank has no obligation to the REFCORP for the year.
The Finance Board is required to extend the term of the FHLBank’s obligation to the REFCORP for each calendar quarter in which there is a deficit quarterly payment. A deficit quarterly payment is the amount by which the actual quarterly payment falls short of $75.0 million.
The FHLBanks’ aggregate payments through 2006 exceeded the scheduled payments, effectively accelerating payment of the REFCORP obligation and shortening its remaining term to the 3rd quarter of 2015. The FHLBanks’ aggregate payments through 2006 have satisfied $3.1 million of the $75.0 million scheduled payment for the 3rd quarter of 2015 and all scheduled payments thereafter. This date assumes that the FHLBanks will pay exactly $300.0 million annually after December 31, 2006 until the annuity is satisfied.
The benchmark payments or portions of them could be reinstated if the actual REFCORP payments of the FHLBanks fall short of $75.0 million in a quarter. The maturity date of the REFCORP obligation may be extended beyond April 15, 2030 if such extension is necessary to ensure that the value of the aggregate amounts the FHLBanks pay equates to a $300.0 million annual annuity. Any payment beyond April 15, 2030 will be paid to the Department of Treasury.
Note 10—Mortgage Loans Held for Portfolio
We historically purchased our mortgage loans held for portfolio directly from participating members through the MPP. The mortgage loans held for portfolio represent held-for-investment mortgage loans that our members originated, service, and support with credit enhancements. If the originating member was not required to service a mortgage loan under the purchase agreement, the servicing for the mortgage loan was transferred to a designated mortgage service provider at the time we purchased the mortgage loan. As of December 31, 2006 and 2005, 88.8% and 88.5% of our outstanding mortgage loans held for portfolio had been purchased from one participating member, Washington Mutual Bank, F.S.B. This member owned more than 10.0% of our total outstanding Class B stock and mandatorily redeemable Class B stock as of December 31, 2006 and 2005. For more information, see Note 19.
In accordance with our business plan, we are exiting from the MPP, which has lowered, and will continue to lower, our overall interest-rate risk profile and reduced our operating costs, including costs associated with managing risks related to our mortgage loans held for portfolio. In July 2005, we reclassified our entire $1.9 billion portfolio of government-insured mortgage loans as held for sale. In August 2005, we sold $1.4 billion of these loans to an affiliate of one of our members. We realized a gain of $7.1 million on the sale of the mortgage loans, which was partially offset by a valuation loss of $1.1 million that was recognized when we reclassified the unsold mortgage loans as held for portfolio. The valuation loss reduced the net premium associated with the government-insured mortgage loans held for portfolio.
123
Federal Home Loan Bank of Seattle
Notes to Financial Statements—(Continued)
The following table summarizes information on mortgage loans held for portfolio.
| | | | | | | | |
Mortgage Loans Held for Portfolio | | As of
December 31,
2006 | | | As of
December 31,
2005 | |
| (dollars in thousands) | | | |
Fixed, medium-term*, single-family mortgage loans | | $ | 1,041,407 | | | $ | 1,222,163 | |
Fixed, long-term, single-family mortgage loans | | | 5,295,225 | | | | 5,960,379 | |
| | | | | | | | |
Total loan principal | | | 6,336,632 | | | | 7,182,542 | |
Unamortized premiums | | | 73,110 | | | | 79,147 | |
Unamortized discounts | | | (43,094 | ) | | | (46,082 | ) |
| | | | | | | | |
Total | | $ | 6,366,648 | | | $ | 7,215,607 | |
| | | | | | | | |
| * | Medium-term is defined as a term of 15 years or less. |
The principal value of mortgage loans held for portfolio as of December 31, 2006 and December 31, 2005 was comprised of government-insured mortgage loans totaling $292.1 million and $383.4 million and conventional mortgage loans totaling $6.0 billion and $6.8 billion. See Note 17 for the estimated fair value of the mortgage loans held for portfolio as of December 31, 2006 and 2005.
In connection with the MPP, we required a member to fund an LRA, either up front as a portion of the purchase proceeds or over time through setting aside a portion of the monthly payment collected. The LRA amount funded by the member is the greater of the expected losses, based on an evaluation of the portfolio or a representative sample of the portfolio, or the minimum amount required by the SMI provider in order to provide SMI. The LRA funds are used to offset any losses that may occur, with excess funds distributed to the member in accordance with a step-down schedule that is stipulated in each master commitment contract. As of December 31, 2006 and 2005, we held amounts of $19.8 million and $16.5 million in our LRA. See Note 1 for additional information.
The following table summarizes the activities of the LRAs.
| | | | | | | | |
Lender Risk Account | | For the Year Ended
December 31,
2006 | | | For the Year Ended
December 31,
2005 | |
| (dollars in thousands) | | | |
Balance, as of January 1 | | $ | 16,548 | | | $ | 12,142 | |
Additions | | | 4,334 | | | | 5,160 | |
Distributions, net | | | (1,084 | ) | | | (754 | ) |
| | | | | | | | |
Balance, as of December 31 | | $ | 19,798 | | | $ | 16,548 | |
| | | | | | | | |
The total coverage of the combined LRA and SMI does not change over the life of mortgage loans delivered under a master commitment contract. Under the credit enhancement structure of the MPP, the value of the foreclosed property would have to fall below 50% of the outstanding mortgage loan amount to result in a loss to us. In addition, we perform quality control reviews on all individual conventional mortgage loans that become 90 days delinquent, and we, as well as the SMI provider, help the member resolve the delinquency. Because of the credit enhancements in the program, we continue to accrue interest on mortgage loans that are 90 days or more past due.
124
Federal Home Loan Bank of Seattle
Notes to Financial Statements—(Continued)
The following table summarizes data on mortgage loan delinquencies.
| | | | | | | | |
Mortgage Loan Delinquencies | | As of
December 31, 2006 | | | As of
December 31,
2005 | |
| (in thousands, except percentage data) | | | |
30—59 days | | $ | 74,214 | | | $ | 92,940 | |
60—89 days | | | 21,735 | | | | 31,419 | |
90 days or more | | | 42,751 | | | | 67,492 | |
| | | | | | | | |
Total delinquencies | | $ | 138,700 | | | $ | 191,851 | |
| | | | | | | | |
Loans past due 90 days or more and still accruing interest | | $ | 42,751 | | | $ | 67,492 | |
Delinquencies as a percent of total principal balance mortgage loans outstanding | | | 2.19 | % | | | 2.67 | % |
As of December 31, 2006, we had $42.8 million of mortgage loans delinquent 90 days or more, compared to $67.5 million as of December 31, 2005, and we had no mortgage loans on non-accrual status as of either of such dates because of the credit enhancements available to us. Mortgage loans are considered impaired when, based on current information and events, it is probable that we will be unable to collect all principal and interest amounts due according to the contractual terms of the mortgage loan agreement. As of December 31, 2006 and 2005, we had no investments in impaired mortgage loans. Based on our analysis of the mortgage loan portfolio, we have determined that the credit enhancement provided by the members, including the LRA and SMI, is sufficient to absorb inherent credit losses and that an allowance for credit loss is unnecessary.
As of December 31, 2006, we had 11 mortgage loans totaling $1.8 million in foreclosure. As of December 31, 2006, our other assets included $147,000 of real estate owned resulting from foreclosure of one mortgage loan that we held. The real estate, which is carried at the lower of market value, less estimated selling costs, or carrying value, is currently being evaluated for disposal. As of December 31, 2005, we did not own any real estate properties.
We have never experienced a credit loss, nor has our SMI carrier ever experienced a loss claim on a mortgage loan purchased under the MPP. In certain instances, we require our members to repurchase mortgage loans. These instances include failure of a member to comply with MPP requirements, breach of representation and warranties made by a member, non-compliance with final documentation, and servicing errors.
The following table summarizes the number and par value of mortgage loans repurchased by our members.
| | | | | | |
Mortgage Loan Repurchases | | For the Year Ended
December 31,
2006 | | For the Year Ended
December 31,
2005 |
| (dollars in thousands) | | |
Number of mortgage loans repurchased | | | 72 | | | 422 |
Par value of mortgage loans repurchased | | $ | 10,671 | | $ | 62,180 |
Note 11—Deposits
We offer demand and overnight deposits for members and qualifying non-members. In addition, we offer short-term deposit programs to members.
Deposits classified as demand and overnight and other, pay interest based on a daily interest rate. Term deposits pay interest based on a fixed rate determined at the issuance of the deposit. The average interest rates paid on average deposits during 2006, 2005 and 2004 were 4.89%, 3.17%, and 1.26%.
125
Federal Home Loan Bank of Seattle
Notes to Financial Statements—(Continued)
The following table details interest bearing and non-interest bearing deposits as of December 31, 2006 and 2005.
| | | | | | |
Interest-Bearing and Non-Interest Bearing Deposits | | As of
December 31,
2006 | | As of
December 31,
2005 |
| (dollars in thousands) | | |
Interest bearing | | | | | | |
Demand and overnight | | $ | 925,913 | | $ | 717,499 |
Term | | | 64,499 | | | 83,278 |
Other | | | 13,438 | | | |
| | | | | | |
Total interest-bearing | | | 1,003,850 | | | 800,777 |
Non-interest bearing demand and overnight | | | 110 | | | 43 |
| | | | | | |
Total deposits | | $ | 1,003,960 | | $ | 800,820 |
| | | | | | |
The following table summarizes the amount and weighted average interest rate of our interest-bearing deposits by term of maturity.
| | | | | | | | | | |
| | | As of December 31, 2006 | | As of December 31, 2005 |
Term to Maturity | | Amount | | Weighted Average Interest Rate % | | Amount | | Weighted Average Interest Rate % |
| (dollars in thousands) | | |
Demand and overnight | | $ | 961,790 | | 5.14 | | $ | 744,599 | | 3.89 |
One to three months | | | 37,890 | | 5.12 | | | 46,405 | | 4.11 |
Three to six months | | | 1,925 | | 5.05 | | | 5,998 | | 4.28 |
Six to 12 months | | | 2,245 | | 5.11 | | | 3,775 | | 4.12 |
| | | | | | | | | | |
Total interest-bearing deposits | | $ | 1,003,850 | | 5.14 | | $ | 800,777 | | 3.91 |
| | | | | | | | | | |
Note 12—Securities Sold Under Agreements to Repurchase
We sell securities under agreements to repurchase the securities. The amounts received under these agreements represent short-term borrowings and are liabilities in the Statement of Condition. We have delivered securities sold under agreements to repurchase to the primary dealer. Should the market value of the underlying securities fall below the market value required as collateral, we must deliver additional securities to the dealer. As of December 31, 2006, we had no securities sold under agreements to repurchase and as of December 31, 2005, our balance was $393.5 million.
Note 13—Consolidated Obligations
Consolidated obligations are the joint and several obligations of the FHLBanks and consist of consolidated obligation bonds and discount notes. The FHLBanks issue consolidated obligations through the Office of Finance as their agent. In connection with each debt issuance, each FHLBank specifies the amount of debt it wants issued on its behalf. The Office of Finance tracks the amount of debt issued on behalf of each FHLBank. In addition, we separately track and record as a liability our specific portion of consolidated obligations for which we are the primary obligor. The Finance Board and the U.S. Secretary of the Treasury have oversight over the issuance of FHLBank debt through the OF. Consolidated bonds are issued primarily to raise intermediate and long-term funds for the FHLBanks and are not subject to any statutory or regulatory limits on maturity. Consolidated discount notes are issued primarily to raise short-term funds. These notes sell at less than their face amount and are redeemed at par value when they mature.
126
Federal Home Loan Bank of Seattle
Notes to Financial Statements—(Continued)
The majority of our consolidated obligation bonds are fixed-rate, non-callable bonds sold through a daily auction process. At times, rather than auctioning new debt on which we are primarily liable, we may negotiate with another FHLBank to transfer their existing debt to us. We may do so when the terms or yield of the transferred debt are more favorable than what we can obtain through the daily auction process. For example, this may occur when the type of consolidated obligation bond available from another FHLBank is issued in the global debt program, where the bonds trade in a more liquid market than exists for other FHLBank programs, or when their term to maturity on a consolidated obligation bond available from another FHLBank matches more closely the term of the asset to be funded than those of the consolidated obligation bonds available in the daily auction.
Because each FHLBank seeks to manage its market risk within its risk management framework, the opportunity to acquire debt from other FHLBanks on favorable terms is generally limited. If an FHLBank is primarily liable for a type of consolidated obligation bond with terms that do not meet its risk management objectives, it may inquire whether any other FHLBank requires the particular type of consolidated obligation. For example, if an FHLBank has ten-year non-callable consolidated obligation bonds in excess of the advances or mortgages loans that it funded with the proceeds because a portion of the related advances or mortgage loans was repaid, it may inquire whether any other FHLBank requires this type of consolidated obligation bond. If the current yield on the bond is attractive, the second FHLBank may enter into a transfer transaction with the first FHLBank rather than having the FHLBank System issue additional ten-year non-callable debt on its behalf. Our ability to acquire transferred debt depends entirely upon circumstances at other FHLBanks therefore, we cannot predict when this funding alternative will be available to us.
In circumstances where we transfer debt from another FHLBank, we negotiate a transfer price directly with the transferring FHLBank. We generally transfer debt with a two-day forward settlement. At settlement, we assume the payment obligations on the transferred debt and receive a cash payment equal to the net settlement value of par, discount or premium, and accrued interest, and notify the Office of Finance of a change in primary obligor for the transferred debt.
Although we are primarily liable for the allocated portion of consolidated obligations issued on our behalf, we are also jointly and severally liable with the other 11 FHLBanks for the payment of principal and interest on all of the consolidated obligations of the FHLBank System. The Finance Board, at its discretion, may require any FHLBank to make principal or interest payments due on any FHLBank’s consolidated obligations, even in the absence of a default of an FHLBank. Although it has never occurred, to the extent that an FHLBank would make a payment on a consolidated obligation on behalf of another FHLBank, the paying FHLBank would be entitled to reimbursement from the other FHLBank. However, if the Finance Board determines that an FHLBank is unable to satisfy its obligations, then the Finance Board may allocate the outstanding liability among the remaining FHLBanks on a pro-rata basis in proportion to each FHLBank’s participation in all consolidated obligations outstanding, or on any other basis the Finance Board may determine. No FHLBank has ever defaulted on a consolidated obligation, and the joint and several requirements have never been invoked.
The par amounts of the 12 FHLBanks’ outstanding consolidated obligations, including consolidated obligations held by other FHLBanks, were $952.0 billion and $937.5 billion as of December 31, 2006 and 2005. We currently hold $4.2 billion in consolidated obligation bonds issued by other FHLBanks. Regulations of each FHLBank require that we maintain unpledged qualifying assets equal to its participation in the consolidated obligations outstanding. Under the FHLBank Act, qualifying assets are defined as: cash; secured advances; assets with an assessment or rating at least equivalent to the current assessment or rating of the consolidated obligations; obligations of or fully guaranteed by the United States, obligations, participations, or other instruments of or issued by Fannie Mae or the Government National Mortgage Association, or Ginnie Mae; mortgages, obligations or other securities which are or have ever been sold by Freddie Mac; and other securities, such as fiduciary and trust funds an FHLBank may invest in under statutory law.
127
Federal Home Loan Bank of Seattle
Notes to Financial Statements—(Continued)
To provide the holders of consolidated obligations issued before January 29, 1993 (prior bondholders) the protection equivalent to that provided under our previous leverage limit of 12 times our capital stock, prior bondholders have a claim on a certain amount of the qualifying assets Special Asset Account, or SAA, if capital stock is less than 8.33% of consolidated obligations. Mandatorily redeemable capital stock is considered capital stock for determining an FHLBank’s compliance with this requirement.
As of December 31, 2006 and 2005, the FHLBanks’ regulatory capital stock was 4.50% and 4.60% of the par value of consolidated obligations outstanding, and the required minimum pledged asset balance was approximately $26,000 and $110,000 as of December 31, 2006 and 2005. Further, the regulations require each FHLBank to transfer qualifying assets in the amount of its allocated share of the FHLBanks’ SAA to a trust for the benefit of the prior bondholders if its capital-to-assets ratio falls below 2.00%. As of December 31, 2006 and 2005, no FHLBank had a capital-to-assets ratio of less than 2.00%; therefore, no assets were being held in a trust. In addition, no trust has ever been established as a result of this regulation, as the ratio has never fallen below 2.00%.
• General Terms •Consolidated obligations are issued with either fixed-interest rate payment terms or variable-interest rate payment terms that use a variety of indices for interest-rate resets, including the London Interbank Offered Rate, or LIBOR, Constant Maturity Treasury, or CMT, 11th District Cost of Funds, and others. In addition, to meet the expected specific needs of certain investors in consolidated obligations, both fixed-rate bonds and variable-rate bonds may also contain certain features, which may result in complex interest-rate payment terms and call options. When such consolidated obligations are issued, we typically enter into interest-rate exchange agreements containing offsetting features that effectively convert the terms of the bond to those of a simple variable-rate bond or a fixed-rate bond. These consolidated obligations, beyond having fixed-rate or simple variable-rate coupon payment terms, may also have the following broad terms regarding either principal repayment or coupon payment terms:
Optional Principal Redemption Bonds, or callable bonds, may be redeemed by us, in whole or in part, at our discretion, on predetermined call dates, according to terms of bond offerings; and
Putable Bonds may be redeemed, in whole or in part, by the bondholder, at their discretion, on predetermined put dates, according to the terms of the bond offering.
With respect to interest payments, consolidated obligations may also have the following terms:
Step-up Bonds generally pay interest at increasing fixed rates for specified intervals over the life of the bond. These bonds generally contain provisions enabling us to call bonds at our option on the step-up dates; and,
Variable-Rate Bonds have interest payment rates determined by the market indices, typically Prime, CMT, and LIBOR.
128
Federal Home Loan Bank of Seattle
Notes to Financial Statements—(Continued)
• Interest Rate Payment Terms • The following table summarizes the par value of consolidated obligation bonds outstanding by interest-rate payment terms.
| | | | | | |
Interest-Rate Payment Terms | | As of
December 31,
2006 | | As of
December 31,
2005 |
| (dollars in thousands) | | | | |
Fixed Rate | | $ | 46,756,090 | | $ | 37,786,010 |
Step-up | | | 235,000 | | | |
Variable-rate bonds | | | 1,230,000 | | | 300,000 |
| | | | | | |
Total consolidated obligations par value | | $ | 48,221,090 | | $ | 38,086,010 |
| | | | | | |
• Redemption Terms • The following table summarizes our participation in consolidated obligation bonds outstanding by term to maturity.
| | | | | | | | | | | | |
| | | As of December 31, 2006 | | As of December 31, 2005 |
Term to Maturity | | Amount | | | Weighted Average
Interest Rate % | | Amount | | | Weighted Average Interest Rate % |
| (dollars in thousands, except for interest rates) | | |
Due in one year or less | | $ | 20,272,290 | | | 4.87 | | $ | 8,635,775 | | | 3.44 |
Due after one year through two years | | | 9,586,050 | | | 4.38 | | | 7,957,230 | | | 4.21 |
Due after two years through three years | | | 5,206,520 | | | 4.87 | | | 6,527,550 | | | 3.94 |
Due after three years through four years | | | 2,453,300 | | | 4.63 | | | 3,260,500 | | | 4.64 |
Due after four years through five years | | | 1,586,865 | | | 5.14 | | | 1,963,300 | | | 4.55 |
Thereafter | | | 9,116,065 | | | 5.37 | | | 9,741,655 | | | 5.33 |
| | | | | | | | | | | | |
Total par value | | | 48,221,090 | | | 4.87 | | | 38,086,010 | | | 4.33 |
Premiums | | | 27,641 | | | | | | 45,890 | | | |
Discounts | | | (74,809 | ) | | | | | (70,100 | ) | | |
Derivatives hedging adjustments | | | (133,207 | ) | | | | | (180,243 | ) | | |
| | | | | | | | | | | | |
Total interest-bearing deposits | | $ | 48,040,715 | | | | | $ | 37,881,557 | | | |
| | | | | | | | | | | | |
The amounts in the above table include the FHLBank consolidated obligation bond transfers of $1.4 billion par from the FHLBank of Chicago and $50.0 million par value from FHLBank of Pittsburgh. These transfers included associated bond discounts of $32.1 million and $31.6 million as of December 31, 2006 and 2005.
Consolidated obligation bonds outstanding as of December 31, 2006 and 2005, included callable bonds totaling $24.5 billion and $19.2 billion. We continue to classify our debt as callable after the last call date has passed. Simultaneous with such a debt issue, we may also enter into an interest-rate exchange agreement (in which we pay variable and receive fixed cash flows) with a call feature that mirrors the option embedded in the debt (e.g., a sold callable swap). The combined sold callable swap and callable debt allows us to provide members with more economically priced, variable-rate funding.
129
Federal Home Loan Bank of Seattle
Notes to Financial Statements—(Continued)
The following table summarizes the par value of consolidated obligation bonds outstanding by callable and putable terms.
| | | | | | |
Consolidated Obligation Bonds | | As of
December 31,
2006 | | As of
December 31,
2005 |
| (dollars in thousands) | | |
Non-callable or non-putable | | $ | 23,300,375 | | $ | 18,473,880 |
Callable | | | 24,516,615 | | | 19,208,030 |
Putable | | | 404,100 | | | 404,100 |
| | | | | | |
Total | | $ | 48,221,090 | | $ | 38,086,010 |
| | | | | | |
The following table summarizes the par value of consolidated bonds outstanding by year of original maturity or next call date as of December 31, 2006 and 2005.
| | | | | | |
Term to Maturity or Next Call Date | | As of
December 31,
2006 | | As of
December 31,
2005 |
| (dollars in thousands) | | |
Due in one year or less | | $ | 35,279,905 | | $ | 22,854,080 |
Due after one year through two years | | | 4,711,000 | �� | | 4,721,130 |
Due after two years through three years | | | 2,704,520 | | | 3,650,000 |
Due after three years through four years | | | 841,300 | | | 1,728,500 |
Due after four years through five years | | | 529,865 | | | 648,300 |
Thereafter | | | 4,154,500 | | | 4,484,000 |
| | | | | | |
Total par value | | $ | 48,221,090 | | $ | 38,086,010 |
| | | | | | |
• Consolidated Obligation Discount Notes •Consolidated obligation discount notes are issued to raise short-term funds. Discount notes are consolidated obligations with original maturities up to one year. These notes are issued at less than their face amount and redeemed at par value when they mature.
The following summarizes the par value, the net discounts, the concessions, book value and the weighted average interest rate, for our consolidated discount notes.
| | | | | | | | |
Book Value & Weighted Average Interest Rate | | 2006 | | | 2005 | |
| (dollars in thousands, except percentage data) | | | |
Par Value | | $ | 1,496,508 | | | $ | 10,646,479 | |
Discounts, net | | | (643 | ) | | | (25,501 | ) |
Concession | | | (4 | ) | | | (27 | ) |
| | | | | | | | |
Book Value | | $ | 1,495,861 | | | $ | 10,620,951 | |
| | | | | | | | |
Weighted Average Yield | | | 4.86 | % | | | 3.95 | % |
Note 14—Capital
The Gramm-Leach-Bliley Act of 1999, or the GLB Act, required each FHLBank to adopt a Capital Plan and convert to a new capital structure. The Finance Board’s capital rule, which implemented the capital provisions of the GLB Act, required each FHLBank to submit a capital plan to the Finance Board by October 29, 2001. The
130
Federal Home Loan Bank of Seattle
Notes to Financial Statements—(Continued)
Finance Board approved our capital plan and we converted to our new capital structure during 2002. The conversion was considered a capital transaction and was accounted for at par value.
• Capital Requirements •We are subject to three capital requirements under our Capital Plan and the Finance Board rules and regulations: (1) risk-based capital, (2) total capital and (3) leverage capital.
First, under the risk-based capital requirement, we must maintain at all times permanent capital defined as Class B stock and retained earnings in an amount at least equal to the sum of our credit risk, market risk, and operations risk capital requirements, all of which are calculated in accordance with the rules and regulations of the Finance Board. The Finance Board has the authority to require us to maintain a greater amount of permanent capital than is required by the risk-based capital requirement, but to date has not exercised such authority.
Second, we are required to maintain at all times a total capital-to-assets ratio of at least 4.00%. Total capital is the sum of permanent capital, Class A stock, any general loss allowance, if consistent with GAAP and not established for specific assets, and other amounts from sources determined by the Finance Board as available to absorb losses. However, as described below, we are subject to a higher Board approved minimum capital requirement. For the purposes of the capital-to-assets ratio, capital is defined as permanent capital plus non-permanent capital, divided by total assets.
Third, we are required to maintain at all times a leverage capital-to-assets ratio of at least 5.00%. Leverage capital is defined as the sum of permanent capital weighted by a 1.5 multiplier plus non-permanent capital, divided by total assets.
We are in compliance with the aforementioned capital rules and requirements. In addition, for regulatory purposes mandatorily redeemable stock, discussed further below, is considered permanent capital. The following table shows our regulatory capital requirements compared to our actual capital position.
| | | | | | | | | | | | | | | | |
| | | As of December 31, 2006 | | | As of December 31, 2005 | |
Regulatory Capital Requirements | | Required | | | Actual | | | Required | | | Actual | |
| (dollars in thousands, except for ratios) | | | |
Risk-based capital | | $ | 325,782 | | | $ | 2,302,616 | | | $ | 461,462 | | | $ | 2,267,552 | |
Total capital-to-assets ratio | | | 4.00 | % | | | 4.30 | % | | | 4.00 | % | | | 4.32 | % |
Total regulatory capital | | | 2,140,590 | | | | 2,302,616 | | | | 2,101,663 | | | | 2,267,552 | |
Leverage ratio | | | 5.00 | % | | | 6.45 | % | | | 5.00 | % | | | 6.47 | % |
Leverage capital | | | 2,675,737 | | | | 3,453,922 | | | | 2,627,079 | | | | 3,401,328 | |
• Supervisory Capital Requirements • On January 11, 2007, the Finance Board terminated the Written Agreement between the Seattle Bank and the Finance Board dated as of December 10, 2004. Subsequently, on January 26, 2007 due to the termination of the Written Agreement, our Board authorized us to lower our minimum capital-to-asset ratio from 4.25% to 4.05%. Previous to the termination of the Written Agreement, we maintained a minimum supervisory capital-to-assets ratio of 4.25% which was required under our business plan submitted to the Finance Board in April 2005, and accepted by the Finance Board in May 2005. We were in compliance with the applicable regulatory and supervisory capital requirements at all times during 2006 and 2005.
• Capital Plan •Our current Capital Plan provides for two classes of stock, Class A and Class B, each of which has a par value of $100. Each class of stock can be issued, redeemed, and repurchased only at par value. The terms and conditions for ownership of our Class A and Class B stock are discussed below.
131
Federal Home Loan Bank of Seattle
Notes to Financial Statements—(Continued)
Total Stock Purchase Requirements.Members are required to hold stock equal to the greater of:
| | • | | $500.00 or 0.50% of the member’s home mortgage loans and mortgage loan pass-through securities; or |
| | • | | The sum of the requirement for advances currently outstanding to that member and the requirement for the remaining principal balance of mortgages sold to us under the MPP. |
Only Class B Stock can be used to meet the membership stock purchase requirement and the MPP stock purchase requirement. Subject to the limitations specified in the Capital Plan, a member may use Class B stock, Class A stock or the Excess Stock Pool to meet its advance stock purchase requirement.
During 2005 and the majority of 2006 we had two classes of capital stock, Class B(1) and Class B(2). The Class B(1) stock represented the stock that members were required to hold based on the minimum membership requirements and the Class B(2) represented stock that a member was no longer required to hold, that exceeded the amount of allowable excess Class B(1) stock. On October 11, 2006, the Finance Board approved amendments to our Capital Plan that simplified the terms and provisions of our Capital Plan. Included in the amendments to the Capital Plan were the conversions of our Class B(1) and Class B(2) into a single Class B stock.
Class B stock.Our Class B stock is redeemable five years after: (1) written notice from the member; (2) consolidation or merger of a member with a nonmember; or (3) withdrawal or termination of membership. All stock redemptions are subject to restrictions set forth in the FHLBank Act, Finance Board regulations, and our Capital Plan. Historically we have elected to repurchase stock that was subject to redemption prior to the expiration of the five-year redemption period that applies to each redemption request if that stock was not required to be held by the member to meet its total stock purchase requirements. However, as further described below, our Board of Directors adopted limitations on our ability to repurchase Class B stock from members.
Class A stock.The October 11, 2006 amendment to the Capital Plan permitted the issuance of a new Class A stock designed to encourage borrowing by our members of the Seattle Bank. The Class A stock has a par value of $100 per share and is redeemable at par upon six months written notice to the Seattle Bank. Class A stock is only issued to members to satisfy a member’s advance stock purchase requirement for new or renewing advances if the member has no excess.
Voting.Each member has the right to vote its stock for the number of directors allocated to the member’s state, subject to certain limitations on the maximum number of shares that can be voted, as set forth in applicable law and regulations.
• Dividends •Generally, under our Capital Plan, our Board can declare and pay dividends, in either cash or capital stock, only from retained earnings or current net earnings. However, the Board has adopted a resolution limiting dividends on Class A stock to cash in September 2006, and on December 28, 2006, the Finance Board adopted a resolution limiting an FHLBank from issuing stock dividends, if, after the issuance, the outstanding excess stock at the FHLBank would be greater than 1.00% of its total assets. As of December 31, 2006, we had excess stock of $902.2 million or 1.69% of our total assets.
To meet Finance Board conditions for the acceptance of our business plan, our Board adopted a policy on May 18, 2005, suspending indefinitely the declaration or payment of any dividends and providing that any future dividend declaration or payment generally may be made only after prior approval of the OS Director.
132
Federal Home Loan Bank of Seattle
Notes to Financial Statements—(Continued)
On December 8, 2006, the OS Director granted us a waiver, at the request of our Board, to resume paying quarterly dividends beginning with the fourth quarter of 2006. The waiver contained dividend limitations imposed by our Board as a condition to the Finance Board’s acceptance in 2005 of our business and capital management plan. The dividend limitation identified in the waiver generally provides that dividend payments may not exceed 50.0% of year-to-date GAAP net income. The waiver allows us to pay quarterly cash dividends to our members within the following parameters:
| | • | | Dividends paid during the fourth quarter of 2006 may not exceed 50.0% of our third quarter 2006 GAAP net income; |
| | • | | Total dividends paid during the fourth quarter of 2006 and the first quarter of 2007 may not exceed 50.0% of combined third quarter and fourth quarter 2006 GAAP net income; |
| | • | | Total dividends paid during the second, third and fourth quarters of any calendar year (any such calendar year being referred to as “Year N”) and the first quarter of the immediately following calendar year (the four quarters being the “Year N Quarters”) may not exceed 50.0% of our GAAP net income for Year N, as calculated pursuant to GAAP; |
| | • | | After the first quarter of 2007, dividends paid during any particular Year N Quarter may exceed 50.0% of the net income for the immediately preceding Year N Quarter, but only if and to the extent that the aggregate amount of dividends paid with respect to earlier Year N Quarters does not exceed 50.0% of aggregate year-to-date net income, as calculated pursuant to GAAP, through the end of the immediately preceding Year N Quarter. |
These dividend limitations will remain in effect until we receive written approval from the OS Director to exceed the limitations. There can be no assurance that our Board will declare dividends, if any, to the fullest extent permitted for any period.
Pursuant to the waiver received from the OS Director, our Board declared a dividend of $0.10 per share on our Class B stock based upon the average amount of such stock held. Based upon Board approval, we paid a $2.1 million cash dividend in late December 2006. We had no Class A stock outstanding during 2006 and therefore, no Class A dividends were declared by our Board.
• Excess Stock Pool •As part of our efforts to encourage members to borrow from us, the October 11, 2006 amendments to our Capital Plan included the creation of the Excess Stock Pool. Under the amended Capital Plan, we permit members with no excess stock available to capitalize new or renewing advances to satisfy their incremental advance stock purchase requirement by relying on Seattle Bank capital that is associated with total outstanding excess stock of all members and other holders of Seattle Bank stock, which we refer to as the Excess Stock Pool. Excess stock is the amount of stock held by a member in excess of its total stock purchase requirement, which is the greater of the member’s membership stock purchase requirement or the sum of (i) the member’s advance stock purchase requirement and (ii) the member’s mortgage purchase plan stock purchase requirement. There are certain limitations relating to the use of the Excess Stock Pool, including among others, restricting the aggregate use of the Excess Stock Pool to 50.0% of the total amount of all excess stock and the ability of our Board to suspend the use of the Excess Stock Pool at any time. Other limitations include: a maturity limit of one year on advances supported by the Excess Stock Pool; a per-member usage limit of 25.0% of the total amount of the Excess Stock Pool; and a maximum dollar threshold whereby a member cannot use the Excess Stock Pool to support additional advances if, on the date the advance would be received by the member, the member’s total outstanding advances equal or exceed $11.0 billion. The authority to use the Excess Stock Pool to support additional advances will terminate on October 1, 2008, unless extended by our Board following approval by the Finance Board.
133
Federal Home Loan Bank of Seattle
Notes to Financial Statements—(Continued)
Additionally, in actions relating to approval of the amendments to the Capital Plan, our Board resolved that we would maintain a 4.00% member advance stock purchase requirement and not repurchase Class B stock during the period the Excess Stock Pool is in effect and would seek prior written authorization of the OS Director if we wish to lower that requirement or repurchase Class B stock thereafter.
As of December 31, 2006 and 2005, our members held $902.2 million and $577.9 million in Class B stock in excess of the minimum amount required to be held in accordance with our Capital Plan.
• Stock Redemption • Generally, and provided that we are in compliance with the regulatory capital requirements, stock is redeemable following the expiration of the applicable notice period after: (1) written notice from the member; (2) consolidation or merger of two members; or (3) withdrawal or termination of membership. We may elect to repurchase stock that is subject to redemption prior to the expiration of the applicable notice period, subject to restrictions contained in the FHLBank Act, Finance Board regulations, and our Capital Plan, but we are under no obligation to do so. In addition, subject to the same restrictions, we may elect, at any time and upon five days’ written notice, to repurchase at par value, payable in cash, any excess stock. Historically, we have generally voluntarily repurchased stock that was subject to redemption within one month after receipt of a member’s redemption request.
However, as part of the Finance Board’s acceptance of our business and capital management plan, our Board adopted a policy on May 18, 2005 suspending indefinitely the repurchases of any Class B stock, except that a limited amount of Class B stock repurchases may be made after prior approval of the OS Director. This policy will be in effect until formally revoked by our Board of Directors, following approval of the OS Director. We do not expect to obtain waivers from the Finance Board for the repurchase of the Class B stock for the foreseeable future.
In accordance with the GLB Act, each class of our stock is considered putable with restrictions, due to the significant restrictions on the obligation/right to redeem and the limitation of the redemption privilege to a small fraction of our outstanding stock. Statutory and regulatory restrictions on the redemption of our stock include the following:
| | • | | In no case may we redeem any stock if, following such redemption, we would fail to satisfy our minimum capital requirements (i.e., a statutory capital-to-asset ratio requirement established by the GLB Act, and a regulatory risk-based capital-to-asset ratio requirement established by the Finance Board); |
| | • | | By law, all member holdings of our stock immediately become non-redeemable if we become undercapitalized. In no case may we redeem any stock if either our Board or the Finance Board determines that we have incurred, or are likely to incur, losses resulting, or expected to result, in a charge against capital; |
| | • | | In addition to possessing the authority to prohibit stock redemptions, our Board has a right and an obligation to call for additional stock purchases by our members, as a condition of membership, as needed to satisfy statutory and regulatory capital requirements. These requirements include the maintenance of a stand-alone “AA” credit rating from a nationally recognized statistical rating organization; |
| | • | | If, during the period between receipt of a stock redemption notification from a member and the actual redemption (which could last indefinitely if we were undercapitalized, did not have the required credit rating, etc.), an FHLBank becomes insolvent and is either liquidated or forced to merge with another FHLBank, the redemption value of our stock will be established either through the market liquidation |
134
Federal Home Loan Bank of Seattle
Notes to Financial Statements—(Continued)
| | process or through negotiation with a merger partner. In either case, all senior claims must first be settled at par, and there are no claims which are subordinated to the rights of FHLBank stockholders; |
| | • | | The GLB Act states that we may redeem, at our sole discretion, stock investments that exceed the required minimum amount. In no case may we redeem any stock if the principal or interest due on any consolidated obligation issued by the Office of Finance has not been paid in full; |
| | • | | In no case may we redeem any stock if we fail to provide the Finance Board the quarterly certification required by section 966.9(b)(1) of the Finance Board’s rules prior to declaring or paying dividends for a quarter; |
| | • | | In no case may we redeem any stock if we project that we will fail to comply with statutory or regulatory liquidity requirements or will be unable to timely and fully meet all of our obligations, actually fail to satisfy these requirements or obligations, or negotiate to enter or enter into an agreement with another FHLBank to obtain financial assistance to meet our current obligations; |
• Mandatorily Redeemable Stock •We adopted SFAS 150 as of January 1, 2004, based on the characteristics of the Seattle Bank’s stock, SFAS 150’s definition of a nonpublic entity, and the definition of an SEC registrant in FASB Staff Position 150-3. We are a cooperative whose members and former members own all of the Seattle Bank’s capital stock. Member shares cannot be purchased or sold except between the Seattle Bank and its members at its $100 per share par value. In accordance with SFAS 150, we reclassify our stock from equity to a liability whenever a member gives notice of intent to withdraw from membership or attains non-member status by merger or acquisition, charter termination, or involuntary termination from membership and we determine the penalty the member would incur for rescinding the redemption request to be substantive. Written redemption requests of excess stock remain classified as equity because the penalty of rescission is not substantive as it is based on the forfeiture of future dividends. If circumstances change, such that the rescission of an excess stock redemption request is subject to a substantive penalty, we would reclassify such stock as mandatorily redeemable capital stock. The reclassification is made at fair value. Dividends on mandatorily redeemable capital stock are accrued on the dividend declaration date and reported as interest expense in the Statements of Income. The repayment of these mandatorily redeemable financial instruments will be reflected as financing activities in the Statements of Cash Flows on settlement date.
At December 31, 2006 and 2005 we had $69.2 million and $66.3 million in Class B stock subject to mandatory redemption with payment subject to a five-year waiting period.
The following table provides the number of members that notified us of their respective decisions to voluntarily redeem their capital stock and the number of redemptions or repurchases during 2006 and 2005:
| | | | |
Voluntary Redemption of Capital Stock | | As of
December 31,
2006 | | As of
December 31,
2005 |
Beginning, January 1 | | 34 | | 6 |
Due to mergers and acquisitions | | 3 | | 1 |
Due to withdrawals | | 2 | | 4 |
Redemptions or repurchases during the year | | 24 | | 23 |
| | | | |
Balance, December 31 | | 63 | | 34 |
| | | | |
The following table shows the amount of mandatorily redeemable capital stock by year of redemption as of December 31, 2006 and 2005. The year of redemption in the table is the later of the end of the five-year redemption period, or the maturity date of the activity the stock is related to, if the capital stock represents the
135
Federal Home Loan Bank of Seattle
Notes to Financial Statements—(Continued)
activity-based stock purchase requirement of a non-member (former member that withdrew from membership, merged into a non-member or was otherwise acquired by a non-member). Consistent with the Capital Plan currently in effect, we are not required to redeem membership stock until five years after the membership is terminated or we receive notice of withdrawal. We are not required to redeem activity-based stock until the later of the expiration of the notice of redemption or until the activity to which the capital stock relates no longer remains outstanding. If activity-based stock becomes excess stock as a result of an activity no longer remaining outstanding, we may repurchase such shares, in our sole discretion.
| | | | | | |
Contractual Year of Redemption | | As of
December 31,
2006 | | As of
December 31,
2005 |
| (dollars in thousands) | | | | |
2008 | | $ | | | $ | |
2009 | | | 63,622 | | | 63,622 |
2010 | | | 2,637 | | | 2,637 |
2011 | | | 2,963 | | | |
| | | | | | |
Total | | $ | 69,222 | | $ | 66,259 |
| | | | | | |
The following table summarizes our activity related to mandatorily redeemable Class B stock.
| | | | | | | |
Mandatorily Redeemable Stock | | For the
Year Ended
2006 | | For the
Year Ended
2005 | |
| (dollars in thousands) | | | |
Balance, January 1 | | $ | 66,259 | | $ | 64,139 | |
Capital stock subject to mandatory redemption reclassified from equity | | | | | | | |
Withdrawals | | | 2,963 | | | 2,387 | |
Other redemptions | | | | | | 65,100 | |
Capital stock subject to mandatory redemption reclassified to equity | | | | | | (65,515 | ) |
Imputed interest and dividends | | | | | | 148 | |
| | | | | | | |
Balance, December 31 | | $ | 69,222 | | $ | 66,259 | |
| | | | | | | |
A member may cancel or revoke its written notice of redemption or its notice of withdrawal from membership prior to the end of the five-year redemption period.
• Membership •The GLB Act made membership voluntary for all members. Members that withdraw from membership must wait five years from the divesture date for all Class B stock that is held as a condition of membership, as that requirement is set out in our Capital Plan, unless the institution has cancelled its notice of withdrawal prior to that date, before being readmitted to membership in any FHLBank.
• Capital Concentration •The following table presents holdings of 10.0% or more of the Seattle Bank’s total capital stock including mandatorily redeemable capital stock outstanding at December 31, 2006 and 2005.
| | | | | | | | | | |
| | | As of December 31, 2006 | | As of December 31, 2005 |
Capital Stock Concentration | | Capital Stock
Outstanding | | Percent of
Total | | Capital Stock
Outstanding | | Percent of
Total |
| (dollars in thousands, except for percentages) | | |
Washington Mutual Bank, F.S.B. | | $ | 590,047 | | 26.7 | | $ | 590,047 | | 26.8 |
Bank of America | | | 249,333 | | 11.3 | | | 249,333 | | 11.3 |
136
Federal Home Loan Bank of Seattle
Notes to Financial Statements—(Continued)
Note 15— Employee Retirement Plans
As of December 31, 2006, the Seattle Bank offered two defined-benefit pension plans and three defined-contribution pension plans.
• Qualified Defined-Benefit Multi-Employer Plan •We participate in the Pentegra Defined-Benefit Plan for Financial Institutions, or Pentegra DB Plan, a tax qualified benefit pension plan, formerly known as the Financial Institutions Retirement Fund. The plan covers substantially all of our officers and employees hired before January 1, 2004. Our contributions to the plan through June 30, 1987, represented the normal cost of the plan. The plan reached the full-funding limitation, as defined by the Employee Retirement Income Security Act, for the plan year beginning July 1, 1987, because of favorable investment and other actuarial experience during previous years. As a result, the plan suspended employer contributions for all plan years ending after June 30, 1987, through June 30, 2003. Contributions to the plan resumed on July 1, 2003. Funding and administrative costs of the plan charged to operating expenses were $2.9 million, $2.5 million, and $1.8 million in 2006, 2005, and 2004. The Pentegra DB Plan is a multi-employer plan and does not segregate its assets, liabilities, or costs by participating employer. As a result, disclosure of the accumulated benefit obligations, plan assets, and the components of annual pension expense attributable to the Seattle Bank cannot be made.
• Qualified Defined-Contribution Retirement Plans •We offer two defined-contribution 401(k) savings plans for eligible employees. One plan is open to all eligible employees and our contributions to that plan are equal to a percentage of voluntary employee contributions, subject to certain limitations. We contributed $454,000, $509,000 and $510,000 for the years ended December 31, 2006, 2005, and 2004. The second plan covers substantially all officers and employees hired after December 31, 2003. Our contributions to the second plan are equal to a percentage of the participating employee’s annual salary. Contributions to the plan were $49,000 and $84,000 for the years ended December 31, 2006 and 2005. There were no contributions for the year ended December 31, 2004.
• Non-Qualified Supplemental Retirement Plans •We offer to certain highly compensated employees non-qualified supplemental retirement plans, including the Thrift Plan Benefit Equalization Plan, or Thrift BEP, a defined-contribution pension plan, and the Federal Bank Home Loan Bank of Seattle Retirement Fund Benefit Equalization Plan, or Retirement BEP, a defined-benefit pension plan.
Thrift BEP
Our liability for the Thrift BEP consists of deferred compensation and accrued earnings on deferred compensation. Our minimum obligation on the Thrift BEP as of December 31, 2006, 2005, and 2004 was $251,000, $249,000, and $1.6 million. Operating expense includes deferred compensation and accrued earnings of ($28,000), $(40,000), and $118,000 for the years ended December 31, 2006, 2005, and 2004.
Retirement BEP
Our liability for the Retirement BEP consists of the actuarial present value of benefits for the participants, accumulated deferred compensation, and accrued earnings on the deferrals. Our minimum obligation on this plan was $715,000 and $621,000 as of December 31, 2006 and 2005. Operating expense includes deferred compensation and accrued earnings of $639,000, $230,000, and $539,000 for the years ended December 31, 2006, 2005, and 2004.
During 2006, we adopted SFAS 158 which required projected benefit obligations to be determined and recognized for single-employer plans as a liability in the Statements of Condition with an offsetting amount in accumulated other comprehensive income. Among the above five retirement plans, only the non-qualified Retirement BEP meets the application criteria of SFAS 158.
137
Federal Home Loan Bank of Seattle
Notes to Financial Statements—(Continued)
The table below identifies the accounts impacted by the adoption of SFAS 158.
| | | | | | | | | | | |
As of December 31, 2006 | | Before
Application of
SFAS 158 | | Adjustments | | | After
Application of
SFAS 158 | |
| (dollars in thousands) | | | |
Other liabilities | | $ | 32,862 | | $ | 2,090 | | | $ | 34,952 | |
Total liabilities | | | 51,281,351 | | | 2,090 | | | | 51,283,441 | |
Accumulated other comprehensive loss* | | | | | | (2,090 | ) | | | (2,090 | ) |
Total capital | | | 2,233,394 | | | (2,090 | ) | | | 2,231,304 | |
| * | Accumulated other comprehensive loss is composed of an adjustment to the funded status for unrealized prior service costs of $1.9 million and unrecognized loss of $212,000. The estimated portion of net gain or loss and net prior service cost remaining in accumulated other comprehensive income that is expected to be recognized as a component of net periodic benefit cost over the next fiscal year is $10,000 and $113,000. |
The following table summarizes our obligations and funded status of the Retirement BEP as of December 31, 2006 and 2005.
| | | | | | | | |
Funded Status of the Retirement BEP | | As of
December 31,
2006 | | | As of
December 31,
2005 | |
| (dollars in thousands) | | | |
Change in benefit obligation | | | | | | | | |
Projected benefit obligation as of January 1, | | $ | 3,259 | | | $ | 2,541 | |
Service cost | | | 174 | | | | 33 | |
Interest cost | | | 186 | | | | 130 | |
Data and discount rate change | | | (19 | ) | | | | |
Payout for retirements | | | (796 | ) | | | (1,351 | ) |
| | | | | | | | |
Projected benefit obligation as of December 31, | | | 2,804 | | | | 1,353 | |
Funded status | | | | | | | | |
Unrecognized net actuarial loss | | | | | | | (305 | ) |
Unrecognized prior service cost | | | | | | | (427 | ) |
| | | | | | | | |
Net amount recognized | | $ | 2,804 | | | $ | 621 | |
| | | | | | | | |
The amounts recognized in the Statements of Condition for our Retirement BEP as of December 31, 2006 and 2005, are identified in the table below.
| | | | | | | |
Accumulated Benefit Obligation for the Retirement BEP | | 2006 | | 2005 | |
| (dollars in thousands) | | | |
Accrued benefit obligation | | $ | 2,804 | | $ | 814 | |
Intangible assets | | | | | | (193 | ) |
| | | | | | | |
Net amount recognized | | $ | 2,804 | | $ | 621 | |
| | | | | | | |
138
Federal Home Loan Bank of Seattle
Notes to Financial Statements—(Continued)
The following table summarizes the components of the net periodic pension cost for our Retirement BEP for the years ended December 31, 2006, 2005, and 2004.
| | | | | | | | | | |
Net Periodic Pension Cost for the Retirement BEP | | As of
December 31,
2006 | | As of
December 31,
2005 | | | As of
December 31,
2004 |
| (dollars in thousands) | | |
Service costs | | $ | 174 | | $ | 33 | | | $ | 299 |
Interest costs | | | 186 | | | 130 | | | | 218 |
Curtailment loss (gain) | | | 344 | | | (701 | ) | | | |
Settlement loss | | | 64 | | | 313 | | | | |
Amortization of unrecognized prior service cost | | | 113 | | | 23 | | | | 62 |
Amortization of unrecognized net loss | | | 9 | | | | | | | 16 |
| | | | | | | | | | |
Net periodic pension cost | | $ | 890 | | $ | (202 | ) | | $ | 595 |
| | | | | | | | | | |
The increase in the minimum liability included in accumulated other comprehensive loss was $2.1 million as of December 31, 2006.
We realized a curtailment (gain) loss, net of settlement loss, of $408,000 and $(389,000) as a result of the termination and retirement of certain highly compensated employees during the years ended December 31, 2006, and 2005. The measurement date used to determine the current year’s benefit obligation was December 31, 2006.
The following table summarizes the key assumptions and other information for the actuarial calculations for our supplemental defined-benefits retirement plan as of December 31, 2006 and 2005.
| | | | | | |
Key Assumptions and Actuarial Calculations | | As of
December 31,
2006 | | | As of
December 31,
2005 | |
| (in percentages, except years) | | | |
Discount Rate | | 5.75 | % | | 5.50 | % |
Salary increases | | 5.00 | % | | 5.00 | % |
Gain/loss amortization period (in years) | | 17.4 | | | 19.1 | |
The following table summarizes the estimated future benefit payments reflecting expected future service as of December 31, 2006.
| | | |
Years | | Estimated Future
Benefit Payments |
| (dollars in thousands) | | |
2007 | | $ | 30,393 |
2008 | | | 29,708 |
2009 | | | 28,969 |
2010 | | | 28,181 |
2011 | | | 27,345 |
2012-2016 | | | 100,185 |
139
Federal Home Loan Bank of Seattle
Notes to Financial Statements—(Continued)
Note 16—Derivatives and Hedging Activities
•Nature of Business Activity •We may enter into interest rate swaps (including callable and putable swaps), swaptions, interest-rate cap and floor agreements, calls, puts, and futures and forward contracts (collectively referred to as derivatives or interest-rate exchange agreements) to manage our exposure to changes in interest rates.
We may adjust the effective maturity, repricing frequency, or option characteristics of financial instruments to achieve risk management objectives. We use derivatives in several ways: by designating them as either a fair value or cash flow hedge of an underlying financial instrument or a forecasted transaction, by acting as an intermediary, or in asset-liability management (i.e., an economic hedge). For example, we use derivatives in our overall interest-rate risk management to adjust the interest-rate sensitivity of consolidated obligations to approximate more closely the interest-rate sensitivity of assets (advances, investments, and mortgage loans), or to adjust the interest-rate sensitivity of advances, investments, or mortgage loans to approximate more closely the interest-rate sensitivity of liabilities.
In addition to using derivatives to manage mismatches of interest rates between assets and liabilities, we also use derivatives as follows: (1) to manage embedded options in assets and liabilities, (2) to hedge the market value of existing assets and liabilities and anticipated transactions, (3) to hedge the duration risk of prepayable instruments, (4) to exactly offset other derivatives executed with members (when we serve as an intermediary) and (5) to reduce funding costs.
Consistent with Finance Board regulation, we enter into derivatives only to reduce the interest rate risk exposures inherent in otherwise unhedged assets and funding positions, to achieve our risk management objectives, and, formerly, to act as an intermediary between our members and counterparties. We use derivatives when they are considered to be the most cost-effective alternative to achieve our financial and risk management objectives. Accordingly, we may enter into derivatives that do not necessarily qualify for hedge accounting (i.e., economic hedges).
An economic hedge is defined as a derivative hedging specific or non-specific underlying assets, liabilities, or firm commitments that does not qualify or was not designated for hedge accounting, but is an acceptable hedging strategy under our risk management program. Economic hedging strategies must also comply with Finance Board regulatory requirements prohibiting speculative hedge transactions. An economic hedge by definition introduces the potential for earnings variability caused by the changes in fair value on the derivatives that are recorded in our income but not offset by corresponding changes in the value of the economically hedged assets, liabilities, or firm commitments. As a result, we recognize only the change in fair value of these derivatives in other income as “Net gain (loss) on derivatives and hedging activities” with no offsetting fair value adjustments for the asset, liability, or firm commitment.
140
Federal Home Loan Bank of Seattle
Notes to Financial Statements—(Continued)
For the years ended December 31, 2006, 2005, and 2004, we recorded $470,000 net gains, $26.5 million net losses, and $15.6 million net losses on derivatives and hedging activities in other income. The following table summarizes our net gain and loss on derivatives and hedging activities as of the periods indicated.
| | | | | | | | | | | | |
Net Gain (Losses) on Derivatives and Hedging Activities and
Hedging Activities | | For the Year Ended
December 31, 2006 | | | For the Year Ended
December 31, 2005 | | | For the Year Ended
December 31, 2004 | |
(dollars in thousands) | | | |
Net gain (loss) related to fair value hedge ineffectiveness | | $ | 2,463 | | | $ | (4,974 | ) | | $ | 4,350 | |
Net loss on economic hedges | | | (799 | ) | | | (21,501 | ) | | | (19,933 | ) |
Net gain related to discontinued fair value hedges on early extinguished debt | | | (1,194 | ) | | | | | | | | |
| | | | | | | | | | | | |
Net gain (loss) on derivatives and hedging activities | | $ | 470 | | | $ | (26,475 | ) | | $ | (15,583 | ) |
| | | | | | | | | | | | |
We had no cash flow hedges during the years ended December 31, 2006, 2005, and 2004.
The following table summarizes the outstanding notional amounts and estimated fair values of the derivatives outstanding.
| | | | | | | | | | | | | | |
| | | As of December 31, 2006 | | | As of December 31, 2005 | |
Derivative Notional Amounts and Estimated Fair Values | | Notional | | Estimated
Fair Value | | | Notional | | Estimated
Fair Value | |
| (dollars in thousands) | | | |
Interest-rate swaps | | | | | | | | | | | | | | |
Fair value | | $ | 31,486,621 | | $ | (120,698 | ) | | $ | 17,359,659 | | $ | (175,885 | ) |
Economic | | | 1,172,450 | | | 137 | | | | 773,300 | | | 53 | |
Interest-rate swaptions | | | | | | | | | | | | | | |
Economic | | | | | | | | | | | | | | |
Interest-rate cap/floor | | | | | | | | | | | | | | |
Fair value | | | 140,000 | | | 1,085 | | | | 30,000 | | | 859 | |
Economic | | | 450,000 | | | 1,299 | | | | 300,000 | | | 782 | |
| | | | | | | | | | | | | | |
Total | | $ | 33,249,071 | | | (118,177 | ) | | $ | 18,462,959 | | | (174,191 | ) |
| | | | | | | | | | | | | | |
Accrued interest | | | | | | 218,231 | | | | | | | 53,631 | |
| | | | | | | | | | | | | | |
Net derivative balances | | | | | $ | 100,054 | | | | | | $ | (120,560 | ) |
| | | | | | | | | | | | | | |
Derivative balances | | | | | | | | | | | | | | |
Assets | | | | | $ | 146,900 | | | | | | $ | 13,205 | |
Liabilities | | | | | | (46,846 | ) | | | | | | (133,765 | ) |
| | | | | | | | | | | | | | |
Net derivative balances | | | | | $ | 100,054 | | | | | | $ | (120,560 | ) |
| | | | | | | | | | | | | | |
• Types of Assets and Liabilities Hedged •We document all relationships between derivatives designated as hedging instruments and hedged items, our risk management objectives and strategies for undertaking various hedge transactions, and our method of assessing effectiveness. This process includes linking all derivatives that are designated as fair value, cash flow, or foreign currency hedges to (1) assets and liabilities on the Statement of Condition, (2) firm commitments, or (3) forecasted transactions. We also formally assess (both at the hedge’s inception and at least quarterly) whether the derivatives that are used in hedging transactions have been effective in offsetting changes in the fair value or cash flows of hedged items and whether those derivatives may be expected to remain effective in future periods. We typically use regression analysis or other statistical analyses to assess the effectiveness of our hedges.
141
Federal Home Loan Bank of Seattle
Notes to Financial Statements—(Continued)
We discontinue hedge accounting prospectively when: (1) we determine that the derivative is no longer effective in offsetting changes in the fair value or cash flows of a hedged item (including hedged items such as firm commitments or forecasted transactions); (2) the derivative or the hedged item expires or is sold, terminated, or exercised; (3) it is no longer probable that the forecasted transaction will occur in the originally expected period; (4) a hedged firm commitment no longer meets the definition of a firm commitment; or (5) we determine that designating the derivative as a hedging instrument in accordance with SFAS 133 is no longer appropriate.
•Consolidated Obligations • While consolidated obligations are our joint and several obligations, each FHLBank has consolidated obligations for which it is the primary obligor. We enter into derivatives to hedge the interest rate risk associated with our specific debt issuances.
For instance, in a typical transaction, fixed-rate consolidated obligations are issued for one or more FHLBanks, and we simultaneously enters into a matching derivative in which the counterparty pays fixed cash flows to us designed to mirror in timing and amount the cash outflows we paid on the consolidated obligation. These transactions are treated as fair value hedges under SFAS 133. In a typical transaction for us, we pay a variable cash flow that closely matches the interest payments we receive on short-term or variable-rate advances (typically one or three-month LIBOR). This intermediation between the capital and derivatives markets permits us to raise funds at lower costs than would otherwise be available through the issuance of simple fixed- or floating-rate consolidated obligations in the capital markets.
•Advances • With issuances of putable or convertible advances, we purchase from the member a put option that enables us to convert an advance from a floating-to-fixed rate if interest rates increase or to terminate the advance and extend additional credit on new terms. We may hedge a putable or convertible advance by entering into a cancelable derivative with a counterparty pursuant to which we pay a fixed rate and receive a variable rate. This type of hedge is treated as a fair value hedge under SFAS 133. The derivative counterparty may cancel the derivative on the put date, which the counterparty normally would do in a rising interest rate environment, subsequently, we would convert the advance to a fixed rate on the same put date.
By making putable advances, we purchase from the member a put option that enables us to terminate an advance if interest rates increase. We may hedge a putable advance by entering into a cancelable derivative with a counterparty, pursuant to which we pay a fixed rate and receive a variable rate. This is treated as a fair value hedge under SFAS 133. The derivative counterparty may cancel the derivative on the put date, which would normally occur in a rising rate environment, and we would, in turn, terminate the advance.
We also offer our members capped advances, or variable-rate advances with a maximum interest rate. To protect us against unfavorable changes in interest rates, when we make a capped advance, we typically purchase an offsetting interest-rate cap from a broker. This is treated as a fair value hedge under SFAS 133.
• Mortgage Loans Held For Portfolio • To enable us to lower our overall interest-rate risk profile and reduce our operating cost structure, including costs associated with managing risks related to our mortgage loans held for portfolio, we are exiting the MPP.
We have historically invested in fixed-rate mortgage loans. The prepayment options embedded in mortgage loans can result in extensions or contractions in the expected repayment of these assets, depending on changes in estimated prepayment speeds. We attempt to manage the interest-rate and prepayment risk associated with mortgage loans through debt issuance. We issue both callable and non-callable debt to attempt to achieve cash flow patterns and liability durations similar to those expected on the mortgage loans. We may also purchase interest-rate exchange agreements to manage the prepayment risk embedded in the mortgage loans. Although
142
Federal Home Loan Bank of Seattle
Notes to Financial Statements—(Continued)
these derivatives are valid economic hedges against the prepayment risk of the mortgage loans, they are not specifically linked to individual mortgage loans, and we account for these derivatives as freestanding pursuant to SFAS 133.
Historically, we received pair-off fees at closing of a mortgage delivery contract only when the amount of mortgage loans actually funded was less than 99% of the delivery commitment amount. We classified such pair-off fees in “other income.” Pair-off fees received for non-delivery of mortgage loans were $13,000 and $54,000 for 2005 and 2004.
• Investments • We invest in U.S. agency obligations, mortgage-backed securities, and the taxable portion of state or local housing finance agency obligations. The interest rate and prepayment risk associated with these investment securities is managed through a combination of debt issuance and derivatives. We may manage the prepayment and interest-rate risk by funding investment securities with consolidated obligations that have call features or by hedging the prepayment risk with caps or floors, callable swaps, or swaptions. These investment securities may be classified as held-to-maturity, available-for-sale or trading securities.
We may also manage the risk arising from changing market prices or cash flows of investment securities classified as trading by entering into derivatives (economic hedges) that offset the changes in fair value or cash flows of the securities. The market value changes of both the trading securities and the associated derivatives are included in other income in the Statement of Income and presented as part of the “Net gain (loss) on trading securities” and “Net gain (loss) on derivatives and hedging activities.”
• Managing Credit Risk on Derivatives •We are subject to credit risk due to the risk of nonperformance by counterparties to the derivative agreements. The degree of counterparty risk depends on the extent to which master netting arrangements are included in such contracts to mitigate the risk. We manage counterparty credit risk through credit analysis, collateral requirements and adherence to the requirements set forth in FHLBank policies and Finance Board regulations. Based on credit analyses and collateral requirements, our management does not anticipate any credit losses on its derivative agreements.
The contractual or notional amount of derivatives reflects our involvement in the various classes of financial instruments. The notional amount of derivatives does not measure our credit risk exposure and our maximum credit exposure is substantially less than the notional amount. We require collateral agreements on all derivatives that establish collateral thresholds. The maximum credit risk is the estimated cost of replacing interest-rate swaps, forward agreements, mandatory delivery contracts for mortgage loans, and purchased caps and floors that have a net positive market value, assuming the counterparty defaults and the related collateral, if any is of no value to us.
Our maximum credit risk, as defined above, was approximately $146.9 million and, $4.5 million as of December 31, 2006 and 2005. These totals included $187.9 million and $4.5 million of net accrued interest receivable. In determining maximum credit risk, we consider accrued interest receivables and payables, and the legal right to offset derivative assets and liabilities by counterparty. We held securities and cash from our counterparties with a fair value of $13.4 million as collateral as of December 31, 2006. We held no securities or cash as collateral from our counterparties as of December 31, 2005.
Additionally, collateral with respect to derivatives with member institutions includes collateral assigned to us as evidenced by a written security agreement and held by the member institution for our benefit.
We transact most of our derivatives with large banks and major broker-dealers. Some of these banks and broker-dealers or their affiliates buy, sell, and distribute consolidated obligations. Note 16 discusses assets pledged by us to these counterparties.
143
Federal Home Loan Bank of Seattle
Notes to Financial Statements—(Continued)
• Intermediation •We are not a derivatives dealer, and we do not trade derivatives for short-term profit; however, we may act as an intermediary between members and counterparties by entering into offsetting interest-rate exchange agreements. The notional amounts and settlement, interest payment, and maturity dates are identical in the offsetting interest-rate exchange agreements. Although we discontinued offering member swaps as a standard product in mid-2004, we will continue to maintain the existing transactions through maturity. The derivatives used in intermediary swaps do not qualify for hedge accounting treatment, and the fair value adjustments are recorded separately through current period earnings. The net result of the accounting for these derivatives does not significantly affect our operating results. These amounts are recorded in other income as “net realized and unrealized gain (loss) on derivatives and hedging activities.”
The following tables summarize the notional amounts of member intermediary swap transactions and gain (loss) on member intermediary swap transactions.
| | | | | | | | |
Notional Amounts of Member Intermediary Swap Transactions | | As of
December 31,
2006 | | | As of
December 31,
2005 | |
| (dollars in thousands) | | | |
Notional amount | | | | | | | | |
Member swaps | | $ | 55,500 | | | $ | 60,500 | |
Offsetting counterparty swaps | | | 55,500 | | | | 60,500 | |
| | | | | | | | |
Total notional amount | | $ | 111,000 | | | $ | 121,000 | |
| | | | | | | | |
| | |
Gain (loss) on Member Intermediary Swap Transactions | | As of
December 31,
2006 | | | As of
December 31,
2005 | |
| (dollars in thousands) | | | |
Gain (loss) | | | | | | | | |
Member swaps | | $ | 13 | | | $ | 394 | |
Offsetting counterparty swaps | | | (3 | ) | | | (509 | ) |
| | | | | | | | |
Total gain (loss) | | $ | 10 | | | $ | (115 | ) |
| | | | | | | | |
We may enter into interest-rate exchange agreements to offset the economic effect of other derivatives that are no longer designated in a hedge transaction of one or more advances, investments, or consolidated obligations. In these intermediary transactions, maturity dates, call dates, and fixed interest rates match, as do the notional amounts on the de-designated portion of the interest-rate exchange agreement and the intermediary derivative.
The following tables summarize the notional amounts and gains (losses) on intermediary swap transactions to offset derivatives that are no longer designated in a hedge transaction.
| | | | | | |
Notional Amounts No Longer Designated in Hedge Transactions | | As of
December 31,
2006 | | As of
December 31,
2005 |
| (dollars in thousands) | | |
Notional amount on | | | | | | |
De-designated swaps | | $ | 247,250 | | $ | 326,000 |
Offsetting counterparty swaps | | | 247,250 | | | 325,800 |
| | | | | | |
Total notional amount | | $ | 494,500 | | $ | 651,800 |
| | | | | | |
144
Federal Home Loan Bank of Seattle
Notes to Financial Statements—(Continued)
| | | | | | | | |
Gain on Amounts No Longer Designated in Hedge Transactions | | As of
December
31, 2006 | | | As of
December
31, 2005 | |
| (dollars in thousands) | | | |
Gain (loss) on | | | | | | | | |
De-designated swaps | | $ | (4,885 | ) | | $ | (5,746 | ) |
Offsetting counterparty swaps | | | 4,885 | | | | 5,753 | |
| | | | | | | | |
Total gain | | $ | | | | $ | 7 | |
| | | | | | | | |
•Fair Values of Bifurcated Derivatives • We had $193,000 of bifurcated derivatives related to non-callable bonds as of December 31, 2006. We had no such bifurcated derivatives as of December 31, 2005.
Note 17—Estimated Fair Values
We have determined the fair value estimates using available market information and our best judgment of approximate valuation methods. These estimates are based on pertinent information available to us as of December 31, 2006 and 2005. Although we use our best judgment in estimating the fair value of these financial instruments, there are inherent limitations in any estimation technique or valuation methodology. For example, because an active secondary market does not exist for a portion of our financial instruments, in certain cases fair values are not subject to precise quantification or verification and may change as economic and market factors and evaluation of those factors change. Therefore, these estimated fair values are not necessarily indicative of the amounts that would be realized in current market transactions. The fair value summary tables below do not represent an estimate of the overall market value of the Seattle Bank as a going concern, which would take into account, among other things, future business opportunities.
•Cash and Due From Banks •The estimated fair value approximates the recorded book value.
• Interest-Bearing Deposits and Investment Securities • The estimated fair value is determined based on quoted prices, excluding accrued interest, as of the last business day of the year. When quoted prices are not available, the estimated fair value is determined by calculating the present value of the expected future cash flows and reducing the amount for accrued interest receivable.
• Securities Purchased Under Agreements to Resell and Securities Sold Under Agreements to Repurchase •The estimated fair value approximates recorded book value.
• Federal Funds Sold • The estimated fair value is determined by calculating the present value of the expected future cash flows. The discount rates used in these calculations are the rates for Federal funds with similar terms.
• Advances and Other Loans • We determine the estimated fair value of advances with fixed rates by calculating the present value of expected future cash flows from the advances and excluding the amount of the accrued interest receivable. The discount rates used in these calculations are the consolidated obligation rates for instruments with similar terms as of the last business day of the year. Under the Finance Board’s advances regulations, advances with a maturity and repricing period greater than six months require a prepayment fee sufficient to make us financially indifferent to the borrower’s decision to prepay the advances. Therefore, the estimated fair value of advances does not assume prepayment risk. We determine the estimated fair value of advances with variable rates using LIBOR rates as the discount factor.
145
Federal Home Loan Bank of Seattle
Notes to Financial Statements—(Continued)
• Mortgage Loans Held for Portfolio • The estimated fair values for mortgage loans are determined based on quoted market prices from an independent source of similar mortgage loans. These prices, however, can change rapidly based upon market conditions and are highly dependent upon the underlying prepayment assumptions.
•Accrued Interest Receivable and Payable • The estimated fair value is the recorded book value.
• Derivative Assets and Liabilities • We base the estimated fair values of interest-rate exchange agreements on instruments with similar terms or available market prices including accrued interest receivable and payable. However, active markets do not exist for many types of financial instruments. Consequently, fair values for these instruments must be estimated using techniques such as discounted cash flow analysis and comparisons to similar instruments. Estimates developed using these methods are highly subjective and require judgments regarding significant matters such as the amount and timing of future cash flows and the selection of discount rates that appropriately reflect market and credit risks. Changes in these judgments often have a material effect on the fair value estimates. Because these estimates are made as of a specific point in time, they are susceptible to material near-term changes. The fair values are netted by counterparty where such legal right exists. If these netted amounts are positive, they are classified as an asset and if negative, a liability.
• Deposits • We determine estimated fair values of member institutions’ deposits with fixed rates by calculating the present value of expected future cash flows from the deposits and reducing this amount for accrued interest payable. The discount rates used in these calculations are the cost of deposits with similar terms.
• Consolidated Obligations • We estimate fair values for consolidated obligations using quoted market prices from independent third-party sources.
• Mandatorily Redeemable Class B Stock •The fair value of Class B stock, formerly Class B(1) and B(2), stock subject to mandatory redemption generally approximates par value. Fair value also includes estimated dividends earned at the time of reclassification from equity to liabilities, until such amount is paid, and any subsequently declared stock dividend. Class B stock can only be acquired by members at par value and redeemed at par value (plus any declared but unpaid dividends). Class B stock is not traded and no market mechanism exists for the exchange of Class B stock outside our cooperative.
• Commitments • The estimated fair value of our commitments to extend credit, is determined using the fees currently charged to enter into similar agreements, taking into account the remaining terms of the agreements and the present creditworthiness of the counterparties. The estimated fair value of standby letters of credit is based on the present value of fees currently charged for similar agreements or on the estimated cost to terminate them or otherwise settle the obligations with the counterparties.
146
Federal Home Loan Bank of Seattle
Notes to Financial Statements—(Continued)
The following tables summarize the carrying values and estimated fair values of our financial instruments as of December 31, 2006 and 2005.
| | | | | | | | | | | | |
As of December 31, 2006 | | Carrying Value | | | Net Unrealized Gains (Losses) | | | Estimated Fair
Value | |
| (dollars in thousands) | | | |
Financial Assets | | | | | | | | | | | | |
Cash and due from banks | | $ | 1,119 | | | $ | | | | $ | 1,119 | |
Interest-bearing deposits | | | 2,165,000 | | | | (35 | ) | | | 2,164,965 | |
Federal funds sold | | | 2,832,000 | | | | (12 | ) | | | 2,831,988 | |
Held-to-maturity securities | | | 13,687,909 | | | | (213,788 | ) | | | 13,474,121 | |
Advances | | | 27,960,994 | | | | 41,687 | | | | 28,002,681 | |
Mortgage loans held for portfolio | | | 6,366,648 | | | | (195,971 | ) | | | 6,170,677 | |
Accrued interest receivable | | | 323,342 | | | | | | | | 323,342 | |
Derivative assets | | | 146,900 | | | | | | | | 146,900 | |
| | | | | | | | | | | | |
Total Financial Assets | | $ | 53,483,912 | | | | | | | $ | 53,115,793 | |
| | | | | | | | | | | | |
Financial Liabilities | | | | | | | | | | | | |
Deposits | | $ | (1,003,960 | ) | | | 12 | | | $ | (1,003,948 | ) |
Consolidated obligations: | | | | | | | | | | | | |
Discount notes | | | (1,495,861 | ) | | | 541 | | | | (1,495,320 | ) |
Bonds | | | (48,040,715 | ) | | | 122,595 | | | | (47,918,120 | ) |
Mandatorily redeemable Class B stock | | | (69,222 | ) | | | | | | | (69,222 | ) |
Accrued interest payable | | | (567,585 | ) | | | | | | | (567,585 | ) |
Derivative liabilities | | | (46,846 | ) | | | | | | | (46,846 | ) |
Other liabilities | | | (59,252 | ) | | | | | | | (59,252 | ) |
| | | | | | | | | | | | |
Total Financial Liabilities | | $ | (51,283,441 | ) | | | | | | $ | (51,160,293 | ) |
| | | | | | | | | | | | |
Other | | | | | | | | | | | | |
Commitments to extend credit for advances | | $ | (1,020 | ) | | | | | | $ | (1,020 | ) |
Commitments to issue consolidated obligation bonds | | | | | | $ | 296 | | | | 296 | |
147
Federal Home Loan Bank of Seattle
Notes to Financial Statements—(Continued)
| | | | | | | | | | | | |
| | | |
As of December 31, 2005 | | Carrying Value | | | Net Unrealized Gains (Losses) | | | Estimated Fair Value | |
| (dollars in thousands) | | | |
Assets | | | | | | | | | | | | |
Cash and due from banks | | $ | 4,124 | | | $ | | | | $ | 4,124 | |
Interest-bearing deposits | | | 1,430,367 | | | | 15 | | | | 1,430,382 | |
Securities purchased under agreements to resell | | | 850,000 | | | | | | | | 850,000 | |
Federal funds sold | | | 6,428,000 | | | | (45 | ) | | | 6,427,955 | |
Held-to-maturity securities | | | 14,877,594 | | | | (292,895 | ) | | | 14,584,699 | |
Advances | | | 21,435,492 | | | | 28,051 | | | | 21,463,543 | |
Mortgage loans held for portfolio | | | 7,215,607 | | | | (190,257 | ) | | | 7,025,350 | |
Accrued interest receivable | | | 250,943 | | | | | | | | 250,943 | |
Derivative assets | | | 13,205 | | | | | | | | 13,205 | |
| | | | | | | | | | | | |
Total Financial Assets | | $ | 52,505,332 | | | | | | | $ | 52,050,201 | |
| | | | | | | | | | | | |
Liabilities | | | | | | | | | | | | |
Deposits | | $ | (800,820 | ) | | | 21 | | | $ | (800,799 | ) |
Securities sold under agreement to purchase | | | (393,500 | ) | | | | | | | (393,500 | ) |
Consolidated obligations: | | | | | | | | | | | | |
Discount notes | | | (10,620,951 | ) | | | 2,843 | | | | (10,618,108 | ) |
Bonds | | | (37,881,557 | ) | | | 89,187 | | | | (37,792,370 | ) |
Mandatorily redeemable Class B stock | | | (66,259 | ) | | | | | | | (66,259 | ) |
Accrued interest payable | | | (377,236 | ) | | | | | | | (377,236 | ) |
Derivative liabilities | | | (133,765 | ) | | | | | | | (133,765 | ) |
Other liabilities | | | (66,189 | ) | | | | | | | (66,189 | ) |
| | | | | | | | | | | | |
Total Financial Liabilities | | $ | (50,340,277 | ) | | | | | | $ | (50,248,226 | ) |
| | | | | | | | | | | | |
Other | | | | | | | | | | | | |
Commitments to extend credit for advances | | $ | (1,027 | ) | | | | | | $ | (1,027 | ) |
Commitments to issue consolidated obligation bonds | | | | | | $ | 77 | | | | 77 | |
Note 18—Commitments and Contingencies
As described in Note 13, as provided by the FHLB Act or Finance Board regulation, consolidated obligations are backed only by the financial resources of the FHLBanks. The joint and several liability regulation of the Finance Board authorizes the Finance Board to require any FHLBank to repay all or a portion of the principal and interest on consolidated obligations for which another FHLBank is the primary obligor. No FHLBank has had to assume or pay the consolidated obligation of another FHLBank.
We considered the guidance under FASB interpretation No. 45,Guarantor’s Accounting and Disclosure Requirements for Guarantees, Including Indirect Guarantees of Indebtedness of Others-an interpretation of FASB Statements No. 5, 57, and 107 and rescission of FASB Interpretation No. 34, or FIN 45, and determined it was not necessary to recognize the fair value of the FHLBank’s joint and several liability for all of the consolidated obligations. The joint and several obligations are mandated by Finance Board regulations and are not the result of arms-length transactions among the FHLBanks. We have no control over the amount of the guaranty or the determination of how each FHLBank would perform under the joint and several obligation. Because the FHLBanks are subject to the authority of the Finance Board as it relates to decisions involving the allocation of the joint and several liability for the FHLBank’s consolidated obligations, an FHLBank’s joint and several obligation is excluded from the initial recognition and measurement provisions of FIN 45. Accordingly,
148
Federal Home Loan Bank of Seattle
Notes to Financial Statements—(Continued)
we have not recognized a liability for our joint and several obligation related to other FHLBanks’ consolidated obligations as of December 31, 2006 and 2005. The par amounts of all the FHLBanks’ outstanding consolidated obligations for which we are jointly and severally liable, net of interbank holdings, were approximately $947.3 billion and $931.7 billion as of December 31, 2006 and 2005.
Commitments that legally bind and unconditionally obligate us for additional advances totaled $46.2 million and $37.8 million as of December 31, 2006 and 2005. Commitments generally are for periods up to 12 months. Standby letters of credit are executed for members for a fee. A standby letter of credit is a short-term financing arrangement between the FHLBank and its member. If the FHLBank is required to make payment for a beneficiary’s draw, these amounts are converted into a collateralized advance to the member.
The following table summarizes our outstanding letters of credit as of December 31, 2006 and 2005.
| | | | |
Outstanding Letters of Credit | | As of December 31, 2006 | | As of
December 31, 2005 |
| (dollars in thousands, except years) | | |
Outstanding notional | | $135.6 | | $109.9 |
Original terms | | one month to 15
years | | one month to 15
years |
Final expiration year | | 2015 | | 2015 |
Unearned fees for standby letter of credit transactions prior to 2003, as well as the fair value of the guarantees related to standby letters of credit entered into after 2002, are recorded in other liabilities and were $88,000 and $75,000 as of December 31, 2006 and 2005. Based on our credit analyses and collateral requirements, we did not consider it necessary to have any provision for credit losses on these commitments. Commitments are fully collateralized at the time of issuance (see Note 7). The estimated fair value of commitments as of December 31, 2006 and 2005 is reported in Note 17.
We have entered into a standby bond purchase agreement with one state housing authority, whereby for a fee, we agree to purchase and hold the authority’s bonds until the designated marketing agent can find a suitable investor or the housing authority repurchases the bond according to a schedule established by the standby agreement. The standby agreement dictates the specific terms that would require us to purchase the bond. The bond purchase commitment entered into by us expires in May 2008. Total commitments for the bond purchase were $68.9 million and $75.6 million as of December 31, 2006 and 2005. During 2006 and 2005, we were not required to purchase any bonds under this agreement. The estimated fair value of our standby bond purchase agreements as of December 31, 2006 and 2005 is reported in Note 17.
Since we made the decision to exit the MPP business during mid-year 2005, we have no commitments that unconditionally obligate us to purchase mortgage loans as of December 31, 2006 and 2005. Mortgage purchase commitments were generally for periods not to exceed 90 days and were recorded as derivatives at their fair values.
We generally execute derivatives with major banks and broker-dealers and enter into master agreements containing specific bilateral collateral requirements based upon applicable counter-party credit ratings and dollar thresholds. As of December 31, 2006, we had no cash or securities pledged as collateral that could be sold or repledged to broker-dealers. As of December 31, 2005, we had cash pledged as such collateral, with a carrying value of $15.4 million, which could not be sold or repledged.
149
Federal Home Loan Bank of Seattle
Notes to Financial Statements—(Continued)
We charged to operating expenses net rental costs of $2.8 million, $4.2 million, and $2.3 million for the years ended December 31, 2006, 2005, and 2004. During 2005, we recognized $5.4 million of impairment costs related to the abandonment of certain portions of our leased premises and in 2006, we subsequently recognized a $1.0 million lease impairment recovery due to increased commercial lease rates. During the latter part of 2006, we signed a sublease agreement for a floor of space no longer used due to our 2005 office space consolidation and reduction of staff. The following table summarizes our future lease commitments as of December 31, 2006.
| | | |
Future Minimum Lease Commitments | | Minimum
Commitment |
| (dollars in thousands) | | |
2007 | | $ | 2,373 |
2008 | | | 2,821 |
2009 | | | 2,929 |
2010 | | | 2,997 |
2011 | | | 3,112 |
Thereafter | | | 4,213 |
| | | |
Total | | $ | 18,445 |
| | | |
Lease agreements for our premises generally provide for increases in the basic rentals resulting from increases in property taxes and maintenance expenses. Such increases are not expected to have a material effect on us.
As of December 31, 2006 and 2005, there were no investments that had been traded but not settled. We entered into agreements to issue $850.0 million and $80.0 million par value of consolidated obligation bonds as of December 31, 2006 and 2005. We had no agreements outstanding to issue consolidated obligation discount notes as of December 31, 2006 and 2005. We had traded and unsettled derivative notional value balances of $850.0 million and $85.0 million as of December 31, 2006 and 2005.
Effective July 20, 2006, the FHLBanks entered into the Federal Home Loan Banks P&I Funding and Contingency Plan Agreement, or the Contingency Agreement. The FHLBanks and the Office of Finance entered into the Contingency Agreement in response to the Board of Governors of the Federal Reserve System revising its Policy Statement on Payments System Risk concerning the disbursement by the Federal Reserve Banks of interest and principal payments on securities issued by GSEs, such as the FHLBanks. Under the Contingency Agreement, in the event that one or more FHLBanks does not fund its principal and interest payments under a consolidated obligation by deadlines agreed upon by the FHLBanks, the other FHLBanks will be responsible for those payments in a manner as described in the Contingency Agreement. We have not funded any consolidated obligation principal and interest payments under the Contingency Agreement.
Other Developments
We are subject to legal proceedings arising in the normal course of business. After consultation with legal counsel, management does not anticipate that the ultimate liability, if any, arising out of these matters will have a material effect on our financial condition or results of operations.
Note 19—Transactions with Related Parties and Other FHLBanks
• Transactions with Members • We are a cooperative whose members own our capital stock and may receive dividends on their investments in our stock. In addition, certain former members that have outstanding transactions with us, such as advances, are also required to maintain their investment in our capital stock until the transactions mature or are paid off and the capital stock is redeemed. Virtually all our advances are issued to
150
Federal Home Loan Bank of Seattle
Notes to Financial Statements—(Continued)
members, and all mortgage loans held for portfolio have been purchased from members. We also maintain demand deposit accounts for members, primarily to facilitate settlement activities that are directly related to advances and mortgage loan purchases. Such transactions with members are entered into in the normal course of business. In instances where a member also has an officer who is a director of the Seattle Bank, transactions with such a member are subject to the same eligibility and credit criteria, as well as the same terms and conditions, as other similar transactions, although the Board of Directors has imposed certain restrictions on the repurchase of stock held by members who have officers on our board. For purposes of these financial statements, we define related parties as those members with Class B stock outstanding in excess of 10% of our total outstanding Class B stock and mandatorily redeemable Class B stock.
In addition, we have investments in federal funds sold, interest-bearing deposits, and mortgage-backed securities with members or their affiliates. All investments are transacted at market prices and mortgage-backed securities are purchased through securities brokers or dealers. In addition, in the past we have entered into offsetting interest-rate exchange agreements, acting as an intermediary between offsetting derivative transactions with members and other counterparties, although we discontinued offering this service as a standard product in mid-2004. These transactions were also executed at market rates.
For member transactions related to concentration associated with advances, see Note 7; mortgage loans held for portfolio and the sale of government-insured mortgage loans to an affiliate of one of our members, see Note 10; capital stock, see Note 14; and concentrations of investments in mortgage-backed securities issued by affiliates of our members, see Note 7.
The following tables set forth information with respect to the Seattle Bank’s transactions with the members and their affiliates and former members and their affiliates as of the dates indicated.
| | | | | | |
| | | As of
December 31,
2006 | | As of
December 31,
2005 |
| (dollars in thousands) | | | | |
Assets | | | | | | |
Cash | | $ | 356 | | $ | 511 |
Interest-bearing deposits | | | | | | 300,000 |
Federal funds sold | | | | | | 580,000 |
Held-to-maturity securities | | | 1,712,166 | | | 1,665,719 |
Advances* | | | 27,907,730 | | | 21,377,438 |
Mortgage loans held for portfolio | | | 6,361,091 | | | 7,215,404 |
Accrued interest receivable | | | 208,659 | | | 131,614 |
Derivative assets | | | 66,346 | | | 3,709 |
| | | | | | |
Total Assets | | $ | 36,256,348 | | $ | 31,274,395 |
| | | | | | |
Liabilities | | | | | | |
Deposits | | $ | 985,000 | | $ | 624,924 |
Mandatorily redeemable Class B stock | | | 59,269 | | | 58,779 |
Derivative liabilities | | | 116 | | | 9,260 |
| | | | | | |
Total liabilities | | $ | 1,044,385 | | $ | 692,963 |
| | | | | | |
Other | | | | | | |
Notional amount of derivatives | | $ | 10,154,274 | | $ | 2,998,857 |
Letters of credit | | $ | 135,627 | | $ | 109,934 |
| * | Includes the effect of associated derivatives with members or their affiliates. |
151
Federal Home Loan Bank of Seattle
Notes to Financial Statements—(Continued)
| | | | | | | | | | | | |
For the Years Ended December 31, | | 2006 | | | 2005 | | | 2004 | |
| (dollars in thousands) | | | |
Interest Income | | | | | | | | | | | | |
Advances* | | $ | 1,277,791 | | | $ | 720,472 | | | $ | 526,884 | |
Prepayment fees on advances | | | 608 | | | | 4,626 | | | | 954 | |
Interest-bearing deposits | | | 9,050 | | | | 2,797 | | | | 2,453 | |
Federal funds sold | | | 15,062 | | | | 5,820 | | | | 291 | |
Held-to-maturity securities | | | 91,695 | | | | 76,495 | | | | 66,329 | |
Mortgage loans held for portfolio | | | 353,568 | | | | 444,883 | | | | 553,134 | |
| | | | | | | | | | | | |
Total interest income | | | 1,747,774 | | | | 1,255,093 | | | | 1,150,045 | |
| | | | | | | | | | | | |
Interest Expense | | | | | | | | | | | | |
Deposits | | | 34,038 | | | | 26,434 | | | | 13,741 | |
Consolidated obligations* | | | 14,609 | | | | 1,111 | | | | (9,950 | ) |
Mandatorily redeemable Class B stock | | | 138 | | | | (3 | ) | | | 225 | |
| | | | | | | | | | | | |
Total interest expense | | | 48,785 | | | | 27,542 | | | | 4,016 | |
| | | | | | | | | | | | |
Net Interest Income | | $ | 1,698,989 | | | $ | 1,227,551 | | | $ | 1,146,029 | |
| | | | | | | | | | | | |
Other Income (Loss) | | | | | | | | | | | | |
Service fees | | | 1,691 | | | | 2,183 | | | | 2,266 | |
Net (loss) gain on derivatives and hedging activities | | | (22 | ) | | | 13,771 | | | | 2,236 | |
Other (loss) income | | | (6 | ) | | | 7,412 | | | | | |
| | | | | | | | | | | | |
Total other income | | $ | 1,663 | | | $ | 23,366 | | | $ | 4,502 | |
| | | | | | | | | | | | |
| * | Includes the effect of associated derivatives with members or their affiliates. |
• Transactions with Certain Members • The following tables set forth information at the dates and for the periods indicated with respect to transactions with (1) members and former members holding more than 10.0% of the outstanding shares of our capital stock at each respective period end, (2) members or former members with a representative serving on our Board of Directors at any time during the year ended on the respective dates or during the respective periods, and (3) affiliates of the foregoing members or former members.
| | | | | | |
As of December 31, | | 2006 | | 2005 |
| (dollars in thousands) | | |
Assets | | | | | | |
Cash | | $ | 356 | | $ | 511 |
Federal funds sold | | | | | | 280,000 |
Held-to-maturity securities | | | 366,799 | | | 514,015 |
Advances* | | | 18,923,425 | | | 13,453,796 |
Mortgage loans held for portfolio | | | 5,770,420 | | | 6,588,757 |
Accrued interest receivable | | | 163,115 | | | 93,930 |
Derivative assets | | | 12,106 | | | 3,709 |
| | | | | | |
Total Assets | | $ | 25,236,221 | | $ | 20,934,718 |
| | | | | | |
Liabilities | | | | | | |
Deposits | | | 33,412 | | | 22,700 |
Derivative liabilities | | | | | | |
| | | | | | |
Total liabilities | | $ | 33,412 | | $ | 22,700 |
| | | | | | |
Other | | | | | | |
Notional amount of derivatives | | $ | 808,650 | | $ | 565,900 |
Letters of credit | | $ | 10,594 | | $ | 12,056 |
| * | Includes the effect of associated derivatives with members or their affiliates. |
152
Federal Home Loan Bank of Seattle
Notes to Financial Statements—(Continued)
| | | | | | | | | | | |
For the Years Ended | | 2006 | | | 2005 | | 2004 | |
| (dollars in thousands) | | | |
Interest Income | | | | | | | | | | | |
Advances* | | $ | 760,205 | | | $ | 475,507 | | $ | 269,986 | |
Prepayment fees on advances | | | | | | | 1,835 | | | 262 | |
Federal funds sold | | | 7,663 | | | | 1,393 | | | 189 | |
Held to maturity securities | | | 21,755 | | | | 17,946 | | | 15,552 | |
Mortgage loans held for portfolio | | | 320,992 | | | | 401,673 | | | 483,923 | |
| | | | | | | | | | | |
Total interest income | | | 1,110,615 | | | | 898,354 | | | 769,912 | |
| | | | | | | | | | | |
Interest Expense | | | | | | | | | | | |
Deposits | | | 2,562 | | | | 863 | | | 632 | |
Consolidated obligations | | | 149 | | | | 397 | | | (1,108 | ) |
Mandatorily redeemable Class B stock | | | | | | | | | | 157 | |
| | | | | | | | | | | |
Total interest expense | | | 2,711 | | | | 1,260 | | | (319 | ) |
| | | | | | | | | | | |
Net Interest Income | | $ | 1,107,904 | | | $ | 897,094 | | $ | 770,231 | |
Other Income (Loss) | | | | | | | | | | | |
Net gain (loss) on derivatives and hedging activities | | $ | (11 | ) | | $ | 1,411 | | $ | 7,089 | |
Other income | | | 23 | | | | 7,169 | | | | |
| | | | | | | | | | | |
Total other income | | $ | 12 | | | $ | 8,580 | | $ | 7,089 | |
| | | | | | | | | | | |
| * | Includes the effect of associated derivatives with members or their affiliates. |
• Transactions with Other FHLBanks •Our transactions with other FHLBanks are identified on the face of our financial statements. See Note 13 for additional information on our investments in other FHLBanks’ consolidated obligation bonds and for debt transfers from other FHLBanks.
Note 20—Subsequent Events
•Termination of the Finance Board Agreement • On January 11, 2007, our regulator, the Finance Board, terminated the Written Agreement between the Seattle Bank and the Finance Board dated as of December 10, 2004. The Written Agreement imposed certain requirements on us relating to our risk management, capital structure, corporate governance, and Capital Plan. The Written Agreement had required us to, among other things:
| | • | | Develop a business plan (which we first implemented as our three-year business and capital management plan in May 2005 and which has since been updated) acceptable to the OS, that, among other things: (1) did not increase our market, credit, or operational risk profiles; (2) specified a minimum regulatory capital-to-assets ratio that was consistent with the business strategy presented in the business plan; and (3) established appropriate capital stock, retained earnings, and dividend policies; |
| | • | | Engage consultants to conduct independent reviews of our senior management and our Board’s oversight and of our risk management policies, procedures, and practices, and respond to any recommendations of the independent consultants; and, |
| | • | | Prohibit increases in our mortgage loan assets held for portfolio (i.e., purchases from our members through our mortgage purchase program, which we have been exiting since early 2005) by an amount in excess of 10% of the net book value of such assets as of November 18, 2004, which was $10.6 billion, unless the OS agreed otherwise. |
153
Federal Home Loan Bank of Seattle
Notes to Financial Statements—(Continued)
The termination of the Written Agreement will not affect:
| | • | | The indefinite suspension of our repurchase of any Class B stock except upon approval of the OS Director and first approved by our Board in May 2005 and updated in December 2006; and |
| | • | | dividend restrictions generally providing that dividend payments may not exceed 50.0% of year-to-date GAAP net income as approved by our Board in December 2006. |
• Board Approval Reduction of Minimum Capital-To-Assets Ratio •On January 26, 2007, our Board approved a reduction in the minimum capital-to-assets ratio from 4.25% to 4.05%.
We intend to continue to take action pursuant to our updated business plan.
154
Unaudited Supplementary Financial Data
Quarterly Financial Data
Quarterly supplementary financial data for each full quarter in the years ended December 31, 2006 and 2005 are included in the tables below:
| | | | | | | | | | | | | | | |
| | | 2006 Quarter Ended | |
Quarterly Financial Data | | December 31 | | | September 30 | | June 30 | | | March 31 | |
| (dollars in thousands, except per share data) | | | |
Interest income | | $ | 670,094 | | | $ | 664,038 | | $ | 619,045 | | | $ | 579,816 | |
Interest expense | | | 649,222 | | | | 641,799 | | | 605,395 | | | | 559,557 | |
| | | | | | | | | | | | | | | |
Net interest income | | | 20,872 | | | | 22,239 | | | 13,650 | | | | 20,259 | |
Non-interest income | | | (1,077 | ) | | | 314 | | | 1,131 | | | | 2,324 | |
Non-interest expense | | | 11,389 | | | | 10,128 | | | 11,413 | | | | 11,695 | |
Assessments | | | 2,241 | | | | 3,296 | | | 894 | | | | 2,883 | |
| | | | | | | | | | | | | | | |
Net income | | $ | 6,165 | | | $ | 9,129 | | $ | 2,474 | | | $ | 8,005 | |
| | | | | | | | | | | | | | | |
Dividends per share | | $ | 0.10 | | | | | | | | | | | | |
| |
| | | 2005 Quarter Ended | |
Quarterly Financial Data | | December 31 | | | September 30 | | June 30 | | | March 31 | |
| (dollars in thousands, except per share data) | | | |
Interest income | | $ | 544,294 | | | $ | 505,731 | | $ | 460,987 | | | $ | 449,907 | |
Interest expense | | | 529,092 | | | | 481,627 | | | 439,306 | | | | 414,104 | |
| | | | | | | | | | | | | | | |
Net interest income | | | 15,202 | | | | 24,104 | | | 21,681 | | | | 35,803 | |
Non-interest income | | | (7,250 | ) | | | 10,009 | | | (27,681 | ) | | | (2,862 | ) |
Non-interest expense | | | 20,386 | | | | 14,554 | | | 15,337 | | | | 16,217 | |
Assessments | | | (3,291 | ) | | | 5,268 | | | (5,634 | ) | | | 4,455 | |
| | | | | | | | | | | | | | | |
Net income | | $ | (9,143 | ) | | $ | 14,291 | | $ | (15,703 | ) | | $ | 12,269 | |
| | | | | | | | | | | | | | | |
Dividends per share | | | | | | | | | | | | | $ | 0.54 | |
Investment Securities
Supplementary financial data on our investment securities are included in the tables below.
Held-to-Maturity Securities
The tables below present the composition of our held-to-maturity securities by major security type as of December 31, 2006 and 2005, and the maturity yield as of December 31, 2006 and 2005.
| | | | | | |
| | | December 31, |
| | | 2006 | | 2005 |
| (dollars in thousands) | | |
Commercial paper | | $ | | | $ | 194,106 |
Other U.S. agency obligations | | | 146,298 | | | 221,671 |
Government-sponsored enterprises | | | 2,691,238 | | | 2,698,649 |
Other FHLBanks’ consolidated obligation bonds | | | 4,224,959 | | | 5,274,944 |
State or local housing agency obligations | | | 12,067 | | | 16,900 |
| | | | | | |
Subtotal | | | 7,074,562 | | | 8,406,270 |
Mortgage-backed securities | | | 6,613,347 | | | 6,471,324 |
| | | | | | |
Total | | $ | 13,687,909 | | $ | 14,877,594 |
| | | | | | |
155
| | | | | | | | | | | | |
| | | December 31, 2006 | | | December 31, 2005 | |
| | | Book Value | | Percent of
Yield | | | Book Value | | Percent
Yield | |
| (dollars in thousands) | | | |
Commercial Paper | | | | | | | | | | | | |
Within one year | | $ | | | | % | | $ | 194,106 | | 4.09 | % |
| | | | | | | | | | | | |
Total | | $ | | | | | | $ | 194,106 | | 4.09 | |
| | | | | | | | | | | | |
Other U.S. Agency Obligations | | | | | | | | | | | | |
Within one year | | $ | 15,000 | | 5.31 | | | $ | 22,918 | | 4.89 | |
After one but within five years | | | 75,758 | | 6.38 | | | | 31,851 | | 6.01 | |
After five but within 10 years | | | 702 | | 6.25 | | | | 98,540 | | 6.26 | |
After 10 years | �� | | 54,838 | | 5.95 | | | | 68,362 | | 6.51 | |
| | | | | | | | | | | | |
Total | | $ | 146,298 | | 6.11 | | | $ | 221,671 | | 6.16 | |
| | | | | | | | | | | | |
Government-Sponsored Enterprise Obligations | | | | | | | | | | | | |
Within one year | | $ | 1,802,899 | | 2.94 | | | $ | — | | | |
After one but within five years | | | 500,708 | | 3.36 | | | | 2,311,094 | | 3.08 | |
After five but within 10 years | | | 387,631 | | 6.05 | | | | 387,555 | | 6.05 | |
| | | | | | | | | | | | |
Total | | $ | 2,691,238 | | 3.47 | | | $ | 2,698,649 | | 3.51 | |
| | | | | | | | | | | | |
Other FHLBanks’ Consolidated Obligation Bonds | | | | | | | | | | | | |
Within one year | | $ | 1,700,000 | | 3.16 | | | $ | 1,000,000 | | 2.75 | |
After one but within five years | | | 2,524,959 | | 3.88 | | | | 4,274,944 | | 3.69 | |
| | | | | | | | | | | | |
Total | | $ | 4,224,959 | | 3.59 | | | $ | 5,274,944 | | 3.51 | |
| | | | | | | | | | | | |
State or Local Housing Agency Obligations | | | | | | | | | | | | |
After 10 years | | $ | 12,067 | | 6.18 | | | $ | 16,900 | | 6.12 | |
| | | | | | | | | | | | |
Total | | $ | 12,067 | | 6.18 | | | $ | 16,900 | | 6.12 | |
| | | | | | | | | | | | |
Mortgage-Backed Securities | | | | | | | | | | | | |
After one but within five years | | $ | 2,120 | | 6.23 | | | $ | 95 | | 9.92 | |
After five but within 10 years | | | 29,267 | | 4.72 | | | | 35,026 | | 4.83 | |
After 10 years | | | 6,581,960 | | 4.80 | | | | 6,436,203 | | 4.59 | |
| | | | | | | | | | | | |
Total | | $ | 6,613,347 | | 4.80 | % | | $ | 6,471,324 | | 4.59 | % |
| | | | | | | | | | | | |
Geographic Concentration of Mortgage Loans
The following table represents the top ten holdings by state as of December 31, 2006 and 2005, for mortgage loans purchased from members.
| | | | | | | | |
| | | As of December 31, 2006 | |
State | | Outstanding
balance | | Loan
count | | Percent
of total
loan
principal | |
| (dollars in thousands) | | | |
California | | $ | 1,590,340 | | 8,531 | | 25.1 | % |
Illinois | | | 467,965 | | 2,689 | | 7.4 | |
Washington | | | 407,797 | | 3,103 | | 6.4 | |
New York | | | 347,255 | | 1,896 | | 5.5 | |
Massachusetts | | | 323,251 | | 1,699 | | 5.1 | |
New Jersey | | | 246,551 | | 1,435 | | 3.9 | |
Florida | | | 202,842 | | 1,424 | | 3.2 | |
Colorado | | | 192,844 | | 1,123 | | 3.0 | |
Texas | | | 191,435 | | 1,390 | | 3.0 | |
Michigan | | | 185,822 | | 1,106 | | 2.9 | % |
156
| | | | | | | | |
| |
| | | As of December 31, 2005 | |
State | | Outstanding
balance | | Loan count | | Percent of
total loan principal | |
| (dollars in thousands) | | | |
California | | $ | 1,792,072 | | 9,451 | | 25.0 | % |
Illinois | | | 527,447 | | 2,979 | | 7.3 | |
Washington | | | 474,044 | | 3,508 | | 6.6 | |
New York | | | 383,091 | | 2,043 | | 5.3 | |
Massachusetts | | | 359,621 | | 1,846 | | 5.0 | |
New Jersey | | | 279,905 | | 1,587 | | 3.9 | |
Florida | | | 233,944 | | 1,620 | | 3.3 | |
Colorado | | | 218,859 | | 1,580 | | 3.1 | |
Texas | | | 218,838 | | 1,247 | | 3.1 | |
Michigan | | | 204,321 | | 1,197 | | 2.8 | |
The following table represents the geographic concentration of the total mortgage loan portfolio as of December 31, 2006 and 2005.
| | | | | | |
| | | December 31, | |
State | | 2006(1) | | | 2005(1) | |
| (in percentages) | | | |
Midwest(2) | | 16.4 | % | | 16.2 | % |
Northeast(3) | | 20.2 | | | 19.8 | |
Southeast(4) | | 14.1 | | | 14.4 | |
Southwest(5) | | 11.6 | | | 10.9 | |
West(6) | | 37.7 | | | 38.7 | |
| | | | | | |
Total | | 100.0 | % | | 100.0 | % |
| | | | | | |
| (1) | Percentage calculated based on the unpaid principal balance at the end of each period. |
| (2) | Midwest includes IA, IL, IN, MI, MN, ND, NE, OH, SD, and WI. |
| (3) | Northeast includes CT, DE, MA, ME, NH, NJ, NY, PA, PR, RI, VI, and VT. |
| (4) | Southeast includes AL, DC, FL, GA, KY, MD, MS, NC, SC, TN, VA, and WV. |
| (5) | Southwest includes AR, AZ, CO, KS, LA, MO, NM, OK, TX, and UT. |
| (6) | West includes AK, CA, GU, HI, ID, MT, NV, OR, WA, and WY. |
Maturities of Member Term Deposits
The table below represents our member term deposits over $100,000 categorized by time to maturity as of December 31, 2006 and 2005.
| | | | | | |
| | | December 31, |
| | | 2006 | | 2005 |
| (dollars in thousands) | | |
Within three months | | $ | 60,329 | | $ | 73,505 |
After three months but within six months | | | 1,925 | | | 5,903 |
After six months but within 12 months | | | 2,245 | | | 3,870 |
| | | | | | |
Total | | $ | 64,499 | | $ | 83,278 |
| | | | | | |
157
Short-Term Borrowings
Borrowings with original maturities of one year or less are considered short-term. The following is a summary of short-term borrowings as of December 31, 2006 and 2005.
| | | | | | | | |
| | | December 31, | |
| | | 2006 | | | 2005 | |
| (dollars in thousands) | | | |
Consolidated Obligation Discount Notes | | | | | | | | |
Outstanding balance at year-end | | $ | 1,495,861 | | | $ | 10,620,951 | |
Weighted-average interest rate at year-end | | | 4.86 | % | | | 3.95 | % |
Daily average outstanding balance for the year | | $ | 7,680,580 | | | $ | 7,940,115 | |
Weighted-average interest rate for the year | | | 4.79 | % | | | 3.40 | % |
Highest outstanding balance at any month-end | | $ | 11,788,351 | | | $ | 13,262,902 | |
| | |
Other Short-Term Borrowings | | | | | | | | |
Outstanding balance at year-end | | $ | | | | $ | 393,500 | |
Weighted-average interest rate at year-end | | | | | | | 4.34 | % |
Daily average outstanding balance for the year | | $ | 165,211 | | | $ | 544,639 | |
Weighted-average interest rate for the year | | | 4.70 | % | | | 2.79 | % |
ITEM 9. CHANGES IN AND DISAGREEMENTS WITH ACCOUNTANTS ON ACCOUNTING AND FINANCIAL DISCLOSURE
There were no changes in or disagreements with the Seattle Bank’s independent accountants on accounting and financial disclosures during the two most recent fiscal years.
ITEM 9A. CONTROLS AND PROCEDURES
Evaluation of Disclosure Controls and Procedures
The Seattle Bank’s senior management is responsible for establishing and maintaining a system of disclosure controls and procedures designed to ensure that information required to be disclosed by the Seattle Bank in the reports it files or submits under the Exchange Act is recorded, processed, summarized and reported within the time periods specified in the rules and forms of the SEC. The Seattle Bank’s disclosure controls and procedures include, without limitation, controls and procedures designed to ensure that information required to be disclosed by the Seattle Bank in the report it files or submits under the Exchange Act is accumulated and communicated to management, including the principal executive officer and principal financial officer, or persons performing similar functions, as appropriate, to allow timely decisions regarding required disclosure.
We have evaluated the effectiveness of the design and operation of our disclosure controls and procedures, with the participation of the chief executive officer and chief financial officer, as of December 31, 2006. Based upon that evaluation, the chief executive officer and chief financial officer have concluded that the Seattle Bank’s disclosure controls and procedures, as defined in Exchange Act Rule 13a-15(e) and 15d-15(e), were effective as of December 31, 2006.
Changes in Internal Control over Financial Reporting
A material weakness is a control deficiency, or combination of control deficiencies, that results in more than a remote likelihood that a material misstatement of the annual or interim financial statements will not be prevented or detected. As of December 31, 2005, our management concluded that we did not maintain effective control over the presentation and classification of certain cash flows in our Statement of Cash Flows. Specifically, in an initial draft of our Statement of Cash Flows for the year ended December 31, 2005, we did not properly classify: (1) the net proceeds from the December 2005 sale of our trading security as an operating
158
activity, (2) the unrealized market value loss related to our September 2005 reclassification of mortgage loans from loans held for sale to loans held for portfolio on the correct caption within operating activities, and (3) payments for concession fees relating to the issuance of consolidated obligations as a financing activity. This control deficiency could have allowed a material misstatement to occur among the cash flow activities that comprise the Statements of Cash Flows in our annual or interim financial statements. Accordingly, as of December 31, 2005, our management determined this control deficiency constituted a material weakness in our internal control over financial reporting.
To address this previously reported material weakness in our internal control over financial reporting, we made certain changes to reinforce U.S. GAAP guidance and improve the accuracy and completeness of our reporting our cash flow activities in our Statements of Cash Flows during the fourth quarter of 2006. Specifically, the following enhanced or remediated control activities were determined by management to have operated effectively during the fourth quarter of 2006:
| | • | | We implemented a supplemental procedure involving the review of all existing U.S. GAAP authoritative guidance and any new guidance released during the current month, as documented in the form of a memorandum required in order to close the general ledger. This procedure identifies when changes to financial statement classification must be made as a result of new authoritative U.S. GAAP guidance. |
| | • | | We document all new and unusual transactions, such as selling a trading security or reclassifying mortgage loans, and we evaluate such transactions’ impact on and proper classification in the statement of condition, the statement of income, and the statement of cash flows, using the appropriate U.S. GAAP guidance. |
| | • | | We implemented a checklist procedure, which is completed by both the preparer and reviewer prior to completing our financial statements. The completed checklist, which becomes part of the internal controls documentation, includes balancing steps, analytical reviews, and reviews for proper account classification according to existing or new U.S. GAAP guidance or changes to data on the general ledger system. |
We believe that the above enhanced or remediated control activities provided us with the basis to conclude that the previously reported material weakness in our internal control over financial reporting no longer existed as of December 31, 2006.
Except for the remediation of the previously reported material weakness discussed above, there was no change in our internal control over financial reporting during the quarter ended December 31, 2006, that materially affected, or is reasonably likely to materially affect, our internal control over financial reporting.
ITEM 9B. OTHER INFORMATION
None.
159
PART III.
ITEM 10. DIRECTORS, EXECUTIVE OFFICERS AND CORPORATE GOVERNANCE
Corporate Governance
Board of Directors
The Seattle Bank’s Board is comprised of directors appointed by the Finance Board and directors elected by the members. Eligibility for appointment or election to the Board and continuing service on the Board are determined by Finance Board regulations. Each director must be a citizen of the United States. Each appointed director must be a bona fide resident of the Seattle Bank’s district, and each elected director must be an officer or director of a member of the Seattle Bank. The term for each directorship is three years, and elected directors are subject to limits on the number of consecutive terms they may serve, in so far as an elected director who has served three consecutive full terms on the Board is not eligible for election to a term that begins earlier than two years after the expiration of the third consecutive term. An appointed director may not serve as an officer of any FHLBank or as a director or officer of any member of the Seattle Bank. Appointed directors may not hold any financial interest in a member of the Seattle Bank. At least two appointed directors are required to come from organizations with more than a two-year history of representing consumer or community interests in banking services, credit needs, housing, or financial consumer protection.
The FHLBank Act provides that a board of at least 14 directors will govern each FHLBank, and the Finance Board determines the total number of directors each FHLBank will have. The Finance Board has determined that the Seattle Bank should have 18 directors. Historically, the Finance Board has appointed eight of our directors, and ten of our directors have been elected by our members. Currently, we have 12 directors, two of whom were appointed by the Finance Board and ten of whom were elected by our members. Each of the elected director positions is allocated to a specific state in our district, and the members in that state elect the director who fills that position, except that our Board is responsible for filling interim vacancies. Of our ten elected director positions, three are allocated to Washington, and one is allocated to each of the other states in our district (including, in the case of Hawaii, certain U.S. territories).
We hold elections each year for the elected director positions that will become vacant at year end. As a part of the election process, we solicit nominations from our eligible members in the relevant states. Members located in the relevant states as of the record date are eligible to participate in the election for the state in which their principal place of business is located. For each elected director position to be filled, an eligible member may cast one vote for each share of capital stock it was required to hold as of the record date (according to the requirements of our Capital Plan), except that an eligible member’s votes for each director position to be filled may not exceed the average number of shares of capital stock required to be held by all of the members in that state as of the record date. In the case of an election to fill more than one elected director position for a state, an eligible member may not cumulate its votes.
To date, the Finance Board has not appointed directors to fill six vacant appointed director positions on our Board for terms that would otherwise have begun on January 1, 2005 and January 1, 2006. Our two current appointed directors were each reappointed as of January 1, 2007 to fill the last year of three-year terms that would otherwise have begun on January 1, 2004, and their current terms will expire on December 31, 2007. The Finance Board has indicated that it plans to fill the six vacant appointed director positions during 2007.
On March 27, 2007, the Finance Board adopted a final rule establishing procedures for the appointment of directors to the boards of the FHLBanks. The final rule will be effective upon publication in the Federal Register. Under the interim final rule, the FHLBanks are responsible for identifying potential directors, conducting a preliminary assessment of their eligibility and qualifications, and sending to the Finance Board for its consideration a list containing up to twice as many nominations as that FHLBank has appointed director vacancies. Each nomination must be accompanied by an application that demonstrates the qualifications of the nominee to serve on the Board. The Finance Board will review each nomination and decide whether to appoint directors from the submitted list of nominees. The Finance Board may require us to submit additional nominees
160
for consideration. The rule requires us to submit a list of nominees to the Finance Board with respect to our six current vacancies by March 31, 2007 although we would be permitted to request an extension. Our Board of Directors intends to submit a list of nominees to the Finance Board on March 30, 2007. However, we cannot predict when the Finance Board will complete the appointment of directors to these vacancies.
Because of our cooperative ownership structure, elected directors represent institutions that have a direct financial interest in the Seattle Bank. At times, individual directors are required to exclude themselves from certain decisions in which there is an actual or perceived conflict of interest due to their employment with a member or their relationship to an entity applying for funding. The Board has adopted a code of ethics for the Seattle Bank’s employees, including the chief executive officer, chief financial officer, controller, and individuals performing similar functions, which establishes conduct standards and policies to promote an honest and ethical work environment. This code of ethics is available on the Seattle Bank’s website atwww.fhlbsea.com/ourcompany/corporategovernance/.
Committees of the Board of Directors
The Board has four core committees: the Audit and Compliance Committee, the Executive Committee, the Financial Operations and Affordable Housing Committee, or the FOAH Committee, and the Governance, Budget and Compensation Committee, or the GBC Committee. The Board may establish other committees from time to time to assist it in the discharge of its responsibilities. Below is a general description of the primary responsibilities of the Seattle Bank’s core committees. More detailed descriptions of the function of each committee are set forth in each committee’s charter.
Audit and Compliance Committee
The Audit and Compliance Committee is comprised of Craig E. Dahl (chair), William V. Humphreys (vice chair), Michael A. DeVico, Russell J. Lau, Park Price, Donald V. Rhodes, Jack T. Riggs, and Gordon Zimmerman. The purpose of the Audit and Compliance Committee is to oversee: (i) the integrity and adequacy of our financial reporting; (ii) the establishment of an effective administrative, operating, and internal accounting control system; (iii) our compliance with legal and regulatory requirements; (iv) the independent auditor’s qualifications and independence; (v) the performance and effectiveness of our internal audit function and independent auditors; and (vi) our compliance with internal policies and procedures.
Finance Board regulations govern the composition of the Audit and Compliance Committee, requiring that there be at least five members drawn from the Board and that at least one committee member have extensive accounting or related financial management experience. All members of the Audit and Compliance Committee must be independent, as defined by Finance Board regulations. The Audit and Compliance Committee is in compliance with these requirements. See “Item 13. Certain Relationships and Related Transactions, and Director Independence—Director Independence and Compliance Committee Financial Expert,” for information relating to the audit committee financial expert and director independence.
Executive Committee
The Executive Committee is comprised of Mike C. Daly (chair), Craig E. Dahl (vice chair), Daniel R. Fauske, Russell J. Lau, and William A. Longbrake. The primary purposes of the Executive Committee are to: (i) act on behalf of the Board during intervals between board meetings; (ii) oversee president and chief executive officer succession planning; and (iii) address compensation matters related to the president and chief executive officer, including setting base pay, establishing performance goals, and recommending incentive awards.
Financial Operations and Affordable Housing Committee
The FOAH Committee is comprised of Russell J. Lau (chair), Harold B. Gilkey (vice chair), Michael A. DeVico, Daniel R. Fauske, William A. Longbrake, Park Price, and Gordon Zimmerman. The purpose of the
161
FOAH Committee is to provide oversight of the Seattle Bank’s financial and risk management activities, information technology infrastructure, and community investment funding and compliance. The FOAH Committee: (i) recommends policies to the Board on financial and risk management issues, including capital, investments, market risk management, and credit-risk management, and monitors compliance with such policies; (ii) evaluates and reports to the Board on the Seattle Bank’s financial strategies and current and expected financial performance; (iii) provides oversight on issues related to capital management, including the Capital Plan and dividend payments on capital stock; and (iv) oversees product pricing and establishes the parameters within which our staff can make day-to-day pricing decisions for advances, member derivatives, and deposits. The FOAH Committee has a standing AHP subcommittee, comprised of Daniel R. Fauske (chair), Russell J. Lau, and Park Price. The AHP subcommittee is responsible for acting as a liaison between the Seattle Bank’s Affordable Housing Advisory Council, the FOAH Committee, the Board, and management with respect to the AHP and our community investment products and services.
Governance, Budget and Compensation Committee
The GBC Committee is comprised of William A. Longbrake (chair), Donald V. Rhodes (vice chair), Mike C. Daly, Daniel R. Fauske, Harold B. Gilkey, William V. Humphreys, and Jack T. Riggs. The purposes of the GBC Committee are to: (i) develop and maintain best practices in governing the Seattle Bank; (ii) coordinate the review, approval, and monitoring of our strategic business plan and annual operating and capital budgets; (iii) assist management in addressing legislative and regulatory issues; and (iv) provide oversight for compensation and benefit programs for the Seattle Bank. The GBC Committee also oversees the establishment and administration of our overall benefit and compensation programs as further described in “Item 11. Executive Compensation—Compensation Discussion and Analysis—Governance, Budget and Compensation Committee.”
Directors
Information regarding the current directors of the Seattle Bank as of the date indicated is provided below.
| | | | | | | | |
Name | | Age as of
March 30, 2007 | | Bank
Director
Since | | Expiration of
Term as Director | | Board Position and Core Committee Membership |
| | | | |
Mike C. Daly, Chairman | | 55 | | 2002 | | December 31, 2007 | | Chairman; Executive (Chair); Governance, Budget and Compensation |
| | | | |
Craig E. Dahl, Vice Chair | | 57 | | 2004 | | December 31, 2009 | | Vice Chair; Audit and Compliance (Chair); Executive (Vice Chair) |
| | | | |
Michael A. DeVico | | 46 | | 2007 | | December 31, 2009 | | Audit and Compliance; Financial Operations and Affordable Housing |
| | | | |
Daniel R. Fauske(1) | | 56 | | 2004 | | December 31, 2007 | | Executive; Financial Operations and Affordable Housing; Governance, Budget and Compensation |
| | | | |
Harold B. Gilkey | | 67 | | 2003 | | December 31, 2008 | | Financial Operations and Affordable Housing (Vice Chair); Governance, Budget and Compensation |
| | | | |
William V. Humphreys | | 59 | | 2006 | | December 31, 2008 | | Audit and Compliance (Vice Chair); Governance, Budget and Compensation |
162
| | | | | | | | |
Name | | Age as of
March 30, 2007 | | Bank
Director
Since | | Expiration of
Term as Director | | Board Position and Core Committee Membership |
Russell J. Lau | | 54 | | 2005 | | December 31, 2009 | | Audit and Compliance; Executive; Financial Operations and Affordable Housing (Chair) |
| | | | |
William A. Longbrake | | 64 | | 2002 | | December 31, 2007 | | Executive; Financial Operations and Affordable Housing; Governance, Budget and Compensation (Chair) |
| | | | |
Park Price(2) | | 64 | | 2006 | | December 31, 2007 | | Audit and Compliance; Financial Operations and Affordable Housing |
| | | | |
Donald V. Rhodes | | 71 | | 2005 | | December 31, 2008 | | Audit and Compliance ; Governance, Budget and Compensation (Vice Chair) |
| | | | |
Jack T. Riggs, M.D.(1) | | 52 | | 2004 | | December 31, 2007 | | Audit and Compliance; Governance, Budget and Compensation |
| | | | |
Gordon Zimmerman(2) | | 44 | | 2007 | | December 31, 2008 | | Audit and Compliance; Financial Operations and Affordable Housing |
| (1) | Appointed by the Finance Board. |
| (2) | Selected by the Seattle Bank’s Board to fill a vacancy. |
The following is a biographical summary of the business experience of each of our directors. Except as otherwise indicated, each director has been engaged in the principal occupation described below for at least five years.
Mike C. Daly has served as a director of the Seattle Bank since 2002 and as chairman since 2005. In 1981, Mr. Daly opened First State Bank in Wheatland, Wyoming, an independent community bank, where he serves as chairman. Since 1985, Mr. Daly has served as chairman and chief executive officer of Wheatland Bankshares, Inc., a single bank holding company that owns 100% of First State Bank. Mr. Daly currently serves as one of three Seattle Bank representatives on the Council of Federal Home Loan Banks.
Craig E. Dahl has served as a director of the Seattle Bank since 2004 and as vice chair since 2005. Since 1996, Mr. Dahl has served as president, chief executive officer, and a director of Alaska Pacific Bancshares, Inc. and its wholly-owned subsidiary, Alaska Pacific Bank, federally chartered savings banks.
Michael A. DeVico joined the Seattle Bank’s Board on January 1, 2007. Mr. DeVico has served as executive vice president and chief information officer since 2001 at Zions Bancorporation, a financial holding company in Salt Lake City, Utah. From 2000 to 2001, he was chief executive officer of Xpede, and he served from 1990 to 2000 at Bank of America, where he held a number of positions, including Executive Vice President for the Interactive Banking Division as well as chief executive officer of Bank of America’s Midwest Retail Division.
Daniel R. Fauskehas served as a director of the Seattle Bank since 2004. Since 1995, Mr. Fauske has served as chief executive officer and executive director of the Alaska Housing Finance Corporation, a self-supporting, non-stock public corporation that provides financing and loan options for housing.
Harold B. Gilkey has served as a director of the Seattle Bank since 2003. Mr. Gilkey co-founded Sterling Savings Bank, a state-chartered, federally insured stock savings and loan association, in 1981, and served as chairman from 1981 through 2004. Since that time has served as the chairman of the board and chief executive officer of Sterling Financial Corporation.
163
William V. Humphreys has served as a director of the Seattle Bank since 2006. Mr. Humphreys has served as president and chief executive officer of Citizens Bank in Corvallis, Oregon, a commercial banking services provider, since 1996 and as president and chief executive officer of Citizens Bancorp, a publicly traded bank holding company, since 1997. He serves as a director of Citizens Bancorp.
Russell J. Lau has served as a director of the Seattle Bank since 2005. Mr. Lau has served as vice chairman and chief executive officer of Finance Factors, Ltd., a depository financial services loan company, since 1997. In addition, Mr. Lau has served as president and chief executive officer of Finance Enterprises, Ltd., the parent company of Finance Factors, Ltd., since 2004.
William A. Longbrake has served as a director of the Seattle Bank since 2002. Since 1982, Mr. Longbrake has served in a variety of positions at Washington Mutual Inc., a national financial services retailer, including currently serving as its vice chair, and serving as its vice chair and chief enterprise risk officer from 2002 to 2004 and as its vice chair and chief financial officer from 1999 to 2002. Mr. Longbrake currently serves as one of three Seattle Bank representatives on the Council of Federal Home Loan Banks.
Park Price has served as a director of the Seattle Bank since 2006. Mr. Price has served as president of Bank of Idaho, an independent community bank, since 2003 and as a director of that institution since 1999. He is also a director of Western Independent Bankers, a regional banking association serving community banks across the Western United States. He was owner and president of Park Price Motor Company in Pocatello, Idaho, from 1979 to 2003.
Donald V. Rhodeshas served as a director of the Seattle Bank since 2005. Mr. Rhodes has served as chairman of Heritage Financial Corporation, a publicly traded bank holding company located in Olympia, Washington, since 1997. He has also served as its chief executive officer and president. Mr. Rhodes has also served as chairman of Heritage Financial Corporation’s Heritage Bank and Central Valley Bank, N.A. subsidiaries.
Jack T. Riggs, MDhas served as a director of the Seattle Bank since 2004. Dr. Riggs is the founder and a partner in North Idaho Medical Care Centers PLLC and chief executive officer of Pita Pit USA, Inc. From January 2001 to January 2003, Dr. Riggs served as Lieutenant Governor of Idaho. From 1996 to 2001, Dr. Riggs served as an Idaho State Senator.
Gordon Zimmermanjoined the Seattle Bank’s Board on January 1, 2007. Mr. Zimmerman has served as the president and a director of Community Bank, Inc., in Ronan, Montana, since 2003. From 1998 to 2003, he served as chief financial officer, president, and a board member of Pend Oreille Bank in Sandpoint, Idaho.
Executive Officers
The following table sets forth information about the executive officers of the Seattle Bank as of the date indicated.
| | | | | | |
Executive Officer | | Age as of
March 30,
2007 | | Capacity in Which Served | | Seattle
Bank
Employee
Since |
James E. Gilleran* | | 73 | | President and Chief Executive Officer | | 2005 |
Richard M. Riccobono* | | 49 | | Executive Vice President, Chief Operating Officer | | 2005 |
Steven R. Horton | | 46 | | Senior Vice President, Chief Risk Officer | | 1992 |
Sheryl A. Symonds | | 51 | | Senior Vice President, General Counsel, and Corporate Secretary | | 2003 |
Mark R. Szczepaniak | | 49 | | Senior Vice President, Chief Financial Officer | | 2004 |
Vincent L. Beatty | | 47 | | First Vice President, Treasurer | | 2004 |
John W. Blizzard | | 39 | | First Vice President, Managing Director, Member Services | | 2001 |
| * | Mr. Gilleran has announced his resignation effective April 30, 2007. The Board has appointed Mr. Riccobono to succeed Mr. Gilleran as president and chief executive officer of the Seattle Bank as of May 1, 2007. See “Part III. Item 11. Executive Compensation—Employment Agreements with Management.” |
164
James E. Gilleran has served as president and chief executive officer of the Seattle Bank since June 2005. From 2001 to April 2005, Mr. Gilleran served as director of the Office of Thrift Supervision, or the OTS, an office of the Department of the Treasury of the United States which regulates the thrift industry. From 1994 to 2000, he served as chairman and chief executive officer of the Bank of San Francisco, a financial banking institution. Mr. Gilleran currently serves as one of three Seattle Bank representatives on the Council of Federal Home Loan Banks. Mr. Gilleran has announced his resignation from the Seattle Bank effective April 30, 2007.
Richard M. Riccobono has served as executive vice president, chief operating officer of the Seattle Bank since August 2005. From 1989 until July 2005, Mr. Riccobono served at the OTS, including as deputy director from 1998 until July 2005. Prior to his tenure at the OTS, he served in various positions at the FHLBank of Atlanta and FHLBank of Boston. The Board has appointed Mr. Riccobono to succeed Mr. Gilleran as president and chief executive officer of the Seattle Bank effective May 1, 2007.
Steven R. Horton has served as senior vice president, chief risk officer of the Seattle Bank since July 2005. From November 2004 until July 2005, Mr. Horton served as senior vice president, interim chief financial officer of the Seattle Bank. In addition, from 2003 until November 2004, Mr. Horton served as senior vice president, chief credit officer of the Seattle Bank and from 1992 to 2003 as vice president and manager of the Seattle Bank’s asset/liability management group.
Sheryl A. Symonds has served as senior vice president, general counsel, and corporate secretary of the Seattle Bank since October 2005. From January 2005 to October 2005, Ms. Symonds served as vice president, associate general counsel of the Seattle Bank. In addition, from 2003 to January 2005, Ms. Symonds served as senior attorney of the Seattle Bank. Ms. Symonds served as vice president, administration, and general counsel of Pacific Aerospace and Electronic, Inc., a producer of electronic components, from 1997 to 2002, and prior to that as a partner in the law firm, Stoel Rives LLP.
Mark R. Szczepaniak has served as senior vice president, chief financial officer of the Seattle Bank since July 2005. From October 2004 until July 2005, Mr. Szczepaniak served as senior vice president, controller of the Seattle Bank. From 1996 to 2004, he served as senior vice president and controller of the Federal Home Loan Bank of Chicago.
Vincent L. Beatty has served as first vice president, treasurer of the Seattle Bank since July 2005. From May 2004 until June 2005, Mr. Beatty served as a senior portfolio manager for the Seattle Bank. From 2001 to 2004, Mr. Beatty owned and operated Great Learning Adventures, an association dedicated to tutoring services, and from 2000 to 2001, he held the position of senior vice president, retail financial officer for Chase Manhattan Mortgage.
John W. Blizzard has served as first vice president, managing director, member services of the Seattle Bank since May 2006, after serving as vice president, director of member services since October 2005. From 2001 through September 2005, Mr. Blizzard held various other positions in the Seattle Bank, including account manager, national accounts manager, and vice president, product and services.
Section 16(a) Beneficial Ownership Reporting Compliance
In accordance with correspondence from the Office of Chief Counsel of the Division of Corporation Finance of the SEC dated May 23, 2006, directors, officers, and 10% stockholders of the Seattle Bank are exempted from Section 16 of the Exchange Act with respect to transactions in or ownership of Seattle Bank capital stock, including the reporting requirements thereof.
165
ITEM 11. EXECUTIVE COMPENSATION
Compensation Discussion and Analysis
This compensation discussion and analysis provides information related to the compensation program provided for our named executive officers for 2006, including the principal executive officer, principal financial officer and the three most highly-compensated executive officers other than the principal executive officer and principal financial officer, all of whom are identified in the Summary Compensation Table below.
Overall Compensation Philosophy and Strategy.The primary objective of our executive compensation and benefits programs is to provide a strategy to attract, retain and motivate talented individuals who can perform at optimal levels to enable us to meet our company’s mission of providing liquidity, funding, and services to enhance our members’ success and the availability of affordable homes and economic development in their communities while considering the evolving needs of our members and customers. Our members are best served when we attract and retain talented executives with compensation packages that are competitive. Total compensation, including base salary, short-term and long-term cash incentive awards, defined-benefit and defined-contribution retirement benefits, and other compensation, is intended to align the interests of the named executive officers and other employees with our short-term and long-term objectives to ensure an appropriate level of competitiveness with the marketplace from which we recruit executive talent, and encourage the named executive officers and other executive officers to remain in our employ. Our compensation strategy consists of establishing each component of compensation to be competitive within the FHLBank System and reflects the selection of a benchmark within industry standards for organizations of similar size serving similar markets.
Role and Responsibilities of the Executive Committee.The Executive Committee has the responsibility for setting base salary, establishing performance goals and evaluating the performance of the president and chief executive officer, and making recommendations to the Board regarding the president and chief executive officer’s incentive awards and compensation changes. In addition, the Executive Committee oversees president and chief executive officer succession planning.
Role and Responsibilities of the Governance, Budget and Compensation Committee.The GBC Committee has the responsibility for oversight of our compensation and benefits programs. In addition, the GBC Committee reviews and makes recommendations with respect to all matters pertaining to compensation for all named executive officers other than the president and chief executive officer. In carrying out its responsibilities, the GBC Committee may rely on the assistance and advice of our management and other advisors as needed. The GBC Committee reports its activities and recommendations to the Board through the GBC Committee chair.
The GBC Committee is comprised of William A. Longbrake (chair), Donald V. Rhodes (vice chair), Mike C. Daly, Daniel R. Fauske, Harold B. Gilkey, William V. Humphreys, and Jack T. Riggs. The purposes of the GBC Committee are to: (i) develop and maintain best practices in governing the Seattle Bank; (ii) coordinate the review, approval, and monitoring of our strategic business plan and annual operating and capital budgets; (iii) assist management in addressing legislative and regulatory issues; and (iv) provide oversight for compensation and benefit programs for the Seattle Bank.
With respect to providing oversight for our overall benefit and compensation programs, the GBC Committee is responsible for:
| | • | | reviewing and recommending to the Board compensation for the Seattle Bank’s executive officers, including the named executive officers (other than the president and chief executive officer) recommended by the president and chief executive officer (e.g., base salary, merit increases, market adjustments, promotional increases, exceptions to policy, etc.); |
| | • | | overseeing the establishment and administration of the short-term and long-term cash-based incentive compensation plans, including the company goals established under such programs, and making recommendations to the Board regarding those plans and the awards under the plans; |
166
| | • | | reviewing, amending and making recommendations to the Board regarding employee benefit plans such as the defined-benefit plans and defined-contribution plans, both qualified and non-qualified; and |
| | • | | ensuring that a senior leadership succession plan (other than the succession plan for the president and chief executive officer) is in place. |
Role and Responsibilities of the President and Chief Executive Officer. The president and chief executive officer’s established role and practice in regard to executive officer compensation, including the compensation of the named executive officers other than himself, include:
| | • | | Establishing and recommending for approval the corporate performance goals for the executive officers; |
| | • | | Providing status reports on performance goals; |
| | • | | Evaluating the individual performance of the executive officers; |
| | • | | Recommending base salary adjustments for the executive officers; |
| | • | | Recommending changes to the executive officers’ compensation and benefit packages; |
| | • | | Recommending changes to established plan documents and policies requiring approval by the GBC Committee or the Board; and |
| | • | | Recommending new plan documents and policies. |
Competition for Executive Talent and Executive Compensation Benchmarking.The Executive and GBC Committees strive to create a compensation program for the president and chief executive officer and the other named executive officers that positions total compensation at the median of the market as compared to peer organizations and other positions at FHLBanks that have similar levels of responsibility and complexity. Each of the individual elements of compensation and total compensation may vary somewhat above or belowthe median range. The Seattle Bank obtains a survey from a national global compensation consulting firm to provide information regarding compensation practices considered to be most appropriate for comparative purposes to the Seattle Bank. In determining compensation for 2006, we reviewed and used information provided in the survey, which contained compensation practices of over 50 financial services and banking firms, as well as compensation information reported by the FHLBank System on the FHLBanks.
Overview of the Compensation Programs.Our total compensation mix for named executive officers is made up of a combination of base salary, short-term annual incentive cash compensation, long-term incentive cash compensation, qualified and non-qualified defined-benefit and defined-contribution retirement plans, and other benefits. We are precluded from offering equity-based compensation because our stock can only be sold to or purchased by our members. Consequently, we rely on a mix of other non-equity compensation elements to attract, retain and reward executive talent. We believe that this approach is appropriate and consistent with prevailing market practice.
Base Salary. Base salary is a key component of our compensation program and ensures we are successful in attracting and retaining executive talent. Base salary levels are initially established for the named executive officers on the basis of a combination of factors. These factors include a review of published industry salary surveys, which may include many, but not necessarily all, of the financial institutions in our peer group in terms of total assets and net income, a comparison of FHLBank compensation data, and certain subjective factors, including the individual’s relevant experience and responsibility to be assumed. In addition, the president and chief executive officer and chief operating officer have employment agreements that provide for a minimum base salary. As of the beginning of each year, changes to base salary are approved by either the Executive Committee for the president and chief executive officer or by the GBC Committee for the other named executive officers, based upon a review of the market data, FHLBank compensation data, and individual performance and contributions to the achievement of goals and objectives.
Short-Term and Long-Term Cash-based Incentive Compensation Plans. Short-term and long-term cash-based incentive compensation plans are intended to create an award program for the named executive officers
167
who significantly contribute to and influence our annual business and longer-term strategic plans, and who are responsible for our overall performance. Our incentive compensation plans are designed to award incentive compensation for our employees, including our named executive officers, for accomplishing bank goals that are approved by the Board as well as individual goals. Our bank-wide goals for the short-term and long-term cash-based incentive compensation plans include a target range profitability goal based upon return on equity, adjusted for predetermined non-recurring items. Individual goals are approved by the Executive Committee for the president and chief executive officer and by the individual’s manager for the other named executive officers. Individual goals are developed to support our long-term business goals of safety and soundness, enhancing member value, increasing organizational capacity, profitability, or other goals that are consistent with our objectives within this framework, individual goals vary in accordance with the scope of an individual’s duties and responsibilities.
Potential incentive award amounts for the named executive officers are stated as a percentage of base salary. Named executive officers are awarded cash incentives at the end of the incentive plan period based on the actual achievement levels of the specified goals.
The Board has discretion to modify any and all incentive payments of plan participants. For 2006, the Board did not modify any incentive payments made to our named executive officers, except the president and chief executive officer. The Executive Committee considered the levels at which the bank-wide goal and the president and chief executive officer’s individual goals were achieved and recommended an award of 50% of base salary which was above the level that would otherwise have been achieved based on the goals. This modification was approved by the Board.
Short-Term Cash-Based Incentive Compensation Plans.We maintain the following short-term cash-based incentive compensation plans that apply to the named executive officers:
| | • | | Bank Incentive Compensation Plan—Annual Plan for the President and Chief Executive Officer, or Annual President and Chief Executive Officer BICP; and |
| | • | | Bank Incentive Compensation Plan—Annual Plan for Exempt Staff and Officers, or Annual BICP. |
Under the Annual President and Chief Executive Officer BICP and Annual BICP plans, performance and individual goals for participants are established annually as of January 1. The Annual BICP Plan is for exempt employees, and includes our current named executive officers, except for the president and chief executive officer, who is covered by the Annual President and Chief Executive Officer BICP.
The bank-wide profitability achievement level is set at threshold, target and maximum, and each participating employee’s individual performance goal measure includes the categories of: more is expected; meets all goals; exceeds expectations; and recognized enterprise performance.
The named executive officers’ short-term incentive awards are based on achievement of bank-wide performance objectives first, at threshold or above, and are adjusted based on individual performance goals at “meets all goals” or above. Certain executive positions have a greater and more direct impact than others on our annual financial success. The differences are recognized by varying award opportunities. The 2006 award opportunities and the award payment percentages for the named executive officers were as follows.
2006 Award Opportunity as a Percentage of Base Salary
| | | | | | | | |
Name | | Threshold | | Target | | Maximum | | 2006 Award Achieved |
James E. Gilleran | | 20-35% | | 25-45% | | 35-60% | | 50.0% of base salary |
Mark R. Szczepaniak | | 15-25% | | 20-30% | | 25-35% | | 25.0% of base salary |
Richard M. Riccobono | | 15-30% | | 20-40% | | 30-50% | | 40.0% of base salary |
Steven R. Horton | | 15-25% | | 20-30% | | 25-35% | | 25.0% of base salary |
Sheryl A. Symonds | | 15-25% | | 20-30% | | 25-35% | | 25.0% of base salary |
168
Long-Term Cash-Based Incentive Compensation Plan.In January 2005, we established the BICP Long-Term Incentive Plan, or Long-Term BICP, which is a long-term cash-based incentive compensation plan designed to retain executive talent. The Long-Term BICP is designed to provide a competitive total cash compensation package relative to the market and rewards the named executive officer for achievement of a bank-wide profitability goal over a three-year performance period. Under the Long-Term BICP, awards are based on the bank-wide achievement of goals at threshold, target and maximum levels. Base award opportunities are provided each performance period, and equal a percentage of an executive’s annual base salary at the beginning of the performance period. In addition, each participant is granted a number of performance units for that performance period determined by dividing the base award opportunity by the value of a performance unit at the beginning of the performance period. Performance measures for the performance period, performance units, and the performance unit initial values are established annually at the beginning of each performance period. A performance period begins as of January 1 of each calendar year and is made up of three interim performance periods consisting of three calendar years. At the end of each calendar year or interim performance period, the achievement of the performance measure is assessed at threshold, target or maximum and the periodic plan awards are provisionally determined. Periodic plan awards equal one-third of the number of the executive’s performance units for the three-year performance period, multiplied by the value of the performance unit at the end of the performance period. No awards are paid out until after the three-year performance period has ended. Final awards equal the sum of the periodic plan awards for each interim performance period. If we fail to achieve the threshold level for a performance measure in any interim performance period, no award will be made for that interim performance period. Since a new performance period is established each year, participants may participate in overlapping performance periods at one time. Currently, the named executive officers are participating in the 2005-2007 performance period, the 2006-2008 performance period and the 2007-2009 performance period. The anticipated payout years for each of those performance periods currently in effect are 2008, 2009 and 2010, respectively. Payments made in 2008 will be the first payment made under this plan. The 2005-2007 and the 2006-2008 award opportunities for the named executive officers will be as follows:
Award Opportunity as a Percentage of Base Salary
| | | | |
Name | | 2005-2007 | | 2006-2008 |
James E. Gilleran | | 15-45% | | 15-45% |
Mark R. Szczepaniak | | 10-30% | | 12.5-37.5% |
Richard M. Riccobono | | 12.5-37.5% | | 12.5-37.5% |
Steven R. Horton | | 10-30% | | 12.5-37.5% |
Sheryl A. Symonds | | 7.5-22.5% | | 12.5-37.5% |
Retirement Plans-Supplemental Executive Retirement Plan. Messrs. Szczepaniak, Riccobono and Horton and Ms. Symonds participate in the Federal Home Loan Bank of Seattle Retirement Fund Benefit Equalization Plan, or Retirement BEP. We maintain the Retirement BEP for executives who also participate in the Pentegra Defined Benefit Plan for Financial Institutions, or Pentegra DB Plan, which is a tax-qualified defined-benefit pension plan, to provide a benefit that is coordinated with such plan. Without the addition of the Retirement BEP, these executives would receive lower percentages of replacement income during retirement than other employees who participate in the Pentegra DB Plan. This supplemental benefit is consistent with market levels and practices and is an extension of our retirement commitment to our executives to preserve and restore the full pension benefits which, due to certain limitations under the Internal Revenue Code, or IRC, are not payable under the Pentegra DB Plan. Mr. Gilleran is not eligible to participate in the Pentegra DB Plan or the Retirement BEP. Additional information regarding the Pentegra DB Plan and the Retirement BEP, as well as the present value of accumulated benefits, is disclosed in the “2006 Pension Benefits” table and narrative of this document below.
Retirement Plans-Deferred Compensation Plan. Our named executive officers are eligible to participate in the Federal Home Loan Bank of Seattle Thrift Plan Benefit Equalization Plan, or Thrift BEP. The Thrift BEP provides certain executives with an opportunity to defer up to 25% of base salary, plus receive additional employer matching contributions, into a bookkeeping account. Each account is also credited with notional
169
earnings based on the performance of the investments selected by the participant from the pool of investment choices identified in the 401(k) savings plan. The Thrift BEP is intended to allow the participants to defer current income and, subject to certain limitations, receive a corresponding matching contribution, without being limited by the IRC contribution limitations for 401(k) savings plans. Participation in the Thrift BEP is consistent with market levels and practices and is an extension of our commitment to our executives to preserve and restore the full benefits which, due to certain limitations under the IRC, are not payable under our 401(k) savings plan. Additional information regarding the Thrift BEP, as well as current balances, is disclosed in the “2006 Non-Qualified Deferred Compensation” table and narrative below.
Other Benefits. We are committed to providing competitive, high-quality benefits designed to promote health, well-being, and income protection for all employees. We offer all employees a core level of benefits and the opportunity to choose from a variety of optional benefits. Core benefits offered include medical, dental, prescription drug, vision, long-term disability, flexible spending accounts, parking or transportation subsidy, worker’s compensation insurance, travel insurance, and life and accident insurance. Additionally, we offer a qualified defined-contribution 401(k) savings plan open to all employees, including our named executive officers. After one year of service, employees are eligible to receive a 401(k) savings plan company match in accordance with the Seattle Bank match schedule provided in the “Thrift BEP” narrative under the 2006 Non-Qualified Deferred Compensation section.
Severance. We provide severance benefits to eligible employees through a Board-approved policy. Our severance policy is designed to help bridge the gap in employment for eligible employees until other employment is found. The president and chief executive officer and chief operating officer have severance terms identified in their employment agreements, as described below, and the chief financial officer, due to previous employment at another FHLBank, will receive an additional nine months pay in the event of severance. Provided that eligibility conditions are met, the Board-approved severance policy will provide benefits to all our officers, including our named executive officers. These severance benefits are described in more detail in the section entitled “Potential Payments Upon Termination or Change in Control” below.
Additional Incentive Awards. Periodically, we provide for additional cash incentive awards in connection with specific projects or other objectives of a unique, challenging and time sensitive nature. We commonly refer to these bonuses as spot bonuses. They are discretionary and are directly tied to improving our strategic position. Spot bonuses are generally recommended by managers or project leaders and approved by our director of human resources and the chief operating officer. Spot bonuses for named executive officers are included and footnoted in the Summary Compensation Table below.
170
COMPENSATION COMMITTEE REPORT
The Governance, Budget and Compensation Committee has reviewed and discussed the Compensation Discussion and Analysis with management and, based on the review and discussion, it has recommended to the Board of Directors that the Compensation Discussion and Analysis be included in the Seattle Bank’s Annual Report on Form 10-K.
William A. Longbrake, chair
Donald V. Rhodes, vice chair
Mike C. Daly
Daniel R. Fauske
Harold B. Gilkey
William V. Humphreys
Jack T. Riggs, M.D.
171
2006 Summary Compensation Table
The following table sets forth compensation earned for 2006 by our chief executive officer, chief financial officer, and our three other most highly paid executive officers who were serving as executive officers at the end of 2006. Annual compensation includes amounts deferred at the election of officers.
| | | | | | | | | | | | | | | | | | | | | |
Name and
Principal Position | | Year | | Salary | | Bonus (1) | | Non-equity
Incentive Plan
Compensation (2) | | Change in
Pension Value
and
Non-Qualified
Deferred
Compensation
Earnings (3) | | | All Other
Compensation (8) | | Total |
| (in dollars) | | | | | | | | | | | | | | | |
James E. Gilleran President and Chief Executive Officer | | 2006 | | $ | 542,769 | | $ | | | $ | 271,385 | | $ | | | | $ | 26,812 | | $ | 840,966 |
Mark R. Szczepaniak Senior Vice President,
Chief Financial Officer | | 2006 | | | 283,250 | | | 20,388 | | | 70,812 | | | 153,729 | (4) | | | 22,269 | | | 550,448 |
Richard M. Riccobono Executive Vice President, Chief Operating Officer | | 2006 | | | 351,492 | | | | | | 140,597 | | | 97,591 | (5) | | | 24,024 | | | 613,704 |
Steven R. Horton Senior Vice President,
Chief Risk Officer | | 2006 | | | 279,125 | | | 2,961 | | | 69,781 | | | 77,009 | (6) | | | 14,648 | | | 443,524 |
Sheryl A. Symonds Senior Vice President,
General Counsel, Corporate Secretary | | 2006 | | | 235,180 | | | 19,934 | | | 58,795 | | | 39,793 | (7) | | | 9,058 | | | 362,760 |
| (1) | Represents an additional incentive award, or spot bonus, in connection with specific projects or other objectives of a unique, challenging and time-sensitive nature. |
| (2) | Represents the total amounts earned in 2006 under the short-term cash-based incentive compensation plans and paid in 2007. |
| (3) | Represents change in actuarial present value of accumulated pension benefits for the Pentegra DB Plan and Retirement BEP. No above market or preferential earnings are paid on non-qualified deferred compensation earnings in the Thrift BEP. For the purposes of calculating the Retirement BEP balances for our named executive officers, we use years of credited service in the Pentegra DB Plan to determine their Retirement BEP present value of accumulated benefit balance adjusted to reflect one year of credited service for 2006. |
| (4) | Mr. Szczepaniak initially joined the Retirement BEP during 2005 and earned $42,826 as of December 31, 2005. Mr. Szczepaniak’s change in pension value and non-qualified deferred compensation earnings for 2006 includes $37,000 for the Pentegra DB Plan and $116,729 for the Retirement BEP. |
| (5) | Mr. Riccobono initially joined the Retirement BEP on January 1, 2006, with a balance of zero. Mr. Riccobono’s change in pension value and non-qualified deferred compensation earnings for 2006 includes $56,000 for the Pentegra DB Plan and $41,591 for the Retirement BEP. The amount shown reflects one year of credited service for 2006. However, because the Retirement BEP uses the years of credited service under the Pentegra DB Plan, during 2006 an additional $526,787 was recognized as a liability by us and credited to Mr. Riccobono’s individual Retirement BEP balance to reflect 19.6 years of credited service prior to 2006. |
| (6) | Mr. Horton initially joined the Retirement BEP on January 1, 2006, with a balance of zero. Mr. Horton’s change in pension value and non-qualified deferred compensation earnings for 2006 includes $50,000 for the Pentegra DB Plan and $27,009 for the Retirement BEP. The amount shown reflects one year of credited service for 2006. However, because the Retirement BEP uses the years of credited service under the Pentegra DB Plan, during 2006 an additional $320,383 was recognized as a liability by us and credited to Mr. Horton’s individual Retirement BEP balance to reflect 16.7 years of credited service prior to 2006. |
| (7) | Ms. Symonds initially joined the Retirement BEP on January 1, 2006, with a balance of zero. Ms. Symonds’ change in pension value and non-qualified deferred compensation earnings for 2006 includes $28,000 for the Pentegra DB Plan and $11,793 for the Retirement BEP. The amount shown reflects one year of credited service for 2006. However, because the Retirement BEP uses the years of credited service under the Pentegra DB Plan, during 2006 an additional $9,721 was recognized as a liability by us and credited to Ms. Symonds’ individual Retirement BEP balance to reflect 1.7 years of credited service prior to 2006. |
| (8) | Represents company contributions to the 401(k) savings plan and Thrift BEP defined-contribution plans. |
172
2006 Grants of Plan-Based Awards
The following table provides information regarding awards that could have been earned in 2006 under the Annual President and Chief Executive Officer BICP, the Annual BICP (for named executive officers other than the president and chief executive officer), and the estimated awards earned in 2006 under Long-Term BICP (anticipated to be paid out in 2008 for the 2005-2007 performance plan and in 2009 for the 2006-2008 performance plan). See “2006 Summary Compensation Table” for the actual awards under the annual plans.
| | | | | | | | | | | | | |
Name | | Type of Award | | Beginning of
Performance
Period(2) | | | Number of
Non-equity
Incentive
Plan Units
Granted (3) | | Estimated Future Payouts Under Non-equity Incentive Plan Awards(1) |
| | | | | Threshold $ | | Target $ | | Maximum $ |
James E. Gilleran | | Annual President and Chief Executive Officer BICP | | | | | | | $108,554 - $189,969 | | $135,962 - $244,246 | | $189,969 - $325,661 |
| | | | | | |
| | Long-Term BICP | | 2005 | (4) | | | | | | | | |
| | Long-Term BICP | | 2006 | (4) | | | | | | | | |
| | | | | | |
Mark R. Szczepaniak | | Annual BICP | | | | | | | 42,488 - 70,813 | | 56,650 - 84,975 | | 70,813 - 99,138 |
| | Long-Term BICP | | 2005 | | | 462 | | 7,700 | | 15,400 | | 23,100 |
| | Long-Term BICP | | 2006 | | | 708 | | 11,802 | | 23,604 | | 35,406 |
| | | | | | |
Richard M. Riccobono | | Annual BICP | | | | | | | 52,724 - 105,448 | | 70,298 - 140,597 | | 105,448 - 175,746 |
| | Long-Term BICP | | 2005 | | | 838 | | 13,958 | | 27,917 | | 41,875 |
| | Long-Term BICP | | 2006 | | | 863 | | 14,377 | | 28,754 | | 43,131 |
| | | | | | |
Steven R. Horton | | Annual BICP | | | | | | | 41,869 - 69,781 | | 55,825 - 83,738 | | 69,781 - 97,694 |
| | Long-Term BICP | | 2005 | | | 450 | | 7,500 | | 15,000 | | 22,500 |
| | Long-Term BICP | | 2006 | | | 698 | | 11,630 | | 23,260 | | 34,891 |
| | | | | | |
Sheryl A. Symonds | | Annual BICP | | | | | | | 35,277 - 58,795 | | 47,036 - 70,554 | | 58,795 - 82,313 |
| | Long-Term BICP | | 2005 | | | 243 | | 4,050 | | 8,100 | | 12,150 |
| | Long-Term BICP | | 2006 | | | 588 | | 9,799 | | 19,598 | | 29,398 |
| (1) | The named executive officers’ short-term incentive awards are based on achievement of bank-wide performance objectives first at threshold or above, and are adjusted based on individual performance goals. The column heading reflects achievement of the indicated level of bank-wide performance, and the ranges shown for each named executive officer reflect the range of possible achievement of his or her individual goals. For additional information refer to the short-term and long-term cash-based incentive compensation plan information discussed above. The actual Annual President and Chief Executive Officer BICP and Annual BICP awards were paid to our named executive officers in February 2007 and are reflected in the “Non-equity Incentive Plan Compensation” column of the 2006 Summary Compensation Table above. |
| (2) | Represents for the 2005 year, the 2006 portion of the award earned during 2006 under the 2005-2007 performance plan, estimated and scheduled to be paid in 2008, if the named executive officer is under the employee of the Seattle Bank at the time the plan awards are paid. Represents for the 2006 year, the 2006 portion of the award earned during 2006 under the 2006-2008 performance plan estimated and scheduled to be paid in 2009, if the named executive officer is under the employee of the Seattle Bank at the time the plan awards are paid. The 2006 portion of the 2005-2007 and 2006-2008 performance plans was determined to be target. |
| (3) | Represents the number of performance units that were granted for each of the 2005-2007 and 2006-2008 performance periods. |
| (4) | As a result of Mr. Gilleran’s resignation effective April 30, 2007, he will not receive his Long-Term BICP awards for the 2005-2007 and 2006-2008 performance plans. The threshold, target and maximum amounts awarded to Mr. Gilleran, had he remained under the employ of the Seattle Bank at the time the plan award payments are made for the 2005-2007 performance plan would have been $26,250, $52,500 and $78,750, respectively, and for the 2006-2008 performance plan would have been $27,038, $54,075, and $81,113, respectively. |
Employment Agreements with Management
Employment Agreement with James E. Gilleran. Effective June 1, 2005, we entered into an employment agreement with James E. Gilleran, our president and chief executive officer. The initial term of the employment agreement is for two years and seven months and the agreement may be renewed for successive one-year periods as mutually agreed to by Mr. Gilleran and the Seattle Bank. The employment agreement provides for an initial salary of $525,000 per year. Mr. Gilleran’s salary is reviewed at the end of each calendar year, but may not be decreased during the term of the agreement.
173
Mr. Gilleran is entitled to participate in short-term and long-term incentive compensation programs, which provide for cash bonuses on the achievement of performance measures over a one-year period and a three-year period, respectively. Both programs are based on the achievement of corporate and/or individual objectives, except that under the short-term cash-based incentive compensation program, the level of achievement of corporate objectives will be modified by “line of sight” performance objectives, to be established by mutual agreement between Mr. Gilleran and the Executive Committee (although for 2005, the “line of sight” performance objectives were established by mutual agreement between Mr. Gilleran and the full Board).
Mr. Gilleran is also eligible to participate in our employee benefit plans and is entitled to three weeks’ paid vacation per year.
Separation, Mutual Release, and Consulting Agreement with James E. Gilleran. On February 26, 2007, in connection with his resignation as president and chief executive officer, we entered into a Separation, Mutual Release, and Consulting Agreement with Mr. Gilleran, under which he will be retained as a consultant from May 1, 2007 through December 31, 2007. Under the agreement, Mr. Gilleran’s consulting services will include providing advice and counsel to us, our Board, and our officers on request. Mr. Gilleran’s current employment agreement, dated June 1, 2005, will remain in effect through April 30, 2007. The Separation, Mutual Release, and Consulting Agreement provides for payment of approximately $47,316 per month from May 1, 2007 through December 31, 2007. In addition, we will reimburse Mr. Gilleran for necessary, customary and usual business expenses.
Pursuant to the agreement, Mr. Gilleran releases all claims, if any, against us that relate in any way to his employment with or separation from the Seattle Bank. Likewise, we release all claims, if any, against Mr. Gilleran that relate in any way to his employment or his separation. Mr. Gilleran will also remain subject to certain confidentiality provisions
Current Employment Agreement with Richard M. Riccobono. On July 19, 2005, we entered into an employment agreement with Richard M. Riccobono, our executive vice president, chief operating officer, effective August 10, 2005. The initial term of the employment agreement is for two years and five months, beginning August 10, 2005, and the agreement may be renewed for successive one-year periods as mutually agreed to by Mr. Riccobono and us. The employment agreement provides for a salary of $335,000 per year. Mr. Riccobono’s salary will be reviewed annually at the end of each calendar year, but may not be decreased during the term of the agreement.
Mr. Riccobono is entitled to participate in short-term and long-term cash-based incentive compensation programs, which provide for cash bonuses on the achievement of performance measures over a one-year period and a three-year period, respectively. Both programs are based on the achievement of corporate and/or individual objectives. Mr. Riccobono’s 2006 short-term and long-term cash-based incentive compensation awards will have the minimum, target and maximum threshold percentages of annual base pay as provided in the applicable program.
Mr. Riccobono is also eligible to participate in the Seattle Bank’s employee benefit plans and is entitled to three weeks’ paid vacation per year.
New Employment Agreement with Richard M. Riccobono. On February 26, 2007, we entered into an employment agreement with Richard M. Riccobono, effective as of May 1, 2007. Mr. Riccobono’s current employment agreement with the Seattle Bank as executive vice president, chief operating officer, will remain in place through April 30, 2007. The initial term of the new employment agreement as president and chief executive Officer is for two years and eight months, beginning May 1, 2007, and the agreement may be renewed for successive one-year periods as mutually agreed to by us and Mr. Riccobono. The employment agreement provides for salary of $485,000 per year. Mr. Riccobono’s salary is reviewed at the end of each calendar year, but may not be decreased during the term of the agreement.
174
Mr. Riccobono’s 2007 compensation under the short-term incentive compensation program will be prorated to reflect his four months of service as chief operating officer and his eight months of service as president and chief executive officer during 2007. Under the long-term incentive compensation program, Mr. Riccobono’s base pay as of January 1, 2007 will be used for one-third of any earned incentive for 2007 and his base pay as of May 1, 2007 will be used for two-thirds of any earned incentive for 2007.
Mr. Riccobono is also eligible to participate in our employee benefit plans and is entitled to four weeks’ paid vacation per year.
2006 Pension Benefits
The following table provides information for each of our named executive officers, other than Mr. Gilleran, regarding the actuarial present value of the officer’s accumulated benefit and years of credited service under the Pentegra DB Plan and the Retirement BEP as of December 31, 2006. The present value of accumulated benefits was determined using interest rate and mortality rate assumptions consistent with those used in our financial statements.
| | | | | | | |
Name(1) | | Plan Name(2) (3) | | Number of Years Credited Service (4) | | Present Value of Accumulated Benefit |
| (in dollars, except years) | | | | | | |
Mark R. Szczepaniak | | Pentegra DB Plan | | 10.3 | | $ | 186,000 |
| | Retirement BEP | | 10.3 | | | 159,555 |
| | | |
Richard M. Riccobono | | Pentegra DB Plan | | 20.6 | | | 340,000 |
| | Retirement BEP | | 20.6 | | | 568,378 |
| | | |
Steven R. Horton | | Pentegra DB Plan | | 17.7 | | | 277,000 |
| | Retirement BEP | | 17.7 | | | 347,392 |
| | | |
Sheryl A. Symonds | | Pentegra DB Plan | | 2.7 | | | 59,000 |
| | Retirement BEP | | 2.7 | | | 21,514 |
| (1) | Mr. Gilleran does not participate in the Pentegra DB Plan or the Retirement BEP. |
| (2) | Under the Pentegra DB Plan, which is a qualified pension plan, the participant’s accrued benefit amounts as of these calculation dates are based on the plan formula ignoring future service periods, future salary increases and mortality for the pre-retirement period. Beginning with the post retirement period, which is assumed to be age 65, the amount to be paid each year of retirement is allocated to each subsequent year. The allocated amounts are then adjusted by the 1994 Group Annuity Mortality (GAM) table projected 5 years and discounted back to age 65 by assuming 50% of benefit valued at 5.00% interest and 50% of benefit valued at 7.75% interest. The present value amount determined at age 65 is then discounted back to the appropriate reporting period using a discount rate of 7.75%. The difference between the present value as of the December 31, 2006 accrued benefit and the present value of the December 31, 2005 accrued benefit is the “change in pension value” for the qualified plan and is reported in the “Change in Pension Value and Non-Qualified Deferred Compensation Earnings” column in the 2006 Summary Compensation Table. |
| (3) | The benefits provided under the Retirement BEP are initially calculated on a gross basis to include benefits provided by the Pentegra DB Plan. The benefits under the Pentegra DB Plan are then deducted from the initially calculated gross amount to arrive at the amount of benefits provided by the Retirement BEP. The participant’s accrued benefit amounts as of these calculation dates are based on plan formulas ignoring future service periods, future salary increases and mortality for the pre-retirement period. Beginning with the post retirement period, which is assumed to be age 65, the amount to be paid each year of retirement is allocated to each subsequent year. The allocated amounts are then adjusted by the GAM table and the present value is discounted back using a discount rate of 5.75% and 5.50%, respectively. |
| (4) | For the purposes of calculating the Retirement BEP balances for our named executive officers, we use years of credited service in the Pentegra DB Plan to determine their Retirement BEP present value of accumulated benefit balance. Messrs. Szczepaniak and Riccobono were entitled to carry their years of credited service earned at other employers that participate in the Pentegra DB Plan over to the Retirement BEP. Messrs. Riccobono and Horton and Ms. Symonds joined the Retirement BEP on January 1, 2006. Therefore, the amounts initially credited to their individual Retirement BEP accounts for 2006 was $568,378, which represented 20.6 years of credited service for Mr. Riccobono, $347,392, which represented 17.7 years of credited service for Mr. Horton, and $21,514, which represented 2.7 years of credit service for Ms. Symonds. |
175
Pentegra Defined Benefit Plan. We are a participating employer in the Pentegra DB Plan, a tax-qualified, multiple employer defined-benefit pension plan. In general, only employees who were hired by us, or who were participating in the Pentegra DB Plan through another GSE, prior to January 1, 2004 are eligible to participate in the Pentegra DB Plan. Accordingly, of our named executive officers, only Messrs. Szczepaniak, Riccobono and Horton and Ms. Symonds are eligible to participate in the plan. The Pentegra DB Plan provides a normal retirement benefit equal to 2.5% of the participant’s average annual compensation for the three highest consecutive years during the participant’s years of credited service, multiplied by the participant’s years of credited service, subject to certain limitations and vesting provisions. Compensation is defined as base salary plus overtime and bonuses, subject to the IRC annual compensation limit. For 2006, the IRC annual compensation limit was $220,000. For 2007, it is $225,000. The IRC also limits the amount of benefits that can be paid to any participant under the Pentegra DB Plan. However, none of the named executive officers has accrued benefits in excess of that limit.
A participant in the Pentegra DB Plan vests in his or her benefit under the plan in accordance with the following schedule.
| | | |
Years of Service Completed | | Vested Percentage | |
Less than 2 years of service | | 0 | % |
2 years of service | | 20 | % |
3 years of service | | 40 | % |
4 years of service | | 60 | % |
5 years of service | | 80 | % |
6 or more years of service | | 100 | % |
In addition, a participant will become 100% vested in his or her benefit under the Pentegra DB Plan, regardless of the participant’s years of service, if he or she attains age 65 (the Pentegra DB Plan’s normal retirement age) or dies or becomes disabled while in our employ or the employ of another GSE that is a participating employer in the Pentegra DB Plan.
The benefit formula described above calculates the participant’s normal retirement benefit in the plan’s “normal” form of payment, which provides monthly benefit payments to the participant for the remainder of his or her life (i.e., a straight life annuity) and a death benefit payable to the participant’s beneficiary following the participant’s death. If the participant is still employed by us or a participating GSE at the time of his or her death, then the death benefit is a lump sum equal to 100% of the participant’s last 12 months of compensation, plus an additional 10% of such compensation for each year of credited service completed by the participant, up to a maximum death benefit equal to 300% of such compensation for 20 or more years of service, plus a refund of his or her contributions, if any, with interest. The participant’s beneficiary may elect to receive this death benefit in installments or in a straight life annuity payable for the remainder of the beneficiary’s life, instead of receiving it in a lump sum. If the participant dies after his or her employment has terminated, then the death benefit is equal to 12 times the participant’s annual retirement benefit less any benefit payments made to the participant prior to his or her death.
In lieu of receiving his or her benefit in the normal form of payment, a participant may elect to receive it in one of several other forms of payment, including a straight life annuity with no death benefit, a 100% joint and survivor annuity with a 120-month period certain, a 50% joint and survivor annuity, a lump sum, or a partial lump sum in combination with an annuity. All such optional forms of payment are actuarially equivalent to the normal form of payment. If a participant elects an optional form of payment, any death benefit will be determined by the optional form of payment elected by the participant.
Normal retirement benefit payments generally commence as of the first day of the month coincident with or next following the later of the participant’s 65th birthday and the date the participant’s employment with us or any other participating GSEs terminates. Early retirement benefit payments are available to vested participants at
176
age 45. However, early retirement benefit payments will be reduced by 3% for each year the participant is under age 65 when benefit payments commence. If the participant has a combined age and service of at least 70 years, this reduction is only 1.5% for each year the participant is under age 65 when benefit payments commence. All of our named executive officers are eligible for early retirement benefit payments with a 3% annual reduction. Benefits under the Pentegra DB Plan are pre-funded and are paid out of the assets of the Pentegra DB Plan.
If a participant’s employment terminates prior to his 65th birthday due to his or her disability, then the participant will be entitled to an annual disability retirement benefit under the Pentegra DB Plan in lieu of his or her normal retirement benefit. The amount of the annual disability retirement benefit will be equal to the greater of (i) the normal retirement benefit the participant had accrued as of the date of his or her termination (unreduced for early commencement) and (ii) 30% of his or her average annual compensation for the five highest consecutive calendar years during the participant’s years of credited service. However, in no event will the disability benefit exceed the amount of the benefit the participant would have accrued had he or she remained in our employment until his or her 65th birthday. This disability benefit will begin when the participant establishes that he or she is disabled and will be payable for as long as the participant remains disabled. If a participant ceases to be disabled, then his or her normal retirement benefit will be reinstated (subject to reduction for early commencement, as described above).
Retirement BEP. The Retirement BEP is a non-qualified defined benefit pension plan that provides eligible executives whose benefits under the Pentegra DB Plan are limited by the IRC limits, including the annual compensation limit, with a supplemental pension benefit. This supplemental benefit is equal to the benefit that would have been paid from the Pentegra DB Plan in the absence of the IRC limits, less the amount that the executive actually receives from the Pentegra DB Plan. In calculating the amount of the supplemental benefit, any salary deferred by the executive under the Thrift BEP (see discussion below) is treated as compensation. The Board determines which executive officers are eligible to participate in the Retirement BEP. Of the named executive officers, only Messrs. Szczepaniak, Riccobono and Horton and Ms. Symonds participate in the Retirement BEP.
Participants vest in their benefits under the Retirement BEP at the same time, and to the same extent, as they vest in their benefits under the Pentegra DB Plan. Benefits under the Retirement BEP are distributed at the same time and in the same form (and are subject to the same early retirement reduction factors) as are the corresponding benefits under the Pentegra DB Plan. However, the participant may elect to have his or her benefits under the Retirement BEP distributed in a different form. The optional forms of benefit under the Retirement BEP are the same as those provided under the Pentegra DB Plan and are all actuarially equivalent to the normal form of payment.
Because the Retirement BEP is a non-qualified plan, Retirement BEP benefits do not receive the same tax treatment and funding protection as do benefits under the Pentegra DB Plan, and our obligations under the Retirement BEP are general obligations of ours. Benefits under the Retirement BEP are maintained and distributed from a rabbi trust established to segregate these assets from other assets.
Additional Pension Benefit. In addition to the benefits shown in the Pension Plan Table above, at the end of each calendar year, beginning with the calendar year in which the executive officer attains age 66, or, if later, the calendar year in which the executive officer begins receiving retirement benefits under the Pentegra DB Plan, the executive officer will receive an additional lump sum benefit under the Pentegra DB Plan and the Retirement BEP equal to 1% of his or her annual retirement benefit multiplied by the number of years from the calendar year in which the executive officer attained age 65 to the calendar year in which such increment is payable. This incremental benefit will continue to the executive officer’s surviving contingent annuitant following the executive officer’s death, if the executive officer elected an optional form of payment with a contingent annuitant benefit. It will be paid from the Pentegra DB Plan to the extent it does not cause the executive’s benefit under the Pentegra DB Plan to exceed applicable IRC limits and from the Retirement BEP to the extent it would cause such benefits to exceed those limits.
177
2006 Non-Qualified Deferred Compensation
The following table provides information for each of our named executive officers regarding aggregate contributions by the named executive and us and aggregate earnings for 2006 and year-end account balances under the Thrift BEP, which is a non-qualified deferred compensation plan.
| | | | | | | | | | | | |
Name | | Executive Contributions Last Fiscal Year | | Registrant Contributions in Last Fiscal Year (2) | | Aggregate Earnings in Last Fiscal Year | | Aggregate Balance as of December 31, 2006 |
| (in dollars) | | | | | | | | |
James E. Gilleran | | $ | 135,692 | | $ | 9,463 | | $ | 8,825 | | $ | 153,980 |
Mark R. Szczepaniak(1) | | | 13,218 | | | 9,206 | | | 1,639 | | | 31,900 |
Richard M. Riccobono | | | 6,901 | | | 12,077 | | | 1,038 | | | 20,016 |
Steven R. Horton | | | 4,885 | | | 5,583 | | | 532 | | | 11,000 |
Sheryl A. Symonds | | | 18,814 | | | 2,352 | | | 1,650 | | | 22,816 |
| (1) | Mr. Szczepaniak’s aggregate balance in the Thrift BEP as of December 31, 2005 was $7,837. |
| (2) | The amounts shown in this column are also included in “All Other Compensation” column of the 2006 Summary Compensation Table. |
As of the year ended December 31, 2006, there were no withdrawals or distributions from the Thrift BEP for our named executive officers.
Thrift BEP. The Thrift BEP is a non-qualified, defined contribution plan under which participating executives can elect to defer up to 25% of their base salary each year. If elected by the executive, amounts deferred under the Thrift BEP will be transferred to our 401(k) savings plan to the extent they do not exceed the applicable IRC limits. Each year, after the participant has reached the annual IRC limit under our 401(k) savings plan, we begin crediting the participant’s Thrift BEP account with a matching amount equal to the amount of the matching contribution that we would have made on amounts deferred by the executive under the Thrift BEP during such year had such amounts actually been deferred under our 401(k) savings plan without regard to applicable IRC limits. This amount is based upon the employee’s length of service and is in accordance with the following schedule.
| | |
Years of Service | | Seattle Bank Match |
During 2nd and 3rd years | | 100% match on deferrals up to 3% of employee’s compensation |
During 4th and 5th years | | 150% match on deferrals up to 3% of employee’s compensation |
During 6th and additional years | | 200% match on deferrals up to 3% of employee’s compensation |
In addition, each year, each Thrift BEP participant’s account is credited with notional investment earnings at the rate earned by the investments selected by the participant from the pool of investment choices identified in the 401(k) savings plan. Participants in the Thrift BEP are fully vested in the amounts credited to their accounts under the Thrift BEP at all times. A participant’s Thrift BEP account will be distributed to the participant (or his or her beneficiary, in the event of the participant’s death) upon the participant’s termination of employment in either a lump sum or in installment payments over a period of up to ten years (as elected by the participant or beneficiary, as applicable). The Board determines which executive officers are eligible to participate in the Thrift BEP. All of the named executive officers are eligible to participate in the Thrift BEP. As a non-qualified plan, the benefits received from the Thrift BEP do not receive the same tax treatment and funding protection as with our 401(k) savings plan, and our obligations under the Thrift BEP are general obligations of ours. However, we have established a rabbi trust to segregate employee deferral contributions, employer matching contributions, and notional earnings from our other assets. Benefits are generally paid from this trust to the extent it has sufficient assets, and from our other general assets to the extent the trust does not have sufficient assets. The trust is irrevocable, unless we were to become bankrupt or insolvent, in which case all of the assets in the trust would be held for the benefit of our general creditors.
178
Potential Payments Upon Termination or Change in Control
The information below describes the benefits payable to our named executive officers in the event of termination or change in control, as applicable.
Severance Policy.We provide severance benefits to eligible employees through a Board-approved policy. Provided that the following eligibility conditions are met, the Board-approved severance policy will provide the following benefits to our named executive officers other than Mr. Gilleran and Mr. Riccobono, who have severance terms identified in their employment agreements and discussed below.
| | • | | One-half month base salary continuation per year of service, with a minimum of two months and a maximum of twelve months; |
| | • | | Medical, dental and vision coverage, based on what was selected at the time of enrollment, for the length of the salary continuation; and |
| | • | | Individualized outplacement service. |
Employees are eligible for severance payments under the following conditions:
| | • | | The employee has satisfactorily completed the introductory period of employment; |
| | • | | The employee is meeting or exceeding all goals and expectations during the course of the year as defined under our human resources policy; |
| | • | | The employee is involuntarily terminated from active employment without cause; and |
| | • | | The employee signs a separation and release agreement, which releases us from any and all claims arising out of their employment with us or their termination. |
For purposes of the severance plan, without cause shall mean that the reason for termination does not relate to the employee’s performance, work habits, conduct, ability to meet job standards, or the employee’s compliance with Seattle Bank policies, including our code of conduct.
In addition, Mr. Szczepaniak will be entitled to an additional nine months of salary continuation as a result of previous employment with another FHLBank.
Severance Benefits for James E. Gilleran. Under the terms of Mr. Gilleran’s existing employment agreement, which will terminate as of May 1, 2007, Mr. Gilleran’s employment would be terminated upon the occurrence of any one of the following events:
| | • | | incapacitation from illness, accident or other disability and inability to perform his normal duties for a period of ninety consecutive days, upon 30 days’ written notice; |
| | • | | expiration of the term of the employment agreement, or any extension or renewal thereof; |
| | • | | without cause upon notice to Mr. Gilleran, which determination may be made by us at any time at our sole discretion, for any or no reason. |
If Mr. Gilleran’s employment is terminated without cause, he is entitled to receive continuing payments of severance pay at a rate equal to his then-current base salary, for a period of 12 months from the date of such termination and continued health insurance benefits for a period of 12 months. No severance payment would be provided if Mr. Gilleran is terminated with cause related to a material breach of the provisions of his employment agreement; or willful, wanton or grossly negligent non-performance or misfeasance of his assigned responsibilities; or dishonest or fraudulent conduct, a deliberate attempt to do an injury to the Seattle Bank, or conduct that materially discredits the Seattle Bank.
179
Change in Control Benefits for James E. Gilleran.If his employment is terminated as a result of a change of control due to the merger or consolidation of the Seattle Bank with or into another Federal Home Loan Bank, or the liquidation of the Seattle Bank, Mr. Gilleran will be entitled to receive a lump sum severance payment in an amount equal to 24 months of his then-current base salary. In addition, we would pay Mr. Gilleran’s premiums for continued health insurance benefits for a period of 18 months.
Severance Benefits for Richard M. Riccobono. Under the terms of Mr. Riccobono’s current and new employment agreements, Mr. Riccobono’s employment would be terminated upon the occurrence of any one of the following events:
| | • | | incapacitation from illness, accident or other disability and inability to perform his normal duties for a period of ninety consecutive days, upon 30 days’ written notice; |
| | • | | expiration of the term of the employment agreement, or any extension or renewal thereof; |
| | • | | without cause upon notice to Mr. Riccobono, which determination may be made by us at any time at our sole discretion, for any or no reason. |
If Mr. Riccobono’s employment is terminated without cause, he is entitled to receive continuing payments of severance pay at a rate equal to his then-current base salary, for a period of 12 months from the date of such termination and continued health insurance benefits for a period of 12 months. No severance payment would be provided if Mr. Riccobono is terminated with cause related to a material breach of the provisions of his employment agreement; or willful, wanton or grossly negligent non-performance or misfeasance of his assigned responsibilities; or dishonest or fraudulent conduct, a deliberate attempt to do an injury to the Seattle Bank, or conduct that materially discredits the Seattle Bank.
Change in Control Benefit for Richard M. Riccobono. If his employment is terminated as a result of a change of control due to the merger or consolidation of the Seattle Bank with or into another Federal Home Loan Bank, or the liquidation of the Seattle Bank, Mr. Riccobono will be entitled to receive a lump sum severance payment in an amount equal to 24 months of his then-current base salary. In addition, we would pay Mr. Riccobono’s premiums for continued health insurance benefits for a period of 18 months.
Short-Term and Long-Term Cash-Based Incentive Compensation Plans. Named executive officers who retire on or after age 65, or whose combined age and service is at least 70 years, who die or become disabled while still employed by the Seattle Bank, or who are involuntarily terminated without cause during the performance period may receive a prorated lump-sum plan award under our short-term and long-term cash-based incentive compensation plans. In such a case, the president and chief executive officer must nominate the other named executive officers and the GBC Committee must recommend that the Board approve such action. The Executive Committee in its discretion may also recommend that the Board approve the president and chief executive officer to receive such an award.
2006 Post-Employment Compensation
The following tables estimate the post-employment compensation information, as described in the narrative above under this “Potential Payments upon Termination or Change in Control” section, for each of our named executive officers, assuming termination or a change in control had occurred on December 29, 2006, the last business day of 2006. These tables do not include payments that would have been received under the Pentegra DB Plan, Retirement BEP, Thrift BEP or any benefits that are available to all employees generally, such as our 401(k) savings plan. The payments that would have been received under the Pentegra DB Plan, Retirement BEP and the Thrift BEP are described in the sections “2006 Pension Benefits” and “2006 Non-Qualified Deferred Compensation” above, as applicable. These tables also do not include payment under our cash-based incentive compensation plans because named executive officers would not be entitled to any such awards without being
180
nominated for an award by the president and chief executive officer and Board approval. Actual amounts payable can only be determined at the time of termination or change in control.
| | | | | | | | | | |
Name and Title | | Benefit | | Involuntary Termination w/o Cause | | | Change in Control | |
James E. Gilleran
President and Chief Executive Officer | | Cash severance | | $ | 540,750 | (1) | | $ | 1,081,500 | (2) |
| | Health and welfare(3) | | | 8,053 | | | | 12,080 | |
| | | | | | | | | | |
| | | | | | | | | | |
| | Total value | | $ | 548,803 | | | $ | 1,093,580 | |
| | | | | | | | | | |
| (1) | Represents 12 months of continuing payments of severance from date of termination. |
| (2) | Represents lump sum cash payment. |
| (3) | Represents continuation of coverage for medical/dental/vision for 12 months due to severance or 18 months due to change in control. |
| | | | | | | |
Name and Title | | Benefit | | Involuntary Termination w/o Cause | | |
Mark R. Szczepaniak
Senior Vice President Chief Financial Officer | | Cash severance(1) | | $ | 259,646 | | |
| | Health and welfare (2) | | | 11,180 | | |
| | Outplacement | | | 4,800 | | |
| | | | | | | |
| | Total value | | $ | 275,626 | | |
| | | | | | | |
| (1) | Represents 11 months of continuing payments of severance from date of termination. |
| (2) | Represents continuation of coverage for medical/dental/vision for 11 months due to severance. |
| | | | | | | | | | |
Name and Title | | Benefit | | Involuntary Termination w/o Cause | | | Change in Control | |
Richard M. Riccobono
Executive Vice President
Chief Operating Officer | | Cash severance | | $ | 340,050 | (1) | | $ | 680,100 | (2) |
| | Health and welfare(3) | | | 12,197 | | | | 18,296 | |
| | | | | | | | | | |
| | | | | | | | | | |
| | Total value | | $ | 352,247 | | | $ | 698,396 | |
| | | | | | | | | | |
| (1) | Represents 12 months of continuing payments of severance from date of termination. |
| (2) | Represents lump sum cash payment. |
| (3) | Represents continuation of coverage for medical/dental/vision for 12 months due to severance or 18 months due to change in control. |
| | | | | | | |
Name and Title | | Benefit | | Involuntary Termination w/o Cause | | |
Steven R. Horton
Senior Vice President
Chief Risk Officer | | Cash severance (1) | | $ | 162,823 | | |
| | Health and welfare (2) | | | 8,106 | | |
| | Outplacement | | | 4,800 | | |
| | | | | | | |
| | Total value | | $ | 175,729 | | |
| | | | | | | |
| (1) | Represents 7 months of continuing payments of severance from date of termination. |
| (2) | Represents continuation of coverage for medical/dental/vision for 7 months due to severance. |
| | | | | | | |
Name and Title | | Benefit | | Involuntary Termination w/o Cause | | |
Sheryl A. Symonds
Senior Vice President
General Counsel and Corporate Secretary | | Cash severance (1) | | $ | 39,197 | | |
| | Health and welfare (2) | | | 2,033 | | |
| | Outplacement | | | 4,800 | | |
| | | | | | | |
| | Total value | | $ | 46,030 | | |
| | | | | | | |
| (1) | Represents 2 months of continuing payments of severance from date of termination. |
| (2) | Represents continuation of coverage for medical/dental/vision for 2 months due to severance. |
181
Director Compensation
Compensation for directors was determined and limited in 2000 with the enactment of the GLB Act, subject to adjustments by the Finance Board based on the percentage annual increase in the Consumer Price Index. The maximum compensation limits for 2007 are $29,944 for an FHLBank chairman, $23,955 for a vice chair, and $17,967 for all other directors. Within these limits, for 2007, we set meeting-day board meeting fees, defined by per-day attendance at a board or committee meeting, including teleconference attendance, at $2,500 for the chairman, $2,000 for the vice chair, and $1,500 for all other directors. The maximum compensation limits for 2006 were $29,357 for an FHLBank chair, $23,486 for a vice chair, and $17,614 for all other directors. Within these 2006 limits, we set per-meeting in-person board meeting fees at $3,000 for the chair and $2,000 for all other directors. Board conference call meeting fees were set at $1,500 for the chairman and $1,000 for all other directors. Board committee meeting fees were set at $800 for the chairman, $1,200 for committee chairs, and $800 for all other directors. Directors are eligible to participate in our Deferred Compensation Plan for the Board. Under this plan, directors may elect to defer all or a portion of their director’s fees earned. Amounts deferred under this plan accrue interest and become payable to the director upon the expiration of the deferral period, which is irrevocably established by the director at the time the director elects to defer director fees.
In addition, each director is eligible for an annual allocation for director training. The allocation for 2007 is $3,000 and in 2006 was also $3,000. Directors also are reimbursed for reasonable Seattle Bank-related travel expenses. Total directors’ fees, training allocation, and reimbursed travel expenses paid by us were $514,669 for the year ended December 31, 2006. Fees paid to directors compensate directors for the time spent reviewing board and committee materials, preparing for board and committee meetings, participating in other board and committee activities, and for actual time spent attending board and committee meetings.
2006 Director Compensation Table
The following table sets forth the compensation earned by our directors who provided services to us as directors in the year ended December 31, 2006.
| | | | | | |
Name | | Fees Earned or Paid in Cash | | Total |
| (In dollars) | | | | |
Current Directors | | | | | | |
Mike C. Daly, chairman | | $ | 29,375 | | $ | 29,375 |
Craig E. Dahl, vice chair | | | 23,486 | | | 23,486 |
Daniel R. Fauske | | | 17,614 | | | 17,614 |
Harold B. Gilkey | | | 17,614 | | | 17,614 |
William V. Humphreys | | | 17,614 | | | 17,614 |
Russell J. Lau | | | 17,614 | | | 17,614 |
William A. Longbrake | | | 17,614 | | | 17,614 |
Park Price (1) | | | 11,743 | | | 11,743 |
Donald V. Rhodes | | | 17,614 | | | 17,614 |
Jack T. Riggs, M.D. | | | 17,614 | | | 17,614 |
| | |
Former Directors | | | | | | |
W. David Hemingway (2) | | | 17,614 | | | 17,614 |
Michael Mooney (3) | | | 8,600 | | | 8,600 |
James H. Strosahl (2) | | | 17,614 | | | 17,614 |
| (1) | Mr. Price was appointed to the Board on May 17, 2006. |
| (2) | Messrs. Hemingway and Strosahl departed the Board on December 31, 2006. |
| (3) | Mr. Mooney departed the Board on April 20, 2006. |
182
ITEM 12. SECURITY OWNERSHIP OF CERTAIN BENEFICIAL OWNERS AND MANAGEMENT AND RELATED STOCKHOLDER MATTERS
The Seattle Bank is a cooperative of which its members own all of the outstanding capital stock, except in limited circumstances, for example, for a period after a member is acquired by a nonmember. As of December 31, 2006, the Seattle Bank had 379 stockholders holding a total of 22,102,184 shares of Class B stock, including 692,217 shares of mandatorily redeemable Class B stock, and no shares of Class A stock.
Five Percent Beneficial Holders
The following table lists the stockholders that beneficially held more than five percent of our outstanding capital stock as of December 31, 2006.
| | | | | |
Member Name | | Class B Shares Held | | Percentage of Total Outstanding Shares | |
Washington Mutual Bank, F.S.B. | | 5,900,469 | | 26.70 | % |
1301 Second Avenue | | | | | |
Seattle, WA 98101 | | | | | |
| | |
Bank of America Oregon, N.A. | | 2,493,328 | | 11.28 | % |
1001 S.W. 5th Avenue | | | | | |
Portland, OR 97204 | | | | | |
| | |
Washington Federal Savings and Loan | | 1,294,534 | | 5.86 | % |
425 Pike Street | | | | | |
Seattle, WA 98101 | | | | | |
| | |
Merrill Lynch Bank, U.S.A. | | 1,216,018 | | 5.50 | % |
15 W. South Temple Street, Suite 300 | | | | | |
Salt Lake City, UT 84111 | | | | | |
Beneficial Ownership of Members with Officers Serving as Seattle Bank Directors
Because under federal law and regulations a majority of our Board must be elected directly from our membership, our elected directors are officers or directors of members that own our capital stock. The following table presents our outstanding capital stock held by members as of December 31, 2006, whose officers or directors served as directors of the Seattle Bank as of that date.
Limitations on Beneficial Ownership of Seattle Bank’s Capital Stock
Beneficial ownership is determined in accordance with Rule 13d-3 of the Exchange Act. A beneficial owner of a security includes any person who, directly or indirectly, holds (i) voting power and/or (ii) investment power over the security. Under federal law and regulations, individuals cannot own shares of FHLBank capital stock, and, accordingly, no Seattle Bank director or officer owns or may own capital stock of the Seattle Bank. Furthermore, each director disclaims any beneficial ownership of all shares of capital stock of the Seattle Bank held by members with which the director is affiliated.
Our members are limited to voting on the election of those members of our Board who are not appointed by the Finance Board. See “Item 10. Directors, Executive Officers and Corporate Governance—Corporate Governance.” The maximum number of votes that a member may cast is capped at the number of shares of Class B stock the member was required to hold on December 31 of the preceding year, but no more than the average amount of Class B stock required to be held by members in the same state as of that date. In addition, each member is eligible to vote for the open director seats only in the state in which its principal place of business is located. Accordingly, none of the members listed above or any individual director affiliated with any of such members holds significant voting power over the election of our Board.
183
| ITEM 13. | CERTAIN RELATIONSHIPS AND RELATED TRANSACTIONS, AND DIRECTOR INDEPENDENCE |
The Seattle Bank is a cooperative of members. All of our outstanding capital stock is owned by our members, except in limited circumstances, for example, for a period after a member is acquired by a nonmember. We conduct most of our business with members, as federal regulation generally requires us to transact business predominantly with our members. In addition, under federal regulation the majority of our directors are elected by and from our members. Accordingly, in the normal course of our business, we extend credit to and transact other business with members whose officers (or affiliates of such officers) serve as directors of the Seattle Bank. It is our policy to extend credit to and transact other business with members having directors, officers, or employees serving on our Board (or persons which are affiliated with such persons) on terms and conditions that are no more favorable than comparable transactions with similarly situated members having no board representation. All non-ordinary course of business transactions, including those with related parties, are reviewed and approved by our Asset and Liability Management Committee under authority delegated by our president and chief executive officer and then presented for approval to the FOAH Committee. See Note 19 in “Item 8. Financial Statements and Supplementary Data—Audited Financial Statements –Notes to Financial Statements” for discussions of transactions with our members and their affiliates.
Director Independence and Audit and Compliance Committee Financial Expert
General
The Board is required to evaluate and report on the independence of Seattle Bank directors under two distinct director independence standards. First, Finance Board regulations establish independence criteria for directors who serve as members of the Audit and Compliance Committee. Second, SEC rules require that the Board apply the independence criteria of a national securities exchange or automated quotation system in assessing the independence of its directors.
As of the date of this report, the Seattle Bank has 12 directors, 10 of whom were elected by our members and two of whom were appointed by the Finance Board. None of the directors is an “inside” director. That is, none of the directors is a Seattle Bank employee or officer. Further, the directors are prohibited from personally owning stock or stock options in the Seattle Bank. Each of the elected directors, however, is a senior officer or director of a member of the Seattle Bank that is encouraged to engage in transactions with us on a regular basis.
184
Finance Board Regulations Regarding Independence
The Finance Board director independence standards prohibit an individual from serving as a member of the Audit and Compliance Committee if he or she has one or more disqualifying relationships with the Seattle Bank or its management that would interfere with the exercise of that individual’s independent judgment. Disqualifying relationships considered by the Board are: employment with the Seattle Bank at any time during the last five years; acceptance of compensation from the Seattle Bank other than for service as a director; being a consultant, advisor, promoter, underwriter, or legal counsel for the Seattle Bank at any time within the last five years; and being an immediate family member of an individual who is or who has been within the past five years a Seattle Bank executive officer. The Board assesses the independence of each director under the Finance Board’s independence standards regardless of whether he or she serves on the Audit and Compliance Committee. As of March 30, 2007, each of the Seattle Bank’s directors was independent under these criteria.
SEC Rules Regarding Independence
SEC rules require the Board to adopt standards to evaluate its directors’ independence. Pursuant to those rules, the Board adopted the independence standards of the New York Stock Exchange, or the NYSE, to determine which of its directors were independent, which members of the Audit and Compliance Committee and the GBC Committee were not independent, and whether the Audit and Compliance Committee’s financial expert was independent, as of March 30, 2007.
After applying the NYSE independence standards to each of our directors, the Board determined that, as of March 30, 2007, elected directors Dahl, Daly, DeVico, Humphreys, Price, and Rhodes, and appointed directors Fauske and Riggs, were independent. Relationships that the Board considered in its determination of independence included: the cooperative nature of the Seattle Bank, the position held by the director at his member institution, the equity position in the Seattle Bank of the director’s financial institution, and the financial transactions with the Seattle Bank of the director’s financial institution (as described in more detail above). The Board determined that none of these were material relationships under the NYSE independence standards.
The Board has a standing Audit and Compliance Committee. The Board determined that Audit and Compliance Committee members Lau and Zimmerman were not independent under the NYSE independence standards applicable for audit committee members due to business transacted by the Seattle Bank with member institutions affiliated with such directors. However, as stated above, the Board determined that each member of the Audit and Compliance Committee was independent under the Finance Board’s standards applicable to audit committees. In addition, the Board determined that GBC Committee members Gilkey and Longbrake were not independent under the NYSE independence standards applicable for compensation committee members due to business transacted by Seattle Bank with member institutions affiliated with such directors. Further, the Board determined that director Dahl was an audit committee financial expert within the meaning of the SEC rules, and as of March 30, 2007, was independent under NYSE independence standards.
185
ITEM 14. PRINCIPAL ACCOUNTING FEES AND SERVICES
The following table sets forth the aggregate fees billed to the Seattle Bank for the years ended December 31, 2006 and 2005, by its principal accounting firm, PricewaterhouseCoopers LLP.
| | | | | | |
| | | For the Years
Ended
December 31, |
Audit Charges | | 2006 | | 2005 |
| (dollars in thousands) | | |
Audit fees | | $ | 735 | | $ | 1,641 |
Audit-related fees | | | 455 | | | 249 |
All other fees | | | 4 | | | 7 |
| | | | | | |
Total | | $ | 1,194 | | $ | 1,897 |
| | | | | | |
Audit fees during the years ended December 31, 2006 and 2005 were for professional services rendered in connection with the audits and quarterly reviews of the financial statements of the Seattle Bank, other statutory and regulatory filings and matters, and consultations related to registration with the SEC.
Audit-related fees for the years ended December 31, 2006 and 2005, were for assurance and related services, primarily for the reviews of internal controls over financial reporting and consultations with management as to the accounting treatments of specific products and transactions.
All other fees for the year ended December 31, 2006 were for non-attestation advisory services, primarily for presentations in FHLBank System conferences.
The Seattle Bank is exempt from all federal, state, and local taxation on income. No tax fees were paid during the years ended December 31, 2006 and 2005.
On an annual basis, Seattle Bank management presents to the Audit and Compliance Committee of the Board a budget for the coming year’s audit fees, as well as any audit-related and non-audit related fees. These budgeted amounts are reviewed by the Audit and Compliance Committee and approved by the Audit and Compliance Committee. At each regular meeting the Audit and Compliance Committee pre-approves specific services to be performed by the Seattle Bank’s auditors. In addition, the chair of the Audit and Compliance Committee has been delegated the authority to pre-approve any services between scheduled meetings to be performed by the Seattle Bank’s auditors and reports any such pre-approved services to the Audit and Compliance Committee at its next meeting.
186
PART IV.
| | |
Exhibit
No. | | EXHIBITS |
| 3.1 | | Form of Organization Certificate of the Federal Home Loan Bank of Seattle (formerly the Federal Home Loan Bank of Spokane), adopted December 31, 1963 (incorporated by reference to Exhibit 3.1 to the registration statement on Form 10 filed with the SEC, file no. 000-51406). |
| |
| 3.2 | | Bylaws of the Federal Home Loan Bank of Seattle, as adopted March 31, 2006 (incorporated by reference to Exhibit 3.2 to the registration statement on Form 10 filed with the SEC, file no. 000-51406). |
| |
| 4.1 | | Capital Plan of the Federal Home Loan Bank of Seattle, adopted March 5, 2002, as amended on November 22, 2002, December 8, 2004, March 9, 2005, June 8, 2005, and October 11, 2006 (incorporated by reference to Exhibit 4.1 to the Form 8-K filed with the SEC on October 16, 2006). |
| |
| 10.1 | | Employment Agreement between Federal Home Loan Bank of Seattle and Richard M. Riccobono, dated as of February 26, 2007, effective as of May 1, 2007 (incorporated by reference to Exhibit 10.1 to the Form 8-K filed with the SEC on February 28, 2007). |
| |
| 10.2 | | Separation, Mutual Release and Consulting Agreement between Federal Home Loan Bank and James E. Gilleran, dated as of February 26, 2007, effective May 1, 2007 (incorporated by reference to Exhibit 10.2 to the Form 8-K filed with the SEC on February 28, 2007). |
| |
| 10.3 | | Federal Home Loan Bank of Seattle Bank Incentive Compensation Plan (BICP) - Annual Plan for President and CEO as of January 1, 2006 (incorporated by reference to Exhibit 10.16 to the registration statement on Form 10 filed with the SEC, file no. 000-51406). |
| |
| 10.4 | | Federal Home Loan Bank of Seattle Bank Incentive Compensation Plan (BICP) – Long-term Incentive Plan as of January 1, 2005. |
| |
| 10.5 | | Federal Home Loan Bank of Seattle Bank Incentive Compensation Plan (BICP) – Long-term Incentive Plan as of January 1, 2006 (incorporated by reference to Exhibit 10.15 to the registration statement on Form 10 filed with the SEC, file no. 000-51406). |
| |
| 10.6 | | Federal Home Loan Bank of Seattle Bank Incentive Compensation Plan (BICP) - Annual Plan for Exempt Staff and Officers as of January 1, 2006 (incorporated by reference to Exhibit 10.14 to the registration statement on Form 10 filed with the SEC, file no. 000-51406). |
| |
| 10.7 | | Employment Agreement between Federal Home Loan Bank of Seattle and James E. Gilleran dated as of May 31, 2005 (incorporated by reference to Exhibit 10.6 to the registration statement on Form 10 filed with the SEC, file no. 000-51406). |
| |
| 10.8 | | Employment Agreement between Federal Home Loan Bank of Seattle and Richard M. Riccobono, dated as of July 19, 2005, effective as of August 10, 2005 (incorporated by reference to Exhibit 10.7 to the registration statement on Form 10 filed with the SEC, file no. 000-51406). |
| |
| 10.9 | | Office Lease Agreement between the Federal Home Loan Bank of Seattle and Fifteen-O-One Fourth Avenue LP, as amended, dated as of July 15, 1991. |
| |
| 10.10 | | Retirement Fund Benefit Equalization Plan of the Federal Home Loan Bank of Seattle, as amended, effective November 23, 1991 (incorporated by reference to Exhibit 10.11 to the registration statement on Form 10 filed with the SEC, file no. 000-51406). |
| |
| 10.11 | | Thrift Plan Benefit Equalization Plan of the Federal Home Loan Bank of Seattle, as amended, effective July 1, 1994 (incorporated by reference to Exhibit 10.12 to the registration statement on Form 10 filed with the SEC, file no. 000-51406). |
187
| | |
Exhibit
No. | | |
| 10.12 | | Deferred Compensation Plan for the Board of Directors of the Federal Home Loan Bank of Seattle, as amended, effective March 21, 1997 (incorporated by reference to Exhibit 10.13 to the registration statement on Form 10 filed with the SEC, file no. 000-51406). |
| |
| 10.13 | | Form of Advances, Security and Deposit Agreement (incorporated by reference to Exhibit 10.17 to the registration statement on Form 10 filed with the SEC, file no. 000-51406). |
| |
| 10.14 | | Purchase Price and Terms Letter between Federal Home Loan Bank of Seattle and Bank of America, National Association, dated August 25, 2005 (incorporated by reference to Exhibit 10.18 to the registration statement on Form 10 filed with the SEC, file no. 000-51406). |
| |
| 10.15 | | Federal Housing Finance Board Waiver Concerning the Direct Placement of Consolidated Obligations, dated December 15, 2005 (relating to Written Agreement between the Federal Home Loan Bank of Seattle and the Federal Housing Finance Board, effective December 10, 2004) (incorporated by reference to Exhibit 10.19 to the registration statement on Form 10 filed with the SEC, file no. 000-51406). |
| |
| 10.16 | | Written Agreement between the Federal Home Loan Bank of Seattle and the Federal Housing Finance Board, effective December 10, 2004 [terminated January 11, 2007] (incorporated by reference to Exhibit 10.1 to the registration statement on Form 10 filed with the SEC, file no. 000-51406). |
| |
| 10.20 | | Federal Home Loan Bank of Seattle Executive Supplemental Retirement Plan, Effective as of January 1, 2007. |
| |
| 12.1 | | Computation of Earnings to Fixed Charges. |
| |
| 31.1 | | Certification of the President and Chief Executive Officer pursuant to Section 302 of the Sarbanes-Oxley Act of 2002. |
| |
| 31.2 | | Certification of the Chief Financial Officer pursuant to Section 302 of the Sarbanes-Oxley Act of 2002. |
| |
| 32.1 | | Certification of the President and Chief Executive Officer pursuant to 18.U.S.C. Section 1350, as adopted pursuant to Section 906 of the Sarbanes-Oxley Act of 2002. |
| |
| 32.2 | | Certification of the Chief Financial Officer pursuant to 18.U.S.C. Section 1350, as adopted pursuant to Section 906 of the Sarbanes-Oxley Act of 2002. |
| |
| 99.1 | | Federal Home Loan Bank of Seattle Audit Committee Report. |
188
SIGNATURES
Pursuant to the requirements of the Securities Exchange Act of 1934, the registrant has duly caused this report to be signed on its behalf by the undersigned thereunto duly authorized.
| | | | | | | | |
| | | | |
| By: | | /s/ James E. Gilleran | | | | Dated: | | March 30, 2007 |
| | James E. Gilleran President and Chief Executive Officer | | | | | | |
| | | | |
| By: | | /s/ Mark R. Szczepaniak | | | | Dated: | | March 30, 2007 |
| | Mark R. Szczepaniak Senior Vice President, Chief Financial Officer | | | | | | |
Pursuant to the requirements of the Securities Exchange Act of 1934, this report has been signed below by the following persons on behalf of the registrant and in the capacities and on the dates indicated.
| | | | | | | | |
| | | | |
| By: | | /s/ Mike C. Daly | | | | Dated: | | March 30, 2007 |
| | Mike C. Daly, Chairman | | | | | | |
| | | | |
| By: | | /s/ Craig E. Dahl | | | | Dated: | | March 30, 2007 |
| | Craig E. Dahl, Vice Chair | | | | | | |
| | | | |
| By: | | /s/ Michael A. DeVico | | | | Dated: | | March 30, 2007 |
| | Michael A. DeVico, Director | | | | | | |
| | | | |
| By: | | /s/ Daniel R. Fauske | | | | Dated: | | March 30, 2007 |
| | Daniel R. Fauske, Director | | | | | | |
| | | | |
| By: | | /s/ Harold B. Gilkey | | | | Dated: | | March 30, 2007 |
| | Harold B. Gilkey, Director | | | | | | |
| | | | |
| By: | | /s/ William V. Humphreys | | | | Dated: | | March 30, 2007 |
| | William V. Humphreys, Director | | | | | | |
| | | | |
| By: | | /s/ Russell J. Lau | | | | Dated: | | March 30, 2007 |
| | Russell J. Lau, Director | | | | | | |
| | | | |
| By: | | /s/ William A. Longbrake | | | | Dated: | | March 30, 2007 |
| | William A. Longbrake, Director | | | | | | |
| | | | |
| By: | | /s/ Park Price | | | | Dated: | | March 30, 2007 |
| | Park Price, Director | | | | | | |
| | | | |
| By: | | /s/ Donald V. Rhodes | | | | Dated: | | March 30, 2007 |
| | Donald V. Rhodes, Director | | | | | | |
| | | | |
| By: | | /s/ Jack T. Riggs, M.D. | | | | Dated: | | March 30, 2007 |
| | Jack T. Riggs, M.D., Director | | | | | | |
| | | | |
| By: | | /s/ Kenneth Gordon Zimmerman | | | | Dated: | | March 30, 2007 |
| | Kenneth Gordon Zimmerman, Director | | | | | | |
| | |
Exhibit
No. | | Index of Exhibits |
| 3.1 | | Form of Organization Certificate of the Federal Home Loan Bank of Seattle (formerly the Federal Home Loan Bank of Spokane), adopted December 31, 1963 (incorporated by reference to Exhibit 3.1 to the registration statement on Form 10 filed with the SEC, file no. 000-51406). |
| |
| 3.2 | | Bylaws of the Federal Home Loan Bank of Seattle, as adopted March 31, 2006 (incorporated by reference to Exhibit 3.2 to the registration statement on Form 10 filed with the SEC, file no. 000-51406). |
| |
| 4.1 | | Capital Plan of the Federal Home Loan Bank of Seattle, adopted March 5, 2002, as amended on November 22, 2002, December 8, 2004, March 9, 2005, June 8, 2005, and October 11, 2006 (incorporated by reference to Exhibit 4.1 to the Form 8-K filed with the SEC on October 16, 2006). |
| |
| 10.1 | | Employment Agreement between Federal Home Loan Bank of Seattle and Richard M. Riccobono, dated as of February 26, 2007, effective as of May 1, 2007 (incorporated by reference to Exhibit 10.1 to the Form 8-K filed with the SEC on February 28, 2007). |
| |
| 10.2 | | Separation, Mutual Release and Consulting Agreement between Federal Home Loan Bank and James E. Gilleran, dated as of February 26, 2007, effective May 1, 2007 (incorporated by reference to Exhibit 10.2 to the Form 8-K filed with the SEC on February 28, 2007). |
| |
| 10.3 | | Federal Home Loan Bank of Seattle Bank Incentive Compensation Plan (BICP) - Annual Plan for President and CEO as of January 1, 2006 (incorporated by reference to Exhibit 10.16 to the registration statement on Form 10 filed with the SEC, file no. 000-51406). |
| |
| 10.4 | | Federal Home Loan Bank of Seattle Bank Incentive Compensation Plan (BICP) – Long-term Incentive Plan as of January 1, 2005. |
| |
| 10.5 | | Federal Home Loan Bank of Seattle Bank Incentive Compensation Plan (BICP) – Long-term Incentive Plan as of January 1, 2006 (incorporated by reference to Exhibit 10.15 to the registration statement on Form 10 filed with the SEC, file no. 000-51406). |
| |
| 10.6 | | Federal Home Loan Bank of Seattle Bank Incentive Compensation Plan (BICP) - Annual Plan for Exempt Staff and Officers as of January 1, 2006 (incorporated by reference to Exhibit 10.14 to the registration statement on Form 10 filed with the SEC, file no. 000-51406). |
| |
| 10.7 | | Employment Agreement between Federal Home Loan Bank of Seattle and James E. Gilleran dated as of May 31, 2005 (incorporated by reference to Exhibit 10.6 to the registration statement on Form 10 filed with the SEC, file no. 000-51406). |
| |
| 10.8 | | Employment Agreement between Federal Home Loan Bank of Seattle and Richard M. Riccobono, dated as of July 19, 2005, effective as of August 10, 2005 (incorporated by reference to Exhibit 10.7 to the registration statement on Form 10 filed with the SEC, file no. 000-51406). |
| |
| 10.9 | | Office Lease Agreement between the Federal Home Loan Bank of Seattle and Fifteen-O-One Fourth Avenue LP, as amended, dated as of July 15, 1991. |
| |
| 10.10 | | Retirement Fund Benefit Equalization Plan of the Federal Home Loan Bank of Seattle, as amended, effective November 23, 1991 (incorporated by reference to Exhibit 10.11 to the registration statement on Form 10 filed with the SEC, file no. 000-51406). |
| |
| 10.11 | | Thrift Plan Benefit Equalization Plan of the Federal Home Loan Bank of Seattle, as amended, effective July 1, 1994 (incorporated by reference to Exhibit 10.12 to the registration statement on Form 10 filed with the SEC, file no. 000-51406). |
| |
| 10.12 | | Deferred Compensation Plan for the Board of Directors of the Federal Home Loan Bank of Seattle, as amended, effective March 21, 1997 (incorporated by reference to Exhibit 10.13 to the registration statement on Form 10 filed with the SEC, file no. 000-51406). |
| |
| 10.13 | | Form of Advances, Security and Deposit Agreement (incorporated by reference to Exhibit 10.17 to the registration statement on Form 10 filed with the SEC, file no. 000-51406). |
| | |
Exhibit
No. | | Index of Exhibits |
| 10.14 | | Purchase Price and Terms Letter between Federal Home Loan Bank of Seattle and Bank of America, National Association, dated August 25, 2005 (incorporated by reference to Exhibit 10.18 to the registration statement on Form 10 filed with the SEC, file no. 000-51406). |
| |
| 10.15 | | Federal Housing Finance Board Waiver Concerning the Direct Placement of Consolidated Obligations, dated December 15, 2005 (relating to Written Agreement between the Federal Home Loan Bank of Seattle and the Federal Housing Finance Board, effective December 10, 2004) (incorporated by reference to Exhibit 10.19 to the registration statement on Form 10 filed with the SEC, file no. 000-51406). |
| |
| 10.16 | | Written Agreement between the Federal Home Loan Bank of Seattle and the Federal Housing Finance Board, effective December 10, 2004 [terminated January 11, 2007] (incorporated by reference to Exhibit 10.1 to the registration statement on Form 10 filed with the SEC, file no. 000-51406). |
| |
| 10.20 | | Federal Home Loan Bank of Seattle Executive Supplemental Retirement Plan, Effective as of January 1, 2007. |
| |
| 12.1 | | Computation of Earnings to Fixed Charges. |
| |
| 31.1 | | Certification of the President and Chief Executive Officer pursuant to Section 302 of the Sarbanes-Oxley Act of 2002. |
| |
| 31.2 | | Certification of the Chief Financial Officer pursuant to Section 302 of the Sarbanes-Oxley Act of 2002. |
| |
| 32.1 | | Certification of the President and Chief Executive Officer pursuant to 18.U.S.C. Section 1350, as adopted pursuant to Section 906 of the Sarbanes-Oxley Act of 2002. |
| |
| 32.2 | | Certification of the Chief Financial Officer pursuant to 18.U.S.C. Section 1350, as adopted pursuant to Section 906 of the Sarbanes-Oxley Act of 2002. |
| |
| 99.1 | | Federal Home Loan Bank of Seattle Audit Committee Report. |