Exhibit 99.2
| ACQUISITION OF SQUARE 1 FINANCIAL March 2, 2015 |
| This communication contains certain forward-looking information about PacWest, Square 1, and the combined company after the close of the transaction that is intended to be covered by the safe harbor for “forward-looking statements” provided by the Private Securities Litigation Reform Act of 1995. All statements other than statements of historical fact are forward-looking statements. Such statements involve inherent risks and uncertainties, many of which are difficult to predict and are generally beyond the control of PacWest, Square 1 and the combined company. Forward-looking statements speak only as of the date they are made and we assume no duty to update such statements. We caution readers that a number of important factors could cause actual results to differ materially from those expressed in, or implied or projected by, such forward-looking statements. In addition to factors previously disclosed in reports filed by PacWest and Square 1 with the SEC, risks and uncertainties for each institution and the combined institution include, but are not limited to: lower than expected revenues; credit quality deterioration or a reduction in real estate values could cause an increase in the allowance for credit losses and a reduction in net earnings; increased competitive pressure among depository institutions; the ability to complete the proposed transaction, including obtaining regulatory approvals and approval by the stockholders of Square 1, or any future transaction, successfully integrate such acquired entities, or achieve expected beneficial synergies and/or operating efficiencies, in each case within expected time-frames or at all; regulatory approvals may not be received on expected timeframes or at all; the possibility that personnel changes will not proceed as planned; the possibility that the cost of additional capital may be more than expected; the possibility that a change in the interest rate environment may reduce net interest margins; asset/liability re-pricing risks and liquidity risks; pending legal matters may take longer or cost more to resolve or may be resolved adversely; general economic conditions, either nationally or in the market areas in which the entities operate or anticipate doing business, are less favorable than expected; and environmental conditions, including natural disasters, may disrupt business, impede operations, or negatively impact the values of collateral securing loans. Pro forma, projected and estimated numbers are used for illustrative purposes only and are not forecasts, and actual results may differ materially. Forward-Looking Statements |
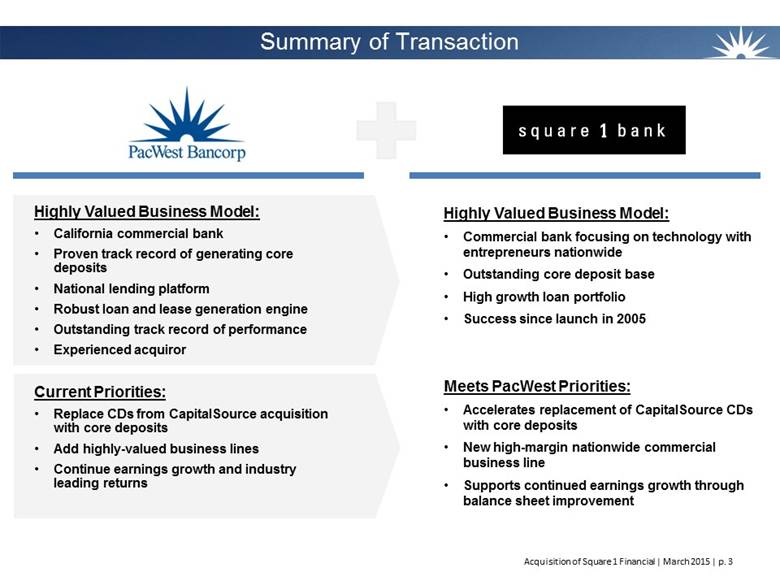
| Summary of Transaction Highly Valued Business Model: California commercial bank Proven track record of generating core deposits National lending platform Robust loan and lease generation engine Outstanding track record of performance Experienced acquiror Current Priorities: Replace CDs from CapitalSource acquisition with core deposits Add highly-valued business lines Continue earnings growth and industry leading returns Highly Valued Business Model: Commercial bank focusing on technology with entrepreneurs nationwide Outstanding core deposit base High growth loan portfolio Success since launch in 2005 Meets PacWest Priorities: Accelerates replacement of CapitalSource CDs with core deposits New high-margin nationwide commercial business line Supports continued earnings growth through balance sheet improvement |
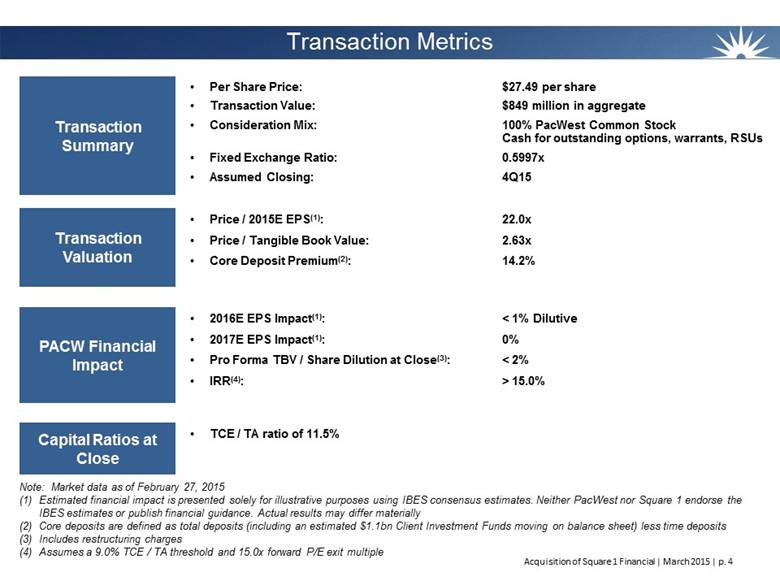
| Transaction Metrics Per Share Price: $27.49 per share Transaction Value: $849 million in aggregate Consideration Mix: 100% PacWest Common Stock Cash for outstanding options, warrants, RSUs Fixed Exchange Ratio: 0.5997x Assumed Closing: 4Q15 Transaction Summary Capital Ratios at Close TCE / TA ratio of 11.5% Price / 2015E EPS(1): 22.0x Price / Tangible Book Value: 2.63x Core Deposit Premium(2): 14.2% Transaction Valuation 2016E EPS Impact(1): < 1% Dilutive 2017E EPS Impact(1): 0% Pro Forma TBV / Share Dilution at Close(3): < 2% IRR(4): > 15.0% PACW Financial Impact Note: Market data as of February 27, 2015 Estimated financial impact is presented solely for illustrative purposes using IBES consensus estimates. Neither PacWest nor Square 1 endorse the IBES estimates or publish financial guidance. Actual results may differ materially Core deposits are defined as total deposits (including an estimated $1.1bn Client Investment Funds moving on balance sheet) less time deposits Includes restructuring charges Assumes a 9.0% TCE / TA threshold and 15.0x forward P/E exit multiple |
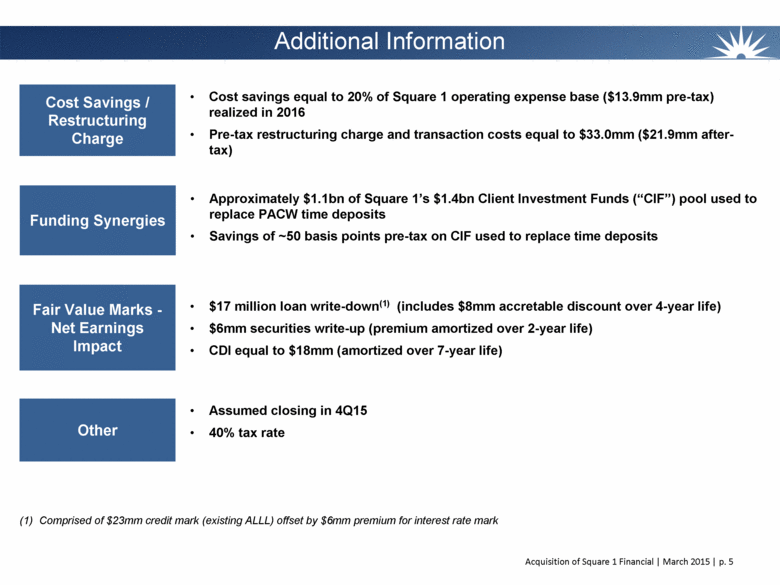
| Additional Information Cost savings equal to 20% of Square 1 operating expense base ($13.9mm pre-tax) realized in 2016 Pre-tax restructuring charge and transaction costs equal to $33.0mm ($21.9mm after-tax) Cost Savings / Restructuring Charge Other Assumed closing in 4Q15 40% tax rate Approximately $1.1bn of Square 1’s $1.4bn Client Investment Funds (“CIF”) pool used to replace PACW time deposits Savings of ~50 basis points pre-tax on CIF used to replace time deposits Funding Synergies $17 million loan write-down(1) (includes $8mm accretable discount over 4-year life) $6mm securities write-up (premium amortized over 2-year life) CDI equal to $18mm (amortized over 7-year life) Fair Value Marks - Net Earnings Impact Comprised of $23mm credit mark (existing ALLL) offset by $6mm premium for interest rate mark |
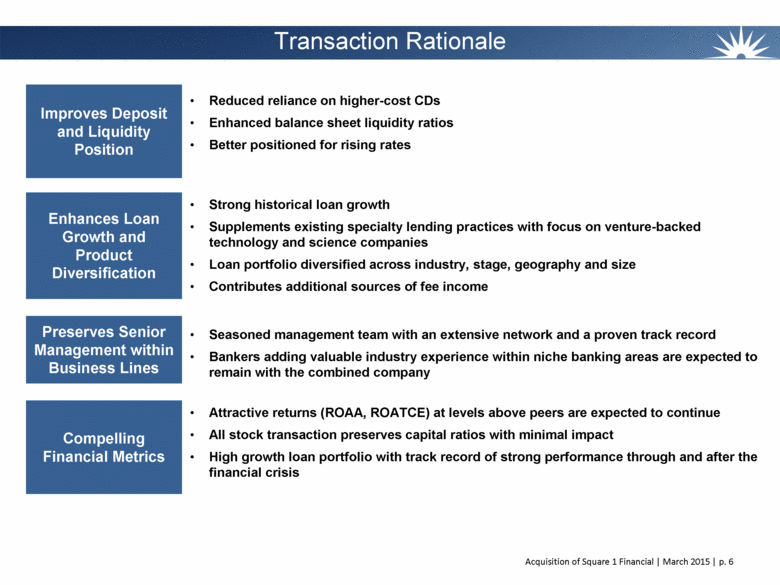
| Transaction Rationale Reduced reliance on higher-cost CDs Enhanced balance sheet liquidity ratios Better positioned for rising rates Improves Deposit and Liquidity Position Seasoned management team with an extensive network and a proven track record Bankers adding valuable industry experience within niche banking areas are expected to remain with the combined company Enhances Loan Growth and Product Diversification Preserves Senior Management within Business Lines Strong historical loan growth Supplements existing specialty lending practices with focus on venture-backed technology and science companies Loan portfolio diversified across industry, stage, geography and size Contributes additional sources of fee income Attractive returns (ROAA, ROATCE) at levels above peers are expected to continue All stock transaction preserves capital ratios with minimal impact High growth loan portfolio with track record of strong performance through and after the financial crisis Compelling Financial Metrics |
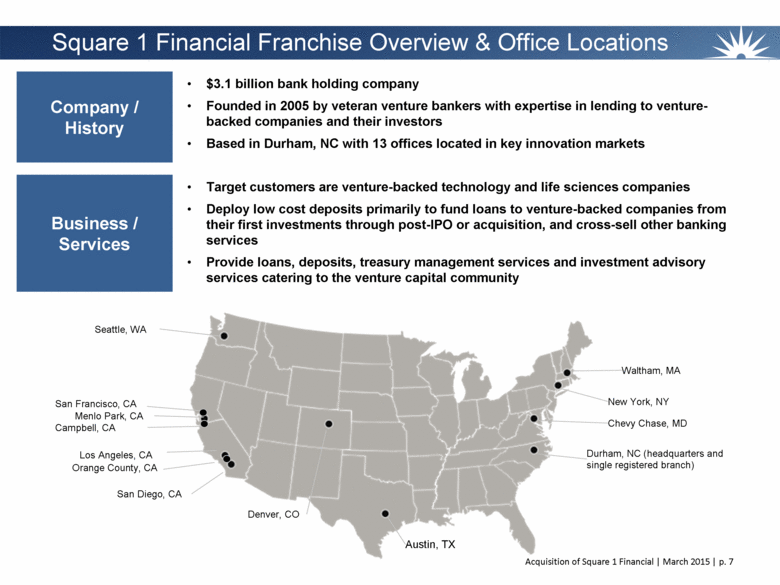
| Seattle, WA Menlo Park, CA San Diego, CA Los Angeles, CA Denver, CO Austin, TX Durham, NC (headquarters and single registered branch) Chevy Chase, MD New York, NY Waltham, MA San Francisco, CA Orange County, CA Campbell, CA Square 1 Financial Franchise Overview & Office Locations $3.1 billion bank holding company Founded in 2005 by veteran venture bankers with expertise in lending to venture-backed companies and their investors Based in Durham, NC with 13 offices located in key innovation markets Company / History Target customers are venture-backed technology and life sciences companies Deploy low cost deposits primarily to fund loans to venture-backed companies from their first investments through post-IPO or acquisition, and cross-sell other banking services Provide loans, deposits, treasury management services and investment advisory services catering to the venture capital community Business / Services |
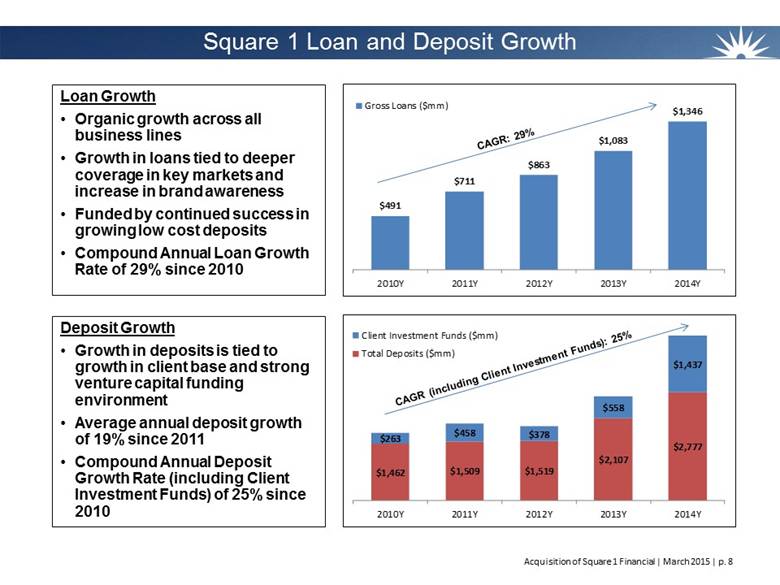
| Square 1 Loan and Deposit Growth Loan Growth Organic growth across all business lines Growth in loans tied to deeper coverage in key markets and increase in brand awareness Funded by continued success in growing low cost deposits Compound Annual Loan Growth Rate of 29% since 2010 Deposit Growth Growth in deposits is tied to growth in client base and strong venture capital funding environment Average annual deposit growth of 19% since 2011 Compound Annual Deposit Growth Rate (including Client Investment Funds) of 25% since 2010 CAGR: 29% CAGR (including Client Investment Funds): 25% |
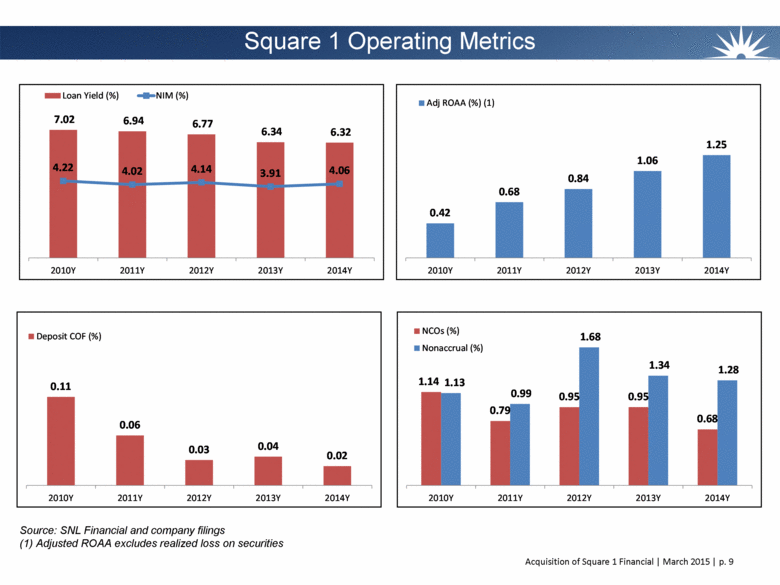
| Square 1 Operating Metrics Source: SNL Financial and company filings (1) Adjusted ROAA excludes realized loss on securities 7.02 6.94 6.77 6.34 6.32 4.22 4.02 4.14 3.91 4.06 2010Y 2011Y 2012Y 2013Y 2014Y Loan Yield (%) NIM (%) 0.11 0.06 0.03 0.04 0.02 2010Y 2011Y 2012Y 2013Y 2014Y Deposit COF (%) 0.42 0.68 0.84 1.06 1.25 2010Y 2011Y 2012Y 2013Y 2014Y Adj ROAA (%) (1) |
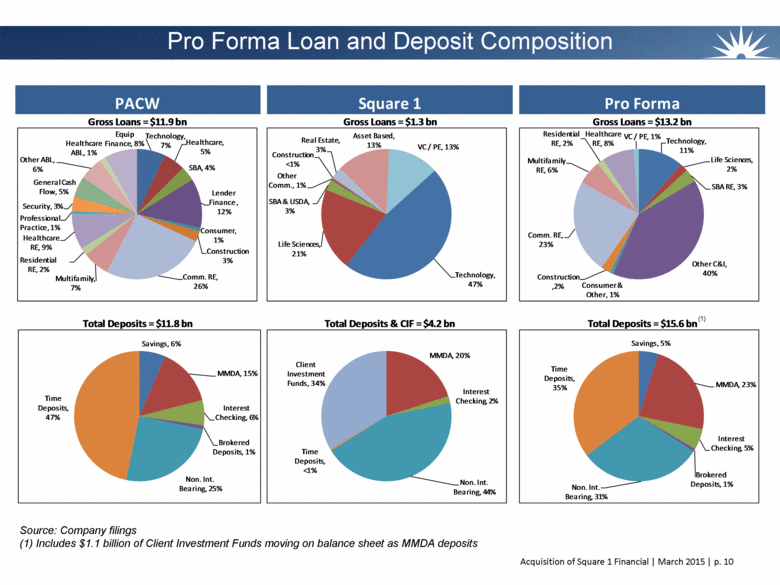
| Pro Forma Loan and Deposit Composition Source: Company filings (1) Includes $1.1 billion of Client Investment Funds moving on balance sheet as MMDA deposits (1) (1) Total Deposits = $15.6 bn PACW Square 1 Pro Forma Gross Loans = $11.9 bn Gross Loans = $1.3 bn Gross Loans = $13.2 bn Total Deposits = $11.8 bn Total Deposits & CIF = $4.2 bn Technology, 7% Healthcare, 5% SBA, 4% Lender Finance , 12% Consumer, 1% Construction 3% Comm. RE, 26% Multifamily, 7% Residential RE, 2% Healthcare RE, 9% Professional Practice, 1% Security, 3% General Cash Flow, 5% Other ABL, 6% Healthcare ABL, 1% Equip Finance, 8% Technology, 47% Life Sciences, 21% SBA & USDA, 3% Other Comm., 1% Construction <1% Real Estate, 3% Asset Based, 13% VC / PE, 13% Technology, 11% Life Sciences, 2% SBA RE, 3% Other C&I, 40% Consumer & Other, 1% Construction ,2% Comm. RE, 23% Multifamily RE, 6% Residential RE, 2% Healthcare RE, 8% VC / PE, 1% Savings, 6% MMDA, 15% Interest Checking, 6% Brokered Deposits, 1% Non. Int. Bearing, 25% Time Deposits, 47% MMDA, 20% Interest Checking, 2% Non. Int. Bearing, 44% Time Deposits, <1% Client Investment Funds, 34% Savings, 5% MMDA, 23% Interest Checking, 5% Brokered Deposits, 1% Non. Int. Bearing, 31% Time Deposits, 35% |
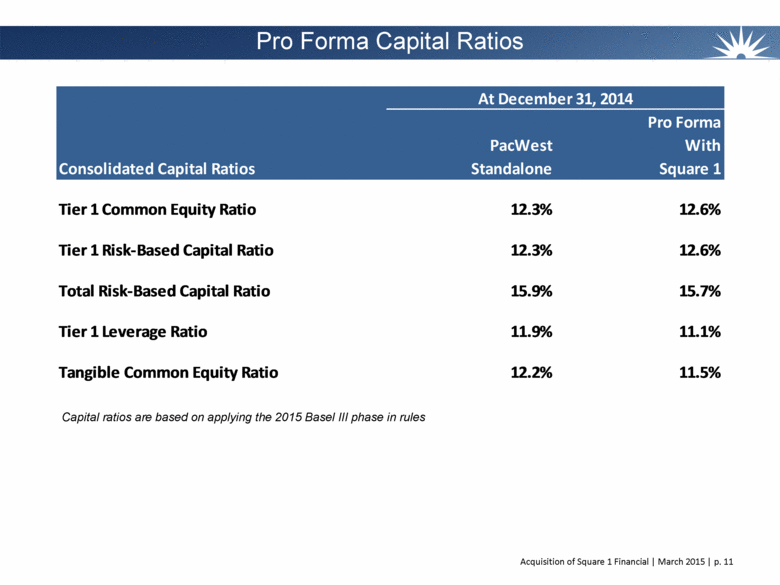
| Pro Forma Capital Ratios Capital ratios are based on applying the 2015 Basel III phase in rules Pro Forma PacWest With Consolidated Capital Ratios Standalone Square 1 Tier 1 Common Equity Ratio 12.3% 12.6% Tier 1 Risk-Based Capital Ratio 12.3% 12.6% Total Risk-Based Capital Ratio 15.9% 15.7% Tier 1 Leverage Ratio 11.9% 11.1% Tangible Common Equity Ratio 12.2% 11.5% At December 31, 2014 |
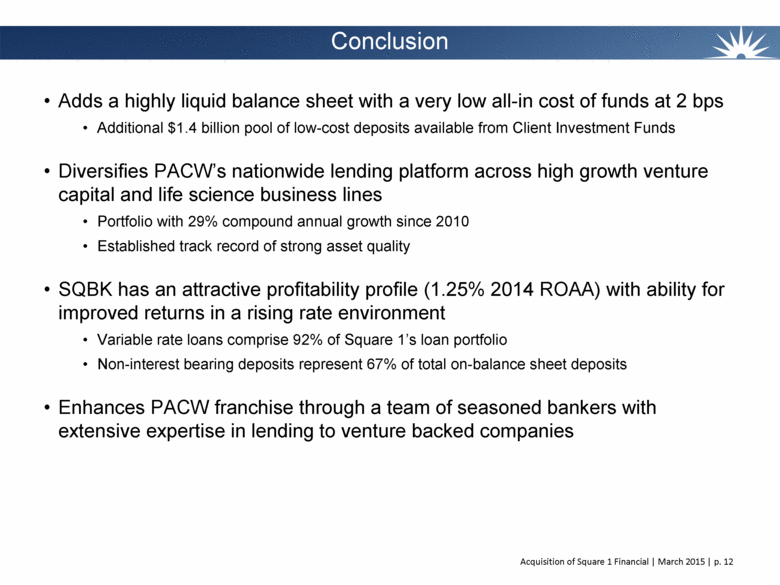
| Conclusion Adds a highly liquid balance sheet with a very low all-in cost of funds at 2 bps Additional $1.4 billion pool of low-cost deposits available from Client Investment Funds Diversifies PACW’s nationwide lending platform across high growth venture capital and life science business lines Portfolio with 29% compound annual growth since 2010 Established track record of strong asset quality SQBK has an attractive profitability profile (1.25% 2014 ROAA) with ability for improved returns in a rising rate environment Variable rate loans comprise 92% of Square 1’s loan portfolio Non-interest bearing deposits represent 67% of total on-balance sheet deposits Enhances PACW franchise through a team of seasoned bankers with extensive expertise in lending to venture backed companies |
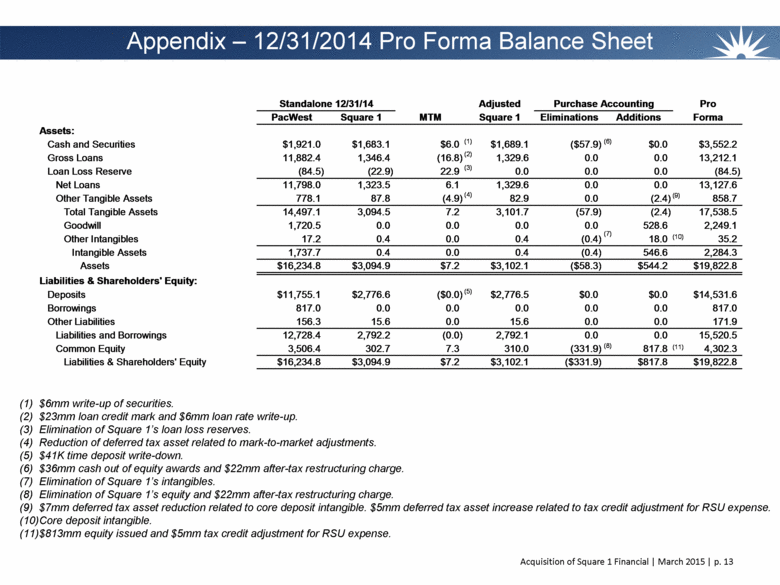
| Appendix – 12/31/2014 Pro Forma Balance Sheet $6mm write-up of securities. $23mm loan credit mark and $6mm loan rate write-up. Elimination of Square 1’s loan loss reserves. Reduction of deferred tax liability related to mark-to-market adjustments. $41K time deposit write-down. $36mm cash out of equity awards and $22mm after-tax restructuring charge. Elimination of Square 1’s intangibles. Elimination of Square 1’s equity and $22mm after-tax restructuring charge. $7mm deferred tax asset reduction related to core deposit intangible. $5mm deferred tax asset increase related to tax credit adjustment for RSU expense. Core deposit intangible. $813mm equity issued and $5mm tax credit adjustment for RSU expense. Standalone 12/31/14 Adjusted Purchase Accounting Pro PacWest Square 1 MTM Square 1 Eliminations Additions Forma Assets: Cash and Securities $1,921.0 $1,683.1 $6.0 $1,689.1 ($57.9) $0.0 $3,552.2 Gross Loans 11,882.4 1,346.4 (16.8) 1,329.6 0.0 0.0 13,212.1 Loan Loss Reserve (84.5) (22.9) 22.9 0.0 0.0 0.0 (84.5) Net Loans 11,798.0 1,323.5 6.1 1,329.6 0.0 0.0 13,127.6 Other Tangible Assets 778.1 87.8 (4.9) 82.9 0.0 (2.4) 858.7 Total Tangible Assets 14,497.1 3,094.5 7.2 3,101.7 (57.9) (2.4) 17,538.5 Goodwill 1,720.5 0.0 0.0 0.0 0.0 528.6 2,249.1 Other Intangibles 17.2 0.4 0.0 0.4 (0.4) 18.0 35.2 Intangible Assets 1,737.7 0.4 0.0 0.4 (0.4) 546.6 2,284.3 Assets $16,234.8 $3,094.9 $7.2 $3,102.1 ($58.3) $544.2 $19,822.8 Liabilities & Shareholders' Equity: Deposits $11,755.1 $2,776.6 ($0.0) $2,776.5 $0.0 $0.0 $14,531.6 Borrowings 817.0 0.0 0.0 0.0 0.0 0.0 817.0 Other Liabilities 156.3 15.6 0.0 15.6 0.0 0.0 171.9 Liabilities and Borrowings 12,728.4 2,792.2 (0.0) 2,792.1 0.0 0.0 15,520.5 Common Equity 3,506.4 302.7 7.3 310.0 (331.9) 817.8 4,302.3 Liabilities & Shareholders' Equity $16,234.8 $3,094.9 $7.2 $3,102.1 ($331.9) $817.8 $19,822.8 (1) (2) (4) (3) (5) (6) (7) (8) (9) (10) (11) |
| Investors and security holders are urged to carefully review and consider each of PacWest Bancorp’s and Square 1’s public filings with the SEC, including but not limited to their Annual Reports on Form 10-K, their proxy statements, their Current Reports on Form 8-K and their Quarterly Reports on Form 10-Q. The documents filed by PacWest with the SEC may be obtained free of charge at PacWest’s website at www.pacwestbancorp.com or at the SEC’s website at www.sec.gov. These documents may also be obtained free of charge from PacWest by requesting them in writing to PacWest Bancorp, c/o Pacific Western Bank, 130 S. State College Boulevard, Brea, CA 92821; Attention: Investor Relations, by telephone at (714) 671-6800 or via e-mail to investor-relations@pacwestbancorp.com. The documents filed by Square 1 with the SEC may be obtained free of charge at Square 1’s website at www.square1bank.com or at the SEC’s website at www.sec.gov. These documents may also be obtained free of charge from Square 1 by requesting them in writing to Square 1 Financial, c/o Square 1 Bank, 406 Blackwell Street, Suite 240, Durham, NC 27701; Attention: Investor Relations, or by telephone at Phone: (866) 355-0468. PacWest intends to file a registration statement with the SEC which will include a proxy statement of Square 1 and a prospectus of PacWest, and each party will file other documents regarding the proposed transaction with the SEC. Before making any voting or investment decision, investors and security holders of Square 1 are urged to carefully read the entire registration statement and proxy statement/prospectus, when they become available, as well as any amendments or supplements to these documents, because they will contain important information about the proposed transaction. A definitive proxy statement/prospectus will be sent to the stockholders of Square 1 seeking any required stockholder approvals. Investors and security holders will be able to obtain the registration statement and the proxy statement/prospectus free of charge from the SEC’s website or from PacWest or Square 1 by writing to the addresses provided for each company set forth in the paragraphs above. PacWest, Square 1, their directors, executive officers and certain other persons may be deemed to be participants in the solicitation of proxies from Square 1 stockholders in favor of the approval of the transaction. Information about the directors and executive officers of PacWest and their ownership of PacWest common stock is set forth in the proxy statement for PacWest’s 2014 annual meeting of stockholders, as previously filed with the SEC. Information about the directors and executive officers of Square 1 and their ownership of Square 1 common stock is set forth in the proxy statement for Square 1’s 2014 annual meeting of stockholders, as previously filed with the SEC. Stockholders may obtain additional information regarding the interests of such participants by reading the registration statement and the proxy statement/prospectus when they become available. Additional Information About the Transaction and Where to Find It |