As filed with the U.S. Securities and Exchange Commission on July 30, 2008
File No. 811-21777
SECURITIES AND EXCHANGE COMMISSION
WASHINGTON, D.C. 20549
FORM N-14
REGISTRATION STATEMENT UNDER THE SECURITIES ACT OF 1933 x
Pre-Effective Amendment No. o
Post-Effective Amendment No. o
JOHN HANCOCK FUNDS III
(Exact Name of Registrant as Specified in Charter)
601 Congress Street
Boston, Massachusetts 02110
(Address of Principal Executive Offices)
(617) 663-4324
(Registrant’s Area Code and Telephone Number)
David D. Barr 601 Congress Street Boston, Massachusetts 02110 (Name and Address of | With copies to: Mark P. Goshko, Esq. K & L Gates LLP One Lincoln Street Boston, Massachusetts 02111 |
AS SOON AS PRACTICABLE AFTER THE EFFECTIVE DATE OF THIS REGISTRATION
STATEMENT
(Approximate Date of Proposed Public Offering)
TITLE OF SECURITIES BEING REGISTERED:
Shares of beneficial interest of Registrant
Calculation of Registration Fee under the Securities Act of 1933: No filing fee is due because of reliance on Section 24(f) of the Investment Company Act of 1940, which permits registration of an indefinite number of securities.
It is proposed that this filing will become effective on August 29, 2008 pursuant to Rule 488 under the Securities Act of 1933.
Important Information
![]()
JOHN HANCOCK FUNDS
August 1, 2008
Dear Fellow Shareholder:
I am writing to ask for your assistance with an important issue involving your investment in one or both of the following funds:
John Hancock Growth Trends Fund (“Growth Trends”)
John Hancock Core Equity Fund (“Core Equity”)
We are proposing to reorganize and merge both Growth Trends and Core Equity into John Hancock Rainier Growth Fund (“Rainier Growth”).
All three funds generally seek to maximize long-term capital appreciation. You will find a detailed explanation of the similarities and differences between the investment strategies and principal risks in the enclosed proxy materials.
The Reorganization Offers You Considerable Advantages.
Here are three significant advantages:
• | By combining your fund with Rainier Growth, you will be a shareholder in one larger fund with lower net annual operating expenses and greater potential to increase asset size and achieve economies of scale. In addition, certain administrative costs will be spread across the combined fund’s larger asset base, which will increase the fund’s overall efficiency. |
• | Rainier Growth has achieved stronger performance results compared to your fund’s performance over the last one, three and five years. |
• | As a shareholder, you will gain access to Rainier Growth’s investment process and the growth investing expertise of Rainier Investment Management, Inc. |
We Need Your Vote of Approval.
After careful consideration, your fund’s trustees have unanimously approved the reorganization of your fund into Rainier Growth, but your vote is required to complete the merger. The enclosed proxy statement contains further explanation and important details of the proposed reorganization, which I strongly encourage you to read before voting. Please note that if approved by the shareholders, the reorganization is scheduled to take place at the close of business on October 3, 2008.
Your Vote Matters!
You are being asked to approve these changes. No matter how large or small your fund holdings, your vote is extremely important. After you review the proxy materials, please submit your vote promptly to help us avoid the need for additional mailings. For your convenience, you may vote one of three ways: via telephone by calling the phone number provided on your proxy card; via mail by returning the enclosed voting card; or via the Internet by visiting http://www.jhfunds.com/proxy and selecting the shareholder entryway.
I am confident that the proposed change will help us better serve you and all of the funds’ shareholders. If you have questions, please call a John Hancock Funds Customer Service Representative at 1-800-225-5291 between 8:00 a.m. and 7:00 p.m. Eastern Time. I thank you for your time and your prompt vote on this matter.
Sincerely,
/s/ Keith F. Hartstein
Keith F. Hartstein
President and Chief Executive Officer
JOHN HANCOCK CORE EQUITY FUND
(a series of John Hancock Capital Series)
JOHN HANCOCK GROWTH TRENDS FUND
(a series of John Hancock Equity Trust)
(collectively, the “funds”)
601 Congress Street
Boston, MA 02210
Notice of Special Joint Meeting of Shareholders
Scheduled for September 23, 2008
This is the formal agenda for the funds’ joint shareholder meeting. It tells you what matters will be voted on and the time and place of the meeting, in case you want to attend in person.
To the shareholders of the funds:
A joint shareholder meeting of the funds will be held at 601 Congress Street, Boston, Massachusetts, on Tuesday, September 23, 2008, at 2:00 p.m. to consider the following:
1. | For shareholders of John Hancock Core Equity Fund (“Core Equity”), a proposal to approve an Agreement and Plan of Reorganization between Core Equity and John Hancock Rainier Growth Fund (“Rainier Growth”). Under this agreement, Core Equity would transfer all of its assets to Rainier Growth in exchange for corresponding shares of Rainier Growth. These shares would be distributed, as described in the accompanying proxy statement, proportionately to you and the other shareholders of Core Equity. Rainier Growth would also assume Core Equity’s liabilities. Your fund’s board of trustees recommends that you vote FOR this proposal. |
2. | For shareholders of John Hancock Growth Trends Fund (“Growth Trends”), a proposal to approve an Agreement and Plan of Reorganization between Growth Trends and Rainier Growth. Under this agreement, Growth Trends would transfer all of its assets to Rainier Growth in exchange for corresponding shares of Rainier Growth. These shares would be distributed, as described in the accompanying proxy statement, proportionately to you and the other shareholders of Growth Trends. Rainier Growth would also assume Growth Trends’ liabilities. Your fund’s board of trustees recommends that you vote FOR this proposal. |
3. | Any other business that may properly come before the meeting. |
Shareholders of record as of the close of business on June 30, 2008, are entitled to vote at the meeting and any related follow-up meetings.
Whether or not you expect to attend the meeting, please complete and return the enclosed proxy card. If shareholders do not return their proxies in sufficient numbers, it may result in the need for additional shareholder solicitation efforts.
By order of the Board of Trustees,
Thomas M. Kinzler
Secretary
Boston, Massachusetts, August 1, 2008
COMBINED PROXY STATEMENT of John Hancock Core Equity Fund, a series of John Hancock Capital Series (“Core Equity”); and John Hancock Growth Trends Fund, PROSPECTUS for John Hancock Rainier Growth Fund, a series of John Hancock Funds III (“Rainier Growth” or the “Acquiring Fund”) |
The address of the Acquired Funds and the Acquiring Fund is 601 Congress Street, Boston, Massachusetts 02210.
* * * * * *
This proxy statement and prospectus contains the information shareholders should know before voting on the proposed reorganization of their fund. Please read it carefully and retain it for future reference.
| Acquired Fund | Acquiring Fund | Shareholders Entitled to Vote |
Proposal 1 | Core Equity | Rainier Growth | Core Equity |
Proposal 2 | Growth Trends | Rainier Growth | Growth Trends |
How each Reorganization Will Work
| § | Your fund will transfer all of its assets to Rainier Growth. Rainier Growth will assume your fund’s liabilities. |
| § | Rainier Growth will issue Class A shares to your fund in an amount equal to the value of your fund’s net assets attributable to its Class A shares. These shares will be distributed to your fund’s Class A shareholders in proportion to their holdings on the reorganization date. |
| § | Rainier Growth will issue Class B shares to your fund in an amount equal to the value of your fund’s net assets attributable to its Class B shares. These shares will be distributed to your fund’s Class B shareholders in proportion to their holdings on the reorganization date. |
| § | Rainier Growth will issue Class C shares to your fund in an amount equal to the value of your fund’s net assets attributable to its Class C shares. These shares will be distributed to your fund’s Class C shareholders in proportion to their holdings on the reorganization date. |
| § | With respect to Core Equity, Rainier Growth will issue Class I shares to your fund in an amount equal to the value of your fund’s net assets attributable to its Class I shares. These shares will be distributed to your fund’s Class I shareholders in proportion to their holdings on the reorganization date. |
| § | No sales charges will be imposed on shares of Rainier Growth received by shareholders of the Acquired Fund. |
| § | Your fund will be terminated and shareholders of your fund will become shareholders of Rainier Growth. |
| § | For federal income tax purposes, the reorganization is not intended to result in income, gain or loss being recognized by your fund, Rainier Growth, or the shareholders of your fund. |
Rationale for the Reorganizations
Each reorganization is intended to consolidate the relevant Acquired Fund with a similar fund advised by John Hancock Investment Management Services, LLC (“JHIMS”) and subadvised by Rainier Investment Management Inc. Although your fund’s stated investment objective may differ from that of Rainier Growth, all of the funds generally seek to maximize long-term capital appreciation.
While each of the funds has been in operation for five or more years, Rainier Growth has achieved a stronger performance record than your fund over a five year period.1 The combined fund would also offer multiple additional classes of shares that would offer greater distribution capabilities than your fund would if it continued as a stand-alone fund.
The combined fund may be better positioned in the market to increase asset size and achieve economies of scale. Each fund incurs substantial operating costs for insurance, accounting, legal and custodial services. For each reorganization, the combination of these funds resulting from the reorganization may enable you to benefit from the ability to achieve better net prices on securities trades and spread fixed expenses in a manner that may contribute to a lower expense ratio in the long term than each fund would achieve separately.
Shares of the Acquiring Fund are not deposits or obligations of, or guaranteed or endorsed by, any bank or other depository institution. These shares are not federally insured by the Federal Deposit Insurance Corporation, the Federal Reserve Board or any other government agency.
Shares of the Acquiring Fund have not been approved or disapproved by the Securities and Exchange Commission (“SEC”). The SEC has not passed upon the accuracy or adequacy of this prospectus. Any representation to the contrary is a criminal offense.
Where to Get More Information
§ The Rainier Growth prospectus dated August 1, 2008 § The annual shareholder report of Large Cap Growth Equity Portfolio, the predecessor to the Acquiring Fund, dated March 31, 2008 | In the same envelope as this proxy statement and prospectus. These documents are incorporated by reference into (and therefore legally part of) this proxy statement and prospectus. |
§ The statement of additional information (“SAI”) dated August 1, 2008, which relates to this proxy statement and prospectus and the reorganizations, and contains additional information about the Acquired Funds and the Acquiring Fund § The Rainier Growth SAI dated August 1, 2008 § The Core Equity prospectus dated May 1, 2008 § The Core Equity SAI dated May 1, 2008 § The Core Equity annual shareholder report dated December 31, 2007 § The Growth Trends prospectus dated March 1, 2008 § The Growth Trends SAI dated March 1, 2008 § The Growth Trends annual shareholder report dated October 31, 2007 § The Growth Trends semi-annual shareholder report dated April 30, 2008 | These documents and additional information about the Acquired Funds and the Acquiring Fund are on file with the SEC and are available at no charge by writing to us or by calling our toll-free telephone number: 1-800-225-5291. These documents are incorporated by reference into (and therefore legally part of) this proxy statement and prospectus. |
To ask questions about this proxy statement and prospectus, call our toll-free telephone number: 1-800-225-5291. | |
The date of this proxy statement and prospectus is August 1, 2008.
_________________________
1 Representing the performance of Rainier Large Cap Growth Equity Portfolio, a series of Rainier Investment Management Mutual Funds, which merged into Rainier Growth on April 25, 2008.
TABLE OF CONTENTS
This proxy statement and prospectus is being used by the boards of trustees of John Hancock Capital Series (the “Capital Series Board”) and John Hancock Equity Trust (the “Equity Board”) to solicit proxies to be voted at a special joint meeting of the funds’ shareholders. This meeting will be held at 601 Congress Street, Boston, Massachusetts, on Tuesday, September 23, 2008, at 2:00 p.m. For each Acquired Fund, the purpose of the meeting is to consider a proposal to approve an Agreement and Plan of Reorganization (the “Agreement”) providing for the reorganization of the Acquired Fund into Rainier Growth (each a “Reorganization”). This proxy statement and prospectus is being mailed to your fund’s shareholders on or about August 1, 2008.
The proxy statement and prospectus includes information that is specific to each proposal, including summary comparisons. You should read the entire proxy statement carefully, including Exhibit A, the enclosed prospectus and annual report of Rainier Growth, because it contains details that are not in the summary comparisons.
Who is Eligible to Vote?
Shareholders of record of each Acquired Fund on June 30, 2008, are entitled to attend and vote at the meeting or any adjourned meeting. Each share is entitled to one vote. Shares represented by properly executed proxies, unless revoked before or at the meeting, will be voted according to shareholders’ instructions. If you sign a proxy but do not fill in a vote, your shares will be voted to approve the Agreement. If any other business comes before the meeting, your shares will be voted at the discretion of the persons named as proxies.
PROPOSAL 1 — REORGANIZATION OF CORE EQUITY
Approval of Agreement and Plan of Reorganization Between Core Equity and Rainier Growth
Under this Agreement, Core Equity would transfer all of its assets to Rainier Growth in exchange for corresponding shares of Rainier Growth. These shares would be distributed proportionately to the shareholders of Core Equity. Rainier Growth would also assume the liabilities of Core Equity. The Capital Series Board unanimously recommends that shareholders vote FOR this proposal.
SUMMARY COMPARISONS OF ACQUIRED FUND TO ACQUIRING FUND
Comparison of Funds’ Investment Objectives, Strategies and Policies
| ACQUIRED FUND | ACQUIRING FUND |
| Core Equity | Rainier Growth |
Business | The fund is a series of John Hancock Capital Series, an open-end investment management company organized as a Massachusetts business trust. | The fund is a series of John Hancock Funds III (“JHF III”), an open-end investment management company organized as a Massachusetts business trust. |
Net assets as of | $209.0 million | $904.5 million |
Investment adviser | John Hancock Advisers, LLC (“JHA”) | John Hancock Investment Management Services, LLC (“JHIMS”) |
Subadviser | Independence Investments LLC (“Independence”) | Rainier Investment Management Inc. (“RIM”) |
| ACQUIRED FUND | ACQUIRING FUND |
| Core Equity | Rainier Growth |
Portfolio managers | John C. Forelli has managed the fund since 2004 and been with Independence since 1990; Jay C. Leu has managed the fund since 2004 and been with Independence since 1990. | Daniel Brewer has been on the fund team since inception and has been a senior portfolio manager with RIM since at least 2002; Mark Broughton has been on the fund team since inception and has been a senior portfolio manager with RIM since 2002; Stacie Cowell has been on the fund team and a senior portfolio manager at RIM since 2006; Mark Dawson has been on the fund team since inception and has been a senior portfolio manager with RIM since at least 2002; Andrea Durbin has been on the fund team since 2007 and has been a senior portfolio manager with RIM since at least 2002; James Margard has been on the fund team since inception and has been RIM’s Chief Investment Officer since at least 2002; Peter Musser has been on the fund team since inception and has been a senior portfolio manager with RIM since at least 2002. |
Investment objective | The fund seeks above-average total return (capital appreciation plus income). | The fund seeks to maximize long-term capital appreciation. |
Principal investments | To pursue its objective, the fund normally invests at least 80% of its assets in a diversified portfolio of equity securities which are primarily large capitalization stocks. The fund will normally invest in approximately 75 to 160 companies. The subadviser selects from a menu of stocks of approximately 1,000 companies that capture the characteristics of the broad market. | To pursue its objective, the fund normally invests at least 80% of its assets in the common stock of large-capitalization growth companies traded in the U.S. The fund will normally invest in approximately 40 to 80 companies. The subadviser considers large-capitalization companies to be those currently with market capitalizations in the range of the Dow Jones Wilshire U.S. Large-Cap Index, which ranged approximately from $381 million to $478 billion as of May 30, 2008. Smaller companies, meaning those with a market capitalization below that range, may be owned when believed to be especially attractive. |
Investment strategies | The portfolio managers seek to invest in stocks that are believed to have improving fundamentals and attractive valuations. The subadviser’s investment research team performs fundamental research, develops | The subadviser compares the fund’s economic sector weightings to a Large Cap Growth Equity Index, such as the Russell 1000 Growth Index. To help control risk, extreme overweighting and underweighting |
| ACQUIRED FUND | ACQUIRING FUND |
| Core Equity | Rainier Growth |
| financial projections and monitors consensus-based fundamental financial data. The information is utilized in a sector-based, multi-factor series of valuation models. These proprietary models use this financial data to rank the stocks according to their combination of: • value (meaning they appear to be underpriced); and • improving fundamentals (meaning they show potential for strong growth). | of the fund as compared to the major sectors of such benchmark are avoided. The subadviser favors companies with attractive fundamentals such as strong revenue, earnings or cash flow growth. Companies with sustainable competitive advantages, potential price of business catalysts, including earnings surprise or market expansion, and disciplined management with shareholder focus are emphasized. |
Equity investments | The fund may invest in common stocks, preferred stocks, American Depositary Receipts (“ADRs”) and their equivalents. | The fund may invest in common stock, preferred and convertible preferred stocks, and ADRs. |
Foreign investments | Each fund may invest in foreign investments. | |
Derivatives | Each fund may invest in derivatives, which are financial contracts with a value that depends on, or is derived from, the value of underlying assets, reference rates or indexes. Derivatives may relate to stocks, bonds, interest rates, currencies or currency exchange rates, commodities and related indexes. The fund may use derivatives for many purposes, including for hedging, and as a substitute for direct investment in securities or other assets. | |
Temporary defensive positions | For temporary defensive purposes, the fund may temporarily invest more than 20% of its assets in investment-grade short-term securities. This may result in the fund’s not achieving its investment objective. | The fund may temporarily depart from its principal investment strategies by making short-term investments in cash equivalents in response to adverse market, economic or political conditions. This may result in the fund’s not achieving its investment objective. |
Active trading | Each fund may trade securities actively, which could increase its transaction costs (thus lowering performance) and increase taxable distributions. | |
In deciding whether to approve the Reorganization, you should consider the similarities and differences between Core Equity and Rainier Growth. In particular, you should consider whether the amount and character of investment risk involved in the authorized investments of Rainier Growth is commensurate with the amount of risk involved in the authorized investments of your fund.
As the above table indicates, the investment objectives, policies and risks of the two funds are similar in many ways, although there are differences, as discussed below.
Investment objective. While Core Equity seeks above-average total return (capital appreciation plus income), Rainier Growth seeks to maximize long-term capital appreciation. Although income is not a part of Rainier Growth’s investment objective, management notes that each fund invests over 80% of its assets in large capitalization companies, which tend to pay dividends on a regular basis. Accordingly, in practice, management does not believe that the difference in investment objectives is significant.
Number of investments. Core Equity normally invests in approximately 75 to 160 companies, while Rainier Growth normally invests in 40 to 80 companies. Although both funds are classified as “diversified” funds, Rainier Growth’s policy in this regard indicates a focus on a smaller number of companies. Management believes that this focus is an
important part of RIM’s investment approach, and has contributed to Rainier Growth’s strong performance over the last five years.
Investment strategies. Core Equity follows a “value” and “growth” approach to investing, while Rainier Growth follows a “growth” approach. At different points in the market cycle, one style will tend to outperform the other. Again, management believes that RIM’s investment process, which emphasizes companies with attractive fundamentals, is designed to invest in companies with strong price-appreciation potential.
Temporary defensive positions. Core Equity may invest in investment-grade short-term debt for temporary defensive purposes, while Rainier Growth may invest only in cash equivalents for these purposes. Although Core Equity’s policy would appear to give it greater latitude, in practice, management believes that the available return on such short-term debt would not be significantly greater than available returns on cash equivalents. In addition, Rainier Growth’s policy could be characterized as a more conservative approach.
PROPOSAL 2 — REORGANIZATION OF GROWTH TRENDS
Approval of Agreement and Plan of Reorganization Between Growth Trends and Rainier Growth
Under this Agreement, Growth Trends would transfer all of its assets to Rainier Growth in exchange for corresponding shares of Rainier Growth. These shares would be distributed proportionately to the shareholders of Growth Trends. Rainier Growth would also assume the liabilities of Growth Trends. The Equity Board unanimously recommends that shareholders vote FOR this proposal.
| ACQUIRED FUND | ACQUIRING FUND |
| Growth Trends | Rainier Growth |
Business | The fund is a series of John Hancock Equity Trust, an open-end investment management company organized as a Massachusetts business trust. | The fund is a series of JHF III, an open-end investment management company organized as a Massachusetts business trust. |
Net assets as of | $60.2 million | $904.5 million |
Investment adviser | JHA | JHIMS |
Subadviser | MFC Global Investment Management (U.S.), LLC (“MFC”) | RIM |
Portfolio managers | Roger C. Hamilton has been on the fund team since 2006 and has been a vice president with MFC since 2005; Thomas P. Norton has been on the fund team since 2006 and has been a vice president with MFC since 2005; Mindy Perry has been on the fund team since 2008 and has been a healthcare portfolio manager with MFC since 2007; Lisa A. Welch has been on the fund team since 2000 and has been a vice president with MFC since 2005. | Daniel Brewer has been on the fund team since inception and has been a senior portfolio manager with RIM since at least 2002; Mark Broughton has been on the fund team since inception and has been a senior portfolio manager with RIM since 2002; Stacie Cowell has been on the fund team and a senior portfolio manager at RIM since 2006; Mark Dawson has been on the fund team since inception and has been a senior portfolio manager with RIM since at least 2002; Andrea Durbin has been on the fund team |
| ACQUIRED FUND | ACQUIRING FUND |
| Growth Trends | Rainier Growth |
|
| since 2007 and has been a senior portfolio manager with RIM since at least 2002; James Margard has been on the fund team since inception and has been RIM’s Chief Investment Officer since at least 2002; Peter Musser has been on the fund team since inception and has been a senior portfolio manager with RIM since at least 2002. |
Investment objective | The fund seeks long-term growth of capital. | The fund seeks to maximize long-term capital appreciation. |
Principal investments | To pursue its objective, the fund normally invests approximately one-third of assets in equity securities of U.S. and foreign companies in each of the following sectors: financial services, healthcare and technology. The fund attempts to concentrate its investments within each of the three sectors in 20 to 35 companies. In managing the portfolio, the management team focuses primarily on stock selection rather than industry allocation. | To pursue its objective, the fund normally invests at least 80% of its assets in the common stock of large-capitalization growth companies traded in the U.S. The fund will normally invest in approximately 40 to 80 companies. The subadviser considers large-capitalization companies to be those currently with market capitalizations in the range of the Dow Jones Wilshire U.S. Large-Cap Index, which ranged approximately from $381 million to $478 billion as of May 30, 2008. Smaller companies, meaning those with a market capitalization below that range, may be owned when believed to be especially attractive. |
Investment strategies | The management team seeks to identify companies positioned to benefit from economic and social trends. It uses fundamental financial analysis to identify individual companies of any size that appear most attractive in terms of earnings stability, growth potential, business changes and valuation. | The subadviser compares the fund’s economic sector weightings to a Large Cap Growth Equity Index, such as the Russell 1000 Growth Index. To help control risk, extreme overweighting and underweighting of the fund as compared to the major sectors of such benchmark are avoided. The subadviser favors companies with attractive fundamentals such as strong revenue, earnings or cash flow growth. Companies with sustainable competitive advantages, potential price of business catalysts, including earnings surprise or market expansion, and disciplined management with shareholder focus are emphasized. |
Equity investments | The fund may invest in common and preferred stocks (and their equivalents) of U.S. and foreign companies. | The fund may invest in common stock, preferred and convertible preferred stocks, and ADRs. |
Foreign investments | Each fund may invest in foreign investments. | |
| ACQUIRED FUND | ACQUIRING FUND |
| Growth Trends | Rainier Growth |
Derivatives | The fund may invest in derivatives, which are financial contracts with a value that depends on, or is derived from, the value of underlying assets, reference rates or indexes. Derivatives may relate to stocks, bonds, interest rates, currencies or currency exchange rates, commodities and related indexes. The fund may use derivatives for many purposes, including for hedging, and as a substitute for direct investment in securities or other assets. | |
Temporary defensive positions | In abnormal market conditions, the fund may temporarily invest extensively in investment-grade short-term securities. This may result in the fund’s not achieving its investment objective. | The fund may temporarily depart from its principal investment strategies by making short-term investments in cash equivalents in response to adverse market, economic or political conditions. This may result in the fund’s not achieving its investment objective. |
Active trading | Each fund may trade securities actively, which could increase its transaction costs (thus lowering performance) and increase taxable distributions. | |
In deciding whether to approve the Reorganization, you should consider the similarities and differences between Growth Trends and Rainier Growth. In particular, you should consider whether the amount and character of investment risk involved in the authorized investments of Rainier Growth is commensurate with the amount of risk involved in the authorized investments of your fund.
As the above table indicates, the investment objectives, policies and risks of the two funds are similar in many ways, although there are differences, as discussed below.
Investment objective. While Growth Trends seeks long-term growth of capital, Rainier Growth seeks to maximize long-term capital appreciation. Although stated differently, management does not believe there to be any substantive difference in the funds’ investment objectives.
Sector allocation; number of investments. Growth Trends normally invests one-third of its assets in each of three sectors: financial services, healthcare and technology, selecting approximately 20 to 35 companies in each sector. Growth Trends’ overall range would be approximately 60 to 105 companies for the fund as a whole. Rainier Growth normally invests in 40 to 80 companies overall without concentrating on specific sectors. Although both funds are classified as “diversified” funds, Rainier Growth’s policy in this regard indicates a focus on a smaller number of companies. Management believes that this focus is an important part of RIM’s investment approach, and has contributed to Rainier Growth’s strong performance over the last five years. Also, management notes that Rainier Growth has the latitude to invest in various market sectors, in the discretion of RIM’s portfolio management team. Although Rainier Growth may, from time to time, invest in financial services, healthcare or technology companies, the fund is not concentrated in these sectors, as is the case with Growth Trends.
Temporary defensive positions. Growth Trends may invest in investment-grade short term securities for temporary defensive purposes, while Rainier Growth may invest only in cash equivalents for these purposes. Although Growth Trends’ policy would appear to give it greater latitude, in practice, management believes that the return on such short-term debt would not be significantly greater than available returns on cash equivalents. In addition, Rainier Growth’s policy could be characterized as a more conservative approach.
COMPARISON OF FUND CLASSES, EXPENSES AND DISTRIBUTION ARRANGEMENTS
Comparison of Funds’ Classes of Shares
Class A sales charges and 12b-1 fees | Class A shares of each fund have the same characteristics and, with the exception of the distribution and service (12b-1) fees as discussed below, the same fee structures. § Class A shares are offered with front-end sales charges ranging from 5% to 1% of the fund’s offering price, depending on the amount invested. |
| § Class A shares of each Acquired Fund are subject to distribution and service (12b-1) fees equal to the annual rate of 0.30% of average daily net assets of Class A shares. Class A shares of Rainer Growth are subject to 12b-1 fees equal to the annual rate of 0.25% of average daily net assets of Class A shares. |
§ There is no front-end sales charge for investments of $1 million or more, but there is a contingent deferred sales charge (“CDSC”) ranging from 0.25% to 1.00% on Class A shares upon which a commission or finder’s fee was paid that are sold within one year of purchase. | |
§ An investor can combine multiple purchases of Class A shares of John Hancock funds to take advantage of breakpoints in the sales charge schedule. | |
§ Class A shares may be offered without front-end sales charges or CDSCs to various individuals and institutions, including those listed in the funds’ prospectuses. |
Class B sales charges and 12b-1 fees | Class B shares of each of the funds have the same characteristics and fee structures. |
§ Class B shares are offered without a front-end sales charge, but are subject to a CDSC if sold within six years after purchase. The CDSC ranges from 1.00% to 5.00% of the original purchase cost or the current market value, whichever is less, of the Class B shares being sold, and depends on how long the shares are held. No CDSC is imposed on shares held for more than six years. | |
§ Class B shares are subject to distribution and service (12b-1) fees equal to the annual rate of 1.00% of the average daily net assets of Class B shares. | |
§ Class B shares’ CDSCs may be waived in certain cases, including those listed in the funds’ prospectuses. | |
§ Class B shares automatically convert to Class A shares after eight years. | |
Class C sales charges and 12b-1 fees | Class C shares of each fund have the same characteristics and fee structures. |
§ Class C shares are offered without a front-end sales charge, but are subject to a CDSC of 1.00% of the original purchase cost or the current market value, whichever is less, of the Class C shares sold within one year of purchase. | |
§ Class C shares are subject to distribution and service fees (12b-1) equal to the annual rate of 1.00% of the average daily net assets of Class C shares. | |
§ Class C shares’ CDSCs may be waived in certain cases, including those listed in the funds’ prospectuses. | |
§ No automatic conversion to Class A shares, so distribution and service fees expenses continue at the Class C level throughout the life of the investment. | |
Class I sales charges and 12b-1 fees | Class I shares of Core Equity and Rainier Growth have the same characteristics and fee structures. |
| § Class I shares are offered without any front-end or contingent deferred sales charges to certain types of investors if they also meet the minimum initial investment requirement for purchase of Class I shares. |
| § Class I shares are not charged a distribution and service fee (12b-1). |
12b-1 fees | § These fees are paid out of a class’ assets on an ongoing basis. Over time, these fees will increase the cost of investments and may cost more than other types of sales charges. |
Comparison of Buying, Selling and Exchanging Shares
Buying shares | Investors may buy shares at their public offering price through a financial representative or the funds’ transfer agent, John Hancock Signature Services, Inc. (“Signature Services”). |
Minimum initial investment | Class A, Class B and Class C Shares: $1,000 for non-retirement accounts, $500 for retirement accounts and $250 per account opened for group investments. Investments also may be made on a Monthly Automatic Accumulation Plan, which requires $25 to open an account followed by a monthly minimum of $25 thereafter. Class I Shares: $250,000. The minimum initial investment requirement may be waived, in a fund’s sole discretion for certain investors. |
Exchanging shares | Class A, Class B and Class C Shares: Shareholders may exchange their shares of one John Hancock fund for shares of the same class of any other John Hancock fund, generally without paying any additional sales charges. The registration for both accounts involved must be identical. Class I Shares: Shareholders may exchange Class I shares for Class I shares of other John Hancock funds that are available through their plan, or Money Market Fund Class A shares without paying any additional sales charges. The registration for both accounts involved must be identical. |
Selling shares | Shareholders may sell their shares by submitting a proper written or telephone request to Signature Services. |
Net asset value | All purchases, exchanges and sales are made at a price based on the next net asset value (“NAV”) per share of the class of the fund to be calculated after Signature Services receives your request in good order. Each fund’s NAV is determined at the close of regular trading on the New York Stock Exchange, which is normally 4:00 P.M., Eastern Time. |
Comparison of Expenses
As the tables below indicate, the hypothetical pro forma net annual operating expenses of the Acquiring Fund after each Reorganization are expected to be lower than your fund’s expenses for all share classes (although the total annual operating expenses of Class B and Class C shares of the Acquiring Fund are higher than those of the corresponding share classes of Core Equity before taking into account contractual expense limitations).
JHA has voluntarily agreed to limit your fund’s net operating expenses; without these voluntary expense limitations your fund’s annual operating expenses would be higher. At current asset levels, Rainier Growth is charged a management fee of 0.75%. In the case of Core Equity, this is the same fee your fund is currently charged. In the case of Growth Trends, this is less than the 1.00% that your fund is currently charged.
JHIMS has agreed contractually to reimburse, or to make a payment to a specific class of shares of Rainier Growth in an amount equal to the amount by which the expenses attributable to such class of shares (excluding taxes, litigation and indemnification expenses, other extraordinary expenses not incurred in the ordinary course of the fund’s business, and fees under any agreement or plans of the fund dealing with services for shareholders and others with beneficial interests in shares of the fund) exceed the percentage of average annual net assets (on an annualized basis) attributable as follows: 1.19% for Class A, 2.04% for Class B, 2.04% for Class C, and 0.89% for Class I. This expense reimbursement will continue in effect until April 28, 2009 and thereafter until terminated by JHIMS on notice to the fund.
In addition, Signature Services has voluntarily agreed to limit transfer agent fees for your fund to 0.25% of the fund’s average daily net assets on an annual basis. These voluntary expense reimbursements may be terminated at any time.
The Funds’ Expenses
Shareholders of all mutual funds pay various expenses, either directly or indirectly. Transaction expenses are charged directly to your account. Operating expenses are paid from a fund’s assets and, therefore, are paid by shareholders indirectly. Future expenses for all share classes may be greater or less.
The following expense tables briefly describe the fees and the expenses that shareholders of each Acquired Fund and Rainier Growth may pay if they buy and hold shares of each respective fund and are based on expenses paid by the funds for the 12-month period ended March 31, 2008. The tables also show the pro forma expenses of Rainier Growth assuming the Reorganizations with the Acquired Funds had occurred on April 1, 2007. Rainier Growth’s expenses after the Reorganizations may be greater or less than those shown.
Concurrent with the proposed Reorganization of Core Equity and Growth Trends, shareholders of another fund, John Hancock Technology Fund (“Technology”), are being asked to approve similar reorganizations with Rainier Growth (Core Equity, Growth Trends and Technology are referred to in this proxy statement and prospectus as the “Merger Funds”). As described herein, an unfavorable vote by any of the Merger Funds will not affect the reorganization of any other Merger Fund if approved by that Fund’s shareholders. It is anticipated that the most favorable expense ratio will be achieved for each Merger Fund if all proposed reorganizations are approved and implemented and that the least favorable expense ratio for each of these funds will result if such fund is the only fund that reorganizes into the Acquiring Fund.
The following tables illustrate the anticipated change in operating expenses expected as a result the reorganization into the Acquiring Fund of: (i) only Core Equity; (ii) only Growth Trends; and (iii) all of the Merger Funds. Because no Merger Fund’s reorganization is contingent on whether any other Merger Fund’s reorganization is approved, several combinations are possible. Although the effects on expenses for all possible fund combinations are not illustrated in the expense tables below, it is expected that the range of resulting expenses from the possible fund combinations with respect to either Core Equity or Growth Trends will be captured in the included expense tables because such tables illustrate what is anticipated to be the least and most favorable resulting expenses for either of these funds.
| Core | Growth | Rainier | Rainier | Rainier | Rainier |
| Class A | Class A | Class A | Class A | Class A | Class A |
Shareholder transaction expenses(1) |
|
|
|
|
|
|
Maximum front-end sales charge (load) on purchases as a % of purchase price | 5.00% | 5.00% | 5.00% | 5.00% | 5.00% | 5.00% |
Maximum deferred sales charge (load) as a % of purchase or sale price, whichever is less | None(2) | None(2) | None(2) | None (2) | None (2) | None (2) |
| Core | Growth | Rainier | Rainier | Rainier | Rainier |
| Class A | Class A | Class A | Class A | Class A | Class A |
Annual Operating Expenses |
|
|
|
|
|
|
Management fee | 0.75% | 1.00% | 0.75% | 0.75% | 0.75% | 0.75% |
Distribution and service (12b-1) fees | 0.30% | 0.30% | 0.25% | 0.25% | 0.25% | 0.25% |
Other expenses | 0.47% | 0.63% | 0.19% | 0.19% | 0.19% | 0.18% |
Total fund operating expenses | 1.52% | 1.93% | 1.19% | 1.19% | 1.19% | 1.18% |
Contractual expense reimbursement | None | 0.41%(3) | 0.00%(4) | 0.00%(4) | 0.00%(4) | 0.00%(4) |
Net annual operating expenses | 1.52% | 1.52% | 1.19% | 1.19% | 1.19% | 1.18% |
(1) A $4.00 fee will be charged for wire redemptions.
(2) A CDSC ranging from 1.00% to 0.25% applies with respect to certain purchases of Class A shares of $1 million or more upon which a commission or finder’s fee was paid and that are sold within 1 year after purchase.
(3) JHA has contractually agreed to waive Growth Trends’ management fees so that the management fees do not exceed 0.75% of the fund’s average net assets. In addition, JHA has contractually agreed to reimburse certain fund expenses (including 12b-1 fees, brokerage commissions, interest, and other extraordinary expenses not incurred in the ordinary course of the fund’s business) that exceed 1.35% of the fund’s average net assets. Also Signature Services has agreed to contractually limit transfer agent fees, a class-specific expense, to 0.25% for Class A shares. The management fee waiver and expense reimbursements continue in effect until February 28, 2009 and thereafter until terminated by JHA and Signature Services on notice to the fund.
(4) JHIMS has contractually agreed to waive advisory fees or reimburse fund expenses for Class A shares of Rainier Growth to the extent that expenses attributable to those shares exceed 1.19% of the average annual net assets attributable to the class. This agreement remains in effect at least until April 28, 2009, and may thereafter be terminated by JHIMS at any time.
| Core | Growth | Rainier | Rainier | Rainier | Rainier |
| Class B | Class B | Class B | Class B | Class B | Class B |
Shareholder transaction expenses(1) |
|
|
|
|
|
|
Maximum deferred sales charge (load) as a % of purchase or sale price, whichever is less | 5.00% | 5.00% | 5.00% | 5.00% | 5.00% | 5.00% |
Annual Operating Expenses |
|
|
|
|
|
|
Management fee | 0.75% | 1.00% | 0.75% | 0.75% | 0.75% | 0.75% |
Distribution and service (12b-1) fees | 1.00% | 1.00% | 1.00% | 1.00% | 1.00% | 1.00% |
Other expenses | 0.47% | 0.63% | 0.75% | 0.75% | 0.75% | 0.30% |
Total fund operating expenses | 2.22% | 2.63% | 2.50% | 2.50% | 2.50% | 2.05% |
Contractual expense reimbursement | None | 0.41%(2) | 0.46%(3) | 0.46%(3) | 0.46%(3) | 0.01%(3) |
Net annual operating expenses | 2.22% | 2.22% | 2.04% | 2.04% | 2.04% | 2.04% |
(1) A $4.00 fee will be charged for wire redemptions.
(2) JHA has contractually agreed to waive Growth Trends’ management fees so that the management fees do not exceed 0.75% of the fund’s average net assets. In addition, JHA has contractually agreed to reimburse certain fund expenses (including 12b-1 fees, brokerage commissions, interest, and other extraordinary expenses not incurred in the ordinary course of the fund’s business) that exceed 1.35% of the fund’s average net assets. Also Signature Services has agreed to contractually limit transfer agent fees, a class-specific expense, to 0.25% for Class B shares. The management fee waiver and expense reimbursements continue in effect until February 28, 2009 and thereafter until terminated by JHA and Signature Services on notice to the fund.
(3) JHIMS has contractually agreed to waive advisory fees or reimburse fund expenses for Class B shares of Rainier Growth to the extent that expenses attributable to those shares exceed 2.04% of the average annual net assets attributable to the class. This agreement remains in effect at least until April 28, 2009, and may thereafter be terminated by JHIMS at any time.
| Core | Growth | Rainier | Rainier | Rainier | Rainier |
| Class C | Class C | Class C | Class C | Class C | Class C |
Shareholder transaction expenses(1) |
|
|
|
|
|
|
Maximum deferred sales charge (load) as a % of purchase or sale price, whichever is less | 1.00% | 1.00% | 1.00% | 1.00% | 1.00% | 1.00% |
Annual Operating Expenses |
|
|
|
|
|
|
Management fee | 0.75% | 1.00% | 0.75% | 0.75% | 0.75% | 0.75% |
Distribution and service (12b-1) fees | 1.00% | 1.00% | 1.00% | 1.00% | 1.00% | 1.00% |
Other expenses | 0.47% | 0.63% | 0.75% | 0.75% | 0.75% | 0.33% |
Total fund operating expenses | 2.22% | 2.63% | 2.50% | 2.50% | 2.50% | 2.08% |
Contractual expense reimbursement | None | 0.41%(2) | 0.46%(3) | 0.46%(3) | 0.46%(3) | 0.04%(3) |
Net annual operating expenses | 2.22% | 2.22% | 2.04% | 2.04% | 2.04% | 2.04% |
(1) A $4.00 fee will be charged for wire redemptions.
(2) JHA has contractually agreed to waive Growth Trends’ management fees so that the management fees do not exceed 0.75% of the fund’s average net assets. In addition, JHA has contractually agreed to reimburse certain fund expenses (including 12b-1 fees, brokerage commissions, interest, and other extraordinary expenses not incurred in the ordinary course of the fund’s business) that exceed 1.35% of the fund’s average net assets. Also Signature Services has agreed to contractually limit transfer agent fees, a class-specific expense, to 0.25% for Class C shares. The management fee waiver and expense reimbursements continue in effect until February 28, 2009 and thereafter until terminated by JHA and Signature Services on notice to the fund.
(3) JHIMS has contractually agreed to waive advisory fees or reimburse fund expenses for Class C shares of Rainier Growth to the extent that expenses attributable to those shares exceed 2.04% of the average annual net assets attributable to the class. This agreement remains in effect at least until April 28, 2009, and may thereafter be terminated by JHIMS at any time.
| Core Equity | Rainier Growth | Rainier Growth |
| Class I | Class I | Class I |
Annual Operating Expenses |
|
|
|
Management fee | 0.75% | 0.75% | 0.75% |
Other expenses | 0.18% | 0.15% | 0.15% |
Total fund operating expenses(1) | 0.93% | 0.90% | 0.90% |
Contractual expense reimbursement | None | 0.01%(1) | 0.01%(1) |
Net annual operating expenses | 0.93% | 0.89% | 0.89% |
(1) JHIMS has contractually agreed to waive advisory fees or reimburse fund expenses for Class I shares of Rainier Growth to the extent that expenses attributable to those shares exceed 0.89% of the average annual net assets attributable to the class. This agreement remains in effect at least until April 28, 2009, and may thereafter be terminated by JHIMS at any time.
Examples
The hypothetical examples below show what your expenses would be if you invested $10,000 over different time periods for your fund and Rainier Growth, based on fees and expenses incurred during the 12-month period ended March 31, 2008. Year 1 expenses only are calculated based upon net annual operating expenses after the expense reimbursement. Each example assumes that you reinvested all distributions and that the average annual return was 5%. Pro forma expenses are included assuming a Reorganization with your fund and Rainier Growth. Because no Merger Fund’s reorganization is contingent on whether any other Merger Fund’s reorganization is approved, various combinations are possible. Although the effects on expenses for all possible fund combinations are not illustrated in the hypothetical examples, it is expected that the range of resulting expenses from the possible fund combinations will be captured in the included examples because the examples illustrate what is anticipated to be the least and most favorable resulting expenses for either Core Equity or Growth Trends. The examples are for comparison purposes only and are not a representation of your fund’s or Rainier Growth’s actual expenses or returns, either past or future.
| Core | Growth | Rainier | Rainier | Rainier | Rainier |
Class A |
|
|
|
|
|
|
Year 1 | $647 | $647 | $615 | $615 | $615 | $614 |
Year 3 | $956 | $1,038 | $859 | $859 | $859 | $856 |
Year 5 | $1,288 | $1,454 | $1,122 | $1,122 | $1,122 | $1,117 |
Year 10 | $2,222 | $2,610 | $1,871 | $1,871 | $1,871 | $1,860 |
|
|
|
|
|
|
|
Class B – assuming |
|
|
|
|
|
|
Year 1 | $725 | $725 | $707 | $707 | $707 | $707 |
Year 3 | $994 | $1,079 | $1,035 | $1,035 | $1,035 | $942 |
Year 5 | $1,390 | $1,559 | $1,489 | $1,489 | $1,489 | $1,302 |
Year 10 | $2,378(1) | $2,763(1) | $2,477(1) | $2,477(1) | $2,477(1) | $2,155(1) |
|
|
|
|
|
|
|
Class B – assuming |
|
|
|
|
|
|
Year 1 | $225 | $225 | $207 | $207 | $207 | $207 |
Year 3 | $694 | $779 | $735 | $735 | $735 | $642 |
Year 5 | $1,190 | $1,359 | $1,289 | $1,289 | $1,289 | $1,102 |
Year 10 | $2,378 | $2,763 | $2,477 | $2,477 | $2,477 | $2,155 |
|
|
|
|
|
|
|
Class C – assuming |
|
|
|
|
|
|
Year 1 | $325 | $325 | $307 | $307 | $307 | $307 |
Year 3 | $694 | $779 | $735 | $735 | $735 | $648 |
Year 5 | $1,190 | $1,359 | $1,289 | $1,289 | $1,289 | $1,115 |
Year 10 | $2,554 | $2,933 | $2,801 | $2,801 | $2,801 | $2,407 |
|
|
|
|
|
|
|
Class C – assuming |
|
|
|
|
|
|
Year 1 | $225 | $225 | $207 | $207 | $207 | $207 |
Year 3 | $694 | $779 | $735 | $735 | $735 | $648 |
Year 5 | $1,190 | $1,359 | $1,289 | $1,289 | $1,289 | $1,115 |
Year 10 | $2,554 | $2,933 | $2,801 | $2,801 | $2,801 | $2,407 |
|
|
|
|
|
|
|
| Core | Growth | Rainier | Rainier | Rainier | Rainier |
Class I |
|
|
|
|
|
|
Year 1 | $95 | N/A | $91 | $91 | N/A | N/A |
Year 3 | $296 | N/A | $286 | $286 | N/A | N/A |
Year 5 | $515 | N/A | $497 | $497 | N/A | N/A |
Year 10 | $1,143 | N/A | $1,107 | $1,107 | N/A | N/A |
|
|
|
|
|
|
|
(1) Reflects conversion of Class B Shares to Class A Shares after 8 years.
Comparison of Advisory Arrangements
Your fund’s and Rainier Growth’s advisory agreements are substantially similar. However, the management fees and subadvisory fees differ as set forth below. As noted in the table under “Management Arrangements,” JHA serves as the investment adviser for each Acquired Fund and JHIMS serves as the investment adviser for Rainier Growth.
Management Arrangements
Each fund pays monthly management fees to JHA or JHIMS, as the case may be, equal to the following annual percentage of its average daily net assets:
Annual Advisory Fee Rates | ||
Core Equity (JHA) | Growth Trends (JHA) | Rainier Growth (JHIMS) |
Up to $750 million: 0.75%; | Up to $2.4 billion: 1.00%; | Up to $3 billion of RIM-fund assets*: 0.75%; |
* “RIM-fund assets” means the total assets of Rainier Growth and another fund sub-advised by RIM.
Subadvisory Arrangements
JHA or JHIMS, as relevant, pays subadvisory fees to each fund’s subadvisers equal to the following annual percentages of the average daily net assets of the relevant fund, as shown in the following table:
Annual Subadvisory Fee Rates | ||
Core Equity | Growth Trends | Rainier Growth |
0.35% | Up to $2.4 billion: 0.35%; | Up to $3 billion of RIM-fund assets: 0.30%; |
Comparison of Distribution Plans
Each fund’s board of trustees and shareholders have approved Distribution Plans and adopted the Plans in accordance with Rule 12b-1 under the Investment Company Act of 1940, as amended (the “1940 Act”). Under the Distribution Plans for each of Core Equity and Growth Trends, the Rule 12b-1 fee is paid as a reimbursement for or in anticipation of expenses incurred for distribution related activities. Under the Acquiring Fund’s Distribution Plans, the Rule 12b-1 fee is paid to John Hancock Funds, LLC, the Acquiring Fund’s distributor (the “Distributor”), which may used to make payments related to distribution or servicing of Acquiring Fund shares. The following table shows the various Rule 12b-1 fees applicable to the funds’ shares. No Rule 12b-1 fee is imposed on Class I shares of Core Equity or Rainier Growth.
| Core Equity | Growth Trends | Rainier Growth |
Class A | 0.25% | 0.25% | 0.25%* |
Class B | 1.00% | 1.00% | 1.00% |
Class C | 1.00% | 1.00% | 1.00% |
* The Distribution Plan for Class A shares of Rainier Growth provides that the fund may pay a fee to JHIMS, as distribution coordinator, at an annual rate of up to 0.30% of the average daily net assets of the fund; however, the Board of Trustees of JHF III has agreed to limit the Rule 12b-1 fees for Class A shares of the Acquiring Fund to 0.25% until at least April 25, 2010. The JHF III Board will annually review the 0.25% fee and, following April 25, 2010, the fee may be increased to 0.30% with Board approval.
While your fund’s Distribution Plans provide for reimbursement of certain distribution and shareholder service expenses of your fund, the Acquiring Fund’s Distribution Plans provide for direct payment of distribution and shareholder service fees to the Distributor. Since the Acquiring Fund’s Distribution Plans are not “reimbursement” type plans, any unreimbursed distribution and shareholder service expenses incurred under your fund’s Distribution Plans will not be reimbursable under the Acquiring Fund’s Distribution Plans. Under a “compensation” Rule 12b-1 plan (in contrast to a reimbursement plan), the Distributor receives a fixed amount that may exceed the Distributor’s costs in providing services and could result in a profit to the Distributor.
COMPARISON OF INVESTMENT RISKS
The funds are exposed to various risks that could cause shareholders to lose money on their investments in the funds. The following table compares and shows the similarities of the principal risks affecting each fund.
In deciding whether to approve the Reorganization, you should consider the similarities and differences between your fund and Rainier Growth. In particular, you should consider whether the amount and character of investment risk involved in the authorized investments of Rainier Growth is commensurate with the amount of risk involved in the authorized investments of your fund.
Equity Securities Risk | A principal risk of each fund that has significant exposure to equity securities is that those equity securities will decline in value due to factors affecting the issuing companies, their industries, or the economy and equity markets generally. The values of equity securities may decline for a number of reasons that directly relate to the issuing company, such as management performance, financial leverage and reduced demand for the issuer’s goods or services. They may also decline due to factors that affect a particular industry or industries, such as labor shortages or increased production costs and competitive conditions within an industry. In addition, they may decline due to general market conditions that are not specifically related to a company or industry, such as real or perceived adverse economic conditions and changes in the general outlook for corporate. |
Management Risk | Each fund’s management strategy has a significant influence on fund performance. If the management’s security selection strategies do not perform as expected, the fund could underperform its peers or lose money. |
Large-Capitalization Risk | Large-capitalization stocks as a group could fall out of favor with the market, causing the fund to underperform investments that focus on small-or medium-capitalization stocks. |
Medium and Smaller Company Risk | To the extent that the funds invest in stocks of small- and medium-capitalization companies, these stocks can be more volatile than those of larger companies. These companies may have limited product lines, markets, or financial resources or they may depend on a few key employees. The securities of companies with medium and smaller market capitalizations may trade less frequently and in lesser volume than more widely held securities, and their value may fluctuate more sharply than those securities. They may also trade in the over-the-counter (“OTC”) market or on a regional exchange, or may otherwise have limited liquidity. Investments in less seasoned companies with medium and smaller market capitalizations may present greater opportunities for growth and capital appreciation, but also involve greater risks than customarily are associated with more established companies with larger market capitalizations |
Industry and Sector Risk | To the extent that the fund invests in a given industry or sector, its performance will be hurt if that industry or sector performs poorly. Because Growth Trends focuses on the financial services, healthcare and technology sectors, this fund is more susceptible to industry and sector risk. |
Small-Capitalization Companies Risk | Investments in securities of small companies involve greater risk of loss than investing in larger companies, and their prices can change more frequently and dramatically. |
Foreign Securities Risk | There may be less publicly available information about issuers of foreign securities than is available about companies in the U.S. and foreign auditing requirements may not be comparable to those in the U.S. Interest or dividends on foreign securities may be subject to foreign withholding taxes. Investments in foreign countries may be subject to the possibility of expropriation or confiscatory taxation, exchange controls, political or social instability or diplomatic developments that could aversely affect the value of those investments. The value of foreign securities may be adversely affected by movements in the exchange rates between foreign currencies (including the “euro”) and the U.S. dollar, as well as other political and economic developments. |
Derivatives Risk | A purchase or sale of a futures contract may result in losses substantially in excess of the amount invested in the futures contract. There can be no guarantee that there will be a correlation between price movements in the hedging vehicle and in the securities being hedged. In addition, there are significant differences between the securities and futures markets that could result in an imperfect correlation between the markets, causing a given futures transaction not to achieve its objectives. A decision as to whether, when and how to use futures involves the exercise of skill and judgment, and even a well-conceived investment may be unsuccessful to some degree because of market behavior or unexpected interest rate or securities price trends. There can be no assurance that a liquid market will exist at a time when a fund seeks to close out a futures contract, and that the fund would remain obligated to meet margin requirements until the position is closed. |
Liquidity Risk | In a down market, higher-risk securities and derivatives could become harder to value or to sell at a fair price; this risk could also affect small-capitalization stocks, especially those with low trading volumes. |
High Portfolio Turnover Risk | Actively trading securities can increase transaction costs (thus lowering performance) and taxable distributions. |
Comparison of Fund Performance
Past performance records of Core Equity, Growth Trends and Rainier Growth through December 31, 2007, including: (1) calendar year total returns (without sales charges); and (2) average annual total returns (including imposition of sales charges) are set forth under “Fund Past Performance” beginning on page 9 of this proxy statement and prospectus.
PROPOSALS TO APPROVE AN AGREEMENT AND PLAN OF REORGANIZATION
Description of Reorganization
You are being asked to approve the Agreement, a form of which is attached to this proxy statement as Exhibit A, with respect to your fund. Additional information about each Reorganization and the Agreement is set forth below under “Further Information on the Reorganization.” The Agreement provides for each Reorganization on the following terms:
| § | The Reorganization is scheduled to occur at 5:00 P.M., Eastern Time, on October 3, 2008, but may occur on any later date on or before September 30, 2009. Each Acquired Fund will transfer all of its assets to the Acquiring Fund, and the Acquiring Fund will assume substantially all of each Acquired Fund’s liabilities. This will result in the addition of each Acquired Fund’s assets to the Acquiring Fund’s portfolio. The NAV of both funds will be computed as of 4:00 P.M., Eastern Time, on the closing date of the Reorganization. |
| § | The Acquiring Fund will issue Class A shares to Core Equity and Growth Trends in an amount equal to the net assets attributable to each such Acquired Fund’s Class A shares. As part of the liquidation of each such Acquired Fund, these shares will immediately be distributed to Class A shareholders of record of each such Acquired Fund in proportion to their holdings on the closing date of the Reorganization. As a result, Class A shareholders of these Acquired Funds will become Class A shareholders of the Acquiring Fund. |
| § | The Acquiring Fund will issue Class B shares to the Acquired Funds in an amount equal to the net assets attributable to each Acquired Fund’s Class B shares. As part of the liquidation of each Acquired Fund, these shares will immediately be distributed to Class B shareholders of record of each Acquired Fund in proportion to their holdings on the closing date of the Reorganization. As a result, Class B shareholders of the Acquired Funds will become Class B shareholders of the Acquiring Fund. |
| § | The Acquiring Fund will issue Class C shares to the Acquired Funds in an amount equal to the net assets attributable to each Acquired Fund’s Class C shares. As part of the liquidation of each Acquired Fund, these shares will immediately be distributed to Class C shareholders of record of each Acquired Fund in proportion to their holdings on the closing date of the Reorganization. As a result, Class C shareholders of the Acquired Funds will become Class C shareholders of the Acquiring Fund. |
| § | The Acquiring Fund will issue Class I shares to Core Equity in an amount equal to the net assets attributable to that fund’s Class I shares. As part of the liquidation of Core Equity, these shares will immediately be distributed to Class I shareholders of record of Core Equity in proportion to their holdings on the closing date of the Reorganization. As a result, Class I shareholders of Core Equity will become Class I shareholders of the Acquiring Fund. |
| § | After the shares are issued, the existence of the Acquired Fund will be terminated. |
Reasons for the Proposed Reorganizations
This proxy statement and prospectus is being used by the Capital Series Board and the Equity Board (collectively, the “Acquired Funds Boards”).
Each Acquired Fund Board believes that the proposed Reorganization for its respective fund will be advantageous to the shareholders of the fund for several reasons. Each Acquired Fund Board (each with the advice and assistance of independent counsel) considered the following matters, among others and in no order of priority, in approving the proposal.
First, each Acquired Fund Board reviewed the historical performance of its respective fund relative to Rainier Growth’s performance and relative to the relevant benchmarks. Rainier Growth has had stronger performance than your fund over the five calendar years ended December 31, 2007, although it is understood that no assurances may be given that the combined fund will achieve any particular level of performance after the Reorganization. Because the combined fund will most closely resemble Rainier Growth, Rainier Growth will be the accounting survivor of each Reorganization. As such, the combined fund will assume the performance history of Rainier Growth at the closing of the Reorganizations.
Second, the Reorganization would permit your fund’s shareholders to pursue a similar investment objective in a larger fund utilizing substantially similar investment policies. Each fund focuses at least in part on capital appreciation. The greater asset size of the combined fund may allow it, relative to your fund, to: (i) obtain better net prices on securities trades; and (ii) reduce per-share expenses by spreading fixed costs over a larger asset base.
Third, at current asset levels, the advisory fee of the Acquiring Fund is equal to that of Core Equity and lower than that of Growth Trends, and the overall operating expense ratio of each class of the Acquiring Fund involved in the Reorganization, after expense waivers and reimbursements, is lower than the expense ratio of the corresponding class of each Acquired Fund.
Fourth, a combined fund offers economies of scale that may lead to lower per share fund expenses in the future. Each fund incurs costs for legal, accounting, transfer agency services, insurance, and custodial and administrative services. Many of these resources and costs are duplicative and there may be an opportunity to reduce Rainier Growth’s expense ratio over time because of economies of scale if the funds are combined.
Fifth, the combined fund offers additional classes with greater distribution capabilities than each of the Acquired Funds. The combined fund provides access to different distribution channels and a greater variety of asset bases. Access to greater distribution will help grow fund assets and may result in economies of scale that may help reduce the combined fund’s expense ratio over time.
Sixth, shareholders of the Acquired Funds will gain access to Rainier Growth’s investment process and the growth investing expertise of RIM.
Seventh, the fact that shareholders of the Acquired Funds will experience no change in shareholder services as a result of the Reorganization, and that JHIMS has access to the same resources, management and personnel as JHA and JHIMS will provide similar supervisory services to the combined fund.
Set forth below is past performance information for Core Equity, Growth Trends and Rainer Growth, which may help provide an indication of each fund’s investment risk.
The bar chart under “Calendar Year Total Returns” shows how each fund’s Class A total return (not including any deduction for sales charges) has varied from year to year for each full calendar year. The table under “Average Annual Total Returns” shows average annual total return for each fund over time, for each class of shares (including deductions for sales charges) compared with a broad-based securities market index. Class A performance is shown
both before and after taxes. All figures assume dividend reinvestment. Past performance before and after taxes does not indicate future results.
Calendar Year Total Returns — Class A Shares (without sales charge)
Core Equity
1998 | 1999 | 2000 | 2001 | 2002 | 2003 | 2004 | 2005 | 2006 | 2007 |
28.84% | 12.37% | -7.75% | -10.87% | -22.85% | 23.67% | 8.78% | 7.60% | 13.29% | 3.27% |
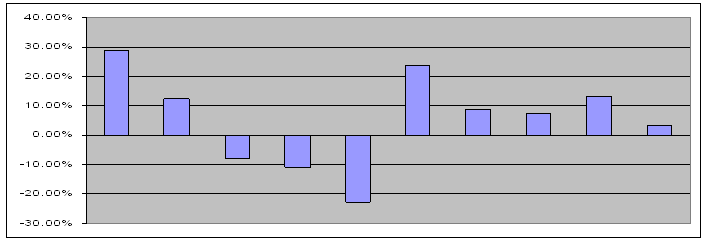
The year-to-date return of Class A shares of Core Equity as of June 30, 2008 was -13.72%.
Quarterly Returns
During the period shown in the above bar chart, Core Equity’s highest quarterly return was 24.17% for the fourth quarter of 1998, and the lowest quarterly return was -16.89% for the third quarter of 2002.
Average Annual Total Returns for Periods Ended December 31, 2007 (including sales charge)
Core Equity
| 1-Year | 5-Years | 10 Years | Life of Class | |
Class A before tax | -1.89% | 9.98% | 3.98% | ---- | ---- |
Class A after tax on distributions(1) | -1.89% | 9.98% | 3.82% | ---- | ---- |
Class A after tax on distributions, with sale(1) | -1.23% | 8.70% | 3.40% | ---- | ---- |
Class B before tax | -2.48% | 10.05% | 3.93% | ---- | ---- |
Class C before tax | 1.55% | 10.33% | ---- | 2.26%(2) | ---- |
Class I before tax | 3.38% | 11.64% | ---- | ---- | 5.51%(3) |
Russell 1000 Index(4) | 5.77% | 13.43% | 6.20% | 4.93%(1)(5) | 7.44%(1)(5) |
(1) After-tax returns are shown for Class A shares only and would be different for the other classes. After-tax returns calculated using the historical highest individual federal marginal income tax rates and do not reflect the impact of state and local taxes. Actual after-tax returns depend on your situation and may differ from those shown. Furthermore, the after-tax returns shown are not relevant to investors who hold their shares through tax-deferred arrangements such as 401(k) plans or IRAs.
(2) Began on May 1, 1998.
(3) Began on March 1, 2002.
(4) An unmanaged index of the largest 1,000 companies on the Russell 3000 Index.
(5) Return as of closest month to share class inception date.
Calendar Year Total Returns — Class A Shares (without sales charge)
Growth Trends
2001 | 2002 | 2003 | 2004 | 2005 | 2006 | 2007 |
-26.89% | -31.42% | 30.61% | 5.56% | 7.24% | 8.44% | 2.55% |
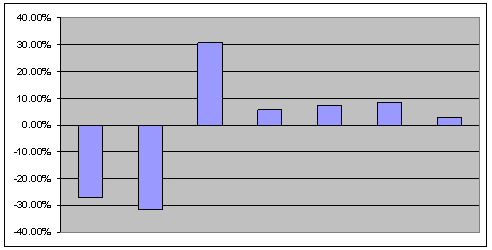
The year-to-date return of Class A shares of Growth Trends as of June 30, 2008 was -17.93%.
Quarterly Returns
During the period shown in the above bar chart, Growth Trends’ highest quarterly return was 18.93% for the second quarter of 2003, and the lowest quarterly return was -23.27% for the first quarter of 2001.
Average Annual Total Returns for Periods Ended December 31, 2007 (including sales charge)
Growth Trends
| 1-Year | 5-Years | Life of Fund(1) |
Class A before tax | -2.55% | 9.34% | -4.98% |
Class A after tax on distributions(2) | -2.55% | 9.34% | -4.99% |
Class A after tax on distributions, with sale(2) | -1.66% | 8.13% | -4.13% |
Class B before tax | -3.23% | 9.36% | -4.99% |
Class C before tax | 0.77% | 9.63% | -4.99% |
Standard & Poor’s 500 Index(3) | 5.49% | 12.83% | 1.91% |
(1) Began on September 22, 2000.
(2) After-tax returns are shown for Class A shares only and would be different for the other classes. After-tax returns calculated using the historical highest individual federal marginal income tax rates and do not reflect the impact of state and local taxes. Actual after-tax returns depend on your situation and may differ from those shown. Furthermore, the after-tax returns shown are not relevant to investors who hold their shares through tax-deferred arrangements such as 401(k) plans or IRAs.
(3) Standard & Poor’s 500 Index, an unmanaged index that includes 500 widely traded common stocks.
Calendar Year Total Returns — Class A Shares (without sales charge)
Rainier Growth
2001 | 2002 | 2003 | 2004 | 2005 | 2006 | 2007 |
-26.95% | -26.16% | 33.88% | 11.60% | 11.61% | 7.24% | 20.57% |
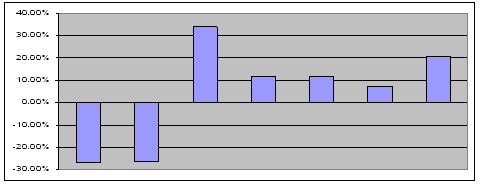
The year-to-date return of Class A shares of Rainier Growth as of June 30, 2008 was -10.74%.
Quarterly Returns
During the period shown in the above bar chart, Rainier Growth’s highest quarterly return was 19.18% for the fourth quarter of 2001, and the lowest quarterly return was -29.30% for the first quarter of 2001.
Average Annual Total Returns for Periods Ended December 31, 2007 (including sales charge)
Rainier Growth(1)
| 1-Year | 5-Years | Life of Fund(2) |
Class A before tax | 14.52% | 15.42% | -1.36% |
Class A after tax on distributions(3) | 14.52% | 15.42% | -1.36% |
Class A after tax on distributions, with sale(3) | 9.44% | 13.59% | -1.15% |
Russell 1000 Growth Index(4) | 11.81% | 12.10% | -2.68%(5) |
Standard & Poor’s 500 Index(4) | 5.49% | 12.83% | 1.60% |
(1) On April 25, 2008, the Rainier Large Cap Growth Equity Portfolio reorganized into Rainier Growth. The performance figures for Rainier Growth’s Class A shares, which commenced operations on April 28, 2008, represent the performance of the Rainier Large Cap Growth Equity Portfolio’s Original Class shares. The performance of the Original Class would be different than the performance of Rainier Growth’s Class A shares because of different expenses. As Class B, Class C and Class I shares of Rainier Growth are new, no performance information is available for these share classes as of the date of this proxy statement and prospectus. Performance of each share class will vary from the performance of the fund’s other share classes due to differences in charges and expenses.
(2) Began on June 15, 2000.
(3) After-tax returns calculated using the historical highest individual federal marginal income tax rates and do not reflect the impact of state and local taxes. Actual after-tax returns depend on your situation and may differ from those shown. Furthermore, the after-tax returns shown are not relevant to investors who hold their shares through tax-deferred arrangements such as 401(k) plans or IRAs.
(4) Each a broad-based, unmanaged total return performance benchmark of domestically traded common stocks.
(5) Return as of closest month end to fund inception date.
FURTHER INFORMATION ON THE REORGANIZATIONS
Tax Status of the Reorganizations
Neither of the Reorganizations is intended to result in income, gain or loss for federal income tax purposes to the Acquiring Fund, any Acquired Fund, or the shareholders of any Acquired Fund. In addition, neither of the Reorganizations will take place unless the relevant fund receives a satisfactory opinion from K&L Gates LLP substantially to the effect that the Reorganization will be a “reorganization” within the meaning of Section 368(a) of the Internal Revenue Code of 1986, as amended (the “Code”).
As a result, with respect to each Reorganization, for federal income tax purposes:
| § | No gain or loss will be recognized by the Acquired Fund upon (1) the transfer of all of its assets to the Acquiring Fund as described above or (2) the distribution by the Acquired Fund of the Acquiring Fund shares to the Acquired Fund’s shareholders; |
| § | No gain or loss will be recognized by the Acquiring Fund upon the receipt of the Acquired Fund’s assets solely in exchange for the issuance of the Acquiring Fund shares to the Acquired Fund and the assumption of the Acquired Fund’s liabilities by the Acquiring Fund; |
| § | The basis of the assets of the Acquired Fund acquired by the Acquiring Fund will be the same as the basis of those assets in the hands of the Acquired Fund immediately before the transfer; |
| § | The tax holding period of the assets of the Acquired Fund in the hands of the Acquiring Fund will include the Acquired Fund’s tax holding period for those assets; |
| § | You will not recognize gain or loss upon the exchange of your shares of the Acquired Fund solely for the Acquiring Fund shares as part of the Reorganization; |
| § | The aggregate tax basis of the Acquiring Fund shares received by you in the Reorganization will be the same as the aggregate tax basis of your shares of the Acquired Fund surrendered in exchange; and |
| § | The tax holding period of the Acquiring Fund shares you receive will include the tax holding period of the shares of the Acquired Fund that you surrender in the exchange, provided that the shares of the Acquired Fund were held by you as capital assets on the date of the exchange. |
In rendering such opinion, counsel shall rely upon, among other things, reasonable assumptions, as well as representations of the relevant Acquired Fund and the Acquiring Fund.
No tax ruling has been or will be received from the Internal Revenue Service (“IRS”) in connection with either Reorganization. An opinion of counsel is not binding on the IRS or a court, and no assurance can be given that the IRS would not assert, or a court would not sustain, a contrary position.
Prior to the closing of each Reorganization, the relevant Acquired Fund will, and the Acquiring Fund may, declare a distribution to shareholders that, together with all previous distributions, will have the effect of distributing to shareholders all of its investment company taxable income (computed without regard to the deduction for dividends paid) and net capital gains, including those realized on disposition of portfolio securities in connection with the Reorganization (after reduction by any available capital loss carry-forwards), if any, through the closing of the Reorganization. Such distributions will be taxable to shareholders.
Each Acquired Fund expects to sell a significant portion of its assets prior to the closing of its Reorganization, which could result in taxable gains to the Fund’s shareholders, as well as increased transaction costs.
As of December 31, 2007, Core Equity had an unused capital loss carryforward of approximately $23.4 million and as of October 31, 2007, Growth Trends had an unused capital loss carryforward of approximately $181.9 million. Capital loss carryforwards are considered valuable tax attributes because they can reduce a fund’s future taxable income and thus reduce the taxable amount distributed to fund shareholders. The proposed Reorganizations will affect the use of these tax attributes in two respects. The first concerns the “sharing” of these tax attributes with the shareholders of the Acquiring Fund. If there were no Reorganization, these tax attributes would inure solely to the
benefit of the shareholders of Core Equity and Growth Trends, respectively. If the Reorganizations occur, these tax attributes carry over (subject to the limitations described below) to the Acquiring Fund. That means that any resulting tax benefits inure to all shareholders of the post-Reorganization Rainier Growth (i.e., both pre-Reorganization shareholders of the Acquired Funds and pre-Reorganization shareholders of the Acquiring Fund).
The second manner in which the Reorganizations will affect the use of the capital loss carryforward and built-in losses concerns certain limitations imposed under the Code with respect to the use of these losses. Generally, when ownership of a “loss corporation” such as each of the Acquired Funds changes for tax purposes in connection with a reorganization (as will be the case here), the Code imposes various limitations on the use of loss carryforwards following the change in ownership. The amount of such loss carryforwards that can be used each year to offset post-acquisition income is generally limited to an amount equal to the “federal long-term tax-exempt rate” (the applicable rate as of April 2008 was 4.71%) multiplied by the value of the “loss corporation’s” equity. Furthermore, capital losses may generally be carried forward for only eight years in the case of regulated investment companies. These limitations would result in forfeiture in the ability to use approximately $173.6 million of Growth Trends’ capital loss carryforward. However, there is no assurance that such losses would be used even in the absence of the Reorganization.
The foregoing consequences may not apply to certain classes of taxpayers who are subject to special circumstances, such as shareholders who are not citizens of or residents of the United States, insurance companies, tax-exempt organizations, financial institutions, dealers in securities or foreign currencies or persons who hold their shares as part of a straddle or conversion transaction.
This description of the federal income tax consequences of each Reorganization is made without regard to the particular circumstances of any shareholder. Shareholders are urged to consult their own tax advisors as to the specific consequences to them of their respective Reorganization, including the applicability and effect of state, local, non-U.S. and other tax laws.
Additional Terms of each Agreement and Plan of Reorganization
Certain terms of the Agreement are described above. The following is a summary of certain additional terms of the Agreement. This summary and any other description of the terms of the Agreement contained in this proxy statement and prospectus is qualified in its entirety by Exhibit A, which is the Form of Agreement and Plan of Reorganization in its entirety that is proposed for each Reorganization.
Conditions to Closing the Reorganization. The obligation of the relevant Acquired Fund to consummate the Reorganization is subject to the satisfaction of certain conditions, including the performance by the Acquiring Fund of all its obligations under the Agreement and the receipt of all consents, orders and permits necessary to consummate the Reorganization (see Agreement, paragraph 8).
The obligation of the relevant Acquiring Fund to consummate the Reorganization is subject to the satisfaction of certain conditions, including the Acquired Fund’s performance of all of its obligations under the Agreement, the receipt of certain documents and financial statements from the Acquired Fund and the receipt of all consents, orders and permits necessary to consummate the Reorganization (see Agreement, paragraph 9).
The obligations of the relevant Acquired Fund and the Acquiring Fund are subject to approval of the Agreement by the necessary vote of the outstanding shares of the Acquired Fund, in accordance with the provisions of Acquired Fund’s declaration of trust and by-laws. The Acquired Fund’s obligations are also subject to the receipt of a favorable opinion of K&L Gates as to the federal income tax consequences of the Reorganization (see Agreement, paragraphs 8(e) and (f) and 9(e) and (f)).
Termination of Agreement. The Board of Trustees of either Acquired Fund (the Capital Series Board or Equity Board) or of the Acquiring Fund (the JHF III Board of Trustees) may terminate the Agreement as to its respective fund (even if the shareholders of the fund have already approved it) at any time before the Reorganization date, if that Board of Trustees believes that proceeding with the Reorganization for its fund would no longer be advisable.
Expenses of the Reorganizations. Each Acquired Fund and the Acquiring Fund will pay the costs that it incurs in connection with the Reorganization, whether or not the Reorganization occurs.
With respect to the proposal, the following table sets forth the capitalization of each fund as of April 30, 2008, and the pro forma combined capitalization of the Acquiring Fund as if all proposed reorganizations had occurred on that date, as well as the pro forma combined capitalization of the Acquiring Fund as if only the Reorganization of Core Equity or Growth Trends had occurred on that date absent the other reorganizations. Because no Merger Fund’s reorganization is contingent on the reorganization of any other Merger Fund, many fund combinations are possible. With respect to Core Equity or Growth Trends, it is expected that the range of resulting pro forma capitalizations will be captured in the following table because the capitalization would be highest if all Merger Funds approved their reorganizations and would be lowest if only Core Equity or Growth Trends, as the case may be, approved its Reorganization.
It is impossible to predict how many shares of the Acquiring Fund will actually be received and distributed by each Acquired Fund on the closing date of the Reorganization. The table below should not be relied upon to determine the amount of Acquiring Fund shares that will actually be received and distributed.
Funds | Net Assets (millions) | Share Class | NAV | Shares Outstanding |
Core Equity | $228.3 | Class A | $31.91 | 5,374,415 |
Class B | $29.48 | 1,590,629 | ||
Class C | $29.48 | 336,439 | ||
Class I | $32.88 | 768 | ||
Rainier Growth | $534.3 | Class A | $22.07 | 6,613,296 |
Class B | $22.15 | 4,452 | ||
Class C | $22.15 | 4,452 | ||
Class I | $22.16 | 6,496,232 | ||
Reduction in net assets and decrease in NAVs to reflect the estimated expenses of the Reorganization with Core Equity only, and increase in outstanding shares relative to net asset value upon that Reorganization. | ($0.2) | Class A | $(0.03) | 2,389,634 |
Class B | $(0.02) | 524,704 | ||
Class C | $(0.02) | 110,969 | ||
Class I | $(0.03) | 371 | ||
Rainier Growth | $762.4 | Class A | $22.07 | 14,377,344 |
Class B | $22.15 | 2,119,786 | ||
Class C | $22.15 | 451,860 | ||
Class I | $22.16 | 6,497,370 |
Funds | Net Assets (millions) | Share Class | NAV | Shares Outstanding |
Growth Trends | $67.4 | Class A | $6.43 | 3,995,174 |
Class B | $6.10 | 4,976,551 | ||
Class C | $6.10 | 1,867,823 | ||
Rainier Growth | $534.3 | Class A | $22.07 | 6,613,296 |
Class B | $22.15 | 4,452 | ||
Class C | $22.15 | 4,452 | ||
Reduction in net assets and decrease in NAVs to reflect the estimated expenses of the Reorganization with Growth Trends only, and decrease in outstanding shares relative to net asset value upon that Reorganization. | ($0.1) | Class A | $(0.01) | (2,832,634) |
Class B | $(0.01) | (3,607,799) | ||
Class C | $(0.01) | (1,354,108) | ||
Rainier Growth | $601.7 | Class A | $22.07 | 7,775,846 |
Class B | $22.15 | 1,373,205 | ||
Class C | $22.15 | 518,168 |
| Net Assets (millions) | Share Class | NAV | Shares Outstanding |
Reduction in net assets and decrease in NAVs to reflect the estimated expenses of the Reorganization with all Merger Funds, and decrease in outstanding shares relative to net asset value upon all Reorganizations. | ($0.6) | Class A | $(0.01) | (28,974,261) |
Class B | $(0.01) | (10,961,053) | ||
Class C | $(0.01) | (3,191,276) | ||
Rainier Growth | $974.1 | Class A | $22.16 | 20,539,270 |
Class B | $22.15 | 4,701,935 | ||
Class C | $22.15 | 1,265,577 |
The expenses of the Reorganization will be borne by the Acquired Funds. The net assets of the Acquired Funds above do not include the estimated expenses of the Reorganization.
If both Reorganizations had taken place on April 30, 2008: approximately 1.44 Class A, 1.33 Class B, 1.33 Class C and 1.48 Class I shares of Rainier Growth Fund would have been issued for the same number of Class A, Class B, Class C, and Class I shares, respectively, of Core Equity Fund; and approximately 0.29 Class A, 0.28 Class B and 0.28 Class C shares of Rainier Growth Fund would have been issued for the same number of Class A, Class B and Class C shares, respectively, of Growth Trends Fund.
ADDITIONAL INFORMATION ABOUT THE FUNDS’ BUSINESSES
The following table shows where in each fund’s prospectus you can find additional information about the business of the fund.
Type of Information | Headings in Each Prospectus |
Investment objective and policies | Goal and Strategy/Main Risks |
Portfolio management | Management Biographies |
Type of Information | Headings in Each Prospectus |
Expenses | Your Expenses |
Custodian | Business Structure |
Shares of beneficial interest | Your Account: Choosing a share class |
Purchase of shares | Your Account: Choosing a share class, How sales charges are calculated, Sales charge reductions and waivers, Opening an account, Buying shares, Transaction policies, Additional investor services |
Redemption of sale of shares | Your Account: Selling shares, How sales charges are calculated, Transaction policies |
Dividends, distributions and taxes | Dividends and account policies |
BOARD EVALUATION AND RECOMMENDATION
For the reasons described above, the Capital Series Board and the Equity Board, including the trustees of each such trust who are not “interested persons” (as defined in the 1940 Act) of their respective Acquired Fund or of JHA or of JHIMS (“independent trustees”), approved the Reorganizations. In particular, the Capital Series Board and the Equity Board each has determined that the proposed Reorganizations are in the best interests of their respective Acquired Funds and that the interests of neither Acquired Fund’s shareholders would be diluted as a result of the Reorganizations. Similarly, the JHF III Board of Trustees, including the independent trustees, approved the Reorganizations. They also determined that the Reorganizations are in the best interests of Rainier Growth and that the interests of Rainier Growth’s shareholders would not be diluted as a result of the Reorganizations.
The trustees of your fund recommend that shareholders of your fund vote FOR the proposal to approve the Agreement and Plan of Reorganization for your fund. |
JHIMS and RIM have entered into an overall business arrangement under which RIM has agreed not to offer investment management services to certain competitors of JHIMS for the investment strategies it manages for JHIMS, subject to further conditions, for a period of up to three years. As part of this arrangement, JHIMS has agreed that under certain circumstances it (and not any of the funds) will pay to RIM specified amounts if total assets of John Hancock investment products subadvised by RIM do not equal or exceed certain thresholds for a period of up to three years. Such amounts may total up to $7.5 million per year for each of the three years. As a further part of this arrangement, JHIMS has agreed that under certain circumstances it (and not any of the funds) will pay to RIM a specified amount if the RIM subadvisory agreement for Rainier Growth is terminated within a three-year period. Such amount may total up to $22.5 million. JHIMS has also agreed that, subject to its fiduciary duties as an investment adviser to Rainier Growth and its shareholders, it will not support or recommend to the Board of Trustees of JHF III any termination of the RIM subadvisory agreement with respect to the Acquiring Fund for a three-year period. Neither JHF III nor any of the funds is a party to any of these arrangements, and they are not binding upon the funds or the JHF III Board. However, these arrangements present certain conflicts of interest because JHIMS has a financial incentive to support the continuation of the RIM subadvisory agreements for as long as these arrangements remain in effect. In approving the Reorganizations and the Agreement, the Board of Trustees of your fund, including the independent Trustees, was aware of and considered these potential conflicts of interest, including any financial obligations of JHIMS to RIM.
VOTING RIGHTS AND REQUIRED VOTE
Each whole share of your fund is entitled to one vote and each fractional share is entitled to a proportionate fractional vote. As to an Acquired Fund, approval of the proposal described above requires the affirmative vote of a majority of the outstanding shares of the Acquired Fund entitled to vote on the proposal. For this purpose, the term “vote of a majority of the outstanding shares entitled to vote” shall mean the vote of the lesser of:
| (1) | 67% or more of the voting securities present at such meeting, if more than 50% of the outstanding voting securities of the relevant Acquired Fund are present or represented by proxy; or |
| (2) | more than 50% of the outstanding voting securities of the relevant Acquired Fund. |
Shares | Quorum | Voting |
In General | All shares “present” in person or by proxy are counted towards a quorum. | Shares “present” at the meeting will be voted in person at the meeting. Shares “present” by proxy will be voted in accordance with instructions. |
Proxy with no Voting Instruction (other than Broker Non-Vote) | Considered “present” at the meeting. | Voted “for” a proposal. |
Broker Non-Vote | Considered “present” at the meeting. | Not voted. Same effect as a vote “against.” |
Abstain | Considered “present” at the meeting. | Not voted. Same effect as a vote “against.” |
If the required approval of the relevant Acquired Fund’s shareholders is not obtained with respect to the relevant proposal, the Acquired Fund subject to the proposal will continue to engage in business as a separate mutual fund and the fund’s Board of Trustees will consider what further action may be appropriate.
INFORMATION CONCERNING THE MEETING
Solicitation of Proxies
In addition to the mailing of these proxy materials, proxies may be solicited by telephone, by fax or in person by the trustees, officers and employees of your fund; by personnel of your fund’s investment adviser, JHA and its transfer agent, Signature Services; or by broker-dealer firms. Signature Services, together with a third party solicitation firm, has agreed to provide proxy solicitation services to the Acquired Funds at a cost of approximately $66,000 for the combined proxy. Each Acquired Fund will pay its pro rata share of the costs of preparing, mailing and soliciting proxies, including payments to unaffiliated solicitation firms.
Revoking Proxies
Each Acquired Fund shareholder signing and returning a proxy has the power to revoke it at any time before it is exercised:
| § | By filing a written notice of revocation with the Acquired Fund’s transfer agent, John Hancock Signature Services, Inc., 1 John Hancock Way, Suite 1000, Boston, Massachusetts 02217-1000; |
| § | By returning a duly executed proxy with a later date before the time of the meeting; or |
| § | If a shareholder has executed a proxy but is present at the meeting and wishes to vote in person, by notifying the secretary of your fund (without complying with any formalities) at any time before it is voted. |
Being present at the meeting alone does not revoke a previously executed and returned proxy.
Outstanding Shares and Quorum
As of June 30, 2008 (the “record date”), the numbers of shares of beneficial interest of the Acquired Funds outstanding were as follows:
Fund | Shares Outstanding |
Core Equity |
|
Class A | 5,281,326.771 |
Class B | 1,489,033.903 |
Class C | 338,089.127 |
Class I | 781.848 |
Total | 7,109,231.649 |
Growth Trends |
|
Class A | 3,868,077.384 |
Class B | 4,794,204.796 |
Class C | 1,791,713.095 |
Total | 10,453,995.275 |
Only shareholders of record on the record date are entitled to notice of and to vote at the meeting. A majority of the outstanding shares of the Acquired Fund that are entitled to vote, present in person or represented by proxy, will be considered a quorum for the transaction of business.
Other Business
The Capital Series Board and the Equity Board know of no business to be presented for consideration at the meeting other than the proposals identified in this proxy. If other business is properly brought before the meeting, proxies will be voted according to the best judgment of the persons named as proxies.
Adjournments
With respect to either Acquired Fund, if a quorum is not present in person or by proxy at the time any session of the meeting is called to order, the persons named as proxies may vote those proxies that have been received to adjourn the meeting to a later date. If a quorum is present but there are not sufficient votes in favor of a proposal, the persons named as proxies may propose one or more adjournments of the meeting to permit further solicitation of proxies concerning the proposal. Any adjournment will require the affirmative vote of a majority of the Acquired Fund’s shares at the session of the meeting to be adjourned. If an adjournment of the meeting is proposed because there are not sufficient votes in favor of a proposal, the persons named as proxies will vote those proxies favoring the proposal in favor of adjournment, and will vote those proxies against the Reorganization against adjournment.
Telephone Voting
In addition to soliciting proxies by mail, by fax or in person, your fund may also arrange to have votes recorded by telephone by officers and employees of your fund or by personnel of JHA, Signature Services, or a third party solicitation firm. The telephone voting procedure is designed to verify a shareholder’s identity, to allow a shareholder to authorize the voting of shares in accordance with the shareholder’s instructions and to confirm that the voting instructions have been properly recorded. If these procedures were subject to a successful legal challenge, these telephone votes would not be counted at the meeting. Your fund has not obtained an opinion of counsel about telephone voting, but is currently not aware of any challenge.
| § | A shareholder will be called on a recorded line at the telephone number in a fund’s account records and will be asked to provide the shareholder’s Social Security number or other identifying information. |
| § | The shareholder will then be given an opportunity to authorize proxies to vote his or her shares at the meeting in accordance with the shareholder’s instructions. |
| § | To ensure that the shareholder’s instructions have been recorded correctly, the shareholder will also receive a confirmation of the voting instructions by mail. |
| § | A toll-free number will be available in case the voting information contained in the confirmation is incorrect. |
| § | If the shareholder decides after voting by telephone to attend the meeting, the shareholder can revoke the proxy at that time and vote the shares at the meeting. |
Internet Voting
You will also have the opportunity to submit your voting instructions via the Internet by utilizing a program provided through a vendor. Voting via the Internet will not affect your right to vote in person if you decide to attend the meeting. Do not mail the proxy card if you are voting via the Internet. To vote via the Internet, you will need the “control number” that appears on your proxy card. These Internet voting procedures are designed to authenticate shareholder identities, to allow shareholders to give their voting instructions and to confirm that shareholders’ instructions have been recorded properly. If you are voting via the Internet, you should understand that there may be costs associated with electronic access, such as usage charges from Internet access providers and telephone companies, that must be borne to you.
To vote via the Internet:
| § | Read the proxy statement and have your proxy card(s) at hand. |
| § | Go to the Web site on the proxy card. |
| § | Enter the “control number” found on your proxy card. |
| § | Follow the instructions on the Web site. Please call us at 1-800-225-5291 if you have any problems. |
| § | To ensure that your instructions have been recorded correctly, you will receive a confirmation of your voting instructions immediately after your submission and also by e-mail, if chosen. |
Shareholders’ Proposals
The funds are not required, and do not intend, to hold meetings of shareholders each year. Instead, meetings will be held only when and if required. Any shareholders desiring to present a proposal for consideration at the next meeting for shareholders of their respective funds must submit the proposal in writing, so that it is received by the appropriate fund at 601 Congress Street, Boston, Massachusetts 02210, within a reasonable time before any meeting.
OWNERSHIP OF SHARES OF THE FUNDS
To the knowledge of each fund, as of June 30, 2008, the following persons owned of record or beneficially 5% or more of the outstanding shares of a class of each fund, respectively:
Core Equity | |||
Names and Addresses | Percentage | Class | Record or Beneficial |
MLPF& S for the | 5.99% | A | Record |
MLPF&S for the | 13.19% | A | Record |
Core Equity | |||
Names and Addresses | Percentage | Class | Record or Beneficial |
4800 Deer Lake Drive East 2nd Floor |
|
|
|
NFS LLC FEBO | 48.01% | I | Beneficial |
MLPF&S for the | 35.98% | I | Record |
MG Trust Custodian | 15.64% | I | Beneficial |
|
|
|
|
Growth Trends | |||
Names and Addresses | Percentage | Class | Record or Beneficial |
MLPF&S for the | 13.31% | B | Record |
MLPF& S for the | 19.60% | C | Record |
|
|
|
|
Rainier Growth | |||
Names and Addresses | Percentage | Class | Record or Beneficial |
NFS LLC FEBO | 27.87% | A | Record |
Charles Schwab & Co. Inc. | 20.11% | A | Record |
AST Capital Trust as TTEE | 7.88% | A | Beneficial |
Rainier Growth | |||
Names and Addresses | Percentage | Class | Record or Beneficial |
FBO Roper Industries Inc. Employee |
|
|
|
NFS LLC FEBO | 7.19% | A | Record |
DCGT as TTEE and/or Custodian | 5.18% | A | Record |
John Hancock Life Insurance Co. | 37.27% | B | Record |
NFS LLC FEBO | 16.57% | B | Beneficial |
NFS LLC FEBO | 13.19% | B | Beneficial |
Jean V. White TOD | 6.78% | B | Beneficial |
John Hancock Life Insurance Co. | 12.56% | C | Record |
CO FBO | 12.36% | C | Beneficial |
LPL Financial Services | 8.88% | C | Record |
LPL Financial Services | 7.04% | C | Record |
Rainier Growth | |||
Names and Addresses | Percentage | Class | Record or Beneficial |
MLPF& S for the | 5.78% | C | Record |
Stifel Nicolaus & Co. Inc. | 5.40% | C | Beneficial |
|
|
|
|
As of June 30, 2008, NFS LLC FEBO Sarah L. Hartstein, Keith F. Hartstein TTEE, Sarah L Hartstein Revocable Trust, through its beneficial ownership of over 25% of Core Equity’s Class I shares, may be deemed to control that class of shares.
Except as noted above with respect to Mr. Hartstein, each fund’s President and Chief Executive Officer, as of June 30, 2008, the trustees and officers of each fund owned in the aggregate less than 1% of each class of the fund’s outstanding shares.
The financial highlights and financial statements of: (i) Large Cap Growth Equity Portfolio, the predecessor to the Acquiring Fund, for the fiscal year ended March 31, 2008; (ii) Core Equity, for the fiscal year ended December 31, 2007; and (iii) Growth Trends, for the fiscal year ended October 31, 2007 and the six-months ended April 30, 2008, are incorporated by reference into this proxy statement and prospectus.
The financial statements for the most recent fiscal year and financial highlights for Large Cap Growth Equity Portfolio, the predecessor to the Acquiring Fund, have been independently audited by the independent registered public accounting firm, KPMG LLP, as stated in its report appearing in Large Cap Growth Equity Portfolio’s annual report to shareholders for the fiscal year ended March 31, 2008. The financial statements for Core Equity’s most recent fiscal year and financial highlights have been independently audited by the independent registered public accounting firm, PricewaterhouseCoopers LLP (“PwC”), as stated in its report incorporated by reference in the fund’s SAI dated May 1, 2008. The financial statements for Growth Trends’ most recent fiscal year and financial highlights have been independently audited by PwC, as stated in its report incorporated by reference in the fund’s SAI dated March 1, 2008.
These financial statements and financial highlights have been included in reliance on the reports of the relevant independent registered public accounting firms, given on their authority as experts in accounting and auditing.
Each fund is subject to the informational requirements of the Securities Exchange Act of 1934, as amended, and the 1940 Act, and files reports, proxy statements and other information with the SEC. These reports, proxy statements and other information filed by the funds can be inspected and copied (for a duplication fee) at the public reference facilities of the SEC at 100 F Street, N.E., Room 1580, Washington, D.C. 20549; at the Northeast Regional Office (3 World Financial Center, New York, New York 10281) and at the Midwest Regional Office (175 West Jackson Boulevard, Suite 900, Chicago, Illinois 60661). Copies of these materials can also be obtained by mail from the Public Reference Section of the SEC at 100 F Street, N.E., Washington, D.C. 20549, at prescribed rates. In addition, copies of these documents may be viewed online or downloaded from the SEC’s Website at www.sec.gov.
EXHIBIT A — AGREEMENT AND PLAN OF REORGANIZATION
FORM OF
AGREEMENT AND PLAN OF REORGANIZATION
This Agreement and Plan of Reorganization (the “Agreement”) is made as of _________ ___, 2008, by and between John Hancock ________________ Fund (the “Acquired Fund”), a series of John Hancock ______________ (the “Acquired Fund Trust”), a Massachusetts business trust, and John Hancock Rainier Growth Fund (the “Acquiring Fund”), a series of John Hancock Funds III (the “Acquiring Fund Trust”), a Massachusetts business trust.
This Agreement is intended to be and is adopted as a plan of reorganization and liquidation within the meaning of Sections 361(a) and Section 368(a) of the United States Internal Revenue Code of 1986, as amended (the “Code”), and any successor provision. The reorganization will consist of the transfer of all assets of the Acquired Fund attributable to each class of its shares in exchange for shares of the corresponding class of shares of the Acquiring Fund (the “Merger Shares”), and the assumption by the Acquiring Fund of substantially all of the liabilities of the Acquired Fund and the distribution of the Merger Shares to the shareholders of the Acquired Fund in liquidation of the Acquired Fund, all upon the terms and conditions set forth in this Agreement.
In order to consummate the reorganization contemplated by this Agreement (the “Reorganization”) and in consideration of the promises and the covenants and agreements hereinafter set forth, and intending to be legally bound, each party hereby agrees as follows:
1. | Representations and Warranties of the Acquiring Fund. |
The Acquiring Fund Trust, on behalf of the Acquiring Fund, represents and warrants to, and agrees with, the Acquired Fund that:
(a) The Acquiring Fund is a series of shares of the Acquiring Fund Trust, a Massachusetts business trust duly organized and validly existing under, and in conformity with, the laws of the Commonwealth of Massachusetts, and has the power to own all of its assets and to carry out its obligations under this Agreement. The Acquiring Fund Trust is qualified as a foreign association in every jurisdiction where required, except to the extent that failure to so qualify would not have a material adverse effect on the Acquiring Fund Trust. Each of the Acquiring Fund Trust and the Acquiring Fund has all necessary federal, state and local authorizations to carry on its business as it is now being conducted and to carry out this Agreement.
(b) The Acquiring Fund Trust is duly registered under the Investment Company Act of 1940, as amended (the “1940 Act”), as an open-end management investment company and such registration has not been revoked or rescinded and is in full force and effect, and the Acquiring Fund is a separate diversified series thereof duly designated in accordance with the applicable provisions of the Acquiring Fund Trust’s Amended and Restated Agreement and Declaration of Trust dated August 12, 2005, as may be amended (the “Acquiring Fund Trust Declaration”), and the 1940 Act.
(c) The Acquiring Fund has elected to be, and has met the requirements of subchapter M of Code for treatment as, a “regulated investment company” (“RIC”) within the meaning of Section 851 of the Code at all times since its inception, and will continue to meet such requirements at all times through the Closing Date (as defined in Section 7 herein) and thereafter. The Acquiring Fund has not at any time since its inception been liable for, or is not now liable for, any material income or excise tax pursuant to Sections 852 or 4982 of the Code.
(d) The Acquired Fund has been furnished with the annual report of the Acquiring Fund for the fiscal year ended March 31, 2008, and the audited financial statements appearing therein, having been audited by KPMG LLP, independent registered public accounting firm, which fairly presents the financial condition and result of operations of the Acquiring Fund as of March 31, 2008, in conformity with generally accepted accounting principles in the United States applied on a consistent basis.
(e) The Acquiring Fund has no known liabilities of a material nature, contingent or otherwise, other than those that will be shown as belonging to it on its statement of assets and liabilities as of March 31, 2008, and those incurred in the ordinary course of business as an investment company since such date. As of the Valuation Time (as
defined in Section 3(e)), the Acquiring Fund will advise the Acquired Fund in writing of all known liabilities, contingent or otherwise, whether or not incurred in the ordinary course of business, existing or accrued as of such time.
(f) The Acquiring Fund Trust, on behalf of the Acquiring Fund, has full power and authority to enter into and perform its obligations under this Agreement. The execution, delivery and performance of this Agreement has been duly authorized by all necessary action of the board of trustees of the Acquiring Fund Trust (the “Acquiring Fund Trust Board of Trustees”), and this Agreement constitutes a valid and binding contract enforceable in accordance with its terms subject to approval by the Acquired Fund’s shareholders and subject to the effects of bankruptcy, insolvency, moratorium, fraudulent conveyance and similar laws relating to or affecting creditors’ rights generally and court decisions with respect thereto.
(g) Except as has been disclosed in writing to the Acquired Fund, there are no material legal, administrative or other proceedings pending or, to the knowledge of the Acquiring Fund Trust or the Acquiring Fund, threatened against the Acquiring Fund Trust or the Acquiring Fund which assert liability on the part of the Acquiring Fund Trust or the Acquiring Fund or which materially affect the financial condition of the Acquiring Fund Trust or the Acquiring Fund or the Acquiring Fund Trust’s or the Acquiring Funds’ ability to consummate the Reorganization. Neither the Acquiring Fund Trust nor the Acquiring Fund is charged with or, to the best of its knowledge, threatened with any violation or investigation of any possible violation of any provisions of any federal, state or local law or regulation or administrative ruling relating to any aspect of its business.
(h) Neither the Acquiring Fund Trust nor the Acquiring Fund is obligated under any provision of the Acquiring Fund Trust Declaration or the Acquiring Fund Trust’s By-laws dated June 28, 2005, as may be amended (the “Acquiring Fund Trust By-laws”), and neither is a party to any contract or other commitment or obligation, nor is subject to any order or decree, which would be violated by its execution of or performance under this Agreement, except insofar as the Acquiring Fund and the Acquired Fund may mutually agree that the Acquiring Fund may take such necessary action to amend such contract or other commitment or obligation to cure any potential violation as a condition precedent to the Reorganization.
(i) There are no material contracts outstanding to which the Acquiring Fund is a party that have not been disclosed in the N-14 Registration Statement (as defined in sub-section (k) below) or that will not otherwise be disclosed to the Acquired Fund prior to the Valuation Time.
(j) No consent, approval, authorization or order of any court or government authority is required for the consummation by the Acquiring Fund of the Reorganization, except such as may be required under the Securities Act of 1933, as amended (the “1933 Act”), the Securities Exchange Act of 1934, as amended (the “1934 Act”), and the 1940 Act or state securities laws (which term as used herein shall include the laws of the District of Columbia and Puerto Rico).
(k) The registration statement on Form N-14 filed with the Securities and Exchange Commission (the “Commission”) by the Acquiring Fund Trust on behalf of the Acquiring Fund and relating to the Merger Shares issuable hereunder, and the proxy statement of the Acquired Fund relating to the meeting of the Acquired Fund’s shareholders referred to in Section 6(b) herein (together with the documents incorporated therein by reference, the “Proxy Statement/Prospectus”), and any supplement or amendment thereto or to the documents therein (as amended or supplemented, the “N-14 Registration Statement”), on the effective date of the N-14 Registration Statement, at the time of the shareholders’ meeting referred to in Section 6(b) of this Agreement and at the Closing Date, insofar as it relates to the Acquiring Fund,
(i) did and will comply in all material respects with the provisions of the 1933 Act, the 1934 Act and the 1940 Act and the rules and regulations thereunder; and
(ii) does not and will not contain any untrue statement of a material fact or omit to state any material fact required to be stated therein or necessary to make the statements therein not misleading; and the Proxy Statement/Prospectus included therein did not or will not contain any untrue statement of a material fact or omit to state any material fact necessary to make the statements therein, in the light of the circumstances under which they were made, not misleading; provided, however, that none of the representations and warranties in this sub-section shall apply to statements in or omissions from the N-14 Registration Statement made in reliance upon and in conformity with information furnished by the Acquired Fund for use in the N-14 Registration Statement.
(l) The Acquiring Fund’s investment operations from inception to the date hereof have been in compliance in all material respects with the investment policies and investment restrictions set forth in the N-14 Registration Statement.
(m) All issued and outstanding shares of the Acquiring Fund are, and at the Closing Date will be, duly and validly issued and outstanding, fully paid and nonassessable by the Acquiring Fund. In regard to the statement that the outstanding shares will be nonassessable, it is noted that the Acquiring Fund Trust is a “Massachusetts business trust” and under Massachusetts’ law, shareholders could, under certain circumstances, be held personally liable for the obligations of the Acquiring Fund. The Acquiring Fund does not have outstanding any security convertible into any of the Acquiring Fund shares, except that Class B shares of the Acquiring Fund are convertible into Class A shares of the Acquiring Fund in the manner and on the terms described in the N-14 Registration Statement.
(n) The Merger Shares to be issued to the Acquired Fund pursuant to this Agreement have been duly authorized and, when issued and delivered pursuant to this Agreement, will be legally and validly issued Class A, Class B, [and] Class C [and Class I] shares of beneficial interest in the Acquiring Fund and will be fully paid and nonassessable by the Acquiring Fund, and no shareholder of the Acquiring Fund will have any preemptive right of subscription or purchase in respect thereof. In regard to the statement above that the Merger Shares will be nonassessable, it is noted that Acquiring Fund Trust is a “Massachusetts business trust” and under Massachusetts’ law, shareholders could, under certain circumstances, be held personally liable for the obligations of Acquiring Fund Trust.
(o) At or prior to the Closing Date, the Merger Shares to be transferred to the Acquired Fund for distribution to the shareholders of the Acquired Fund on the Closing Date will be duly qualified for offering to the public in all states of the United States in which the sale of shares of the Acquired Fund presently are qualified, and there will be a sufficient number of such shares registered under the 1933 Act and, as may be necessary, with each pertinent state securities commission to permit the transfers contemplated by this Agreement to be consummated.
(p) At or prior to the Closing Date, the Acquiring Fund will have obtained any and all regulatory, trustee and shareholder approvals necessary to issue the Merger Shares to the Acquired Fund.
(q) The Acquiring Fund has filed, or intends to file, or has obtained extensions to file, all federal, state and local tax returns which are required to be filed by it, and has paid or has obtained extensions to pay, all federal, state and local taxes shown on said returns to be due and owing and all assessments received by it, up to and including the taxable year in which the Closing Date occurs. All tax liabilities of the Acquiring Fund have been adequately provided for on its books, and no tax deficiency or liability of the Acquiring Fund has been asserted and no question with respect thereto has been raised by the Internal Revenue Service or by any state or local tax authority for taxes in excess of those already paid, up to and including the taxable year in which the Closing Date occurs.
2. | Representations and Warranties of the Acquired Fund. |
The Acquired Fund Trust, on behalf of the Acquired Fund, represents and warrants to, and agrees with, the Acquiring Fund that:
(a) The Acquired Fund is a series of shares of the Acquired Fund Trust, a Massachusetts business trust duly organized and validly existing under, and in good standing in conformity with, the laws of the Commonwealth of Massachusetts, and has the power to own all of its assets and to carry out its obligations under this Agreement. The Acquired Fund Trust is qualified as a foreign association in every jurisdiction where required, except to the extent that failure to so qualify would not have a material adverse effect on the Acquired Fund Trust. Each of the Acquired Fund Trust and the Acquired Fund has all necessary federal, state and local authorizations to carry on its business as it is now being conducted and to carry out this Agreement.
(b) The Acquired Fund Trust is a duly registered under the 1940 Act, as an open-end management investment company and such registration has not been revoked or rescinded and is in full force and effect, and the Acquired Fund is a separate diversified series thereof duly designated in accordance with the applicable provisions of the Acquired Fund Trust’s Amended and Restated Declaration of Trust dated March 8, 2005, as may be amended (the “Acquired Fund Trust Declaration”), and the 1940 Act.
(c) The Acquired Fund has elected to be, and has met the requirements of subchapter M of the Code for treatment as a RIC within the meaning of Section 851 of the Code at all times since its inception, and will continue to meet such requirements at all times through the Closing Date with respect to its taxable year ending on the Closing Date. The Acquired Fund has not at any time since its inception been liable for, and is not now liable for, and will not be liable for on the Closing Date, any material income or excise tax pursuant to Sections 852 or 4982 of the Code.
(d) The Acquired Fund Trust, on behalf of the Acquired Fund, has full power and authority to enter into and perform its obligations under this Agreement. The execution, delivery and performance of this Agreement has been duly authorized by all necessary action of the board of trustees of the Acquired Fund Trust (the “Acquired Fund Trust Board of Trustees”), and this Agreement constitutes a valid and binding contract enforceable in accordance with its terms subject to approval by the Acquired Fund’s shareholders and subject to the effects of bankruptcy, insolvency, moratorium, fraudulent conveyance and similar laws relating to or affecting creditors’ rights generally and court decisions with respect thereto.
(e) The Acquiring Fund has been furnished with the annual report of the Acquired Fund for the fiscal year ended _______________ 31, 2007, and the audited financial statements appearing therein, having been audited by PricewaterhouseCoopers LLP, independent registered public accounting firm, and the unaudited statement of assets and liabilities, statement of operations, and statement of changes in net assets of the Acquired Fund and the unaudited schedule of investments of the Acquiring Fund for the period ended ________ ___, 2008, each of which fairly presents the financial condition and result of operations of the Acquired Fund as of the date indicated, in conformity with accounting principles generally accepted in the United States applied on a consistent basis.
(f) The Acquired Fund has no known liabilities of a material nature, contingent or otherwise, other than those that will be shown as belonging to it on its statement of assets and liabilities as of ____________ ___, 2008, and those incurred in the ordinary course of business as an investment company since such date. As of the Valuation Time, the Acquired Fund will advise the Acquiring Fund in writing of all known liabilities, contingent or otherwise, whether or not incurred in the ordinary course of business, existing or accrued as of such time.
(g) Except as has been disclosed in writing to the Acquiring Fund, there are no material legal, administrative or other proceedings pending or, to the knowledge of the Acquired Fund Trust or the Acquired Fund, threatened against the Acquired Fund Trust or the Acquired Fund which assert liability on the part of the Acquired Fund Trust or the Acquired Fund or which materially affect the financial condition of the Acquired Fund Trust or the Acquired Fund or the Acquired Fund Trust’s or the Acquired Funds’ ability to consummate the Reorganization. Neither Acquired Fund Trust nor the Acquired Fund is charged with or, to the best of its knowledge, threatened with any violation or investigation of any possible violation of any provisions of any federal, state or local law or regulation or administrative ruling relating to any aspect of its business.
(h) There are no material contracts outstanding to which the Acquired Fund is a party that have not been disclosed in the N-14 Registration Statement or that will not otherwise be disclosed to the Acquiring Fund prior to the Valuation Time.
(i) Neither the Acquired Fund Trust nor the Acquired Fund is obligated under any provision of the Acquired Fund Trust Declaration or the Acquired Fund Trust’s Amended and Restated By-laws dated ________ ___, _____, as may be amended (the “Acquired Fund Trust By-laws”), and neither is a party to any contract or other commitment or obligation, nor is subject to any order or decree, which would be violated by its execution of or performance under this Agreement, except insofar as the Acquired Fund and the Acquiring Fund may mutually agree that the Acquired Fund may take such necessary action to amend such contract or other commitment or obligation to cure any potential violation as a condition precedent to the Reorganization.
(j) The Acquired Fund has filed, or intends to file, or has obtained extensions to file, all federal, state and local tax returns which are required to be filed by it, and has paid or has obtained extensions to pay, all federal, state and local taxes shown on said returns to be due and owing and all assessments received by it, up to and including the taxable year in which the Closing Date occurs. All tax liabilities of the Acquired Fund have been adequately provided for on its books, and no tax deficiency or liability of the Acquired Fund has been asserted and no question with respect thereto has been raised by the Internal Revenue Service or by any state or local tax authority for taxes in excess of those already paid, up to and including the taxable year in which the Closing Date occurs.
(k) As used in this Agreement, the term “Acquired Fund Investments” shall mean: (i) the investments of the Acquired Fund shown on its schedule of investments as of the Valuation Time furnished to the Acquiring Fund; and (ii) all other assets owned by the Acquired Fund or liabilities incurred as of the Valuation Time. At the Valuation Time and the Closing Date, the Acquired Fund will have full right, power and authority to sell, assign, transfer and deliver the Acquired Fund Investments. At the Closing Date, subject only to the obligation to deliver the Acquired Fund Investments as contemplated by this Agreement, the Acquired Fund will have good and marketable title to all of the Acquired Fund Investments, and the Acquiring Fund will acquire all of the Acquired Fund Investments free and clear of any encumbrances, liens or security interests and without any restrictions upon the transfer thereof (except those imposed by the federal or state securities laws and those imperfections of title or encumbrances as do not materially detract from the value or use of the Acquired Fund Investments or materially affect title thereto).
(l) No consent, approval, authorization or order of any court or governmental authority is required for the consummation by the Acquired Fund of the Reorganization, except such as may be required under the 1933 Act, the 1934 Act, the 1940 Act or state securities laws.
(m) The N-14 Registration Statement, on the effective date of the N-14 Registration Statement, at the time of the shareholders’ meeting referred to in Section 6(b) of this Agreement and at the Closing Date, insofar as it relates to the Acquired Fund,
(i) did and will comply in all material respects with the provisions of the 1933 Act, the 1934 Act and the 1940 Act and the rules and regulations thereunder; and
(ii) does not and will not contain any untrue statement of a material fact or omit to state any material fact required to be stated therein or necessary to make the statements therein not misleading; and the Proxy Statement/Prospectus included therein did not or will not contain any untrue statement of a material fact or omit to state any material fact necessary to make the statements therein, in the light of the circumstances under which they were made, not misleading; provided, however, that none of the representations and warranties in this sub-section shall apply to statements in or omissions from the N-14 Registration Statement made in reliance upon and in conformity with information furnished by the Acquiring Fund for use in the N-14 Registration Statement.
(n) All issued and outstanding shares of the Acquired Fund are, and at the Closing Date will be, duly and validly issued and outstanding, fully paid and nonassessable by the Acquired Fund (“Acquired Fund Shares”). In regard to the statement above that the Acquired Fund Shares will be nonassessable, it is noted that the Acquired Fund Trust is a “Massachusetts business trust” and under Massachusetts’ law, shareholders could, under certain circumstances, be held personally liable for the obligations of the Acquired Fund. The Acquired Fund does not have outstanding any security convertible into any of the Acquired Fund Shares, except that Class B shares of the Acquired Fund are convertible into Class A shares of the Acquired Fund in the manner and on the terms described in the N-14 Registration Statement.
(o) All of the issued and outstanding shares of the Acquired Fund were offered for sale and sold in conformity with all applicable federal and state securities laws.
(p) The books and records of the Acquired Fund made available to the Acquiring Fund and/or its counsel are substantially true and correct and contain no material misstatements or omissions with respect to the operations of the Acquired Fund.
(q) The Acquired Fund will not sell or otherwise dispose of any of the Merger Shares to be received in the Reorganization, except in distribution to the shareholders of the Acquired Fund, as provided in Section 3 of this Agreement.
3. | The Reorganization. |
(a) Subject to the requisite approval of the shareholders of the Acquired Fund, and to the other terms and conditions contained herein, the Acquired Fund agrees to sell, convey, transfer and deliver to the Acquiring Fund, and the Acquiring Fund agrees to acquire from the Acquired Fund, on the Closing Date, all of the Acquired Fund Investments (including interest accrued as of the Valuation Time on debt instruments) and to assume substantially all of the liabilities of the Acquired Fund, in exchange for that number of Merger Shares provided for in Section 4. Pursuant to this Agreement, as soon as practicable after the Closing Date, the Acquired Fund will distribute all
Merger Shares received by it to its shareholders in exchange for their Acquired Fund Shares. Such distributions shall be accomplished by the opening of shareholder accounts on the share ledger records of the Acquiring Fund in the amounts due the shareholders of the Acquired Fund based on their respective holdings in the Acquired Fund as of the Valuation Time.
(b) If it is determined that the portfolios of the Acquired Fund and the Acquiring Fund, when aggregated, would contain investments exceeding certain percentage limitations imposed upon the Acquiring Fund with respect to such investments, the Acquired Fund, if requested by the Acquiring Fund, will dispose of a sufficient amount of such investments as may be necessary to avoid violating such limitations as of the Closing Date. Notwithstanding the foregoing,
(i) nothing herein will require the Acquired Fund to dispose of any portfolios, securities or other investments, if, in the reasonable judgment of the Acquired Fund Trust Board of Trustees or the Acquired Fund’s investment adviser, such disposition would adversely affect the tax-free nature of the Reorganization for federal income tax purposes or would otherwise not be in the best interests of the Acquired Fund, and
(ii) nothing will permit the Acquired Fund to dispose of any portfolio securities or other investments if, in the reasonable judgment of the Acquiring Fund Trust Board of Trustees or the Acquiring Fund’s investment adviser, such disposition would adversely affect the tax-free nature of the Reorganization for federal income tax purposes or would otherwise not be in the best interests of the Acquiring Fund.
(c) Prior to the Closing Date, the Acquired Fund shall declare a dividend or dividends which, together with all such previous dividends, shall have the effect of distributing to its shareholders all of its net investment company taxable income to and including the Closing Date, if any (computed without regard to any deduction for dividends paid), and all of its net capital gain realized to and including the Closing Date, if any.
(d) The Acquired Fund will pay or cause to be paid to the Acquiring Fund any interest the Acquired Fund receives on or after the Closing Date with respect to any of the Acquired Fund Investments transferred to the Acquiring Fund hereunder.
(e) The Valuation Time shall be 4:00 p.m., Eastern Time, on the Closing Date, or such earlier or later day and time as may be mutually agreed upon in writing (the “Valuation Time”).
(f) Recourse for liabilities assumed from the Acquired Fund by the Acquiring Fund in the Reorganization will be limited to the assets acquired by the Acquiring Fund. The known liabilities of the Acquired Fund, as of the Valuation Time, shall be confirmed to the Acquiring Fund pursuant to Section 2(k) of this Agreement.
(g) The Acquired Fund will be terminated following the Closing Date by terminating its registration under the 1940 Act and its organization under Massachusetts law and, where it is required to do so, will withdraw its authority to do business in any state.
(h) The Acquiring Fund will file with the Secretary of the Commonwealth of Massachusetts any necessary amendment to the Acquiring Fund Trust Declaration and Acquiring Fund Trust By-laws to consummate the Reorganization.
(i) The Acquiring Fund and the Acquired Fund each understands and acknowledges that the Acquiring Fund has or intends to enter into a similar Agreement and Plan of Reorganization (each an “Other Reorganization”) with John Hancock __________ Fund and John Hancock Technology Fund (each an “Other Acquired Fund”) pursuant to which the Acquiring Fund: (1) would acquire substantially all of the assets and assume substantially all of the liabilities of the Other Acquired Fund, and (2) common shareholders of the Other Acquired Fund will become common shareholders of the Acquiring Fund. The effective date of each such Other Reorganization is expected to be in proximity to the Closing Date, however, no Other Reorganizations may occur simultaneously with the Reorganization or with one another, and any Other Reorganization may occur at any such time as the Acquiring Fund and the relevant Other Acquired Fund may agree. The consummation of the Reorganization is not conditioned upon the consummation of any such Other Reorganization. The Acquiring Fund and the Acquired Fund each understands, acknowledges and agrees that any or all of such Other Reorganizations may not occur and the status of any such Other Reorganization will not have a bearing on the consummation of the Reorganization.
4. | Valuation. |
(a) On the Closing Date, the Acquiring Fund will deliver to the Acquired Fund a number of full and fractional Merger Shares having an aggregate net asset value equal, in the case of Class A, Class B, Class C and Class _____ shares of the Acquiring Fund, to the value of the assets of the Acquired Fund attributable to Class A, Class B, Class C and Class _____ shares of the Acquired Fund, respectively, on such date less the value of the liabilities attributable to Class A, Class B, Class C and Class _____ shares of the Acquired Fund assumed by the Acquiring Fund on that date, determined as hereinafter provided in this Section 4.
(b) The net asset value of the Merger Shares to be delivered to the Acquired Fund, the value of the assets attributable to the Acquired Fund Shares, and the value of the liabilities of the Acquired Fund to be assumed by the Acquiring Fund, shall in each case be determined as of the Valuation Time.
(c) The net asset value of the Merger Shares shall be computed in the manner set forth in the then-current prospectus or statement of additional information of the Acquiring Fund Prospectus. The value of the assets and liabilities of the Acquired Fund shall be determined by the Acquiring Fund, in cooperation with the Acquired Fund, pursuant to procedures which the Acquiring Fund would use in determining the fair market value of the Acquiring Fund’s assets and liabilities.
(d) No adjustment shall be made in the net asset value of either the Acquired Fund or the Acquiring Fund to take into account differences in realized and unrealized gains and losses.
(e) The Acquiring Fund shall issue the Merger Shares to the Acquired Fund. The Acquired Fund shall promptly distribute the Merger Shares to the shareholders of the Acquired Fund by establishing open accounts for each Acquired Fund shareholder on the share ledger records of the Acquiring Fund. Certificates representing Merger Shares will not be issued to Acquired Fund shareholders.
(f) The Acquiring Fund shall assume substantially all of the liabilities of the Acquired Fund, whether accrued or contingent, in connection with the acquisition of assets and subsequent liquidation and dissolution of the Acquired Fund or otherwise, except for the Acquired Fund’s liabilities, if any, arising pursuant to this Agreement.
5. | Payment of Expenses. |
(a) The Acquired Fund will bear any and all costs and expenses of the Reorganization that it may incur, including any brokerage commissions, dealer mark-ups and similar expenses that it may incur in connection with the purchases or sale of portfolio securities; provided, that the Acquiring Fund will pay all governmental fees required in connection with the registration or qualification of the Merger Shares under applicable state and federal laws.
(b) Notwithstanding any other provisions of this Agreement, if for any reason the Reorganization contemplated by this Agreement is not consummated, neither the Acquiring Fund nor the Acquired Fund shall be liable to the other for any damages resulting therefrom, including, without limitation, consequential damages, except as specifically set forth above.
(c) Notwithstanding any of the foregoing, costs and expenses will in any event be paid by the party directly incurring them if and to the extent that the payment by another party of such costs and expenses would result in the disqualification of such party as a “regulated investment company” within the meaning of subchapter M of the Code.
6. | Covenants of the Acquired Fund and the Acquiring Fund. |
The Acquired Fund and the Acquiring Fund hereby covenant and agree with the other as follows:
(a) Each of the Acquired Fund and the Acquiring Fund will operate its business as presently conducted in the ordinary course of business between the date hereof and the Closing Date, it being understood that such ordinary course of business will include regular and customary periodic dividends and distributions.
(b) The Acquired Fund Trust, on behalf of the Acquired Fund, will call a meeting of its shareholders to be held prior to the Closing Date to consider and act upon this Agreement and take all other reasonable action necessary to obtain the required shareholder approval of the Reorganization contemplated hereby.
(c) In connection with the Acquired Fund shareholders’ meeting referred to in sub-section (b) above, the Acquiring Fund will prepare the Prospectus/Proxy Statement for such meeting, to be included in the N-14 Registration Statement, which the Acquiring Fund Trust, on behalf of the Acquiring Fund, will prepare and file for registration under the 1933 Act of the Merger Shares to be distributed to the Acquired Fund’s shareholders pursuant hereto, all in compliance with the applicable requirements of the 1933 Act, the 1934 Act, and the 1940 Act. The Acquiring Fund will use its best efforts to provide for the N-14 Registration Statement to become effective as promptly as practicable. The Acquired Fund and the Acquiring Fund will cooperate fully with each other, and each will furnish to the other the information relating to itself to be set forth in the N-14 Registration Statement, as required by the 1933 Act, the 1934 Act, the 1940 Act and the rules and regulations thereunder and the state securities laws.
(d) The information to be furnished by the Acquired Fund and the Acquiring Fund for use in the N-14 Registration Statement shall be accurate and complete in all material respects and shall comply with federal securities and other laws and regulations thereunder applicable hereto.
(e) | The Acquired Fund Trust shall: |
(i) following the consummation of the Reorganization, terminate the Acquired Fund in accordance with the laws of the Commonwealth of Massachusetts, the Acquired Fund Trust Declaration and Acquired Fund Trust By-laws, the 1940 Act and any other applicable law;
(ii) not make any distributions of any Merger Shares other than to the respective Acquired Fund shareholders and without first paying or adequately providing for the payment of all of its respective liabilities not assumed by the Acquiring Fund, if any; and
(iii) on and after the Closing Date not conduct any business on behalf of the Acquired Fund except in connection with the termination of the Acquired Fund.
(f) Each of the Acquired Fund and the Acquiring Fund agrees that by the Closing Date all of its federal and other tax returns and reports required to be filed on or before such date shall have been filed and all taxes shown as due on said returns either have been paid or adequate liability reserves have been provided for the payment of such taxes.
(g) Neither the Acquiring Fund nor the Acquired Fund shall take any action or cause any action to be taken (including, without limitation, the filing of any tax return) that results in the failure of the Reorganization to qualify as a reorganization within the meaning of Section 368(a) of the Code or is inconsistent with the treatment of the Reorganization as a reorganization within the meaning of such Code section. At or prior to the Closing Date, the Acquiring Fund Trust, the Acquiring Fund, the Acquired Fund Trust and the Acquired Fund will take such action, or cause such action to be taken, as is reasonably necessary to enable Kirkpatrick & Lockhart Preston Gates Ellis LLP (“K&L Gates”), special counsel to the Acquired Fund and the Acquiring Fund, to render the tax opinion required herein (including, without limitation, each party’s execution of representations reasonably requested by and addressed to K&L Gates).
(h) In connection with the covenant in subsection (g) above, each of the Acquired Fund and Acquiring Fund will cooperate with each other in filing any tax return, amended return or claim for refund, determining a liability for taxes or a right to a refund of taxes or participating in or conducting any audit or other proceeding in respect of taxes. The Acquiring Fund will retain for a period of ten (10) years following the Closing Date all returns, schedules and work papers and all material records or other documents relating to tax matters of the Acquired Fund for such Acquired Fund’s taxable period first ending after the Closing Date and for all prior taxable periods.
(i) After the Closing Date, the Acquired Fund shall prepare, or cause its agents to prepare, any federal, state or local tax returns required to be filed by the Acquired Fund with respect to its final taxable year ending with its complete liquidation and for any prior periods or taxable years and further shall cause such tax returns to be duly filed with the appropriate taxing authorities. Notwithstanding the aforementioned provisions of this subsection, any expenses incurred by the Acquired Fund (other than for payment of taxes) in connection with the preparation and filing of said tax returns after the Closing Date shall be borne by such Acquired Fund to the extent such expenses have been accrued by such Acquired Fund in the ordinary course without regard to the Reorganization; any excess expenses shall be borne by the investment adviser or an affiliate thereof.
(j) Following the consummation of the Reorganization, the Acquiring Fund will continue its business as a diversified series of the Acquiring Fund Trust, an open-end management investment company registered under the 1940 Act.
7. | Closing Date. |
(a) Delivery of the assets of the Acquired Fund to be transferred, together with any other Acquired Fund Investments, assumption of the liabilities of the Acquired Fund to be assumed, and delivery of the Merger Shares to be issued as provided in this Agreement shall be made at such place and time as the Acquired Fund and Acquiring Fund shall mutually agree, as of the close of business on October 3, 2008, or at such other time and date agreed to by the Acquired Fund and the Acquiring Fund, the date and time upon which such delivery is to take place being referred to herein as the “Closing Date.”
(b) To the extent that any Acquired Fund Investments, for any reason, are not transferable on the Closing Date, the Acquired Fund shall cause such Acquired Fund Investments to be transferred to the Acquiring Fund’s account with its custodian at the earliest practicable date thereafter.
(c) The Acquired Fund will deliver to the Acquiring Fund on the Closing Date confirmation or other adequate evidence as to the tax basis of the Acquired Fund Investments delivered to the Acquiring Fund hereunder.
(d) As soon as practicable after the close of business on the Closing Date, the Acquired Fund shall deliver to the Acquiring Fund a list of the names and addresses of all of the shareholders of record of the Acquired Fund on the Closing Date and the number of Acquired Fund Shares owned by each such shareholder, certified to the best of its knowledge and belief by the transfer agent for the Acquired Fund or by its President.
8. | Conditions of the Acquired Fund’s Obligations. |
The obligations of the Acquired Fund hereunder shall be subject to the following conditions:
(a) That the Acquiring Fund Trust Board of Trustees has determined that participation in the Reorganization is in the best interests of the Acquiring Fund and that the interests of the existing shareholders thereof will not be diluted as a result of the Reorganization, that this Agreement shall have been adopted, and the Reorganization shall have been approved, by the Acquiring Fund Trust Board of Trustees, and that the Acquiring Fund shall have delivered to the Acquired Fund a copy of the resolution approving this Agreement adopted by the Acquiring Fund Trust Board of Trustees certified by its Secretary.
(b) That the Acquired Fund shall have received from the Acquiring Fund a statement of assets, liabilities and capital, with values determined as provided in Section 4 of this Agreement, together with a schedule of the Acquiring Fund’s investments, all as of the Valuation Time, certified on the Acquiring Fund’s behalf by its President (or any Vice President) or its Treasurer, and a certificate signed by the Acquiring Fund’s President (or any Vice President) and its Treasurer, dated as of the Closing Date, certifying that as of the Valuation Time and as of the Closing Date there has been no material adverse change in the financial position of the Acquiring Fund since the date of the Acquiring Fund’s most recent annual report or semiannual report, as applicable, other than changes in its portfolio securities since that date or changes in the market value of its portfolio securities.
(c) That the Acquiring Fund shall have furnished to the Acquired Fund a certificate signed by the Acquiring Fund’s President (or any Vice President) or its Treasurer, dated as of the Closing Date, certifying that, as of the Valuation Time and as of the Closing Date, all representations and warranties of the Acquiring Fund made in this Agreement are true and correct in all material respects with the same effect as if made at and as of such dates, and that the Acquiring Fund has complied with all of the agreements and satisfied all of the conditions on its part to be performed or satisfied at or prior to each of such dates.
(d) That there shall not be any material litigation pending with respect to the matters contemplated by this Agreement.
(e) That the Acquired Fund shall have received the opinion(s) of K&L Gates, counsel for the Acquiring Fund, dated as of the Closing Date, addressed to the Acquired Fund substantially in the form and to the effect that:
(i) the Acquiring Fund is a separate series of the Acquiring Fund Trust, both the Acquiring Fund and the Acquiring Fund Trust are duly formed and validly existing under the laws of the Commonwealth of Massachusetts;
(ii) the Acquiring Fund is separate series of the Acquiring Fund Trust, an open-end, management investment company registered under the 1940 Act;
(iii) this Agreement and the Reorganization provided for herein and the execution of this Agreement have been duly authorized and approved by all requisite action of the Acquiring Fund Trust Board of Trustees, and this Agreement has been duly executed and delivered by the Acquiring Fund Trust on behalf of the Acquiring Fund and (assuming this Agreement is a valid and binding obligation of the other party hereto) is a valid and binding obligation of the Acquiring Fund;
(iv) neither the execution or delivery by the Acquiring Fund Trust on behalf of the Acquiring Fund of this Agreement nor the consummation by the Acquiring Fund of the Reorganization contemplated hereby violates any provision of any statute or any published regulation or any judgment or order disclosed to counsel by the Acquiring Fund as being applicable to the Acquiring Fund;
(v) the Merger Shares have each been duly authorized and, upon issuance thereof in accordance with this Agreement, will be validly issued, fully paid and nonassessable, except to the extent shareholders could under certain circumstances, in accordance with Massachusetts’ law, be held personally liable for the obligations of the Acquiring Fund; and
(vi) to their knowledge and subject to the qualifications set forth below, the execution and delivery by the Acquiring Fund Trust on behalf of the Acquiring Fund of this Agreement and the consummation of the Reorganization herein contemplated do not require, under the laws of the Commonwealth of Massachusetts or any state in which the Acquiring Fund is qualified to do business or the federal laws of the United States, the consent, approval, authorization, registration, qualification or order of, or filing with, any court or governmental agency or body (except such as have been obtained under the 1933 Act, 1934 Act, the 1940 Act or the rules and regulations thereunder). Counsel need express no opinion, however, as to any such consent, approval, authorization, registration, qualification, order or filing which may be required as a result of the involvement of other parties to this Agreement in the transactions herein contemplated because of their legal or regulatory status or because of any other facts specifically pertaining to them.
(f) That the Acquired Fund shall have obtained an opinion from K&L Gates dated as of the Closing Date, addressed to the Acquired Fund, and based upon such representations of the parties as K&L Gates may reasonably request, that the consummation of the Reorganization set forth in this Agreement complies with the requirements of a reorganization as described in Section 368(a) of the Code.
(g) That all proceedings taken by the Acquiring Fund and its counsel in connection with the Reorganization and all documents incidental thereto shall be satisfactory in form and substance to the others.
(h) That the N-14 Registration Statement shall have become effective under the 1933 Act, and no stop order suspending such effectiveness shall have been instituted or, to the knowledge of the Acquiring Fund Trust or the Acquiring Fund, be contemplated by the Commission.
9. | Conditions of the Acquiring Fund’s Obligations. |
The obligations of the Acquiring Fund hereunder shall be subject to the following conditions:
(a) That the Acquired Fund Trust Board of Trustees has determined that participation in the Reorganization is in the best interests of the Acquired Fund and that the interests of the existing shareholders thereof will not be diluted as a result of the Reorganization, that this Agreement shall have been adopted, and the Reorganization shall have been approved, by the Acquired Fund Trust Board of Trustees of the Acquired Fund and by the affirmative vote of the holders of a majority of the outstanding Acquired Fund Shares (as defined in the Acquired Fund Trust Declaration); and the Acquired Fund shall have delivered to the Acquiring Fund a copy of the resolutions approving this Agreement adopted by the Acquired Fund Trust Board of Trustees, and a certificate setting forth the vote of the holders of the Acquired Fund Shares obtained, each certified by its Secretary.
(b) That the Acquired Fund shall have furnished to the Acquiring Fund a statement of its assets, liabilities and capital, with values determined as provided in Section 4 of this Agreement, together with a schedule of investments with their respective dates of acquisition and tax costs, all as of the Valuation Time, certified on the Acquired Fund’s behalf by its President (or any Vice President) or its Treasurer, and a certificate signed by the Acquired Fund’s President (or any Vice President) or its Treasurer, dated as of the Closing Date, certifying that as of the Valuation Time and as of the Closing Date there has been no material adverse change in the financial position of the Acquired Fund since the date of the Acquired Fund’s most recent annual report or semiannual report, as applicable, other than changes in the Acquired Fund Investments since that date or changes in the market value of the Acquired Fund Investments.
(c) That the Acquired Fund shall have furnished to the Acquiring Fund a certificate signed by the Acquired Fund’s President (or any Vice President) or its Treasurer, dated as of the Closing Date, certifying that as of the Valuation Time and as of the Closing Date, all representations and warranties of the Acquired Fund made in this Agreement are true and correct in all material respects with the same effect as if made at and as of such dates and the Acquired Fund has complied with all of the agreements and satisfied all of the conditions on its part to be performed or satisfied at or prior to such dates.
(d) That there shall not be any material litigation pending with respect to the matters contemplated by this Agreement.
(e) That the Acquiring Fund shall have received the opinion(s) of K&L Gates, counsel for the Acquired Fund, dated as of the Closing Date, addressed to the Acquiring Fund, substantially in the form and to the effect that:
(i) the Acquired Fund is a separate series of the Acquired Fund Trust, both the Acquired Fund and the Acquired Fund Trust are duly formed and validly existing under the laws of the Commonwealth of Massachusetts;
(ii) the Acquired Fund is a separate series of the Acquired Fund Trust, an open-end, management investment company registered under the 1940 Act;
(iii) this Agreement and the Reorganization provided for herein and the execution of this Agreement have been duly authorized and approved by all requisite action of the Acquired Fund Trust Board of Trustees, and this Agreement has been duly executed and delivered by the Acquired Fund Trust on behalf of the Acquired Fund and (assuming this Agreement is a valid and binding obligation of the other party hereto) is a valid and binding obligation of the Acquired Fund;
(iv) neither the execution or delivery by the Acquired Fund Trust on behalf of the Acquired Fund of this Agreement nor the consummation by the Acquired Fund of the Reorganization contemplated hereby violates any provision of any statute, or any published regulation or any judgment or order disclosed to counsel by the Acquired Fund as being applicable to the Acquired Fund; and
(v) to their knowledge and subject to the qualifications set forth below, the execution and delivery by the Acquired Fund Trust on behalf of the Acquired Fund of the Agreement and the consummation of the Reorganization herein contemplated do not require, under the laws of the Commonwealth of Massachusetts or any state in which the Acquired Fund is qualified to do business, or the federal laws of the United States, the consent, approval, authorization, registration, qualification or order of, or filing with, any court or governmental agency or body (except such as have been obtained under the 1933 Act, 1934 Act, the 1940 Act or the rules and regulations thereunder). Counsel need express no opinion, however, as to any such consent, approval, authorization, registration, qualification, order or filing which may be required as a result of the involvement of other parties to this Agreement in the transactions herein contemplated because of their legal or regulatory status or because of any other facts specifically pertaining to them.
(f) That the Acquiring Fund shall have obtained an opinion from K&L Gates, counsel for the Acquired Fund, dated as of the Closing Date, addressed to the Acquiring Fund, and based upon such representations of the parties as K&L Gates may reasonably request, that the consummation of the Reorganization set forth in this Agreement complies with the requirements of a reorganization as described in Section 368(a) of the Code.
(g) That the N-14 Registration Statement shall have become effective under the 1933 Act and no stop order suspending such effectiveness shall have been instituted or, to the knowledge of the Acquired Fund, be contemplated by the Commission.
(h) That the Acquired Fund’s custodian shall have delivered to the Acquiring Fund a certificate identifying all assets of the Acquired Fund held or maintained by such custodian as of the Valuation Time.
(i) That all proceedings taken by the Acquired Fund and its counsel in connection with the Reorganization and all documents incidental thereto shall be satisfactory in form and substance to the Acquiring Fund.
(j) That prior to the Closing Date the Acquired Fund shall have declared a dividend or dividends which, together with all such previous dividends, shall have the effect of distributing to its shareholders all of its net investment company taxable income for the period to and including the Closing Date, if any (computed without regard to any deduction for dividends paid), and all of its net capital gain, if any, realized up to and including the Closing Date.
10. | Termination, Postponement and Waivers. |
(a) Notwithstanding anything contained in this Agreement to the contrary, this Agreement may be terminated and the Reorganization abandoned at any time (whether before or after adoption thereof by the shareholders of the Acquired Fund) prior to the Closing Date, or the Closing Date may be postponed,
(i) by mutual consent of the Acquired Fund Trust Board of Trustees and the Acquiring Fund Trust Board of Trustees;
(ii) by the Acquired Fund Trust Board of Trustees if any condition of the Acquired Fund’s obligations set forth in Section 8 of this Agreement has not been fulfilled or waived by such Board; or
(iii) by the Acquiring Fund Trust Board of Trustees if any condition of the Acquiring Fund’s obligations set forth in Section 9 of this Agreement has not been fulfilled or waived by such Board.
(b) If the Reorganization contemplated by this Agreement has not been consummated by April 1, 2008, this Agreement automatically shall terminate on that date, unless a later date is mutually agreed to by the Acquired Fund Trust Board of Trustees and the Acquiring Fund Trust Board of Trustees.
(c) In the event of termination of this Agreement pursuant to the provisions hereof, the same shall become void and have no further effect, and there shall not be any liability on the part of the Acquired Fund, the Acquiring Fund or persons who are their directors, trustees, officers, agents or shareholders in respect of this Agreement.
(d) At any time prior to the Closing Date, any of the terms or conditions of this Agreement may be waived by the Acquired Fund Trust Board of Trustees or the Acquiring Fund Trust Board of Trustees (whichever is entitled to the benefit thereof), if, in the judgment of such Board after consultation with its counsel, such action or waiver will not have a material adverse effect on the benefits intended under this Agreement to the shareholders of their respective Fund, on behalf of which such action is taken.
(e) The respective representations and warranties contained in Sections 1 and 2 of this Agreement shall expire with, and be terminated by, the consummation of the Reorganization, and the Acquired Fund and the Acquiring Fund and the officers, trustees, agents or shareholders of such Funds shall not have any liability with respect to such representations or warranties after the Closing Date. This provision shall not protect any officer, trustee, agent or shareholder of either the Acquired Fund or the Acquiring Fund against any liability to the entity for which that officer, trustee, agent or shareholder so acts or to its shareholders, to which that officer, trustee, agent or shareholder otherwise would be subject by reason of willful misfeasance, bad faith, gross negligence, or reckless disregard of the duties in the conduct of such office.
(f) If any order or orders of the Commission with respect to this Agreement shall be issued prior to the Closing Date and shall impose any terms or conditions which are determined by action of the respective Boards of Trustees to be acceptable, such terms and conditions shall be binding as if a part of this Agreement without further vote or approval of the shareholders of the Acquired Fund unless such terms and conditions shall result in a change in the method of computing the number of Merger Shares to be issued to the Acquired Fund, in which event, unless such
terms and conditions shall have been included in the proxy solicitation materials furnished to the shareholders of the Acquired Fund prior to the meeting at which the Reorganization shall have been approved, this Agreement shall not be consummated and shall terminate unless the Acquired Fund promptly shall call a special meeting of shareholders at which such conditions so imposed shall be submitted for approval.
11. | Indemnification. |
(a) Each party (an “Indemnitor”) shall indemnify and hold the other and its officers, trustees, agents and persons controlled by or controlling any of them (each an “Indemnified Party”) harmless from and against any and all losses, damages, liabilities, claims, demands, judgments, settlements, deficiencies, taxes, assessments, charges, costs and expenses of any nature whatsoever (including reasonable attorneys’ fees) including amounts paid in satisfaction of judgments, in compromise or as fines and penalties, and counsel fees reasonably incurred by such Indemnified Party in connection with the defense or disposition of any claim, action, suit or other proceeding, whether civil or criminal, before any court or administrative or investigative body in which such Indemnified Party may be or may have been involved as a party or otherwise or with which such Indemnified Party may be or may have been threatened (collectively, the “Losses”) arising out of or related to any claim of a breach of any representation, warranty or covenant made herein by the Indemnitor; provided, however, that no Indemnified Party shall be indemnified hereunder against any Losses arising directly from such Indemnified Party’s: (i) willful misfeasance; (ii) bad faith; (iii) gross negligence; or (iv) reckless disregard of the duties involved in the conduct of such Indemnified Party’s position.
(b) The Indemnified Party shall use its best efforts to minimize any liabilities, damages, deficiencies, claims, judgments, assessments, costs and expenses in respect of which indemnity may be sought hereunder. The Indemnified Party shall give written notice to Indemnitor within the earlier of ten (10) days of receipt of written notice to Indemnified Party or thirty (30) days from discovery by Indemnified Party of any matters which may give rise to a claim for indemnification or reimbursement under this Agreement. The failure to give such notice shall not affect the right of Indemnified Party to indemnity hereunder unless such failure has materially and adversely affected the rights of the Indemnitor. At any time after ten (10) days from the giving of such notice, Indemnified Party may, at its option, resist, settle or otherwise compromise, or pay such claim unless it shall have received notice from Indemnitor that Indemnitor intends, at Indemnitor’s sole cost and expense, to assume the defense of any such matter, in which case Indemnified Party shall have the right, at no cost or expense to Indemnitor, to participate in such defense. If Indemnitor does not assume the defense of such matter, and in any event until Indemnitor states in writing that it will assume the defense, Indemnitor shall pay all costs of Indemnified Party arising out of the defense until the defense is assumed; provided, however, that Indemnified Party shall consult with Indemnitor and obtain Indemnitor’s prior written consent to any payment or settlement of any such claim. Indemnitor shall keep Indemnified Party fully apprised at all times as to the status of the defense. If Indemnitor does not assume the defense, Indemnified Party shall keep Indemnitor apprised at all times as to the status of the defense. Following indemnification as provided for hereunder, Indemnitor shall be subrogated to all rights of Indemnified Party with respect to all third parties, firms or corporations relating to the matter for which indemnification has been made.
12. | Other Matters. |
(a) All covenants, agreements, representations and warranties made under this Agreement and any certificates delivered pursuant to this Agreement shall be deemed to have been material and relied upon by each of the parties, notwithstanding any investigation made by them or on their behalf.
(b) All notices hereunder shall be sufficiently given for all purposes hereunder if in writing and delivered personally or sent by registered mail or certified mail, postage prepaid. Notice to the Acquired Fund shall be addressed to the John Hancock _______________ Fund c/o John Hancock, 601 Congress Street, Boston, Massachusetts 02210, Attention: General Counsel, or at such other address as the Acquired Fund may designate by written notice to the Acquiring Fund. Notice to the Acquiring Fund shall be addressed to John Hancock Rainier Growth Fund c/o John Hancock, 601 Congress Street, Boston, Massachusetts 02210, Attention: General Counsel, or at such other address and to the attention of such other person as the Acquiring Fund may designate by written notice to the Acquired Fund. Any notice shall be deemed to have been served or given as of the date such notice is delivered personally or mailed.
(c) This Agreement supersedes all previous correspondence and oral communications between the parties regarding the Reorganization, constitutes the only understanding with respect to the Reorganization, may not be changed except by a letter of agreement signed by each party and shall be governed by and construed in accordance with the laws of the Commonwealth of Massachusetts applicable to agreements made and to be performed in said state.
(d) It is expressly agreed that the obligations of the each of the Acquired Fund Trust, on behalf of the Acquired Fund, and the Acquiring Fund Trust, on behalf of the Acquiring Fund, hereunder shall not be binding upon any of their respective trustees, shareholders, nominees, officers, agents, or employees personally, but shall bind only the trust property of the respective Fund as provided in the Acquired Fund Trust Declaration or the Acquiring Fund Trust Declaration, as applicable. The execution and delivery of this Agreement has been authorized by the Acquired Fund Trust Board of Trustees on behalf of the Acquired Fund and the Acquiring Fund Trust Board of Trustees on behalf of the Acquiring Fund and signed by authorized officers of each respective Trust, acting as such, and neither such authorization by such trustees, nor such execution and delivery by such officers shall be deemed to have been made by any of them individually or to impose any liability on any of them personally, but shall bind only the trust property of each respective trust on behalf of the relevant Fund as provided in the Acquired Fund Trust Declaration and the Acquiring Fund Trust Declaration, as applicable.
(e) This Agreement may be executed in any number of counterparts, each of which, when executed and delivered, shall be deemed to be an original but all such counterparts together shall constitute but one instrument.
IN WITNESS WHEREOF, the parties have hereunto caused this Agreement to be executed and delivered by their duly authorized officers as of the day and year first written above.
JOHN HANCOCK ___________________,
on behalf of its series, John Hancock _________________ Fund
By: _________________________________
Name: _______________________________
Title: ________________________________
Attest: ________________________________
Name: ________________________________
Title: _________________________________
JOHN HANCOCK FUNDS III,
on behalf of its series, John Hancock Rainier Growth Fund
By: _________________________________
Name: _______________________________
Title: ________________________________
Attest: ________________________________
Name: ________________________________
Title: _________________________________
Thank You
for mailing your proxy card promptly!
_________________
[Logo] John Hancock(R) John Hancock Funds, LLC
MEMBER FINRA
601 Congress Street
Boston, MA 02210-2805
1-800-225-5291
1-800-554-6713 TDD
1-800-338-8080 EASI-Line
www.jhfunds.com
Mutual Funds
Institutional Services
Private Managed Accounts
Retirement Plans
[MAILING CODE]
STATEMENT OF ADDITIONAL INFORMATION
August 1, 2008
JOHN HANCOCK CORE EQUITY FUND
(“Core Equity,” a series of John Hancock Capital Series)
JOHN HANCOCK GROWTH TRENDS FUND
(“Growth Trends,” a series of John Hancock Equity Trust)
AND
JOHN HANCOCK RAINIER GROWTH FUND
(the “Acquiring Fund,” a series of John Hancock Funds III)
This Statement of Additional Information (“SAI”) is not a prospectus. It should be read in conjunction with the related combined Proxy Statement and Prospectus (also dated August 1, 2008). This SAI provides additional information about the Acquiring Fund and the funds that it is acquiring, Core Equity and Growth Trends (each an “Acquired Fund”). Core Equity, Growth Trends and the Acquiring Fund are diversified series of John Hancock Capital Series (“Capital Series”), John Hancock Equity Trust (“Equity Trust”), and John Hancock Funds III (“JHF III”), respectively, each a Massachusetts business trust. Please retain this SAI for further reference.
A copy of the Proxy Statement and Prospectus can be obtained free of charge by writing or telephoning:
John Hancock Signature Services, Inc.
P. O. Box 9510
Portsmouth, NH 03802-9510
800-225-5291
www.jhfunds.com
INTRODUCTION | 2 |
EXHIBITS AND DOCUMENTS INCORPORATED BY REFERENCE | 2 |
ADDITIONAL INFORMATION ABOUT THE ACQUIRING FUND | 2 |
| FUND HISTORY | 2 |
| DESCRIPTION OF THE FUND AND ITS INVESTMENTS AND RISKS | 2 |
| MANAGEMENT OF THE FUND | 2 |
| CONTROL PERSONS AND PRINCIPAL HOLDERS OF SECURITIES | 2 |
| INVESTMENT ADVISORY AND OTHER SERVICES | 2 |
| PORTFOLIO MANAGERS | 2 |
| BROKERAGE ALLOCATION AND OTHER PRACTICES | 3 |
| CAPITAL STOCK AND OTHER SECURITIES | 3 |
| PURCHASE, REDEMPTION AND PRICING OF SHARES | 3 |
| TAXATION OF THE FUND | 3 |
| UNDERWRITERS | 3 |
| FINANCIAL STATEMENTS | 3 |
ADDITIONAL INFORMATION ABOUT THE ACQUIRED FUNDS | 4 |
| FUND HISTORY | 4 |
| DESCRIPTION OF THE FUNDS AND THEIR INVESTMENTS AND RISKS | 4 |
| MANAGEMENT OF THE FUNDS | 4 |
| CONTROL PERSONS AND PRINCIPAL HOLDERS OF SECURITIES | 4 |
| INVESTMENT ADVISORY AND OTHER SERVICES | 4 |
| PORTFOLIO MANAGERS | 4 |
| BROKERAGE ALLOCATION AND OTHER PRACTICES | 4 |
| CAPITAL STOCK AND OTHER SECURITIES | 4 |
| PURCHASE, REDEMPTION AND PRICING OF SHARES | 4 |
| TAXATION OF THE FUNDS | 4 |
| UNDERWRITERS | 5 |
| FINANCIAL STATEMENTS | 5 |
PRO FORMA FINANCIAL INFORMATION | 5 |
INTRODUCTION
This SAI is intended to supplement the information provided in a combined Proxy Statement and Prospectus dated August 1, 2008 relating to the proposed reorganizations of the Acquired Funds into the Acquiring Fund (each a “Reorganization”) and in connection with the solicitation by the management of each Acquired Fund of proxies to be voted at the Joint Special Meeting of Shareholders of the Acquired Funds to be held on September 23, 2008.
EXHIBITS AND DOCUMENTS INCORPORATED BY REFERENCE
The following documents are incorporated herein by reference. Shareholders will receive a copy of each document that is incorporated by reference upon any request to receive a copy of this SAI.
1. | The SAI dated May 1, 2008 of Capital Series (File Nos. 811-01677 and 002-29502) with respect to Core Equity, as filed with the Securities and Exchange Commission (the “SEC”) on April 25, 2008 (Accession No. 0000950135-08-002867). |
2. | The SAI dated May 1, 2008 of Equity Trust (File No. 002-92548) with respect to Growth Trends, as filed with the SEC on April 18, 2008 (Accession No. 0000950135-08-002595). |
3. | The SAI dated August 1, 2008 of JHF III (File Nos. 811-21777 and 333-125838) with respect to the Acquiring Fund, as filed with the SEC on July ___, 2008 (Accession No. ____________________) (the “JHF III SAI”). |
4. | The Annual Report of Capital Series (File No. 811-01677) for the fiscal year ended December 31, 2007 with respect to Core Equity, as filed with the SEC on March 7, 2008 (Accession No. 0000928816-08-000335). |
5. | The Annual Report of Equity Trust (File No. 811-04079) for the fiscal year ended October 31, 2007 with respect to Growth Trends, as filed with the SEC on January 11, 2008 (Accession No. 0000928816-08-000061). |
6. | The Semi-Annual Report of Equity Trust (File No. 811-04079) for the six months April 30, 2008 with respect to Growth Trends, as filed with the SEC on July 1, 2008 (Accession No. 0000928816-08-000774). |
7. | The Annual Report of Rainier Investment Management Mutual Funds (File No. 811-811-08270) for the fiscal year ended March 31, 2008 with respect to Large Cap Growth Equity Portfolio, the predecessor to the Acquiring Fund, as filed with the SEC on June 6, 2008 (Accession No. 0000894189-08-001824). (On April 28, 2008, the Large Cap Growth Equity Portfolio merged into the Acquiring Fund.) |
ADDITIONAL INFORMATION ABOUT THE ACQUIRING FUND
FUND HISTORY
For additional information about the Acquiring Fund generally and its history, see “Organization of the Fund” in the JHF III SAI.
DESCRIPTION OF THE FUND AND ITS INVESTMENT RISKS
For additional information about the Acquiring Fund’s investment objectives, policies, risks and restrictions, see “Investment Objectives and Policies,” “Descriptions and Risks of Fund Investments,” “Use of Derivatives” and “Investment Restrictions” in the JHF III SAI.
MANAGEMENT OF THE FUND
For additional information about the Trustees of JHF III, see “Those Responsible for Management” in the JHF III SAI.
CONTROL PERSONS AND PRINCIPAL HOLDERS OF SECURITIES
For additional information, see “Those Responsible for Management” in the JHF III SAI.
INVESTMENT ADVISORY AND OTHER SERVICES
For additional information, see “Investment Advisory and Other Services,” “Transfer Agent Services,” “Custody of Portfolio” and “Independent Registered Public Accounting Firm” in the JHF III SAI.
PORTFOLIO MANAGERS
For additional information, see “Portfolio Manager Holdings” in the JHF III SAI.
BROKERAGE ALLOCATION AND OTHER PRACTICES
For additional information about the Acquiring Fund’s brokerage allocation practices, see “Brokerage Allocation” in the JHF III SAI.
CAPITAL STOCK AND OTHER SECURITIES
For additional information about the voting rights and other characteristics of shares of beneficial interest of the Acquiring Fund, see “Description of the Fund Shares” in the JHF III SAI.
PURCHASE, REDEMPTION AND PRICING OF SHARES
For additional information about purchase, redemption and pricing of shares of the Acquiring Fund, see “Net Asset Value,” “Initial Sales Charge on Class A Shares,” “Deferred Sales Charge on Class B and Class C Shares,” “Special Redemptions,” “Additional Services and Programs” and “Purchases and Redemptions through Third Parties” in the JHF III SAI.
TAXATION OF THE FUND
For additional information about tax matters related to an investment in the Acquiring Fund, see “Taxes” in the JHF III SAI.
UNDERWRITERS
For additional information about the Acquiring Fund’s principal underwriter and distribution plans, see “Distribution Contracts” and “Sales Compensation” in the JHF III SAI.
FINANCIAL STATEMENTS
For additional information, see the annual report of the Acquiring Fund, as incorporated by reference into the JHF III SAI.
ADDITIONAL INFORMATION ABOUT THE ACQUIRED FUNDS
FUND HISTORY
For additional information about each Acquired Fund generally and its history, see “Organization of the Funds” in the relevant Acquired Fund SAI.
DESCRIPTION OF THE FUNDS AND THEIR INVESTMENT RISKS
For additional information about each Acquired Fund’s investment objectives, policies, risks and restrictions, see “Investment Objectives and Policies,” “Description of Investment Risks,” “Hedging and Other Strategies” and “Investment Restrictions” in the relevant Acquired Fund SAI.
MANAGEMENT OF THE FUNDS
For additional information about the Trustees of Capital Series and Equity Trust, see “Those Responsible for Management” in the relevant Acquired Fund SAI.
CONTROL PERSONS AND PRINCIPAL HOLDERS OF SECURITIES
For additional information, see “Those Responsible for Management” in the relevant Acquired Fund SAI.
INVESTMENT ADVISORY AND OTHER SERVICES
For additional information, see “Investment Advisory and Other Services,” “Transfer Agent Services,” “Custody of Portfolio” and “Independent Registered Public Accounting Firm” in the relevant Acquired Fund SAI.
PORTFOLIO MANAGERS
For additional information, see “Additional Information about the Funds’ Portfolio Managers” in the Capital Series SAI and “Additional Information about the Portfolio Managers” in the Equity Trust SAI.
BROKERAGE ALLOCATION AND OTHER PRACTICES
For additional information about each Acquired Fund’s brokerage allocation practices, see “Brokerage Allocation” in the relevant Acquired Fund SAI.
CAPITAL STOCK AND OTHER SECURITIES
For additional information about the voting rights and other characteristics of shares of beneficial interest of each Acquired Fund, see “Description of the Funds’ Shares” in the relevant Acquired Fund SAI.
PURCHASE, REDEMPTION AND PRICING OF SHARES
For additional information about purchase, redemption and pricing of shares of the Acquired Fund, see “Net Asset Value,” “Initial Sales Charge on Class A Shares,” “Deferred Sales Charge on Class B and Class C Shares,” “Special Redemptions,” “Additional Services and Programs” and “Purchases and Redemptions through Third Parties” in the relevant Acquired Fund SAI.
TAXATION OF THE FUNDS
For additional information about tax matters related to an investment in an Acquired Fund, see “Tax Status” in the relevant Acquired Fund SAI.
UNDERWRITERS
For additional information about each Acquired Fund’s principal underwriter and distribution plans, see “Distribution Contracts” and “Sales Compensation” in the relevant Acquired Fund SAI.
FINANCIAL STATEMENTS
For additional information, see the annual report of each Acquired Fund, as incorporated by reference into the relevant Acquired Fund SAI.
PRO FORMA FINANCIAL INFORMATION
The pro forma information provided herein should be read in conjunction with the annual report of Core Equity dated December 31, 2007; the annual and semi-annual reports of Growth Trends dated October 31, 2007 and April 30, 2008, respectively; and the annual report of the Acquiring Fund dated March 31, 2008, each of which is on file with the SEC and is available at no charge.
The following unaudited pro forma Combined Statement of Operations has been derived from the Statements of Operations of Core Equity (as of December 31, 2007), Growth Trends (as of April 30, 2008), and the Acquiring Fund (as of March 31, 2008), and such information has been adjusted to give effect to the Reorganization as if the Reorganization had been consummated at March 31, 2008. The pro forma Combined Statement of Operations is presented for informational purposes only and does not purport to be indicative of the financial conditions that actually would have resulted if the Reorganization had occurred on March 31, 2008. The pro forma Combined Statement of Operations should be read in conjunction with the funds’ financial statements and related notes thereto, which are included in the Proxy Statement and Prospectus.
Concurrent with the proposed Reorganizations of Core Equity and Growth Trends, shareholders of another fund, John Hancock Technology Fund (“Technology”), are being asked to approve a similar reorganization with Rainier Growth (Core Equity, Growth Trends and Technology are referred to in this SAI as the “Merger Funds”). An unfavorable vote by any of the Merger Funds will not affect the reorganization of any other Merger Fund if approved by that Fund’s shareholders. It is anticipated that the most favorable Combined Statement of Operations will be achieved for either Core Equity or Growth Trends if all proposed reorganizations are approved and implemented and that the least favorable Statement of Operations for either such fund will result if that fund alone reorganizes into the Acquiring Fund.
John Hancock Funds
Core Equity Fund
Pro-forma Statement of Assets and Liabilities
03/31/2008
(Unaudited)
The following unaudited pro forma combined Statement of Assets, Liabilities and Capital has been derived from the Statement of Assets , Liabilities and Capital of John Hancock Funds Core Equity Fund and John Hancock Rainier Growth Fund (formely known as the Rainier Large Cap Growth Equity Fund). Such information has been adjusted to give effect to the Reorganization as if the Reorganization had occurred on March 31, 2007.
The pro forma combined Statement of Assets, Liabilities and Capital is presented for informational purposes only and does not purport to be indicative of the financial conditions that actually would have resulted if the Reorganization had occurred on March 31, 2007. The pro forma Combined Statement of Assets, Liabilities and Capital should be read in conjunction with the funds' financial statements and related notes thereto which are included in the Proxy Statement and Prospectus.
|
|
|
|
|
|
|
|
|
| ||||
|
|
| John Hancock Funds |
|
| John Hancock Funds |
| ADJUSTMENTS |
|
|
| PRO-FORMA | |
Assets: |
|
|
|
|
|
|
|
|
|
| |||
Investments at value |
| $ | 222,127,939 | $ | 294,779,851 |
| - |
| $ | 516,907,790 | |||
(cost - $211,129,122; $314,590,824) |
|
|
|
|
|
|
|
|
|
| |||
|
|
|
|
|
|
|
|
|
|
| |||
Short term Investments |
|
| 613,000 |
| 12,248,165 |
| - |
|
| 12,861,165 | |||
Cash |
|
| 45 |
| - |
| - |
|
| 45 | |||
Receivable for investments sold |
|
| - |
| 2,256,699 |
| - |
|
| 2,256,699 | |||
Receivable for shares sold |
|
| 1,418 |
| 1,200,712 |
| - |
|
| 1,202,130 | |||
Dividends and interest receivable |
|
| 556,350 |
| 151,024 |
| - |
|
| 707,374 | |||
Prepaid Expenses |
|
| 29,774 |
| 26,490 |
| - |
|
| 56,264 | |||
Other assets |
|
| - |
| - |
| - |
|
| - | |||
| Total Assets |
| 223,328,526 |
|
| 310,662,941 |
|
|
|
| 533,991,467 | ||
Liabilities: |
|
|
|
|
|
|
|
|
|
| |||
Payable for investments purchased |
|
|
|
| 9,669,796 |
| - |
|
| 9,669,796 | |||
Payable for capital shares repurchased |
| 125,677 |
| 494,874 |
| - |
|
| 620,551 | ||||
Payable to affiliates |
|
|
|
|
|
|
|
|
|
| |||
Management Fees |
|
| 138,475 |
| 193,089 |
| - |
|
| 331,564 | |||
Fund Administration Fees |
|
| 452 |
|
|
| - |
|
| 452 | |||
Distribution Fees |
|
| 88,569 |
| 33,873 |
| - |
|
| 122,442 | |||
Transfer Agent Fees |
|
| 371,341 |
|
|
| - |
|
| 371,341 | |||
Trustees Fees |
|
| 83 |
| 15,461 |
| - |
|
| 15,544 | |||
Other payables and accrued expenses |
| 113,929 |
| 26,221 | $ | 219,000 | (A) |
| 359,150 | ||||
| Total Liabilities |
| 838,526 |
| 10,433,314 |
| 219,000 | (A) |
| 11,490,840 | |||
Net Assets |
| $ | 222,490,000 | $ | 300,229,627 | $ | (219,000) | (A) | $ | 522,500,627 | |||
|
|
|
|
|
|
|
|
|
|
| |||
Net Assets: |
|
|
|
|
|
|
|
|
|
| |||
Common shares capital paid-in |
|
| 231,193,832 |
| 319,690,274 |
|
|
|
| 550,884,106 | |||
Accumulated net realized gain(loss) on investments |
| (20,156,597) |
| (11,882,378) |
|
|
|
| (32,038,975) | ||||
Net unrealized appreciation of investments |
| 11,611,817 |
| (7,562,808) |
|
|
|
| 4,049,009 | ||||
Undistributed net investment income(loss) |
| (159,052) |
| (15,461) |
| (219,000) | (A) |
| (393,513) | ||||
|
| $ | 222,490,000 | $ | 300,229,627 | $ | (219,000) | (A) | $ | 522,500,627 | |||
|
|
|
|
|
|
|
|
|
|
| |||
|
| John Hancock Funds |
| John Hancock Funds |
| ADJUSTMENTS |
|
| PRO-FORMA | ||||
|
|
|
|
|
|
|
|
|
| ||||
|
|
|
|
|
|
|
|
|
| ||||
Net Assets applicable to |
|
|
|
|
|
|
|
|
| ||||
Class A Shares | $ | 166,136,552 | $ | - | $ | 164,086,067 | (A)(B) | $ | 330,222,619 | ||||
Original Shares | $ | - | $ | 164,249,598 | $ | (164,249,598) | (B) | $ | - | ||||
Class B Shares | $ | 46,766,519 | $ | - | $ | (46,033) | (A)(B) | $ | 46,720,486 | ||||
Class C Shares | $ | 9,562,899 | $ | - | $ | (9,413) | (A)(B) | $ | 9,553,486 | ||||
Class I Shares | $ | 24,030 | $ | - | $ | 135,980,005 | (A)(B) | $ | 136,004,035 | ||||
Institutional Shares | $ | - | $ | 135,980,029 | $ | (135,980,029) | (B) | $ | - | ||||
|
|
|
|
|
|
|
|
|
| ||||
Shares applicable to |
|
|
|
|
|
|
|
|
| ||||
Class A Shares |
| 5,422,894 |
| - |
| 10,372,568 | (B) |
| 15,795,462 | ||||
Original Shares |
| - |
| 7,856,513 |
| (7,856,513) | (B) |
|
| ||||
Class B Shares |
| 1,651,362 |
| - |
| 575,544 | (B) |
| 2,226,906 | ||||
Class C Shares |
| 337,677 |
| - |
| 117,685 | (B) |
| 455,362 | ||||
Class I Shares |
| 762 |
| - |
| 6,480,842 | (B) |
| 6,481,603 | ||||
Institutional Shares |
| - |
| 6,480,458 |
| (6,480,458) | (B) |
|
| ||||
|
|
|
|
|
|
|
|
|
| ||||
|
|
|
|
|
|
|
|
|
| ||||
Net Asset Value |
|
|
|
|
|
|
|
|
| ||||
Class A Shares | $ | 30.64 | $ | - |
|
|
| $ | 20.91 | ||||
Original Shares | $ | - | $ | 20.91 |
|
|
| $ | - | ||||
Class B Shares | $ | 28.32 | $ | - |
|
|
| $ | 20.98 | ||||
Class C Shares | $ | 28.32 | $ | - |
|
|
| $ | 20.98 | ||||
Class I Shares | $ | 31.55 | $ | - |
|
|
|
| 20.98 | ||||
Institutional Shares |
| $ | - | $ | 20.98 |
|
|
| $ | - |
See Notes to Pro-Forma Statements
John Hancock Funds
Core Equity Fund
Pro-forma Statement of Operations
03/31/2008 (Unaudited)
The following unaudited pro forma combined Statement of Operations has been derived from the Trial Balances and supporting schedules of John Hancock Funds Core Equity Fund, John Hancock Funds Growth Trends Fund, John Hancock Funds Technology Fund, and John Hancock Funds Rainier Growth Fund (formely known as the Rainier Large Cap Growth Equity Fund) as of March 31, 2008, and such information has been adjusted to give effect to the Reorganization as if the Reorganization had occurred on March 31, 2007. The pro forma combined Statement of Operations is presented for informational purposes only and does not purport to be indicative of the financial conditions that actually would have resulted if the Reorganization had occurred on March 31, 2007.
The pro forma Combined Statement of Operations should be read in conjunction with the funds' financial statements and related notes thereto which are included in the Proxy Statement and Prospectus.
|
|
|
|
|
|
|
|
|
|
|
|
|
|
|
| ||
|
| John Hancock Funds |
| John Hancock Funds |
| PRO-FORMA |
| ADJUSTMENTS |
|
|
| ADJUSTED | |||||
Investment Income: |
|
|
|
|
|
|
|
|
|
|
|
| |||||
|
|
|
|
|
|
|
|
|
|
|
|
| |||||
Dividends | $ | 4,434,616 | $ | 934,821 | $ | 5,369,437 | $ | - |
|
| $ | 5,369,437 | |||||
Interest |
| 42,505 |
| 358,643 |
| 401,148 |
|
|
|
|
| 401,148 | |||||
Securities lending |
| 29,643 |
|
|
| 29,643 |
|
|
|
|
| 29,643 | |||||
|
| 4,506,764 |
| 1,293,464 |
| 5,800,228 |
|
|
|
| $ | 5,800,228 | |||||
|
|
|
|
|
|
|
|
|
|
|
|
| |||||
Expenses: |
|
|
|
|
|
|
|
|
|
|
|
| |||||
Investment management fees |
| 2,074,474 |
| 1,059,037 |
| 3,133,511 |
|
|
|
|
| 3,133,511 | |||||
Class A & Original shares distribution and service |
| 587,150 |
| 207,539 |
| 794,689 |
| (102,000) | (D) |
| 692,689 | ||||||
Class B distribution and service |
| 689,251 |
|
|
| 689,251 |
|
|
|
|
| 689,251 | |||||
Class C distribution and service |
| 119,442 |
|
|
| 119,442 |
|
|
|
|
| 119,442 | |||||
Class A & Original Shares Transfer Agent fees |
| 682,846 |
| 8,231 |
| 691,077 |
| (400,000) | (E) |
| 291,077 | ||||||
Class B Transfer Agent fees |
| 241,559 |
|
|
| 241,559 |
| (100,000) | (E) |
| 141,559 | ||||||
Class C Transfer Agent fees |
| 41,697 |
|
|
| 41,697 |
| (18,000) | (E) |
| 23,697 | ||||||
Class I Transfer Agent fees |
| 7 |
|
|
| 7 |
| 27,000 | (E) |
| 27,007 | ||||||
Fund Administration fees |
| 34,492 |
| 47,406 |
| 81,898 |
| (40,550) | (F) |
| 41,348 | ||||||
Audit and legal fees |
| 23,958 |
| 9,670 |
| 33,628 |
| 1,372 | (G) |
| 35,000 | ||||||
Printing and postage fees |
| 82,807 |
| 8,269 |
| 91,076 |
| 33,969 | (G) |
| 125,045 | ||||||
Custodian fees |
| 53,935 |
|
|
| 53,935 |
| 27,511 | (G) |
| 81,446 | ||||||
Miscellaneous |
| 23,134 |
| 13,679 |
| 36,813 |
| (13,679) | (G) |
| 23,134 | ||||||
Trustees' fees |
| 16,638 |
| 6,408 |
| 23,046 |
|
|
|
|
| 23,046 | |||||
Registration and filing fees |
| 78,090 |
| 38,381 |
| 116,471 |
| (34,580) | (G) |
| 81,891 | ||||||
Total Expenses |
| 4,749,481 |
| 1,398,620 |
| 6,148,101 |
| (618,957) |
|
| 5,529,144 | ||||||
Less Expense Reductions & Exoenses Recouped |
| (151,454) |
| 140,114 |
| (11,340) |
| 11,340 |
|
|
| ||||||
Net Expenses |
| 4,598,027 |
| 1,538,734 |
| 6,136,761 |
| (607,617) |
| $ | 5,529,144 | ||||||
Net Investment Income(Loss) |
| (91,263) |
| (245,270) |
| (336,533) |
| 607,617 |
|
| 271,084 | ||||||
REALIZED AND UNREALIZED GAIN (LOSS) |
|
|
|
|
|
|
|
|
|
|
|
| |||||
Net realized gain (loss) on: |
|
|
|
|
|
|
|
|
|
|
| - | |||||
Investments |
| 16,296,073 |
| (10,598,963) |
| 5,697,110 |
| - |
|
|
| 5,697,110 | |||||
Foreign currency, forward contracts and foreign currency related transactions |
| - |
| - |
| - |
|
|
|
|
| - | |||||
Change in net unrealized appreciation (depreciation) of: |
|
|
|
|
|
|
|
|
|
|
|
| |||||
Investments |
| (43,538,518) |
| (9,639,351) |
| (53,177,869) |
| - |
|
|
| (53,177,869) | |||||
Foreign currency, forward contracts and foreign currency related transactions |
| - |
| - |
| - |
|
|
|
|
| - | |||||
Net realized and unrealized gain / loss |
| (27,242,445) |
| (20,238,314) |
| (47,480,759) |
| - |
|
|
| (47,480,759 | ) | ||||
Increase (Decrease) in net assets resulting from operations | $ | (27,333,708) | $ | (20,483,584) | $ | (47,817,292 | ) | $ | 607,617 |
| $ | (47,209,675 | ) | ||||
See Notes to Pro-Forma Statements
John Hancock Funds Core Equity Fund
John Hancock Funds Rainier Growth Fund
NOTES TO THE MARCH 31, 2008 PRO FORMA FINANCIAL STATEMENTS (UNAUDITED)
BASIS OF COMBINATION. The accompanying Pro Forma Combined Schedule of Portfolio Investments and Statements of Assets and Liabilities as of March 31, 2008 and the unaudited Pro Forma Combined Statements of Operations for the year ended March 31, 2008, are intended to present the financial condition and related results of operations of John Hancock Rainier Growth Fund as if the reorganization with the John Hancock Funds Core Equity Fund had been consummated at March 31, 2007. (Note: The Rainier Large Cap Growth Equity Fund was adopted as the John Hancock Rainier Growth Fund on April 25, 2008). Under generally accepted accounting principles in the United States of America ("GAAP"), John Hancock Rainier Growth Fund will be the surviving entity for accounting purposes.
These statements have been derived from the books and records of each Portfolio utilized in calculating daily net asset value at March 31, 2008. The Pro Forma financial statements have been adjusted to reflect the anticipated fee arrangements for the surviving entity and do not reflect the expenses of each of these Portfolios in carrying out their obligations under the Agreement and Plan of Reorganization. If approved by shareholders, the reorganization is expected to occur as of the close of regularly scheduled trading on the New York Stock Exchange on October 3, 2008.
The Pro Forma Combining Schedule of Portfolio Investments, Statements of Assets and Liabilities and Statements of Operations should be read in conjunction with the historical financial statements of John Hancock Funds Core Equity Fund and the Rainier Large Cap Growth Equity Fund, incorporated by reference in the Statement of Additional Information.
The pro forma adjustments to the pro forma financial statement are comprised of:
(A) Adjustment to reflect one time proxy, accounting, legal and other costs of the reorganization as approved by Board of Trustees and to be borne by the Acquired Fund.
(B) Adjustment to reflect the transfer of assets of the Acquired Fund to the Acquiring Fund, and the issuance of shares by the Acquiring Fund equal to the value of the Acquired Fund upon reorganization.
(C) Adjustment to reflect the change in Distribution and Services fees upon reorganization.
(D) Adjustment to reflect the change in Transfer Agent fees upon reorganization.
(E) Adjustment to reflect the change in Fund Administration fees upon reorganization.
(F) Adjustment to reflect the change in expense upon reorganization primarily due to the expense structure of John Hancock Funds and economies of scale. Adjustments are based upon estimates.
1. SIGNIFICANT ACCOUNTING POLICIES
Both the Acquiring Fund and the Acquired Fund have substantially the same accounting policies, which are detailed in the annual shareholder reports referenced below.
2. FEDERAL INCOME TAXES. The Funds’ policy is to qualify as a regulated investment company under Subchapter M of the Internal Revenue Code, as amended, and to distribute substantially all of its taxable income to its shareholders. Accordingly, no federal income tax provision is required.
The unaudited pro forma financial statements should be read in conjunction with the separate financial statements as follows which are incorporated into by reference in the Statement of Additional Information to this proxy statement and prospectus:
Securities held by the Acquired Fund may have to be sold in connection with the merger for the purpose of complying with the investment policies or limitations of the Acquiring Fund.
The merger is expected to be tax free for federal income tax purposes. This means that no gain or loss will be recognized by the Acquired Fund or their shareholders as a result of the merger. The aggregate tax basis of the Acquiring Fund shares received by the shareholders of the Acquired Fund will be the same as the aggregate tax basis the shareholders of the Acquired Fund held in their shares of the Acquired Fund immediately before the merger. At December 31, 2007, the Acquired Fund had a capital loss carry forward of approximately $23 million. At March 31, 2008, the Acquiring Fund had a capital loss carry forward of approximately $1.5 million.
John Hancock Funds Core Equity Fund Annual Report dated December 31, 2007
Rainier Large Cap Growth Equity Fund Annual Report dated March 31, 2008
John Hancock Funds
Growth Trends Fund
Pro-forma Statement of Assets and Liabilities
3/31/2008
(Unaudited)
The following unaudited pro forma combined Statement of Assets and Liabilities has been derived from the Statement of Assets and Liabilities of John Hancock Funds Growth Trends Fund and
John Hancock Funds Rainier Growth Fund (formerly known as the Rainier Large Cap Growth Equity Fund) as of March 31, 2008. Such information has been adjusted to give effect to the Reorganization as if the Reoganization had occurred on March 31, 2007. The pro forma combined Statement of Assets and Liabilities is presented for informational purposes only and does not purport to be indicative of the financial conditions that actually would have resulted if the Reorganization had occurred on March 31, 2007. The pro forma Combined Statement of Assets and Liabilities should be read in conjunction with the funds' financial statements and related notes thereto which are included in the Proxy Statement and Prospectus.
|
|
|
|
|
|
|
|
|
|
|
| ||
|
|
|
| John Hancock Funds |
|
| John Hancock Funds |
|
|
| PRO-FORMA | ||
Assets: |
|
|
|
|
|
|
|
|
|
|
| ||
Investments at value |
|
| $ | 58,390,624 |
| $ | 294,779,851 |
|
| - |
| $ | 353,170,475 |
(cost - $66,078,945; $314,590,824) |
|
|
|
|
|
|
|
|
|
|
| - | |
Short term Investments |
|
|
| 7,670,000 |
|
| 12,248,165 |
|
| - |
|
| 19,918,165 |
Cash |
|
|
| 2,028 |
|
| - |
|
| - |
|
| 2,028 |
Receivable for investments sold |
|
| 2,004,470 |
|
| 2,256,699 |
|
| - |
|
| 4,261,169 | |
Receivable for shares sold |
|
| 370 |
|
| 1,200,712 |
|
| - |
|
| 1,201,082 | |
Dividends and interest receivable |
|
| 32,168 |
|
| 151,024 |
|
| - |
|
| 183,192 | |
Prepaid Expenses |
|
|
| 94,526 |
|
| 26,490 |
|
| - |
|
| 121,016 |
Other assets |
|
|
| 254,326 |
|
|
|
|
| - |
|
| 254,326 |
|
| Total Assets |
| 68,448,512 |
|
| 310,662,941 |
|
| - |
|
| 379,111,453 |
Liabilities: |
|
|
|
|
|
|
|
|
|
|
| ||
Payable for investments purchased |
|
| 1,438,010 |
|
| 9,669,796 |
|
| - |
|
| 11,107,806 | |
Payable for capital shares repurchased |
| 86,815 |
|
| 494,874 |
|
| - |
|
| 581,689 | ||
Payable to affiliates |
|
|
|
|
|
|
|
|
|
| |||
Management Fees |
|
|
| 249,591 |
|
| 193,089 |
|
| - |
|
| 442,680 |
Fund Administration | Fees |
|
| - |
|
| - |
|
|
|
|
| |
Distribution Fees |
|
|
| 40,418 |
|
| 33,873 |
|
| - |
|
| 74,291 |
Transfer Agent Fees |
|
|
| 252,119 |
|
| - |
|
| - |
|
| 252,119 |
Trustees Fees |
|
|
| - |
|
| 15,461 |
|
| - |
|
| 15,461 |
Other payables and accrued expenses |
| 46,033 |
|
| 26,221 |
| $ | 113,000 | (A) |
| 185,254 | ||
|
| Total Liabilities |
| 2,112,986 |
|
| 10,433,314 |
|
| 113,000 | (A) |
| 12,659,300 |
Net Assets |
|
| $ | 66,335,526 |
| $ | 300,229,627 |
| $ | (113,000) | (A) | $ | 366,452,153 |
|
|
|
|
|
|
|
|
|
|
|
| ||
Net Assets: |
|
|
|
|
|
|
|
|
|
|
| ||
Common shares capital paid-in |
|
| 246,963,100 |
|
| 319,690,274 |
|
|
|
|
| 566,653,374 | |
Accumulated net realized gain/(loss) on investments |
| (180,457,655) |
|
| (11,882,378) |
|
|
|
|
| (192,340,033) | ||
Net unrealized appreciation of investments and currency |
| (17,335) |
|
| (7,562,808) |
|
|
|
|
| (7,580,143) | ||
Undistributed net investment income |
|
| (152,584) |
|
| (15,461) |
|
| (113,000) | (A) |
| (281,045) | |
|
|
| $ | 66,335,526 |
| $ | 300,229,627 |
| $ | (113,000) | (A) | $ | 366,452,153 |
|
|
|
|
|
|
|
| ||||
|
|
|
|
|
|
|
| ||||
Net Assets applicable to |
|
|
|
|
|
|
| PRO-FORMA | |||
| John Hancock Funds |
|
| John Hancock Funds |
|
|
| John Hancock Funds | |||
|
|
|
|
|
|
|
|
|
| ||
Class A Shares | $ | 25,048,935 |
| $ | - |
| $ | 164,206,928 | (A)(B) | $ | 189,255,863 |
Original Shares | $ | - |
| $ | 164,249,598 |
| $ | (164,249,598) | (A) | $ | - |
Class B Shares | $ | 30,046,914 |
| $ | - |
| $ | (51,184) | (A)(B) | $ | 29,995,730 |
Class C Shares | $ | 11,239,677 |
| $ | - |
| $ | (19,146) | (A)(B) | $ | 11,220,531 |
Class I Shares | $ | - |
| $ | - |
| $ | 135,980,029 | (A)(B) | $ | 135,980,029 |
Institutional Shares | $ | - |
| $ | 135,980,029 |
| $ | (135,980,029) | (A) | $ | - |
|
|
|
|
|
|
|
|
|
| ||
Shares applicable to |
|
|
|
|
|
|
|
|
| ||
Class A Shares |
| 4,047,688 |
|
| - |
|
| 5,002,591 | (A) |
| 9,050,279 |
Original Shares |
| - |
|
| 7,856,513 |
|
| (7,856,513) | (A) |
| - |
Class B Shares |
| 5,115,721 |
|
| - |
|
| (3,686,202) | (A) |
| 1,429,519 |
Class C Shares |
| 1,913,667 |
|
| - |
|
| (1,378,925) | (A) |
| 534,742 |
Class I Shares |
| - |
|
| - |
|
| 6,480,458 | (A) |
| 6,480,458 |
Institutional Shares |
| - |
|
| 6,480,458 |
|
| (6,480,458) | (A) |
| - |
|
|
|
|
|
|
|
|
|
| ||
|
|
|
|
|
|
|
|
|
| ||
Net Asset Value |
|
|
|
|
|
|
|
|
| ||
Class A Shares | $ | 6.19 |
| $ | - |
|
|
|
| $ | 20.91 |
Original Shares | $ | - |
| $ | 20.91 |
|
|
|
| $ | - |
Class B Shares | $ | 5.87 |
| $ | - |
|
|
|
| $ | 20.98 |
Class C Shares | $ | 5.87 |
| $ | - |
|
|
|
| $ | 20.98 |
Class I Shares | $ | - |
| $ | - |
|
|
|
| $ | 20.98 |
Institutional Shares | $ | - |
| $ | 20.98 |
|
|
|
| $ | - |
See Notes to Pro-Forma Statements
John Hancock Funds
Growth Trends Fund
Pro-forma Statement of Operations
For the period year ended 3/31/2008
(Unaudited)
The following unaudited pro forma combined Statement of Operations has been derived from the Trial Balances and supporting schedules of John Hancock Funds Growth Trends Fund and John Hancock Funds Rainier Growth Fund (formely known as the Rainier Large Cap Growth Equity Fund) as of March 31, 2008, and such information has been adjusted to give effect to the Reorganization as if the Reorganization had occurred on March 31, 2007.
The pro forma combined Statement of Operations is presented for informational purposes only and does not purport to be indicative of the financial conditions that actually would have resulted if the Reorganization had occurred on March 31, 2007.
The pro forma Combined Statement of Operations should be read in conjunction with the funds' financial statements and related notes thereto which are included in the Proxy Statement and Prospectus.
|
|
|
|
|
|
|
|
|
|
|
| ||||
|
| John Hancock Funds |
|
| John Hancock Funds |
|
| PRO-FORMA |
|
|
|
|
| ADJUSTED | |
Investment Income: |
|
|
|
|
|
|
|
|
|
|
|
| |||
|
|
|
|
|
|
|
|
|
|
|
|
| |||
Dividends | $ | 943,496 |
| $ | 934,821 |
| $ | 1,878,317 |
| $ |
| - |
| $ | 1,878,317 |
Interest |
| 148,875 |
|
| 358,643 |
|
| 507,518 |
|
|
| - |
|
| 507,518 |
Securities lending |
| 43,692 |
|
| - |
|
| 43,692 |
|
|
| - |
|
| 43,692 |
|
| 1,136,063 |
|
| 1,293,464 |
|
| 2,429,527 |
|
|
| - |
| $ | 2,429,527 |
|
|
|
|
|
|
|
|
|
|
|
|
| |||
Expenses: |
|
|
|
|
|
|
|
|
|
|
|
| |||
Investment management fees |
| 647,201 |
|
| 1,059,037 |
|
| 1,706,238 |
|
|
| - |
|
| 1,706,238 |
Class A & Original shares distribution and service |
| 96,192 |
|
| 207,539 |
|
| 303,731 |
|
| (16,000) | (C) |
| 287,731 | |
Class B distribution and service |
| 395,500 |
|
| - |
|
| 395,500 |
|
|
| - |
|
| 395,500 |
Class C distribution and service |
| 146,800 |
|
| - |
|
| 146,800 |
|
|
| - |
|
| 146,800 |
Transfer Agent fees for Class A & Original shares |
| 201,012 |
|
| 8,231 |
|
| 209,243 |
|
| (95,000) | (D) |
| 114,243 | |
Transfer Agent fees for Class B |
| 247,951 |
|
| - |
|
| 247,951 |
|
| (170,000) | (D) |
| 77,951 | |
Transfer Agent fees for Class C |
| 92,031 |
|
| - |
|
| 92,031 |
|
| (63,000) | (D) |
| 29,031 | |
Transfer Agent fees for Class I |
|
|
|
|
|
|
|
|
|
| 30,000 | (D) |
| 30,000 | |
Fund Administration fees |
| 11,763 |
|
| 47,406 |
|
| 59,169 |
|
| (37,500) | (E) |
| 21,669 | |
Audit and legal fees |
| 20,813 |
|
| 9,670 |
|
| 30,483 |
|
| 4,517 | (F) |
| 35,000 | |
Printing and postage fees |
| 44,733 |
|
| 8,269 |
|
| 53,002 |
|
| 1,500 | (F) |
| 54,502 | |
Custodian fees |
| 44,086 |
|
| - |
|
| 44,086 |
|
| 11,500 | (F) |
| 55,586 | |
Miscellaneous |
| 46,546 |
|
| 13,679 |
|
| 60,225 |
|
| (13,679) | (F) |
| 46,546 | |
Trustees' fees |
| 3,755 |
|
| 6,408 |
|
| 10,163 |
|
|
| - |
|
| 10,163 |
Registration and filing fees |
| 32,527 |
|
| 38,381 |
|
| 70,908 |
|
| (26,200) | (F) |
| 44,708 | |
Total Expenses |
| 2,030,910 |
|
| 1,398,620 |
|
| 3,429,530 |
|
| (373,862) |
|
| 3,055,668 | |
Less Expense Reductions & Expenses Recouped |
| (325,260) |
|
| 140,114 |
|
| (185,146) |
|
| 185,146 |
|
|
| |
Net Expenses |
| 1,705,650 |
|
| 1,538,734 |
|
| 3,244,384 |
|
| (188,716) |
|
| 3,055,668 | |
Net Investment Income(Loss) |
| (569,587) |
|
| (245,270) |
|
| (814,857) |
|
| 188,716 |
|
| (626,141) | |
|
|
|
|
|
|
|
|
|
|
|
|
| |||
REALIZED AND UNREALIZED GAIN (LOSS) |
|
|
|
|
|
|
|
|
|
|
|
| |||
Net realized gain (loss) on: |
|
|
|
|
|
|
|
|
|
|
| - | |||
Investments |
| 10,394,519 |
|
| (10,598,963) |
|
| (204,444) |
|
|
| - |
|
| (204,444) |
Foreign currency, forward contracts and foreign currency related transactions |
| (5,285) |
|
| - |
|
| (5,285) |
|
|
| - |
|
| (5,285) |
|
|
|
|
|
|
|
|
|
|
|
|
| |||
|
|
|
|
|
|
|
|
|
|
|
| - | |||
Change in net unrealized appreciation (depreciation) of: |
|
|
|
|
|
|
|
|
|
|
| - | |||
Investments, Foreign currency, forward contracts and foreign currency related transactions |
| (18,718,945) |
|
| (9,639,351) |
|
| (28,358,296) |
|
|
| - |
|
| (28,358,296) |
Net realized and unrealized gain / loss |
| (8,329,711) |
|
| (20,238,314) |
|
| (28,568,025) |
|
|
| - |
|
| (28,568,025) |
Increase (Decrease) in net assets resulting from operations | $ | (8,899,298) |
| $ | (20,483,584) |
| $ | (29,382,882) |
|
| 188,716 |
| $ | (29,194,166) | |
See Notes to Pro-Forma Statements
John Hancock Funds Growth Trends Fund
John Hancock Funds Rainier Growth Fund
NOTES TO THE MARCH 31, 2008 PRO FORMA FINANCIAL STATEMENTS (UNAUDITED)
BASIS OF COMBINATION. The accompanying Pro Forma Combined Schedule of Portfolio Investments and Statements of Assets and Liabilities as of March 31, 2008 and the unaudited Pro Forma Combined Statements of Operations for the year ended March 31, 2008, are intended to present the financial condition and related results of operations of John Hancock Rainier Growth Fund as if the reorganization with the John Hancock Funds Growth Trends Fund had been consummated at March 31, 2007. (Note: The Rainier Large Cap Growth Equity Fund was adopted as the John Hancock Rainier Growth Fund on April 25, 2008). Under generally accepted accounting principles in the United States of America ("GAAP"), John Hancock Rainier Growth Fund will be the surviving entity for accounting purposes.
These statements have been derived from the books and records of each Portfolio utilized in calculating daily net asset value at March 31, 2008. The Pro Forma financial statements have been adjusted to reflect the anticipated fee arrangements for the surviving entity and do not reflect the expenses of each of these Portfolios in carrying out their obligations under the Agreement and Plan of Reorganization. If approved by shareholders, the reorganization is expected to occur as of the close of regularly scheduled trading on the New York Stock Exchange on October 3, 2008.
The Pro Forma Combining Schedule of Portfolio Investments, Statements of Assets and Liabilities and Statements of Operations should be read in conjunction with the historical financial statements of John Hancock Funds Growth Trends Fund and the Rainier Large Cap Growth Equity Fund, incorporated by reference in the Statement of Additional Information.
The pro forma adjustments to the pro forma financial statement are comprised of:
(A) Adjustment to reflect one time proxy, accounting, legal and other costs of the reorganization as approved by Board of Trustees and to be borne by the Acquired Fund.
(B) Adjustment to reflect the transfer of assets of the Acquired Fund to the Acquiring Fund, and the issuance of shares by the Acquiring Fund equal to the value of the Acquired Fund upon reorganization.
(C) Adjustment to reflect the change in Distribution and Services fees upon reorganization.
(D) Adjustment to reflect the change in Transfer Agent fees upon reorganization.
(E) Adjustment to reflect the change in Fund Administration fees upon reorganization.
(F) Adjustment to reflect the change in expense upon reorganization primarily due to the expense structure of John Hancock Funds and economies of scale. Adjustments are based upon estimates.
1. SIGNIFICANT ACCOUNTING POLICIES
Both the Acquiring Fund and the Acquired Fund have substantially the same accounting policies, which are detailed in the annual shareholder reports referenced below.
2. FEDERAL INCOME TAXES. The Funds’ policy is to qualify as a regulated investment company under Subchapter M of the Internal Revenue Code, as amended, and to distribute substantially all of its taxable income to its shareholders. Accordingly, no federal income tax provision is required.
The unaudited pro forma financial statements should be read in conjunction with the separate financial statements as follows which are incorporated into by reference in the Statement of Additional Information to this proxy statement and prospectus:
Securities held by the Acquired Fund may have to be sold in connection with the merger for the purpose of complying with the investment policies or limitations of the Acquiring Fund.
The merger is expected to be tax free for federal income tax purposes. This means that no gain or loss will be recognized by the Acquired Fund or their shareholders as a result of the merger. The aggregate tax basis of the Acquiring Fund shares received by the shareholders of the Acquired Fund will be the same as the aggregate tax basis the shareholders of the Acquired Fund held in their shares of the Acquired Fund immediately before the merger. At October 31, 2007, the Acquired Fund had a capital loss carry forward of approximately $181 million. At March 31, 2008, the Acquiring Fund had a capital loss carry forward of approximately $1.5 million.
John Hancock Funds Growth Trends Fund Annual Report dated October 31, 2007
Rainier Large Cap Growth Equity Fund Annual Report dated March 31, 2008
Rainier Large Cap Growth Equity Fund Annual Report dated March 31, 2008
John Hancock Funds
Core Equity Fund, Growth Trends Fund, Technology Fund, Rainier Growth Fund
Pro-forma Statement of Assets and Liabilities
03/31/2008 (Unaudited)
The following unaudited pro forma combined Statement of Assets, Liabilities and Capital has been derived from the Statement of Assets , Liabilities and Capital of John Hancock Funds Core Equity Fund, John Hancock Funds Growth Trends Fund,
John Hancock Funds Technology Fund, and John Hancock Funds Rainier Growth Fund (formely known as the Rainier Large Cap Growth Equity Fund). Such information has been adjusted to give effect to the Reorganization as if the Reorganization had occurred on March 31, 2007. The pro forma combined Statement of Assets, Liabilities and Capital is presented for informational purposes only and does not purport to be indicative of the financial conditions that actually would have resulted if the Reorganization had occurred on March 31, 2007. The pro forma Combined Statement of Assets, Liabilities and Capital should be read in conjunction with the funds' financial statements and related notes thereto which are included in the Proxy Statement and Prospectus.
|
|
|
|
|
|
|
|
|
|
|
|
|
|
|
|
|
|
| ||
|
|
| John Hancock Funds |
|
| John Hancock Funds |
| John Hancock Funds |
|
| John Hancock Funds |
|
| ADJUSTMENTS |
|
| PRO-FORMA | |||
Assets: |
|
|
|
|
|
|
|
|
|
|
|
|
|
| ||||||
Investments at value |
| $ | 222,127,939 | $ | 58,390,624 | $ | 139,127,310 | $ | 294,779,851 |
| - |
| $ | 714,425,724 | ||||||
(cost - $211,129,122; $66,078,945; $146,075,871; $314,590,824) |
|
|
|
|
|
|
|
|
|
|
|
|
| |||||||
|
|
|
|
|
|
|
|
|
|
|
|
|
|
| ||||||
Short term Investments |
|
| 613,000 |
| 7,670,000 |
| 879,000 |
| 12,248,165 |
| - |
|
| 21,410,165 | ||||||
Cash |
|
| 45 |
| 2,028 |
| 688 |
| - |
| - |
|
| 2,761 | ||||||
Receivable for investments sold |
| - |
| 2,004,470 |
| 1,764,819 |
| 2,256,699 |
| - |
|
| 6,025,988 | |||||||
Receivable for shares sold |
| 1,418 |
| 370 |
| 150 |
| 1,200,712 |
| - |
|
| 1,202,650 | |||||||
Dividends and interest receivable |
| 556,350 |
| 32,168 |
| 24,612 |
| 151,024 |
| - |
|
| 764,154 | |||||||
Prepaid Expenses |
|
| 29,774 |
| 94,526 |
| 73,053 |
| 26,490 |
| - |
|
| 223,843 | ||||||
Other assets |
|
| - |
| 254,326 |
| - |
| - |
| - |
|
| 254,326 | ||||||
| Total Assets |
| 223,328,526 |
| 68,448,512 |
| 141,869,632 |
| 310,662,941 |
|
|
|
| 744,309,611 | ||||||
Liabilities: |
|
|
|
|
|
|
|
|
|
|
|
|
|
| ||||||
Payable for investments purchased |
| - |
| 1,438,010 |
| - |
| 9,669,796 |
| - |
|
| 11,107,806 | |||||||
Payable for capital shares repurchased |
| 125,677 |
| 86,815 |
| 81,650 |
| 494,874 |
| - |
|
| 789,016 | |||||||
Payable to affiliates |
|
|
|
|
|
|
|
|
|
|
|
|
|
| ||||||
Management Fees |
|
| 138,475 |
| 249,591 |
| 95,721 |
| 193,089 |
| - |
|
| 676,876 | ||||||
Fund Administration Fees |
| 452 |
| - |
| - |
| - |
| - |
|
| 452 | |||||||
Distribution Fees |
|
| 88,569 |
| 40,418 |
| 55,241 |
| 33,873 |
| - |
|
| 218,101 | ||||||
Transfer Agent Fees |
|
| 371,341 |
| 252,119 |
| 218,611 |
| - |
| - |
|
| 842,071 | ||||||
Trustees Fees |
|
| 83 |
| - |
| - |
| 15,461 |
| - |
|
| 15,544 | ||||||
Other payables and accrued expenses |
| 113,929 |
| 46,033 |
| - |
| 26,221 | $ | 643,000 | (A) |
| 829,183 | |||||||
| Total Liabilities |
| 838,526 |
| 2,112,986 |
| 451,223 |
| 10,433,314 |
| 643,000 | (A) |
| 14,479,049 | ||||||
Net Assets |
| $ | 222,490,000 | $ | 66,335,526 | $ | 141,418,409 | $ | 300,229,627 | $ | (643,000) | (A) | $ | 729,830,562 | ||||||
|
|
|
|
|
|
|
|
|
|
|
|
|
|
| ||||||
Net Assets: |
|
|
|
|
|
|
|
|
|
|
|
|
|
| ||||||
Common shares capital paid-in |
| 231,193,832 |
| 246,963,100 |
| 1,344,906,147 |
| 319,690,274 |
|
|
|
| 2,142,753,353 | |||||||
Accumulated net realized gain(loss) on investments |
| (20,156,597) |
| (180,457,655) |
| (1,196,384,590) |
| (11,882,378) |
|
|
|
| (1,408,881,220) | |||||||
Net unrealized appreciation of investments |
| 11,611,817 |
| (17,335) |
| (6,069,561) |
| (7,562,808) |
|
|
|
| (2,037,887) | |||||||
Undistributed net investment income(loss) |
| (159,052) |
| (152,584) |
| (1,033,587) |
| (15,461) |
| (643,000) | (A) |
| (2,003,684) | |||||||
|
| $ | 222,490,000 | $ | 66,335,526 | $ | 141,418,409 | $ | 300,229,627 | $ | (643,000) | (A) | $ | 729,830,562 | ||||||
|
|
|
|
|
|
|
|
|
|
|
|
|
|
|
|
|
| |
|
| John Hancock Funds |
|
| John Hancock Funds |
|
| John Hancock Funds |
|
| John Hancock Funds |
|
| ADJUSTMENTS |
|
|
| PRO-FORMA |
|
|
|
|
|
|
|
|
|
|
|
|
|
| |||||
|
|
|
|
|
|
|
|
|
|
|
|
|
| |||||
Net Assets applicable to |
|
|
|
|
|
|
|
|
|
|
|
|
| |||||
Class A Shares | $ | 166,136,552 | $ | 25,048,935 | $ | 107,335,313 | $ | - | $ | 163,807,352 | (A)(B) | $ | 462,328,152 | |||||
Original Shares | $ | - | $ | - | $ | - | $ | 164,249,598 | $ | (164,249,598) | (B) | $ | - | |||||
Class B Shares | $ | 46,766,519 | $ | 30,046,914 | $ | 27,498,281 | $ | - | $ | (157,690) | (A)(B) | $ | 104,154,024 | |||||
Class C Shares | $ | 9,562,899 | $ | 11,239,677 | $ | 6,564,965 | $ | - | $ | (42,996) | (A)(B) | $ | 27,324,545 | |||||
Class I Shares | $ | 24,030 | $ | - | $ | 19,850 | $ | - | $ | 135,979,961 | (A)(B) | $ | 136,023,841 | |||||
Institutional Shares |
|
|
|
|
|
| $ | 135,980,029 | $ | (135,980,029) | (B) | $ | - | |||||
|
|
|
|
|
|
|
|
|
|
|
|
|
| |||||
Shares applicable to |
|
|
|
|
|
|
|
|
|
|
|
|
| |||||
Class A Shares |
| 5,422,894 |
| 4,047,688 |
| 33,664,239 |
| - |
| (21,020,386) | (B) |
| 22,114,436 | |||||
Original Shares |
| - |
| - |
| - |
| 7,856,513 |
| (7,856,513) | (B) |
|
| |||||
Class B Shares |
| 1,651,362 |
| 5,115,721 |
| 9,633,674 |
| - |
| (11,437,044) | (B) |
| 4,963,713 | |||||
Class C Shares |
| 337,677 |
| 1,913,667 |
| 2,299,479 |
| - |
| (3,248,605) | (B) |
| 1,302,217 | |||||
Class I Shares |
| 762 |
| - |
| 5,611 |
| - |
| 6,476,173 | (B) |
| 6,482,546 | |||||
Institutional Shares |
| - |
| - |
| - |
| 6,480,458 |
| (6,480,458) | (B) |
|
| |||||
|
|
|
|
|
|
|
|
|
|
|
|
|
| |||||
|
|
|
|
|
|
|
|
|
|
|
|
|
| |||||
Net Asset Value |
|
|
|
|
|
|
|
|
|
|
|
|
| |||||
Class A Shares | $ | 30.64 | $ | 6.19 | $ | 3.19 | $ | - |
|
|
| $ | 20.91 | |||||
Original Shares | $ | - | $ | - | $ | - | $ | 20.91 |
|
|
| $ | - | |||||
Class B Shares | $ | 28.32 | $ | 5.87 | $ | 2.85 | $ | - |
|
|
| $ | 20.98 | |||||
Class C Shares | $ | 28.32 | $ | 5.87 | $ | 2.85 | $ | - |
|
|
| $ | 20.98 | |||||
Class I Shares | $ | 31.55 | $ | - | $ | 3.54 | $ | - |
|
|
|
| 20.98 | |||||
Institutional Shares | $ | - | $ | - | $ | - | $ | 20.98 |
|
|
| $ | - |
See Notes to Pro-Forma Statements
John Hancock Funds
Core Equity Fund, Growth Trends Fund, Technology Fund, Rainier Growth Fund
Pro-forma Statement of Operations
03/31/2008
(Unaudited)
The following unaudited pro forma combined Statement of Operations has been derived from the Trial Balances and supporting schedules of John Hancock Funds Core Equity Fund, John Hancock Funds Growth Trends Fund, John Hancock Funds Technology Fund, and John Hancock Funds Rainier Growth Fund (formely known as the Rainier Large Cap Growth Equity Fund) as of March 31, 2008, and such information has been adjusted to give effect to the Reorganization as if the Reorganization had occurred on March 31, 2007. The pro forma combined Statement of Operations is presented for informational purposes only and does not purport to be indicative of the financial conditions that actually would have resulted if the Reorganization had occurred on March 31, 2007.
The pro forma Combined Statement of Operations should be read in conjunction with the funds' financial statements and related notes thereto which are included in the Proxy Statement and Prospectus.
|
|
|
|
|
|
|
|
|
|
|
|
|
|
|
|
|
|
|
|
|
|
| |
|
| John Hancock Funds |
| John Hancock Funds |
| John Hancock Funds |
| John Hancock Funds |
| PRO-FORMA |
| ADJUSTMENTS |
|
| ADJUSTED | ||||||||
Investment Income: |
|
|
|
|
|
|
|
|
|
|
|
|
|
|
|
|
| ||||||
|
|
|
|
|
|
|
|
|
|
|
|
|
|
|
|
|
| ||||||
Dividends | $ | 4,434,616 | $ | 943,496 | $ | 893,935 | $ | 934,821 | $ | 7,206,868 | $ |
|
| - |
| $ | 7,206,868 | ||||||
Interest |
| 42,505 |
| 148,875 |
| 176,376 |
| 358,643 |
| 726,399 |
|
|
| - |
|
| 726,399 | ||||||
Securities lending |
| 29,643 |
| 43,692 |
| 186,441 |
|
|
| 259,776 |
|
|
| - |
|
| 259,776 | ||||||
|
| 4,506,764 |
| 1,136,063 |
| 1,256,752 |
| 1,293,464 |
| 8,193,043 |
|
|
|
|
|
| 8,193,043 | ||||||
|
|
|
|
|
|
|
|
|
|
|
|
|
|
|
|
|
| ||||||
Expenses: |
|
|
|
|
|
|
|
|
|
|
|
|
|
|
|
|
| ||||||
Investment management fees |
| 2,074,474 |
| 647,201 |
| 1,424,423 |
| 1,059,037 |
| 5,205,135 |
| (95,000) | (C) |
| 5,110,135 | ||||||||
Class A & Original shares distribution and service |
| 587,150 |
| 96,192 |
| 376,810 |
| 207,539 |
| 1,267,691 |
| (500,000) | (D) |
| 767,691 | ||||||||
Class B distribution and service |
| 689,251 |
| 395,500 |
| 427,757 |
| - |
| 1,512,508 |
|
|
| - |
|
| 1,512,508 | ||||||
Class C distribution and service |
| 119,442 |
| 146,800 |
| 82,145 |
| - |
| 348,387 |
|
|
| - |
|
| 348,387 | ||||||
Class T distribution and service |
| - |
| - |
| - |
| - |
| - |
| 383,525 | (D) |
| 383,525 | ||||||||
Class A & Original Shares Transfer Agent fees |
| 682,846 |
| 201,012 |
| 875,236 |
| 8,231 |
| 1,767,325 |
| (1,450,000) | (E) |
| 317,325 | ||||||||
Class B Transfer Agent fees |
| 241,559 |
| 247,951 |
| 297,760 |
| - |
| 787,270 |
| (490,000) | (E) |
| 297,270 | ||||||||
Class C Transfer Agent fees |
| 41,697 |
| 92,031 |
| 57,166 |
| - |
| 190,894 |
| (122,000) | (E) |
| 68,894 | ||||||||
Class I Transfer Agent fees |
| 7 |
| - |
| 7 |
| - |
| 14 |
| 27,500 | (E) |
| 27,514 | ||||||||
Class T Transfer Agent fees |
|
|
|
|
|
|
|
|
| - |
| 899,082 | (E) |
| 899,082 | ||||||||
Fund Administration fees |
| 34,492 |
| 11,763 |
| 24,461 |
| 47,406 |
| 118,122 |
| (51,000) | (F) |
| 67,122 | ||||||||
Audit and legal fees |
| 23,958 |
| 20,813 |
| 42,133 |
| 9,670 |
| 96,574 |
| (46,500) | (G) |
| 50,074 | ||||||||
Printing and postage fees |
| 82,807 |
| 44,733 |
| 79,095 |
| 8,269 |
| 214,904 |
| 30,000 | (G) |
| 244,904 | ||||||||
Custodian fees |
| 53,935 |
| 44,086 |
| 28,488 |
| - |
| 126,509 |
| 30,000 | (G) |
| 156,509 | ||||||||
Interest on Overdrafts |
| - |
| - |
| 61,856 |
| - |
| 61,856 |
| (61,856) | (G) |
| - | ||||||||
Miscellaneous |
| 23,134 |
| 46,546 |
| 11,424 |
| 13,679 |
| 94,783 |
| (49,679) | (G) |
| 45,104 | ||||||||
Trustees' fees |
| 16,638 |
| 3,755 |
| 5,582 |
| 6,408 |
| 32,383 |
|
|
| - |
|
| 32,383 | ||||||
Registration and filing fees |
| 78,090 |
| 32,527 |
| 35,929 |
| 38,381 |
| 184,927 |
| (80,000) | (G) |
| 104,927 | ||||||||
Total Expenses |
| 4,749,481 |
| 2,030,910 |
| 3,830,272 |
| 1,398,620 |
| 12,009,283 |
| (1,575,928) |
|
| 10,433,355 | ||||||||
Less Expense Reductions |
| (151,454) |
|
| (325,260) |
|
|
| 140,114 |
| (336,600) |
| 336,600 |
|
|
| |||||||
Net Expenses |
| 4,598,027 |
| 1,705,650 |
| 3,830,272 |
| 1,538,734 |
| 11,672,683 |
| (1,239,328) |
|
| 10,433,355 | ||||||||
Net Investment Income(Loss) |
| (91,263) |
| (569,587) |
| (2,573,520) |
| (245,270) |
| (3,479,640) |
| 1,239,328 |
|
| (2,240,312) | ||||||||
REALIZED AND UNREALIZED GAIN (LOSS) |
|
|
|
|
|
|
|
|
|
|
|
|
|
|
|
|
| ||||||
Net realized gain (loss) on: |
|
|
|
|
|
|
|
|
|
|
|
|
|
|
|
| - | ||||||
Investments |
| 16,296,073 |
| 10,394,519 |
| 14,007,954 |
| (10,598,963) |
| 30,099,583 |
|
|
| - |
|
| 30,099,583 | ||||||
Foreign currency, forward contracts and foreign currency related transactions |
|
|
| (5,285) |
|
|
|
|
| (5,285) |
|
|
| - |
|
| (5,285) | ||||||
|
|
|
|
|
|
|
|
|
|
|
|
|
|
|
|
|
| ||||||
|
|
|
|
|
|
|
|
|
|
|
|
|
|
|
|
| - | ||||||
Change in net unrealized appreciation (depreciation) of: |
|
|
|
|
|
|
|
|
|
|
|
|
|
|
|
| - | ||||||
Investments |
| (43,538,518) |
| (18,718,945) |
| (20,553,477) |
| (9,639,351) |
| (92,450,291) |
|
| - |
|
| (92,450,291) | |||||||
Foreign currency, forward contracts and foreign currency related transactions |
| - |
| - |
| - |
| - |
| - |
|
|
| - |
|
| - | ||||||
Net realized and unrealized gain / loss |
| (27,242,445) |
| (8,329,711) |
| (6,545,523) |
| (20,238,314) |
| (62,355,993) |
|
|
| -; |
|
| (62,355,993) | ||||||
Increase (Decrease) in net assets resulting from operations | $ | (27,333,708) | $ | (8,899,298) | $ | (9,119,043) | $ | (20,483,584) | $ | (65,835,633) | $ | 1,239,328 |
| $ | (64,596,305) | ||||||||
Note: Upon the Reoganization, John Hancock Funds Technology Fund Class A shares will convert to John Hancock Funds Rainier Growth Fund Class T shares.
See Notes to Pro-Forma Statements
John Hancock Funds Core Equity Fund
John Hancock Funds Growth Trends Fund
John Hancock Funds Technology Fund
John Hancock Funds Rainier Growth Fund
NOTES TO THE MARCH 31, 2008 PRO FORMA FINANCIAL STATEMENTS (UNAUDITED)
BASIS OF COMBINATION. The accompanying Pro Forma Combined Schedule of Portfolio Investments and Statements of Assets and Liabilities as of March 31, 2008 and the unaudited Pro Forma Combined Statements of Operations for the year ended March 31, 2008, are intended to present the financial condition and related results of operations of John Hancock Rainier Growth Fund as if the reorganization with John Hancock Funds Core Equity Fund, John Hancock Funds Growth Trends Fund, and John Hancock Funds Technology Fund had been consummated at March 31, 2007. (Note: The Rainier Large Cap Growth Equity Fund was adopted as the John Hancock Rainier Growth Fund on April 25, 2008). Under generally accepted accounting principles in the United States of America ("GAAP"), John Hancock Rainier Growth Fund will be the surviving entity for accounting purposes.
These statements have been derived from the books and records of each Portfolio utilized in calculating daily net asset value at March 31, 2008. The Pro Forma financial statements have been adjusted to reflect the anticipated fee arrangements for the surviving entity and do not reflect the expenses of each of these Portfolios in carrying out their obligations under the Agreement and Plan of Reorganization. If approved by shareholders, the reorganization is expected to occur as of the close of regularly scheduled trading on the New York Stock Exchange on October 3, 2008.
The Pro Forma Combining Schedule of Portfolio Investments, Statements of Assets and Liabilities and Statements of Operations should be read in conjunction with the historical financial statements of John Hancock Funds Core Equity Fund, John Hancock Funds Growth Trends Fund, John Hancock Funds Technology Fund, and the Rainier Large Cap Growth Equity Fund, incorporated by reference in the Statement of Additional Information.
The pro forma adjustments to the pro forma financial statement are comprised of:
(A) Adjustment to reflect one time proxy, accounting, legal and other costs of the reorganization as approved by Board of Trustees and to be borne by the Acquired Funds.
(B) Adjustment to reflect the transfer of assets of each acquired fund to the acquiring fund, and the issuance of shares by the acquiring fund equal to the value of each of the acquired funds upon reorganization.
(C) Adjustment to reflect the change in Management fees upon reorganization.
(D) Adjustment to reflect the change in Distribution and Services fees upon reorganization.
(E) Adjustment to reflect the change in Transfer Agent fees upon reorganization.
(F) Adjustment to reflect the change in Fund Administration fees upon reorganization.
(G) Adjustment to reflect the change in expense upon reorganization primarily due to the expense structure of John Hancock Funds and economies of scale. Adjustments are based upon estimates.
1. SIGNIFICANT ACCOUNTING POLICIES
The Acquiring Fund and the Acquired Funds have substantially the same accounting policies, which are detailed in the annual shareholder reports referenced below.
2. FEDERAL INCOME TAXES. The Funds’ policy is to qualify as a regulated investment company under Subchapter M of the Internal Revenue Code, as amended, and to distribute substantially all of its taxable income to its shareholders. Accordingly, no federal income tax provision is required.
Securities held by the Acquired Funds may have to be sold in connection with the merger for the purpose of complying with the investment policies or limitations of the Acquiring Fund.
The mergers are expected to be tax free for federal income tax purposes. This means that no gain or loss will be recognized by the Acquired Funds or their shareholders as a result of the merger. The aggregate tax basis of the Acquiring Fund shares received by the shareholders of the Acquired Funds will be the same as the aggregate tax basis the shareholders of the Acquired Funds held in their shares of the Acquired Funds immediately before the merger. At December 31, 2007, the Core Equity Fund had a capital loss carry forward of approximately $23 million. At October 31, 2007, the Growth Trends Fund and the Technology Fund had a capital loss carry forward of approximately $181 million and $1.2 billion, respectively. At March 31, 2008, the Acquiring Fund had a capital loss carry forward of approximately $1.5 million.
The unaudited pro forma financial statements should be read in conjunction with the separate financial statements as follows which are incorporated into by reference in the Statement of Additional Information to this proxy statement and prospectus:
John Hancock Funds Core Equity Fund Annual Report dated December 31, 2007
John Hancock Funds Growth Trends Fund Annual Report dated October 31, 2007
John Hancock Funds Technology Fund Annual Report dated October 31, 2007
JOHN HANCOCK FUNDS RAINIER GROWTH FUND |
|
|
| |||
JOHN HANCOCK FUNDS CORE EQUITY FUND |
|
|
| |||
PRO FORMA COMBINING SCHEDULE OF INVESTMENTS - MARCH 31, 2008 (Unaudited) |
|
|
| |||
(showing percentage of combined pro forma total net assets) |
|
|
| |||
|
|
|
|
|
|
|
John Hancock | John Hancock | Proforma | Security Name Line 1 | John Hancock | John Hancock | Proforma |
|
|
|
|
|
|
|
Shares or Principal Amount | Security Description | Value | ||||
|
|
|
|
|
|
|
|
|
| COMMON STOCKS - 98.89% |
|
|
|
|
|
| Advertising - 1.23% |
|
|
|
65,725 | - | 65,725 | Focus Media Holding Ltd., ADR* | 2,310,234 | - | 2,310,234 |
93,575 | - | 93,575 | Omnicom Group Inc. | 4,134,144 | - | 4,134,144 |
|
|
|
| 6,444,378 | - | 6,444,378 |
|
|
|
|
|
|
|
|
|
| Aerospace & Defense - 1.87% |
|
|
|
52,350 | 37,400 | 89,750 | Boeing Co. (The) | 3,893,269 | 2,781,438 | 6,674,707 |
44,925 | - | 44,925 | United Technologies Corp. | 3,091,739 | - | 3,091,739 |
|
|
|
| 6,985,008 | 2,781,438 | 9,766,446 |
|
|
|
|
|
|
|
|
|
| Air Freight & Logistics - 0.86% |
|
|
|
81,550 | - | 81,550 | Expeditors International of Washington, Inc. | 3,684,429 | - | 3,684,429 |
- | 11,000 | 11,000 | United Parcel Service, Inc. (Class B) | - | 803,220 | 803,220 |
|
|
|
| 3,684,429 | 803,220 | 4,487,649 |
|
|
|
|
|
|
|
|
|
| Airlines - 0.14% |
|
|
|
- | 59,000 | 59,000 | Southwest Airlines Co. | - | 731,600 | 731,600 |
|
|
|
|
|
|
|
|
|
| Apparel Retail - 0.34% |
|
|
|
- | 78,000 | 78,000 | Macys, Inc.. | - | 1,798,680 | 1,798,680 |
|
|
|
|
|
|
|
|
|
| Apparel, Accessories And Luxury Goods - 0.39% |
|
|
|
- | 21,000 | 21,000 | Coach, Inc. | - | 633,150 | 633,150 |
- | 24,500 | 24,500 | Polo Ralph Lauren Corp. | - | 1,428,105 | 1,428,105 |
|
|
|
| - | 2,061,255 | 2,061,255 |
|
|
|
|
|
|
|
|
|
| Application Software - 0.71% |
|
|
|
60,175 | 57,000 | 117,175 | Autodesk, Inc.* | 1,894,309 | 1,794,360 | 3,688,669 |
|
|
|
|
|
|
|
|
|
|
|
|
|
|
|
|
| Asset Management & Custody Banks - 1.91% |
|
|
|
26,800 | - | 26,800 | BlackRock, Inc. | 5,472,024 | - | 5,472,024 |
- | 13,200 | 13,200 | Northern Trust Corp. | - | 877,404 | 877,404 |
72,350 | - | 72,350 | T. Rowe Price Group Inc. | 3,617,500 | - | 3,617,500 |
|
|
|
| 9,089,524 | 877,404 | 9,966,928 |
|
|
|
|
|
|
|
|
|
| Biotechnology - 3.91% |
|
|
|
- | 20,000 | 20,000 | Amgen, Inc. | - | 835,600 | 835,600 |
64,575 | - | 64,575 | Celgene Corp.* | 3,957,802 | - | 3,957,802 |
77,600 | - | 77,600 | Genentech, Inc.* | 6,299,568 | - | 6,299,568 |
28,850 | - | 28,850 | Genzyme Corp.* | 2,150,479 | - | 2,150,479 |
139,375 | - | 139,375 | Gilead Sciences, Inc.* | 7,181,994 | - | 7,181,994 |
|
|
|
| 19,589,843 | 835,600 | 20,425,443 |
|
|
|
|
|
|
|
|
|
| Broadcasting & Cable TV - 0.55% |
|
|
|
- | 65,900 | 65,900 | DIRECTV Group, Inc. (The) | - | 1,633,661 | 1,633,661 |
- | 23,400 | 23,400 | Discovery Holding Co. | - | 496,548 | 496,548 |
- | 21,800 | 21,800 | Liberty Global, Inc. (Class A) | - | 742,944 | 742,944 |
|
|
|
| - | 2,873,153 | 2,873,153 |
|
|
|
|
|
|
|
|
|
| Casinos & Gaming - 0.81% |
|
|
|
- | 8,500 | 8,500 | Las Vegas Sands Corp. | - | 625,940 | 625,940 |
61,122 | - | 61,122 | MGM Mirage* | 3,592,140 | - | 3,592,140 |
|
|
|
| 3,592,140 | 625,940 | 4,218,080 |
|
|
|
|
|
|
|
|
|
| Communications Equipment - 5.13% |
|
|
|
305,525 | 76,000 | 381,525 | Cisco Systems, Inc.* | 7,360,097 | 1,830,840 | 9,190,937 |
The accompanying notes are an integral part of the pro forma financial statements.
JOHN HANCOCK FUNDS RAINIER GROWTH FUND |
|
|
| |||
JOHN HANCOCK FUNDS CORE EQUITY FUND |
|
|
| |||
PRO FORMA COMBINING SCHEDULE OF INVESTMENTS - MARCH 31, 2008 (Unaudited) |
|
|
| |||
(showing percentage of combined pro forma total net assets) |
|
|
| |||
|
|
|
|
|
|
|
John Hancock | John Hancock | Proforma | Security Name Line 1 | John Hancock | John Hancock | Proforma |
|
|
|
|
|
|
|
Shares or Principal Amount | Security Description | Value | ||||
154,050 |
| 154,050 | Corning Inc. | 3,703,362 | - | 3,703,362 |
126,100 | 90,000 | 216,100 | Nokia Corp., SADR | 4,013,763 | 2,864,700 | 6,878,463 |
108,375 | - | 108,375 | QUALCOMM Inc. | 4,443,375 | - | 4,443,375 |
23,000 | - | 23,000 | Research In Motion, Ltd.* | 2,581,290 | - | 2,581,290 |
|
|
|
| 22,101,887 | 4,695,540 | 26,797,427 |
|
|
|
|
|
|
|
|
|
| Computer & Electronics Retail - 0.58% |
|
|
|
- | 45,800 | 45,800 | Best Buy Co., Inc. | - | 1,898,868 | 1,898,868 |
- | 22,000 | 22,000 | GameStop Corp. (Class A) | - | 1,137,620 | 1,137,620 |
|
|
|
| - | 3,036,488 | 3,036,488 |
|
|
|
|
|
|
|
|
|
| Computer Hardware - 3.19% |
|
|
|
47,675 | 7,500 | 55,175 | Apple, Inc.* | 6,841,362 | 1,076,250 | 7,917,612 |
- | 68,500 | 68,500 | Dell, Inc. | - | 1,364,520 | 1,364,520 |
139,225 | 22,900 | 162,125 | Hewlett-Packard Co. | 6,357,013 | 1,045,614 | 7,402,627 |
|
|
|
| 13,198,375 | 3,486,384 | 16,684,759 |
|
|
|
|
|
|
|
|
|
| Computer Storage & Peripherals - 0.91% |
|
|
|
- | 35,500 | 35,500 | NetApp, Inc. | - | 711,775 | 711,775 |
- | 81,000 | 81,000 | SanDisk Corp. | - | 1,828,170 | 1,828,170 |
- | 105,500 | 105,500 | Seagate Technology | - | 2,209,170 | 2,209,170 |
|
|
|
| - | 4,749,115 | 4,749,115 |
|
|
|
|
|
|
|
|
|
| Construction & Farm Machinery - 1.17% |
|
|
|
42,175 | - | 42,175 | Deere & Co. | 3,392,557 | - | 3,392,557 |
67,125 | - | 67,125 | Manitowoc Co., Inc. | 2,738,700 | - | 2,738,700 |
|
|
|
| 6,131,257 | - | 6,131,257 |
|
|
|
|
|
|
|
|
|
| Construction & Engineering - 0.20% |
|
|
|
- | 38,000 | 38,000 | KBR, Inc. | - | 1,053,740 | 1,053,740 |
- |
|
|
|
|
|
|
- |
|
| Data Processing & Outsourced Services - 1.59% |
|
|
|
- | 33,100 | 33,100 | Broadridge Financial Solutions, Inc. | - | 582,560 | 582,560 |
- | 23,300 | 23,300 | Fiserv, Inc. | - | 1,120,497 | 1,120,497 |
- | 16,300 | 16,300 | Global Payments, Inc. | - | 674,168 | 674,168 |
- | 17,500 | 17,500 | Hewitt Associates, Inc. | - | 695,975 | 695,975 |
- | 9,800 | 9,800 | MasterCard, Inc. | - | 2,185,302 | 2,185,302 |
48,975 | - | 48,975 | Visa, Inc. (Class A)* | 3,054,081 | - | 3,054,081 |
|
|
|
| 3,054,081 | 5,258,502 | 8,312,583 |
|
|
|
|
|
|
|
|
|
| Diversified Commercial & Professional Services - 0.13% |
|
|
|
- | 10,300 | 10,300 | Brink's Co. (The) | - | 691,954 | 691,954 |
- |
|
|
|
|
|
|
- |
|
| Diversified Banks - 1.15% |
|
|
|
- | 43,100 | 43,100 | Bank of America Corp. | - | 1,633,921 | 1,633,921 |
- | 39,300 | 39,300 | Wachovia Corp. | - | 1,061,100 | 1,061,100 |
- | 114,000 | 114,000 | Wells Fargo & Co. | - | 3,317,400 | 3,317,400 |
|
|
|
| - | 6,012,421 | 6,012,421 |
- |
|
|
|
|
|
|
- |
|
| Diversified Chemicals - 0.95% |
|
|
|
- | 71,100 | 71,100 | Dow Chemical Co. (The) | - | 2,620,035 | 2,620,035 |
- | 38,400 | 38,400 | PPG Industries, Inc. | - | 2,323,584 | 2,323,584 |
|
|
|
| - | 4,943,619 | 4,943,619 |
|
|
|
|
|
|
|
|
|
| Diversified Metals & Mining - 2.91% |
|
|
|
46,475 | 33,300 | 79,775 | Freeport-McMoRan Copper & Gold | 4,471,824 | 3,204,126 | 7,675,950 |
63,000 | 7,100 | 70,100 | Precision Castparts Corp. | 6,431,040 | 724,768 | 7,155,808 |
- | 3,800 | 3,800 | Southern Copper Corp. | - | 394,554 | 394,554 |
The accompanying notes are an integral part of the pro forma financial statements.
JOHN HANCOCK FUNDS RAINIER GROWTH FUND |
|
|
| |||
JOHN HANCOCK FUNDS CORE EQUITY FUND |
|
|
| |||
PRO FORMA COMBINING SCHEDULE OF INVESTMENTS - MARCH 31, 2008 (Unaudited) |
|
|
| |||
(showing percentage of combined pro forma total net assets) |
|
|
| |||
|
|
|
|
|
|
|
John Hancock | John Hancock | Proforma | Security Name Line 1 | John Hancock | John Hancock | Proforma |
|
|
|
|
|
|
|
Shares or Principal Amount | Security Description | Value | ||||
|
|
|
| 10,902,864 | 4,323,448 | 15,226,312 |
|
|
|
|
|
|
|
|
|
| Drug Retail - 0.28% |
|
|
|
35,800 | - | 35,800 | CVS Corp. | 1,450,258 | - | 1,450,258 |
|
|
|
|
|
|
|
|
|
| Education Services - 0.05% |
|
|
|
- | 5,800 | 5,800 | ITT Educational Services, Inc. | - | 266,394 | 266,394 |
|
|
|
|
|
|
|
|
|
| Electric Utilities - 1.64% |
|
|
|
- | 131,600 | 131,600 | Duke Energy Corp. | - | 2,349,060 | 2,349,060 |
36,975 | - | 36,975 | Entergy Corp. | 4,033,233 | - | 4,033,233 |
- | 21,700 | 21,700 | FirstEnergy Corp. | - | 1,489,054 | 1,489,054 |
- | 11,000 | 11,000 | FPL Group, Inc. | - | 690,140 | 690,140 |
|
|
|
| 4,033,233 | 4,528,254 | 8,561,487 |
|
|
|
|
|
|
|
|
|
| Electrical Components & Equipment - 0.87% |
|
|
|
- | 15,000 | 15,000 | General Cable Corp. | - | 886,050 | 886,050 |
- | 38,400 | 38,400 | Rockwell Automation, Inc. | - | 2,204,928 | 2,204,928 |
- | 33,300 | 33,300 | Tyco International, Ltd. | - | 1,466,865 | 1,466,865 |
|
|
|
| - | 4,557,843 | 4,557,843 |
|
|
|
|
|
|
|
|
|
| Fertilizers & Agricultural Chemicals - 2.41% |
|
|
|
65,550 | 15,000 | 80,550 | Monsanto Co. | 7,308,825 | 1,672,500 | 8,981,325 |
35,325 | - | 35,325 | Mosaic Co. | 3,624,345 | - | 3,624,345 |
|
|
|
| 10,933,170 | 1,672,500 | 12,605,670 |
|
|
|
|
|
|
|
|
|
| Food Distributors - 0.34% |
|
|
|
- | 61,000 | 61,000 | SYSCO, Corp. | - | 1,770,220 | 1,770,220 |
|
|
|
|
|
|
|
|
|
| Food Retail - 0.55% |
|
|
|
- | 33,500 | 33,500 | Safeway, Inc. | - | 983,225 | 983,225 |
- | 62,800 | 62,800 | SUPERVALU, Inc. | - | 1,882,744 | 1,882,744 |
|
|
|
| - | 2,865,969 | 2,865,969 |
|
|
|
|
|
|
|
|
|
| Footwear - 1.78% |
|
|
|
124,600 | 12,200 | 136,800 | NIKE, Inc. (Class B) | 8,472,800 | 829,600 | 9,302,400 |
|
|
|
|
|
|
|
|
|
| Health Care Distributors - 0.45% |
|
|
|
- | 22,400 | 22,400 | AmerisourceBergen Corp. | - | 917,952 | 917,952 |
- | 27,500 | 27,500 | McKesson Corp. | - | 1,440,175 | 1,440,175 |
|
|
|
| - | 2,358,127 | 2,358,127 |
|
|
|
|
|
|
|
|
|
| Health Care Equipment - 1.60% |
|
|
|
- | 39,800 | 39,800 | Baxter International, Inc. | - | 2,301,236 | 2,301,236 |
79,215 | - | 79,215 | Hologic, Inc.* | 4,404,354 | - | 4,404,354 |
33,900 | - | 33,900 | Medtronic Inc. | 1,639,743 | - | 1,639,743 |
|
|
|
| 6,044,097 | 2,301,236 | 8,345,333 |
|
|
|
|
|
|
|
|
|
| Health Care Services - 0.63% |
|
|
|
51,125 | - | 51,125 | Express Scripts, Inc.* | 3,288,360 | - | 3,288,360 |
|
|
|
|
|
|
|
|
|
| Health Care Supplies - 0.95% |
|
|
|
34,775 | - | 34,775 | Alcon, Inc. | 4,946,744 | - | 4,946,744 |
|
|
|
|
|
|
|
|
|
| Heavy Electrical Equipment - 0.49% |
|
|
|
95,700 | - | 95,700 | ABB Ltd., SADR | 2,576,244 | - | 2,576,244 |
|
|
|
|
|
|
|
|
|
| Hotels, Resorts & Cruise Lines - 0.38% |
|
|
|
The accompanying notes are an integral part of the pro forma financial statements.
JOHN HANCOCK FUNDS RAINIER GROWTH FUND |
|
|
| |||
JOHN HANCOCK FUNDS CORE EQUITY FUND |
|
|
| |||
PRO FORMA COMBINING SCHEDULE OF INVESTMENTS - MARCH 31, 2008 (Unaudited) |
|
|
| |||
(showing percentage of combined pro forma total net assets) |
|
|
| |||
|
|
|
|
|
|
|
John Hancock | John Hancock | Proforma | Security Name Line 1 | John Hancock | John Hancock | Proforma |
|
|
|
|
|
|
|
Shares or Principal Amount | Security Description | Value | ||||
- | 59,800 | 59,800 | Royal Caribbean Cruises, Ltd. | - | 1,967,420 | 1,967,420 |
|
|
|
|
|
|
|
|
|
| Household Products - 2.60% |
|
|
|
- | 10,500 | 10,500 | Colgate-Palmolive Co. | - | 818,055 | 818,055 |
141,850 | 40,100 | 181,950 | Procter & Gamble Co. (The) | 9,939,430 | 2,809,807 | 12,749,237 |
|
|
|
| 9,939,430 | 3,627,862 | 13,567,292 |
|
|
|
|
|
|
|
|
|
| Housewares & Specialties - 0.42% |
|
|
|
- | 96,800 | 96,800 | Newell Rubbermaid, Inc. | - | 2,213,816 | 2,213,816 |
|
|
|
|
|
|
|
|
|
| Human Resource & Employment Services - 0.12% |
|
|
|
- | 24,900 | 24,900 | Robert Half International, Inc. | - | 640,926 | 640,926 |
|
|
|
|
|
|
|
|
|
| Hypermarkets & Super Centers - 0.54% |
|
|
|
- | 53,200 | 53,200 | Wal-Mart Stores, Inc. | - | 2,802,576 | 2,802,576 |
|
|
|
|
|
|
|
|
|
| Industrial Power Producers & Energy Traders - 0.20% |
|
|
|
- | 29,200 | 29,200 | Mirant Corp. | - | 1,062,588 | 1,062,588 |
|
|
|
|
|
|
|
|
|
| Industrial Conglomerates - 4.94% |
|
|
|
- | 15,400 | 15,400 | 3M Co. | - | 1,218,910 | 1,218,910 |
99,450 | 217,000 | 316,450 | General Electric Co. | 3,680,644 | 8,031,170 | 11,711,814 |
125,275 | - | 125,275 | McDermott International, Inc.* | 6,867,576 | - | 6,867,576 |
52,525 | 56,300 | 108,825 | Textron, Inc. | 2,910,936 | 3,120,146 | 6,031,082 |
|
|
|
| 13,459,156 | 12,370,226 | 25,829,382 |
|
|
|
|
|
|
|
|
|
| Industrial Machinery - 0.25% |
|
|
|
- | 29,500 | 29,500 | Ingersoll-Rand Co., Ltd. | - | 1,315,110 | 1,315,110 |
|
|
|
|
|
|
|
|
|
| Integrated Oil And Gas - 3.63% |
|
|
|
- | 139,700 | 139,700 | Exxon Mobil Corp. | - | 11,815,826 | 11,815,826 |
- | 16,800 | 16,800 | Marathon Oil Corp. | - | 766,080 | 766,080 |
- | 63,600 | 63,600 | Occidental Petroleum Corp. | - | 4,653,612 | 4,653,612 |
- | 25,300 | 25,300 | Royal Dutch Shell Plc, ADR | - | 1,745,194 | 1,745,194 |
|
|
|
| - | 18,980,712 | 18,980,712 |
|
|
|
|
|
|
|
|
|
| Integrated Telecommunication Services - 1.42% |
|
|
|
- | 107,300 | 107,300 | AT&T, Inc. | - | 4,109,590 | 4,109,590 |
- | 90,900 | 90,900 | Verizon Communications, Inc. | - | 3,313,305 | 3,313,305 |
|
|
|
| - | 7,422,895 | 7,422,895 |
|
|
|
|
|
|
|
|
|
| Internet Retail - 0.69% |
|
|
|
33,825 | - | 33,825 | Amazon.com, Inc.* | 2,411,722 | - | 2,411,722 |
- | 53,700 | 53,700 | Expedia, Inc. | - | 1,175,493 | 1,175,493 |
|
|
|
| 2,411,722 | 1,175,493 | 3,587,215 |
|
|
|
|
|
|
|
|
|
| Internet Software & Services - 1.55% |
|
|
|
17,325 | 1,100 | 18,425 | Google, Inc. (Class A)* | 7,631,143 | 484,517 | 8,115,660 |
|
|
|
|
|
|
|
|
|
| Investment Banking & Brokerage - 1.91% |
|
|
|
353,100 | 96,500 | 449,600 | Charles Schwab Corp. (The) | 6,648,873 | 1,817,095 | 8,465,968 |
- | 9,300 | 9,300 | Goldman Sachs Group, Inc. | - | 1,538,127 | 1,538,127 |
|
|
|
| 6,648,873 | 3,355,222 | 10,004,095 |
|
|
|
|
|
|
|
|
|
| IT Consulting & Other Services - 0.50% |
|
|
|
- | 39,200 | 39,200 | Accenture, Ltd. (Class A) | - | 1,378,664 | 1,378,664 |
42,250 | - | 42,250 | Cognizant Technology Solutions Corp.* | 1,218,067 | - | 1,218,067 |
|
|
|
| 1,218,067 | 1,378,664 | 2,596,731 |
|
|
|
|
|
|
|
The accompanying notes are an integral part of the pro forma financial statements.
JOHN HANCOCK FUNDS RAINIER GROWTH FUND |
|
|
| |||
JOHN HANCOCK FUNDS CORE EQUITY FUND |
|
|
| |||
PRO FORMA COMBINING SCHEDULE OF INVESTMENTS - MARCH 31, 2008 (Unaudited) |
|
|
| |||
(showing percentage of combined pro forma total net assets) |
|
|
| |||
|
|
|
|
|
|
|
John Hancock | John Hancock | Proforma | Security Name Line 1 | John Hancock | John Hancock | Proforma |
|
|
|
|
|
|
|
Shares or Principal Amount | Security Description | Value | ||||
|
|
| Life & Health Insurance - 0.13% |
|
|
|
- | 11,700 | 11,700 | MetLife, Inc. | - | 705,042 | 705,042 |
|
|
|
|
|
|
|
|
|
| Managed Health Care - 1.89% |
|
|
|
51,825 | 44,500 | 96,325 | Aetna, Inc. | 2,181,314 | 1,873,005 | 4,054,319 |
- | 54,600 | 54,600 | CIGNA Corp. | - | 2,215,122 | 2,215,122 |
- | 49,800 | 49,800 | Humana, Inc. | - | 2,234,028 | 2,234,028 |
- | 19,500 | 19,500 | Wellcare Health Plans, Inc. | - | 759,525 | 759,525 |
- | 14,200 | 14,200 | WellPoint, Inc. | - | 626,646 | 626,646 |
|
|
|
| 2,181,314 | 7,708,326 | 9,889,640 |
|
|
|
|
|
|
|
|
|
| Marine - 0.13% |
|
|
|
- | 9,500 | 9,500 | Overseas Shipholding Group, Inc. | - | 665,380 | 665,380 |
|
|
|
|
|
|
|
|
|
| Metal & Glass Containers - 0.52% |
|
|
|
48,300 | - | 48,300 | Owens Illinois, Inc.* | 2,725,569 | - | 2,725,569 |
|
|
|
|
|
|
|
|
|
| Mortgage Reits - 0.07% |
|
|
|
- | 23,500 | 23,500 | Annaly Capital Management, Inc. | - | 360,020 | 360,020 |
|
|
|
|
|
|
|
|
|
| Movies & Entertainment - 1.83% |
|
|
|
357,175 | 154,500 | 511,675 | News Corp. (Class A) | 6,697,031 | 2,896,875 | 9,593,906 |
|
|
|
|
|
|
|
|
|
| Multi-Line Insurance - 0.41% |
|
|
|
- | 28,100 | 28,100 | Hartford Financial Services Group, Inc. (The) | - | 2,129,137 | 2,129,137 |
|
|
|
|
|
|
|
|
|
| Multi-Utilities - 0.42% |
|
|
|
- | 54,800 | 54,800 | Public Service Enterprise Group, Inc. | - | 2,202,412 | 2,202,412 |
|
|
|
|
|
|
|
|
|
| Oil & Gas Drilling - 1.90% |
|
|
|
78,225 | 25,200 | 103,425 | Noble Corp. | 3,885,436 | 1,251,684 | 5,137,120 |
35,458 | - | 35,458 | Transocean, Inc.* | 4,793,922 | - | 4,793,922 |
|
|
|
| 8,679,358 | 1,251,684 | 9,931,042 |
|
|
|
|
|
|
|
|
|
| Oil & Gas Equipment & Services - 4.17% |
|
|
|
34,475 | - | 34,475 | Compagnie Generale de Geophysique-Veritas, SADR | 1,706,857 |
| 1,706,857 |
82,550 | 56,100 | 138,650 | Halliburton Co. | 3,246,691 | 2,206,413 | 5,453,104 |
77,575 | 33,900 | 111,475 | National-Oilwell Varco, Inc.* | 4,528,828 | 1,979,082 | 6,507,910 |
44,600 | - | 44,600 | Schlumberger, Ltd. | 3,880,200 | - | 3,880,200 |
59,025 | - | 59,025 | Weatherford International, Ltd.* | 4,277,542 | - | 4,277,542 |
|
|
|
| 17,640,118 | 4,185,495 | 21,825,613 |
|
|
|
|
|
|
|
|
|
| Oil & Gas Exploration & Production - 1.94% |
|
|
|
- | 31,600 | 31,600 | Devon Energy Corp. | - | 3,296,828 | 3,296,828 |
- | 20,800 | 20,800 | Noble Energy, Inc. | - | 1,514,240 | 1,514,240 |
95,375 | - | 95,375 | Pioneer Natural Resources Co. | 4,684,820 | - | 4,684,820 |
- | 19,000 | 19,000 | W & T Offshore, Inc. | - | 648,090 | 648,090 |
|
|
|
| 4,684,820 | 5,459,158 | 10,143,978 |
|
|
|
|
|
|
|
|
|
| Oil & Gas Refining & Marketing - 0.30% |
|
|
|
- | 41,500 | 41,500 | Tesoro Corp. | - | 1,245,000 | 1,245,000 |
- | 6,500 | 6,500 | Valero Energy Corp. | - | 319,215 | 319,215 |
|
|
|
| - | 1,564,215 | 1,564,215 |
|
|
|
|
|
|
|
|
|
| Other Diversified Financial Services - 1.32% |
|
|
|
- | 160,500 | 160,500 | JPMorgan Chase & Co. | - | 6,893,475 | 6,893,475 |
|
|
|
|
|
|
|
The accompanying notes are an integral part of the pro forma financial statements.
JOHN HANCOCK FUNDS RAINIER GROWTH FUND |
|
|
| |||
JOHN HANCOCK FUNDS CORE EQUITY FUND |
|
|
| |||
PRO FORMA COMBINING SCHEDULE OF INVESTMENTS - MARCH 31, 2008 (Unaudited) |
|
|
| |||
(showing percentage of combined pro forma total net assets) |
|
|
| |||
|
|
|
|
|
|
|
John Hancock | John Hancock | Proforma | Security Name Line 1 | John Hancock | John Hancock | Proforma |
|
|
|
|
|
|
|
Shares or Principal Amount | Security Description | Value | ||||
|
|
| Personal Products - 0.15% |
|
|
|
- | 25,900 | 25,900 | NBTY, Inc. | - | 775,705 | 775,705 |
|
|
|
|
|
|
|
|
|
| Pharmaceuticals - 5.43% |
|
|
|
94,000 | - | 94,000 | Abbott Laboratories | 5,184,100 | - | 5,184,100 |
90,925 | - | 90,925 | Allergan, Inc. | 5,127,260 | - | 5,127,260 |
- | 75,200 | 75,200 | Bristol-Myers Squibb Co. | - | 1,601,760 | 1,601,760 |
- | 40,700 | 40,700 | Endo Pharmaceuticals Holdings, Inc. | - | 974,358 | 974,358 |
94,700 | 96,800 | 191,500 | Merck & Co., Inc. | 3,593,865 | 3,673,560 | 7,267,425 |
- | 46,000 | 46,000 | Novartis AG | - | 2,356,580 | 2,356,580 |
- | 29,100 | 29,100 | Pfizer, Inc. | - | 609,063 | 609,063 |
- | 212,100 | 212,100 | Schering-Plough Corp. | - | 3,056,361 | 3,056,361 |
47,825 | - | 47,825 | Teva Pharmaceutical Ind's Ltd., SADR* | 2,209,037 | - | 2,209,037 |
|
|
|
| 16,114,262 | 12,271,682 | 28,385,944 |
|
|
|
|
|
|
|
|
|
| Property & Casualty Insurance - 0.58% |
|
|
|
- | 30,900 | 30,900 | ACE Ltd. | - | 1,701,354 | 1,701,354 |
- | 39,500 | 39,500 | Axis Capital Holdings, Ltd. | - | 1,342,210 | 1,342,210 |
|
|
|
| - | 3,043,564 | 3,043,564 |
- |
|
|
|
|
|
|
|
|
| Railroads - 1.23% |
|
|
|
- | 20,400 | 20,400 | Burlington Northern Santa Fe Corp. | - | 1,881,288 | 1,881,288 |
68,075 | 15,400 | 83,475 | Norfolk Southern Corp. | 3,697,834 | 836,528 | 4,534,362 |
|
|
|
| 3,697,834 | 2,717,816 | 6,415,650 |
|
|
|
|
|
|
|
|
|
| Reinsurance - 0.23% |
|
|
|
- | 13,300 | 13,300 | Everest Re Group, Ltd. | - | 1,190,749 | 1,190,749 |
|
|
|
|
|
|
|
|
|
| Semiconductor Equipment - 0.08% |
|
|
|
- | 21,400 | 21,400 | Applied Materials, Inc. | - | 417,514 | 417,514 |
|
|
|
|
|
|
|
|
|
| Semiconductors - 2.14% |
|
|
|
- | 26,400 | 26,400 | Cypress Semiconductor Corp. | - | 623,304 | 623,304 |
183,175 | 153,700 | 336,875 | Intel Corp. | 3,879,646 | 3,255,366 | 7,135,012 |
62,050 | - | 62,050 | Intersil Corp. | 1,592,824 | - | 1,592,824 |
94,050 | - | 94,050 | NVIDIA Corp.* | 1,861,250 | - | 1,861,250 |
|
|
|
| 7,333,720 | 3,878,670 | 11,212,390 |
|
|
|
|
|
|
|
|
|
| Soft Drinks - 2.00% |
|
|
|
100,400 | 44,100 | 144,500 | PepsiCo, Inc. | 7,248,880 | 3,184,020 | 10,432,900 |
|
|
|
|
|
|
|
|
|
| Specialized Finance - 1.85% |
|
|
|
47,325 | - | 47,325 | IntercontinentalExchange, Inc.* | 6,175,913 | - | 6,175,913 |
- | 52,300 | 52,300 | Nasdaq Stock Market, Inc. | - | 2,021,918 | 2,021,918 |
- | 16,000 | 16,000 | Nymex Holdings, Inc. | - | 1,450,080 | 1,450,080 |
|
|
|
| 6,175,913 | 3,471,998 | 9,647,911 |
|
|
|
|
|
|
|
|
|
| Specialized Reits - 0.17% |
|
| - |
- | 5,100 | 5,100 | Public Storage, Inc. | - | 451,962 | 451,962 |
- | 10,100 | 10,100 | Ventas, Inc. | - | 453,591 | 453,591 |
|
|
|
| - | 905,553 | 905,553 |
|
|
|
|
|
|
|
|
|
| Systems Software - 5.34% |
|
|
|
85,625 |
| 85,625 | Adobe Systems, Inc.* | 3,047,394 | - | 3,047,394 |
- | 63,700 | 63,700 | Check Point Software Technologies Ltd. | - | 1,426,880 | 1,426,880 |
231,475 | 239,000 | 470,475 | Microsoft Corp. | 6,569,261 | 6,782,820 | 13,352,081 |
321,675 | 144,700 | 466,375 | Oracle Corp. | 6,291,963 | 2,830,332 | 9,122,295 |
22,350 | - | 22,350 | VMware, Inc. (Class. A)* | 957,027 | - | 957,027 |
The accompanying notes are an integral part of the pro forma financial statements.
JOHN HANCOCK FUNDS RAINIER GROWTH FUND |
|
|
| |||
JOHN HANCOCK FUNDS CORE EQUITY FUND |
|
|
| |||
PRO FORMA COMBINING SCHEDULE OF INVESTMENTS - MARCH 31, 2008 (Unaudited) |
|
|
| |||
(showing percentage of combined pro forma total net assets) |
|
|
| |||
|
|
|
|
|
|
|
John Hancock | John Hancock | Proforma | Security Name Line 1 | John Hancock | John Hancock | Proforma |
|
|
|
|
|
|
|
Shares or Principal Amount | Security Description | Value | ||||
|
|
|
| 16,865,645 | 11,040,032 | 27,905,677 |
|
|
|
|
|
|
|
|
|
| Technology Distributors - 0.35% |
|
|
|
- | 26,700 | 26,700 | Arrow Electronics, Inc. | - | 898,455 | 898,455 |
- | 29,100 | 29,100 | Avnet, Inc. | - | 952,443 | 952,443 |
|
|
|
| - | 1,850,898 | 1,850,898 |
|
|
|
|
|
|
|
|
|
| Tobacco - 1.31% |
|
|
|
- | 79,100 | 79,100 | Altria Group, Inc. | - | 1,756,020 | 1,756,020 |
- | 14,800 | 14,800 | Loews Corp. - Carolina Group | - | 1,073,740 | 1,073,740 |
- | 79,100 | 79,100 | Philip Morris International | - | 4,000,878 | 4,000,878 |
|
|
|
| - | 6,830,638 | 6,830,638 |
|
|
|
|
|
|
|
|
|
| Trading Companies & Distributors - 0.22% |
|
|
|
- | 15,000 | 15,000 | W. W. Grainger, Inc. | - | 1,145,850 | 1,145,850 |
|
|
|
|
|
|
|
|
|
| Wireless Telecommunication Ser - 0.96% |
|
|
|
78,725 | - | 78,725 | America Movil S.A.B. de C.V., ADR | 5,013,995 | - | 5,013,995 |
|
|
|
|
|
|
|
|
|
| TOTAL COMMON STOCKS |
|
|
|
|
|
| (cost $512,858,781) | 294,779,851 | 222,127,939 | 516,907,790 |
|
|
|
|
|
|
|
|
|
| SHORT TERM INVESTMENTS - 2.34% |
|
|
|
|
|
| Commercial Paper - 2.31% |
|
|
|
12,085,000 | - | 12,085,000 | Starbucks Co., 3.30%, 04/01/2008 | 12,085,000 | - | 12,085,000 |
|
|
|
|
|
|
|
|
|
| Variable Rate Demand Notes - 0.03%** |
|
|
|
163,165 | - | 163,165 | Wiscoonsin Corp. Central Union, 4.869% | 163,165 | - | 163,165 |
|
|
|
|
|
|
|
|
|
| TOTAL SHORT-TERM INVESTMENTS |
|
|
|
|
|
| (cost $12,248,165) | 12,248,165 | - | 12,248,165 |
|
|
|
|
|
|
|
|
|
| JOINT REPURCHASE AGREEMENT - 0.12% |
|
| - |
- | 613,000 | 613,000 | Joint Repurchase Agreement with Barclays Plc dated 03/31/2008 at 1.450% to be repurchased at $613,025 on 04/01/2008, collateralized by $514,806 U.S. Treasury Inflation Indexed Bond, 2.375%, due 01/15/2025 (valued at $625,260, including interest) | - | 613,000 | 613,000 |
|
|
| TOTAL REPURCHASE AGREEMENTS |
|
|
|
|
|
| (cost $613,000) | - | 613,000 | 613,000 |
|
|
|
|
|
|
|
|
|
|
|
|
|
|
|
|
|
|
|
|
|
|
|
|
|
|
|
|
- |
|
|
|
|
|
|
|
|
| Total Investments (Cost $525,719,946) - 101.35% | 307,028,016 | 222,740,939 | 529,768,955 |
|
|
| Other Assets and Liabilities, Net - (1.35)% | (6,798,389) | (250,939) | (7,049,328) |
|
|
| TOTAL NET ASSETS - 100.00% | 300,229,627 | 222,490,000 | 522,719,627 |
|
|
|
|
|
|
|
|
|
| ADR - American Depositary Receipt |
|
|
|
|
|
| SADR - Sponsored American Depositary Receipt |
|
|
|
|
|
| * Non-Income Producing |
|
|
|
|
|
|
|
|
|
|
The accompanying notes are an integral part of the pro forma financial statements.
JOHN HANCOCK FUNDS RAINIER GROWTH FUND |
|
|
| |||
JOHN HANCOCK FUNDS GROWTH TRENDS FUND |
|
|
| |||
PRO FORMA COMBINING SCHEDULE OF INVESTMENTS - MARCH 31, 2008 (Unaudited) |
|
|
| |||
(showing percentage of combined pro forma total net assets) |
|
|
| |||
|
|
|
|
|
|
|
John Hancock Funds Rainier Growth Fund | John Hancock Funds Growth Trends Fund | Proforma Combined | Security Name Line 1 | John Hancock Funds Rainier Growth Fund | John Hancock Funds Growth Trends Fund | Proforma Combined |
|
|
|
|
|
|
|
Shares or Principal Amount | Security Description | Value | ||||
|
|
|
|
|
|
|
|
|
| COMMON STOCKS - 96.35% |
|
|
|
|
|
| Advertising - 1.76% |
|
|
|
65,725 | - | 65,725 | Focus Media Holding Ltd., ADR* | 2,310,234 | - | 2,310,234 |
93,575 | - | 93,575 | Omnicom Group Inc. | 4,134,144 | - | 4,134,144 |
|
|
|
| 6,444,378 | - | 6,444,378 |
|
|
|
|
|
|
|
|
|
| Aerospace & Defense - 3.66% |
|
|
|
52,350 | - | 52,350 | Boeing Co. | 3,893,269 | - | 3,893,269 |
63,000 | - | 63,000 | Precision Castparts Corp. | 6,431,040 | - | 6,431,040 |
44,925 | - | 44,925 | United Technologies Corp. | 3,091,739 | - | 3,091,739 |
|
|
|
| 13,416,048 | - | 13,416,048 |
|
|
|
|
|
|
|
|
|
| Air Freight & Logistics - 1.01% |
|
|
|
81,550 | - | 81,550 | Expeditors International of Washington, Inc. | 3,684,429 | - | 3,684,429 |
|
|
|
|
|
|
|
|
|
| Application Software - 1.02% |
|
|
|
- | 13,300 | 13,300 | Amdocs, Ltd. | - | 377,188 | 377,188 |
60,175 | - | 60,175 | Autodesk, Inc.* | 1,894,309 | - | 1,894,309 |
- | 10,000 | 10,000 | Intuit, Inc. | - | 270,100 | 270,100 |
- | 51,000 | 51,000 | NetScout Systems, Inc. | - | 474,300 | 474,300 |
- | 4,500 | 4,500 | Salesforce.com, Inc. | - | 260,415 | 260,415 |
- | 20,500 | 20,500 | Synopsys, Inc. | - | 465,555 | 465,555 |
|
|
|
| 1,894,309 | 1,847,558 | 3,741,867 |
|
|
|
|
|
|
|
|
|
| Asset Management & Custody Banks - 3.57% |
|
|
|
- | 3,366 | 3,366 | Affiliated Managers Group, Inc. | - | 305,431 | 305,431 |
- | 23,840 | 23,840 | Bank of New York Mellon Corp. | - | 994,843 | 994,843 |
26,800 | 1,742 | 28,542 | BlackRock, Inc. (Class A) | 5,472,024 | 355,682 | 5,827,706 |
- | 24,550 | 24,550 | State Street Corp. | - | 1,939,450 | 1,939,450 |
72,350 | 8,079 | 80,429 | T. Row Price Group, Inc. | 3,617,500 | 403,950 | 4,021,450 |
|
|
|
| 9,089,524 | 3,999,356 | 13,088,880 |
|
|
|
|
|
|
|
|
|
| Biotechnology - 6.12% |
|
|
|
- | 10,789 | 10,789 | Amgen, Inc. | - | 450,764 | 450,764 |
64,575 | - | 64,575 | Celgene Corp.* | 3,957,802 | - | 3,957,802 |
77,600 | 12,417 | 90,017 | Genentech, Inc.* | 6,299,568 | 1,008,012 | 7,307,580 |
28,850 | - | 28,850 | Genzyme Corp.* | 2,150,479 | - | 2,150,479 |
139,375 | 17,785 | 157,160 | Gilead Sciences, Inc.* | 7,181,994 | 916,461 | 8,098,455 |
| 21,650 | 21,650 | Qiagen NV | - | 450,320 | 450,320 |
|
|
|
| 19,589,843 | 2,825,558 | 22,415,401 |
|
|
|
|
|
|
|
|
|
| Casinos & Gaming - 0.98% |
|
|
|
61,122 | - | 61,122 | MGM Mirage* | 3,592,140 | - | 3,592,140 |
|
|
|
|
|
|
|
|
|
| Communications Equipment - 6.77% |
|
|
|
305,525 | 74,102 | 379,627 | Cisco Systems, Inc.* | 7,360,097 | 1,785,117 | 9,145,214 |
154,050 | - | 154,050 | Corning Inc. | 3,703,362 | - | 3,703,362 |
- | 7,200 | 7,200 | Harris Corp. | - | 349,416 | 349,416 |
126,100 | - | 126,100 | Nokia Corp., SADR | 4,013,763 | - | 4,013,763 |
108,375 | 14,400 | 122,775 | QUALCOMM, Inc. | 4,443,375 | 590,400 | 5,033,775 |
23,000 | - | 23,000 | Research In Motion, Ltd.* | 2,581,290 | - | 2,581,290 |
|
|
|
| 22,101,887 | 2,724,933 | 24,826,820 |
|
|
|
|
|
|
|
|
|
| Computer & Electronics Retail - 0.07% |
|
|
|
- | 4,948 | 4,948 | GameStop Corp. (Class A) | - | 255,861 | 255,861 |
|
|
|
|
|
|
|
|
|
| Computer Hardware - 4.91% |
|
|
|
47,675 | 10,100 | 57,775 | Apple, Inc.* | 6,841,362 | 1,449,350 | 8,290,712 |
- | 23,400 | 23,400 | Dell, Inc. | - | 466,128 | 466,128 |
139,225 | 23,365 | 139,225 | Hewlett-Packard Co. | 6,357,013 | 1,066,846 | 7,423,859 |
- | 15,900 | 15,900 | International Business Machines Corp. | - | 1,830,726 | 1,830,726 |
|
|
|
| 13,198,375 | 4,813,050 | 18,011,425 |
The accompanying notes are an integral part of the pro forma financial statements.
JOHN HANCOCK FUNDS RAINIER GROWTH FUND |
|
|
| |||
JOHN HANCOCK FUNDS GROWTH TRENDS FUND |
|
|
| |||
PRO FORMA COMBINING SCHEDULE OF INVESTMENTS - MARCH 31, 2008 (Unaudited) |
|
|
| |||
(showing percentage of combined pro forma total net assets) |
|
|
| |||
|
|
|
|
|
|
|
John Hancock Funds Rainier Growth Fund | John Hancock Funds Growth Trends Fund | Proforma Combined | Security Name Line 1 | John Hancock Funds Rainier Growth Fund | John Hancock Funds Growth Trends Fund | Proforma Combined |
|
|
|
|
|
|
|
Shares or Principal Amount | Security Description | Value | ||||
|
|
|
|
|
|
|
|
|
|
|
|
|
|
|
|
| Computer Storage & Peripherals - 0.20% |
|
|
|
- | 29,752 | 29,752 | EMC Corp. | - | 426,644 | 426,644 |
- | 15,358 | 15,358 | Seagate Technology | - | 321,597 | 321,597 |
|
|
|
| - | 748,240 | 748,240 |
|
|
|
|
|
|
|
|
|
| Construction & Farm Machinery - 1.67% |
|
|
|
42,175 | - | 42,175 | Deere & Co. | 3,392,557 | - | 3,392,557 |
67,125 | - | 67,125 | Manitowoc Co., Inc. | 2,738,700 | - | 2,738,700 |
|
|
|
| 6,131,257 | - | 6,131,257 |
|
|
|
|
|
|
|
|
|
| Consumer Finance - 0.41% |
|
|
|
- | 19,612 | 19,612 | American Express Co. | - | 857,437 | 857,437 |
- | 40,078 | 40,078 | Discover Financial Services | - | 656,077 | 656,077 |
|
|
|
| - | 1,513,514 | 1,513,514 |
|
|
|
|
|
|
|
|
|
| Data Processing & Outsourced Services - 0.12% |
|
|
|
- | 13,765 | 13,765 | Wright Express Corp. | - | 422,998 | 422,998 |
|
|
|
|
|
|
|
|
|
| Diversified Banks - 0.88% |
|
|
|
- | 45,685 | 45,685 | Bank of America Corp. | - | 1,731,918 | 1,731,918 |
- | 6,587 | 6,587 | Kookmin Bank, ADR | - | 369,201 | 369,201 |
- | 41,611 | 41,611 | Wachovia Corp. | - | 1,123,497 | 1,123,497 |
|
|
|
| - | 3,224,617 | 3,224,617 |
|
|
|
|
|
|
|
|
|
| Diversified Chemicals - 0.35% |
|
|
|
- | 15,795 | 15,795 | Bayer AG | - | 1,266,124 | 1,266,124 |
|
|
|
|
|
|
|
|
|
| Diversified Metals & Mining - 1.22% |
|
|
|
46,475 | - | 46,475 | Freeport-McMoRan Copper & Gold | 4,471,824 | - | 4,471,824 |
|
|
|
|
|
|
|
|
|
| Drug Retail - 0.40% |
|
|
|
35,800 | - | 35,800 | CVS Corp. | 1,450,258 | - | 1,450,258 |
|
|
|
|
|
|
|
|
|
| Electric Utilities - 1.10% |
|
|
|
36,975 | - | 36,975 | Entergy Corp. | 4,033,233 | - | 4,033,233 |
|
|
|
|
|
|
|
|
|
| Fertilizers & Agricultural Chemicals - 2.98% |
|
|
|
65,550 | - | 65,550 | Monsanto Co. | 7,308,825 | - | 7,308,825 |
35,325 | - | 35,325 | Mosaic Co. | 3,624,345 | - | 3,624,345 |
|
|
|
| 10,933,170 | - | 10,933,170 |
|
|
|
|
|
|
|
|
|
| Footwear - 2.31% |
|
|
|
124,600 | - | 124,600 | NIKE, Inc. (Class B) | 8,472,800 | - | 8,472,800 |
|
|
|
|
|
|
|
|
|
| Health Care Distributors - 0.22% |
|
|
|
- | 11,281 | 11,281 | AmerisourceBergen Corp. | - | 462,295 | 462,295 |
- | 6,834 | 6,834 | Cardinal Health, Inc. | - | 358,853 | 358,853 |
|
|
|
| - | 821,149 | 821,149 |
|
|
|
|
|
|
|
|
|
| Health Care Equipment - 1.90% |
|
|
|
79,215 | 8,946 | 88,161 | Hologic, Inc.* | 4,404,354 | 497,398 | 4,901,752 |
33,900 | 8,673 | 42,573 | Medtronic, Inc. | 1,639,743 | 419,513 | 2,059,256 |
|
|
|
| 6,044,097 | 916,911 | 6,961,008 |
|
|
|
|
|
|
|
|
|
| Health Care Services - 1.04% |
|
|
|
- | 97,210 | 97,210 | Aveta, Inc. | - | 534,655 | 534,655 |
51,125 | - | 51,125 | Express Scripts, Inc.* | 3,288,360 | - | 3,288,360 |
|
|
|
| 3,288,360 | 534,655 | 3,823,015 |
|
|
|
|
|
|
|
|
|
| Health Care Supplies - 1.47% |
|
|
|
34,775 | - | 34,775 | Alcon, Inc. | 4,946,744 | - | 4,946,744 |
- | 7,634 | 7,634 | Thermo Fisher Scientific, Inc. | - | 433,917 | 433,917 |
|
|
|
| 4,946,744 | 433,917 | 5,380,661 |
The accompanying notes are an integral part of the pro forma financial statements.
JOHN HANCOCK FUNDS RAINIER GROWTH FUND |
|
|
| |||
JOHN HANCOCK FUNDS GROWTH TRENDS FUND |
|
|
| |||
PRO FORMA COMBINING SCHEDULE OF INVESTMENTS - MARCH 31, 2008 (Unaudited) |
|
|
| |||
(showing percentage of combined pro forma total net assets) |
|
|
| |||
|
|
|
|
|
|
|
John Hancock Funds Rainier Growth Fund | John Hancock Funds Growth Trends Fund | Proforma Combined | Security Name Line 1 | John Hancock Funds Rainier Growth Fund | John Hancock Funds Growth Trends Fund | Proforma Combined |
|
|
|
|
|
|
|
Shares or Principal Amount | Security Description | Value | ||||
|
|
|
|
|
|
|
|
|
|
|
|
|
|
|
|
| Health Care Technology - 0.61% |
|
|
|
- | 277,305 | 277,305 | American Oriental Bioengineering, Inc. | - | 2,246,171 | 2,246,171 |
|
|
|
|
|
|
|
|
|
| Heavy Electrical Equipment - 0.70% |
|
|
|
95,700 | - | 95,700 | ABB Ltd., SADR | 2,576,244 | - | 2,576,244 |
|
|
|
|
|
|
|
|
|
| Household Products - 2.71% |
|
|
|
141,850 | - | 141,850 | Procter & Gamble Co. | 9,939,430 | - | 9,939,430 |
|
|
|
|
|
|
|
|
|
| Industrial Conglomerates - 3.67% |
|
|
|
99,450 | - | 99,450 | General Electric Co. | 3,680,644 | - | 3,680,644 |
125,275 | - | 125,275 | McDermott International, Inc.* | 6,867,576 | - | 6,867,576 |
52,525 | - | 52,525 | Textron Inc. | 2,910,936 | - | 2,910,936 |
|
|
|
| 13,459,156 | - | 13,459,156 |
|
|
|
|
|
|
|
|
|
| Insurance Brokers - 0.15% |
|
|
|
- | 6,250 | 6,250 | Aon Corp. | - | 251,250 | 251,250 |
- | 8,925 | 8,925 | Willis Group Holdings, Ltd. | - | 299,969 | 299,969 |
|
|
|
| - | 551,219 | 551,219 |
|
|
|
|
|
|
|
|
|
| Integrated Oil And Gas - 0.25% |
|
|
|
- | 9,382 | 9,382 | Sasol Ltd., ADR | - | 453,995 | 453,995 |
- | 4,622 | 4,622 | Suncor Energy, Inc. | - | 445,330 | 445,330 |
|
|
|
| - | 899,325 | 899,325 |
|
|
|
|
|
|
|
|
|
| Integrated Telecommunication Services - 0.06% |
|
|
|
- | 6,463 | 6,463 | Verizon Communications, Inc. | - | 235,576 | 235,576 |
|
|
|
|
|
|
|
|
|
| Internet Retail - 0.66% |
|
|
|
33,825 | - | 33,825 | Amazon.com, Inc.* | 2,411,722 | - | 2,411,722 |
|
|
|
|
|
|
|
|
|
| Internet Software & Services - 2.45% |
|
|
|
- | 24,500 | 24,500 | eBay, Inc. | - | 731,080 | 731,080 |
17,325 | 1,400 | 17,325 | Google, Inc. (Class A)* | 7,631,143 | 616,658 | 8,247,801 |
|
|
|
| 7,631,143 | 1,347,738 | 8,978,881 |
|
|
|
|
|
|
|
|
|
| Investment Banking & Brokerage - 2.12% |
|
|
|
353,100 | 21,402 | 353,100 | Charles Schwab Corp. (The) | 6,648,873 | 403,000 | 7,051,873 |
- | 9,600 | 9,600 | Lazard, Ltd. | - | 366,720 | 366,720 |
- | 5,200 | 5,200 | Merrill Lynch & Co., Inc. | - | 211,848 | 211,848 |
- | 15,036 | 15,036 | MF Global, Ltd. | - | 149,007 | 149,007 |
|
|
|
| 6,648,873 | 1,130,574 | 7,779,447 |
|
|
|
|
|
|
|
|
|
| IT Consulting & Other Services - 0.44% |
|
|
|
- | 17,950 | 17,950 | CA, Inc. | - | 403,875 | 403,875 |
42,250 | - | 42,250 | Cognizant Technology Solutions Corp.* | 1,218,067 | - | 1,218,067 |
|
|
|
| 1,218,067 | 403,875 | 1,621,942 |
|
|
|
|
|
|
|
|
|
| Life & Health Insurance - 0.69% |
|
|
|
- | 17,650 | 17,650 | Aflac, Inc. | - | 1,146,368 | 1,146,368 |
- | 6,916 | 6,916 | MetLife, Inc. | - | 416,758 | 416,758 |
- | 7,880 | 7,880 | Principal Financial Group, Inc. | - | 439,074 | 439,074 |
- | 6,750 | 6,750 | Prudential Financial, Inc. | - | 528,188 | 528,188 |
|
|
|
| - | 2,530,387 | 2,530,387 |
|
|
|
|
|
|
|
|
|
| Managed Health Care - 1.10% |
|
|
|
51,825 | 18,769 | 70,594 | Aetna, Inc. | 2,181,314 | 789,987 | 2,971,301 |
- | 14,409 | 14,409 | UnitedHealth Group, Inc. | - | 495,093 | 495,093 |
- | 12,650 | 12,650 | WellPoint, Inc. | - | 558,245 | 558,245 |
|
|
|
| 2,181,314 | 1,843,325 | 4,024,639 |
The accompanying notes are an integral part of the pro forma financial statements.
JOHN HANCOCK FUNDS RAINIER GROWTH FUND |
|
|
| |||
JOHN HANCOCK FUNDS GROWTH TRENDS FUND |
|
|
| |||
PRO FORMA COMBINING SCHEDULE OF INVESTMENTS - MARCH 31, 2008 (Unaudited) |
|
|
| |||
(showing percentage of combined pro forma total net assets) |
|
|
| |||
|
|
|
|
|
|
|
John Hancock | John Hancock | Proforma | Security Name Line 1 | John Hancock | John Hancock | Proforma |
|
|
|
|
|
|
|
Shares or Principal Amount | Security Description | Value | ||||
|
|
|
|
|
|
|
|
|
|
|
|
|
|
|
|
| Metal & Glass Containers - 0.74% |
|
|
|
48,300 | - | 48,300 | Owens Illinois, Inc.* | 2,725,569 | - | 2,725,569 |
|
|
|
|
|
|
|
|
|
| Movies & Entertainment - 1.83% |
|
|
|
357,175 | - | 357,175 | News Corp. (Class A) | 6,697,031 | - | 6,697,031 |
|
|
|
|
|
|
|
|
|
| Multi-Line Insurance - 0.58% |
|
|
|
- | 38,650 | 38,650 | American International Group, Inc. | - | 1,671,613 | 1,671,613 |
- | 5,900 | 5,900 | Hartford Financial Services Group, Inc. (The) | - | 447,043 | 447,043 |
|
|
|
| - | 2,118,656 | 2,118,656 |
|
|
|
|
|
|
|
|
|
| Oil & Gas Drilling - 2.37% |
|
|
|
78,225 | - | 78,225 | Noble Corp. | 3,885,436 | - | 3,885,436 |
35,458 | - | 35,458 | Transocean, Inc.* | 4,793,922 | - | 4,793,922 |
|
|
|
| 8,679,358 | - | 8,679,358 |
|
|
|
|
|
|
|
|
|
| Oil & Gas Equipment & Services - 4.81% |
|
|
|
34,475 | - | 34,475 | Compagnie Generale de Geophysique-Veritas, SADR | 1,706,857 | - | 1,706,857 |
82,550 | - | 82,550 | Halliburton Co. | 3,246,691 | - | 3,246,691 |
77,575 | - | 77,575 | National-Oilwell Varco, Inc.* | 4,528,828 | - | 4,528,828 |
44,600 | - | 44,600 | Schlumberger, Ltd. | 3,880,200 | - | 3,880,200 |
59,025 | - | 59,025 | Weatherford International, Ltd.* | 4,277,542 | - | 4,277,542 |
|
|
|
| 17,640,118 | - | 17,640,118 |
|
|
|
|
|
|
|
|
|
| Oil & Gas Exploration & Production - 1.28% |
|
|
|
95,375 | - | 95,375 | Pioneer Natural Resources Co. | 4,684,820 | - | 4,684,820 |
|
|
|
|
|
|
|
|
|
| Other Diversified Financial Services - 1.10% |
|
|
|
- | 29,614 | 29,614 | Citigroup, Inc. | - | 634,332 | 634,332 |
- | 3,900 | 3,900 | JPMorgan Chase & Co. | - | 167,505 | 167,505 |
48,975 | 2,887 | 51,862 | Visa, Inc. (Class A)* | 3,054,081 | 180,033 | 3,234,114 |
|
|
|
| 3,054,081 | 981,870 | 4,035,951 |
|
|
|
|
|
|
|
|
|
| Pharmaceuticals - 5.71% |
|
|
|
94,000 | 12,906 | 106,906 | Abbott Laboratories | 5,184,100 | 711,766 | 5,895,866 |
90,925 | - | - | Allergan, Inc. | 5,127,260 |
| 5,127,260 |
- | 23,834 | 23,834 | Dr. Reddy's Laboratories Lrd., ADR | - | 345,116 | 345,116 |
- | 19,901 | 19,901 | Johnson & Johnson | - | 1,290,978 | 1,290,978 |
94,700 | 5,362 | 100,062 | Merck & Co., Inc. | 3,593,865 | 203,488 | 3,797,353 |
- | 13,967 | 13,967 | OSI Pharmaceuticals, Inc. | - | 522,226 | 522,226 |
- | 14,129 | 14,129 | Pfizer, Inc. | - | 295,720 | 295,720 |
- | 2,260 | 2,260 | Roche Holding AG | - | 425,942 | 425,942 |
- | 7,166 | 7,166 | Stada Arzneimittel AG | - | 522,303 | 522,303 |
47,825 | - | 47,825 | Teva Pharmaceutical Ind's Ltd., SADR* | 2,209,037 | - | 2,209,037 |
- | 62,185 | 62,185 | Tongjitang Chinese Medicines Co., ADR | - | 511,161 | 511,161 |
|
|
|
| 16,114,262 | 4,828,699 | 20,942,961 |
|
|
|
|
|
|
|
|
|
| Property And Casualty Insurance - 0.21% |
|
|
|
- | 10,882 | 10,882 | ACE Ltd. | - | 599,163 | 599,163 |
- | 9,700 | 9,700 | Progressive Corp. | - | 155,879 | 155,879 |
|
|
|
| - | 755,042 | 755,042 |
|
|
|
|
|
|
|
|
|
| Railroads - 1.01% |
|
|
|
68,075 | - | 68,075 | Norfolk Southern Corp. | 3,697,834 | - | 3,697,834 |
|
|
|
|
|
|
|
|
|
| Reinsurance - 0.49% |
|
|
|
- | 100 | 100 | Berkshire Hathaway, Inc. (Class B) | - | 447,290 | 447,290 |
- | 14,350 | 14,350 | PartnerRe, Ltd. | - | 1,094,905 | 1,094,905 |
- | 7,800 | 7,800 | Platinum Underwriters Holdings, Ltd. | - | 253,188 | 253,188 |
|
|
|
| - | 1,795,383 | 1,795,383 |
|
|
|
|
|
|
|
|
|
| Semiconductor Equipment - 0.05% |
|
|
|
- | 33,000 | 33,000 | Mattson Technology, Inc. | - | 200,970 | 200,970 |
The accompanying notes are an integral part of the pro forma financial statements.
JOHN HANCOCK FUNDS RAINIER GROWTH FUND |
|
|
| |||
JOHN HANCOCK FUNDS GROWTH TRENDS FUND |
|
|
| |||
PRO FORMA COMBINING SCHEDULE OF INVESTMENTS - MARCH 31, 2008 (Unaudited) |
|
|
| |||
(showing percentage of combined pro forma total net assets) |
|
|
| |||
|
|
|
|
|
|
|
John Hancock | John Hancock | Proforma | Security Name Line 1 | John Hancock | John Hancock | Proforma |
|
|
|
|
|
|
|
Shares or Principal Amount | Security Description | Value | ||||
|
|
|
|
|
|
|
|
|
|
|
|
|
|
|
|
| Semiconductors - 2.48% |
|
|
|
| 18,773 | 18,773 | Fairchild Semiconductor International, Inc. | - | 223,774 | 223,774 |
183,175 | 71,500 | 254,675 | Intel Corp. | 3,879,646 | 1,514,370 | 5,394,016 |
62,050 | - | 62,050 | Intersil Corp. | 1,592,824 | - | 1,592,824 |
94,050 | - | 94,050 | NVIDIA Corp.* | 1,861,250 | - | 1,861,250 |
|
|
|
| 7,333,720 | 1,738,144 | 9,071,864 |
|
|
|
|
|
|
|
|
|
| Soft Drinks - 1.98% |
|
|
|
100,400 | - | 100,400 | PepsiCo, Inc. | 7,248,880 | - | 7,248,880 |
|
|
|
|
|
|
|
|
|
| Specialized Finance - 1.93% |
|
|
|
- | 3,366 | 3,366 | Interactive Brokers Group, Inc. (Class A) | - | 86,405 | 86,405 |
47,325 | - | 47,325 | IntercontinentalExchange, Inc.* | 6,175,913 | - | 6,175,913 |
- | 13,412 | 13,412 | Nasdaq Stock Market, Inc. | - | 518,508 | 518,508 |
- | 3,043 | 3,043 | Nymex Holdings, Inc. | - | 275,787 | 275,787 |
|
|
|
| 6,175,913 | 880,700 | 7,056,613 |
|
|
|
|
|
|
|
|
|
| Systems Software - 6.22% |
|
|
|
85,625 | 14,350 | 99,975 | Adobe Systems, Inc.* | 3,047,394 | 510,717 | 3,558,111 |
- | 8,438 | 8,438 | BMC Software, Inc. | - | 274,404 | 274,404 |
- | 14,000 | 14,000 | McAfee, Inc. | - | 463,260 | 463,260 |
231,475 | 122,050 | 353,525 | Microsoft Corp. | 6,569,261 | 3,463,779 | 10,033,040 |
321,675 | 62,600 | 384,275 | Oracle Corp.* | 6,291,963 | 1,224,456 | 7,516,419 |
22,350 | - | 22,350 | VMware, Inc. (Class. A)* | 957,027 |
| 957,027 |
|
|
|
| 16,865,645 | 5,936,615 | 22,802,260 |
|
|
|
|
|
|
|
|
|
| Technology Distributors - 0.35% |
|
|
|
- | 11,450 | 11,450 | Arrow Electronics, Inc. | - | 385,293 | 385,293 |
- | 23,453 | 23,453 | Ingram Micro, Inc. (Class A) | - | 371,261 | 371,261 |
- | 15,700 | 15,700 | Tech Data Corp. | - | 514,960 | 514,960 |
|
|
|
| - | 1,271,513 | 1,271,513 |
|
|
|
|
|
|
|
|
|
| Wireless Telecommunication Services - 1.46% |
|
|
|
78,725 | - | 78,725 | America Movil S.A.B. de C.V., ADR | 5,013,995 | - | 5,013,995 |
- | 10,900 | 10,900 | NII Holdings, Inc. | - | 346,402 | 346,402 |
|
|
|
| 5,013,995 | 346,402 | 5,360,397 |
|
|
|
|
|
|
|
|
|
| TOTAL COMMON STOCKS |
|
|
|
|
|
| (cost $360,751,604) | 294,779,851 | 58,390,624 | 353,170,475 |
|
|
|
|
|
|
|
|
|
| SHORT TERM INVESTMENTS - 3.34% |
|
|
|
|
|
| Commercial Paper - 3.30% |
|
|
|
12,085,000 | - | 12,085,000 | Starbucks Co., 3.30%, 04/01/2008 | 12,085,000 | - | 12,085,000 |
|
|
|
|
|
|
|
|
|
| Variable Rate Demand Notes - 0.04%** |
|
|
|
163,165 | - | 163,165 | Wiscoonsin Corp. Central Union, 4.869% | 163,165 | - | 163,165 |
|
|
|
|
|
|
|
|
|
| TOTAL SHORT-TERM INVESTMENTS |
|
|
|
|
|
| (cost $12,248,165) | 12,248,165 | - | 12,248,165 |
|
|
|
|
|
|
|
|
|
| JOINT REPURCHASE AGREEMENT - 2.09% |
|
|
|
| 7,670,000 | 7,670,000 | Joint Repurchase Agreement with Barclays Plc dated 03/31/2008 at 1.450% to be repurchased at $7,670,309 on 04/01/2008, collateralized by $6,441,373 U.S. Treasury Inflation Indexed Bond, 2.375%, due 01/15/2025 (valued at $7,823,400, including interest) | - | 7,670,000 | 7,670,000 |
|
|
| TOTAL REPURCHASE AGREEMENTS |
|
|
|
|
|
| (cost $7,670,000) | - | 7,670,000 | 7,670,000 |
|
|
|
|
|
|
|
|
|
|
|
|
|
|
|
|
|
|
|
|
|
|
|
|
|
|
|
|
|
|
| Total Investments (Cost $380,669,769) - 101.78% | 307,028,016 | 66,060,624 | 373,088,640 |
The accompanying notes are an integral part of the pro forma financial statements.
JOHN HANCOCK FUNDS RAINIER GROWTH FUND |
|
|
| |||
JOHN HANCOCK FUNDS GROWTH TRENDS FUND |
|
|
| |||
PRO FORMA COMBINING SCHEDULE OF INVESTMENTS - MARCH 31, 2008 (Unaudited) |
|
|
| |||
(showing percentage of combined pro forma total net assets) |
|
|
| |||
|
|
|
|
|
|
|
John Hancock | John Hancock | Proforma | Security Name Line 1 | John Hancock | John Hancock | Proforma |
|
|
|
|
|
|
|
Shares or Principal Amount | Security Description | Value | ||||
|
|
|
|
|
|
|
|
|
| Other Assets and Liabilities, Net - (1.78)% | (6,798,389) | 274,902 | (6,523,487) |
|
|
| TOTAL NET ASSETS - 100.00% | 300,229,627 | 66,335,526 | 366,565,153 |
|
|
|
|
|
|
|
|
|
| ADR - American Depositary Receipt |
|
|
|
|
|
| SADR - Sponsored American Depositary Receipt |
|
|
|
|
|
| * Non-Income Producing |
|
|
|
|
|
| ** The variable -rate securities are subject to a demand feature, which reduces the remaining maturity. |
|
|
|
The accompanying notes are an integral part of the pro forma financial statements.
JOHN HANCOCK FUNDS RAINIER GROWTH FUND |
|
|
|
|
|
|
| |||
JOHN HANCOCK FUNDS CORE EQUITY FUND |
|
|
|
|
|
|
| |||
JOHN HANCOCK FUNDS GROWTH TRENDS FUND |
|
|
|
|
|
|
| |||
JOHN HANCOCK FUNDS TECHNOLOGY FUND |
|
|
|
|
|
|
| |||
PRO FORMA COMBINING SCHEDULE OF INVESTMENTS - MARCH 31, 2008 (Unaudited) |
|
|
|
|
| |||||
(showing percentage of combined pro forma total net assets) |
|
|
|
|
|
|
| |||
|
|
|
|
|
|
|
|
|
|
|
John Hancock | John Hancock | John Hancock | John Hancock | Proforma | Security Description | John Hancock | John Hancock | John Hancock | John Hancock | Proforma |
|
|
|
|
|
|
|
|
|
|
|
Shares or Principal Amount | Security Description | Value | ||||||||
|
|
|
|
|
|
|
|
|
|
|
|
|
|
|
| COMMON STOCKS - 97.77% |
|
|
|
|
|
|
|
|
|
| Advertising - 0.88% |
|
|
|
|
|
65,725 | - | - | - | 65,725 | Focus Media Holding Ltd., ADR* | 2,310,234 | - | - | - | 2,310,234 |
93,575 | - | - | - | 93,575 | Omnicom Group Inc. | 4,134,144 | - | - | - | 4,134,144 |
|
|
|
|
|
| 6,444,378 | - | - | - | 6,444,378 |
|
|
|
|
|
|
|
|
|
|
|
|
|
|
|
| Aerospace & Defense - 1.33% |
|
|
|
|
|
52,350 | 37,400 | - | - | 89,750 | Boeing Co. (The) | 3,893,269 | 2,781,438 | - | - | 6,674,707 |
44,925 | - | - | - | 44,925 | United Technologies Corp. | 3,091,739 | - | - | - | 3,091,739 |
|
|
|
|
|
| 6,985,008 | 2,781,438 | - | - | 9,766,446 |
|
|
|
|
|
|
|
|
|
|
|
|
|
|
|
| Air Freight & Logistics - 0.61% |
|
|
|
|
|
81,550 | - | - | - | 81,550 | Expeditors International of Washington, Inc. | 3,684,429 | - | - | - | 3,684,429 |
- | 11,000 | - | - | 11,000 | United Parcel Service, Inc. (Class B) | - | 803,220 | - | - | 803,220 |
|
|
|
|
|
| 3,684,429 | 803,220 | - | - | 4,487,649 |
|
|
|
|
|
|
|
|
|
|
|
|
|
|
|
| Airlines - 0.10% |
|
|
|
|
|
- | 59,000 | - | - | 59,000 | Southwest Airlines Co. | - | 731,600 | - | - | 731,600 |
|
|
|
|
|
|
|
|
|
|
|
|
|
|
|
|
|
|
|
|
|
|
|
|
|
|
| Apparel Retail - 0.25% |
|
|
|
|
|
- | 78,000 | - | - | 78,000 | Macys, Inc.. | - | 1,798,680 | - | - | 1,798,680 |
|
|
|
|
|
|
|
|
|
|
|
|
|
|
|
|
|
|
|
|
|
|
|
|
|
|
| Apparel, Accessories & Luxury Goods - 0.28% |
|
|
|
|
|
- | 21,000 | - | - | 21,000 | Coach, Inc. | - | 633,150 | - | - | 633,150 |
- | 24,500 | - | - | 24,500 | Polo Ralph Lauren Corp. | - | 1,428,105 | - | - | 1,428,105 |
|
|
|
|
|
| - | 2,061,255 | - | - | 2,061,255 |
|
|
|
|
|
|
|
|
|
|
|
|
|
|
|
| Application Software - 2.32% |
|
|
|
|
|
- | - | 13,300 | 80,000 | 93,300 | Amdocs, Ltd. | - | - | 377,188 | 2,268,800 | 2,645,988 |
60,175 | 57,000 | - | - | 117,175 | Autodesk, Inc.* | 1,894,309 | 1,794,360 | - | - | 3,688,669 |
- | - | 10,000 | 64,000 | 74,000 | Intuit, Inc. | - | - | 270,100 | 1,728,640 | 1,998,740 |
- | - |
| 328,000 | 328,000 | Iona Technologies Plc | - | - |
| 1,272,640 | 1,272,640 |
- | - | 51,000 | 322,000 | 373,000 | NetScout Systems, Inc. | - | - | 474,300 | 2,994,600 | 3,468,900 |
- | - | 4,500 | 28,500 | 33,000 | Salesforce.com, Inc. | - | - | 260,415 | 1,649,295 | 1,909,710 |
- | - | 20,500 | 66,000 | 86,500 | Synopsys, Inc. | - | - | 465,555 | 1,498,860 | 1,964,415 |
|
|
|
|
|
| 1,894,309 | 1,794,360 | 1,847,558 | 11,412,835 | 16,949,062 |
|
|
|
|
|
|
|
|
|
|
|
|
|
|
|
| Asset Management & Custody Banks - 1.91% |
|
|
|
|
|
- | - | 3,366 | - | 3,366 | Affiliated Managers Group, Inc. | - | - | 305,431 |
| 305,431 |
- | - | 23,840 | - | 23,840 | Bank of New York Mellon Corp. | - | - | 994,843 | - | 994,843 |
26,800 | - | 1,742 | - | 28,542 | BlackRock, Inc. (Class A) | 5,472,024 | - | 355,682 | - | 5,827,706 |
- | 13,200 | - | - | 13,200 | Northern Trust Corp. | - | 877,404 | - | - | 877,404 |
| - | 24,550 | - | 24,550 | State Street Corp. | - | - | 1,939,450 | - | 1,939,450 |
72,350 | - | 8,079 | - | 80,429 | T. Row Price Group, Inc. | 3,617,500 |
| 403,950 | - | 4,021,450 |
|
|
|
|
|
| 9,089,524 | 877,404 | 3,999,356 | - | 13,966,284 |
|
|
|
|
|
|
|
|
|
|
|
|
|
|
|
| Biotechnology - 3.18% |
|
|
|
|
|
- | 20,000 | 10,789 | - | 30,789 | Amgen, Inc. | - | 835,600 | 450,764 | - | 1,286,364 |
64,575 | - | - | - | 64,575 | Celgene Corp.* | 3,957,802 | - | - | - | 3,957,802 |
77,600 | - | 12,417 | - | 90,017 | Genentech, Inc.* | 6,299,568 | - | 1,008,012 | - | 7,307,580 |
28,850 | - | - | - | 28,850 | Genzyme Corp.* | 2,150,479 | - | - | - | 2,150,479 |
139,375 | - | 17,785 | - | 157,160 | Gilead Sciences, Inc.* | 7,181,994 | - | 916,461 | - | 8,098,455 |
- | - | 21,650 | - | 21,650 | Qiagen NV | - | - | 450,320 | - | 450,320 |
|
|
|
|
|
| 19,589,843 | 835,600 | 2,825,558 | - | 23,251,001 |
|
|
|
|
|
|
|
|
|
|
|
|
|
|
|
| Broadcasting & Cable TV - 0.39% |
|
|
|
|
|
- | 65,900 | - | - | 65,900 | DIRECTV Group, Inc. (The) | - | 1,633,661 | - | - | 1,633,661 |
- | 23,400 | - | - | 23,400 | Discovery Holding Co. | - | 496,548 | - | - | 496,548 |
- | 21,800 | - | - | 21,800 | Liberty Global, Inc. (Class A) | - | 742,944 | - | - | 742,944 |
|
|
|
|
|
| - | 2,873,153 | - | - | 2,873,153 |
|
|
|
|
|
|
|
|
|
|
|
|
|
|
|
| Casinos & Gaming - 0.58% | - | - | - | - |
|
- | 8,500 | - | - | 8,500 | Las Vegas Sands Corp. | - | 625,940 | - | - | 625,940 |
61,122 | - | - | - | 61,122 | MGM Mirage* | 3,592,140 | - | - | - | 3,592,140 |
|
|
|
|
|
| 3,592,140 | 625,940 | - | - | 4,218,080 |
|
|
|
|
|
|
|
|
|
|
|
|
|
|
|
| Communications Equipment - 6.91% |
|
|
|
|
|
- | - | - | 100,000 | 100,000 | Avocent Corp. | - | - | - | 1,690,000 | 1,690,000 |
305,525 | 76,000 | 74,102 | 351,800 | 807,427 | Cisco Systems, Inc.* | 7,360,097 | 1,830,840 | 1,785,117 | 8,474,862 | 19,450,916 |
- | - | - | 319,400 | 319,400 | Comverse Technology, Inc. | - | - | - | 4,918,760 | 4,918,760 |
154,050 | - | - | - | 154,050 | Corning Inc. | 3,703,362 | - | - |
| 3,703,362 |
- | - | 7,200 | 45,000 | 52,200 | Harris Corp. | - | - | 349,416 | 2,183,850 | 2,533,266 |
126,100 | 90,000 | - | - | 216,100 | Nokia Corp., SADR | 4,013,763 | 2,864,700 |
|
| 6,878,463 |
- |
|
| 67,620 | 67,620 | Primus Telecommunications Group, Inc. | - | - | - | 20,421 | 20,421 |
108,375 | - | 14,400 | 89,550 | 212,325 | QUALCOMM, Inc. | 4,443,375 | - | 590,400 | 3,671,550 | 8,705,325 |
23,000 |
|
|
| 23,000 | Research In Motion, Ltd.* | 2,581,290 | - | - | - | 2,581,290 |
|
|
|
|
|
| 22,101,887 | 4,695,540 | 2,724,933 | 20,959,443 | 50,481,803 |
|
|
|
|
|
|
|
|
|
|
|
|
|
|
|
| Computer & Electronics Retail - 0.67% |
|
|
|
|
|
- | 45,800 | - | - | 45,800 | Best Buy Co., Inc. | - | 1,898,868 | - | - | 1,898,868 |
- | 22,000 | 4,948 | 30,700 | 57,648 | GameStop Corp. (Class A) | - | 1,137,620 | 255,861 | 1,587,497 | 2,980,978 |
|
|
|
|
|
| - | 3,036,488 | 255,861 | 1,587,497 | 4,879,846 |
|
|
|
|
|
|
|
|
|
|
|
The accompanying notes are an integral part of the pro forma financial statements.
JOHN HANCOCK FUNDS RAINIER GROWTH FUND |
|
|
|
|
|
|
| |||
JOHN HANCOCK FUNDS CORE EQUITY FUND |
|
|
|
|
|
|
| |||
JOHN HANCOCK FUNDS GROWTH TRENDS FUND |
|
|
|
|
|
|
| |||
JOHN HANCOCK FUNDS TECHNOLOGY FUND |
|
|
|
|
|
|
| |||
PRO FORMA COMBINING SCHEDULE OF INVESTMENTS - MARCH 31, 2008 (Unaudited) |
|
|
|
|
| |||||
(showing percentage of combined pro forma total net assets) |
|
|
|
|
|
|
| |||
|
|
|
|
|
|
|
|
|
|
|
John Hancock | John Hancock | John Hancock | John Hancock | Proforma | Security Description | John Hancock | John Hancock | John Hancock | John Hancock | Proforma Combined |
|
|
|
|
|
|
|
|
|
|
|
Shares or Principal Amount | Security Description | Value | ||||||||
|
|
|
|
|
|
|
|
|
|
|
|
|
|
|
| Computer Hardware - 5.87% |
|
|
|
|
|
47,675 | 7,500 | 10,100 | 40,550 | 105,825 | Apple, Inc.* | 6,841,362 | 1,076,250 | 1,449,350 | 5,818,925 | 15,185,887 |
- | 68,500 | 23,400 | 73,300 | 165,200 | Dell, Inc. | - | 1,364,520 | 466,128 | 1,460,136 | 3,290,784 |
139,225 | 22,900 | 23,365 | 148,400 | 333,890 | Hewlett-Packard Co. | 6,357,013 | 1,045,614 | 1,066,846 | 6,775,944 | 15,245,417 |
- | - | 15,900 | 63,500 | 79,400 | International Business Machines Corp. | - | - | 1,830,726 | 7,311,390 | 9,142,116 |
|
|
|
|
|
| 13,198,375 | 3,486,384 | 4,813,050 | 21,366,395 | 42,864,204 |
|
|
|
|
|
|
|
|
|
|
|
|
|
|
|
| Computer Storage & Peripherals - 1.71% |
|
|
|
|
|
- | - | - | 308,000 | 308,000 | Brocade Communications Systems, Inc. | - | - | - | 2,248,400 | 2,248,400 |
- | - | 29,752 | 188,000 | 217,752 | EMC Corp. | - | - | 426,644 | 2,695,920 | 3,122,564 |
- | 35,500 | - | - | 35,500 | NetApp, Inc. | - | 711,775 | - | - | 711,775 |
- | 81,000 | - | - | 81,000 | SanDisk Corp. | - | 1,828,170 | - | - | 1,828,170 |
- | 105,500 | 15,358 | 97,500 | 218,358 | Seagate Technology | - | 2,209,170 | 321,597 | 2,041,650 | 4,572,417 |
|
|
|
|
|
| - | 4,749,115 | 748,240 | 6,985,970 | 12,483,325 |
|
|
|
|
|
|
|
|
|
|
|
|
|
|
|
| Construction & Engineering - 0.14% |
|
|
|
|
|
- | 38,000 | - | - | 38,000 | KBR, Inc. | - | 1,053,740 | - | - | 1,053,740 |
|
|
|
|
|
|
|
|
|
|
|
|
|
|
|
|
|
|
|
|
|
|
|
|
|
|
| Construction & Farm Machinery - 0.84% |
|
|
|
|
|
42,175 | - | - | - | 42,175 | Deere & Co. | 3,392,557 | - | - | - | 3,392,557 |
67,125 | - | - | - | 67,125 | Manitowoc Co., Inc. | 2,738,700 | - | - | - | 2,738,700 |
|
|
|
|
|
| 6,131,257 | - | - | - | 6,131,257 |
|
|
|
|
|
|
|
|
|
|
|
|
|
|
|
| Consumer Finance - 0.21% |
|
|
|
|
|
- | - | 19,612 | - | 19,612 | American Express Co. | - | - | 857,437 | - | 857,437 |
- | - | 40,078 | - | 40,078 | Discover Financial Services | - | - | 656,077 | - | 656,077 |
|
|
|
|
|
| - | - | 1,513,514 | - | 1,513,514 |
|
|
|
|
|
|
|
|
|
|
|
|
|
|
|
| Data Processing & Outsourced Services - 0.78% |
|
|
|
|
|
- | 33,100 | - | - | 33,100 | Broadridge Financial Solutions, Inc. | - | 582,560 | - | - | 582,560 |
- | 23,300 | - | - | 23,300 | Fiserv, Inc. | - | 1,120,497 | - | - | 1,120,497 |
- | 16,300 | - | - | 16,300 | Global Payments, Inc. | - | 674,168 | - | - | 674,168 |
- | 17,500 | - | - | 17,500 | Hewitt Associates, Inc. | - | 695,975 | - | - | 695,975 |
- | 9,800 | - | - | 9,800 | MasterCard, Inc. | - | 2,185,302 | - | - | 2,185,302 |
- | - | 13,765 | - | 13,765 | Wright Express Corp. | - | - | 422,998 | - | 422,998 |
|
|
|
|
|
| - | 5,258,502 | 422,998 | - | 5,681,500 |
|
|
|
|
|
|
|
|
|
|
|
|
|
|
|
| Diversified Banks - 1.29% |
|
|
|
|
|
- | 43,100 | 45,685 | - | 88,785 | Bank of America Corp. | - | 1,633,921 | 1,731,918 | - | 3,365,839 |
- | - | - | 14,369 | 14,369 | First Internet Bancorp | - | - | - | 167,399 | 167,399 |
- | - | 6,587 | - | 6,587 | Kookmin Bank, ADR | - | - | 369,201 | - | 369,201 |
- | 39,300 | 41,611 | - | 80,911 | Wachovia Corp. | - | 1,061,100 | 1,123,497 | - | 2,184,597 |
- | 114,000 | - | - | 114,000 | Wells Fargo & Co. | - | 3,317,400 | - | - | 3,317,400 |
|
|
|
|
|
| - | 6,012,421 | 3,224,617 | 167,399 | 9,404,437 |
|
|
|
|
|
|
|
|
|
|
|
|
|
|
|
| Diversified Chemicals - 0.85% |
|
|
|
|
|
- | - | 15,795 | - | 15,795 | Bayer AG | - | - | 1,266,124 | - | 1,266,124 |
- | 71,100 | - | - | 71,100 | Dow Chemical Co. (The) | - | 2,620,035 | - | - | 2,620,035 |
- | 38,400 | - | - | 38,400 | PPG Industries, Inc. | - | 2,323,584 | - | - | 2,323,584 |
|
|
|
|
|
| - | 4,943,619 | 1,266,124 | - | 6,209,743 |
|
|
|
|
|
|
|
|
|
|
|
|
|
|
|
| Diversified Commercial & Professional Services - 0.09% |
|
|
|
|
|
- | 10,300 | - | - | 10,300 | Brink's Co. (The) | - | 691,954 | - | - | 691,954 |
|
|
|
|
|
|
|
|
|
|
|
|
|
|
|
|
|
|
|
|
|
|
|
|
|
|
| Diversified Metals & Mining - 2.03% |
|
|
|
|
|
46,475 | 33,300 | - | - | 79,775 | Freeport-McMoRan Copper & Gold | 4,471,824 | 3,204,126 | - | - | 7,675,950 |
63,000 | 7,100 | - | - | 70,100 | Precision Castparts Corp. | 6,431,040 | 724,768 | - | - | 7,155,808 |
|
|
|
|
|
| 10,902,864 | 3,928,894 | - | - | 14,831,758 |
|
|
|
|
|
|
|
|
|
|
|
|
|
|
|
| Diversified Metals & Mining - 0.05% |
|
|
|
|
|
- | 3,800 | - | - | 3,800 | Southern Copper Corp. | - | 394,554 | - | - | 394,554 |
|
|
|
|
|
|
|
|
|
|
|
|
|
|
|
|
|
|
|
|
|
|
|
|
|
|
| Drug Retail - 0.20% |
|
|
|
|
|
35,800 | - | - | - | 35,800 | CVS Corp. | 1,450,258 | - | - | - | 1,450,258 |
|
|
|
|
|
|
|
|
|
|
|
|
|
|
|
|
|
|
|
|
|
|
|
|
|
|
| Education Services - 0.04% |
|
|
|
|
|
- | 5,800 | - | - | 5,800 | ITT Educational Services, Inc. | - | 266,394 | - | - | 266,394 |
|
|
|
|
|
|
|
|
|
|
|
|
|
|
|
|
|
|
|
|
|
|
|
|
|
|
| Electric Utilities - 1.17% |
|
|
|
|
|
- | 131,600 | - | - | 131,600 | Duke Energy Corp. | - | 2,349,060 | - | - | 2,349,060 |
36,975 | - | - | - | 36,975 | Entergy Corp. | 4,033,233 | - | - | - | 4,033,233 |
- | 21,700 | - | - | 21,700 | FirstEnergy Corp. | - | 1,489,054 | - | - | 1,489,054 |
- | 11,000 | - | - | 11,000 | FPL Group, Inc. | - | 690,140 | - | - | 690,140 |
|
|
|
|
|
| 4,033,233 | 4,528,254 | - | - | 8,561,487 |
|
|
|
|
|
|
|
|
|
|
|
|
|
|
|
| Electrical Components & Equipment - 0.64% |
|
|
|
|
|
- | 15,000 | - | - | 15,000 | General Cable Corp. | - | 886,050 | - | - | 886,050 |
- | 38,400 | - | - | 38,400 | Rockwell Automation, Inc. | - | 2,204,928 | - | - | 2,204,928 |
- | 33,300 | - | - | 33,300 | Tyco International, Ltd. | - | 1,466,865 | - | - | 1,466,865 |
- | - | - | 143,678 | 143,678 | Silicon Genesis Corp. | - |
| - | 152,586 | 152,586 |
|
|
|
|
|
| - | 4,557,843 | - | 152,586 | 4,710,429 |
|
|
|
|
|
|
|
|
|
|
|
The accompanying notes are an integral part of the pro forma financial statements.
JOHN HANCOCK FUNDS RAINIER GROWTH FUND |
|
|
|
|
|
|
| |||
JOHN HANCOCK FUNDS CORE EQUITY FUND |
|
|
|
|
|
|
| |||
JOHN HANCOCK FUNDS GROWTH TRENDS FUND |
|
|
|
|
|
|
| |||
JOHN HANCOCK FUNDS TECHNOLOGY FUND |
|
|
|
|
|
|
| |||
PRO FORMA COMBINING SCHEDULE OF INVESTMENTS - MARCH 31, 2008 (Unaudited) |
|
|
|
|
| |||||
(showing percentage of combined pro forma total net assets) |
|
|
|
|
|
|
| |||
|
|
|
|
|
|
|
|
|
|
|
John Hancock | John Hancock | John Hancock | John Hancock | Proforma | Security Description | John Hancock | John Hancock | John Hancock | John Hancock | Proforma |
|
|
|
|
|
|
|
|
|
|
|
Shares or Principal Amount | Security Description | Value | ||||||||
|
|
|
|
|
|
|
|
|
|
|
|
|
|
|
| Fertilizers & Agricultural Chemicals - 1.73% |
|
|
|
|
|
65,550 | 15,000 | - | - | 80,550 | Monsanto Co. | 7,308,825 | 1,672,500 | - | - | 8,981,325 |
35,325 | - | - | - | 35,325 | Mosaic Co. | 3,624,345 |
| - | - | 3,624,345 |
|
|
|
|
|
| 10,933,170 | 1,672,500 | - | - | 12,605,670 |
|
|
|
|
|
|
|
|
|
|
|
|
|
|
|
| Food Distributors - 0.24% |
|
|
|
|
|
- | 61,000 | - | - | 61,000 | SYSCO, Corp. | - | 1,770,220 | - | - | 1,770,220 |
|
|
|
|
|
|
|
|
|
|
|
|
|
|
|
|
|
|
|
|
|
|
|
|
|
|
| Food Retail - 0.39% |
|
|
|
|
|
- | 33,500 | - | - | 33,500 | Safeway, Inc. | - | 983,225 | - | - | 983,225 |
- | 62,800 | - | - | 62,800 | SUPERVALU, Inc. | - | 1,882,744 | - | - | 1,882,744 |
|
|
|
|
|
| - | 2,865,969 | - | - | 2,865,969 |
|
|
|
|
|
|
|
|
|
|
|
|
|
|
|
| Footwear - 1.27% |
|
|
|
|
|
124,600 | 12,200 | - | - | 136,800 | NIKE, Inc. (Class B) | 8,472,800 | 829,600 | - | - | 9,302,400 |
|
|
|
|
|
|
|
|
|
|
|
|
|
|
|
|
|
|
|
|
|
|
|
|
|
|
| Health Care Distributors - 0.44% |
|
|
|
|
|
- | 22,400 | 11,281 | - | 33,681 | AmerisourceBergen Corp. | - | 917,952 | 462,295 | - | 1,380,247 |
- | - | 6,834 | - | 6,834 | Cardinal Health, Inc. | - | - | 358,853 | - | 358,853 |
- | 27,500 | - | - | 27,500 | McKesson Corp. | - | 1,440,175 | - | - | 1,440,175 |
|
|
|
|
|
| - | 2,358,127 | 821,149 | - | 3,179,276 |
|
|
|
|
|
|
|
|
|
|
|
|
|
|
|
| Health Care Equipment - 1.28% |
|
|
|
|
|
- | 39,800 | - | - | 39,800 | Baxter International, Inc. | - | 2,301,236 | - | - | 2,301,236 |
79,215 | - | 8,946 | - | 88,161 | Hologic, Inc.* | 4,404,354 | - | 497,398 | - | 4,901,752 |
33,900 | - | 8,673 | - | 42,573 | Medtronic, Inc. | 1,639,743 | - | 419,513 | - | 2,059,256 |
|
|
| 491,800 | 491,800 | SerOptix, Inc. | - | - | - | 54,098 | 54,098 |
|
|
|
|
|
| 6,044,097 | 2,301,236 | 916,911 | 54,098 | 9,316,342 |
|
|
|
|
|
|
|
|
|
|
|
|
|
|
|
| Health Care Services - 0.52% |
|
|
|
|
|
- | - | 97,210 | - | 97,210 | Aveta, Inc. | - | - | 534,655 | - | 534,655 |
51,125 | - | - | - | 51,125 | Express Scripts, Inc.* | 3,288,360 | - | - | - | 3,288,360 |
|
|
|
|
|
| 3,288,360 | - | 534,655 | - | 3,823,015 |
|
|
|
|
|
|
|
|
|
|
|
|
|
|
|
| Health Care Supplies - 0.74% |
|
|
|
|
|
34,775 | - | - | - | 34,775 | Alcon, Inc. | 4,946,744 | - | - | - | 4,946,744 |
- | - | 7,634 | - | 7,634 | Thermo Fisher Scientific, Inc. | - | - | 433,917 | - | 433,917 |
|
|
|
|
|
| 4,946,744 | - | 433,917 | - | 5,380,661 |
|
|
|
|
|
|
|
|
|
|
|
|
|
|
|
| Health Care Technology - 0.31% |
|
|
|
|
|
- | - | 277,305 | - | 277,305 | American Oriental Bioengineering, Inc. | - | - | 2,246,171 | - | 2,246,171 |
|
|
|
|
|
|
|
|
|
|
|
|
|
|
|
|
|
|
|
|
|
|
|
|
|
|
| Heavy Electrical Equipment - 0.35% |
|
|
|
|
|
95,700 | - | - | - | 95,700 | ABB Ltd., SADR | 2,576,244 | - | - | - | 2,576,244 |
|
|
|
|
|
|
|
|
|
|
|
|
|
|
|
|
|
|
|
|
|
|
|
|
|
|
| Activision, Inc. - 0.37% |
|
|
|
|
|
- | - | - | 99,200 | 99,200 | Activision, Inc. | - | - | - | 2,709,152 | 2,709,152 |
|
|
|
|
|
|
|
|
|
|
|
|
|
|
|
|
|
|
|
|
|
|
|
|
|
|
| Hotels, Resorts & Cruise Lines - 0.27% |
|
|
|
|
|
- | 59,800 | - | - | 59,800 | Royal Caribbean Cruises, Ltd. | - | 1,967,420 | - | - | 1,967,420 |
|
|
|
|
|
|
|
|
|
|
|
|
|
|
|
|
|
|
|
|
|
|
|
|
|
|
| Household Products - 1.86% |
|
|
|
|
|
- | 10,500 | - | - | 10,500 | Colgate-Palmolive Co. | - | 818,055 | - | - | 818,055 |
141,850 | 40,100 | - | - | 181,950 | Procter & Gamble Co. (The) | 9,939,430 | 2,809,807 | - | - | 12,749,237 |
|
|
|
|
|
| 9,939,430 | 3,627,862 | - | - | 13,567,292 |
|
|
|
|
|
|
|
|
|
|
|
|
|
|
|
| Housewares & Specialties - 0.30% |
|
|
|
|
|
- | 96,800 | - | - | 96,800 | Newell Rubbermaid, Inc. | - | 2,213,816 | - | - | 2,213,816 |
|
|
|
|
|
|
|
|
|
|
|
|
|
|
|
|
|
|
|
|
|
|
|
|
|
|
| Human Resource & Employment Services - 0.09% |
|
|
|
|
|
- | 24,900 | - | - | 24,900 | Robert Half International, Inc. | - | 640,926 | - | - | 640,926 |
|
|
|
|
|
|
|
|
|
|
|
|
|
|
|
|
|
|
|
|
|
|
|
|
|
|
| Hypermarkets & Super Centers - 0.38% |
|
|
|
|
|
- | 53,200 | - | - | 53,200 | Wal-Mart Stores, Inc. | - | 2,802,576 | - | - | 2,802,576 |
|
|
|
|
|
|
|
|
|
|
|
|
|
|
|
|
|
|
|
|
|
|
|
|
|
|
| Industrial Conglomerates - 3.54% |
|
|
|
|
|
- | 15,400 | - | - | 15,400 | 3M Co. | - | 1,218,910 | - | - | 1,218,910 |
99,450 | 217,000 | - | - | 316,450 | General Electric Co. | 3,680,644 | 8,031,170 | - | - | 11,711,814 |
125,275 | - | - | - | 125,275 | McDermott International, Inc.* | 6,867,576 |
| - | - | 6,867,576 |
52,525 | 56,300 | - | - | 108,825 | Textron, Inc. | 2,910,936 | 3,120,146 | - | - | 6,031,082 |
|
|
|
|
|
| 13,459,156 | 12,370,226 | - | - | 25,829,382 |
|
|
|
|
|
|
|
|
|
|
|
|
|
|
|
| Industrial Machinery - 0.18% |
|
|
|
|
|
- | 29,500 | - | - | 29,500 | Ingersoll-Rand Co., Ltd. | - | 1,315,110 | - | - | 1,315,110 |
|
|
|
|
|
|
|
|
|
|
|
|
|
|
|
|
|
|
|
|
|
|
The accompanying notes are an integral part of the pro forma financial statements.
JOHN HANCOCK FUNDS RAINIER GROWTH FUND |
|
|
|
|
|
|
| |||
JOHN HANCOCK FUNDS CORE EQUITY FUND |
|
|
|
|
|
|
| |||
JOHN HANCOCK FUNDS GROWTH TRENDS FUND |
|
|
|
|
|
|
| |||
JOHN HANCOCK FUNDS TECHNOLOGY FUND |
|
|
|
|
|
|
| |||
PRO FORMA COMBINING SCHEDULE OF INVESTMENTS - MARCH 31, 2008 (Unaudited) |
|
|
|
|
| |||||
(showing percentage of combined pro forma total net assets) |
|
|
|
|
|
|
| |||
|
|
|
|
|
|
|
|
|
|
|
John Hancock | John Hancock | John Hancock | John Hancock | Proforma | Security Description | John Hancock | John Hancock | John Hancock | John Hancock | Proforma |
|
|
|
|
|
|
|
|
|
|
|
Shares or Principal Amount | Security Description | Value | ||||||||
|
|
|
|
|
|
|
|
|
|
|
|
|
|
|
| Industrial Power Producers & Energy Traders - 0.15% |
|
|
|
|
|
- | 29,200 | - | - | 29,200 | Mirant Corp. | - | 1,062,588 | - | - | 1,062,588 |
|
|
|
|
|
|
|
|
|
|
|
|
|
|
|
|
|
|
|
|
|
|
|
|
|
|
| Insurance Brokers - 0.08% |
|
|
|
|
|
- | - | 6,250 | - | 6,250 | Aon Corp. | - | - | 251,250 | - | 251,250 |
- | - | 8,925 | - | 8,925 | Willis Group Holdings, Ltd. | - | - | 299,969 | - | 299,969 |
|
|
|
|
|
| - | - | 551,219 | - | 551,219 |
|
|
|
|
|
|
|
|
|
|
|
|
|
|
|
| Integrated Oil & Gas - 2.72% |
|
|
|
|
|
- | 139,700 | - | - | 139,700 | Exxon Mobil Corp. | - | 11,815,826 | - | - | 11,815,826 |
- | 16,800 | - | - | 16,800 | Marathon Oil Corp. | - | 766,080 | - | - | 766,080 |
- | 63,600 | - | - | 63,600 | Occidental Petroleum Corp. | - | 4,653,612 | - | - | 4,653,612 |
- | 25,300 | - | - | 25,300 | Royal Dutch Shell Plc, ADR | - | 1,745,194 | - | - | 1,745,194 |
- | - | 9,382 | - | 9,382 | Sasol Ltd., ADR | - | - | 453,995 | - | 453,995 |
- | - | 4,622 | - | 4,622 | Suncor Energy, Inc. | - | - | 445,330 | - | 445,330 |
|
|
|
|
|
| - | 18,980,712 | 899,325 | - | 19,880,037 |
|
|
|
|
|
|
|
|
|
|
|
|
|
|
|
| Integrated Telecommunication Services - 1.25% |
|
|
|
|
|
- | 107,300 | - | - | 107,300 | AT&T, Inc. | - | 4,109,590 | - | - | 4,109,590 |
- | 90,900 | 6,463 | 41,000 | 138,363 | Verizon Communications, Inc. | - | 3,313,305 | 235,576 | 1,494,450 | 5,043,331 |
|
|
|
|
|
| - | 7,422,895 | 235,576 | 1,494,450 | 9,152,921 |
|
|
|
|
|
|
|
|
|
|
|
|
|
|
|
| Internet Retail - 0.49% |
|
|
|
|
|
33,825 | - | - | - | 33,825 | Amazon.com, Inc.* | 2,411,722 | - | - | - | 2,411,722 |
- | 53,700 | - | - | 53,700 | Expedia, Inc. | - | 1,175,493 | - | - | 1,175,493 |
|
|
|
|
|
| 2,411,722 | 1,175,493 | - | - | 3,587,215 |
|
|
|
|
|
|
|
|
|
|
|
|
|
|
|
| Internet Software & Services - 2.61% |
|
|
|
|
|
- | - | 24,500 | 125,000 | 149,500 | eBay, Inc. | - | - | 731,080 | 3,730,000 | 4,461,080 |
17,325 | 1,100 | 1,400 | 3,091 | 22,916 | Google, Inc. (Class A)* | 7,631,143 | 484,517 | 616,658 | 1,361,493 | 10,093,811 |
- | - | - | 46,449 | 46,449 | NDS Group Plc, ADR | - | - | - | 2,269,963 | 2,269,963 |
- | - | - | 76,000 | 76,000 | Shanda Interactive Entertainment Ltd., ADR | - | - | - | 2,211,600 | 2,211,600 |
|
|
|
|
|
| 7,631,143 | 484,517 | 1,347,738 | 9,573,055 | 19,036,453 |
|
|
|
|
|
|
|
|
|
|
|
|
|
|
|
| Investment Banking & Brokerage - 1.93% |
|
|
|
|
|
- | - | - | 591,080 | 591,080 | BancTec, Inc. | - | - | - | 2,955,400 | 2,955,400 |
353,100 | 96,500 | 21,402 | - | 471,002 | Charles Schwab Corp. (The) | 6,648,873 | 1,817,095 | 403,000 |
| 8,868,968 |
- | 9,300 | - | - | 9,300 | Goldman Sachs Group, Inc. | - | 1,538,127 | - | - | 1,538,127 |
- | - | 9,600 | - | 9,600 | Lazard, Ltd. | - | - | 366,720 | - | 366,720 |
- | - | 5,200 | - | 5,200 | Merrill Lynch & Co., Inc. | - | - | 211,848 | - | 211,848 |
- | - | 15,036 | - | 15,036 | MF Global, Ltd. | - | - | 149,007 | - | 149,007 |
|
|
|
|
|
| 6,648,873 | 3,355,222 | 1,130,574 | 2,955,400 | 14,090,069 |
|
|
|
|
|
|
|
|
|
|
|
|
|
|
|
| IT Consulting & Other Services - 0.64% |
|
|
|
|
|
- | 39,200 | - | - | 39,200 | Accenture, Ltd. (Class A) | - | 1,378,664 | - | - | 1,378,664 |
- | - | 17,950 | 71,600 | 89,550 | CA, Inc. | - | - | 403,875 | 1,611,000 | 2,014,875 |
42,250 | - | - | - | 42,250 | Cognizant Technology Solutions Corp.* | 1,218,067 | - | - | - | 1,218,067 |
- | - | - | 6,427 | 6,427 | Gomez, Inc. | - | - | - | 30,014 | 30,014 |
- | - | - | 328 | 328 | Gomez, Inc. | - | - | - | 1,532 | 1,532 |
|
|
|
|
|
| 1,218,067 | 1,378,664 | 403,875 | 1,642,546 | 4,643,152 |
|
|
|
|
|
|
|
|
|
|
|
|
|
|
|
| Life & Health Insurance - 0.44% |
|
|
|
|
|
- | - | 17,650 | - | 17,650 | Aflac, Inc. | - | - | 1,146,368 | - | 1,146,368 |
- | 11,700 | 6,916 | - | 18,616 | MetLife, Inc. | - | 705,042 | 416,758 | - | 1,121,800 |
- | - | 7,880 | - | 7,880 | Principal Financial Group, Inc. | - | - | 439,074 | - | 439,074 |
- | - | 6,750 | - | 6,750 | Prudential Financial, Inc. | - | - | 528,188 | - | 528,188 |
|
|
|
|
|
| - | 705,042 | 2,530,387 | - | 3,235,429 |
|
|
|
|
|
|
|
|
|
|
|
|
|
|
|
| Managed Health Care - 1.61% |
|
|
|
|
|
51,825 | 44,500 | 18,769 | - | 115,094 | Aetna, Inc. | 2,181,314 | 1,873,005 | 789,987 | - | 4,844,306 |
- | 54,600 | - | - | 54,600 | CIGNA Corp. | - | 2,215,122 | - | - | 2,215,122 |
- | 49,800 | - | - | 49,800 | Humana, Inc. | - | 2,234,028 | - | - | 2,234,028 |
- | - | 14,409 | - | 14,409 | UnitedHealth Group, Inc. | - | - | 495,093 | - | 495,093 |
- | 19,500 | - | - | 19,500 | Wellcare Health Plans, Inc. | - | 759,525 | - | - | 759,525 |
- | 14,200 | 12,650 | - | 26,850 | WellPoint, Inc. | - | 626,646 | 558,245 | - | 1,184,891 |
|
|
|
|
|
| 2,181,314 | 7,708,326 | 1,843,325 | - | 11,732,965 |
|
|
|
|
|
|
|
|
|
|
|
|
|
|
|
| Marine - 0.09% |
|
|
|
|
|
- | 9,500 | - | - | 9,500 | Overseas Shipholding Group, Inc. | - | 665,380 | - | - | 665,380 |
|
|
|
|
|
|
|
|
|
|
|
|
|
|
|
|
|
|
|
|
|
|
|
|
|
|
| Metal & Glass Containers - 0.37% |
|
|
|
|
|
48,300 | - | - | - | 48,300 | Owens Illinois, Inc.* | 2,725,569 | - | - | - | 2,725,569 |
|
|
|
|
|
|
|
|
|
|
|
|
|
|
|
|
|
|
|
|
|
|
|
|
|
|
| Mortgage Reits - 0.05% |
|
|
|
|
|
- | 23,500 | - | - | 23,500 | Annaly Capital Management, Inc. | - | 360,020 | - | - | 360,020 |
|
|
|
|
|
|
|
|
|
|
|
|
|
|
|
|
|
|
|
|
|
|
|
|
|
|
| Movies & Entertainment - 1.31% |
|
|
|
|
|
357,175 | 154,500 | - | - | 511,675 | News Corp. (Class A) | 6,697,031 | 2,896,875 | - | - | 9,593,906 |
|
|
|
|
|
|
|
|
|
|
|
|
|
|
|
|
|
|
|
|
|
|
|
|
|
|
| Multi-Line Insurance - 0.58% |
|
|
|
|
|
- | - | 38,650 | - | 38,650 | American International Group, Inc. | - | - | 1,671,613 | - | 1,671,613 |
- | 28,100 | 5,900 | - | 34,000 | Hartford Financial Services Group, Inc. (The) | - | 2,129,137 | 447,043 | - | 2,576,180 |
|
|
|
|
|
| - | 2,129,137 | 2,118,656 | - | 4,247,793 |
The accompanying notes are an integral part of the pro forma financial statements.
JOHN HANCOCK FUNDS RAINIER GROWTH FUND |
|
|
|
|
|
|
| |||
JOHN HANCOCK FUNDS CORE EQUITY FUND |
|
|
|
|
|
|
| |||
JOHN HANCOCK FUNDS GROWTH TRENDS FUND |
|
|
|
|
|
|
| |||
JOHN HANCOCK FUNDS TECHNOLOGY FUND |
|
|
|
|
|
|
| |||
PRO FORMA COMBINING SCHEDULE OF INVESTMENTS - MARCH 31, 2008 (Unaudited) |
|
|
|
|
| |||||
(showing percentage of combined pro forma total net assets) |
|
|
|
|
|
|
| |||
|
|
|
|
|
|
|
|
|
|
|
John Hancock | John Hancock | John Hancock | John Hancock | Proforma | Security Description | John Hancock | John Hancock | John Hancock | John Hancock | Proforma Combined |
|
|
|
|
|
|
|
|
|
|
|
Shares or Principal Amount | Security Description | Value | ||||||||
|
|
|
|
|
|
|
|
|
|
|
|
|
|
|
|
|
|
|
|
|
|
|
|
|
|
| Multi-Utilities - 0.30% |
|
|
|
|
|
- | 54,800 | - | - | 54,800 | Public Service Enterprise Group, Inc. | - | 2,202,412 | - | - | 2,202,412 |
|
|
|
|
|
|
|
|
|
|
|
|
|
|
|
|
|
|
|
|
|
|
|
|
|
|
| Oil & Gas Drilling - 1.36% |
|
|
|
|
|
78,225 | 25,200 | - | - | 103,425 | Noble Corp. | 3,885,436 | 1,251,684 | - | - | 5,137,120 |
35,458 | - | - | - | 35,458 | Transocean, Inc.* | 4,793,922 |
| - | - | 4,793,922 |
|
|
|
|
|
| 8,679,358 | 1,251,684 | - | - | 9,931,042 |
|
|
|
|
|
|
|
|
|
|
|
|
|
|
|
| Oil & Gas Equipment & Services - 2.99% |
|
|
|
|
|
34,475 | - | - | - | 34,475 | Compagnie Generale de Geophysique-Veritas, SADR* | 1,706,857 | - | - | - | 1,706,857 |
82,550 | 56,100 | - | - | 138,650 | Halliburton Co. | 3,246,691 | 2,206,413 | - | - | 5,453,104 |
77,575 | 33,900 | - | - | 111,475 | National-Oilwell Varco, Inc.* | 4,528,828 | 1,979,082 | - | - | 6,507,910 |
44,600 | - | - | - | 44,600 | Schlumberger, Ltd. | 3,880,200 | - | - | - | 3,880,200 |
59,025 | - | - | - | 59,025 | Weatherford International, Ltd.* | 4,277,542 | - | - | - | 4,277,542 |
|
|
|
|
|
| 17,640,118 | 4,185,495 | - | - | 21,825,613 |
|
|
|
|
|
|
|
|
|
|
|
|
|
|
|
| Oil & Gas Exploration & Production - 1.39% |
|
|
|
|
|
- | 31,600 | - | - | 31,600 | Devon Energy Corp. | - | 3,296,828 | - | - | 3,296,828 |
- | 20,800 | - | - | 20,800 | Noble Energy, Inc. | - | 1,514,240 | - | - | 1,514,240 |
95,375 | - | - | - | 95,375 | Pioneer Natural Resources Co. | 4,684,820 | - | - | - | 4,684,820 |
- | 19,000 | - | - | 19,000 | W & T Offshore, Inc. | - | 648,090 | - | - | 648,090 |
|
|
|
|
|
| 4,684,820 | 5,459,158 | - | - | 10,143,978 |
|
|
|
|
|
|
|
|
|
|
|
|
|
|
|
| Oil & Gas Refining & Marketing - 0.21% |
|
|
|
|
|
- | 41,500 | - | - | 41,500 | Tesoro Corp. | - | 1,245,000 | - | - | 1,245,000 |
- | 6,500 | - | - | 6,500 | Valero Energy Corp. | - | 319,215 | - | - | 319,215 |
|
|
|
|
|
| - | 1,564,215 | - | - | 1,564,215 |
|
|
|
|
|
|
|
|
|
|
|
|
|
|
|
| Other Diversified Financial Services - 1.50% |
|
|
|
|
|
- | - | 29,614 | - | 29,614 | Citigroup, Inc. | - | - | 634,332 | - | 634,332 |
- | 160,500 | 3,900 | - | 164,400 | JPMorgan Chase & Co. | - | 6,893,475 | 167,505 | - | 7,060,980 |
48,975 | - | 2,887 | - | 51,862 | Visa, Inc. (Class A)* | 3,054,081 | - | 180,033 | - | 3,234,114 |
|
|
|
|
|
| 3,054,081 | 6,893,475 | 981,870 | - | 10,929,426 |
|
|
|
|
|
|
|
|
|
|
|
|
|
|
|
| Personal Products - 0.11% |
|
|
|
|
|
- | 25,900 | - | - | 25,900 | NBTY, Inc. | - | 775,705 | - | - | 775,705 |
|
|
|
|
|
|
|
|
|
|
|
|
|
|
|
|
|
|
|
|
|
|
|
|
|
|
| Pharmaceuticals - 4.55% |
|
|
|
|
|
94,000 | - | 12,906 | - | 106,906 | Abbott Laboratories | 5,184,100 | - | 711,766 | - | 5,895,866 |
90,925 | - | - | - | 90,925 | Allergan, Inc. | 5,127,260 | - | - | - | 5,127,260 |
- | 75,200 | - | - | 75,200 | Bristol-Myers Squibb Co. | - | 1,601,760 | - | - | 1,601,760 |
- | - | 23,834 | - | 23,834 | Dr. Reddy's Laboratories Lrd., ADR | - | - | 345,116 | - | 345,116 |
- | 40,700 | - | - | 40,700 | Endo Pharmaceuticals Holdings, Inc. | - | 974,358 | - | - | 974,358 |
- | - | 19,901 | - | 19,901 | Johnson & Johnson | - | - | 1,290,978 | - | 1,290,978 |
94,700 | 96,800 | 5,362 | - | 196,862 | Merck & Co., Inc. | 3,593,865 | 3,673,560 | 203,488 | - | 7,470,913 |
- | 46,000 | - | - | 46,000 | Novartis AG | - | 2,356,580 | - | - | 2,356,580 |
- | - | 13,967 | - | 13,967 | OSI Pharmaceuticals, Inc. | - | - | 522,226 | - | 522,226 |
- | 29,100 | 14,129 | - | 43,229 | Pfizer, Inc. | - | 609,063 | 295,720 | - | 904,783 |
- | - | 2,260 | - | 2,260 | Roche Holding AG | - | - | 425,942 | - | 425,942 |
- | 212,100 | - | - | 212,100 | Schering-Plough Corp. | - | 3,056,361 | - | - | 3,056,361 |
- | - | 7,166 | - | 7,166 | Stada Arzneimittel AG | - | - | 522,303 | - | 522,303 |
47,825 | - |
| - | 47,825 | Teva Pharmaceutical Ind's Ltd., SADR* | 2,209,037 | - | - | - | 2,209,037 |
- | - | 62,185 | - | 62,185 | Tongjitang Chinese Medicines Co., ADR | - | - | 511,161 | - | 511,161 |
|
|
|
|
|
| 16,114,262 | 12,271,682 | 4,828,699 | - | 33,214,643 |
|
|
|
|
|
|
|
|
|
|
|
|
|
|
|
| Property & Casualty Insurance - 0.52% |
|
|
|
|
|
- | 30,900 | 10,882 | - | 41,782 | ACE Ltd. | - | 1,701,354 | 599,163 | - | 2,300,517 |
- | 39,500 | - | - | 39,500 | Axis Capital Holdings, Ltd. | - | 1,342,210 | - | - | 1,342,210 |
- | - | 9,700 | - | 9,700 | Progressive Corp. | - | - | 155,879 | - | 155,879 |
|
|
|
|
|
| - | 3,043,564 | 755,042 | - | 3,798,606 |
|
|
|
|
|
|
|
|
|
|
|
|
|
|
|
| Railroads - 0.88% |
|
|
|
|
|
- | 20,400 | - | - | 20,400 | Burlington Northern Santa Fe Corp. | - | 1,881,288 | - | - | 1,881,288 |
68,075 | 15,400 | - | - | 83,475 | Norfolk Southern Corp. | 3,697,834 | 836,528 | - | - | 4,534,362 |
|
|
|
|
|
| 3,697,834 | 2,717,816 | - | - | 6,415,650 |
|
|
|
|
|
|
|
|
|
|
|
|
|
|
|
| Reinsurance - 0.41% |
|
|
|
|
|
- | - | 100 | - | 100 | Berkshire Hathaway, Inc. (Class B) | - | - | 447,290 | - | 447,290 |
- | 13,300 | - | - | 13,300 | Everest Re Group, Ltd. | - | 1,190,749 | - | - | 1,190,749 |
- | - | 14,350 | - | 14,350 | PartnerRe, Ltd. | - | - | 1,094,905 | - | 1,094,905 |
- | - | 7,800 | - | 7,800 | Platinum Underwriters Holdings, Ltd. | - | - | 253,188 | - | 253,188 |
|
|
|
|
|
| - | 1,190,749 | 1,795,383 | - | 2,986,132 |
|
|
|
|
|
|
|
|
|
|
|
|
|
|
|
| Semiconductor Equipment - 0.96% |
|
|
|
|
|
- | - | - | 136,000 | 136,000 | 02Micro International Ltd., ADR | - | - | - | 1,051,280 | 1,051,280 |
- | 21,400 | - | - | 21,400 | Applied Materials, Inc. | - | 417,514 | - | - | 417,514 |
- | - | - | 662,172 | 662,172 | Credence Systems Corp. | - | - | - | 1,125,692 | 1,125,692 |
- | - | 33,000 | 201,200 | 234,200 | Mattson Technology, Inc. | - | - | 200,970 | 1,225,308 | 1,426,278 |
- | - | - | 243,000 | 243,000 | Teradyne, Inc. | - | - | - | 3,018,060 | 3,018,060 |
|
|
|
|
|
| - | 417,514 | 200,970 | 6,420,340 | 7,038,824 |
|
|
|
|
|
|
|
|
|
|
|
The accompanying notes are an integral part of the pro forma financial statements.
JOHN HANCOCK FUNDS RAINIER GROWTH FUND |
|
|
|
|
|
|
| |||
JOHN HANCOCK FUNDS CORE EQUITY FUND |
|
|
|
|
|
|
| |||
JOHN HANCOCK FUNDS GROWTH TRENDS FUND |
|
|
|
|
|
|
| |||
JOHN HANCOCK FUNDS TECHNOLOGY FUND |
|
|
|
|
|
|
| |||
PRO FORMA COMBINING SCHEDULE OF INVESTMENTS - MARCH 31, 2008 (Unaudited) |
|
|
|
|
| |||||
(showing percentage of combined pro forma total net assets) |
|
|
|
|
|
|
| |||
|
|
|
|
|
|
|
|
|
|
|
John Hancock | John Hancock | John Hancock | John Hancock | Proforma | Security Description | John Hancock | John Hancock | John Hancock | John Hancock | Proforma Combined |
|
|
|
|
|
|
|
|
|
|
|
Shares or Principal Amount | Security Description | Value | ||||||||
|
|
|
|
|
|
|
|
|
|
|
|
|
|
|
| Semiconductors - 3.14% |
|
|
|
|
|
- | 26,400 | - | - | 26,400 | Cypress Semiconductor Corp. | - | 623,304 | - | - | 623,304 |
- | - | 18,773 | 117,100 | 135,873 | Fairchild Semiconductor International, Inc. | - | - | 223,774 | 1,395,832 | 1,619,606 |
- | - | - | 128,000 | 128,000 | Integrated Device Technology, Inc. | - | - | - | 1,143,040 | 1,143,040 |
183,175 | 153,700 | 71,500 | 351,250 | 759,625 | Intel Corp. | 3,879,646 | 3,255,366 | 1,514,370 | 7,439,475 | 16,088,857 |
62,050 | - | - | - | 62,050 | Intersil Corp. | 1,592,824 | - | - | - | 1,592,824 |
94,050 | - | - | - | 94,050 | NVIDIA Corp.* | 1,861,250 | - | - | - | 1,861,250 |
|
|
|
|
|
| 7,333,720 | 3,878,670 | 1,738,144 | 9,978,347 | 22,928,881 |
|
|
|
|
|
|
|
|
|
|
|
|
|
|
|
| Soft Drinks - 1.43% |
|
|
|
|
|
100,400 | 44,100 | - | - | 144,500 | PepsiCo, Inc. | 7,248,880 | 3,184,020 |
|
| 10,432,900 |
|
|
|
|
|
|
|
|
|
|
|
|
|
|
|
|
|
|
|
|
|
|
|
|
|
|
| Specialized Finance - 1.44% |
|
|
|
|
|
- | - | 3,366 | - | 3,366 | Interactive Brokers Group, Inc. (Class A) | - | - | 86,405 | - | 86,405 |
47,325 |
| - | - | 47,325 | IntercontinentalExchange, Inc.* | 6,175,913 | - | - | - | 6,175,913 |
- | 52,300 | 13,412 | - | 65,712 | Nasdaq Stock Market, Inc. | - | 2,021,918 | 518,508 | - | 2,540,426 |
- | 16,000 | 3,043 | - | 19,043 | Nymex Holdings, Inc. | - | 1,450,080 | 275,787 | - | 1,725,867 |
|
|
|
|
|
| 6,175,913 | 3,471,998 | 880,700 | - | 10,528,611 |
|
|
|
|
|
|
|
|
|
|
|
|
|
|
|
| Specialized Reits - 0.12% |
|
|
|
|
|
- | 5,100 | - | - | 5,100 | Public Storage, Inc. | - | 451,962 | - | - | 451,962 |
- | 10,100 | - | - | 10,100 | Ventas, Inc. | - | 453,591 | - | - | 453,591 |
|
|
|
|
|
| - | 905,553 | - | - | 905,553 |
|
|
|
|
|
|
|
|
|
|
|
|
|
|
|
| Systems Software - 8.59% |
|
|
|
|
|
85,625 | - | 14,350 | 90,500 | 190,475 | Adobe Systems, Inc.* | 3,047,394 | - | 510,717 | 3,220,895 | 6,779,006 |
- | - | 8,438 | 53,250 | 61,688 | BMC Software, Inc. | - | - | 274,404 | 1,731,690 | 2,006,094 |
- | 63,700 | - | - | 63,700 | Check Point Software Technologies, Ltd. | - | 1,426,880 | - | - | 1,426,880 |
- | - | - | 85,000 | 85,000 | JDA Software Group, Inc. | - | - | - | 1,551,250 | 1,551,250 |
- | - | 14,000 | 88,900 | 102,900 | McAfee, Inc. | - | - | 463,260 | 2,941,701 | 3,404,961 |
231,475 | 239,000 | 122,050 | 476,800 | 1,069,325 | Microsoft Corp. | 6,569,261 | 6,782,820 | 3,463,779 | 13,531,584 | 30,347,444 |
321,675 | 144,700 | 62,600 | 302,800 | 831,775 | Oracle Corp.* | 6,291,963 | 2,830,332 | 1,224,456 | 5,922,768 | 16,269,519 |
22,350 | - | - | - | 22,350 | VMware, Inc. (Class. A)* | 957,027 | - | - | - | 957,027 |
|
|
|
|
|
| 16,865,645 | 11,040,032 | 5,936,615 | 28,899,888 | 62,742,180 |
|
|
|
|
|
|
|
|
|
|
|
|
|
|
|
| Technology Distributors - 1.74% |
|
|
|
|
|
- | 26,700 | 11,450 | 73,350 | 111,500 | Arrow Electronics, Inc. | - | 898,455 | 385,293 | 2,468,228 | 3,751,975 |
- | 29,100 | - | 52,300 | 81,400 | Avnet, Inc. | - | 952,443 | - | 1,711,779 | 2,664,222 |
- | - | 23,453 | 144,500 | 167,953 | Ingram Micro, Inc. (Class A) | - | - | 371,261 | 2,287,435 | 2,658,696 |
- | - | 15,700 | 95,300 | 111,000 | Tech Data Corp. | - | - | 514,960 | 3,125,840 | 3,640,800 |
|
|
|
|
|
| - | 1,850,898 | 1,271,513 | 9,593,282 | 12,715,693 |
|
|
|
|
|
|
|
|
|
|
|
|
|
|
|
| Tobacco - 0.94% |
|
|
|
|
|
- | 79,100 | - | - | 79,100 | Altria Group, Inc. | - | 1,756,020 | - | - | 1,756,020 |
- | 14,800 | - | - | 14,800 | Loews Corp. - Carolina Group | - | 1,073,740 | - | - | 1,073,740 |
- | 79,100 | - | - | 79,100 | Philip Morris International | - | 4,000,878 | - | - | 4,000,878 |
|
|
|
|
|
| - | 6,830,638 | - | - | 6,830,638 |
|
|
|
|
|
|
|
|
|
|
|
|
|
|
|
| Trading Companies & Distributors - 0.16% |
|
|
|
|
|
- | 15,000 | - | - | 15,000 | W. W. Grainger, Inc. | - | 1,145,850 | - | - | 1,145,850 |
|
|
|
|
|
|
|
|
|
|
|
|
|
|
|
|
|
|
|
|
|
|
|
|
|
|
| Wireless Telecommunication Services - 1.13% |
|
|
|
|
|
78,725 | - | - | - | 78,725 | America Movil S.A.B. de C.V., ADR | 5,013,995 | - | - | - | 5,013,995 |
- | - | 10,900 | 68,000 | 78,900 | NII Holdings, Inc. | - | - | 346,402 | 2,161,040 | 2,507,442 |
- | - | - | 785,730 | 785,730 | Airspan Networks, Inc. | - | - | - | 738,586 | 738,586 |
|
|
|
|
|
| 5,013,995 | - | 346,402 | 2,899,626 | 8,260,023 |
|
|
|
|
| TOTAL COMMON STOCKS |
|
|
|
|
|
|
|
|
|
| (cost $715,297,930) | 294,779,851 | 222,127,939 | 58,390,624 | 138,852,309 | 714,150,724 |
|
|
|
|
|
|
|
|
|
|
|
|
|
|
|
|
| 294,779,851 | 222,127,939 | 58,390,624 | 138,852,309 | 714,150,724 |
|
|
|
|
| PREFERRED STOCKS - 0.04% | - | - | - | - | - |
|
|
|
|
| Health Care Equipment - 0.04% |
|
|
|
|
|
- | - | - | 500,000 | 500,000 | SerOptix, Inc. | - | - | - | 150,000 | 150,000 |
- | - | - | 500,000 | 500,000 | SerOptix, Inc. | - | - | - | 125,000 | 125,000 |
|
|
|
|
|
| - | - | - | 275,000 | 275,000 |
|
|
|
|
|
|
|
|
|
|
|
|
|
|
|
| TOTAL PREFERRED STOCKS |
|
|
|
|
|
|
|
|
|
| (cost $1,166,667) | - | - | - | 275,000 | 275,000 |
|
|
|
|
|
|
|
|
|
|
|
|
|
|
|
| SHORT TERM INVESTMENTS - 1.67% |
|
|
|
|
|
|
|
|
|
| Commercial Paper - 1.65% |
|
|
|
|
|
12,085,000 | - | - | - | 12,085,000 | Starbucks Co., 3.30%, 04/01/2008 | 12,085,000 | - | - | - | 12,085,000 |
|
|
|
|
|
|
|
|
|
|
|
|
|
|
|
| Variable Rate Demand Notes - 0.02%** |
|
|
|
|
|
163,165 | - | - | - | 163,165 | Wiscoonsin Corp. Central Union, 4.869% | 163,165 | - | - | - | 163,165 |
|
|
|
|
|
|
|
|
|
|
|
|
|
|
|
| TOTAL SHORT-TERM INVESTMENTS |
|
|
|
|
|
|
|
|
|
| (cost $12,248,165) | 12,248,165 | - | - | - | 12,248,165 |
|
|
|
|
|
|
|
|
|
|
|
|
|
|
|
| JOINT REPURCHASE AGREEMENTS - 1.25% |
|
|
|
|
|
- | 613,000 | - | - | 613,000 | Joint Repurchase Agreement with Barclays Plc dated 03/31/2008 at 1.450% to be repurchased at $613,025 on 04/01/2008, collateralized by $514,806 U.S. Treasury Inflation Indexed Bond, 2.375%, due 01/15/2025 (valued at $625,260, including interest) | - | 613,000 | - | - | 613,000 |
|
|
|
|
|
|
|
|
|
|
|
The accompanying notes are an integral part of the pro forma financial statements.
JOHN HANCOCK FUNDS RAINIER GROWTH FUND |
|
|
|
|
|
|
| |||
JOHN HANCOCK FUNDS CORE EQUITY FUND |
|
|
|
|
|
|
| |||
JOHN HANCOCK FUNDS GROWTH TRENDS FUND |
|
|
|
|
|
|
| |||
JOHN HANCOCK FUNDS TECHNOLOGY FUND |
|
|
|
|
|
|
| |||
PRO FORMA COMBINING SCHEDULE OF INVESTMENTS - MARCH 31, 2008 (Unaudited) |
|
|
|
|
| |||||
(showing percentage of combined pro forma total net assets) |
|
|
|
|
|
|
| |||
|
|
|
|
|
|
|
|
|
|
|
John Hancock | John Hancock | John Hancock | John Hancock | Proforma | Security Description | John Hancock | John Hancock | John Hancock | John Hancock | Proforma |
|
|
|
|
|
|
|
|
|
|
|
Shares or Principal Amount | Security Description | Value | ||||||||
|
|
|
|
|
|
|
|
|
|
|
- | - | 7,670,000 | - | 7,670,000 | Joint Repurchase Agreement with Barclays Plc dated 03/31/2008 at 1.450% to be repurchased at $7,670,309 on 04/01/2008, collateralized by $6,441,373 U.S. Treasury Inflation Indexed Bond, 2.375%, due 01/15/2025 (valued at $7,823,400, including interest) | - | - | 7,670,000 | - | 7,670,000 |
|
|
|
|
|
|
|
|
|
|
|
- | - | - | 879,000 | 879,000 | Joint Repurchase Agreement with Barclays Plc dated 03/31/2008 at 1.450% to be repurchased at $879,035 on 04/01/2008, collateralized by $738,196 U.S. Treasury Inflation Indexed Bond, 2.375%, due 01/15/2025 (valued at $896,580, including interest) | - | - | - | 879,000 | 879,000 |
|
|
|
|
|
|
|
|
|
|
|
|
|
|
|
| TOTAL REPURCHASE AGREEMENTS |
|
|
|
|
|
|
|
|
|
| (cost $9,162,000) | - | 613,000 | 7,670,000 | 879,000 | 9,162,000 |
|
|
|
|
|
|
|
|
|
|
|
|
|
|
|
|
|
|
|
|
|
|
|
|
|
|
|
|
|
|
|
|
|
|
|
|
|
|
|
|
|
|
|
|
|
|
|
|
| Total Investments (Cost $737,874,762) - 100.73% | 307,028,016 | 222,740,939 | 66,060,624 | 140,006,310 | 735,835,889 |
|
|
|
|
| Other Assets and Liabilities, Net - (0.73)% | (6,798,389) | (250,939) | 274,902 | 1,412,099 | (5,362,327) |
|
|
|
|
| TOTAL NET ASSETS - 100.00% | 300,229,627 | 222,490,000 | 66,335,526 | 141,418,409 | 730,473,562 |
|
|
|
|
|
|
|
|
|
|
|
|
|
|
|
| ADR - American Depositary Receipt |
|
|
|
|
|
|
|
|
|
| SADR - Sponsored American Depositary Receipt |
|
|
|
|
|
|
|
|
|
| * Non-Income Producing |
|
|
|
|
|
|
|
|
|
| ** The variable -rate securities are subject to a demand feature, which reduces the remaining maturity. |
|
|
|
|
|
The accompanying notes are an integral part of the pro forma financial statements.
PART C
OTHER INFORMATION
ITEM 15. | INDEMNIFICATION |
No change from the information set forth in Item 25 of the most recently filed Registration Statement of John Hancock Funds III (“Registrant”) on Form N-1A under the 1933 Act and the 1940 Act (File Nos. 333-140210 and 811-21777) as filed with the Securities and Exchange Commission (the “SEC”) on June 27, 2007 (accession no. 0001010521-07-000572), which information is incorporated herein by reference.
ITEM 16. | EXHIBITS |
Exhibit | Exhibit Description | Note | |||
(1)(a) | Amended and Restated Declaration of Trust dated August 12, 2005. | (1) | |||
(2) | By-Laws dated June 9, 2005. | (2) | |||
(3) | Not applicable. |
| |||
(4) | Form of Agreement and Plan of Reorganization. | (+) | |||
(5) | Instruments Defining Rights of Security Holders, see Exhibits (1) and (2). |
| |||
(6)(a) | Advisory Agreement between John Hancock Funds III and John Hancock Investment Management Services, LLC (“JHIMS”). | (1) | |||
(6)(b) | Amendment to Advisory Agreement between the Registrant and John Hancock Investment Management Services, LLC. | (3) | |||
(6)(c) | Subadvisory Agreement between JHIMS and Rainier Investment Management Services, Inc. (“Rainier”). | (4) | |||
_________________________
1 Incorporated by reference to an exhibit filed with pre-effective amendment no. 2 to Registrant’s Registration Statement on Form N-1A (File Nos. 333-125838 and 811-21777), as filed with the SEC on September 2, 2005 (Accession No. 0000898432-05-000776).
2 Incorporated by reference to an exhibit filed with Registrant’s Registration Statement on Form N-1A (File Nos. 333-125838 and 811-21777), as filed with the SEC on June 15, 2005 (Accession No. 0000898432-05-000492).
+ Filed herewith as Exhibit A to the Proxy Statement and Prospectus included in Part A of this Registration Statement.
3 Incorporated by reference to an exhibit filed with post-effective amendment no. 7 to Registrant’s Registration Statement on Form N-1A (File Nos. 333-125838 and 811-21777), as filed with the SEC on March 14, 2008 (Accession No. 0000950135-08-001781).
4 Incorporated by reference to an exhibit filed with post-effective amendment no. 8 to Registrant’s Registration Statement on Form N-1A (File Nos. 333-125838 and 811-21777), as filed with the SEC on May 18, 2008 (Accession No. 0000950135-08-003822).
Exhibit | Exhibit Description | Note |
(7) | Distribution Agreement between John Hancock Funds, LLC and Registrant. | (1) |
(8) | Not applicable. |
|
(9) | Custody Agreement between Registrant and State Street Bank & Trust Co. | (1) |
(10)(a) | Classes A, B, and C Distribution Plans between the Fund and John Hancock Funds, LLC dated September 2, 2005, as amended December 13, 2006. | (5) |
(10)(b) | John Hancock Funds Class A, Class B, Class C and Class I Multiple Class Plan pursuant to Rule 18f-3. | (5) |
(11) | Opinion and Consent of Counsel. | (#) |
(12) | Form of Opinion as to Tax Matters and Consent. | (#) |
(13)(a) | Transfer Agency Agreement. | (6) |
(13)(b) | Expense Limitation Agreement. | (#) |
(14) | Consents of Independent Registered Public Accounting Firms. | (#) |
(15) | Not applicable. |
|
(16) | Powers of Attorney. | (#) |
(17)(a) | Code of Ethics of JHIMS, MFC, and each John Hancock open-end and closed-end fund dated January 1, 2008. | (6) |
(17)(b) | Code of Ethics of Rainier. | (6) |
(17)(c) | Form of Proxy Card. | (#) |
Item 17. | Undertakings. |
(1) The undersigned registrant agrees that prior to any public reoffering of the securities registered through the use of a prospectus which is a part of this Registration Statement by any person or party who is deemed to be an underwriter within the meaning of Rule 145(c) under the Securities Act of 1933, as amended (the “1933 Act”), the reoffering prospectus will contain the information called for by the applicable registration form for reofferings by persons who may be deemed underwriters, in addition to the information called for by the other items of the applicable form.
(2) The undersigned registrant agrees that every prospectus that is filed under paragraph (1) above will be filed as a part of an amendment to the registration statement and will not be used until the amendment is effective, and that, in determining any liability under the 1933 Act, each post-effective
_________________________
5 Incorporated by reference to an exhibit filed with post-effective amendment no. 3 to Registrant’s Registration Statement on Form N-1A (File Nos. 333-125838 and 811-21777), as filed with the SEC on December 15, 2006 (Accession No. 0001010521-06-000969).
# Filed herewith.
6 Incorporated by reference to an exhibit filed with post-effective amendment no. 5 to Registrant’s Registration Statement on Form N-1A (File Nos. 333-125838 and 811-21777), as filed with the SEC on January 16, 2008 (Accession No. 0000950135-08-000181).
amendment shall be deemed to be a new Registration Statement for the securities offered therein, and the offering of the securities at that time shall be deemed to be the initial bona fide offering of them.
(3) The undersigned registrant agrees that a final form of the Opinion and Consent of Kirkpatrick & Lockhart Preston Gates Ellis LLP regarding certain tax matters and consequences to shareholders discussed in the Combined Proxy Statement and Prospectus will be filed in a post-effective amendment to this registration statement.
NOTICE
A copy of the Amended and Restated Declaration of Trust of John Hancock Funds III is on file with the Secretary of State of the Commonwealth of Massachusetts and notice is hereby given that this instrument is executed on behalf of the Registrant by an officer of the Registrant as an officer and not individually and that the obligations of or arising out of this instrument are not binding upon any of the Trustees, officers or shareholders individually, but are binding only upon the assets and property of the Registrant.
SIGNATURES
As required by the Securities Act of 1933, this registration statement has been signed on behalf of the Registrant, in the City of Boston and Commonwealth of Massachusetts on the 21st day of July 2008.
John Hancock Funds III
By: /s/ Keith F. Hartstein*
Name: Keith F. Hartstein
Title: President and Chief Executive Officer
As required by the Securities Act of 1933, this registration statement has been signed by the following persons in the capacities and on the dates indicated:
Signature | Title | Date |
/s/ Keith F. Hartstein* | President and Chief Executive Officer | July 21, 2008 |
Keith F. Hartstein |
|
|
|
|
|
/s/ Gordon M. Shone* | Treasurer (Chief Accounting Officer) | July 21, 2008 |
Gordon M. Shone |
|
|
|
|
|
/s/ James R. Boyle* | Trustee | July 21, 2008 |
James R. Boyle |
|
|
|
|
|
/s/ James F. Carlin* | Trustee | July 21, 2008 |
James F. Carlin |
|
|
|
|
|
/s/ William H. Cunningham* | Trustee | July 21, 2008 |
William H. Cunningham |
|
|
/s/ Charles L. Ladner* | Trustee | July 21, 2008 |
Charles L. Ladner |
|
|
|
|
|
/s/ John A. Moore* | Trustee | July 21, 2008 |
John A. Moore |
|
|
|
|
|
/s/ Patti McGill Peterson* | Trustee | July 21, 2008 |
Patti McGill Peterson |
|
|
|
|
|
/s/ Steven R. Pruchansky* | Trustee | July 21, 2008 |
Steven R. Pruchansky |
|
|
*By: | /s/ David D. Barr |
David D. Barr
Attorney-In-Fact, under
Power of Attorney dated
June 10, 2008
EXHIBIT INDEX
Exhibit No. | Description |
(4) | Form of Agreement and Plan of Reorganization (filed as Exhibit A to the Proxy Statement and Prospectus included in Part A of this Registration Statement). |
(11) | Opinion and Consent of Counsel. |
(12) | Form of Opinion as to Tax Matters and Consent. |
(13)(b) | Expense Limitation Agreement. |
(14) | Consents of Independent Registered Public Accounting Firms. |
(16) | Powers of Attorney. |
(17)(c) | Form of Proxy Card. |