UNITED STATES
SECURITIES AND EXCHANGE COMMISSION
Washington, D.C. 20549
FORM N-CSR
CERTIFIED SHAREHOLDER REPORT OF REGISTERED
MANAGEMENT INVESTMENT COMPANIES
Investment Company Act file number 811-21777
John Hancock Funds III
(Exact name of registrant as specified in charter)
601 Congress Street, Boston, Massachusetts 02210
(Address of principal executive offices) (Zip code)
Salvatore Schiavone
Treasurer
601 Congress Street
Boston, Massachusetts 02210
(Name and address of agent for service)
Registrant's telephone number, including area code: 617-663-4497
| Date of fiscal year end: | February 28 |
| Date of reporting period: | August 31, 2015 |
ITEM 1. REPORTS TO SHAREHOLDERS.
John Hancock
International Core Fund
Semiannual report 8/31/15


A message to shareholders
Dear shareholder,
The global financial markets were especially rocky in mid-2015. The pullback we had anticipated for some months took place in August, and U.S. equities experienced their first official correction—a decline of more than 10% in the stock market—in more than four years. Fixed-income securities fared better than stocks but remain roughly flat for the year to date. There were several headwinds restraining stock prices from moving higher all year, but the trigger for this summer's correction was the news of slowing economic growth in China and the effect that might have on global growth. For the time being, global economic data continues to be a leading driver of markets worldwide.
The asset managers in our network believe, on balance, that investors should stay the course when it comes to U.S. equities. Our economy continues to grow at a healthy pace, driven by strong housing and jobs data, falling commodity prices, solid consumer spending, and low inflation. While the U.S. Federal Reserve (Fed) chose to leave the federal funds rate unchanged at its September meeting, Fed Chair Janet Yellen cited a number of positives in the U.S. economy and signaled that the Fed will likely raise interest rates soon in response to stronger growth. Although market movements are unpredictable, this summer's correction may prove to be not much more than a necessary breather before the market resumes its upward trend.
Introducing John Hancock Multifactor Exchange-Traded Funds (ETFs)
We believe investors benefit from a combination of active and passive strategies in their portfolios. That's why, for years, we've offered actively managed funds to our shareholders, alongside asset allocation portfolios that employ a mix of active and passive strategies. That same thinking is what led us to team up with Dimensional Fund Advisors—a company regarded as one of the pioneers in strategic beta investing—for the launch of the passively managed John Hancock Multifactor ETFs.* Each ETF seeks to track a custom index built upon decades of academic research into the factors that drive higher expected returns: smaller capitalizations, lower valuations, and higher profitability. For nearly 30 years, it's just the kind of time-tested approach we have looked for as a manager of managers. For more information, visit our website at jhinvestments.com/etf.
On behalf of everyone at John Hancock Investments, I'd like to take this opportunity to welcome new shareholders and thank existing shareholders for the continued trust you've placed in us.
Sincerely,

Andrew G. Arnott
President and Chief Executive Officer
John Hancock Investments
This commentary reflects the CEO's views as of August 31, 2015. They are subject to change at any time. For more up-to-date information, you can visit our website at jhinvestments.com.
| * | Strategic beta investing EFTs seek to improve upon cap-weighted strategies by tracking a custom index that combines active management insight with the discipline of a rules-based approach. |
John Hancock
International Core Fund
1
INVESTMENT OBJECTIVE
The fund seeks high total return.
AVERAGE ANNUAL TOTAL RETURNS AS OF 8/31/15 (%)
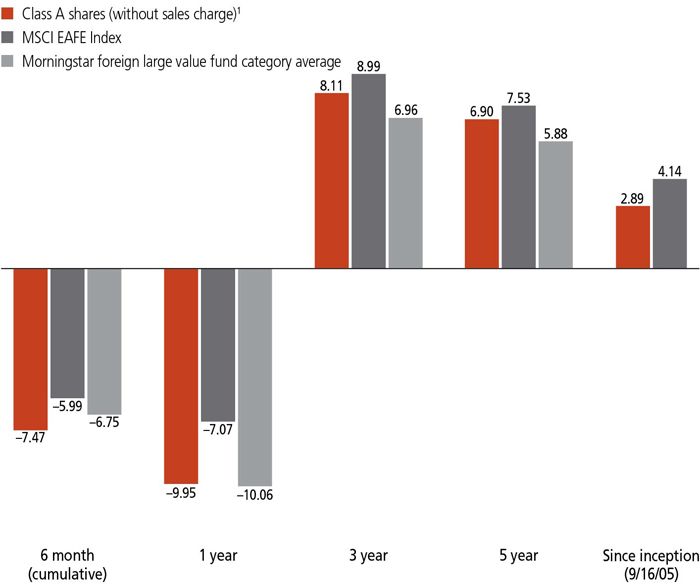
The MSCI EAFE Index (gross of foreign withholding tax on dividends) (Europe, Australasia, Far East) is a free float-adjusted market capitalization index that is designed to measure developed market equity performance, excluding the U.S. and Canada.
It is not possible to invest directly in an index. Index figures do not reflect expenses or sales charges, which would result in lower returns.
Figures from Morningstar, Inc. include reinvested distributions and do not take into account sales charges. Actual load-adjusted performance is lower.
| 1 | On 6-9-06, through a reorganization, the fund acquired all of the assets of the GMO International Disciplined Equity Fund (the predecessor fund). The predecessor fund offered its Class III shares, inception date 9-16-05, in exchange for Class A shares, which were first offered on 6-12-06. The predecessor fund's Class III shares' returns have been recalculated to reflect the gross fees and expenses of Class A shares. |
The past performance shown here reflects reinvested distributions and the beneficial effect of any expense reductions, and does not guarantee future results. Returns for periods shorter than one year are cumulative, and results for other share classes will vary. Shares will fluctuate in value and, when redeemed, may be worth more or less than their original cost. Current performance may be lower or higher than the performance cited, and can be found at jhinvestments.com or by calling 800-225-5291. For further information on the fund's objectives, risks, and strategy, see the fund's prospectuses.
2
PERFORMANCE HIGHLIGHTS OVER THE LAST SIX MONTHS
Global markets declined
Most developed-market stock indexes outside the United States declined amid a challenging global economic environment and low energy prices.
European holdings, energy positions detracted
Overweights in European value stocks and in the energy sector weighed on the fund's relative results.
Positioning in Australia and selected sectors contributed
The fund's underweight in Australia and positioning in the telecommunication services and materials sectors added relative value.
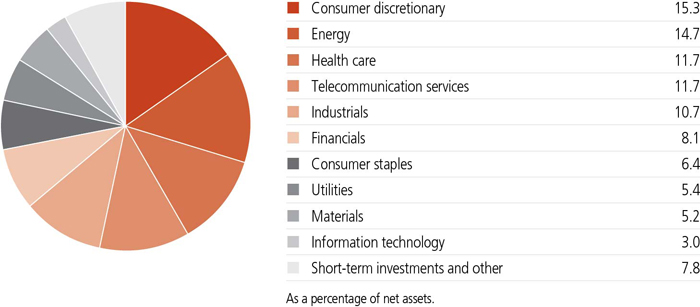
SECTOR COMPOSITION AS OF 8/31/15 (%)
A note about risks
Foreign investing has additional risks, such as currency and market volatility, and political and social instability. Hedging, derivatives, and other strategic transactions may increase volatility and result in losses if not successful. Large company stocks could fall out of favor. The stock prices of midsize and small companies can change more frequently and dramatically than those of large companies. The value of a company's equity securities is subject to changes in the company's financial condition and overall market and economic conditions. Please see the fund's prospectuses for additional risks.
3

David Cowan, Ph.D.
Portfolio Manager
GMO
What factors drove the negative return for the fund's benchmark, the MSCI EAFE Index, during the six-month period?
While the U.S. economy remained strong, economic news from other key developed markets such as Japan and Europe was somewhat disappointing. European markets were shaken by a sovereign debt crisis in Greece, although an eventual deal that the Greek government reached with creditors in July offered a fairly orderly resolution. The negative impact that the Greek crisis had on investor sentiment was mitigated somewhat by the European Central Bank's continued implementation of a program to stimulate markets and the economy through the purchase of sovereign bonds from member countries of the eurozone. Despite this initiative and record-low benchmark lending rates, inflation in the eurozone remained below policymakers' target level. In Japan, the economic initiatives of Prime Minister Shinzo Abe's government failed to yield a significant turnaround in the nation's economy. However, Japanese equities were supported by modest improvement in corporate earnings and economic reforms adopted by the Abe government.
After falling sharply in late 2014, oil prices failed to recover significantly during the period, despite briefly climbing in March. The slump in oil prices and soft prices for most other commodities had a negative impact on most energy and materials stocks, although the reduced energy prices provided a tailwind for the economies of certain energy-importing countries. The outlook for global growth was constrained, in part because of concerns that a growth slowdown in China, an emerging market, could have a negative impact on economic activity in developed markets, particularly Asian trading partners with China, such as Japan. These concerns, and China's devaluation of its currency in August, weighed on developed-market stocks in the latter part of the period.
How did this environment affect the portfolio team's management of the fund?
The market environment generally does not cause us to alter our approach. With its relatively balanced reliance on valuation-based stock selection techniques combined with our top-down assessment, we maintained an approach that we believe makes the fund flexible and responsive to a variety of market conditions. In our view, the constrained economic outlook for many of the
4
The fund underperformed relative to its benchmark. What factors had the most significant negative impact?
The fund's overweight in European value stocks, including U.K. equities, relative to the benchmark weighed on performance, as these equities underperformed their growth-oriented counterparts in the European equity market. Another significant factor was the fund's overweight in energy, one of the worst-performing sectors during the period. The slump in oil prices reduced profitability for many energy companies, and the three holdings that had the largest negative impact on the fund's relative performance were integrated energy firms whose shares declined sharply: Royal Dutch Shell PLC (Netherlands), BP PLC (U.K.), and Total SA (France). Among other individual positions, significant detractors included overweights in automakers Nissan Motor Co., Ltd. (Japan) and Renault SA (France). At the country level, our stock selection in France and Germany significantly detracted from relative performance.
What factors contributed to the fund's relative performance?
At the country level, the fund's underweight in Australian equities contributed to relative results, as the Australian equity market underperformed. The slump in commodity prices weighed on Australia's prominent commodities producers and on its economy more broadly.
TOP 10 HOLDINGS AS OF 8/31/15 (%)
| Total SA | 4.0 |
| Valeant Pharmaceuticals International, Inc. | 3.5 |
| AstraZeneca PLC | 3.2 |
| BP PLC | 3.0 |
| Nissan Motor Company, Ltd. | 2.6 |
| GlaxoSmithKline PLC | 2.3 |
| Telefonica SA | 2.3 |
| Royal Dutch Shell PLC, A Shares | 2.3 |
| BASF SE | 2.2 |
| Vodafone Group PLC | 2.2 |
| TOTAL | 27.6 |
| As a percentage of net assets. | |
| Cash and cash equivalents are not included. | |
5
At the sector level, the fund's overweight in telecommunication services and our stock selection within the sector significantly aided relative results. Within materials, our stock selection and the fund's underweight had a positive impact on returns compared with the benchmark.
Among the individual positions that significantly contributed were overweights in Nippon Telegraph & Telephone Corp. (Japan), Valeant Pharmaceuticals International, Inc. (Canada), and telecommunications company Vodafone Group PLC (U.K.).
How was the fund positioned at the end of the period?
As has been the case for several years, we continue to favor European value stocks in the international market, owing to valuations that we find attractive. At the end of the period, this positioning left the portfolio significantly overweight in the energy, telecommunication services, consumer discretionary, and utilities sectors.
The fund's overweight in energy stems in part from our view that recent share price declines within the sector have left many energy stocks with attractive valuations. As a result, three of the fund's top 10 largest equity positions at the end of the period were in energy companies: Total, BP, and Royal Dutch Shell.
The most significant underweight at the sector level was in financials. By country, the fund was overweight in France, the United Kingdom, Germany, Italy, and Spain, among others.
TOP 10 COUNTRIES AS OF 8/31/15 (%)
| Japan | 21.3 |
| United Kingdom | 17.4 |
| France | 14.1 |
| Germany | 9.8 |
| Canada | 5.5 |
| Netherlands | 5.1 |
| Spain | 4.1 |
| Italy | 3.4 |
| Switzerland | 2.5 |
| Sweden | 1.6 |
| TOTAL | 84.8 |
| As a percentage of net assets. | |
| Cash and cash equivalents are not included. |
6
Were there any substantive changes in the fund's operations?
The day after the end of the period, effective September 1, 2015, Neil Constable, Ph.D., and Chris Fortson were named portfolio managers of the fund. Thomas R. Hancock, Ph.D., no longer serves as a portfolio manager of the fund. David Cowan, Ph.D., Ben Inker, CFA, and Sam Wilderman, CFA, continue to serve as portfolio managers of the fund.
MANAGED BY
| | David Cowan, Ph.D. On the fund since 2009 Investing since 2006 |
 | Ben Inker, CFA On the fund since 2014 Investing since 1992 |
 | Sam Wilderman, CFA On the fund since 2014 Investing since 1996 |
 | Neil Constable, Ph.D. On the fund since 2015 Investing since 2003 |
 | Chris Fortson On the fund since 2015 Investing since 2006 |
![]()
7
TOTAL RETURNS FOR THE PERIOD ENDED AUGUST 31, 2015
| Average annual total returns (%) with maximum sales charge | Cumulative total returns (%) with maximum sales charge | ||||||||||||||||||||||
| 1-year | 5-year | Since inception | 6-month | 5-year | Since inception | ||||||||||||||||||
| Class A | -14.46 | 5.80 | 2.36 | 1 | -12.10 | 32.59 | 26.15 | 1 | |||||||||||||||
| Class B2 | -15.02 | 5.77 | 2.14 | 1 | -12.46 | 32.37 | 23.47 | 1 | |||||||||||||||
| Class C2 | -11.55 | 6.09 | 2.14 | 1 | -8.77 | 34.38 | 23.49 | 1 | |||||||||||||||
| Class I2,3 | -9.65 | 7.31 | 3.34 | 1 | -7.32 | 42.29 | 38.72 | 1 | |||||||||||||||
| Class R12,3 | -10.32 | 6.50 | 2.59 | 1 | -7.69 | 37.02 | 28.96 | 1 | |||||||||||||||
| Class R22,3 | -10.14 | 6.38 | 2.06 | 1 | -7.59 | 36.21 | 22.46 | 1 | |||||||||||||||
| Class R33 | -10.24 | 6.62 | 6.61 | 4 | -7.64 | 37.76 | 49.51 | 4 | |||||||||||||||
| Class R43 | -9.88 | 7.00 | 6.98 | 4 | -7.45 | 40.26 | 52.80 | 4 | |||||||||||||||
| Class R53 | -9.70 | 7.25 | 7.25 | 4 | -7.36 | 41.93 | 55.20 | 4 | |||||||||||||||
| Class R62,3 | -9.53 | 7.41 | 3.52 | 1 | -7.28 | 42.94 | 41.18 | 1 | |||||||||||||||
| Class 13 | -9.58 | 7.40 | 1.46 | 5 | -7.31 | 42.87 | 13.60 | 5 | |||||||||||||||
| Class NAV3 | -9.54 | 7.44 | 1.86 | 6 | -7.29 | 43.17 | 18.08 | 6 | |||||||||||||||
| Index† | -7.07 | 7.53 | 4.14 | 1 | -5.99 | 43.75 | 49.69 | 1 | |||||||||||||||
Performance figures assume all distributions have been reinvested. Figures reflect maximum sales charges on Class A shares of 5%, and the applicable contingent deferred sales charge (CDSC) on Class B and Class C shares. The Class B shares' CDSC declines annually between years 1 to 6 according to the following schedule: 5%, 4%, 3%, 3%, 2%, 1%. No sales charge will be assessed after the sixth year. Class C shares held for less than one year are subject to a 1% CDSC. Sales charges are not applicable to Class I, Class R1, Class R2, Class R3, Class R4, Class R5, Class R6, Class 1, and Class NAV shares.
The expense ratios of the fund, both net (including any fee waivers and/or expense limitations) and gross (excluding any fee waivers and/or expense limitations), are set forth according to the most recent publicly available prospectuses for the fund and may differ from those disclosed in the Financial highlights tables in this report. Had the fee waivers and expense limitations not been in place, gross expenses would apply. The expense ratios are as follows:
| Class A | Class B | Class C | Class I | Class R1 | Class R2 | Class R3 | Class R4 | Class R5 | Class R6 | Class 1 | Class NAV | |
| Gross (%) | 1.40 | 2.10 | 2.10 | 1.08 | 1.74 | 1.49 | 1.64 | 1.34 | 1.04 | 0.99 | 1.02 | 0.97 |
| Net (%) | 1.38 | 2.10 | 2.10 | 1.08 | 1.74 | 1.49 | 1.64 | 1.24 | 1.04 | 0.97 | 1.02 | 0.97 |
Please refer to the most recent prospectus and annual or semiannual report for more information on expenses and any expense limitation arrangements for each class.
The returns reflect past results and should not be considered indicative of future performance. The return and principal value of an investment will fluctuate so that shares, when redeemed, may be worth more or less than their original cost. Due to market volatility and other factors, the fund's current performance may be higher or lower than the performance shown. For current to the most recent month-end performance data, please call 800-225-5291 or visit the fund's website at jhinvestments.com.
The performance table above and the chart on the next page do not reflect the deduction of taxes that a shareholder would pay on fund distributions or the redemption of fund shares. The fund's performance results reflect any applicable fee waivers or expense reductions, without which the expenses would increase and results would have been less favorable.
| † | Index is the MSCI EAFE Index. |
See the following page for footnotes.
8
This chart and table show what happened to a hypothetical $10,000 investment in John Hancock International Core Fund for the share classes and periods indicated, assuming all distributions were reinvested. For comparison, we've shown the same investment in the MSCI EAFE Index.
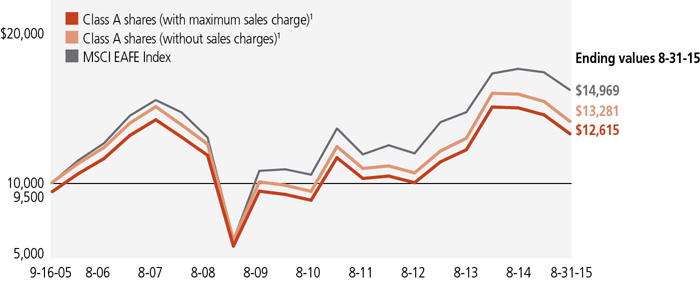
| Start date | With maximum sales charge ($) | Without sales charge ($) | Index ($) | |
| Class B2,7 | 9-16-05 | 12,347 | 12,347 | 14,969 |
| Class C2,7 | 9-16-05 | 12,349 | 12,349 | 14,969 |
| Class I2,3 | 9-16-05 | 13,872 | 13,872 | 14,969 |
| Class R12,3 | 9-16-05 | 12,896 | 12,896 | 14,969 |
| Class R22,3 | 9-16-05 | 12,246 | 12,246 | 14,969 |
| Class R33 | 5-22-09 | 14,951 | 14,951 | 16,609 |
| Class R43 | 5-22-09 | 15,280 | 15,280 | 16,609 |
| Class R53 | 5-22-09 | 15,520 | 15,520 | 16,609 |
| Class R62,3 | 9-16-05 | 14,118 | 14,118 | 14,969 |
| Class 13 | 11-6-06 | 11,360 | 11,360 | 11,905 |
| Class NAV3 | 8-29-06 | 11,808 | 11,808 | 12,504 |
The MSCI EAFE Index (gross of foreign withholding tax on dividends) (Europe, Australasia, Far East) is a free float-adjusted market capitalization index that is designed to measure developed market equity performance, excluding the U.S. and Canada.
It is not possible to invest directly in an index. Index figures do not reflect expenses or sales charges, which would result in lower returns.
Footnotes related to performance pages
| 1 | From 9-16-05. On 6-9-06, through a reorganization, the fund acquired all of the assets of the GMO International Disciplined Equity Fund (the predecessor fund). The predecessor fund offered its Class III shares, inception date 9-16-05, in exchange for Class A shares, which were first offered on 6-12-06. The predecessor fund's Class III shares' returns have been recalculated to reflect the gross fees and expenses of Class A shares. |
| 2 | Class B, Class C, Class I, and Class R1 shares were first offered on 6-12-06; Class R6 shares were first offered on 9-1-11; Class R2 shares were first offered on 3-1-12. Returns prior to these dates are those of Class A shares that have been recalculated to apply the gross fees and expenses of Class B, Class C, Class I, Class R1, Class R6, and Class R2 shares, as applicable. |
| 3 | For certain types of investors, as described in the fund's prospectuses. |
| 4 | From 5-22-09. |
| 5 | From 11-6-06. |
| 6 | From 8-29-06. |
| 7 | The contingent deferred sales charge is not applicable. |
9
These examples are intended to help you understand your ongoing operating expenses of investing in the fund so you can compare these costs with the ongoing costs of investing in other mutual funds.
Understanding fund expenses
As a shareholder of the fund, you incur two types of costs:
| • | Transaction costs, which include sales charges (loads) on purchases or redemptions (varies by share class), minimum account fee charge, etc. |
| • | Ongoing operating expenses, including management fees, distribution and service fees (if applicable), and other fund expenses. |
We are presenting only your ongoing operating expenses here.
Actual expenses/actual returns
This example is intended to provide information about the fund's actual ongoing operating expenses, and is based on the fund's actual return. It assumes an account value of $1,000.00 on March 1, 2015, with the same investment held until August 31, 2015.
| Beginning Account value on 3-1-2015 | Ending value on 8-31-2015 | Expenses paid during period ended 8-31-20151 | Annualized expense ratio | |
| Class A | $1,000.00 | $925.30 | $6.79 | 1.40% |
| Class B | 1,000.00 | 921.50 | 10.63 | 2.20% |
| Class C | 1,000.00 | 921.50 | 10.44 | 2.16% |
| Class I | 1,000.00 | 926.80 | 5.24 | 1.08% |
| Class R1 | 1,000.00 | 923.10 | 8.99 | 1.86% |
| Class R2 | 1,000.00 | 924.10 | 7.89 | 1.63% |
| Class R3 | 1,000.00 | 923.60 | 8.31 | 1.72% |
| Class R4 | 1,000.00 | 925.50 | 6.51 | 1.35% |
| Class R5 | 1,000.00 | 926.40 | 5.60 | 1.16% |
| Class R6 | 1,000.00 | 927.20 | 4.64 | 0.96% |
| Class 1 | 1,000.00 | 926.90 | 4.88 | 1.01% |
| Class NAV | 1,000.00 | 927.10 | 4.63 | 0.96% |
Together with the value of your account, you may use this information to estimate the operating expenses that you paid over the period. Simply divide your account value at August 31, 2015, by $1,000.00, then multiply it by the "expenses paid" for your share class from the table above. For example, for an account value of $8,600.00, the operating expenses should be calculated as follows:
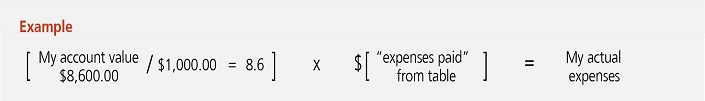
10
Hypothetical example for comparison purposes
This table allows you to compare the fund's ongoing operating expenses with those of any other fund. It provides an example of the fund's hypothetical account values and hypothetical expenses based on each class's actual expense ratio and an assumed 5% annualized return before expenses (which is not the fund's actual return). It assumes an account value of $1,000.00 on March 1, 2015, with the same investment held until August 31, 2015. Look in any other fund shareholder report to find its hypothetical example and you will be able to compare these expenses. Please remember that these hypothetical account values and expenses may not be used to estimate the actual ending account balance or expenses you paid for the period.
| Beginning Account value on 3-1-2015 | Ending value on 8-31-2015 | Expenses paid during period ended 8-31-20151 | Annualized expense ratio | |
| Class A | $1,000.00 | $1,018.10 | $7.12 | 1.40% |
| Class B | 1,000.00 | 1,014.10 | 11.15 | 2.20% |
| Class C | 1,000.00 | 1,014.30 | 10.94 | 2.16% |
| Class I | 1,000.00 | 1,019.70 | 5.49 | 1.08% |
| Class R1 | 1,000.00 | 1,015.80 | 9.42 | 1.86% |
| Class R2 | 1,000.00 | 1,016.90 | 8.27 | 1.63% |
| Class R3 | 1,000.00 | 1,016.50 | 8.71 | 1.72% |
| Class R4 | 1,000.00 | 1,018.40 | 6.83 | 1.35% |
| Class R5 | 1,000.00 | 1,019.30 | 5.87 | 1.16% |
| Class R6 | 1,000.00 | 1,020.30 | 4.86 | 0.96% |
| Class 1 | 1,000.00 | 1,020.10 | 5.11 | 1.01% |
| Class NAV | 1,000.00 | 1,020.30 | 4.85 | 0.96% |
Remember, these examples do not include any transaction costs, therefore, these examples will not help you to determine the relative total costs of owning different funds. If transaction costs were included, your expenses would have been higher. See the prospectuses for details regarding transaction costs.
| 1 | Expenses are equal to the fund's annualized expense ratio, multiplied by the average account value over the period, multiplied by 184/366 (to reflect the one-half year period). |
11
Fund's investments
| As of 8-31-15 (unaudited) | ||||||||||||||||||||||||||
| Shares | Value | |||||||||||||||||||||||||
| Common stocks 91.2% | $1,546,251,856 | |||||||||||||||||||||||||
| (Cost $1,680,752,988) | ||||||||||||||||||||||||||
| Australia 1.2% | 19,838,532 | |||||||||||||||||||||||||
| Abacus Property Group | 7,244 | 15,821 | ||||||||||||||||||||||||
| AMP, Ltd. | 125,541 | 531,031 | ||||||||||||||||||||||||
| ASX, Ltd. | 7,461 | 209,267 | ||||||||||||||||||||||||
| Australia & New Zealand Banking Group, Ltd. | 102,935 | 2,047,259 | ||||||||||||||||||||||||
| Bendigo & Adelaide Bank, Ltd. | 20,474 | 159,713 | ||||||||||||||||||||||||
| BT Investment Management, Ltd. | 13,022 | 88,962 | ||||||||||||||||||||||||
| BWP Trust | 21,696 | 48,734 | ||||||||||||||||||||||||
| Challenger, Ltd. | 20,608 | 104,703 | ||||||||||||||||||||||||
| Charter Hall Group | 14,359 | 45,282 | ||||||||||||||||||||||||
| Charter Hall Retail REIT | 10,741 | 30,646 | ||||||||||||||||||||||||
| Commonwealth Bank of Australia | 44,276 | 2,365,495 | ||||||||||||||||||||||||
| Cromwell Property Group | 52,446 | 38,205 | ||||||||||||||||||||||||
| Dexus Property Group | 45,837 | 239,886 | ||||||||||||||||||||||||
| Echo Entertainment Group, Ltd. | 76,293 | 266,599 | ||||||||||||||||||||||||
| Fairfax Media, Ltd. | 170,865 | 103,750 | ||||||||||||||||||||||||
| Federation Centres | 271,626 | 546,035 | ||||||||||||||||||||||||
| Genworth Mortgage Insurance Australia, Ltd. | 32,739 | 62,359 | ||||||||||||||||||||||||
| Goodman Group | 75,989 | 328,417 | ||||||||||||||||||||||||
| Insurance Australia Group, Ltd. | 113,497 | 409,159 | ||||||||||||||||||||||||
| Investa Office Fund | 19,806 | 54,152 | ||||||||||||||||||||||||
| IOOF Holdings, Ltd. | 28,603 | 182,130 | ||||||||||||||||||||||||
| Lend Lease Group | 26,298 | 260,214 | ||||||||||||||||||||||||
| Macquarie Group, Ltd. | 21,545 | 1,162,885 | ||||||||||||||||||||||||
| Magellan Financial Group, Ltd. | 4,962 | 67,562 | ||||||||||||||||||||||||
| Mirvac Group | 212,934 | 264,715 | ||||||||||||||||||||||||
| National Australia Bank, Ltd. | 68,104 | 1,510,099 | ||||||||||||||||||||||||
| Nine Entertainment Company Holdings, Ltd. | 35,142 | 41,425 | ||||||||||||||||||||||||
| Perpetual, Ltd. | 5,166 | 158,371 | ||||||||||||||||||||||||
| Premier Investments, Ltd. | 3,366 | 29,669 | ||||||||||||||||||||||||
| Seven West Media, Ltd. | 77,411 | 45,664 | ||||||||||||||||||||||||
| Shopping Centres Australasia Property Group | 18,234 | 25,545 | ||||||||||||||||||||||||
| Stockland | 130,997 | 363,968 | ||||||||||||||||||||||||
| Suncorp Group, Ltd. | 59,993 | 547,462 | ||||||||||||||||||||||||
| Telstra Corp., Ltd. | 357,300 | 1,465,865 | ||||||||||||||||||||||||
| The GPT Group | 103,309 | 330,162 | ||||||||||||||||||||||||
| Westfield Corp. (I) | 95,017 | 657,970 | ||||||||||||||||||||||||
| Westpac Banking Corp. | 111,824 | 2,483,086 | ||||||||||||||||||||||||
| Woodside Petroleum, Ltd. | 108,153 | 2,489,215 | ||||||||||||||||||||||||
| WorleyParsons, Ltd. | 10,680 | 57,050 | ||||||||||||||||||||||||
| Shares | Value | |||||||||||||||||||||||||
| Austria 0.3% | $6,013,247 | |||||||||||||||||||||||||
| OMV AG | 96,625 | 2,473,696 | ||||||||||||||||||||||||
| UNIQA Insurance Group AG | 1,903 | 15,916 | ||||||||||||||||||||||||
| voestalpine AG | 96,648 | 3,523,635 | ||||||||||||||||||||||||
| Belgium 0.9% | 14,914,162 | |||||||||||||||||||||||||
| Ageas | 16,196 | 661,176 | ||||||||||||||||||||||||
| D'ieteren SA | 617 | 22,745 | ||||||||||||||||||||||||
| Delhaize Group | 81,184 | 7,264,037 | ||||||||||||||||||||||||
| Gimv NV | 269 | 12,755 | ||||||||||||||||||||||||
| KBC Ancora | 1,023 | 40,849 | ||||||||||||||||||||||||
| Mobistar SA (I) | 2,044 | 42,506 | ||||||||||||||||||||||||
| Proximus | 142,808 | 5,122,532 | ||||||||||||||||||||||||
| Solvay SA | 10,666 | 1,251,599 | ||||||||||||||||||||||||
| Umicore SA | 12,429 | 495,963 | ||||||||||||||||||||||||
| Canada 5.5% | 93,610,392 | |||||||||||||||||||||||||
| Allied Properties Real Estate Investment Trust | 3,800 | 100,690 | ||||||||||||||||||||||||
| Artis Real Estate Investment Trust | 5,700 | 53,118 | ||||||||||||||||||||||||
| Bank of Montreal | 47,500 | 2,563,469 | ||||||||||||||||||||||||
| BCE, Inc. | 23,500 | 950,289 | ||||||||||||||||||||||||
| Canadian Apartment Properties REIT | 4,500 | 95,774 | ||||||||||||||||||||||||
| Canadian Imperial Bank of Commerce | 29,300 | 2,153,403 | ||||||||||||||||||||||||
| Canadian Natural Resources, Ltd. | 2,400 | 54,089 | ||||||||||||||||||||||||
| Canadian Tire Corp., Ltd., Class A | 3,200 | 302,098 | ||||||||||||||||||||||||
| Cenovus Energy, Inc. | 9,000 | 130,458 | ||||||||||||||||||||||||
| CI Financial Corp. | 12,800 | 305,990 | ||||||||||||||||||||||||
| Cogeco Cable, Inc. | 1,600 | 80,766 | ||||||||||||||||||||||||
| Cominar Real Estate Investment Trust | 9,100 | 112,263 | ||||||||||||||||||||||||
| Corus Entertainment, Inc., B Shares | 5,600 | 60,827 | ||||||||||||||||||||||||
| Fairfax Financial Holdings, Ltd. | 800 | 372,004 | ||||||||||||||||||||||||
| Genworth MI Canada, Inc. | 6,500 | 150,593 | ||||||||||||||||||||||||
| Granite Real Estate Investment Trust | 1,900 | 55,544 | ||||||||||||||||||||||||
| Great-West Lifeco, Inc. | 12,600 | 322,087 | ||||||||||||||||||||||||
| IGM Financial, Inc. | 5,500 | 157,400 | ||||||||||||||||||||||||
| Imperial Oil, Ltd. | 4,400 | 155,351 | ||||||||||||||||||||||||
| Industrial Alliance Insurance & Financial Services, Inc. | 3,900 | 124,565 | ||||||||||||||||||||||||
| Intact Financial Corp. | 5,100 | 352,961 | ||||||||||||||||||||||||
| Laurentian Bank of Canada | 1,500 | 55,207 | ||||||||||||||||||||||||
| Linamar Corp. | 5,000 | 262,656 | ||||||||||||||||||||||||
| Magna International, Inc. | 56,200 | 2,773,262 | ||||||||||||||||||||||||
| National Bank of Canada | 25,600 | 842,566 | ||||||||||||||||||||||||
| Power Corp. of Canada | 18,200 | 398,419 | ||||||||||||||||||||||||
| Power Financial Corp. | 11,600 | 285,151 | ||||||||||||||||||||||||
| RONA, Inc. | 3,600 | 38,857 | ||||||||||||||||||||||||
| Royal Bank of Canada | 89,200 | 4,972,581 | ||||||||||||||||||||||||
| Shares | Value | |||||||||||||||||||||||||
| Canada (continued) | ||||||||||||||||||||||||||
| Smart Real Estate Investment Trust | 5,200 | $115,692 | ||||||||||||||||||||||||
| Sun Life Financial, Inc. | 31,600 | 1,004,494 | ||||||||||||||||||||||||
| Suncor Energy, Inc. | 323,200 | 9,153,566 | ||||||||||||||||||||||||
| The Bank of Nova Scotia | 19,400 | 888,012 | ||||||||||||||||||||||||
| The Toronto-Dominion Bank | 101,000 | 4,028,945 | ||||||||||||||||||||||||
| Valeant Pharmaceuticals International, Inc. (I) | 260,786 | 60,137,245 | ||||||||||||||||||||||||
| Colombia 0.0% | 349,857 | |||||||||||||||||||||||||
| Pacific Exploration and Production Corp. (L) | 103,200 | 349,857 | ||||||||||||||||||||||||
| Denmark 0.7% | 11,616,820 | |||||||||||||||||||||||||
| AP Moeller - Maersk A/S, Class B | 2,915 | 4,964,442 | ||||||||||||||||||||||||
| Carlsberg A/S, Class B | 24,762 | 1,871,001 | ||||||||||||||||||||||||
| Novo Nordisk A/S, B Shares | 1,021 | 56,370 | ||||||||||||||||||||||||
| Pandora A/S | 14,038 | 1,622,662 | ||||||||||||||||||||||||
| Sydbank A/S | 2,356 | 89,559 | ||||||||||||||||||||||||
| TDC A/S | 155,984 | 986,181 | ||||||||||||||||||||||||
| Tryg A/S | 4,367 | 85,728 | ||||||||||||||||||||||||
| Vestas Wind Systems A/S | 36,422 | 1,940,877 | ||||||||||||||||||||||||
| Finland 0.8% | 13,789,898 | |||||||||||||||||||||||||
| Fortum OYJ | 180,622 | 2,923,743 | ||||||||||||||||||||||||
| Metso OYJ (L) | 14,684 | 361,743 | ||||||||||||||||||||||||
| Neste OYJ | 74,097 | 1,899,592 | ||||||||||||||||||||||||
| Nokia OYJ | 282,516 | 1,772,490 | ||||||||||||||||||||||||
| Sampo OYJ, A Shares | 19,847 | 956,118 | ||||||||||||||||||||||||
| Sponda OYJ | 6,930 | 27,875 | ||||||||||||||||||||||||
| Stora Enso OYJ, R Shares | 78,673 | 698,022 | ||||||||||||||||||||||||
| Tieto OYJ | 56,426 | 1,444,344 | ||||||||||||||||||||||||
| UPM-Kymmene OYJ | 222,947 | 3,705,971 | ||||||||||||||||||||||||
| France 14.1% | 238,391,829 | |||||||||||||||||||||||||
| AXA SA | 244,178 | 6,150,575 | ||||||||||||||||||||||||
| BNP Paribas SA | 85,854 | 5,407,973 | ||||||||||||||||||||||||
| Bouygues SA | 97,223 | 3,702,363 | ||||||||||||||||||||||||
| Carrefour SA | 54,949 | 1,784,061 | ||||||||||||||||||||||||
| Casino Guichard Perrachon SA | 26,164 | 1,652,774 | ||||||||||||||||||||||||
| Christian Dior SE | 22,941 | 4,246,774 | ||||||||||||||||||||||||
| Cie de Saint-Gobain | 132,787 | 6,094,497 | ||||||||||||||||||||||||
| Cie Generale des Etablissements Michelin | 70,435 | 6,801,183 | ||||||||||||||||||||||||
| CNP Assurances | 7,127 | 109,905 | ||||||||||||||||||||||||
| Credit Agricole SA (L) | 7,784 | 105,230 | ||||||||||||||||||||||||
| Electricite de France SA | 81,831 | 1,765,160 | ||||||||||||||||||||||||
| Engie | 780,515 | 13,939,926 | ||||||||||||||||||||||||
| Euler Hermes Group | 214 | 22,050 | ||||||||||||||||||||||||
| Hermes International | 82 | 29,095 | ||||||||||||||||||||||||
| Shares | Value | |||||||||||||||||||||||||
| France (continued) | ||||||||||||||||||||||||||
| LVMH Moet Hennessy Louis Vuitton SE | 450 | $74,898 | ||||||||||||||||||||||||
| Mercialys SA | 2,208 | 49,716 | ||||||||||||||||||||||||
| Metropole Television SA | 2,391 | 46,236 | ||||||||||||||||||||||||
| Nexity SA | 1,338 | 59,778 | ||||||||||||||||||||||||
| Orange SA | 1,104,935 | 17,474,759 | ||||||||||||||||||||||||
| Peugeot SA (I) | 2,610 | 44,871 | ||||||||||||||||||||||||
| Rallye SA | 28,655 | 700,528 | ||||||||||||||||||||||||
| Renault SA | 327,192 | 27,093,488 | ||||||||||||||||||||||||
| Rexel SA | 92,931 | 1,423,617 | ||||||||||||||||||||||||
| Sanofi | 295,256 | 29,041,767 | ||||||||||||||||||||||||
| Schneider Electric SE | 230,742 | 14,543,807 | ||||||||||||||||||||||||
| SCOR SE | 8,574 | 301,785 | ||||||||||||||||||||||||
| Societe Generale SA | 35,973 | 1,747,858 | ||||||||||||||||||||||||
| Suez Environnement Company | 121,853 | 2,191,736 | ||||||||||||||||||||||||
| Total SA | 1,475,352 | 68,022,871 | ||||||||||||||||||||||||
| Valeo SA | 11,395 | 1,426,968 | ||||||||||||||||||||||||
| Vallourec SA (L) | 59,339 | 757,556 | ||||||||||||||||||||||||
| Veolia Environnement SA | 12,938 | 282,565 | ||||||||||||||||||||||||
| Vinci SA | 52,516 | 3,378,000 | ||||||||||||||||||||||||
| Vivendi SA | 725,911 | 17,917,459 | ||||||||||||||||||||||||
| Germany 8.8% | 149,668,176 | |||||||||||||||||||||||||
| Allianz SE | 38,693 | 6,165,044 | ||||||||||||||||||||||||
| Alstria Office REIT AG (I) | 5,693 | 76,191 | ||||||||||||||||||||||||
| Aurubis AG | 43,716 | 2,894,150 | ||||||||||||||||||||||||
| BASF SE | 460,690 | 37,014,840 | ||||||||||||||||||||||||
| Bayerische Motoren Werke AG | 95,125 | 8,742,978 | ||||||||||||||||||||||||
| Bilfinger SE (L) | 20,081 | 804,936 | ||||||||||||||||||||||||
| Daimler AG | 281,874 | 22,593,395 | ||||||||||||||||||||||||
| Deutsche EuroShop AG | 803 | 35,712 | ||||||||||||||||||||||||
| Deutsche Lufthansa AG (I) | 253,627 | 3,077,485 | ||||||||||||||||||||||||
| Deutsche Telekom AG | 747,245 | 12,746,854 | ||||||||||||||||||||||||
| E.ON SE | 812,938 | 9,186,847 | ||||||||||||||||||||||||
| Freenet AG | 18,094 | 573,897 | ||||||||||||||||||||||||
| Fresenius Medical Care AG & Company KGaA | 27,202 | 2,071,860 | ||||||||||||||||||||||||
| Hannover Rueck SE | 4,802 | 487,356 | ||||||||||||||||||||||||
| HeidelbergCement AG | 29,894 | 2,254,485 | ||||||||||||||||||||||||
| K+S AG | 140,802 | 5,255,219 | ||||||||||||||||||||||||
| LEG Immobilien AG (I) | 2,959 | 221,826 | ||||||||||||||||||||||||
| Leoni AG | 38,892 | 2,353,854 | ||||||||||||||||||||||||
| Metro AG | 97,078 | 2,822,567 | ||||||||||||||||||||||||
| Muenchener Rueckversicherungs AG | 26,837 | 4,922,750 | ||||||||||||||||||||||||
| ProSiebenSat.1 Media SE | 80,305 | 3,900,302 | ||||||||||||||||||||||||
| Rheinmetall AG | 6,591 | 405,660 | ||||||||||||||||||||||||
| Shares | Value | |||||||||||||||||||||||||
| Germany (continued) | ||||||||||||||||||||||||||
| RWE AG | 229,422 | $3,435,097 | ||||||||||||||||||||||||
| Salzgitter AG | 37,867 | 1,175,274 | ||||||||||||||||||||||||
| Siemens AG | 145,119 | 14,384,568 | ||||||||||||||||||||||||
| Volkswagen AG | 11,073 | 2,065,029 | ||||||||||||||||||||||||
| Hong Kong 1.0% | 17,815,663 | |||||||||||||||||||||||||
| BOC Hong Kong Holdings, Ltd. | 393,000 | 1,328,018 | ||||||||||||||||||||||||
| Champion REIT | 52,000 | 26,050 | ||||||||||||||||||||||||
| CK Hutchison Holdings, Ltd. | 128,472 | 1,711,139 | ||||||||||||||||||||||||
| Dah Sing Banking Group, Ltd. | 36,400 | 68,722 | ||||||||||||||||||||||||
| Dah Sing Financial Holdings, Ltd. | 4,800 | 26,146 | ||||||||||||||||||||||||
| First Pacific Company, Ltd. | 68,000 | 44,291 | ||||||||||||||||||||||||
| Great Eagle Holdings, Ltd. | 3,000 | 9,328 | ||||||||||||||||||||||||
| Hang Lung Properties, Ltd. | 128,000 | 289,776 | ||||||||||||||||||||||||
| Hang Seng Bank, Ltd. | 45,700 | 812,847 | ||||||||||||||||||||||||
| Henderson Land Development Company, Ltd. | 83,000 | 512,318 | ||||||||||||||||||||||||
| HKT Trust & HKT, Ltd. | 85,000 | 98,290 | ||||||||||||||||||||||||
| Hongkong Land Holdings, Ltd. | 85,600 | 593,079 | ||||||||||||||||||||||||
| Hutchison Telecommunications Hong Kong Holdings, Ltd. | 36,000 | 14,516 | ||||||||||||||||||||||||
| Hysan Development Company, Ltd. | 27,000 | 108,589 | ||||||||||||||||||||||||
| Kerry Properties, Ltd. | 25,000 | 74,996 | ||||||||||||||||||||||||
| Luk Fook Holdings International, Ltd. | 25,000 | 64,508 | ||||||||||||||||||||||||
| Man Wah Holdings, Ltd. | 24,400 | 25,763 | ||||||||||||||||||||||||
| New World Development Company, Ltd. | 409,000 | 416,263 | ||||||||||||||||||||||||
| Noble Group, Ltd. (L) | 3,343,900 | 1,293,120 | ||||||||||||||||||||||||
| Pacific Textiles Holdings, Ltd. | 41,000 | 58,697 | ||||||||||||||||||||||||
| PCCW, Ltd. | 319,000 | 168,068 | ||||||||||||||||||||||||
| Power Assets Holdings, Ltd. | 79,000 | 680,025 | ||||||||||||||||||||||||
| Sino Land Company, Ltd. | 82,000 | 121,713 | ||||||||||||||||||||||||
| SJM Holdings, Ltd. | 374,000 | 338,626 | ||||||||||||||||||||||||
| SmarTone Telecommunications Holdings, Ltd. | 28,000 | 50,102 | ||||||||||||||||||||||||
| Sun Hung Kai & Company, Ltd. | 26,000 | 16,597 | ||||||||||||||||||||||||
| Sun Hung Kai Properties, Ltd. | 217,589 | 2,760,940 | ||||||||||||||||||||||||
| Swire Pacific, Ltd., Class A | 185,000 | 2,029,348 | ||||||||||||||||||||||||
| Swire Properties, Ltd. | 45,400 | 138,619 | ||||||||||||||||||||||||
| Techtronic Industries Company, Ltd. | 70,000 | 253,146 | ||||||||||||||||||||||||
| Television Broadcasts, Ltd. | 12,500 | 46,918 | ||||||||||||||||||||||||
| Texwinca Holdings, Ltd. | 34,000 | 32,352 | ||||||||||||||||||||||||
| The Bank of East Asia, Ltd. | 69,600 | 239,533 | ||||||||||||||||||||||||
| The Link REIT | 83,000 | 440,118 | ||||||||||||||||||||||||
| The Wharf Holdings, Ltd. | 421,000 | 2,372,322 | ||||||||||||||||||||||||
| Value Partners Group, Ltd. | 210,000 | 189,222 | ||||||||||||||||||||||||
| Wheelock & Company, Ltd. | 24,000 | 108,954 | ||||||||||||||||||||||||
| Xinyi Glass Holdings, Ltd. | 200,000 | 89,794 | ||||||||||||||||||||||||
| Shares | Value | |||||||||||||||||||||||||
| Hong Kong (continued) | ||||||||||||||||||||||||||
| Yue Yuen Industrial Holdings, Ltd. | 45,500 | $162,810 | ||||||||||||||||||||||||
| Ireland 0.0% | 120,527 | |||||||||||||||||||||||||
| CRH PLC | 2,141 | 63,993 | ||||||||||||||||||||||||
| Shire PLC | 731 | 56,534 | ||||||||||||||||||||||||
| Israel 0.3% | 4,399,535 | |||||||||||||||||||||||||
| Alony Hetz Properties & Investments, Ltd. | 1,604 | 12,356 | ||||||||||||||||||||||||
| Bank Hapoalim BM | 30,941 | 156,928 | ||||||||||||||||||||||||
| Bank Leumi Le-Israel BM (I) | 43,114 | 157,088 | ||||||||||||||||||||||||
| Bezeq The Israeli Telecommunication Corp., Ltd. | 118,280 | 212,339 | ||||||||||||||||||||||||
| Check Point Software Technologies, Ltd. (I) | 19,500 | 1,521,195 | ||||||||||||||||||||||||
| Delek Automotive Systems, Ltd. | 1,007 | 10,591 | ||||||||||||||||||||||||
| First International Bank of Israel, Ltd. | 1,054 | 13,161 | ||||||||||||||||||||||||
| Gazit-Globe, Ltd. | 2,941 | 30,212 | ||||||||||||||||||||||||
| Harel Insurance Investments & Financial Services, Ltd. | 4,113 | 18,770 | ||||||||||||||||||||||||
| Israel Discount Bank, Ltd., Class A (I) | 34,481 | 63,847 | ||||||||||||||||||||||||
| Mizrahi Tefahot Bank, Ltd. | 3,507 | 40,781 | ||||||||||||||||||||||||
| Partner Communications Company, Ltd. (I) | 32,620 | 142,328 | ||||||||||||||||||||||||
| Teva Pharmaceutical Industries, Ltd. | 30,991 | 2,019,939 | ||||||||||||||||||||||||
| Italy 3.4% | 58,176,086 | |||||||||||||||||||||||||
| A2A SpA | 891,883 | 1,090,893 | ||||||||||||||||||||||||
| ACEA SpA | 1,242 | 17,037 | ||||||||||||||||||||||||
| Credito Emiliano SpA | 2,447 | 19,644 | ||||||||||||||||||||||||
| Enel SpA | 3,050,313 | 13,716,439 | ||||||||||||||||||||||||
| Eni SpA | 1,496,840 | 24,706,645 | ||||||||||||||||||||||||
| EXOR SpA | 11,463 | 526,053 | ||||||||||||||||||||||||
| Finmeccanica SpA (I) | 167,249 | 2,259,985 | ||||||||||||||||||||||||
| Mediaset SpA | 444,954 | 2,126,993 | ||||||||||||||||||||||||
| Mediolanum SpA | 55,186 | 435,062 | ||||||||||||||||||||||||
| Recordati SpA | 9,591 | 227,817 | ||||||||||||||||||||||||
| Snam SpA | 18,691 | 91,308 | ||||||||||||||||||||||||
| Societa Cattolica di Assicurazioni SCRL | 6,649 | 47,089 | ||||||||||||||||||||||||
| Telecom Italia SpA (I) | 5,642,873 | 6,848,391 | ||||||||||||||||||||||||
| Telecom Italia SpA | 5,966,040 | 5,978,933 | ||||||||||||||||||||||||
| Unipol Gruppo Finanziario SpA | 17,768 | 83,797 | ||||||||||||||||||||||||
| Japan 21.3% | 360,832,978 | |||||||||||||||||||||||||
| Adastria Company, Ltd. | 3,200 | 171,602 | ||||||||||||||||||||||||
| Aeon Company, Ltd. (L) | 120,300 | 1,804,257 | ||||||||||||||||||||||||
| Aisin Seiki Company, Ltd. | 61,500 | 2,211,391 | ||||||||||||||||||||||||
| Alpine Electronics, Inc. | 8,500 | 119,038 | ||||||||||||||||||||||||
| AOKI Holdings, Inc. | 3,600 | 43,385 | ||||||||||||||||||||||||
| Aoyama Trading Company, Ltd. | 2,800 | 104,278 | ||||||||||||||||||||||||
| Asahi Glass Company, Ltd. | 206,000 | 1,220,367 | ||||||||||||||||||||||||
| Shares | Value | |||||||||||||||||||||||||
| Japan (continued) | ||||||||||||||||||||||||||
| Asahi Kasei Corp. | 157,000 | $1,248,795 | ||||||||||||||||||||||||
| Asatsu-DK, Inc. | 12,700 | 261,918 | ||||||||||||||||||||||||
| Ashikaga Holdings Company, Ltd. | 8,500 | 35,008 | ||||||||||||||||||||||||
| Autobacs Seven Company, Ltd. | 3,100 | 56,938 | ||||||||||||||||||||||||
| Bridgestone Corp. | 88,700 | 2,965,916 | ||||||||||||||||||||||||
| Brother Industries, Ltd. | 11,000 | 149,617 | ||||||||||||||||||||||||
| Calsonic Kansei Corp. | 16,000 | 111,645 | ||||||||||||||||||||||||
| Canon Marketing Japan, Inc. | 4,300 | 62,990 | ||||||||||||||||||||||||
| Canon, Inc. | 304,900 | 9,289,413 | ||||||||||||||||||||||||
| Central Japan Railway Company | 14,800 | 2,423,139 | ||||||||||||||||||||||||
| Century Tokyo Leasing Corp. | 1,800 | 55,212 | ||||||||||||||||||||||||
| Cosmo Oil Company, Ltd. | 43,000 | 66,927 | ||||||||||||||||||||||||
| Credit Saison Company, Ltd. | 14,300 | 285,738 | ||||||||||||||||||||||||
| CyberAgent, Inc. | 23,200 | 917,936 | ||||||||||||||||||||||||
| Daihatsu Motor Company, Ltd. | 52,600 | 641,709 | ||||||||||||||||||||||||
| Daiichi Sankyo Company, Ltd. | 37,100 | 714,023 | ||||||||||||||||||||||||
| Daiichikosho Company, Ltd. | 1,000 | 37,852 | ||||||||||||||||||||||||
| Daikyo, Inc. | 63,000 | 98,355 | ||||||||||||||||||||||||
| Daito Trust Construction Company, Ltd. | 23,200 | 2,534,263 | ||||||||||||||||||||||||
| Daiwa House Industry Company, Ltd. | 25,600 | 627,619 | ||||||||||||||||||||||||
| Daiwabo Holdings Company, Ltd. | 108,000 | 189,282 | ||||||||||||||||||||||||
| DCM Holdings Company, Ltd. | 12,400 | 97,670 | ||||||||||||||||||||||||
| DeNA Company, Ltd. | 168,861 | 3,079,956 | ||||||||||||||||||||||||
| Descente, Ltd. | 1,200 | 16,661 | ||||||||||||||||||||||||
| Eagle Industry Company, Ltd. | 1,400 | 28,523 | ||||||||||||||||||||||||
| Exedy Corp. | 1,600 | 36,397 | ||||||||||||||||||||||||
| Fuji Heavy Industries, Ltd. | 102,516 | 3,583,841 | ||||||||||||||||||||||||
| Fuji Oil Company, Ltd. | 50,500 | 698,487 | ||||||||||||||||||||||||
| FUJIFILM Holdings Corp. | 91,600 | 3,754,899 | ||||||||||||||||||||||||
| Fujitsu General, Ltd. | 9,000 | 111,242 | ||||||||||||||||||||||||
| Fukuoka Financial Group, Inc. | 50,000 | 247,710 | ||||||||||||||||||||||||
| Fuyo General Lease Company, Ltd. | 600 | 23,394 | ||||||||||||||||||||||||
| Gree, Inc. (L) | 529,700 | 2,494,900 | ||||||||||||||||||||||||
| Gunze, Ltd. | 48,000 | 149,722 | ||||||||||||||||||||||||
| H2O Retailing Corp. | 6,700 | 133,334 | ||||||||||||||||||||||||
| Hanwa Company, Ltd. | 322,000 | 1,348,307 | ||||||||||||||||||||||||
| Haseko Corp. | 263,100 | 3,077,122 | ||||||||||||||||||||||||
| Hitachi Capital Corp. | 5,900 | 141,666 | ||||||||||||||||||||||||
| Hitachi Chemical Company, Ltd. | 27,900 | 427,074 | ||||||||||||||||||||||||
| Hokuhoku Financial Group, Inc. | 81,000 | 182,644 | ||||||||||||||||||||||||
| Honda Motor Company, Ltd. | 432,603 | 13,607,134 | ||||||||||||||||||||||||
| Hoya Corp. | 48,600 | 1,896,146 | ||||||||||||||||||||||||
| IBJ Leasing Company, Ltd. | 1,100 | 22,662 | ||||||||||||||||||||||||
| Idemitsu Kosan Company, Ltd. | 14,600 | 251,226 | ||||||||||||||||||||||||
| Shares | Value | |||||||||||||||||||||||||
| Japan (continued) | ||||||||||||||||||||||||||
| Inpex Corp. | 483,700 | $4,902,873 | ||||||||||||||||||||||||
| Isuzu Motors, Ltd. | 47,500 | 538,087 | ||||||||||||||||||||||||
| ITOCHU Corp. | 1,127,200 | 13,518,799 | ||||||||||||||||||||||||
| Itochu Enex Company, Ltd. | 1,400 | 12,083 | ||||||||||||||||||||||||
| Jafco Company, Ltd. | 6,200 | 269,661 | ||||||||||||||||||||||||
| JFE Holdings, Inc. | 89,500 | 1,385,997 | ||||||||||||||||||||||||
| JSR Corp. | 27,300 | 427,980 | ||||||||||||||||||||||||
| JX Holdings, Inc. | 506,000 | 1,957,936 | ||||||||||||||||||||||||
| K's Holdings Corp. | 98,800 | 3,147,737 | ||||||||||||||||||||||||
| Kawasaki Kisen Kaisha, Ltd. | 774,000 | 1,718,122 | ||||||||||||||||||||||||
| KDDI Corp. | 450,500 | 11,178,652 | ||||||||||||||||||||||||
| Keihin Corp. | 5,800 | 80,123 | ||||||||||||||||||||||||
| Keyence Corp. | 3,400 | 1,573,924 | ||||||||||||||||||||||||
| Kobe Steel, Ltd. | 884,000 | 1,183,534 | ||||||||||||||||||||||||
| Kohnan Shoji Company, Ltd. | 12,700 | 165,679 | ||||||||||||||||||||||||
| Koito Manufacturing Company, Ltd. | 10,700 | 365,640 | ||||||||||||||||||||||||
| Kuraray Company, Ltd. | 19,700 | 232,259 | ||||||||||||||||||||||||
| Kyocera Corp. | 191,500 | 9,381,400 | ||||||||||||||||||||||||
| Leopalace21 Corp. (I) | 432,600 | 2,102,928 | ||||||||||||||||||||||||
| Marubeni Corp. | 1,278,324 | 7,003,899 | ||||||||||||||||||||||||
| Marui Group Company, Ltd. | 18,400 | 222,415 | ||||||||||||||||||||||||
| Medipal Holdings Corp. | 118,735 | 2,048,170 | ||||||||||||||||||||||||
| Mitsuba Corp. | 5,300 | 91,061 | ||||||||||||||||||||||||
| Mitsubishi Chemical Holdings Corp. | 410,249 | 2,326,396 | ||||||||||||||||||||||||
| Mitsubishi Corp. | 805,695 | 14,968,327 | ||||||||||||||||||||||||
| Mitsubishi Electric Corp. | 159,000 | 1,582,175 | ||||||||||||||||||||||||
| Mitsubishi UFJ Financial Group, Inc. | 1,313,800 | 8,666,062 | ||||||||||||||||||||||||
| Mitsubishi UFJ Lease & Finance Company, Ltd. | 25,400 | 122,311 | ||||||||||||||||||||||||
| Mitsui & Company, Ltd. | 947,600 | 12,322,350 | ||||||||||||||||||||||||
| Mitsui Engineering & Shipbuilding Company, Ltd. | 976,000 | 1,514,021 | ||||||||||||||||||||||||
| Mitsui OSK Lines, Ltd. | 734,000 | 2,064,710 | ||||||||||||||||||||||||
| Mizuho Financial Group, Inc. | 3,046,900 | 6,239,957 | ||||||||||||||||||||||||
| MS&AD Insurance Group Holdings, Inc. | 21,600 | 679,087 | ||||||||||||||||||||||||
| Murata Manufacturing Company, Ltd. | 11,400 | 1,642,095 | ||||||||||||||||||||||||
| NHK Spring Company, Ltd. | 11,000 | 106,073 | ||||||||||||||||||||||||
| Nidec Corp. | 20,200 | 1,581,599 | ||||||||||||||||||||||||
| Nifco, Inc. | 4,000 | 155,698 | ||||||||||||||||||||||||
| Nippon Electric Glass Company, Ltd. | 169,000 | 744,349 | ||||||||||||||||||||||||
| Nippon Light Metal Holdings Company, Ltd. | 156,600 | 240,868 | ||||||||||||||||||||||||
| Nippon Paper Industries Company, Ltd. | 194,800 | 3,180,850 | ||||||||||||||||||||||||
| Nippon Seiki Company, Ltd. | 1,000 | 20,005 | ||||||||||||||||||||||||
| Nippon Steel & Sumitomo Metal Corp. | 685,000 | 1,404,678 | ||||||||||||||||||||||||
| Nippon Telegraph & Telephone Corp. | 634,800 | 24,212,642 | ||||||||||||||||||||||||
| Nippon Television Holdings, Inc. | 9,000 | 155,671 | ||||||||||||||||||||||||
| Shares | Value | |||||||||||||||||||||||||
| Japan (continued) | ||||||||||||||||||||||||||
| Nippon Yusen KK | 485,000 | $1,271,720 | ||||||||||||||||||||||||
| Nipro Corp. | 48,400 | 553,048 | ||||||||||||||||||||||||
| Nissan Motor Company, Ltd. | 4,967,367 | 44,673,614 | ||||||||||||||||||||||||
| Nissin Kogyo Company, Ltd. | 4,300 | 59,131 | ||||||||||||||||||||||||
| Nitori Holdings Company, Ltd. | 39,400 | 3,127,224 | ||||||||||||||||||||||||
| NOK Corp. | 11,300 | 277,773 | ||||||||||||||||||||||||
| Nomura Holdings, Inc. | 355,300 | 2,228,874 | ||||||||||||||||||||||||
| Nomura Real Estate Holdings, Inc. | 14,000 | 262,623 | ||||||||||||||||||||||||
| North Pacific Bank, Ltd. | 49,100 | 197,151 | ||||||||||||||||||||||||
| NTT DOCOMO, Inc. | 579,743 | 12,159,390 | ||||||||||||||||||||||||
| Okasan Securities Group, Inc. | 8,000 | 49,262 | ||||||||||||||||||||||||
| Onward Holdings Company, Ltd. | 6,000 | 37,740 | ||||||||||||||||||||||||
| Open House Company, Ltd. | 4,100 | 75,180 | ||||||||||||||||||||||||
| Orient Corp. (I) | 159,500 | 259,306 | ||||||||||||||||||||||||
| ORIX Corp. | 141,800 | 1,900,607 | ||||||||||||||||||||||||
| Osaka Gas Company, Ltd. | 143,000 | 580,250 | ||||||||||||||||||||||||
| Otsuka Holdings Company, Ltd. | 114,600 | 3,910,521 | ||||||||||||||||||||||||
| Paltac Corp. | 1,200 | 22,557 | ||||||||||||||||||||||||
| PanaHome Corp. | 5,000 | 33,269 | ||||||||||||||||||||||||
| Panasonic Corp. | 161,100 | 1,764,310 | ||||||||||||||||||||||||
| Parco Company, Ltd. | 1,000 | 9,110 | ||||||||||||||||||||||||
| Relo Holdings, Inc. | 500 | 52,229 | ||||||||||||||||||||||||
| Resona Holdings, Inc. | 472,300 | 2,380,535 | ||||||||||||||||||||||||
| Resorttrust, Inc. | 4,400 | 116,927 | ||||||||||||||||||||||||
| Ricoh Company, Ltd. | 219,700 | 2,141,888 | ||||||||||||||||||||||||
| Ricoh Leasing Company, Ltd. | 800 | 22,320 | ||||||||||||||||||||||||
| Ryohin Keikaku Company, Ltd. | 13,000 | 2,885,224 | ||||||||||||||||||||||||
| Saizeriya Company, Ltd. | 5,300 | 123,064 | ||||||||||||||||||||||||
| Sangetsu Company, Ltd. | 1,400 | 24,346 | ||||||||||||||||||||||||
| Seiko Epson Corp. | 101,400 | 1,639,726 | ||||||||||||||||||||||||
| Sekisui Chemical Company, Ltd. | 41,000 | 451,528 | ||||||||||||||||||||||||
| Sekisui House, Ltd. | 178,700 | 2,663,655 | ||||||||||||||||||||||||
| Senshu Ikeda Holdings, Inc. | 13,300 | 58,220 | ||||||||||||||||||||||||
| Shimachu Company, Ltd. | 2,700 | 65,823 | ||||||||||||||||||||||||
| Shimamura Company, Ltd. | 2,000 | 184,468 | ||||||||||||||||||||||||
| Showa Denko KK | 409,000 | 468,266 | ||||||||||||||||||||||||
| SKY Perfect JSAT Holdings, Inc. | 9,500 | 43,108 | ||||||||||||||||||||||||
| SMC Corp. | 7,400 | 1,791,028 | ||||||||||||||||||||||||
| Sojitz Corp. | 2,407,100 | 5,083,194 | ||||||||||||||||||||||||
| Sony Financial Holdings, Inc. | 16,800 | 314,217 | ||||||||||||||||||||||||
| Sumitomo Corp. | 797,800 | 8,461,748 | ||||||||||||||||||||||||
| Sumitomo Forestry Company, Ltd. | 8,400 | 93,958 | ||||||||||||||||||||||||
| Sumitomo Heavy Industries, Ltd. | 150,000 | 648,241 | ||||||||||||||||||||||||
| Sumitomo Metal Mining Company, Ltd. | 201,000 | 2,551,514 | ||||||||||||||||||||||||
| Shares | Value | |||||||||||||||||||||||||
| Japan (continued) | ||||||||||||||||||||||||||
| Sumitomo Mitsui Financial Group, Inc. | 157,300 | $6,420,430 | ||||||||||||||||||||||||
| Sumitomo Mitsui Trust Holdings, Inc. | 267,000 | 1,102,147 | ||||||||||||||||||||||||
| Sumitomo Real Estate Sales Company, Ltd. | 700 | 18,402 | ||||||||||||||||||||||||
| Sumitomo Rubber Industries, Ltd. | 67,900 | 959,391 | ||||||||||||||||||||||||
| Suruga Bank, Ltd. | 7,800 | 148,989 | ||||||||||||||||||||||||
| T&D Holdings, Inc. | 41,400 | 555,776 | ||||||||||||||||||||||||
| T-Gaia Corp. | 2,400 | 39,266 | ||||||||||||||||||||||||
| Takashimaya Company, Ltd. | 39,000 | 337,050 | ||||||||||||||||||||||||
| Takeda Pharmaceutical Company, Ltd. | 68,589 | 3,364,609 | ||||||||||||||||||||||||
| The 77 Bank, Ltd. | 14,000 | 82,843 | ||||||||||||||||||||||||
| The Awa Bank, Ltd. | 3,000 | 17,082 | ||||||||||||||||||||||||
| The Bank of Kyoto, Ltd. | 18,000 | 195,155 | ||||||||||||||||||||||||
| The Bank of Yokohama, Ltd. | 69,000 | 421,333 | ||||||||||||||||||||||||
| The Chiba Bank, Ltd. | 40,000 | 291,224 | ||||||||||||||||||||||||
| The Daishi Bank, Ltd. | 7,000 | 29,892 | ||||||||||||||||||||||||
| The Gunma Bank, Ltd. | 19,000 | 126,635 | ||||||||||||||||||||||||
| The Hachijuni Bank, Ltd. | 13,000 | 89,579 | ||||||||||||||||||||||||
| The Hiroshima Bank, Ltd. | 17,000 | 95,795 | ||||||||||||||||||||||||
| The Hokkoku Bank, Ltd. | 5,000 | 19,113 | ||||||||||||||||||||||||
| The Hyakugo Bank, Ltd. | 5,000 | 24,064 | ||||||||||||||||||||||||
| The Hyakujushi Bank, Ltd. | 3,000 | 10,386 | ||||||||||||||||||||||||
| The Iyo Bank, Ltd. | 8,500 | 95,019 | ||||||||||||||||||||||||
| The Joyo Bank, Ltd. | 31,000 | 165,579 | ||||||||||||||||||||||||
| The Juroku Bank, Ltd. | 8,000 | 32,613 | ||||||||||||||||||||||||
| The Keiyo Bank, Ltd. | 4,000 | 20,985 | ||||||||||||||||||||||||
| The Kiyo Bank, Ltd. | 1,400 | 21,413 | ||||||||||||||||||||||||
| The Musashino Bank, Ltd. | 800 | 28,055 | ||||||||||||||||||||||||
| The Nanto Bank, Ltd. | 3,000 | 9,554 | ||||||||||||||||||||||||
| The Nishi-Nippon City Bank, Ltd. | 49,000 | 135,759 | ||||||||||||||||||||||||
| The Ogaki Kyoritsu Bank, Ltd. | 6,000 | 21,239 | ||||||||||||||||||||||||
| The San-In Godo Bank, Ltd. | 5,000 | 44,483 | ||||||||||||||||||||||||
| The Shizuoka Bank, Ltd. | 21,000 | 220,986 | ||||||||||||||||||||||||
| The Toho Bank, Ltd. | 3,000 | 12,122 | ||||||||||||||||||||||||
| The Yokohama Rubber Company, Ltd. | 35,400 | 693,695 | ||||||||||||||||||||||||
| Toei Company, Ltd. | 2,000 | 14,880 | ||||||||||||||||||||||||
| Tokai Rika Company, Ltd. | 4,200 | 88,960 | ||||||||||||||||||||||||
| Tokai Tokyo Financial Holdings, Inc. | 14,000 | 93,122 | ||||||||||||||||||||||||
| Token Corp. | 400 | 27,602 | ||||||||||||||||||||||||
| Tokio Marine Holdings, Inc. | 32,000 | 1,280,991 | ||||||||||||||||||||||||
| Tokyo Broadcasting System Holdings, Inc. | 5,600 | 76,542 | ||||||||||||||||||||||||
| Tokyo Electric Power Company, Inc. (I) | 343,200 | 2,350,127 | ||||||||||||||||||||||||
| Tokyo Gas Company, Ltd. | 115,000 | 628,298 | ||||||||||||||||||||||||
| TonenGeneral Sekiyu KK | 42,133 | 421,675 | ||||||||||||||||||||||||
| Topre Corp. | 1,500 | 29,048 | ||||||||||||||||||||||||
| Shares | Value | |||||||||||||||||||||||||
| Japan (continued) | ||||||||||||||||||||||||||
| Tosoh Corp. | 388,000 | $1,828,583 | ||||||||||||||||||||||||
| Toyo Tire & Rubber Company, Ltd. | 13,400 | 299,103 | ||||||||||||||||||||||||
| Toyoda Gosei Company, Ltd. | 4,700 | 91,810 | ||||||||||||||||||||||||
| Toyota Boshoku Corp. | 8,900 | 147,916 | ||||||||||||||||||||||||
| Toyota Industries Corp. | 700 | 34,626 | ||||||||||||||||||||||||
| Toyota Motor Corp. | 105,100 | 6,212,066 | ||||||||||||||||||||||||
| Toyota Tsusho Corp. | 199,600 | 4,592,461 | ||||||||||||||||||||||||
| TPR Company, Ltd. | 1,200 | 28,903 | ||||||||||||||||||||||||
| TS Tech Company, Ltd. | 4,500 | 120,370 | ||||||||||||||||||||||||
| Ube Industries, Ltd. | 310,000 | 534,933 | ||||||||||||||||||||||||
| Unipres Corp. | 2,200 | 40,907 | ||||||||||||||||||||||||
| UNY Group Holdings Company, Ltd. | 327,300 | 2,032,522 | ||||||||||||||||||||||||
| USS Company, Ltd. | 8,900 | 157,616 | ||||||||||||||||||||||||
| Wacoal Holdings Corp. | 4,000 | 51,353 | ||||||||||||||||||||||||
| West Japan Railway Company | 35,000 | 2,362,222 | ||||||||||||||||||||||||
| Xebio Company, Ltd. | 1,600 | 30,277 | ||||||||||||||||||||||||
| Yamada Denki Company, Ltd. | 1,036,679 | 3,988,564 | ||||||||||||||||||||||||
| Yamaguchi Financial Group, Inc. | 13,000 | 160,101 | ||||||||||||||||||||||||
| Yamaha Motor Company, Ltd. | 12,500 | 240,637 | ||||||||||||||||||||||||
| Luxembourg 0.1% | 1,389,938 | |||||||||||||||||||||||||
| ArcelorMittal | 170,052 | 1,327,980 | ||||||||||||||||||||||||
| Grand City Properties SA | 3,510 | 61,958 | ||||||||||||||||||||||||
| Malta 0.0% | 127,917 | |||||||||||||||||||||||||
| BGP Holdings PLC (I) | 2,714,128 | 127,917 | ||||||||||||||||||||||||
| Netherlands 5.1% | 87,060,686 | |||||||||||||||||||||||||
| Aegon NV | 7,566 | 46,601 | ||||||||||||||||||||||||
| Corbion NV | 33,663 | 738,618 | ||||||||||||||||||||||||
| Delta Lloyd NV | 97,420 | 1,034,380 | ||||||||||||||||||||||||
| Heineken Holding NV | 14,733 | 1,027,302 | ||||||||||||||||||||||||
| Heineken NV | 24,312 | 1,921,506 | ||||||||||||||||||||||||
| ING Groep NV | 3,459 | 53,000 | ||||||||||||||||||||||||
| Koninklijke Ahold NV | 480,901 | 9,484,599 | ||||||||||||||||||||||||
| Koninklijke BAM Groep NV (I) | 100,858 | 557,425 | ||||||||||||||||||||||||
| Koninklijke DSM NV (L) | 28,153 | 1,478,809 | ||||||||||||||||||||||||
| Koninklijke KPN NV | 142,218 | 552,462 | ||||||||||||||||||||||||
| PostNL NV (I) | 753,488 | 2,843,559 | ||||||||||||||||||||||||
| Royal Boskalis Westminster NV | 9,991 | 519,991 | ||||||||||||||||||||||||
| Royal Dutch Shell PLC, A Shares | 1,474,119 | 38,404,048 | ||||||||||||||||||||||||
| Royal Dutch Shell PLC, B Shares | 990,273 | 25,855,050 | ||||||||||||||||||||||||
| SNS REAAL NV (I) | 69,009 | 0 | ||||||||||||||||||||||||
| TomTom NV (I) | 31,946 | 320,018 | ||||||||||||||||||||||||
| Wolters Kluwer NV | 70,273 | 2,223,318 | ||||||||||||||||||||||||
| Shares | Value | |||||||||||||||||||||||||
| New Zealand 0.0% | $230,330 | |||||||||||||||||||||||||
| Chorus, Ltd. (I) | 105,127 | 169,642 | ||||||||||||||||||||||||
| Kiwi Property Group, Ltd. | 20,691 | 17,167 | ||||||||||||||||||||||||
| SKY Network Television, Ltd. | 13,543 | 43,521 | ||||||||||||||||||||||||
| Norway 1.5% | 25,002,888 | |||||||||||||||||||||||||
| DNB ASA | 50,922 | 724,939 | ||||||||||||||||||||||||
| Orkla ASA | 34,430 | 253,829 | ||||||||||||||||||||||||
| Statoil ASA | 628,222 | 9,574,711 | ||||||||||||||||||||||||
| Storebrand ASA (I) | 53,496 | 183,082 | ||||||||||||||||||||||||
| Telenor ASA | 307,883 | 6,122,379 | ||||||||||||||||||||||||
| TGS Nopec Geophysical Company ASA (L) | 86,622 | 1,697,002 | ||||||||||||||||||||||||
| Yara International ASA | 144,475 | 6,446,946 | ||||||||||||||||||||||||
| Portugal 0.3% | 4,476,422 | |||||||||||||||||||||||||
| EDP - Energias de Portugal SA | 1,281,924 | 4,476,422 | ||||||||||||||||||||||||
| Singapore 0.3% | 5,255,990 | |||||||||||||||||||||||||
| ARA Asset Management, Ltd. | 9,100 | 9,290 | ||||||||||||||||||||||||
| Ascendas Real Estate Investment Trust | 125,800 | 198,541 | ||||||||||||||||||||||||
| Ascott Residence Trust | 38,000 | 33,669 | ||||||||||||||||||||||||
| CapitaLand Commercial Trust | 147,400 | 138,827 | ||||||||||||||||||||||||
| CapitaLand Mall Trust | 146,700 | 199,306 | ||||||||||||||||||||||||
| CapitaLand Retail China Trust | 20,900 | 20,907 | ||||||||||||||||||||||||
| CapitaLand, Ltd. | 190,300 | 381,392 | ||||||||||||||||||||||||
| CDL Hospitality Trusts | 12,700 | 11,874 | ||||||||||||||||||||||||
| DBS Group Holdings, Ltd. | 65,300 | 823,062 | ||||||||||||||||||||||||
| Frasers Centrepoint Trust | 13,400 | 18,465 | ||||||||||||||||||||||||
| Golden Agri-Resources, Ltd. | 8,650,500 | 1,932,143 | ||||||||||||||||||||||||
| Keppel REIT | 69,300 | 48,109 | ||||||||||||||||||||||||
| Mapletree Commercial Trust | 17,500 | 16,393 | ||||||||||||||||||||||||
| Mapletree Greater China Commercial Trust | 46,700 | 31,428 | ||||||||||||||||||||||||
| Mapletree Industrial Trust | 33,200 | 36,144 | ||||||||||||||||||||||||
| Mapletree Logistics Trust | 68,800 | 47,759 | ||||||||||||||||||||||||
| Oversea-Chinese Banking Corp., Ltd. | 82,800 | 524,334 | ||||||||||||||||||||||||
| SPH REIT | 19,200 | 13,062 | ||||||||||||||||||||||||
| Starhill Global REIT | 33,700 | 18,365 | ||||||||||||||||||||||||
| Suntec Real Estate Investment Trust | 90,500 | 98,104 | ||||||||||||||||||||||||
| United Overseas Bank, Ltd. | 41,200 | 566,444 | ||||||||||||||||||||||||
| UOL Group, Ltd. | 17,000 | 75,385 | ||||||||||||||||||||||||
| Yanlord Land Group, Ltd. | 16,900 | 12,987 | ||||||||||||||||||||||||
| Spain 4.1% | 69,702,245 | |||||||||||||||||||||||||
| ACS Actividades de Construccion y Servicios SA | 75,956 | 2,455,290 | ||||||||||||||||||||||||
| Enagas SA | 70,132 | 1,913,679 | ||||||||||||||||||||||||
| Endesa SA | 115,101 | 2,377,732 | ||||||||||||||||||||||||
| Ferrovial SA | 70,797 | 1,687,930 | ||||||||||||||||||||||||
| Shares | Value | |||||||||||||||||||||||||
| Spain (continued) | ||||||||||||||||||||||||||
| Gas Natural SDG SA | 181,400 | $3,668,708 | ||||||||||||||||||||||||
| Iberdrola SA | 1,630,573 | 11,026,051 | ||||||||||||||||||||||||
| Indra Sistemas SA (I)(L) | 27,112 | 319,881 | ||||||||||||||||||||||||
| Mapfre SA | 189,581 | 556,567 | ||||||||||||||||||||||||
| Red Electrica Corp. SA | 10,279 | 817,910 | ||||||||||||||||||||||||
| Repsol SA | 393,840 | 5,615,343 | ||||||||||||||||||||||||
| Telefonica SA | 2,786,120 | 39,263,154 | ||||||||||||||||||||||||
| Sweden 1.6% | 27,254,909 | |||||||||||||||||||||||||
| Bilia AB, A Shares | 748 | 14,852 | ||||||||||||||||||||||||
| Castellum AB | 6,822 | 96,544 | ||||||||||||||||||||||||
| Fabege AB | 5,275 | 74,559 | ||||||||||||||||||||||||
| Fastighets AB Balder, B Shares (I) | 1,820 | 31,820 | ||||||||||||||||||||||||
| Hufvudstaden AB, A Shares | 4,063 | 52,115 | ||||||||||||||||||||||||
| Industrivarden AB, C Shares | 5,390 | 98,013 | ||||||||||||||||||||||||
| Investor AB, B Shares | 57,362 | 2,062,001 | ||||||||||||||||||||||||
| Kungsleden AB | 4,826 | 32,259 | ||||||||||||||||||||||||
| L E Lundbergforetagen AB, B Shares | 538 | 25,886 | ||||||||||||||||||||||||
| NCC AB, B Shares | 56,478 | 1,646,760 | ||||||||||||||||||||||||
| Sandvik AB | 155,759 | 1,503,106 | ||||||||||||||||||||||||
| Securitas AB, B Shares | 34,798 | 443,120 | ||||||||||||||||||||||||
| Skanska AB, B Shares | 109,130 | 2,136,332 | ||||||||||||||||||||||||
| SKF AB, B Shares | 47,585 | 907,642 | ||||||||||||||||||||||||
| Tele2 AB, B Shares | 28,278 | 278,718 | ||||||||||||||||||||||||
| Telefonaktiebolaget LM Ericsson, B Shares | 766,755 | 7,473,868 | ||||||||||||||||||||||||
| TeliaSonera AB | 1,560,218 | 8,788,603 | ||||||||||||||||||||||||
| Volvo AB, B Shares | 143,826 | 1,561,843 | ||||||||||||||||||||||||
| Wihlborgs Fastigheter AB | 1,540 | 26,868 | ||||||||||||||||||||||||
| Switzerland 2.5% | 41,929,819 | |||||||||||||||||||||||||
| ABB, Ltd. (I) | 573,005 | 11,065,979 | ||||||||||||||||||||||||
| Actelion, Ltd. (I) | 373 | 50,640 | ||||||||||||||||||||||||
| Autoneum Holding AG (I) | 262 | 49,270 | ||||||||||||||||||||||||
| Baloise Holding AG | 2,819 | 344,760 | ||||||||||||||||||||||||
| Helvetia Holding AG | 319 | 168,003 | ||||||||||||||||||||||||
| LafargeHolcim, Ltd. (I) | 48,461 | 3,076,808 | ||||||||||||||||||||||||
| Nestle SA | 200,729 | 14,787,087 | ||||||||||||||||||||||||
| Swiss Life Holding AG (I) | 2,273 | 531,982 | ||||||||||||||||||||||||
| Swiss Re AG | 27,851 | 2,387,629 | ||||||||||||||||||||||||
| Swisscom AG | 6,323 | 3,412,958 | ||||||||||||||||||||||||
| The Swatch Group AG | 4,185 | 1,599,711 | ||||||||||||||||||||||||
| Vontobel Holding AG | 1,263 | 66,370 | ||||||||||||||||||||||||
| Zurich Insurance Group AG (I) | 15,984 | 4,388,622 | ||||||||||||||||||||||||
| Shares | Value | |||||||||||||||||||||||||
| United Kingdom 17.4% | $294,283,010 | |||||||||||||||||||||||||
| AstraZeneca PLC | 856,414 | 53,430,759 | ||||||||||||||||||||||||
| Aviva PLC | 235,799 | 1,736,085 | ||||||||||||||||||||||||
| BAE Systems PLC | 595,028 | 4,095,782 | ||||||||||||||||||||||||
| Balfour Beatty PLC | 131,474 | 546,963 | ||||||||||||||||||||||||
| BG Group PLC | 3,713 | 56,354 | ||||||||||||||||||||||||
| BP PLC | 9,075,569 | 50,303,595 | ||||||||||||||||||||||||
| British American Tobacco PLC | 279,390 | 14,794,341 | ||||||||||||||||||||||||
| BT Group PLC | 384,921 | 2,567,872 | ||||||||||||||||||||||||
| Carillion PLC | 87,734 | 457,545 | ||||||||||||||||||||||||
| Centrica PLC | 3,341,827 | 12,373,867 | ||||||||||||||||||||||||
| Compass Group PLC | 330,788 | 5,217,369 | ||||||||||||||||||||||||
| Fiat Chrysler Automobiles NV (I) | 6,932 | 97,188 | ||||||||||||||||||||||||
| GlaxoSmithKline PLC | 1,925,379 | 39,311,523 | ||||||||||||||||||||||||
| Home Retail Group PLC | 882,185 | 2,051,040 | ||||||||||||||||||||||||
| Imperial Tobacco Group PLC | 39,026 | 1,878,469 | ||||||||||||||||||||||||
| J Sainsbury PLC | 510,606 | 1,889,966 | ||||||||||||||||||||||||
| Kingfisher PLC | 776,574 | 4,220,309 | ||||||||||||||||||||||||
| Marks & Spencer Group PLC | 630,997 | 5,010,053 | ||||||||||||||||||||||||
| Next PLC | 8,893 | 1,076,766 | ||||||||||||||||||||||||
| Pearson PLC | 288,256 | 4,997,354 | ||||||||||||||||||||||||
| Prudential PLC | 2,272 | 49,035 | ||||||||||||||||||||||||
| Reckitt Benckiser Group PLC | 172,709 | 15,131,755 | ||||||||||||||||||||||||
| Royal Mail PLC | 242,303 | 1,713,142 | ||||||||||||||||||||||||
| Smiths Group PLC | 48,032 | 825,526 | ||||||||||||||||||||||||
| SSE PLC | 109,809 | 2,460,720 | ||||||||||||||||||||||||
| Tesco PLC | 5,360,565 | 15,558,612 | ||||||||||||||||||||||||
| The Sage Group PLC | 164,602 | 1,292,616 | ||||||||||||||||||||||||
| Unilever NV | 68,767 | 2,755,796 | ||||||||||||||||||||||||
| Unilever PLC | 34,568 | 1,386,342 | ||||||||||||||||||||||||
| Vodafone Group PLC | 10,685,099 | 36,793,397 | ||||||||||||||||||||||||
| WM Morrison Supermarkets PLC | 1,922,654 | 4,935,361 | ||||||||||||||||||||||||
| WPP PLC | 255,888 | 5,267,508 | ||||||||||||||||||||||||
| Preferred securities 1.0% | $16,597,447 | |||||||||||||||||||||||||
| (Cost $19,024,353) | ||||||||||||||||||||||||||
| Germany 1.0% | 16,597,447 | |||||||||||||||||||||||||
| Porsche Automobil Holding SE | 135,236 | 9,391,248 | ||||||||||||||||||||||||
| Volkswagen AG | 38,033 | 7,206,199 | ||||||||||||||||||||||||
| Rights 0.0% | $594 | |||||||||||||||||||||||||
| (Cost $0) | ||||||||||||||||||||||||||
| Commonwealth Bank of Australia (Expiration Date: 9-9-15; Strike Price: AUD 71.50) (I) | 235 | 594 | ||||||||||||||||||||||||
| Yield (%) | Shares | Value | ||||||||||||||||||||||||
| Securities lending collateral 0.5% | $8,502,257 | |||||||||||||||||||||||||
| (Cost $8,502,369) | ||||||||||||||||||||||||||
| John Hancock Collateral Trust (W) | 0.1436(Y) | 849,792 | 8,502,257 | |||||||||||||||||||||||
| Yield (%)* | Maturity date | Par value | Value | |||||||||||||||||||||||
| Short-term investments 6.5% | $110,956,869 | |||||||||||||||||||||||||
| (Cost $110,956,732) | ||||||||||||||||||||||||||
| U.S. Government 5.4% | 92,233,386 | |||||||||||||||||||||||||
| U.S. Treasury Bill | 0.033 | 11-27-15 | 10,265,000 | 10,264,959 | ||||||||||||||||||||||
| U.S. Treasury Bill | 0.087 | 11-12-15 | 15,000,000 | 14,999,850 | ||||||||||||||||||||||
| U.S. Treasury Bill | 0.115 | 01-07-16 | 67,000,000 | 66,968,577 | ||||||||||||||||||||||
| Yield (%) | Shares | Value | ||||||||||||||||||||||||
| Money market funds 1.1% | 18,723,483 | |||||||||||||||||||||||||
| JPMorgan U.S. Treasury Plus Money Market Fund | 0.0100(Y) | 18,723,483 | $18,723,483 | |||||||||||||||||||||||
| Total investments (Cost $1,819,236,442)† 99.2% | $1,682,309,023 | |||||||||||||||||||||||||
| Other assets and liabilities, net 0.8% | $12,909,759 | |||||||||||||||||||||||||
| Total net assets 100.0% | $1,695,218,782 | |||||||||||||||||||||||||
| The percentage shown for each investment category is the total value of the category as a percentage of the net assets of the fund. | ||||||||||||||||||||||||||
| Key to Currency Abbreviations | ||||||||||||||||||||||||||
| AUD | Australian Dollar | |||||||||||||||||||||||||
| Key to Security Abbreviations and Legend | ||||||||||||||||||||||||||
| REIT | Real Estate Investment Trust | |||||||||||||||||||||||||
| (I) | Non-income producing security. | |||||||||||||||||||||||||
| (L) | A portion of this security is on loan as of 8-31-15. | |||||||||||||||||||||||||
| (W) | Investment is an affiliate of the fund, the advisor and/or subadvisor. This security represents the investment of cash collateral received for securities lending. | |||||||||||||||||||||||||
| (Y) | The rate shown is the annualized seven-day yield as of 8-31-15. | |||||||||||||||||||||||||
| * | Yield represents either the annualized yield at the date of purchase, the stated coupon rate or, for floating rate securities, the rate at period end. | |||||||||||||||||||||||||
| † | At 8-31-15, the aggregate cost of investment securities for federal income tax purposes was $1,849,695,013. Net unrealized depreciation aggregated $167,385,990, of which $47,175,721 related to appreciated investment securities and $214,561,711 related to depreciated investment securities. | |||||||||||||||||||||||||
Financial statements
STATEMENT OF ASSETS AND LIABILITIES 8-31-15 (unaudited)
| Assets | ||||||||||||||||||||||||||||||||||||||||||||||
| Investments in unaffiliated issuers, at value (Cost $1,810,734,073) including $8,061,508 of securities loaned | $1,673,806,766 | |||||||||||||||||||||||||||||||||||||||||||||
| Investments in affiliated issuers, at value (Cost $8,502,369) | 8,502,257 | |||||||||||||||||||||||||||||||||||||||||||||
| Total investments, at value (Cost $1,819,236,442) | 1,682,309,023 | |||||||||||||||||||||||||||||||||||||||||||||
| Cash held at broker for futures contracts | 23,783 | |||||||||||||||||||||||||||||||||||||||||||||
| Receivable for investments sold | 21,350,089 | |||||||||||||||||||||||||||||||||||||||||||||
| Receivable for fund shares sold | 2,822,562 | |||||||||||||||||||||||||||||||||||||||||||||
| Dividends and interest receivable | 5,904,311 | |||||||||||||||||||||||||||||||||||||||||||||
| Receivable for securities lending income | 44,380 | |||||||||||||||||||||||||||||||||||||||||||||
| Other receivables and prepaid expenses | 129,000 | |||||||||||||||||||||||||||||||||||||||||||||
| Total assets | 1,712,583,148 | |||||||||||||||||||||||||||||||||||||||||||||
| Liabilities | ||||||||||||||||||||||||||||||||||||||||||||||
| Foreign currency overdraft, at value (cost $502,864) | 502,808 | |||||||||||||||||||||||||||||||||||||||||||||
| Payable for investments purchased | 6,525,156 | |||||||||||||||||||||||||||||||||||||||||||||
| Payable for fund shares repurchased | 1,179,786 | |||||||||||||||||||||||||||||||||||||||||||||
| Payable upon return of securities loaned | 8,466,075 | |||||||||||||||||||||||||||||||||||||||||||||
| Payable for futures variation margin | 319,000 | |||||||||||||||||||||||||||||||||||||||||||||
| Payable to affiliates | ||||||||||||||||||||||||||||||||||||||||||||||
| Accounting and legal services fees | 15,827 | |||||||||||||||||||||||||||||||||||||||||||||
| Transfer agent fees | 67,884 | |||||||||||||||||||||||||||||||||||||||||||||
| Distribution and service fees | 162 | |||||||||||||||||||||||||||||||||||||||||||||
| Trustees' fees | 4,224 | |||||||||||||||||||||||||||||||||||||||||||||
| Other liabilities and accrued expenses | 283,444 | |||||||||||||||||||||||||||||||||||||||||||||
| Total liabilities | 17,364,366 | |||||||||||||||||||||||||||||||||||||||||||||
| Net assets | $1,695,218,782 | |||||||||||||||||||||||||||||||||||||||||||||
| Net assets consist of | ||||||||||||||||||||||||||||||||||||||||||||||
| Paid-in capital | $1,839,886,268 | |||||||||||||||||||||||||||||||||||||||||||||
| Undistributed net investment income | 27,258,316 | |||||||||||||||||||||||||||||||||||||||||||||
| Accumulated net realized gain (loss) on investments and foreign currency transactions | (35,319,283 | ) | ||||||||||||||||||||||||||||||||||||||||||||
| Net unrealized appreciation (depreciation) on investments, futures contracts and translation of assets and liabilities in foreign currencies | (136,606,519 | ) | ||||||||||||||||||||||||||||||||||||||||||||
| Net assets | $1,695,218,782 | |||||||||||||||||||||||||||||||||||||||||||||
STATEMENT OF ASSETS AND LIABILITIES (continued)
| Net asset value per share | |||||||||||||||||||||
| Based on net asset values and shares outstanding - The fund has an unlimited number of shares authorized with no par value | |||||||||||||||||||||
| Class A ($117,833,217 ÷ 3,835,306 shares)1 | $30.72 | ||||||||||||||||||||
| Class B ($2,099,586 ÷ 68,798 shares)1 | $30.52 | ||||||||||||||||||||
| Class C ($11,977,338 ÷ 392,402 shares)1 | $30.52 | ||||||||||||||||||||
| Class I ($537,131,267 ÷ 17,395,382 shares) | $30.88 | ||||||||||||||||||||
| Class R1 ($472,409 ÷ 15,434 shares) | $30.61 | ||||||||||||||||||||
| Class R2 ($211,641 ÷ 6,869 shares) | $30.81 | ||||||||||||||||||||
| Class R3 ($212,113 ÷ 6,884 shares) | $30.81 | ||||||||||||||||||||
| Class R4 ($111,077 ÷ 3,603 shares) | $30.83 | ||||||||||||||||||||
| Class R5 ($97,734 ÷ 3,168 shares) | $30.85 | ||||||||||||||||||||
| Class R6 ($190,910 ÷ 6,172 shares) | $30.93 | ||||||||||||||||||||
| Class 1 ($40,551,780 ÷ 1,310,881 shares) | $30.93 | ||||||||||||||||||||
| Class NAV ($984,329,710 ÷ 31,841,859 shares) | $30.91 | ||||||||||||||||||||
| Maximum offering price per share | |||||||||||||||||||||
| Class A (net assets value per share ÷ 95%)2 | $32.34 | ||||||||||||||||||||
| 1 | Redemption price per share is equal to net asset value less any applicable contingent deferred sales charge. | |||||||||||||||||||
| 2 | On single retail sales of less than $50,000. On sales of $50,000 or more and on group sales the offering price is reduced. | |||||||||||||||||||
STATEMENT OF OPERATIONS For the six months ended 8-31-15 (unaudited)
| Investment income | ||||||||||||||||||||||||||||||||||||||||
| Dividends | $39,285,510 | |||||||||||||||||||||||||||||||||||||||
| Securities lending | 941,827 | |||||||||||||||||||||||||||||||||||||||
| Interest | 4,070 | |||||||||||||||||||||||||||||||||||||||
| Less foreign taxes withheld | (4,782,559 | ) | ||||||||||||||||||||||||||||||||||||||
| Total investment income | 35,448,848 | |||||||||||||||||||||||||||||||||||||||
| Expenses | ||||||||||||||||||||||||||||||||||||||||
| Investment management fees | 7,370,713 | |||||||||||||||||||||||||||||||||||||||
| Distribution and service fees | 271,666 | |||||||||||||||||||||||||||||||||||||||
| Accounting and legal services fees | 105,324 | |||||||||||||||||||||||||||||||||||||||
| Transfer agent fees | 401,288 | |||||||||||||||||||||||||||||||||||||||
| Trustees' fees | 10,509 | |||||||||||||||||||||||||||||||||||||||
| State registration fees | 90,072 | |||||||||||||||||||||||||||||||||||||||
| Printing and postage | 46,804 | |||||||||||||||||||||||||||||||||||||||
| Professional fees | 49,499 | |||||||||||||||||||||||||||||||||||||||
| Custodian fees | 468,575 | |||||||||||||||||||||||||||||||||||||||
| Registration and filing fees | 27,161 | |||||||||||||||||||||||||||||||||||||||
| Other | 14,920 | |||||||||||||||||||||||||||||||||||||||
| Total expenses | 8,856,531 | |||||||||||||||||||||||||||||||||||||||
| Less expense reductions | (91,720 | ) | ||||||||||||||||||||||||||||||||||||||
| Net expenses | 8,764,811 | |||||||||||||||||||||||||||||||||||||||
| Net investment income | 26,684,037 | |||||||||||||||||||||||||||||||||||||||
| Realized and unrealized gain (loss) | ||||||||||||||||||||||||||||||||||||||||
| Net realized gain (loss) on | ||||||||||||||||||||||||||||||||||||||||
| Investments in unaffiliated issuers and foreign currency transactions | 27,569,522 | |||||||||||||||||||||||||||||||||||||||
| Investments in affiliated issuers | (517 | ) | ||||||||||||||||||||||||||||||||||||||
| 27,569,005 | ||||||||||||||||||||||||||||||||||||||||
| Change in net unrealized appreciation (depreciation) of | ||||||||||||||||||||||||||||||||||||||||
| Investments in unaffiliated issuers and translation of assets and liabilities in foreign currencies | (189,551,198 | ) | ||||||||||||||||||||||||||||||||||||||
| Investments in affiliated issuers | 100 | |||||||||||||||||||||||||||||||||||||||
| Futures contracts | 375,718 | |||||||||||||||||||||||||||||||||||||||
| (189,175,380 | ) | |||||||||||||||||||||||||||||||||||||||
| Net realized and unrealized loss | (161,606,375 | ) | ||||||||||||||||||||||||||||||||||||||
| Decrease in net assets from operations | ($134,922,338 | ) | ||||||||||||||||||||||||||||||||||||||
STATEMENTS OF CHANGES IN NET ASSETS
| Six months ended 8-31-15 | Year ended 2-28-15 | |||||||||||||||||||||||||||||||||||||||||||||||
| (unaudited) | ||||||||||||||||||||||||||||||||||||||||||||||||
| Increase (decrease) in net assets | ||||||||||||||||||||||||||||||||||||||||||||||||
| From operations | ||||||||||||||||||||||||||||||||||||||||||||||||
| Net investment income | $26,684,037 | $31,584,385 | ||||||||||||||||||||||||||||||||||||||||||||||
| Net realized gain | 27,569,005 | 121,544,541 | ||||||||||||||||||||||||||||||||||||||||||||||
| Change in net unrealized appreciation (depreciation) | (189,175,380 | ) | (194,624,802 | ) | ||||||||||||||||||||||||||||||||||||||||||||
| Decrease in net assets resulting from operations | (134,922,338 | ) | (41,495,876 | ) | ||||||||||||||||||||||||||||||||||||||||||||
| Distributions to shareholders | ||||||||||||||||||||||||||||||||||||||||||||||||
| From net investment income | ||||||||||||||||||||||||||||||||||||||||||||||||
| Class A | — | (3,337,701 | ) | |||||||||||||||||||||||||||||||||||||||||||||
| Class B | — | (60,350 | ) | |||||||||||||||||||||||||||||||||||||||||||||
| Class C | — | (272,511 | ) | |||||||||||||||||||||||||||||||||||||||||||||
| Class I | — | (19,689,726 | ) | |||||||||||||||||||||||||||||||||||||||||||||
| Class R1 | — | (12,379 | ) | |||||||||||||||||||||||||||||||||||||||||||||
| Class R2 | — | (6,327 | ) | |||||||||||||||||||||||||||||||||||||||||||||
| Class R3 | — | (5,356 | ) | |||||||||||||||||||||||||||||||||||||||||||||
| Class R4 | — | (2,953 | ) | |||||||||||||||||||||||||||||||||||||||||||||
| Class R5 | — | (4,261 | ) | |||||||||||||||||||||||||||||||||||||||||||||
| Class R6 | — | (5,738 | ) | |||||||||||||||||||||||||||||||||||||||||||||
| Class 1 | — | (1,452,520 | ) | |||||||||||||||||||||||||||||||||||||||||||||
| Class NAV | — | (26,695,437 | ) | |||||||||||||||||||||||||||||||||||||||||||||
| Total distributions | — | (51,545,259 | ) | |||||||||||||||||||||||||||||||||||||||||||||
| From fund share transactions | 347,679,770 | 59,050,987 | ||||||||||||||||||||||||||||||||||||||||||||||
| Total increase (decrease) | 212,757,432 | (33,990,148 | ) | |||||||||||||||||||||||||||||||||||||||||||||
| Net assets | ||||||||||||||||||||||||||||||||||||||||||||||||
| Beginning of period | 1,482,461,350 | 1,516,451,498 | ||||||||||||||||||||||||||||||||||||||||||||||
| End of period | $1,695,218,782 | $1,482,461,350 | ||||||||||||||||||||||||||||||||||||||||||||||
| Undistributed net investment income | $27,258,316 | $574,279 | ||||||||||||||||||||||||||||||||||||||||||||||
Financial highlights
| Class A Shares Period ended | 8-31-15 | 1 | 2-28-15 | 2-28-14 | 2-28-13 | 2-29-12 | 2-28-11 | |||||||||||||||||||||||||||||||||||||||||||||||||||||||||||||||||||||||||||||||||||||||||||||||||||||||||||||||
| Per share operating performance | ||||||||||||||||||||||||||||||||||||||||||||||||||||||||||||||||||||||||||||||||||||||||||||||||||||||||||||||||||||||
| Net asset value, beginning of period | $33.20 | $35.40 | $28.81 | $27.72 | $30.85 | $25.74 | ||||||||||||||||||||||||||||||||||||||||||||||||||||||||||||||||||||||||||||||||||||||||||||||||||||||||||||||||
| Net investment income2 | 0.47 | 0.62 | 1.05 | 3 | 0.71 | 0.58 | 0.33 | |||||||||||||||||||||||||||||||||||||||||||||||||||||||||||||||||||||||||||||||||||||||||||||||||||||||||||||||
| Net realized and unrealized gain (loss) on investments | (2.95 | ) | (1.77 | ) | 6.52 | 1.31 | (3.32 | ) | 5.09 | |||||||||||||||||||||||||||||||||||||||||||||||||||||||||||||||||||||||||||||||||||||||||||||||||||||||||||||
| Total from investment operations | (2.48 | ) | (1.15 | ) | 7.57 | 2.02 | (2.74 | ) | 5.42 | |||||||||||||||||||||||||||||||||||||||||||||||||||||||||||||||||||||||||||||||||||||||||||||||||||||||||||||
| Less distributions | ||||||||||||||||||||||||||||||||||||||||||||||||||||||||||||||||||||||||||||||||||||||||||||||||||||||||||||||||||||||
| From net investment income | — | (1.05 | ) | (0.98 | ) | (0.93 | ) | (0.39 | ) | (0.31 | ) | |||||||||||||||||||||||||||||||||||||||||||||||||||||||||||||||||||||||||||||||||||||||||||||||||||||||||||
| Net asset value, end of period | $30.72 | $33.20 | $35.40 | $28.81 | $27.72 | $30.85 | ||||||||||||||||||||||||||||||||||||||||||||||||||||||||||||||||||||||||||||||||||||||||||||||||||||||||||||||||
| Total return (%)4,5 | (7.47 | ) 6 | (2.98 | ) | 26.56 | 7.41 | (8.73 | ) | 21.13 | |||||||||||||||||||||||||||||||||||||||||||||||||||||||||||||||||||||||||||||||||||||||||||||||||||||||||||||
| Ratios and supplemental data | ||||||||||||||||||||||||||||||||||||||||||||||||||||||||||||||||||||||||||||||||||||||||||||||||||||||||||||||||||||||
| Net assets, end of period (in millions) | $118 | $112 | $109 | $91 | $374 | 333 | ||||||||||||||||||||||||||||||||||||||||||||||||||||||||||||||||||||||||||||||||||||||||||||||||||||||||||||||||
| Ratios (as a percentage of average net assets): | ||||||||||||||||||||||||||||||||||||||||||||||||||||||||||||||||||||||||||||||||||||||||||||||||||||||||||||||||||||||
| Expenses before reductions | 1.41 | 7 | 1.47 | 1.46 | 1.58 | 1.58 | 1.61 | |||||||||||||||||||||||||||||||||||||||||||||||||||||||||||||||||||||||||||||||||||||||||||||||||||||||||||||||
| Expenses including reductions | 1.40 | 7 | 1.47 | 1.46 | 1.58 | 1.58 | 1.60 | |||||||||||||||||||||||||||||||||||||||||||||||||||||||||||||||||||||||||||||||||||||||||||||||||||||||||||||||
| Net investment income | 2.81 | 7 | 1.81 | 3.27 | 3 | 2.66 | 2.05 | 1.21 | ||||||||||||||||||||||||||||||||||||||||||||||||||||||||||||||||||||||||||||||||||||||||||||||||||||||||||||||
| Portfolio turnover (%) | 28 | 81 | 47 | 53 | 42 | 39 | ||||||||||||||||||||||||||||||||||||||||||||||||||||||||||||||||||||||||||||||||||||||||||||||||||||||||||||||||
| 1 | Six months ended 8-31-15. Unaudited. | ||||||||||||||||||||||||||||||||||||||||||||||||||||||||||||||||||||||||||||||||||
| 2 | Based on average daily shares outstanding. | ||||||||||||||||||||||||||||||||||||||||||||||||||||||||||||||||||||||||||||||||||
| 3 | Net investment income per share and ratio of net investment income to average net assets reflect a special dividend received by the fund which amounted to $0.24 and 0.77%, respectively. | ||||||||||||||||||||||||||||||||||||||||||||||||||||||||||||||||||||||||||||||||||
| 4 | Total returns would have been lower had certain expenses not been reduced during the applicable periods. | ||||||||||||||||||||||||||||||||||||||||||||||||||||||||||||||||||||||||||||||||||
| 5 | Does not reflect the effect of sales charges, if any. | ||||||||||||||||||||||||||||||||||||||||||||||||||||||||||||||||||||||||||||||||||
| 6 | Not annualized. | ||||||||||||||||||||||||||||||||||||||||||||||||||||||||||||||||||||||||||||||||||
| 7 | Annualized. | ||||||||||||||||||||||||||||||||||||||||||||||||||||||||||||||||||||||||||||||||||
| Class B Shares Period ended | 8-31-15 | 1 | 2-28-15 | 2-28-14 | 2-28-13 | 2-29-12 | 2-28-11 | |||||||||||||||||||||||||||||||||||||||||||||||||||||||||||||||||||||||||||||||||||||||||||||||||||||||||||||||
| Per share operating performance | ||||||||||||||||||||||||||||||||||||||||||||||||||||||||||||||||||||||||||||||||||||||||||||||||||||||||||||||||||||||
| Net asset value, beginning of period | $33.12 | $35.27 | $28.70 | $27.61 | $30.70 | $25.62 | ||||||||||||||||||||||||||||||||||||||||||||||||||||||||||||||||||||||||||||||||||||||||||||||||||||||||||||||||
| Net investment income2 | 0.34 | 0.34 | 0.73 | 3 | 0.42 | 0.44 | 0.18 | |||||||||||||||||||||||||||||||||||||||||||||||||||||||||||||||||||||||||||||||||||||||||||||||||||||||||||||||
| Net realized and unrealized gain (loss) on investments | (2.94 | ) | (1.74 | ) | 6.53 | 1.41 | (3.34 | ) | 5.01 | |||||||||||||||||||||||||||||||||||||||||||||||||||||||||||||||||||||||||||||||||||||||||||||||||||||||||||||
| Total from investment operations | (2.60 | ) | (1.40 | ) | 7.26 | 1.83 | (2.90 | ) | 5.19 | |||||||||||||||||||||||||||||||||||||||||||||||||||||||||||||||||||||||||||||||||||||||||||||||||||||||||||||
| Less distributions | ||||||||||||||||||||||||||||||||||||||||||||||||||||||||||||||||||||||||||||||||||||||||||||||||||||||||||||||||||||||
| From net investment income | — | (0.75 | ) | (0.69 | ) | (0.74 | ) | (0.19 | ) | (0.11 | ) | |||||||||||||||||||||||||||||||||||||||||||||||||||||||||||||||||||||||||||||||||||||||||||||||||||||||||||
| Net asset value, end of period | $30.52 | $33.12 | $35.27 | $28.70 | $27.61 | $30.70 | ||||||||||||||||||||||||||||||||||||||||||||||||||||||||||||||||||||||||||||||||||||||||||||||||||||||||||||||||
| Total return (%)4,5 | (7.85 | ) 6 | (3.77 | ) | 25.50 | 6.71 | (9.38 | ) | 20.28 | |||||||||||||||||||||||||||||||||||||||||||||||||||||||||||||||||||||||||||||||||||||||||||||||||||||||||||||
| Ratios and supplemental data | ||||||||||||||||||||||||||||||||||||||||||||||||||||||||||||||||||||||||||||||||||||||||||||||||||||||||||||||||||||||
| Net assets, end of period (in millions) | $2 | $3 | $3 | $3 | $4 | $5 | ||||||||||||||||||||||||||||||||||||||||||||||||||||||||||||||||||||||||||||||||||||||||||||||||||||||||||||||||
| Ratios (as a percentage of average net assets): | ||||||||||||||||||||||||||||||||||||||||||||||||||||||||||||||||||||||||||||||||||||||||||||||||||||||||||||||||||||||
| Expenses before reductions | 2.46 | 7 | 2.66 | 2.64 | 2.94 | 2.49 | 2.36 | |||||||||||||||||||||||||||||||||||||||||||||||||||||||||||||||||||||||||||||||||||||||||||||||||||||||||||||||
| Expenses including reductions | 2.20 | 7 | 2.31 | 2.30 | 2.30 | 2.30 | 2.30 | |||||||||||||||||||||||||||||||||||||||||||||||||||||||||||||||||||||||||||||||||||||||||||||||||||||||||||||||
| Net investment income | 2.06 | 7 | 1.02 | 2.28 | 3 | 1.56 | 1.58 | 0.65 | ||||||||||||||||||||||||||||||||||||||||||||||||||||||||||||||||||||||||||||||||||||||||||||||||||||||||||||||
| Portfolio turnover (%) | 28 | 81 | 47 | 53 | 42 | 39 | ||||||||||||||||||||||||||||||||||||||||||||||||||||||||||||||||||||||||||||||||||||||||||||||||||||||||||||||||
| 1 | Six months ended 8-31-15. Unaudited. | ||||||||||||||||||||||||||||||||||||||||||||||||||||||||||||||||||||||||||||||||||
| 2 | Based on average daily shares outstanding. | ||||||||||||||||||||||||||||||||||||||||||||||||||||||||||||||||||||||||||||||||||
| 3 | Net investment income per share and ratio of net investment income to average net assets reflect a special dividend received by the fund which amounted to $0.24 and 0.77%, respectively. | ||||||||||||||||||||||||||||||||||||||||||||||||||||||||||||||||||||||||||||||||||
| 4 | Total returns would have been lower had certain expenses not been reduced during the applicable periods. | ||||||||||||||||||||||||||||||||||||||||||||||||||||||||||||||||||||||||||||||||||
| 5 | Does not reflect the effect of sales charges, if any. | ||||||||||||||||||||||||||||||||||||||||||||||||||||||||||||||||||||||||||||||||||
| 6 | Not annualized. | ||||||||||||||||||||||||||||||||||||||||||||||||||||||||||||||||||||||||||||||||||
| 7 | Annualized. | ||||||||||||||||||||||||||||||||||||||||||||||||||||||||||||||||||||||||||||||||||
| Class C Shares Period ended | 8-31-15 | 1 | 2-28-15 | 2-28-14 | 2-28-13 | 2-29-12 | 2-28-11 | |||||||||||||||||||||||||||||||||||||||||||||||||||||||||||||||||||||||||||||||||||||||||||||||||||||||||||||||
| Per share operating performance | ||||||||||||||||||||||||||||||||||||||||||||||||||||||||||||||||||||||||||||||||||||||||||||||||||||||||||||||||||||||
| Net asset value, beginning of period | $33.12 | $35.27 | $28.70 | $27.61 | $30.71 | $25.62 | ||||||||||||||||||||||||||||||||||||||||||||||||||||||||||||||||||||||||||||||||||||||||||||||||||||||||||||||||
| Net investment income2 | 0.34 | 0.29 | 0.83 | 3 | 0.42 | 0.43 | 0.17 | |||||||||||||||||||||||||||||||||||||||||||||||||||||||||||||||||||||||||||||||||||||||||||||||||||||||||||||||
| Net realized and unrealized gain (loss) on investments | (2.94 | ) | (1.68 | ) | 6.43 | 1.41 | (3.34 | ) | 5.03 | |||||||||||||||||||||||||||||||||||||||||||||||||||||||||||||||||||||||||||||||||||||||||||||||||||||||||||||
| Total from investment operations | (2.60 | ) | (1.39 | ) | 7.26 | 1.83 | (2.91 | ) | 5.20 | |||||||||||||||||||||||||||||||||||||||||||||||||||||||||||||||||||||||||||||||||||||||||||||||||||||||||||||
| Less distributions | ||||||||||||||||||||||||||||||||||||||||||||||||||||||||||||||||||||||||||||||||||||||||||||||||||||||||||||||||||||||
| From net investment income | — | (0.76 | ) | (0.69 | ) | (0.74 | ) | (0.19 | ) | (0.11 | ) | |||||||||||||||||||||||||||||||||||||||||||||||||||||||||||||||||||||||||||||||||||||||||||||||||||||||||||
| Net asset value, end of period | $30.52 | $33.12 | $35.27 | $28.70 | $27.61 | $30.71 | ||||||||||||||||||||||||||||||||||||||||||||||||||||||||||||||||||||||||||||||||||||||||||||||||||||||||||||||||
| Total return (%)4,5 | (7.85 | ) 6 | (3.76 | ) | 25.50 | 6.71 | (9.41 | ) | 20.32 | |||||||||||||||||||||||||||||||||||||||||||||||||||||||||||||||||||||||||||||||||||||||||||||||||||||||||||||
| Ratios and supplemental data | ||||||||||||||||||||||||||||||||||||||||||||||||||||||||||||||||||||||||||||||||||||||||||||||||||||||||||||||||||||||
| Net assets, end of period (in millions) | $12 | $12 | $8 | $4 | $4 | $5 | ||||||||||||||||||||||||||||||||||||||||||||||||||||||||||||||||||||||||||||||||||||||||||||||||||||||||||||||||
| Ratios (as a percentage of average net assets): | ||||||||||||||||||||||||||||||||||||||||||||||||||||||||||||||||||||||||||||||||||||||||||||||||||||||||||||||||||||||
| Expenses before reductions | 2.17 | 7 | 2.30 | 2.46 | 2.77 | 2.50 | 2.47 | |||||||||||||||||||||||||||||||||||||||||||||||||||||||||||||||||||||||||||||||||||||||||||||||||||||||||||||||
| Expenses including reductions | 2.16 | 7 | 2.29 | 2.30 | 2.30 | 2.30 | 2.30 | |||||||||||||||||||||||||||||||||||||||||||||||||||||||||||||||||||||||||||||||||||||||||||||||||||||||||||||||
| Net investment income | 2.07 | 7 | 0.86 | 2.59 | 3 | 1.54 | 1.53 | �� | 0.62 | |||||||||||||||||||||||||||||||||||||||||||||||||||||||||||||||||||||||||||||||||||||||||||||||||||||||||||||
| Portfolio turnover (%) | 28 | 81 | 47 | 53 | 42 | 39 | ||||||||||||||||||||||||||||||||||||||||||||||||||||||||||||||||||||||||||||||||||||||||||||||||||||||||||||||||
| 1 | Six months ended 8-31-15. Unaudited. | ||||||||||||||||||||||||||||||||||||||||||||||||||||||||||||||||||||||||||||||||||
| 2 | Based on average daily shares outstanding. | ||||||||||||||||||||||||||||||||||||||||||||||||||||||||||||||||||||||||||||||||||
| 3 | Net investment income per share and ratio of net investment income to average net assets reflect a special dividend received by the fund which amounted to $0.24 and 0.77%, respectively. | ||||||||||||||||||||||||||||||||||||||||||||||||||||||||||||||||||||||||||||||||||
| 4 | Does not reflect the effect of sales charges, if any. | ||||||||||||||||||||||||||||||||||||||||||||||||||||||||||||||||||||||||||||||||||
| 5 | Total returns would have been lower had certain expenses not been reduced during the applicable periods. | ||||||||||||||||||||||||||||||||||||||||||||||||||||||||||||||||||||||||||||||||||
| 6 | Not annualized. | ||||||||||||||||||||||||||||||||||||||||||||||||||||||||||||||||||||||||||||||||||
| 7 | Annualized. | ||||||||||||||||||||||||||||||||||||||||||||||||||||||||||||||||||||||||||||||||||
| Class I Shares Period ended | 8-31-15 | 1 | 2-28-15 | 2-28-14 | 2-28-13 | 2-29-12 | 2-28-11 | |||||||||||||||||||||||||||||||||||||||||||||||||||||||||||||||||||||||||||||||||||||||||||||||||||||||||||||||
| Per share operating performance | ||||||||||||||||||||||||||||||||||||||||||||||||||||||||||||||||||||||||||||||||||||||||||||||||||||||||||||||||||||||
| Net asset value, beginning of period | $33.32 | $35.52 | $28.90 | $27.78 | $30.94 | $25.80 | ||||||||||||||||||||||||||||||||||||||||||||||||||||||||||||||||||||||||||||||||||||||||||||||||||||||||||||||||
| Net investment income2 | 0.53 | 0.71 | 1.10 | 3 | 0.68 | 0.72 | 0.45 | |||||||||||||||||||||||||||||||||||||||||||||||||||||||||||||||||||||||||||||||||||||||||||||||||||||||||||||||
| Net realized and unrealized gain (loss) on investments | (2.97 | ) | (1.76 | ) | 6.60 | 1.49 | (3.36 | ) | 5.12 | |||||||||||||||||||||||||||||||||||||||||||||||||||||||||||||||||||||||||||||||||||||||||||||||||||||||||||||
| Total from investment operations | (2.44 | ) | (1.05 | ) | 7.70 | 2.17 | (2.64 | ) | 5.57 | |||||||||||||||||||||||||||||||||||||||||||||||||||||||||||||||||||||||||||||||||||||||||||||||||||||||||||||
| Less distributions | ||||||||||||||||||||||||||||||||||||||||||||||||||||||||||||||||||||||||||||||||||||||||||||||||||||||||||||||||||||||
| From net investment income | — | (1.15 | ) | (1.08 | ) | (1.05 | ) | (0.52 | ) | (0.43 | ) | |||||||||||||||||||||||||||||||||||||||||||||||||||||||||||||||||||||||||||||||||||||||||||||||||||||||||||
| Net asset value, end of period | $30.88 | $33.32 | $35.52 | $28.90 | $27.78 | $30.94 | ||||||||||||||||||||||||||||||||||||||||||||||||||||||||||||||||||||||||||||||||||||||||||||||||||||||||||||||||
| Total return (%)4 | (7.32 | ) 5 | (2.65 | ) | 26.94 | 7.92 | (8.33 | ) | 21.73 | |||||||||||||||||||||||||||||||||||||||||||||||||||||||||||||||||||||||||||||||||||||||||||||||||||||||||||||
| Ratios and supplemental data | ||||||||||||||||||||||||||||||||||||||||||||||||||||||||||||||||||||||||||||||||||||||||||||||||||||||||||||||||||||||
| Net assets, end of period (in millions) | $537 | $541 | $527 | $392 | $411 | $291 | ||||||||||||||||||||||||||||||||||||||||||||||||||||||||||||||||||||||||||||||||||||||||||||||||||||||||||||||||
| Ratios (as a percentage of average net assets): | ||||||||||||||||||||||||||||||||||||||||||||||||||||||||||||||||||||||||||||||||||||||||||||||||||||||||||||||||||||||
| Expenses before reductions | 1.09 | 6 | 1.14 | 1.15 | 1.17 | 1.16 | 1.12 | |||||||||||||||||||||||||||||||||||||||||||||||||||||||||||||||||||||||||||||||||||||||||||||||||||||||||||||||
| Expenses including reductions | 1.08 | 6 | 1.13 | 1.15 | 1.17 | 1.16 | 1.12 | |||||||||||||||||||||||||||||||||||||||||||||||||||||||||||||||||||||||||||||||||||||||||||||||||||||||||||||||
| Net investment income | 3.15 | 6 | 2.08 | 3.42 | 3 | 2.49 | 2.54 | 1.61 | ||||||||||||||||||||||||||||||||||||||||||||||||||||||||||||||||||||||||||||||||||||||||||||||||||||||||||||||
| Portfolio turnover (%) | 28 | 81 | 47 | 53 | 42 | 39 | ||||||||||||||||||||||||||||||||||||||||||||||||||||||||||||||||||||||||||||||||||||||||||||||||||||||||||||||||
| 1 | Six months ended 8-31-15. Unaudited. | ||||||||||||||||||||||||||||||||||||||||||||||||||||||||||||||||||||||||||||||||||
| 2 | Based on average daily shares outstanding. | ||||||||||||||||||||||||||||||||||||||||||||||||||||||||||||||||||||||||||||||||||
| 3 | Net investment income per share and ratio of net investment income to average net assets reflect a special dividend received by the fund which amounted to $0.24 and 0.77%, respectively. | ||||||||||||||||||||||||||||||||||||||||||||||||||||||||||||||||||||||||||||||||||
| 4 | Total returns would have been lower had certain expenses not been reduced during the applicable periods. | ||||||||||||||||||||||||||||||||||||||||||||||||||||||||||||||||||||||||||||||||||
| 5 | Not annualized. | ||||||||||||||||||||||||||||||||||||||||||||||||||||||||||||||||||||||||||||||||||
| 6 | Annualized. | ||||||||||||||||||||||||||||||||||||||||||||||||||||||||||||||||||||||||||||||||||
| Class R1 Shares Period ended | 8-31-15 | 1 | 2-28-15 | 2-28-14 | 2-28-13 | 2-29-12 | 2-28-11 | |||||||||||||||||||||||||||||||||||||||||||||||||||||||||||||||||||||||||||||||||||||||||||||||||||||||||||||||
| Per share operating performance | ||||||||||||||||||||||||||||||||||||||||||||||||||||||||||||||||||||||||||||||||||||||||||||||||||||||||||||||||||||||
| Net asset value, beginning of period | $33.16 | $35.33 | $28.75 | $27.66 | $30.77 | $25.67 | ||||||||||||||||||||||||||||||||||||||||||||||||||||||||||||||||||||||||||||||||||||||||||||||||||||||||||||||||
| Net investment income2 | 0.39 | 0.43 | 0.85 | 3 | 0.51 | 0.53 | 0.24 | |||||||||||||||||||||||||||||||||||||||||||||||||||||||||||||||||||||||||||||||||||||||||||||||||||||||||||||||
| Net realized and unrealized gain (loss) on investments | (2.94 | ) | (1.70 | ) | 6.56 | 1.43 | (3.33 | ) | 5.06 | |||||||||||||||||||||||||||||||||||||||||||||||||||||||||||||||||||||||||||||||||||||||||||||||||||||||||||||
| Total from investment operations | (2.55 | ) | (1.27 | ) | 7.41 | 1.94 | (2.80 | ) | 5.30 | |||||||||||||||||||||||||||||||||||||||||||||||||||||||||||||||||||||||||||||||||||||||||||||||||||||||||||||
| From net investment income | — | (0.90 | ) | (0.83 | ) | (0.85 | ) | (0.31 | ) | (0.20 | ) | |||||||||||||||||||||||||||||||||||||||||||||||||||||||||||||||||||||||||||||||||||||||||||||||||||||||||||
| Net asset value, end of period | $30.61 | $33.16 | $35.33 | $28.75 | $27.66 | $30.77 | ||||||||||||||||||||||||||||||||||||||||||||||||||||||||||||||||||||||||||||||||||||||||||||||||||||||||||||||||
| Total return (%)4 | (7.69 | ) 5 | (3.38 | ) | 26.00 | 7.10 | (9.00 | ) | 20.71 | 4 | ||||||||||||||||||||||||||||||||||||||||||||||||||||||||||||||||||||||||||||||||||||||||||||||||||||||||||||
| Ratios and supplemental data | ||||||||||||||||||||||||||||||||||||||||||||||||||||||||||||||||||||||||||||||||||||||||||||||||||||||||||||||||||||||
| Net assets, end of period (in millions) | — | 6 | $1 | — | 6 | — | 6 | — | 6 | — | 6 | |||||||||||||||||||||||||||||||||||||||||||||||||||||||||||||||||||||||||||||||||||||||||||||||||||||||||||
| Ratios (as a percentage of average net assets): | ||||||||||||||||||||||||||||||||||||||||||||||||||||||||||||||||||||||||||||||||||||||||||||||||||||||||||||||||||||||
| Expenses before reductions | 3.26 | 7 | 4.91 | 5.71 | 7.16 | 7.37 | 6.88 | |||||||||||||||||||||||||||||||||||||||||||||||||||||||||||||||||||||||||||||||||||||||||||||||||||||||||||||||
| Expenses including reductions | 1.86 | 7 | 1.90 | 1.90 | 1.90 | 1.90 | 1.92 | |||||||||||||||||||||||||||||||||||||||||||||||||||||||||||||||||||||||||||||||||||||||||||||||||||||||||||||||
| Net investment income | 2.37 | 7 | 1.26 | 2.67 | 3 | 1.87 | 1.88 | 0.90 | ||||||||||||||||||||||||||||||||||||||||||||||||||||||||||||||||||||||||||||||||||||||||||||||||||||||||||||||
| Portfolio turnover (%) | 28 | 81 | 47 | 53 | 420 | 39 | ||||||||||||||||||||||||||||||||||||||||||||||||||||||||||||||||||||||||||||||||||||||||||||||||||||||||||||||||
| 1 | Six months ended 8-31-15. Unaudited. | ||||||||||||||||||||||||||||||||||||||||||||||||||||||||||||||||||||||||||||||||||
| 2 | Based on average daily shares outstanding. | ||||||||||||||||||||||||||||||||||||||||||||||||||||||||||||||||||||||||||||||||||
| 3 | Net investment income per share and ratio of net investment income to average net assets reflect a special dividend received by the fund which amounted to $0.24 and 0.77%, respectively. | ||||||||||||||||||||||||||||||||||||||||||||||||||||||||||||||||||||||||||||||||||
| 4 | Total returns would have been lower had certain expenses not been reduced during the applicable periods. | ||||||||||||||||||||||||||||||||||||||||||||||||||||||||||||||||||||||||||||||||||
| 5 | Not annualized. | ||||||||||||||||||||||||||||||||||||||||||||||||||||||||||||||||||||||||||||||||||
| 6 | Less than $500,000. | ||||||||||||||||||||||||||||||||||||||||||||||||||||||||||||||||||||||||||||||||||
| 7 | Annualized. | ||||||||||||||||||||||||||||||||||||||||||||||||||||||||||||||||||||||||||||||||||
| Class R2 Shares Period ended | 8-31-15 | 1 | 2-28-15 | 2-28-14 | 2-28-13 | 2 | ||||||||||||||||||||||||||||||||||||||||||||||||||||||||||||||||||||||||||||||||
| Per share operating performance | ||||||||||||||||||||||||||||||||||||||||||||||||||||||||||||||||||||||||||||||||||||||
| Net asset value, beginning of period | $33.34 | $35.53 | $28.91 | $27.80 | ||||||||||||||||||||||||||||||||||||||||||||||||||||||||||||||||||||||||||||||||||
| Net investment income3 | 0.51 | 0.51 | 0.94 | 4 | 0.59 | |||||||||||||||||||||||||||||||||||||||||||||||||||||||||||||||||||||||||||||||||
| Net realized and unrealized gain (loss) on investments | (3.04 | ) | (1.72 | ) | 6.60 | 1.43 | ||||||||||||||||||||||||||||||||||||||||||||||||||||||||||||||||||||||||||||||||
| Total from investment operations | (2.53 | ) | (1.21 | ) | 7.54 | 2.02 | ||||||||||||||||||||||||||||||||||||||||||||||||||||||||||||||||||||||||||||||||
| Less distributions | ||||||||||||||||||||||||||||||||||||||||||||||||||||||||||||||||||||||||||||||||||||||
| From net investment income | — | (0.98 | ) | (0.92 | ) | (0.91 | ) | |||||||||||||||||||||||||||||||||||||||||||||||||||||||||||||||||||||||||||||||
| Net asset value, end of period | $30.81 | $33.34 | $35.53 | $28.91 | ||||||||||||||||||||||||||||||||||||||||||||||||||||||||||||||||||||||||||||||||||
| Total return (%)5 | (7.59 | ) 6 | (3.15 | ) | 26.32 | 7.39 | ||||||||||||||||||||||||||||||||||||||||||||||||||||||||||||||||||||||||||||||||
| Ratios and supplemental data | ||||||||||||||||||||||||||||||||||||||||||||||||||||||||||||||||||||||||||||||||||||||
| Net assets, end of period (in millions) | — | 7 | — | 7 | — | 7 | — | 7 | ||||||||||||||||||||||||||||||||||||||||||||||||||||||||||||||||||||||||||||||
| Ratios (as a percentage of average net assets): | ||||||||||||||||||||||||||||||||||||||||||||||||||||||||||||||||||||||||||||||||||||||
| Expenses before reductions | 5.28 | 8 | 8.98 | 15.89 | 20.70 | |||||||||||||||||||||||||||||||||||||||||||||||||||||||||||||||||||||||||||||||||
| Expenses including reductions | 1.63 | 8 | 1.65 | 1.65 | 1.65 | |||||||||||||||||||||||||||||||||||||||||||||||||||||||||||||||||||||||||||||||||
| Net investment income | 3.04 | 8 | 1.51 | 2.94 | 4 | 2.16 | ||||||||||||||||||||||||||||||||||||||||||||||||||||||||||||||||||||||||||||||||
| Portfolio turnover (%) | 28 | 81 | 47 | 53 | ||||||||||||||||||||||||||||||||||||||||||||||||||||||||||||||||||||||||||||||||||
| 1 | Six months ended 8-31-15. Unaudited. | ||||||||||||||||||||||||||||||||||||||||||||||||||||||||||||||||||||||||||||||||||
| 2 | The inception date for Class R2 shares is 3-1-12. | ||||||||||||||||||||||||||||||||||||||||||||||||||||||||||||||||||||||||||||||||||
| 3 | Based on average daily shares outstanding. | ||||||||||||||||||||||||||||||||||||||||||||||||||||||||||||||||||||||||||||||||||
| 4 | Net investment income per share and ratio of net investment income to average net assets reflect a special dividend received by the fund which amounted to $0.24 and 0.77%, respectively. | ||||||||||||||||||||||||||||||||||||||||||||||||||||||||||||||||||||||||||||||||||
| 5 | Total returns would have been lower had certain expenses not been reduced during the applicable periods. | ||||||||||||||||||||||||||||||||||||||||||||||||||||||||||||||||||||||||||||||||||
| 6 | Not annualized. | ||||||||||||||||||||||||||||||||||||||||||||||||||||||||||||||||||||||||||||||||||
| 7 | Less than $500,000. | ||||||||||||||||||||||||||||||||||||||||||||||||||||||||||||||||||||||||||||||||||
| 8 | Annualized. | ||||||||||||||||||||||||||||||||||||||||||||||||||||||||||||||||||||||||||||||||||
| Class R3 Shares Period ended | 8-31-15 | 1 | 2-28-15 | 2-28-14 | 2-28-13 | 2-29-12 | 2-28-11 | |||||||||||||||||||||||||||||||||||||||||||||||||||||||||||||||||||||||||||||||||||||||||||||||||||||||||||||||
| Per share operating performance | ||||||||||||||||||||||||||||||||||||||||||||||||||||||||||||||||||||||||||||||||||||||||||||||||||||||||||||||||||||||
| Net asset value, beginning of period | $33.36 | $35.54 | $28.92 | $27.80 | $30.94 | $25.80 | ||||||||||||||||||||||||||||||||||||||||||||||||||||||||||||||||||||||||||||||||||||||||||||||||||||||||||||||||
| Net investment income2 | 0.41 | 0.48 | 1.09 | 3 | 0.53 | 0.57 | 0.29 | |||||||||||||||||||||||||||||||||||||||||||||||||||||||||||||||||||||||||||||||||||||||||||||||||||||||||||||||
| Net realized and unrealized gain (loss) on investments | (2.96 | ) | (1.73 | ) | 6.40 | 1.46 | (3.38 | ) | 5.08 | |||||||||||||||||||||||||||||||||||||||||||||||||||||||||||||||||||||||||||||||||||||||||||||||||||||||||||||
| Total from investment operations | (2.55 | ) | (1.25 | ) | 7.49 | 1.99 | (2.81 | ) | 5.37 | |||||||||||||||||||||||||||||||||||||||||||||||||||||||||||||||||||||||||||||||||||||||||||||||||||||||||||||
| Less distributions | ||||||||||||||||||||||||||||||||||||||||||||||||||||||||||||||||||||||||||||||||||||||||||||||||||||||||||||||||||||||
| From net investment income | — | (0.93 | ) | (0.87 | ) | (0.87 | ) | (0.33 | ) | (0.23 | ) | |||||||||||||||||||||||||||||||||||||||||||||||||||||||||||||||||||||||||||||||||||||||||||||||||||||||||||
| Net asset value, end of period | $30.81 | $33.36 | $35.54 | $28.92 | $27.80 | $30.94 | ||||||||||||||||||||||||||||||||||||||||||||||||||||||||||||||||||||||||||||||||||||||||||||||||||||||||||||||||
| Total return (%)4 | (7.64 | ) 5 | (3.28 | ) | 26.12 | 7.28 | (8.95 | ) | 20.87 | |||||||||||||||||||||||||||||||||||||||||||||||||||||||||||||||||||||||||||||||||||||||||||||||||||||||||||||
| Ratios and supplemental data | ||||||||||||||||||||||||||||||||||||||||||||||||||||||||||||||||||||||||||||||||||||||||||||||||||||||||||||||||||||||
| Net assets, end of period (in millions) | — | 6 | — | 6 | — | 6 | — | 6 | — | 6 | — | 6 | ||||||||||||||||||||||||||||||||||||||||||||||||||||||||||||||||||||||||||||||||||||||||||||||||||||||||||
| Ratios (as a percentage of average net assets): | ||||||||||||||||||||||||||||||||||||||||||||||||||||||||||||||||||||||||||||||||||||||||||||||||||||||||||||||||||||||
| Expenses before reductions | 4.89 | 7 | 9.34 | 18.96 | 47.36 | 45.66 | 44.55 | |||||||||||||||||||||||||||||||||||||||||||||||||||||||||||||||||||||||||||||||||||||||||||||||||||||||||||||||
| Expenses including reductions | 1.72 | 7 | 1.80 | 1.80 | 1.80 | 1.80 | 1.83 | |||||||||||||||||||||||||||||||||||||||||||||||||||||||||||||||||||||||||||||||||||||||||||||||||||||||||||||||
| Net investment income | 2.46 | 7 | 1.40 | 3.36 | 3 | 1.93 | 2.01 | 1.05 | ||||||||||||||||||||||||||||||||||||||||||||||||||||||||||||||||||||||||||||||||||||||||||||||||||||||||||||||
| Portfolio turnover (%) | 28 | 81 | 47 | 53 | 42 | 39 | ||||||||||||||||||||||||||||||||||||||||||||||||||||||||||||||||||||||||||||||||||||||||||||||||||||||||||||||||
| 1 | Six months ended 8-31-15. Unaudited. | ||||||||||||||||||||||||||||||||||||||||||||||||||||||||||||||||||||||||||||||||||
| 2 | Based on average daily shares outstanding. | ||||||||||||||||||||||||||||||||||||||||||||||||||||||||||||||||||||||||||||||||||
| 3 | Net investment income per share and ratio of net investment income to average net assets reflect a special dividend received by the fund which amounted to $0.24 and 0.77%, respectively. | ||||||||||||||||||||||||||||||||||||||||||||||||||||||||||||||||||||||||||||||||||
| 4 | Total returns would have been lower had certain expenses not been reduced during the applicable periods. | ||||||||||||||||||||||||||||||||||||||||||||||||||||||||||||||||||||||||||||||||||
| 5 | Not annualized. | ||||||||||||||||||||||||||||||||||||||||||||||||||||||||||||||||||||||||||||||||||
| 6 | Less than $500,000. | ||||||||||||||||||||||||||||||||||||||||||||||||||||||||||||||||||||||||||||||||||
| 7 | Annualized. | ||||||||||||||||||||||||||||||||||||||||||||||||||||||||||||||||||||||||||||||||||
| Class R4 Shares Period ended | 8-31-15 | 1 | 2-28-15 | 2-28-14 | 2-28-13 | 2-29-12 | 2-28-11 | |||||||||||||||||||||||||||||||||||||||||||||||||||||||||||||||||||||||||||||||||||||||||||||||||||||||||||||||
| Per share operating performance | ||||||||||||||||||||||||||||||||||||||||||||||||||||||||||||||||||||||||||||||||||||||||||||||||||||||||||||||||||||||
| Net asset value, beginning of period | $33.31 | $35.51 | $28.89 | $27.79 | $30.94 | $25.80 | ||||||||||||||||||||||||||||||||||||||||||||||||||||||||||||||||||||||||||||||||||||||||||||||||||||||||||||||||
| Net investment income2 | 0.51 | 0.69 | 0.99 | 3 | 0.64 | 0.65 | 0.37 | |||||||||||||||||||||||||||||||||||||||||||||||||||||||||||||||||||||||||||||||||||||||||||||||||||||||||||||||
| Net realized and unrealized gain (loss) on investments | (2.99 | ) | (1.82 | ) | 6.63 | 1.44 | (3.38 | ) | 5.08 | |||||||||||||||||||||||||||||||||||||||||||||||||||||||||||||||||||||||||||||||||||||||||||||||||||||||||||||
| Total from investment operations | (2.48 | ) | (1.13 | ) | 7.62 | 2.08 | (2.73 | ) | 5.45 | |||||||||||||||||||||||||||||||||||||||||||||||||||||||||||||||||||||||||||||||||||||||||||||||||||||||||||||
| Less distributions | ||||||||||||||||||||||||||||||||||||||||||||||||||||||||||||||||||||||||||||||||||||||||||||||||||||||||||||||||||||||
| From net investment income | — | (1.07 | ) | (1.00 | ) | (0.98 | ) | (0.42 | ) | (0.31 | ) | |||||||||||||||||||||||||||||||||||||||||||||||||||||||||||||||||||||||||||||||||||||||||||||||||||||||||||
| Net asset value, end of period | $30.83 | $33.31 | $35.51 | $28.89 | $27.79 | $30.94 | ||||||||||||||||||||||||||||||||||||||||||||||||||||||||||||||||||||||||||||||||||||||||||||||||||||||||||||||||
| Total return (%)4 | (7.45 | ) 5 | (2.91 | ) | 26.66 | 7.61 | (8.67 | ) | 21.21 | |||||||||||||||||||||||||||||||||||||||||||||||||||||||||||||||||||||||||||||||||||||||||||||||||||||||||||||
| Ratios and supplemental data | ||||||||||||||||||||||||||||||||||||||||||||||||||||||||||||||||||||||||||||||||||||||||||||||||||||||||||||||||||||||
| Net assets, end of period (in millions) | — | 6 | — | 6 | — | 6 | — | 6 | — | 6 | — | 6 | ||||||||||||||||||||||||||||||||||||||||||||||||||||||||||||||||||||||||||||||||||||||||||||||||||||||||||
| Ratios (as a percentage of average net assets): | ||||||||||||||||||||||||||||||||||||||||||||||||||||||||||||||||||||||||||||||||||||||||||||||||||||||||||||||||||||||
| Expenses before reductions | 6.34 | 7 | 15.63 | 21.10 | 42.45 | 42.74 | 44.22 | |||||||||||||||||||||||||||||||||||||||||||||||||||||||||||||||||||||||||||||||||||||||||||||||||||||||||||||||
| Expenses including reductions | 1.35 | 7 | 1.40 | 1.40 | 1.43 | 1.50 | 1.53 | |||||||||||||||||||||||||||||||||||||||||||||||||||||||||||||||||||||||||||||||||||||||||||||||||||||||||||||||
| Net investment income | 3.06 | 7 | 2.01 | 3.05 | 3 | 2.34 | 2.29 | 1.34 | ||||||||||||||||||||||||||||||||||||||||||||||||||||||||||||||||||||||||||||||||||||||||||||||||||||||||||||||
| Portfolio turnover (%) | 28 | 81 | 47 | 53 | 42 | 39 | ||||||||||||||||||||||||||||||||||||||||||||||||||||||||||||||||||||||||||||||||||||||||||||||||||||||||||||||||
| 1 | Six months ended 8-31-15. Unaudited. | ||||||||||||||||||||||||||||||||||||||||||||||||||||||||||||||||||||||||||||||||||
| 2 | Based on average daily shares outstanding. | ||||||||||||||||||||||||||||||||||||||||||||||||||||||||||||||||||||||||||||||||||
| 3 | Net investment income per share and ratio of net investment income to average net assets reflect a special dividend received by the fund which amounted to $0.24 and 0.77%, respectively. | ||||||||||||||||||||||||||||||||||||||||||||||||||||||||||||||||||||||||||||||||||
| 4 | Total returns would have been lower had certain expenses not been reduced during the applicable periods. | ||||||||||||||||||||||||||||||||||||||||||||||||||||||||||||||||||||||||||||||||||
| 5 | Not annualized. | ||||||||||||||||||||||||||||||||||||||||||||||||||||||||||||||||||||||||||||||||||
| 6 | Less than $500,000. | ||||||||||||||||||||||||||||||||||||||||||||||||||||||||||||||||||||||||||||||||||
| 7 | Annualized. | ||||||||||||||||||||||||||||||||||||||||||||||||||||||||||||||||||||||||||||||||||
| Class R5 Shares Period ended | 8-31-15 | 1 | 2-28-15 | 2-28-14 | 2-28-13 | 2-29-12 | 2-28-11 | |||||||||||||||||||||||||||||||||||||||||||||||||||||||||||||||||||||||||||||||||||||||||||||||||||||||||||||||
| Per share operating performance | ||||||||||||||||||||||||||||||||||||||||||||||||||||||||||||||||||||||||||||||||||||||||||||||||||||||||||||||||||||||
| Net asset value, beginning of period | $33.30 | $35.51 | $28.90 | $27.78 | $30.94 | $25.79 | ||||||||||||||||||||||||||||||||||||||||||||||||||||||||||||||||||||||||||||||||||||||||||||||||||||||||||||||||
| Net investment income2 | 0.56 | 0.70 | 1.11 | 3 | 0.70 | 0.73 | 0.44 | |||||||||||||||||||||||||||||||||||||||||||||||||||||||||||||||||||||||||||||||||||||||||||||||||||||||||||||||
| Net realized and unrealized gain (loss) on investments | (3.01 | ) | (1.77 | ) | 6.57 | 1.45 | (3.38 | ) | 5.10 | |||||||||||||||||||||||||||||||||||||||||||||||||||||||||||||||||||||||||||||||||||||||||||||||||||||||||||||
| Total from investment operations | (2.45 | ) | (1.07 | ) | 7.68 | 2.15 | (2.65 | ) | 5.54 | |||||||||||||||||||||||||||||||||||||||||||||||||||||||||||||||||||||||||||||||||||||||||||||||||||||||||||||
| Less distributions | ||||||||||||||||||||||||||||||||||||||||||||||||||||||||||||||||||||||||||||||||||||||||||||||||||||||||||||||||||||||
| From net investment income | — | (1.14 | ) | (1.07 | ) | (1.03 | ) | (0.51 | ) | (0.39 | ) | |||||||||||||||||||||||||||||||||||||||||||||||||||||||||||||||||||||||||||||||||||||||||||||||||||||||||||
| Net asset value, end of period | $30.85 | $33.30 | $35.51 | $28.90 | $27.78 | $30.94 | ||||||||||||||||||||||||||||||||||||||||||||||||||||||||||||||||||||||||||||||||||||||||||||||||||||||||||||||||
| Total return (%)4 | (7.36 | ) 5 | (2.72 | ) | 26.87 | 7.88 | (8.38 | ) | 21.59 | |||||||||||||||||||||||||||||||||||||||||||||||||||||||||||||||||||||||||||||||||||||||||||||||||||||||||||||
| Ratios and supplemental data | ||||||||||||||||||||||||||||||||||||||||||||||||||||||||||||||||||||||||||||||||||||||||||||||||||||||||||||||||||||||
| Net assets, end of period (in millions) | — | 6 | — | 6 | — | 6 | — | 6 | — | 6 | — | 6 | ||||||||||||||||||||||||||||||||||||||||||||||||||||||||||||||||||||||||||||||||||||||||||||||||||||||||||
| Ratios (as a percentage of average net assets): | ||||||||||||||||||||||||||||||||||||||||||||||||||||||||||||||||||||||||||||||||||||||||||||||||||||||||||||||||||||||
| Expenses before reductions | 6.34 | 7 | 12.76 | 16.15 | 21.14 | 20.87 | 31.41 | |||||||||||||||||||||||||||||||||||||||||||||||||||||||||||||||||||||||||||||||||||||||||||||||||||||||||||||||
| Expenses including reductions | 1.16 | 7 | 1.20 | 1.20 | 1.20 | 1.20 | 1.22 | |||||||||||||||||||||||||||||||||||||||||||||||||||||||||||||||||||||||||||||||||||||||||||||||||||||||||||||||
| Net investment income | 3.33 | 7 | 2.05 | 3.45 | 3 | 2.57 | 2.58 | 1.58 | ||||||||||||||||||||||||||||||||||||||||||||||||||||||||||||||||||||||||||||||||||||||||||||||||||||||||||||||
| Portfolio turnover (%) | 28 | 81 | 47 | 53 | 42 | 39 | ||||||||||||||||||||||||||||||||||||||||||||||||||||||||||||||||||||||||||||||||||||||||||||||||||||||||||||||||
| 1 | Six months ended 8-31-15. Unaudited. | ||||||||||||||||||||||||||||||||||||||||||||||||||||||||||||||||||||||||||||||||||
| 2 | Based on average daily shares outstanding. | ||||||||||||||||||||||||||||||||||||||||||||||||||||||||||||||||||||||||||||||||||
| 3 | Net investment income per share and ratio of net investment income to average net assets reflect a special dividend received by the fund which amounted to $0.24 and 0.77%, respectively. | ||||||||||||||||||||||||||||||||||||||||||||||||||||||||||||||||||||||||||||||||||
| 4 | Total returns would have been lower had certain expenses not been reduced during the applicable periods. | ||||||||||||||||||||||||||||||||||||||||||||||||||||||||||||||||||||||||||||||||||
| 5 | Not annualized. | ||||||||||||||||||||||||||||||||||||||||||||||||||||||||||||||||||||||||||||||||||
| 6 | Less than $500,000. | ||||||||||||||||||||||||||||||||||||||||||||||||||||||||||||||||||||||||||||||||||
| 7 | Annualized. | ||||||||||||||||||||||||||||||||||||||||||||||||||||||||||||||||||||||||||||||||||
| Class R6 Shares Period ended | 8-31-15 | 1 | 2-28-15 | 2-28-14 | 2-28-13 | 2-29-12 | 2 | |||||||||||||||||||||||||||||||||||||||||||||||||||||||||||||||||||||||||||||||||||||||||||||||||||||||||||||||
| Per share operating performance | ||||||||||||||||||||||||||||||||||||||||||||||||||||||||||||||||||||||||||||||||||||||||||||||||||||||||||||||||||||||
| Net asset value, beginning of period | $33.36 | $35.57 | $28.94 | $27.82 | $28.00 | |||||||||||||||||||||||||||||||||||||||||||||||||||||||||||||||||||||||||||||||||||||||||||||||||||||||||||||||||
| Net investment income3 | 0.53 | 0.76 | 1.13 | 4 | 0.73 | 0.26 | ||||||||||||||||||||||||||||||||||||||||||||||||||||||||||||||||||||||||||||||||||||||||||||||||||||||||||||||||
| Net realized and unrealized gain (loss) on investments | (2.96 | ) | (1.77 | ) | 6.60 | 1.45 | 0.10 | |||||||||||||||||||||||||||||||||||||||||||||||||||||||||||||||||||||||||||||||||||||||||||||||||||||||||||||||
| Total from investment operations | (2.43 | ) | (1.01 | ) | 7.73 | 2.18 | 0.36 | |||||||||||||||||||||||||||||||||||||||||||||||||||||||||||||||||||||||||||||||||||||||||||||||||||||||||||||||
| Less distributions | ||||||||||||||||||||||||||||||||||||||||||||||||||||||||||||||||||||||||||||||||||||||||||||||||||||||||||||||||||||||
| From net investment income | — | (1.20 | ) | (1.10 | ) | (1.06 | ) | (0.54 | ) | |||||||||||||||||||||||||||||||||||||||||||||||||||||||||||||||||||||||||||||||||||||||||||||||||||||||||||||
| Net asset value, end of period | $30.93 | $33.36 | $35.57 | $28.94 | $27.82 | |||||||||||||||||||||||||||||||||||||||||||||||||||||||||||||||||||||||||||||||||||||||||||||||||||||||||||||||||
| Total return (%)5 | (7.28 | ) 6 | (2.51 | ) | 27.00 | 7.95 | 1.49 | 6 | ||||||||||||||||||||||||||||||||||||||||||||||||||||||||||||||||||||||||||||||||||||||||||||||||||||||||||||||
| Ratios and supplemental data | ||||||||||||||||||||||||||||||||||||||||||||||||||||||||||||||||||||||||||||||||||||||||||||||||||||||||||||||||||||||
| Net assets, end of period (in millions) | — | 7 | — | 7 | — | 7 | — | 7 | — | 7 | ||||||||||||||||||||||||||||||||||||||||||||||||||||||||||||||||||||||||||||||||||||||||||||||||||||||||||||
| Ratios (as a percentage of average net assets): | ||||||||||||||||||||||||||||||||||||||||||||||||||||||||||||||||||||||||||||||||||||||||||||||||||||||||||||||||||||||
| Expenses before reductions | 5.89 | 8 | 11.51 | 1.17 | 21.97 | 16.83 | 8 | |||||||||||||||||||||||||||||||||||||||||||||||||||||||||||||||||||||||||||||||||||||||||||||||||||||||||||||||
| Expenses including reductions | 0.96 | 8 | 1.00 | 1.12 | 1.12 | 1.12 | 8 | |||||||||||||||||||||||||||||||||||||||||||||||||||||||||||||||||||||||||||||||||||||||||||||||||||||||||||||||
| Net investment income | 3.15 | 8 | 2.22 | 3.50 | 4 | 2.66 | 1.98 | 8 | ||||||||||||||||||||||||||||||||||||||||||||||||||||||||||||||||||||||||||||||||||||||||||||||||||||||||||||||
| Portfolio turnover (%) | 28 | 81 | 47 | 53 | 42 | 9 | ||||||||||||||||||||||||||||||||||||||||||||||||||||||||||||||||||||||||||||||||||||||||||||||||||||||||||||||||
| 1 | Six months ended 8-31-15. Unaudited. | ||||||||||||||||||||||||||||||||||||||||||||||||||||||||||||||||||||||||||||||||||
| 2 | The inception date for Class R6 shares is 9-1-11. | ||||||||||||||||||||||||||||||||||||||||||||||||||||||||||||||||||||||||||||||||||
| 3 | Based on average daily shares outstanding. | ||||||||||||||||||||||||||||||||||||||||||||||||||||||||||||||||||||||||||||||||||
| 4 | Net investment income per share and ratio of net investment income to average net assets reflect a special dividend received by the fund which amounted to $0.24 and 0.77%, respectively. | ||||||||||||||||||||||||||||||||||||||||||||||||||||||||||||||||||||||||||||||||||
| 5 | Total returns would have been lower had certain expenses not been reduced during the applicable periods. | ||||||||||||||||||||||||||||||||||||||||||||||||||||||||||||||||||||||||||||||||||
| 6 | Not annualized. | ||||||||||||||||||||||||||||||||||||||||||||||||||||||||||||||||||||||||||||||||||
| 7 | Less than $500,000. | ||||||||||||||||||||||||||||||||||||||||||||||||||||||||||||||||||||||||||||||||||
| 8 | Annualized. | ||||||||||||||||||||||||||||||||||||||||||||||||||||||||||||||||||||||||||||||||||
| 9 | The portfolio turnover is shown for the period from 3-1-11 to 2-29-12. | ||||||||||||||||||||||||||||||||||||||||||||||||||||||||||||||||||||||||||||||||||
| Class 1 Shares Period ended | 8-31-15 | 1 | 2-28-15 | 2-28-14 | 2-28-13 | 2-29-12 | 2-28-11 | |||||||||||||||||||||||||||||||||||||||||||||||||||||||||||||||||||||||||||||||||||||||||||||||||||||||||||||||
| Per share operating performance | ||||||||||||||||||||||||||||||||||||||||||||||||||||||||||||||||||||||||||||||||||||||||||||||||||||||||||||||||||||||
| Net asset value, beginning of period | $33.37 | $35.58 | $28.94 | $27.82 | $30.99 | $25.84 | ||||||||||||||||||||||||||||||||||||||||||||||||||||||||||||||||||||||||||||||||||||||||||||||||||||||||||||||||
| Net investment income2 | 0.55 | 0.76 | 1.14 | 3 | 0.75 | 0.79 | 0.50 | |||||||||||||||||||||||||||||||||||||||||||||||||||||||||||||||||||||||||||||||||||||||||||||||||||||||||||||||
| Net realized and unrealized gain (loss) on investments | (2.99 | ) | (1.78 | ) | 6.61 | 1.44 | (3.41 | ) | 5.09 | |||||||||||||||||||||||||||||||||||||||||||||||||||||||||||||||||||||||||||||||||||||||||||||||||||||||||||||
| Total from investment operations | (2.44 | ) | (1.02 | ) | 7.75 | 2.19 | (2.62 | ) | 5.59 | |||||||||||||||||||||||||||||||||||||||||||||||||||||||||||||||||||||||||||||||||||||||||||||||||||||||||||||
| Less distributions | ||||||||||||||||||||||||||||||||||||||||||||||||||||||||||||||||||||||||||||||||||||||||||||||||||||||||||||||||||||||
| From net investment income | — | (1.19 | ) | (1.11 | ) | (1.07 | ) | (0.55 | ) | (0.44 | ) | |||||||||||||||||||||||||||||||||||||||||||||||||||||||||||||||||||||||||||||||||||||||||||||||||||||||||||
| Net asset value, end of period | $30.93 | $33.37 | $35.58 | $28.94 | $27.82 | $30.99 | ||||||||||||||||||||||||||||||||||||||||||||||||||||||||||||||||||||||||||||||||||||||||||||||||||||||||||||||||
| Total return (%)4 | (7.31 | ) 5 | (2.56 | ) | 27.09 | 8.00 | (8.27 | ) | 21.75 | |||||||||||||||||||||||||||||||||||||||||||||||||||||||||||||||||||||||||||||||||||||||||||||||||||||||||||||
| Ratios and supplemental data | ||||||||||||||||||||||||||||||||||||||||||||||||||||||||||||||||||||||||||||||||||||||||||||||||||||||||||||||||||||||
| Net assets, end of period (in millions) | $41 | $42 | $44 | $37 | $39 | $47 | ||||||||||||||||||||||||||||||||||||||||||||||||||||||||||||||||||||||||||||||||||||||||||||||||||||||||||||||||
| Ratios (as a percentage of average net assets): | ||||||||||||||||||||||||||||||||||||||||||||||||||||||||||||||||||||||||||||||||||||||||||||||||||||||||||||||||||||||
| Expenses before reductions | 1.01 | 6 | 1.06 | 1.06 | 1.08 | 1.07 | 1.07 | |||||||||||||||||||||||||||||||||||||||||||||||||||||||||||||||||||||||||||||||||||||||||||||||||||||||||||||||
| Expenses including reductions | 1.01 | 6 | 1.05 | 1.06 | 1.08 | 1.07 | 1.07 | |||||||||||||||||||||||||||||||||||||||||||||||||||||||||||||||||||||||||||||||||||||||||||||||||||||||||||||||
| Net investment income | 3.24 | 6 | 2.20 | 3.53 | 3 | 2.76 | 2.76 | 1.83 | ||||||||||||||||||||||||||||||||||||||||||||||||||||||||||||||||||||||||||||||||||||||||||||||||||||||||||||||
| Portfolio turnover (%) | 28 | 81 | 47 | 53 | 42 | 39 | ||||||||||||||||||||||||||||||||||||||||||||||||||||||||||||||||||||||||||||||||||||||||||||||||||||||||||||||||
| 1 | Six months ended 8-31-15. Unaudited. | ||||||||||||||||||||||||||||||||||||||||||||||||||||||||||||||||||||||||||||||||||
| 2 | Based on average daily shares outstanding. | ||||||||||||||||||||||||||||||||||||||||||||||||||||||||||||||||||||||||||||||||||
| 3 | Net investment income per share and ratio of net investment income to average net assets reflect a special dividend received by the fund which amounted to $0.24 and 0.77%, respectively. | ||||||||||||||||||||||||||||||||||||||||||||||||||||||||||||||||||||||||||||||||||
| 4 | Total returns would have been lower had certain expenses not been reduced during the applicable periods. | ||||||||||||||||||||||||||||||||||||||||||||||||||||||||||||||||||||||||||||||||||
| 5 | Not annualized. | ||||||||||||||||||||||||||||||||||||||||||||||||||||||||||||||||||||||||||||||||||
| 6 | Annualized. | ||||||||||||||||||||||||||||||||||||||||||||||||||||||||||||||||||||||||||||||||||
| Class NAV Shares Period ended | 8-31-15 | 1 | 2-28-15 | 2-28-14 | 2-28-13 | 2-29-12 | 2-28-11 | |||||||||||||||||||||||||||||||||||||||||||||||||||||||||||||||||||||||||||||||||||||||||||||||||||||||||||||||
| Per share operating performance | ||||||||||||||||||||||||||||||||||||||||||||||||||||||||||||||||||||||||||||||||||||||||||||||||||||||||||||||||||||||
| Net asset value, beginning of period | $33.34 | $35.55 | $28.92 | $27.80 | $30.98 | $25.82 | ||||||||||||||||||||||||||||||||||||||||||||||||||||||||||||||||||||||||||||||||||||||||||||||||||||||||||||||||
| Net investment income2 | 0.55 | 0.77 | 1.14 | 3 | 0.82 | 0.81 | 0.51 | |||||||||||||||||||||||||||||||||||||||||||||||||||||||||||||||||||||||||||||||||||||||||||||||||||||||||||||||
| Net realized and unrealized gain (loss) on investments | (2.98 | ) | (1.78 | ) | 6.62 | 1.38 | (3.43 | ) | 5.10 | |||||||||||||||||||||||||||||||||||||||||||||||||||||||||||||||||||||||||||||||||||||||||||||||||||||||||||||
| Total from investment operations | (2.43 | ) | (1.01 | ) | 7.76 | 2.20 | (2.62 | ) | 5.61 | |||||||||||||||||||||||||||||||||||||||||||||||||||||||||||||||||||||||||||||||||||||||||||||||||||||||||||||
| Less distributions | ||||||||||||||||||||||||||||||||||||||||||||||||||||||||||||||||||||||||||||||||||||||||||||||||||||||||||||||||||||||
| From net investment income | — | (1.20 | ) | (1.13 | ) | (1.08 | ) | (0.56 | ) | (0.45 | ) | |||||||||||||||||||||||||||||||||||||||||||||||||||||||||||||||||||||||||||||||||||||||||||||||||||||||||||
| Net asset value, end of period | $30.91 | $33.34 | $35.55 | $28.92 | $27.80 | $30.98 | ||||||||||||||||||||||||||||||||||||||||||||||||||||||||||||||||||||||||||||||||||||||||||||||||||||||||||||||||
| Total return (%)4 | (7.29 | ) 5 | (2.51 | ) | 27.14 | 8.06 | (8.24 | ) | 21.85 | |||||||||||||||||||||||||||||||||||||||||||||||||||||||||||||||||||||||||||||||||||||||||||||||||||||||||||||
| Ratios and supplemental data | ||||||||||||||||||||||||||||||||||||||||||||||||||||||||||||||||||||||||||||||||||||||||||||||||||||||||||||||||||||||
| Net assets, end of period (in millions) | $984 | $771 | $823 | $611 | $753 | $920 | ||||||||||||||||||||||||||||||||||||||||||||||||||||||||||||||||||||||||||||||||||||||||||||||||||||||||||||||||
| Ratios (as a percentage of average net assets): | ||||||||||||||||||||||||||||||||||||||||||||||||||||||||||||||||||||||||||||||||||||||||||||||||||||||||||||||||||||||
| Expenses before reductions | 0.96 | 6 | 1.01 | 1.01 | 1.03 | 1.02 | 1.02 | |||||||||||||||||||||||||||||||||||||||||||||||||||||||||||||||||||||||||||||||||||||||||||||||||||||||||||||||
| Expenses including reductions | 0.96 | 6 | 1.00 | 1.00 | 1.03 | 1.02 | 1.02 | |||||||||||||||||||||||||||||||||||||||||||||||||||||||||||||||||||||||||||||||||||||||||||||||||||||||||||||||
| Net investment income | 3.26 | 6 | 2.25 | 3.54 | 3 | 3.03 | 2.84 | 1.87 | ||||||||||||||||||||||||||||||||||||||||||||||||||||||||||||||||||||||||||||||||||||||||||||||||||||||||||||||
| Portfolio turnover (%) | 28 | 81 | 47 | 53 | 42 | 39 | ||||||||||||||||||||||||||||||||||||||||||||||||||||||||||||||||||||||||||||||||||||||||||||||||||||||||||||||||
| 1 | Six months ended 8-31-15. Unaudited. | ||||||||||||||||||||||||||||||||||||||||||||||||||||||||||||||||||||||||||||||||||
| 2 | Based on average daily shares outstanding. | ||||||||||||||||||||||||||||||||||||||||||||||||||||||||||||||||||||||||||||||||||
| 3 | Net investment income per share and ratio of net investment income to average net assets reflect a special dividend received by the fund which amounted to $0.24 and 0.77%, respectively. | ||||||||||||||||||||||||||||||||||||||||||||||||||||||||||||||||||||||||||||||||||
| 4 | Total returns would have been lower had certain expenses not been reduced during the applicable periods. | ||||||||||||||||||||||||||||||||||||||||||||||||||||||||||||||||||||||||||||||||||
| 5 | Not annualized. | ||||||||||||||||||||||||||||||||||||||||||||||||||||||||||||||||||||||||||||||||||
| 6 | Annualized. | ||||||||||||||||||||||||||||||||||||||||||||||||||||||||||||||||||||||||||||||||||
Note 1 — Organization
John Hancock International Core Fund (the fund) is a series of John Hancock Funds III (the Trust), an open-end management investment company organized as a Massachusetts business trust and registered under the Investment Company Act of 1940, as amended (the 1940 Act). The investment objective of the fund is to seek high total return.
The fund may offer multiple classes of shares. The shares currently offered are detailed in the Statement of assets and liabilities. Class A and Class C shares are offered to all investors. Class B shares are closed to new investors. Class I shares are offered to institutions and certain investors. Class R1, Class R2, Class R3, Class R4, and Class R5 shares are available only to certain retirement plans. Class R6 shares are available only to certain retirement plans, institutions and other investors. Class 1 shares are offered only to certain affiliates of Manulife Financial Corporation (MFC). Class NAV shares are offered to John Hancock affiliated funds of funds and certain 529 plans. Shareholders of each class have exclusive voting rights to matters that affect that class. The distribution and service fees, if any, and transfer agent fees, for each class may differ. Class B shares convert to Class A shares eight years after purchase.
Note 2 — Significant accounting policies
The financial statements have been prepared in conformity with accounting principles generally accepted in the United States of America (US GAAP), which require management to make certain estimates and assumptions as of the date of the financial statements. Actual results could differ from those estimates and those differences could be significant. The fund qualifies as an investment company under Topic 946 of Accounting Standards Codification of US GAAP.
Events or transactions occurring after the end of the fiscal period through the date that the financial statements were issued have been evaluated in the preparation of the financial statements. The following summarizes the significant accounting policies of the fund.
Security valuation. Investments are stated at value as of the close of regular trading on the New York Stock Exchange (NYSE), normally at 4:00 p.m., Eastern Time. In order to value the securities, the fund uses the following valuation techniques: Equity securities held by the fund are valued at the last sale price or official closing price on the exchange where the security was acquired or most likely will be sold. In the event there were no sales during the day or closing prices are not available, the securities are valued using the last available bid price. Investments by the fund in open-end mutual funds, including John Hancock Collateral Trust (JHCT), are valued at their respective net asset values each business day. Foreign securities and currencies are valued in U.S. dollars, based on foreign currency exchange rates supplied by an independent pricing vendor. Securities that trade only in the over-the-counter (OTC) market are valued using bid prices.
Other portfolio securities and assets, for which reliable market quotations are not readily available, are valued at fair value as determined in good faith by the fund's Pricing Committee following procedures established by the Board of Trustees. The frequency with which these fair valuation procedures are used cannot be predicted and fair value of securities may differ significantly from the value that would have been used had a ready market for such securities existed. Trading in foreign securities may be completed before the daily close of trading on the NYSE. Significant events at the issuer or market level may affect the values of securities between the time when the valuation of the securities is generally determined and the close of the NYSE. If a significant event occurs, these securities may be fair valued, as determined in good faith by the fund's Pricing Committee, following procedures established by the Board of Trustees. The fund uses fair value adjustment factors provided by an independent pricing vendor to value certain foreign securities in order to adjust for events that may occur between the close of foreign exchanges or markets and the close of the NYSE.
The fund uses a three-tier hierarchy to prioritize the pricing assumptions, referred to as inputs, used in valuation techniques to measure fair value. Level 1 includes securities valued using quoted prices in active markets for identical securities. Level 2 includes securities valued using other significant observable inputs. Observable inputs may include quoted prices for similar securities, interest rates, prepayment speeds and credit risk. Prices for securities valued using these inputs are received from independent pricing vendors and brokers and are based on an evaluation of the inputs described. Level 3 includes securities valued using significant unobservable inputs when market prices are not readily available or reliable, including the fund's own assumptions in determining the fair value of investments. Factors used in determining value may include market or
43
issuer specific events or trends, changes in interest rates and credit quality. The inputs or methodology used for valuing securities are not necessarily an indication of the risks associated with investing in those securities. Changes in valuation techniques and related inputs may result in transfers into or out of an assigned level within the disclosure hierarchy.
The following is a summary of the values by input classification of the fund's investments as of August 31, 2015, by major security category or type:
| Total value at 8-31-15 | Level 1 quoted price | Level 2 significant observable inputs | Level 3 significant unobservable inputs | ||
| Common stocks | |||||
| Australia | $19,838,532 | — | $19,838,532 | — | |
| Austria | 6,013,247 | — | 6,013,247 | — | |
| Belgium | 14,914,162 | — | 14,914,162 | — | |
| Canada | 93,610,392 | $93,610,392 | — | — | |
| Colombia | 349,857 | 349,857 | — | — | |
| Denmark | 11,616,820 | — | 11,616,820 | — | |
| Finland | 13,789,898 | — | 13,789,898 | — | |
| France | 238,391,829 | — | 238,391,829 | — | |
| Germany | 149,668,176 | — | 149,668,176 | — | |
| Hong Kong | 17,815,663 | — | 17,815,663 | — | |
| Ireland | 120,527 | — | 120,527 | — | |
| Israel | 4,399,535 | 1,521,195 | 2,878,340 | — | |
| Italy | 58,176,086 | — | 58,176,086 | — | |
| Japan | 360,832,978 | — | 360,832,978 | — | |
| Luxembourg | 1,389,938 | — | 1,389,938 | — | |
| Malta | 127,917 | — | — | $127,917 | |
| Netherlands | 87,060,686 | — | 87,060,686 | — | |
| New Zealand | 230,330 | — | 230,330 | — | |
| Norway | 25,002,888 | — | 25,002,888 | — | |
| Portugal | 4,476,422 | — | 4,476,422 | — | |
| Singapore | 5,255,990 | — | 5,255,990 | — | |
| Spain | 69,702,245 | — | 69,702,245 | — | |
| Sweden | 27,254,909 | — | 27,254,909 | — | |
| Switzerland | 41,929,819 | — | 41,929,819 | — | |
| United Kingdom | 294,283,010 | — | 294,283,010 | — | |
| Preferred securities | 16,597,447 | — | 16,597,447 | — | |
| Rights | 594 | — | 594 | — | |
| Securities lending collateral | 8,502,257 | 8,502,257 | — | — | |
| Short-term investments | 110,956,869 | 18,723,483 | 92,233,386 | — | |
| Total investments in securities | $1,682,309,023 | $122,707,184 | $1,559,473,922 | $127,917 | |
| Other financial instruments: | |||||
| Futures | $375,718 | $375,718 | — | — | |
Security transactions and related investment income. Investment security transactions are accounted for on a trade date plus one basis for daily net asset value calculations. However, for financial reporting purposes, investment transactions are reported on trade date. Interest income is accrued as earned. Dividend income is recorded on the ex-date, except for dividends of foreign securities where the dividend may not be known until after the ex-date. In those cases, dividend income, net of withholding taxes, is recorded when the fund becomes aware of the dividends. Foreign taxes are provided for based on
44
the fund's understanding of the tax rules and rates that exist in the foreign markets in which it invests. Gains and losses on securities sold are determined on the basis of identified cost and may include proceeds from litigation.
Securities lending. The fund may lend its securities to earn additional income. The fund receives cash collateral from the borrower in an amount not less than the market value of the loaned securities. The fund will invest its collateral in JHCT, an affiliate of the fund, which has a floating net asset value and is registered with the Securities and Exchange Commission as an investment company. JHCT invests cash received as collateral as part of the securities lending program in short-term money market investments. The fund will receive the benefit of any gains and bear any losses generated by JHCT with respect to the cash collateral.
If a borrower fails to return loaned securities when due, then the lending agent is responsible and indemnifies the fund for the lent securities. The lending agent uses the collateral received from the borrower to purchase replacement securities of the same issue, type, class and series of the loaned securities. If the value of the collateral is less than the purchase cost of replacement securities, the lending agent is responsible for satisfying the shortfall but only to the extent that the shortfall is not due to any decrease in the value of JHCT.
Although the risk of the loss of the securities lent is mitigated by receiving collateral from the borrower and through lending agent indemnification, the fund could experience a delay in recovering securities or could experience a lower than expected return if the borrower fails to return the securities on a timely basis. The fund may receive compensation for lending its securities by retaining a portion of the return on the investment of the collateral and compensation from fees earned from borrowers of the securities. Net income received from JHCT is a component of securities lending income as recorded on the Statement of operations.
Obligations to repay collateral received by the fund is shown on the Statement of assets and liabilities as Payable upon return of securities loaned.
Foreign currency translation. Assets, including investments and liabilities denominated in foreign currencies, are translated into U.S. dollar values each day at the prevailing exchange rate. Purchases and sales of securities, income and expenses are translated into U.S. dollars at the prevailing exchange rate on the date of the transaction. The effect of changes in foreign currency exchange rates on the value of securities is reflected as a component of the realized and unrealized gains (losses) on investments.
Funds that invest internationally generally carry more risk than funds that invest strictly in U.S. securities. Risks can result from differences in economic and political conditions, regulations, market practices (including higher transaction costs), accounting standards and other factors. Foreign investments are also subject to a decline in the value of a foreign currency versus the U.S. dollar, which reduces the dollar value of securities denominated in that currency.
Foreign taxes. The fund may be subject to withholding tax on income and/or capital gains or repatriation taxes imposed by certain countries in which the fund invests. Taxes are accrued based upon investment income, realized gains or unrealized appreciation.
Line of credit. The fund may borrow from banks for temporary or emergency purposes, including meeting redemption requests that otherwise might require the untimely sale of securities. Pursuant to the fund's custodian agreement, the custodian may loan money to the fund to make properly authorized payments. The fund is obligated to repay the custodian for any overdraft, including any related costs or expenses. The custodian may have a lien, security interest or security entitlement in any fund property that is not otherwise segregated or pledged, to the extent of any overdraft, and to the maximum extent permitted by law.
Effective June 30, 2015, the fund and other affiliated funds entered into a syndicated line of credit agreement, with Citibank, N.A. as the administrative agent, that enables them to participate in a $750 million unsecured committed line of credit. Prior to June 30, 2015, the fund and other affiliated funds had an agreement with Citibank that enabled them to participate in a $300 million unsecured committed line of credit. A commitment fee, payable at the end of each calendar quarter, based on the average daily unused portion of the effective line of credit, is charged to each participating fund on a pro rata basis and is
45
reflected in other expenses on the Statement of operations. Commitment fees for the six months ended August 31, 2015 were $278. For the six months ended August 31, 2015, the fund had no borrowings under either line of credit.
Expenses. Within the John Hancock group of funds complex, expenses that are directly attributable to an individual fund are allocated to such fund. Expenses that are not readily attributable to a specific fund are allocated among all funds in an equitable manner, taking into consideration, among other things, the nature and type of expense and the fund's relative net assets. Expense estimates are accrued in the period to which they relate and adjustments are made when actual amounts are known.
Class allocations. Income, common expenses and realized and unrealized gains (losses) are determined at the fund level and allocated daily to each class of shares based on the net assets of the class. Class-specific expenses, such as distribution and service fees, if any, and transfer agent fees, for all classes, are calculated daily at the class level based on the net assets of each class and the specific expense rates applicable to each class. Through June 30, 2015, class-specific expenses, such as state registration fees and printing and postage, for all classes were calculated daily at the class level based on the net assets of each class and the specific expense rates applicable to each class.
Federal income taxes. The fund intends to continue to qualify as a regulated investment company by complying with the applicable provisions of the Internal Revenue Code and will not be subject to federal income tax on taxable income that is distributed to shareholders. Therefore, no federal income tax provision is required.
Under the Regulated Investment Company Modernization Act of 2010, the fund is permitted to carry forward capital losses incurred in taxable years beginning after December 22, 2010 for an unlimited period. Any losses incurred during those taxable years will be required to be utilized prior to the losses incurred in pre-enactment taxable years. As a result of this ordering rule, pre-enactment capital loss carryforwards may be more likely to expire unused. Additionally, post-enactment capital losses that are carried forward will retain their character as either short-term or long-term capital losses rather than being considered all short-term as under previous law.
For federal income tax purposes, as of February 28, 2015, the fund has a capital loss carryforward of $21,824,866 available to offset future net realized capital gains. The following table details the capital loss carryforward available:
| Capital loss carryforward expiring February 28 | |
| 2018 | 2019 |
| $14,781,454 | $7,043,412 |
As of February 28, 2015, the fund had no uncertain tax positions that would require financial statement recognition, derecognition or disclosure. The fund's federal tax returns are subject to examination by the Internal Revenue Service for a period of three years.
Distribution of income and gains. Distributions to shareholders from net investment income and net realized gains, if any, are recorded on the ex-date. The fund generally declares and pays dividends and capital gain distributions, if any, annually.
Distributions paid by the fund with respect to each class of shares are calculated in the same manner, at the same time and in the same amount, except for the effect of class level expenses that may be applied differently to each class.
Such distributions, on a tax basis, are determined in conformity with income tax regulations, which may differ from US GAAP.
Capital accounts within the financial statements are adjusted for permanent book-tax differences. These adjustments have no impact on net assets or the results of operations. Temporary book-tax differences, if any, will reverse in a subsequent period. Book-tax differences are primarily attributable to foreign currency transactions, passive foreign investment companies, and wash sale loss deferrals.
46
Note 3 — Derivative instruments
The fund may invest in derivatives in order to meet its investment objective. Derivatives include a variety of different instruments that may be traded in the over-the-counter market, on a regulated exchange or through a clearing facility. The risks in using derivatives vary depending upon the structure of the instruments, including the use of leverage, optionality, the liquidity or lack of liquidity of the contract, the creditworthiness of the counterparty or clearing organization and the volatility of the position. Some derivatives involve risks that are potentially greater than the risks associated with investing directly in the referenced securities or other referenced underlying instrument. Specifically, the fund is exposed to the risk that the counterparty to an OTC derivatives contract will be unable or unwilling to make timely settlement payments or otherwise honor its obligations. OTC derivatives transactions typically can only be closed out with the other party to the transaction.
Futures are traded on an exchange. Exchange-traded transactions generally present less counterparty risk to a fund than OTC transactions. The exchange stands between the fund and the broker to the contract and therefore, credit risk is generally limited to the failure of the exchange.
Margin requirements for exchange-traded derivatives are set by the broker or applicable clearinghouse. Margin for exchange-traded derivatives are detailed in the Statement of assets and liabilities as Cash held at broker for futures contracts.
Futures. A futures contract is a contractual agreement to buy or sell a particular currency or financial instrument at a pre-determined price in the future. Risks related to the use of futures contracts include possible illiquidity of the futures markets, contract prices that can be highly volatile and imperfectly correlated to movements in the underlying financial instrument and potential losses in excess of the amounts recognized on the Statement of assets and liabilities. Use of long futures contracts subjects the fund to the risk of loss up to the notional value of the futures contracts. Use of short futures contracts subjects the fund to unlimited risk of loss.
Upon entering into a futures contract, the fund is required to deposit initial margin with the broker in the form of cash or securities. The amount of required margin is generally based on a percentage of the contract value; this amount is the initial margin for the trade. The margin deposit must then be maintained at the established level over the life of the contract. Futures margin receivable / payable is included on the Statement of assets and liabilities. Futures contracts are marked-to-market daily and an appropriate payable or receivable for the change in value (variation margin) and unrealized gain or loss is recorded by the fund. When the contract is closed, the fund records a realized gain or loss equal to the difference between the value of the contract at the time it was opened and the value at the time it was closed.
During the six months ended August 31, 2015, the fund used futures contracts to gain exposure to certain securities markets and to maintain diversity and liquidity of the fund. The fund held futures contracts with notional values ranging up to $47.6 million. The following table summarizes the contracts held at August 31, 2015:
| Open contracts | Number of contracts | Position | Expiration date | Notional basis | Notional value | Unrealized appreciation (depreciation) |
| Mini MSCI EAFE Index Futures | 550 | Long | Sep 2015 | $47,273,532 | $47,649,250 | $375,718 |
Notional basis refers to the contractual amount agreed upon at inception of open contracts; notional value represents the current value of the open contract.
Fair value of derivative instruments by risk category
The table below summarizes the fair value of derivatives held by the fund at August 31, 2015 by risk category:
| Risk | Statement of assets and liabilities location | Financial instruments location | Asset derivatives fair value | Liabilities derivatives fair value |
| Equity | Receivable/payable for futures | Futures† | $375,718 | — |
† Reflects cumulative appreciation/depreciation on futures as disclosed in Note 3. Only the period end variation margin is separately disclosed on the Statement of assets and liabilities.
47
Effect of derivative instruments on the Statement of operations
The table below summarizes the net change in unrealized appreciation (depreciation) included in the net increase (decrease) in net assets from operations, classified by derivative instrument and risk category, for the six months ended August 31, 2015:
| Risk | Statement of operations location | Futures contracts |
| Equity | Change in unrealized appreciation (depreciation) | $375,718 |
Note 4 — Guarantees and indemnifications
Under the Trust's organizational documents, its Officers and Trustees are indemnified against certain liabilities arising out of the performance of their duties to the Trust, including the fund. Additionally, in the normal course of business, the fund enters into contracts with service providers that contain general indemnification clauses. The fund's maximum exposure under these arrangements is unknown, as this would involve future claims that may be made against the fund that have not yet occurred. The risk of material loss from such claims is considered remote.
Note 5 — Fees and transactions with affiliates
John Hancock Advisers, LLC (the Advisor) serves as investment advisor for the fund. John Hancock Funds, LLC (the Distributor), an affiliate of the Advisor, serves as principal underwriter of the fund. The Advisor and the Distributor are indirect, wholly owned subsidiaries of MFC.
Management fee. Effective July 1, 2015, the fund has an investment management agreement with the Advisor under which the fund pays a daily management fee to the Advisor, on an annual basis, equal to the sum of: a) 0.920% of the first $100 million of the fund's aggregate average daily net assets (together with the assets of any other applicable fund identified in the advisory agreement); b) 0.890% of the next $900 million of the fund's aggregate average daily net assets; c) 0.860% of the next $1 billion of the fund's aggregate average daily net assets; d) 0.830% of the next $1 billion of the fund's aggregate average daily net assets; e) 0.800% of the next $1 billion of the fund's aggregate average daily net assets; and f) 0.780% of the fund's aggregate average daily net assets in excess of $4 billion. The Advisor has a subadvisory agreement with Grantham,Mayo,Van Otterloo & Co. LLC. The fund is not responsible for payment of the subadvisory fees.
Prior to July 1, 2015, the fund had an investment management agreement with the Advisor under which the fund paid a daily management fee to the Advisor, on an annual basis, equal to the sum of: a) 0.920% of the first $100 million of the fund's aggregate average daily net assets (together with the assets of any other applicable fund identified in the advisory agreement); b) 0.895% of the next $900 million of the fund's aggregate average daily net assets; c) 0.880% of the next $1 billion of the fund's aggregate average daily net assets; d) 0.850% of the next $1 billion of the fund's aggregate average daily net assets; e) 0.825% of the next $1 billion of the fund's aggregate average daily net assets; and f) 0.800% of the fund's aggregate average daily net assets in excess of $4 billion.
The Advisor has contractually agreed to waive a portion of its management fee and/or reimburse expenses for certain funds of the John Hancock group of funds complex, including the fund (the participating portfolios). This waiver is based upon aggregate net assets of all the participating portfolios. The amount of the reimbursement is calculated daily and allocated among all the participating portfolios in proportion to the daily net assets of each fund. During the six months ended August 31, 2015, this waiver amounted to 0.01% of the fund's average net assets on an annualized basis. This arrangement may be amended or terminated at any time by the Advisor upon notice to the fund and with the approval of the Board of Trustees.
The Advisor has contractually agreed to waive all or a portion of its management fee and/or reimburse or pay operating expenses of the fund to the extent necessary to maintain the fund's total operating expenses at 1.38% and 1.08% for Class A and Class I shares, respectively, excluding certain expenses such as taxes, brokerage commissions, interest expense, litigation and indemnification expenses and other extraordinary expenses not incurred in the ordinary course of the fund's business, acquired fund fees and short dividend expense. These expense limitations shall remain in effect until June 30, 2016, unless renewed by mutual agreement of the fund and the Advisor based upon a determination that this is appropriate under the circumstances at the time. Prior to July 1, 2015, Class C, Class R1, Class R2, Class R3, Class R4, Class R5, and Class R6
48
shares had fee waivers and/or reimbursement such that the expenses would not exceed 2.30%, 1.90%, 1.65%, 1.80%, 1.40%, 1.20%, and 1.12% for Class C, Class R1, Class R2, Class R3, Class R4, Class R5, and Class R6 shares, respectively.
Prior to July 1, 2015, the Advisor contractually agreed to waive and/or reimburse all class specific expenses for Class B shares of the fund, including Rule 12b-1 fees and transfer agency fees and service fees, as applicable, to the extent they exceed 1.30% of average annual net assets (on an annualized basis) attributable to Class B shares (the Class Expense Waiver).
The Advisor has contractually agreed to waive and/or reimburse all class specific expenses for Class R6 shares of the fund to the extent they exceed 0.00% of average annual net assets, on an annualized basis. The expense limitation expires on June 30, 2016, unless renewed by mutual agreement of the fund and the advisor based upon a determination that this is appropriate under the circumstances at the time.
The expense reductions described above for the six months ended August 31, 2015 amounted to:
| Class | Expense reductions | Class | Expense reductions | |
| Class A | $4,712 | Class R4 | $3,424 | |
| Class B | 3,066 | Class R5 | 3,442 | |
| Class C | 499 | Class R6 | 4,655 | |
| Class I | 21,893 | Class 1 | 1,697 | |
| Class R1 | 3,662 | Class NAV | 36,488 | |
| Class R2 | 4,725 | Total | $91,650 | |
| Class R3 | 3,387 |
The investment management fees, including the impact of the waivers and reimbursements as described above, incurred for the six months ended August 31, 2015, were equivalent to a net annual effective rate of 0.87% of the fund's average daily net assets.
Accounting and legal services. Pursuant to a service agreement, the fund reimburses the Advisor for all expenses associated with providing the administrative, financial, legal, accounting and recordkeeping services to the fund, including the preparation of all tax returns, periodic reports to shareholders and regulatory reports, among other services. These expenses are allocated to each share class based on its relative net assets at the time the expense was incurred. These accounting and legal services fees incurred for the six months ended August 31, 2015 amounted to an annual rate of 0.01% of the fund's average daily net assets.
Distribution and service plans. The fund has a distribution agreement with the Distributor. The fund has adopted distribution and service plans with respect to Class A, Class B, Class C, Class R1, Class R2, Class R3, Class R4, Class R5, and Class 1 shares pursuant to Rule 12b-1 under the 1940 Act, to pay the Distributor for services provided as the distributor of shares of the fund. In addition, under a service plan for Class R1, Class R2, Class R3, Class R4, and Class R5 shares, the fund pays for certain other services. The fund may pay up to the following contractual rates of distribution and service fees under these arrangements, expressed as an annual percentage of average daily net assets for each class of the fund's shares.
| Class | Rule 12b-1 fee | Service fee | Class | Rule 12b-1 fee | Service fee | |
| Class A | 0.30% | — | Class R3 | 0.50% | 0.15% | |
| Class B | 1.00% | — | Class R4 | 0.25% | 0.10% | |
| Class C | 1.00% | — | Class R5 | — | 0.05% | |
| Class R1 | 0.50% | 0.25% | Class 1 | 0.05% | — | |
| Class R2 | 0.25% | 0.25% |
The fund's Distributor has contractually agreed to waive 0.10% of Rule 12b-1 fees for Class R4 shares. The current waiver agreement expires on June 30, 2016, unless renewed by mutual agreement of the fund and the Distributor based upon a determination that this is appropriate under the circumstances at the time. This contractual waiver amounted to $70 for Class R4 shares for the six months ended August 31, 2015.
49
Sales charges. Class A shares are assessed up-front sales charges, which resulted in payments to the Distributor amounting to $593,340 for the six months ended August 31, 2015. Of this amount, $101,856 was retained and used for printing prospectuses, advertising, sales literature and other purposes, $489,113 was paid as sales commissions to broker-dealers and $2,371 was paid as sales commissions to sales personnel of Signator Investors, Inc., a broker-dealer affiliate of the Advisor.
Class A, Class B and Class C shares may be subject to contingent deferred sales charges (CDSCs). Certain Class A shares that are acquired through purchases of $1 million or more and are redeemed within one year of purchase are subject to a 1.00% sales charge. Class B shares that are redeemed within six years of purchase are subject to CDSCs, at declining rates, beginning at 5.00%. Class C shares that are redeemed within one year of purchase are subject to a 1.00% CDSC. CDSCs are applied to the lesser of the current market value at the time of redemption or the original purchase cost of the shares being redeemed. Proceeds from CDSCs are used to compensate the Distributor for providing distribution-related services in connection with the sale of these shares. During the six months ended August 31, 2015, CDSCs received by the Distributor amounted to $438, $946 and $1,021 for Class A, Class B and Class C shares, respectively.
Transfer agent fees. The fund has a transfer agent agreement with John Hancock Signature Services, Inc. (Signature Services), an affiliate of the Advisor. The transfer agent fees paid to Signature Services are determined based on the cost to Signature Services (Signature Services Cost) of providing recordkeeping services. It also includes out-of-pocket expenses, including payments made to third-parties for recordkeeping services provided to their clients who invest in one or more John Hancock funds. In addition, Signature Services Cost may be reduced by certain fees that Signature Services receives in connection with retirement and small accounts. Signature Services Cost is calculated monthly and allocated, as applicable, to five categories of share classes: Retail Share and Institutional Share Classes of Non-Municipal Bond Funds, Class R6 Shares, Retirement Share Classes and Municipal Bond Share Classes. Within each of these categories, the applicable costs are allocated to the affected John Hancock affiliated funds and/or classes, based on the relative average daily net assets.
Class level expenses. Class level expenses for the six months ended August 31, 2015 were:
| Class | Distribution and service fees | Transfer agent fees | State registration fees | Printing and postage |
| Class A | $181,494 | $76,504 | $6,253 | $6,127 |
| Class B | 11,771 | 1,490 | 4,224 | 129 |
| Class C | 64,076 | 8,105 | 4,500 | 500 |
| Class I | — | 315,075 | 15,559 | 21,337 |
| Class R1 | 1,955 | 41 | 3,964 | 39 |
| Class R2 | 559 | 20 | 4,995 | 18 |
| Class R3 | 646 | 17 | 3,513 | 17 |
| Class R4 | 228 | 11 | 3,513 | 10 |
| Class R5 | 33 | 10 | 3,513 | 12 |
| Class R6 | — | 15 | 4,588 | 45 |
| Class 1 | 10,904 | — | — | — |
| Total | $271,666 | $401,288 | $54,622 | $28,234 |
Effective July 1, 2015, state registration fees and printing and postage are treated as fund level expenses and are not included in the table above. For the period July 1, 2015 to August 31, 2015, state registration and printing and postage amounted to $35,450 and $18,570, respectively.
Trustee expenses. The fund compensates each Trustee who is not an employee of the Advisor or its affiliates. The costs of paying Trustee compensation and expenses are allocated to each fund based on its net assets relative to other funds within the John Hancock group of funds complex.
50
Note 6 — Fund share transactions
Transactions in fund shares for the six months ended August 31, 2015 and for the year ended February 28, 2015 were as follows:
| Six months ended 8-31-15 | Year ended 2-28-15 | |||||||||||||||||||||||||
| Shares | Amount | Shares | Amount | |||||||||||||||||||||||
| Class A shares | ||||||||||||||||||||||||||
| Sold | 827,525 | $27,352,979 | 1,241,454 | $42,456,199 | ||||||||||||||||||||||
| Distributions reinvested | — | — | 107,972 | 3,280,189 | ||||||||||||||||||||||
| Repurchased | (350,944 | ) | (11,523,345 | ) | (1,080,319 | ) | (37,612,136 | ) | ||||||||||||||||||
| Net increase | 476,581 | $15,829,634 | 269,107 | $8,124,252 | ||||||||||||||||||||||
| Class B shares | ||||||||||||||||||||||||||
| Sold | 3,983 | $130,524 | 9,074 | $315,452 | ||||||||||||||||||||||
| Distributions reinvested | — | — | 1,872 | 56,821 | ||||||||||||||||||||||
| Repurchased | (10,725 | ) | (353,417 | ) | (31,309 | ) | (1,037,633 | ) | ||||||||||||||||||
| Net decrease | (6,742 | ) | ($222,893 | ) | (20,363 | ) | ($665,360 | ) | ||||||||||||||||||
| Class C shares | ||||||||||||||||||||||||||
| Sold | 76,013 | $2,516,730 | 231,098 | $7,958,404 | ||||||||||||||||||||||
| Distributions reinvested | — | — | 8,342 | 253,168 | ||||||||||||||||||||||
| Repurchased | (56,578 | ) | (1,862,293 | ) | (101,787 | ) | (3,421,510 | ) | ||||||||||||||||||
| Net increase | 19,435 | $654,437 | 137,653 | $4,790,062 | ||||||||||||||||||||||
| Class I shares | ||||||||||||||||||||||||||
| Sold | 2,320,287 | $76,962,643 | 5,235,922 | $179,552,256 | ||||||||||||||||||||||
| Distributions reinvested | — | — | 632,252 | 19,258,385 | ||||||||||||||||||||||
| Repurchased | (1,173,734 | ) | (38,946,292 | ) | (4,446,623 | ) | (145,611,804 | ) | ||||||||||||||||||
| Net increase | 1,146,553 | $38,016,351 | 1,421,551 | $53,198,837 | ||||||||||||||||||||||
| Class R1 shares | ||||||||||||||||||||||||||
| Sold | 5,679 | $187,725 | 3,746 | $124,458 | ||||||||||||||||||||||
| Distributions reinvested | — | — | 246 | 7,481 | ||||||||||||||||||||||
| Repurchased | (5,776 | ) | (185,574 | ) | (308 | ) | (10,445 | ) | ||||||||||||||||||
| Net increase (decrease) | (97 | ) | $2,151 | 3,684 | $121,494 | |||||||||||||||||||||
| Class R2 shares | ||||||||||||||||||||||||||
| Sold | 5,312 | $171,343 | 2,960 | $102,837 | ||||||||||||||||||||||
| Distributions reinvested | — | — | 79 | 2,425 | ||||||||||||||||||||||
| Repurchased | (4,871 | ) | (156,952 | ) | (1,674 | ) | (56,687 | ) | ||||||||||||||||||
| Net increase | 441 | $14,391 | 1,365 | $48,575 | ||||||||||||||||||||||
| Class R3 shares | ||||||||||||||||||||||||||
| Sold | 2,011 | $67,073 | 1,076 | $38,435 | ||||||||||||||||||||||
| Distributions reinvested | — | — | 143 | 4,360 | ||||||||||||||||||||||
| Repurchased | (1,072 | ) | (33,948 | ) | (6 | ) | (192 | ) | ||||||||||||||||||
| Net increase | 939 | $33,125 | 1,213 | $42,603 | ||||||||||||||||||||||
| Class R4 shares | ||||||||||||||||||||||||||
| Sold | 475 | $15,772 | 1,715 | $55,440 | ||||||||||||||||||||||
| Distributions reinvested | — | — | 59 | 1,808 | ||||||||||||||||||||||
| Repurchased | (1,108 | ) | (35,173 | ) | (777 | ) | (28,484 | ) | ||||||||||||||||||
| Net increase (decrease) | (633 | ) | ($19,401 | ) | 997 | $28,764 | ||||||||||||||||||||
51
| Six months ended 8-31-15 | Year ended 2-28-15 | |||||||||||||||||||||||||
| Shares | Amount | Shares | Amount | |||||||||||||||||||||||
| Class R5 shares | ||||||||||||||||||||||||||
| Sold | 407 | $13,468 | 1,031 | $35,089 | ||||||||||||||||||||||
| Distributions reinvested | — | — | 100 | 3,041 | ||||||||||||||||||||||
| Repurchased | (1,336 | ) | (42,858 | ) | (390 | ) | (14,135 | ) | ||||||||||||||||||
| Net increase (decrease) | (929 | ) | ($29,390 | ) | 741 | $23,995 | ||||||||||||||||||||
| Class R6 shares | ||||||||||||||||||||||||||
| Sold | 1,116 | $37,987 | 630 | $21,025 | ||||||||||||||||||||||
| Distributions reinvested | — | — | 47 | 1,437 | ||||||||||||||||||||||
| Repurchased | (19 | ) | (644 | ) | (53 | ) | (1,830 | ) | ||||||||||||||||||
| Net increase | 1,097 | $37,343 | 624 | $20,632 | ||||||||||||||||||||||
| Class 1 shares | ||||||||||||||||||||||||||
| Sold | 135,050 | $4,514,029 | 162,098 | $5,543,589 | ||||||||||||||||||||||
| Distributions reinvested | — | — | 47,624 | 1,452,520 | ||||||||||||||||||||||
| Repurchased | (80,883 | ) | (2,671,128 | ) | (202,727 | ) | (6,836,578 | ) | ||||||||||||||||||
| Net increase | 54,167 | $1,842,901 | 6,995 | $159,531 | ||||||||||||||||||||||
| Class NAV shares | ||||||||||||||||||||||||||
| Sold | 8,701,239 | $291,524,310 | 1,300,450 | $43,997,681 | ||||||||||||||||||||||
| Distributions reinvested | — | — | 876,122 | 26,695,437 | ||||||||||||||||||||||
| Repurchased | (107 | ) | (3,189 | ) | (2,193,503 | ) | (77,535,516 | ) | ||||||||||||||||||
| Net increase (decrease) | 8,701,132 | $291,521,121 | (16,931 | ) | ($6,842,398 | ) | ||||||||||||||||||||
| Total net increase | 10,391,944 | $347,679,770 | 1,806,636 | $59,050,987 | ||||||||||||||||||||||
Affiliates of the fund owned 58%, 100% and 100% of shares of beneficial interest of Class R6, Class 1 and Class NAV respectively, on August 31, 2015.
Note 7 — Purchase and sale of securities
Purchases and sales of securities, other than short-term investments, amounted to $727,905,791 and $448,465,623, respectively, for the six months ended August 31, 2015.
Note 8 — Investment by affiliated funds
Certain investors in the fund are affiliated funds that are managed by the Advisor and its affiliates. The affiliated funds do not invest in the fund for the purpose of exercising management or control; however, this investment may represent a significant portion of the fund's net assets. At August 31, 2015, funds within the John Hancock group of funds complex held 58.1% of the fund's net assets. The following funds had an affiliate ownership of 5% or more of the fund's net assets:
| Fund | Affiliated concentration |
| John Hancock Lifestyle Growth Portfolio | 21.9% |
| John Hancock Lifestyle Balanced Portfolio | 17.4% |
| John Hancock Lifestyle Aggressive Portfolio | 9.6% |
52
Continuation of Investment Advisory and Subadvisory Agreements
Evaluation of Advisory and Subadvisory Agreements by the Board of Trustees
This section describes the evaluation by the Board of Trustees (the Board) of John Hancock Funds III (the Trust) of the Advisory Agreement (the Advisory Agreement) with John Hancock Advisers, LLC (the Advisor) and the Subadvisory Agreement (the Subadvisory Agreement) with Grantham, Mayo, Van Otterloo & Co. LLC (the Subadvisor), for John Hancock International Core Fund (the fund). The Advisory Agreement and Subadvisory Agreement are collectively referred to as the Agreements. Prior to the June 23-25, 2015 meeting at which the Agreements were approved, the Board also discussed and considered information regarding the proposed continuation of the Agreements at an in-person meeting held on May 21-22, 2015.
Approval of Advisory and Subadvisory Agreements
At in-person meetings held on June 23-25, 2015, the Board, including the Trustees who are not considered to be interested persons of the Trust under the Investment Company Act of 1940, as amended (the 1940 Act) (the Independent Trustees), reapproved for an annual period the continuation of the Advisory Agreement between the Trust and the Advisor and the Subadvisory Agreement between the Advisor and the Subadvisor with respect to the fund.
In considering the Advisory Agreement and the Subadvisory Agreement, the Board received in advance of the meetings a variety of materials relating to the fund, the Advisor and the Subadvisor, including comparative performance, fee and expense information for a peer group of similar funds prepared by an independent third-party provider of mutual fund data, performance information for an applicable benchmark index; and, with respect to the Subadvisor, comparative performance information for comparably managed accounts, as applicable, and other information provided by the Advisor and the Subadvisor regarding the nature, extent and quality of services provided by the Advisor and the Subadvisor under their respective Agreements, as well as information regarding the Advisor's revenues and costs of providing services to the fund and any compensation paid to affiliates of the Advisor. At the meetings at which the renewal of the Advisory Agreement and Subadvisory Agreement are considered, particular focus is given to information concerning fund performance, comparability of fees and total expenses, and profitability. However, the Board notes that the evaluation process with respect to the Advisor and the Subadvisor is an ongoing one. In this regard, the Board also took into account discussions with management and information provided to the Board at prior meetings with respect to the services provided by the Advisor and the Subadvisor to the fund, including quarterly performance reports prepared by management containing reviews of investment results and prior presentations from the Subadvisor with respect to the fund. The Board also considered the nature, quality, and extent of non-advisory services, if any, to be provided to the fund by the Advisor's affiliates, including distribution services.
Throughout the process, the Board asked questions of and requested additional information from management. The Board is assisted by counsel for the Trust and the Independent Trustees are also separately assisted by independent legal counsel throughout the process. The Independent Trustees also received a memorandum from their independent legal counsel discussing the legal standards for their consideration of the proposed continuation of the Agreements and discussed the proposed continuation of the Agreements in private sessions with their independent legal counsel at which no representatives of management were present.
Approval of Advisory Agreement
In approving the Advisory Agreement with respect to the fund, the Board, including the Independent Trustees, considered a variety of factors, including those discussed below. The Board also considered other factors (including conditions and trends prevailing generally in the economy, the securities markets, and the industry) and does not treat any single factor as determinative, and each Trustee may attribute different weights to different factors. The Board's conclusions may be based in part on its consideration of the advisory and subadvisory arrangements in prior years and on the Board's ongoing regular review of fund performance and operations throughout the year.
53
Nature, extent, and quality of services. Among the information received by the Board from the Advisor relating to the nature, extent, and quality of services provided to the fund, the Board reviewed information provided by the Advisor relating to its operations and personnel, descriptions of its organizational and management structure, and information regarding the Advisor's compliance and regulatory history, including its Form ADV. The Board also noted that on a regular basis it receives and reviews information from the Trust's Chief Compliance Officer (CCO) regarding the fund's compliance policies and procedures established pursuant to Rule 38a-1 under the 1940 Act. The Board also considered the Advisor's risk management processes. The Board considered that the Advisor is responsible for the management of the day-to-day operations of the fund, including, but not limited to, general supervision of and coordination of the services provided by the Subadvisor, and is also responsible for monitoring and reviewing the activities of the Subadvisor and other third-party service providers.
In considering the nature, extent, and quality of the services provided by the Advisor, the Trustees also took into account their knowledge of the Advisor's management and the quality of the performance of the Advisor's duties, through Board meetings, discussions and reports during the preceding year and through each Trustee's experience as a Trustee of the Trust and of the other trusts in the John Hancock group of funds complex (the John Hancock Fund Complex).
In the course of their deliberations regarding the Advisory Agreement, the Board considered, among other things:
| (a) | the skills and competency with which the Advisor has in the past managed the Trust's affairs and its subadvisory relationship, the Advisor's oversight and monitoring of the Subadvisor's investment performance and compliance programs, such as the Subadvisor's compliance with fund policies and objectives, review of brokerage matters, including with respect to trade allocation and best execution and the Advisor's timeliness in responding to performance issues; | |
| (b) | the background, qualifications and skills of the Advisor's personnel; | |
| (c) | the Advisor's compliance policies and procedures and its responsiveness to regulatory changes and mutual fund industry developments; | |
| (d) | the Advisor's administrative capabilities, including its ability to supervise the other service providers for the fund; | |
| (e) | the financial condition of the Advisor and whether it has the financial wherewithal to provide a high level and quality of services to the fund; and | |
| (f) | the Advisor's reputation and experience in serving as an investment advisor to the Trust and the benefit to shareholders of investing in funds that are part of a family of funds offering a variety of investments. |
The Board concluded that the Advisor may reasonably be expected to continue to provide a high quality of services under the Advisory Agreement with respect to the fund.
Investment performance. In considering the fund's performance, the Board noted that it reviews at its regularly scheduled meetings information about the fund's performance results. In connection with the consideration of the Advisory Agreement, the Board:
| (a) | reviewed information prepared by management regarding the fund's performance; | |
| (b) | considered the comparative performance of an applicable benchmark index; | |
| (c) | considered the performance of comparable funds, if any, as included in the report prepared by an independent third-party provider of fund data; and | |
| (d) | took into account the Advisor's analysis of the fund's performance and its plans and recommendations regarding the Trust's subadvisory arrangements generally. |
The Board noted that the fund underperformed its benchmark index for the one- and three-year periods ended December 31, 2014 and outperformed its benchmark index for the five-year period ended December 31, 2014. The Board also noted that
54
the fund underperformed its peer group average for the one-year period ended December 31, 2014 and outperformed its peer group average for the three- and five-year periods ended December 31, 2014. The Board took into account management's discussion of the fund's performance, including the favorable performance relative to the benchmark index for the five-year period and to the peer group for the three- and five-year periods. The Board concluded that the fund's performance has generally been in line with or outperformed the historical performance of comparable funds and the fund's benchmark index over the longer-term.
Fees and expenses. The Board reviewed comparative information prepared by an independent third-party provider of mutual fund data, including, among other data, the fund's contractual and net management fees (and subadvisory fees, to the extent available) and total expenses as compared to similarly situated investment companies deemed to be comparable to the fund. The Board considered the fund's ranking within a smaller group of peer funds chosen by the independent third-party provider, as well as the fund's ranking within a broader group of funds. In comparing the fund's contractual and net management fees to those of comparable funds, the Board noted that such fees include both advisory and administrative costs. The Board noted that net management fees and total expenses for the fund are higher than the peer group median.
The Board took into account management's discussion of the fund's expenses, including actions taken that have reduced certain fund expenses. The Board also took into account management's discussion with respect to the advisory/subadvisory fee structure, including the amount of the advisory fee retained by the Advisor after payment of the subadvisory fee. The Board also noted that the Advisor pays the subadvisory fee, and that such fees are negotiated at arm's length with respect to the Subadvisor. In addition, the Board took into account that management had agreed to implement an overall fee waiver across the complex, including the fund, which is discussed further below. The Board also noted actions taken over the past several years to reduce the fund's operating expenses. The Board also noted that, in addition, the Advisor is currently waiving fees and/or reimbursing expenses with respect to the fund and that the fund has breakpoints in its contractual management fee schedule that reduces management fees as assets increase. The Board also noted that the fund's distributor, an affiliate of the Advisor, has agreed to waive a portion of its Rule 12b-1 fee for a share class of the fund. The Board reviewed information provided by the Advisor concerning the investment advisory fee charged by the Advisor or one of its advisory affiliates to other clients (including other funds in the John Hancock Fund Complex) having similar investment mandates, if any. The Board considered any differences between the Advisor's and Subadvisor's services to the fund and the services they provide to other comparable clients or funds. The Board concluded that the advisory fee paid with respect to the fund is reasonable.
Profitability/indirect benefits. In considering the costs of the services to be provided and the profits to be realized by the Advisor and its affiliates from the Advisor's relationship with the Trust, the Board:
| (a) | reviewed financial information of the Advisor; | |||||||
| (b) | reviewed and considered information presented by the Advisor regarding the net profitability to the Advisor and its affiliates with respect to the fund; | |||||||
| (c) | received and reviewed profitability information with respect to the John Hancock Fund Complex as a whole; | |||||||
| (d) | received information with respect to the Advisor's allocation methodologies used in preparing the profitability data; | |||||||
| (e) | considered that the John Hancock insurance companies that are affiliates of the Advisor, as shareholders of the Trust directly or through their separate accounts, receive certain tax credits or deductions relating to foreign taxes paid and dividends received by certain funds of the Trust and noted that these tax benefits, which are not available to participants in qualified retirement plans under applicable income tax law, are reflected in the profitability information reviewed by the Board; | |||||||
| (f) | considered that the Advisor also provides administrative services to the fund on a cost basis pursuant to an administrative services agreement; | |||||||
| (g) | noted that affiliates of the Advisor provide transfer agency services and distribution services to the fund, and that the fund's distributor also receives Rule 12b-1 payments to support distribution of the fund; |
55
| (h) | noted that the Advisor also derives reputational and other indirect benefits from providing advisory services to the fund; | |||||||
| (i) | noted that the subadvisory fee for the fund is paid by the Advisor and is negotiated at arm's length; and | |||||||
| (j) | considered that the Advisor should be entitled to earn a reasonable level of profits in exchange for the level of services it provides to the fund and the entrepreneurial risk that it assumes as Advisor. |
Based upon its review, the Board concluded that the level of profitability, if any, of the Advisor and its affiliates from their relationship with the fund was reasonable and not excessive.
Economies of scale. In considering the extent to which economies of scale would be realized as the fund grows and whether fee levels reflect these economies of scale for the benefit of fund shareholders, the Board:
| (a) | considered that the Advisor has contractually agreed to waive a portion of its management fee for certain funds of the John Hancock Fund Complex, including the fund (the participating portfolios) or otherwise reimburse the expenses of the participating portfolios (the reimbursement). This waiver is based upon aggregate net assets of all the participating portfolios. The amount of the reimbursement is calculated daily and allocated among all the participating portfolios in proportion to the daily net assets of each fund; | |
| (b) | reviewed the fund's advisory fee structure and concluded that: (i) the fund's fee structure contains breakpoints at the subadvisory fee level and that such breakpoints are reflected as breakpoints in the advisory fees for the fund; and (ii) although economies of scale cannot be measured with precision, these arrangements permit shareholders of the fund to benefit from economies of scale if the fund grows. The Board also took into account management's discussion of the fund's advisory fee structure; and | |
| (c) | the Board also considered the effect of the fund's growth in size on its performance and fees. The Board also noted that if the fund's assets increase over time, the fund may realize other economies of scale. |
Approval of Subadvisory Agreement
In making its determination with respect to approval of the Subadvisory Agreement, the Board reviewed:
| (1) | information relating to the Subadvisor's business, including current subadvisory services to the Trust (and other funds in the John Hancock Fund Complex); | |
| (2) | the historical and current performance of the fund and comparative performance information relating to an applicable benchmark index and comparable funds; | |
| (3) | the subadvisory fee for the fund, including any breakpoints, and to the extent available, comparable fee information prepared by an independent third party provider of fund data; and | |
| (4) | information relating to the nature and scope of any material relationships and their significance to the Trust's Advisor and Subadvisor. |
Nature, extent, and quality of services. With respect to the services provided by the Subadvisor, the Board received information provided to the Board by the Subadvisor, including the Subadvisor's Form ADV, as well as took into account information presented throughout the past year. The Board considered the Subadvisor's current level of staffing and its overall resources, as well as received information relating to the Subadvisor's compensation program. The Board reviewed the Subadvisor's history and investment experience, as well as information regarding the qualifications, background, and responsibilities of the Subadvisor's investment and compliance personnel who provide services to the fund. The Board also considered, among other things, the Subadvisor's compliance program and any disciplinary history. The Board also considered the Subadvisor's risk assessment and monitoring process. The Board reviewed the Subadvisor's regulatory history, including whether it was involved in any regulatory actions or investigations as well as material litigation, and any settlements and amelioratory actions undertaken, as appropriate. The Board noted that the Advisor conducts regular,
56
periodic reviews of the Subadvisor and its operations, including regarding investment processes and organizational and staffing matters. The Board also noted that the Trust's CCO and his staff conduct regular, periodic compliance reviews with the Subadvisor and present reports to the Independent Trustees regarding the same, which includes evaluating the regulatory compliance systems of the Subadvisor and procedures reasonably designed to assure compliance with the federal securities laws. The Board also took into account the financial condition of the Subadvisor.
The Board considered the Subadvisor's investment process and philosophy. The Board took into account that the Subadvisor's responsibilities include the development and maintenance of an investment program for the fund that is consistent with the fund's investment objective, the selection of investment securities and the placement of orders for the purchase and sale of such securities, as well as the implementation of compliance controls related to performance of these services. The Board also received information with respect to the Subadvisor's brokerage policies and practices, including with respect to best execution and soft dollars.
Subadvisor compensation. In considering the cost of services to be provided by the Subadvisor and the profitability to the Subadvisor of its relationship with the fund, the Board noted that the fees under the Subadvisory Agreement are paid by the Advisor and not the fund.
The Board also relied on the ability of the Advisor to negotiate the Subadvisory Agreement with the Subadvisor, which is not affiliated with the Advisor, and the fees thereunder at arm's length. As a result, the costs of the services to be provided and the profits to be realized by the Subadvisor from its relationship with the Trust were not a material factor in the Board's consideration of the Subadvisory Agreement.
The Board also received information regarding the nature and scope (including their significance to the Advisor and its affiliates and to the Subadvisor) of any material relationships with respect to the Subadvisor, which include arrangements in which the Subadvisor or its affiliates provide advisory, distribution, or management services in connection with financial products sponsored by the Advisor or its affiliates, and may include other registered investment companies, a 529 education savings plan, managed separate accounts and exempt group annuity contracts sold to qualified plans. The Board also received information and took into account any other potential conflicts of interest the Advisor might have in connection with the Subadvisory Agreement.
In addition, the Board considered other potential indirect benefits that the Subadvisor and its affiliates may receive from the Subadvisor's relationship with the fund, such as the opportunity to provide advisory services to additional funds in the John Hancock Fund Complex and reputational benefits.
Subadvisory fees. The Board considered that the fund pays an advisory fee to the Advisor and that, in turn, the Advisor pays a subadvisory fee to the Subadvisor. As noted above, the Board also considered the fund's subadvisory fees as compared to similarly situated investment companies deemed to be comparable to the fund as included in the report prepared by the independent third party provider of fund data, to the extent available. The Board noted that the limited size of the Lipper peer group was not sufficient for comparative purposes. The Board also took into account the subadvisory fees paid by the Advisor to the Subadvisor with respect to the fund and compared them to fees charged by the Subadvisor to manage other subadvised portfolios and portfolios not subject to regulation under the 1940 Act, as applicable.
Subadvisor performance. As noted above, the Board considered the fund's performance as compared to the fund's peer group and the benchmark index and noted that the Board reviews information about the fund's performance results at its regularly scheduled meetings. The Board noted the Advisor's expertise and resources in monitoring the performance, investment style and risk-adjusted performance of the Subadvisor. The Board was mindful of the Advisor's focus on the Subadvisor's performance. The Board also noted the Subadvisor's long-term performance record for similar accounts, as applicable.
The Board's decision to approve the Subadvisory Agreement was based on a number of determinations, including the following:
| (1) | the Subadvisor has extensive experience and demonstrated skills as a manager; |
57
| (2) | the performance of the fund has generally been in line with or outperformed the historical performance of comparable funds and the fund's benchmark index over the longer-term; | |||||||
| (3) | the subadvisory fee is reasonable in relation to the level and quality of services being provided; and | |||||||
| (4) | noted that the subadvisory fees are paid by the Advisor not the fund and that the subadvisory fee breakpoints are reflected as breakpoints in the advisory fees for the fund in order to permit shareholders to benefit from economies of scale if the fund grows. | |||||||
| * * * | ||||||||
Based on the Board's evaluation of all factors that the Board deemed to be material, including those factors described above, the Board, including the Independent Trustees, concluded that renewal of the Advisory Agreement and the Subadvisory Agreement would be in the best interest of the fund and its shareholders. Accordingly, the Board, and the Independent Trustees voting separately, approved the Advisory Agreement and Subadvisory Agreement for an additional one-year period.
58
Trustees James M. Oates, Chairperson Officers Andrew G. Arnott John J. Danello Francis V. Knox, Jr. Charles A. Rizzo Salvatore Schiavone | Investment advisor John Hancock Advisers, LLC Subadvisor Grantham, Mayo, Van Otterloo & Co. LLC Principal distributor John Hancock Funds, LLC Custodian Citibank, N.A. Transfer agent John Hancock Signature Services, Inc. Legal counsel K&L Gates LLP |
*Member of the Audit Committee
†Non-Independent Trustee
#Effective 3-10-15
The fund's proxy voting policies and procedures, as well as the fund proxy voting record for the most recent twelve-month period ended June 30, are available free of charge on the Securities and Exchange Commission (SEC) website at sec.gov or on our website.
The fund's complete list of portfolio holdings, for the first and third fiscal quarters, is filed with the SEC on Form N-Q. The fund's Form N-Q is available on our website and the SEC's website, sec.gov, and can be reviewed and copied (for a fee) at the SEC's Public Reference Room in Washington, DC. Call 800-SEC-0330 to receive information on the operation of the SEC's Public Reference Room.
We make this information on your fund, as well as monthly portfolio holdings, and other fund details available on our website at jhinvestments.com or by calling 800-225-5291.
| You can also contact us: | |||
| 800-225-5291 jhinvestments.com | Regular mail: John Hancock Signature Services, Inc. | Express mail: John Hancock Signature Services, Inc. | |
59
Family of funds
DOMESTIC EQUITY FUNDS Balanced Blue Chip Growth Classic Value Disciplined Value Disciplined Value Mid Cap Equity Income Fundamental All Cap Core Fundamental Large Cap Core Fundamental Large Cap Value Large Cap Equity New Opportunities Select Growth Small Cap Equity Small Cap Value Small Company Strategic Growth U.S. Equity U.S. Global Leaders Growth Value Equity GLOBAL AND INTERNATIONAL EQUITY FUNDS Disciplined Value International Emerging Markets Emerging Markets Equity Global Equity Global Shareholder Yield Greater China Opportunities International Core International Growth International Small Company International Value Equity INCOME FUNDS Bond California Tax-Free Income Core High Yield Emerging Markets Debt Floating Rate Income Focused High Yield Global Income Government Income High Yield Municipal Bond Income | INCOME FUNDS (continued) Investment Grade Bond Money Market Short Duration Credit Opportunities Spectrum Income Strategic Income Opportunities Tax-Free Bond ALTERNATIVE AND SPECIALTY FUNDS Absolute Return Currency Alternative Asset Allocation Enduring Equity Financial Industries Global Absolute Return Strategies Global Conservative Absolute Return Natural Resources Redwood Regional Bank Seaport Technical Opportunities ASSET ALLOCATION Income Allocation Fund Lifestyle Aggressive Portfolio Lifestyle Balanced Portfolio Lifestyle Conservative Portfolio Lifestyle Growth Portfolio Lifestyle Moderate Portfolio Retirement Choices Portfolios (2010-2055) Retirement Living Portfolios (2010-2055) Retirement Living II Portfolios (2010-2055) CLOSED-END FUNDS Financial Opportunities Hedged Equity & Income Income Securities Trust Investors Trust Preferred Income Preferred Income II Preferred Income III Premium Dividend Tax-Advantaged Dividend Income Tax-Advantaged Global Shareholder Yield |
The fund's investment objectives, risks, charges, and expenses are included in the prospectus and should be considered carefully before investing. For a prospectus, contact your financial professional, call John Hancock Investments at 800-225-5291, or visit the fund's website at jhinvestments.com. Please read the prospectus carefully before investing or sending money.
John Hancock Investments
A trusted brand
John Hancock Investments is a premier asset manager representing
one of America's most trusted brands, with a heritage of financial
stewardship dating back to 1862. Helping our shareholders pursue
their financial goals is at the core of everything we do. It's why we
support the role of professional financial advice and operate with the
highest standards of conduct and integrity.
A better way to invest
We build funds based on investor needs, then search the world to find
proven portfolio teams with specialized expertise in those strategies.
As a manager of managers, we apply vigorous oversight to ensure that
they continue to meet our uncompromising standards and serve the
best interests of our shareholders.
Results for investors
Our unique approach to asset management enables us to provide
a diverse set of investments backed by some of the world's best
managers, along with strong risk-adjusted returns across asset classes.

 | John Hancock Funds, LLC n Member FINRA, SIPC 601 Congress Street n Boston, MA 02210-2805 800-225-5291 n jhinvestments.com | |
| This report is for the information of the shareholders of John Hancock International Core Fund. It is not authorized for distribution to prospective investors unless preceded or accompanied by a prospectus. | ||
| MF250812 | 66SA 8/15 10/15 | |
John Hancock
International Growth Fund
Semiannual report 8/31/15
A message to shareholders
Dear shareholder,
The global financial markets were especially rocky in mid-2015. The pullback we had anticipated for some months took place in August, and U.S. equities experienced their first official correction—a decline of more than 10% in the stock market—in more than four years. Fixed-income securities fared better than stocks but remain roughly flat for the year to date. There were several headwinds restraining stock prices from moving higher all year, but the trigger for this summer's correction was the news of slowing economic growth in China and the effect that might have on global growth. For the time being, global economic data continues to be a leading driver of markets worldwide.
The asset managers in our network believe, on balance, that investors should stay the course when it comes to U.S. equities. Our economy continues to grow at a healthy pace, driven by strong housing and jobs data, falling commodity prices, solid consumer spending, and low inflation. While the U.S. Federal Reserve (Fed) chose to leave the federal funds rate unchanged at its September meeting, Fed Chair Janet Yellen cited a number of positives in the U.S. economy and signaled that the Fed will likely raise interest rates soon in response to stronger growth. Although market movements are unpredictable, this summer's correction may prove to be not much more than a necessary breather before the market resumes its upward trend.
Introducing John Hancock Multifactor Exchange-Traded Funds (ETFs)
We believe investors benefit from a combination of active and passive strategies in their portfolios. That's why, for years, we've offered actively managed funds to our shareholders, alongside asset allocation portfolios that employ a mix of active and passive strategies. That same thinking is what led us to team up with Dimensional Fund Advisors—a company regarded as one of the pioneers in strategic beta investing—for the launch of the passively managed John Hancock Multifactor ETFs.* Each ETF seeks to track a custom index built upon decades of academic research into the factors that drive higher expected returns: smaller capitalizations, lower valuations, and higher profitability. For nearly 30 years, it's just the kind of time-tested approach we have looked for as a manager of managers. For more information, visit our website at jhinvestments.com/etf.
On behalf of everyone at John Hancock Investments, I'd like to take this opportunity to welcome new shareholders and thank existing shareholders for the continued trust you've placed in us.
Sincerely,
Andrew G. Arnott
President and Chief Executive Officer
John Hancock Investments
This commentary reflects the CEO's views as of August 31, 2015. They are subject to change at any time. For more up-to-date information, you can visit our website at jhinvestments.com.
| * | Strategic beta investing EFTs seek to improve upon cap-weighted strategies by tracking a custom index that combines active management insight with the discipline of a rules-based approach. |
John Hancock
International Growth Fund
1
INVESTMENT OBJECTIVE
The fund seeks high total return primarily through capital appreciation.
AVERAGE ANNUAL TOTAL RETURNS AS OF 8/31/15 (%)
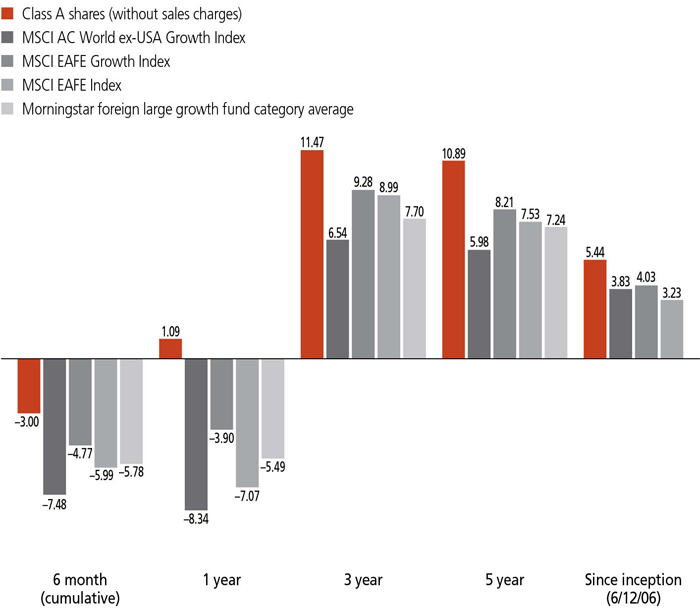
The MSCI AC World ex-USA Growth Index (gross of foreign withholding tax on dividends) is a free float-adjusted market capitalization index that is designed to measure the equity performance of growth oriented stocks in developed (excluding the U.S.) and emerging markets.
The MSCI EAFE Growth Index (gross of foreign withholding tax on dividends) is a free float-adjusted market capitalization index that is designed to measure the performance of growth-oriented developed market stocks within Europe, Australasia, and the Far East.
The MSCI EAFE Index (gross of foreign withholding tax on dividends) is a free float-adjusted market capitalization index that is designed to measure the equity market performance of developed markets, excluding the U.S. and Canada.
It is not possible to invest directly in an index. Index figures do not reflect expenses or sales charges, which would result in lower returns.
Figures from Morningstar, Inc. include reinvested distributions and do not take into account sales charges. Actual load-adjusted performance is lower.
The past performance shown here reflects reinvested distributions and the beneficial effect of any expense reductions, and does not guarantee future results. Returns for periods shorter than one year are cumulative, and results for other share classes will vary. Shares will fluctuate in value and, when redeemed, may be worth more or less than their original cost. Current performance may be lower or higher than the performance cited, and can be found at jhinvestments.com or by calling 800-225-5291. For further information on the fund's objectives, risks, and strategy, see the fund's prospectuses.
2
PERFORMANCE HIGHLIGHTS OVER THE LAST SIX MONTHS
Global markets declined amid a challenging economic environment
Most developed-market stocks outside the United States declined as a debt crisis in Greece and a slowdown in China's GDP growth accentuated concerns about the global economy.
Contribution from stock picking helped the fund outperform
Although the fund posted a negative overall return, it outperformed its benchmark, the MSCI AC World ex-USA Growth Index, largely as a result of effective stock selection.
Sector overweight in information technology detracted
The fund's overweight in information technology detracted from relative results, as the sector underperformed.
SECTOR COMPOSITION AS OF 8/31/15 (%)
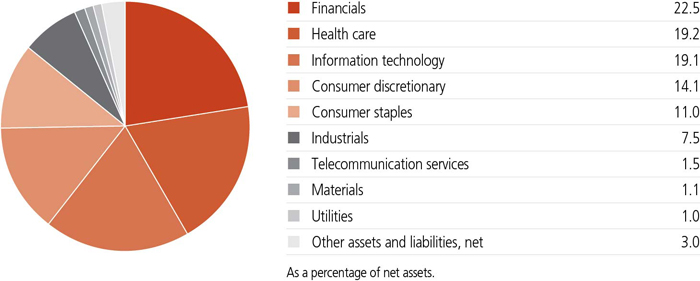
A note about risks
Foreign investing, especially in emerging markets, has additional risks, such as currency and market volatility and political and social instability. Growth stocks may be subject to greater price fluctuations because their prices tend to place greater emphasis on earnings expectations. The value of a company's equity securities is subject to changes in the company's financial condition, and overall market and economic conditions. Hedging, derivatives, and other strategic transactions may increase the volatility of a fund and, if the transaction is not successful, could result in a significant loss. Actively trading securities can increase transaction costs (thus lowering performance) and taxable distributions. A higher portfolio turnover rate may indicate higher transaction costs and may result in higher taxes when fund shares are held in a taxable account. Please see the fund's prospectuses for additional risks.
3

John A. Boselli, CFA
Portfolio Manager
Wellington Management Company LLP
Can you describe the market environment during the six-month period and the factors underlying the negative return for the benchmark, the MSCI AC World ex-USA Growth Index?
During the early months of the period, Europe was a bright spot; there were signs of an economic rebound, including solid manufacturing activity and a nearly four-year high in economic sentiment. The European Central Bank helped fuel optimism after it boosted its growth and inflation forecasts and implemented a stimulus program to purchase sovereign bonds from member countries of the eurozone. Globally, there were a few worrisome data points, including disappointing manufacturing numbers from China and Japan. Fears regarding Greece's future in the European Union resurfaced amid uncertainty about the disbursement of more bailout aid, although these issues were largely resolved before the end of the period.
Investor sentiment turned negative in mid-August when China unexpectedly devalued its currency, triggering concerns about global disinflationary trends, a weaker-than-anticipated global growth backdrop, and further potential devaluations. Selling reached a peak after Chinese manufacturing data fell to the weakest level in six years. The People's Bank of China responded by cutting the benchmark interest rate and deposit rate, while also reducing the reserve requirement ratio for banks. With these fears in mind, global equities declined sharply in August.
Although its overall return was negative, the fund outperformed relative to its benchmark. At the sector level, what factors had the most significant impact on this result?
Security selection contributed to performance relative to the benchmark in nine of the ten sectors, led by stock picking in the information technology, consumer discretionary, and financials sectors. An overweight in the information technology sector detracted from relative performance, as this sector underperformed. However, relative results were aided by the fund's overweight in healthcare, the only sector in the index that posted a positive return during the period. An underweight in materials also contributed, as the sector underperformed the broad index.
4
Which equity positions had the biggest positive impact on the fund's performance?
The top individual contributor was a position in Pandora A/S, a Denmark-based jewelry maker. Pandora's high organic revenue growth was driven by product expansion and store growth, particularly in underpenetrated regions. The stock outperformed as earnings results exceeded consensus estimates and the company announced a new share buyback program.
Another strong contributor was a position in Japan-based Ono Pharmaceutical Company, Ltd. Its shares were supported by the company's strong earnings results and a rebound in sales of drugs to treat diabetes and osteoporosis. Ono's shares also benefited from positive expectations for Opdivo, a drug that Ono codeveloped and that is approved in the United States to treat melanoma and lung cancer.
A position in Hong Kong Exchanges & Clearing, Ltd., the only stock and futures exchange in Hong Kong, also added value. Its shares rallied as the company benefited from increased trading volume generated by the Hong Kong-Shanghai Connect. This recently launched program facilitates trading in shares of companies listed in Shanghai by investors outside of mainland China through the Hong Kong Exchange. We sold the fund's position in Hong Kong Exchanges & Clearing prior to the end of the period.
Which positions had a significantly negative impact?
A position in China-based technology company AAC Technologies Holdings, Inc. was the largest detractor from relative performance. The stock fell after it was reported that Apple Inc. had dropped AAC Technologies as a supplier for a component in the new Apple Watch. We sold the fund's position in AAC Technologies during the period. A position in India-based ICICI Bank, Ltd., also detracted from performance. Investors' concerns over the falling rupee and disappointing bank earnings weighed on India's banking sector and on shares of ICICI Bank.
TOP 10 HOLDINGS AS OF 8/31/15 (%)
| Novartis AG | 3.2 |
| Novo Nordisk A/S, B Shares | 2.6 |
| UBS Group AG | 2.4 |
| British American Tobacco PLC | 2.4 |
| Taiwan Semiconductor Manufacturing Company, Ltd., ADR | 2.2 |
| Tencent Holdings, Ltd. | 2.0 |
| Prudential PLC | 2.0 |
| Anheuser-Busch InBev NV | 2.0 |
| L'Oreal SA | 2.0 |
| Reckitt Benckiser Group PLC | 1.9 |
| TOTAL | 22.7 |
| As a percentage of net assets. | |
| Cash and cash equivalents are not included. | |
5
A position in Kaskikornbank PLC, a banking group in Thailand, also hindered relative performance. Concerns about a slowdown in Thailand's economy and reduced government spending weighed on the stock, and we sold the fund's position in Kasikornbank during the period.
How was the fund positioned at the end of the period?
We continued to emphasize the quality and total return characteristics of companies when considering their relative attractiveness. While fundamentals for companies in emerging markets have recently deteriorated, earnings revisions for companies in the developed economies, particularly North America and Europe, have generally improved, in our view. Macroeconomic indicators and corporate lending to small- and medium-sized businesses have strengthened in Europe, a region in which the fund remained overweight during the period. However, we remained concerned that the eurozone has a monetary union without a fiscal union or a unified decision-making authority to collect and expend taxes shared by participating governments. Many of the fund's European holdings are high-quality, multinational growth companies in the United Kingdom, Switzerland, and northern Europe, which we have observed tend to return excess capital to shareholders and trade at a discount to the broad markets.
The fund continued to be underweight Japan, Australia, and Asia in general. The economies of many
TOP 10 COUNTRIES AS OF 8/31/15 (%)
| United Kingdom | 31.2 |
| Switzerland | 10.6 |
| India | 6.6 |
| Japan | 6.4 |
| Denmark | 5.8 |
| France | 5.1 |
| Taiwan | 4.9 |
| United States | 4.2 |
| Netherlands | 3.8 |
| China | 3.0 |
| TOTAL | 81.6 |
| As a percentage of net assets. | |
| Cash and cash equivalents are not included. |
6
Asian countries that export products to China are suffering as a result of the slowdown in China's economic growth.
Relative weakness in emerging markets has been negative for the more cyclical energy, materials, and industrials sectors, all of which were underweight in the fund. The fund's largest overweight was in information technology, a sector in which we continue to see growing demand for the products and services of technology companies that provide software that increases overall corporate productivity.
MANAGED BY
| | John A. Boselli, CFA On the fund since 2014 Investing since 1996 |
![]()
7
TOTAL RETURNS FOR THE PERIOD ENDED AUGUST 31, 2015
| Average annual total returns (%) with maximum sales charge | Cumulative total returns (%) with maximum sales charge | ||||||
| 1-year | 5-year | Since inception1 | 6-month | 5-year | Since inception1 | ||
| Class A | -3.98 | 9.76 | 4.86 | -7.86 | 59.34 | 54.97 | |
| Class B | -3.92 | 9.79 | 4.66 | -8.22 | 59.49 | 52.25 | |
| Class C | -0.52 | 10.06 | 4.65 | -4.32 | 61.50 | 52.09 | |
| Class I2 | 1.39 | 11.29 | 5.87 | -2.86 | 70.69 | 69.28 | |
| Class R22,3 | 0.99 | 10.87 | 5.43 | -3.09 | 67.55 | 62.95 | |
| Class R42,3 | 1.09 | 10.90 | 5.45 | -3.00 | 67.71 | 63.11 | |
| Class R62,3 | 1.33 | 10.95 | 5.47 | -2.77 | 68.11 | 63.50 | |
| Class 12 | 1.51 | 11.38 | 5.92 | -2.77 | 71.40 | 70.07 | |
| Class NAV2,3 | 1.15 | 10.91 | 5.46 | -2.94 | 67.82 | 63.21 | |
| Index 1† | -8.34 | 5.98 | 3.83 | -7.48 | 33.71 | 41.48 | |
| Index 2† | -3.90 | 8.21 | 4.03 | -4.77 | 48.35 | 44.00 | |
| Index 3† | -7.07 | 7.53 | 3.23 | -5.99 | 43.75 | 34.04 | |
Performance figures assume all distributions have been reinvested. Figures reflect maximum sales charges on Class A shares of 5%, and the applicable contingent deferred sales charge (CDSC) on Class B and Class C shares. The Class B shares' CDSC declines annually between years 1 to 6 according to the following schedule: 5%, 4%, 3%, 3%, 2%, and 1%. No sales charge will be assessed after the sixth year. Class C shares sold within one year of purchase are subject to a 1% CDSC. Sales charges are not applicable to Class R2, Class R4, Class R6, Class I, Class 1, and Class NAV shares.
The expense ratios of the fund, both net (including any fee waivers and/or expense limitations) and gross (excluding any fee waivers and/or expense limitations), are set forth according to the most recent publicly available prospectuses for the fund and may differ from those disclosed in the Financial highlights tables in this report. Had the fee waivers and expense limitations not been in place, gross expenses would apply. The expense ratios are as follows:
| Class A | Class B | Class C | Class I | Class R2* | Class R4* | Class R6* | Class 1 | Class NAV* | |
| Gross (%) | 1.45 | 2.15 | 2.15 | 1.14 | 1.54 | 1.39 | 1.04 | 1.07 | 1.02 |
| Net (%) | 1.45 | 2.15 | 2.15 | 1.14 | 1.54 | 1.29 | 1.02 | 1.07 | 1.02 |
| * | Expenses have been estimated for the first year of operation. |
Please refer to the most recent prospectus and annual or semiannual report for more information on expenses and any expense limitation arrangements for each class.
The returns reflect past results and should not be considered indicative of future performance. The return and principal value of an investment will fluctuate so that shares, when redeemed, may be worth more or less than their original cost. Due to market volatility and other factors, the fund's current performance may be higher or lower than the performance shown. For current to the most recent month-end performance data, please call 800-225-5291 or visit the fund's website at jhinvestments.com.
The performance table above and the chart on the next page do not reflect the deduction of taxes that a shareholder would pay on fund distributions or the redemption of fund shares. The fund's performance results reflect any applicable fee waivers or expense reductions, without which the expenses would increase and results would have been less favorable.
| † | Index 1 is the MSCI AC World ex-USA Growth Index; Index 2 is the MSCI EAFE Growth Index; Index 3 is the MSCI EAFE Index. |
See the following page for footnotes.
8
This chart and table show what happened to a hypothetical $10,000 investment in John Hancock International Growth Fund for the share classes and periods indicated, assuming all distributions were reinvested. For comparison, we've shown the same investment in three separate indexes.
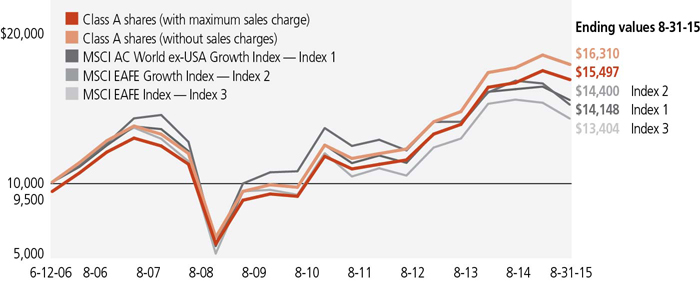
| Start date | With maximum sales charge ($) | Without sales charge ($) | Index 1 ($) | Index 2 ($) | Index 3 ($) | |
| Class B4 | 6-12-06 | 15,225 | 15,225 | 14,148 | 14,400 | 13,404 |
| Class C4 | 6-12-06 | 15,209 | 15,209 | 14,148 | 14,400 | 13,404 |
| Class I2 | 6-12-06 | 16,928 | 16,928 | 14,148 | 14,400 | 13,404 |
| Class R22,3 | 6-12-06 | 16,295 | 16,295 | 14,148 | 14,400 | 13,404 |
| Class R42,3 | 6-12-06 | 16,311 | 16,311 | 14,148 | 14,400 | 13,404 |
| Class R62,3 | 6-12-06 | 16,350 | 16,350 | 14,148 | 14,400 | 13,404 |
| Class 12 | 6-12-06 | 17,007 | 17,007 | 14,148 | 14,400 | 13,404 |
| Class NAV2,3 | 6-12-06 | 16,321 | 16,321 | 14,148 | 14,400 | 13,404 |
The MSCI AC World ex-USA Growth Index (gross of foreign withholding tax on dividends) is a free float-adjusted market capitalization index that is designed to measure the equity performance of growth oriented stocks in developed (excluding the U.S.) and emerging markets.
The MSCI EAFE Growth Index (gross of foreign withholding tax on dividends) is a free float-adjusted market capitalization index that is designed to measure the performance of growth-oriented developed market stocks within Europe, Australasia, and the Far East.
The MSCI EAFE Index (gross of foreign withholding tax on dividends) is a free float-adjusted market capitalization index that is designed to measure the equity market performance of developed markets, excluding the U.S. and Canada.
It is not possible to invest directly in an index. Index figures do not reflect expenses or sales charges, which would result in lower returns.
Footnotes related to performance pages
| 1 | From 6-12-06. |
| 2 | For certain types of investors, as described in the fund's prospectuses. |
| 3 | Class R2, Class R4, and Class R6 shares were first offered on 3-27-15. Class NAV shares were first offered on 6-2-15. The returns prior to these dates are those of Class A shares and may be higher or lower than if adjusted to reflect the expenses of any other share classes. |
| 4 | The contingent deferred sales charge is not applicable. |
9
These examples are intended to help you understand your ongoing operating expenses of investing in the fund so you can compare these costs with the ongoing costs of investing in other mutual funds.
Understanding fund expenses
As a shareholder of the fund, you incur two types of costs:
| • | Transaction costs, which include sales charges (loads) on purchases or redemptions (varies by share class), minimum account fee charge, etc. |
| • | Ongoing operating expenses, including management fees, distribution and service fees (if applicable), and other fund expenses. |
We are presenting only your ongoing operating expenses here.
Actual expenses/actual returns
This example is intended to provide information about the fund's actual ongoing operating expenses, and is based on the fund's actual return. It assumes an account value of $1,000.00 on March 1, 2015, with the same investment held until August 31, 2015.
| Beginning Account value on 3-1-2015 | Ending value on 8-31-2015 | Expenses paid during period ended 8-31-20151 | Annualized expense ratio | |
| Class A | $1,000.00 | $970.00 | $6.93 | 1.40% |
| Class B | 1,000.00 | 966.10 | 10.87 | 2.20% |
| Class C | 1,000.00 | 966.50 | 10.43 | 2.11% |
| Class I | 1,000.00 | 971.40 | 5.35 | 1.08% |
| Class R22 | 1,000.00 | 978.10 | 7.17 | 1.69% |
| Class R42 | 1,000.00 | 979.00 | 6.11 | 1.44% |
| Class R62 | 1,000.00 | 981.40 | 4.25 | 1.00% |
| Class 1 | 1,000.00 | 972.30 | 4.99 | 1.01% |
| Class NAV3 | 1,000.00 | 928.90 | 2.23 | 0.94% |
Together with the value of your account, you may use this information to estimate the operating expenses that you paid over the period. Simply divide your account value at August 31, 2015, by $1,000.00, then multiply it by the "expenses paid" for your share class from the table above. For example, for an account value of $8,600.00, the operating expenses should be calculated as follows:
10
Hypothetical example for comparison purposes
This table allows you to compare the fund's ongoing operating expenses with those of any other fund. It provides an example of the fund's hypothetical account values and hypothetical expenses based on each class's actual expense ratio and an assumed 5% annualized return before expenses (which is not the fund's actual return). It assumes an account value of $1,000.00 on March 1, 2015, with the same investment held until August 31, 2015. Look in any other fund shareholder report to find its hypothetical example and you will be able to compare these expenses. Please remember that these hypothetical account values and expenses may not be used to estimate the actual ending account balance or expenses you paid for the period.
| Beginning Account value on 3-1-2015 | Ending value on 8-31-2015 | Expenses paid during period ended 8-31-20151 | Annualized expense ratio | |
| Class A | $1,000.00 | $1,018.10 | $7.10 | 1.40% |
| Class B | 1,000.00 | 1,014.10 | 11.14 | 2.20% |
| Class C | 1,000.00 | 1,014.50 | 10.69 | 2.11% |
| Class I | 1,000.00 | 1,019.70 | 5.48 | 1.08% |
| Class R2 | 1,000.00 | 1,016.60 | 8.57 | 1.69% |
| Class R4 | 1,000.00 | 1,017.90 | 7.30 | 1.44% |
| Class R6 | 1,000.00 | 1,020.10 | 5.08 | 1.00% |
| Class 1 | 1,000.00 | 1,020.10 | 5.11 | 1.01% |
| Class NAV | 1,000.00 | 1,020.40 | 4.77 | 0.94% |
Remember, these examples do not include any transaction costs, therefore, these examples will not help you to determine the relative total costs of owning different funds. If transaction costs were included, your expenses would have been higher. See the prospectuses for details regarding transaction costs.
| 1 | Expenses are equal to the fund's annualized expense ratio, multiplied by the average account value over the period, multiplied by 184/366 (to reflect the one-half year period). |
| 2 | The inception date for Class R2, Class R4 and Class R6 shares is 3-27-15. Expenses are equal to the fund's annual expense ratio multiplied by the average account value over the period, multiplied by 157/366 (to reflect the period). |
| 3 | The inception date for Class NAV shares is 6-2-15. Expenses are equal to the fund's annual expense ratio multiplied by the average account value over the period, multiplied by 90/366 (to reflect the period). |
11
Fund's investments
| As of 8-31-15 (unaudited) | |||||||||||
| Shares | Value | ||||||||||
| Common stocks 97.0% | $1,155,293,925 | ||||||||||
| (Cost $1,193,212,136) | |||||||||||
| Belgium 2.0% | 23,410,196 | ||||||||||
| Anheuser-Busch InBev NV | 214,638 | 23,410,196 | |||||||||
| Canada 1.5% | 18,225,565 | ||||||||||
| Magna International, Inc. | 369,340 | 18,225,565 | |||||||||
| China 3.0% | 35,700,847 | ||||||||||
| PICC Property & Casualty Company, Ltd., H Shares | 6,352,450 | 12,049,525 | |||||||||
| Tencent Holdings, Ltd. | 1,412,270 | 23,651,322 | |||||||||
| Denmark 5.8% | 69,597,871 | ||||||||||
| DSV A/S | 521,805 | 18,630,690 | |||||||||
| Novo Nordisk A/S, B Shares | 569,841 | 31,461,132 | |||||||||
| Pandora A/S | 168,751 | 19,506,049 | |||||||||
| Finland 1.2% | 13,758,860 | ||||||||||
| Sampo OYJ, A Shares | 285,605 | 13,758,860 | |||||||||
| France 5.1% | 60,375,242 | ||||||||||
| L'Oreal SA | 136,366 | 23,321,011 | |||||||||
| Safran SA | 274,914 | 21,448,717 | |||||||||
| Sanofi | 158,655 | 15,605,514 | |||||||||
| Germany 2.8% | 32,855,305 | ||||||||||
| ProSiebenSat.1 Media SE | 372,956 | 18,113,954 | |||||||||
| United Internet AG | 304,898 | 14,741,351 | |||||||||
| Hong Kong 2.7% | 32,503,279 | ||||||||||
| AIA Group, Ltd. | 3,660,500 | 20,224,620 | |||||||||
| Guangdong Investment, Ltd. | 9,078,405 | 12,278,659 | |||||||||
| India 6.6% | 78,712,593 | ||||||||||
| Axis Bank, Ltd. | 426,139 | 3,254,507 | |||||||||
| Axis Bank, Ltd., GDR | 274,773 | 10,451,798 | |||||||||
| HCL Technologies, Ltd. | 1,141,431 | 16,687,700 | |||||||||
| HDFC Bank, Ltd. | 259,488 | 4,559,127 | |||||||||
| HDFC Bank, Ltd., ADR | 186,660 | 10,637,753 | |||||||||
| ICICI Bank, Ltd. | 358,817 | 1,509,262 | |||||||||
| ICICI Bank, Ltd., ADR | 1,435,520 | 12,517,734 | |||||||||
| Sun Pharmaceutical Industries, Ltd. | 1,437,119 | 19,094,712 | |||||||||
| Ireland 2.5% | 29,589,788 | ||||||||||
| ICON PLC (I) | 187,672 | 14,450,744 | |||||||||
| Medtronic PLC | 209,421 | 15,139,044 | |||||||||
| Shares | Value | ||||||||||
| Israel 1.4% | $17,081,226 | ||||||||||
| Check Point Software Technologies, Ltd. (I) | 218,962 | 17,081,226 | |||||||||
| Japan 6.4% | 76,141,193 | ||||||||||
| Astellas Pharma, Inc. | 1,441,990 | 21,327,715 | |||||||||
| Fuji Heavy Industries, Ltd. | 502,800 | 17,577,305 | |||||||||
| Nippon Telegraph & Telephone Corp. | 465,100 | 17,739,918 | |||||||||
| Ono Pharmaceutical Company, Ltd. | 153,320 | 19,496,255 | |||||||||
| Netherlands 3.8% | 45,480,538 | ||||||||||
| ASML Holding NV | 176,292 | 16,079,022 | |||||||||
| NXP Semiconductors NV (I) | 174,548 | 14,775,488 | |||||||||
| Sensata Technologies Holding NV (I) | 308,566 | 14,626,028 | |||||||||
| Singapore 1.3% | 15,139,956 | ||||||||||
| Avago Technologies, Ltd. | 120,187 | 15,139,956 | |||||||||
| Switzerland 10.6% | 126,690,889 | ||||||||||
| Givaudan SA (I) | 7,876 | 13,540,511 | |||||||||
| Julius Baer Group, Ltd. (I) | 311,802 | 15,155,193 | |||||||||
| Novartis AG | 384,953 | 37,565,950 | |||||||||
| Partners Group Holding AG | 59,232 | 19,103,573 | |||||||||
| UBS Group AG | 1,375,165 | 28,446,166 | |||||||||
| Zurich Insurance Group AG (I) | 46,909 | 12,879,496 | |||||||||
| Taiwan 4.9% | 58,598,962 | ||||||||||
| Catcher Technology Company, Ltd. | 929,000 | 9,496,938 | |||||||||
| Catcher Technology Company, Ltd., GDR | 89,927 | 4,576,324 | |||||||||
| Largan Precision Company, Ltd. | 170,530 | 15,869,976 | |||||||||
| Taiwan Semiconductor Manufacturing Company, Ltd. | 488,000 | 1,898,715 | |||||||||
| Taiwan Semiconductor Manufacturing Company, Ltd., ADR | 1,345,926 | 26,757,009 | |||||||||
| United Kingdom 31.2% | 371,934,753 | ||||||||||
| Aon PLC | 168,453 | 15,740,248 | |||||||||
| ARM Holdings PLC | 1,099,107 | 15,748,046 | |||||||||
| BAE Systems PLC | 2,586,907 | 17,806,571 | |||||||||
| Booker Group PLC | 6,274,661 | 16,118,026 | |||||||||
| British American Tobacco PLC | 535,197 | 28,339,909 | |||||||||
| Compass Group PLC | 1,282,160 | 20,222,929 | |||||||||
| Direct Line Insurance Group PLC | 2,613,274 | 14,086,021 | |||||||||
| Hikma Pharmaceuticals PLC | 518,290 | 17,966,216 | |||||||||
| IG Group Holdings PLC | 1,554,932 | 17,154,848 | |||||||||
| Imperial Tobacco Group PLC | 344,211 | 16,568,176 | |||||||||
| Next PLC | 160,818 | 19,471,866 | |||||||||
| Persimmon PLC (I) | 580,354 | 18,567,060 | |||||||||
| Prudential PLC | 1,092,704 | 23,583,047 | |||||||||
| Reckitt Benckiser Group PLC | 264,338 | 23,159,754 | |||||||||
| Schroders PLC | 345,066 | 14,893,043 | |||||||||
| Shares | Value | ||||||||||
| United Kingdom (continued) | |||||||||||
| Sky PLC | 1,256,836 | $20,019,129 | |||||||||
| Smith & Nephew PLC | 1,119,700 | 19,930,858 | |||||||||
| St. James's Place PLC | 1,275,312 | 17,754,572 | |||||||||
| The Sage Group PLC | 2,415,299 | 18,967,285 | |||||||||
| WPP PLC | 769,346 | 15,837,149 | |||||||||
| United States 4.2% | 49,496,862 | ||||||||||
| Allergan PLC (I) | 54,784 | 16,640,090 | |||||||||
| Amdocs, Ltd. | 284,007 | 16,248,040 | |||||||||
| WABCO Holdings, Inc. (I) | 144,023 | 16,608,732 | |||||||||
| Total investments (Cost $1,193,212,136)† 97.0% | $1,155,293,925 | ||||||||||
| Other assets and liabilities, net 3.0% | $35,655,519 | ||||||||||
| Total net assets 100.0% | $1,190,949,444 | ||||||||||
| The percentage shown for each investment category is the total value of the category as a percentage of the net assets of the fund. | |||||||||||
| Key to Security Abbreviations and Legend | |||||||||||
| ADR | American Depositary Receipts | ||||||||||
| GDR | Global Depositary Receipts | ||||||||||
| (I) | Non-income producing security. | ||||||||||
| † | At 8-31-15, the aggregate cost of investment securities for federal income tax purposes was $1,193,661,161. Net unrealized depreciation aggregated $38,367,236, of which $19,095,405 related to appreciated investment securities and $57,462,641 related to depreciated investment securities. | ||||||||||
Financial statements
STATEMENT OF ASSETS AND LIABILITIES 8-31-15 (unaudited)
| Assets | ||||||||||||||||||||||||||||||||||||||||||||||
| Investments, at value (Cost $1,193,212,136) | $1,155,293,925 | |||||||||||||||||||||||||||||||||||||||||||||
| Cash | 30,717,507 | |||||||||||||||||||||||||||||||||||||||||||||
| Foreign currency, at value (Cost $359,926) | 359,923 | |||||||||||||||||||||||||||||||||||||||||||||
| Receivable for investments sold | 33,245,380 | |||||||||||||||||||||||||||||||||||||||||||||
| Receivable for fund shares sold | 21,264,629 | |||||||||||||||||||||||||||||||||||||||||||||
| Dividends and interest receivable | 2,442,471 | |||||||||||||||||||||||||||||||||||||||||||||
| Receivable for securities lending income | 3,310 | |||||||||||||||||||||||||||||||||||||||||||||
| Other receivables and prepaid expenses | 292,103 | |||||||||||||||||||||||||||||||||||||||||||||
| Total assets | 1,243,619,248 | |||||||||||||||||||||||||||||||||||||||||||||
| Liabilities | ||||||||||||||||||||||||||||||||||||||||||||||
| Payable for investments purchased | 50,885,807 | |||||||||||||||||||||||||||||||||||||||||||||
| Payable for fund shares repurchased | 1,393,427 | |||||||||||||||||||||||||||||||||||||||||||||
| Payable to affiliates | ||||||||||||||||||||||||||||||||||||||||||||||
| Accounting and legal services fees | 14,197 | |||||||||||||||||||||||||||||||||||||||||||||
| Transfer agent fees | 102,956 | |||||||||||||||||||||||||||||||||||||||||||||
| Distribution and service fees | 208 | |||||||||||||||||||||||||||||||||||||||||||||
| Trustees' fees | 1,368 | |||||||||||||||||||||||||||||||||||||||||||||
| Other liabilities and accrued expenses | 271,841 | |||||||||||||||||||||||||||||||||||||||||||||
| Total liabilities | 52,669,804 | |||||||||||||||||||||||||||||||||||||||||||||
| Net assets | $1,190,949,444 | |||||||||||||||||||||||||||||||||||||||||||||
| Net assets consist of | ||||||||||||||||||||||||||||||||||||||||||||||
| Paid-in capital | $1,231,191,241 | |||||||||||||||||||||||||||||||||||||||||||||
| Undistributed net investment income | 5,915,262 | |||||||||||||||||||||||||||||||||||||||||||||
| Accumulated net realized gain (loss) on investments and foreign currency transactions | (8,162,681 | ) | ||||||||||||||||||||||||||||||||||||||||||||
| Net unrealized appreciation (depreciation) on investments and translation of assets and liabilities in foreign currencies | (37,994,378 | ) | ||||||||||||||||||||||||||||||||||||||||||||
| Net assets | $1,190,949,444 | |||||||||||||||||||||||||||||||||||||||||||||
STATEMENT OF ASSETS AND LIABILITIES (continued)
| Net asset value per share | |||||||||||||||||||||
| Based on net asset values and shares outstanding - The fund has an unlimited number of shares authorized with no par value | |||||||||||||||||||||
| Class A ($383,854,327 ÷ 18,289,090 shares)1 | $20.99 | ||||||||||||||||||||
| Class B ($2,101,070 ÷ 100,934 shares)1 | $20.82 | ||||||||||||||||||||
| Class C ($66,954,792 ÷ 3,223,201 shares) 1 | $20.77 | ||||||||||||||||||||
| Class I ($611,514,949 ÷ 29,050,400 shares) | $21.05 | ||||||||||||||||||||
| Class R2 ($941,571 ÷ 44,866 shares) | $20.99 | ||||||||||||||||||||
| Class R4 ($1,216,648 ÷ 57,909 shares) | $21.01 | ||||||||||||||||||||
| Class R6 ($1,274,492 ÷ 60,515 shares) | $21.06 | ||||||||||||||||||||
| Class 1 ($31,015,028 ÷ 1,473,674 shares) | $21.05 | ||||||||||||||||||||
| Class NAV ($92,076,567 ÷ 4,373,450 shares) | $21.05 | ||||||||||||||||||||
| Maximum offering price per share | |||||||||||||||||||||
| Class A (net assets value per share ÷ 95%)2 | $22.09 | ||||||||||||||||||||
| 1 | Redemption price per share is equal to net asset value less any applicable contingent deferred sales charge. | |||||||||||||||||||
| 2 | On single retail sales of less than $50,000. On sales of $50,000 or more and on group sales the offering price is reduced. | |||||||||||||||||||
STATEMENT OF OPERATIONS For the six months ended 8-31-15 (unaudited)
| Investment income | ||||||||||||||||||||||||||||||||||||||||
| Dividends | $11,518,720 | |||||||||||||||||||||||||||||||||||||||
| Securities lending | 62,820 | |||||||||||||||||||||||||||||||||||||||
| Less foreign taxes withheld | (898,419 | ) | ||||||||||||||||||||||||||||||||||||||
| Total investment income | 10,683,121 | |||||||||||||||||||||||||||||||||||||||
| Expenses | ||||||||||||||||||||||||||||||||||||||||
| Investment management fees | 3,383,830 | |||||||||||||||||||||||||||||||||||||||
| Distribution and service fees | 599,471 | |||||||||||||||||||||||||||||||||||||||
| Accounting and legal services fees | 51,522 | |||||||||||||||||||||||||||||||||||||||
| Transfer agent fees | 410,440 | |||||||||||||||||||||||||||||||||||||||
| Trustees' fees | 3,004 | |||||||||||||||||||||||||||||||||||||||
| State registration fees | 57,805 | |||||||||||||||||||||||||||||||||||||||
| Printing and postage | 23,770 | |||||||||||||||||||||||||||||||||||||||
| Professional fees | 44,801 | |||||||||||||||||||||||||||||||||||||||
| Custodian fees | 146,453 | |||||||||||||||||||||||||||||||||||||||
| Registration and filing fees | 48,721 | |||||||||||||||||||||||||||||||||||||||
| Other | 6,824 | |||||||||||||||||||||||||||||||||||||||
| Total expenses | 4,776,641 | |||||||||||||||||||||||||||||||||||||||
| Less expense reductions | (44,553 | ) | ||||||||||||||||||||||||||||||||||||||
| Net expenses | 4,732,088 | |||||||||||||||||||||||||||||||||||||||
| Net investment income | 5,951,033 | |||||||||||||||||||||||||||||||||||||||
| Realized and unrealized gain (loss) | ||||||||||||||||||||||||||||||||||||||||
| Net realized gain (loss) on | ||||||||||||||||||||||||||||||||||||||||
| Investments in unaffiliated issuers and foreign currency transactions | (7,499,809 | ) | ||||||||||||||||||||||||||||||||||||||
| Investments in affiliated issuers | (13 | ) | ||||||||||||||||||||||||||||||||||||||
| (7,499,822 | ) | |||||||||||||||||||||||||||||||||||||||
| Change in net unrealized appreciation (depreciation) of | ||||||||||||||||||||||||||||||||||||||||
| Investments in unaffiliated issuers and translation of assets and liabilities in foreign currencies | (59,178,353 | ) | ||||||||||||||||||||||||||||||||||||||
| Investments in affiliated issuers | 32 | |||||||||||||||||||||||||||||||||||||||
| (59,178,321 | ) | |||||||||||||||||||||||||||||||||||||||
| Net realized and unrealized loss | (66,678,143 | ) | ||||||||||||||||||||||||||||||||||||||
| Decrease in net assets from operations | ($60,727,110 | ) | ||||||||||||||||||||||||||||||||||||||
STATEMENTS OF CHANGES IN NET ASSETS
| Six months ended 8-31-15 | Year ended 2-28-15 | |||||||||||||||||||||||||||||||||||||||||||||||
| (unaudited) | ||||||||||||||||||||||||||||||||||||||||||||||||
| Increase (decrease) in net assets | ||||||||||||||||||||||||||||||||||||||||||||||||
| From operations | ||||||||||||||||||||||||||||||||||||||||||||||||
| Net investment income | $5,951,033 | $4,894,445 | ||||||||||||||||||||||||||||||||||||||||||||||
| Net realized gain (loss) | (7,499,822 | ) | 53,662,737 | |||||||||||||||||||||||||||||||||||||||||||||
| Change in net unrealized appreciation (depreciation) | (59,178,321 | ) | (41,189,146 | ) | ||||||||||||||||||||||||||||||||||||||||||||
| Increase (decrease) in net assets resulting from operations | (60,727,110 | ) | 17,368,036 | |||||||||||||||||||||||||||||||||||||||||||||
| Distributions to shareholders | ||||||||||||||||||||||||||||||||||||||||||||||||
| From net investment income | ||||||||||||||||||||||||||||||||||||||||||||||||
| Class A | — | (2,076,485 | ) | |||||||||||||||||||||||||||||||||||||||||||||
| Class B | — | (18,824 | ) | |||||||||||||||||||||||||||||||||||||||||||||
| Class C | — | (111,601 | ) | |||||||||||||||||||||||||||||||||||||||||||||
| Class I | — | (3,224,326 | ) | |||||||||||||||||||||||||||||||||||||||||||||
| Class 1 | — | (377,806 | ) | |||||||||||||||||||||||||||||||||||||||||||||
| From net realized gain | ||||||||||||||||||||||||||||||||||||||||||||||||
| Class A | — | (15,751,297 | ) | |||||||||||||||||||||||||||||||||||||||||||||
| Class B | — | (246,055 | ) | |||||||||||||||||||||||||||||||||||||||||||||
| Class C | — | (1,372,983 | ) | |||||||||||||||||||||||||||||||||||||||||||||
| Class I | — | (20,794,947 | ) | |||||||||||||||||||||||||||||||||||||||||||||
| Class 1 | — | (2,333,810 | ) | |||||||||||||||||||||||||||||||||||||||||||||
| Total distributions | — | (46,308,134 | ) | |||||||||||||||||||||||||||||||||||||||||||||
| From fund share transactions | 924,211,408 | (88,615,950 | ) | |||||||||||||||||||||||||||||||||||||||||||||
| Total increase (decrease) | 863,484,298 | (117,556,048 | ) | |||||||||||||||||||||||||||||||||||||||||||||
| Net assets | ||||||||||||||||||||||||||||||||||||||||||||||||
| Beginning of period | 327,465,146 | 445,021,194 | ||||||||||||||||||||||||||||||||||||||||||||||
| End of period | $1,190,949,444 | $327,465,146 | ||||||||||||||||||||||||||||||||||||||||||||||
| Undistributed (accumulated distributions in excess of) net investment income | $5,915,262 | ($35,771 | ) | |||||||||||||||||||||||||||||||||||||||||||||
Financial highlights
| Class A Shares Period ended | 8-31-15 | 1 | 2-28-15 | 2-28-14 | 2-28-13 | 2-29-12 | 2-28-11 | |||||||||||||||||||||||||||||||||||||||||||||||||||||||||||||||||||||||||||||||||||||||||||||||||||||||||||||||
| Per share operating performance | ||||||||||||||||||||||||||||||||||||||||||||||||||||||||||||||||||||||||||||||||||||||||||||||||||||||||||||||||||||||
| Net asset value, beginning of period | $21.64 | $24.60 | $21.28 | $19.98 | $20.99 | $17.36 | ||||||||||||||||||||||||||||||||||||||||||||||||||||||||||||||||||||||||||||||||||||||||||||||||||||||||||||||||
| Net investment income2 | 0.16 | 0.24 | 0.25 | 0.23 | 0.30 | 0.13 | ||||||||||||||||||||||||||||||||||||||||||||||||||||||||||||||||||||||||||||||||||||||||||||||||||||||||||||||||
| Net realized and unrealized gain (loss) on investments | (0.81 | ) | 0.83 | 3.94 | 2.65 | (1.12 | ) | 3.61 | ||||||||||||||||||||||||||||||||||||||||||||||||||||||||||||||||||||||||||||||||||||||||||||||||||||||||||||||
| Total from investment operations | (0.65 | ) | 1.07 | 4.19 | 2.88 | (0.82 | ) | 3.74 | ||||||||||||||||||||||||||||||||||||||||||||||||||||||||||||||||||||||||||||||||||||||||||||||||||||||||||||||
| Less distributions | ||||||||||||||||||||||||||||||||||||||||||||||||||||||||||||||||||||||||||||||||||||||||||||||||||||||||||||||||||||||
| From net investment income | — | (0.47 | ) | (0.15 | ) | (0.42 | ) | (0.19 | ) | (0.11 | ) | |||||||||||||||||||||||||||||||||||||||||||||||||||||||||||||||||||||||||||||||||||||||||||||||||||||||||||
| From net realized gain | — | (3.56 | ) | (0.72 | ) | (1.16 | ) | — | — | |||||||||||||||||||||||||||||||||||||||||||||||||||||||||||||||||||||||||||||||||||||||||||||||||||||||||||||
| Total distributions | — | (4.03 | ) | (0.87 | ) | (1.58 | ) | (0.19 | ) | (0.11 | ) | |||||||||||||||||||||||||||||||||||||||||||||||||||||||||||||||||||||||||||||||||||||||||||||||||||||||||||
| Net asset value, end of period | $20.99 | $21.64 | $24.60 | $21.28 | $19.98 | $20.99 | ||||||||||||||||||||||||||||||||||||||||||||||||||||||||||||||||||||||||||||||||||||||||||||||||||||||||||||||||
| Total return (%)4,5 | (3.00 | ) 3 | 5.91 | 19.95 | 14.82 | (3.80 | ) | 21.58 | ||||||||||||||||||||||||||||||||||||||||||||||||||||||||||||||||||||||||||||||||||||||||||||||||||||||||||||||
| Ratios and supplemental data | ||||||||||||||||||||||||||||||||||||||||||||||||||||||||||||||||||||||||||||||||||||||||||||||||||||||||||||||||||||||
| Net assets, end of period (in millions) | $384 | $140 | $130 | $73 | $49 | $45 | ||||||||||||||||||||||||||||||||||||||||||||||||||||||||||||||||||||||||||||||||||||||||||||||||||||||||||||||||
| Ratios (as a percentage of average net assets): | ||||||||||||||||||||||||||||||||||||||||||||||||||||||||||||||||||||||||||||||||||||||||||||||||||||||||||||||||||||||
| Expenses before reductions | 1.40 | 6 | 1.53 | 1.56 | 1.68 | 1.66 | 1.60 | |||||||||||||||||||||||||||||||||||||||||||||||||||||||||||||||||||||||||||||||||||||||||||||||||||||||||||||||
| Expenses including reductions | 1.40 | 6 | 1.52 | 1.55 | 1.60 | 1.59 | 1.60 | |||||||||||||||||||||||||||||||||||||||||||||||||||||||||||||||||||||||||||||||||||||||||||||||||||||||||||||||
| Net investment income | 1.47 | 6 | 1.02 | 1.09 | 1.13 | 1.50 | 0.69 | |||||||||||||||||||||||||||||||||||||||||||||||||||||||||||||||||||||||||||||||||||||||||||||||||||||||||||||||
| Portfolio turnover (%) | 46 | 204 | 42 | 61 | 55 | 48 | ||||||||||||||||||||||||||||||||||||||||||||||||||||||||||||||||||||||||||||||||||||||||||||||||||||||||||||||||
| 1 | Six months ended 8-31-15. Unaudited. | ||||||||||||||||||||||||||||||||||||||||||||||||||||||||||||||||||||||||||||||||||
| 2 | Based on average daily shares outstanding. | ||||||||||||||||||||||||||||||||||||||||||||||||||||||||||||||||||||||||||||||||||
| 3 | Not annualized. | ||||||||||||||||||||||||||||||||||||||||||||||||||||||||||||||||||||||||||||||||||
| 4 | Total returns would have been lower had certain expenses not been reduced during the applicable periods. | ||||||||||||||||||||||||||||||||||||||||||||||||||||||||||||||||||||||||||||||||||
| 5 | Does not reflect the effect of sales charges, if any. | ||||||||||||||||||||||||||||||||||||||||||||||||||||||||||||||||||||||||||||||||||
| 6 | Annualized. | ||||||||||||||||||||||||||||||||||||||||||||||||||||||||||||||||||||||||||||||||||
| Class B Shares Period ended | 8-31-15 | 1 | 2-28-15 | 2-28-14 | 2-28-13 | 2-29-12 | 2-28-11 | |||||||||||||||||||||||||||||||||||||||||||||||||||||||||||||||||||||||||||||||||||||||||||||||||||||||||||||||
| Per share operating performance | ||||||||||||||||||||||||||||||||||||||||||||||||||||||||||||||||||||||||||||||||||||||||||||||||||||||||||||||||||||||
| Net asset value, beginning of period | $21.55 | $24.50 | $21.22 | $19.94 | $20.93 | $17.36 | ||||||||||||||||||||||||||||||||||||||||||||||||||||||||||||||||||||||||||||||||||||||||||||||||||||||||||||||||
| Net investment income2 | 0.11 | — | 3 | 0.10 | 0.10 | 0.12 | 0.01 | |||||||||||||||||||||||||||||||||||||||||||||||||||||||||||||||||||||||||||||||||||||||||||||||||||||||||||||||
| Net realized and unrealized gain (loss) on investments | (0.84 | ) | 0.88 | 3.90 | 2.62 | (1.06 | ) | 3.56 | ||||||||||||||||||||||||||||||||||||||||||||||||||||||||||||||||||||||||||||||||||||||||||||||||||||||||||||||
| Total from investment operations | (0.73 | ) | 0.88 | 4.00 | 2.72 | (0.94 | ) | 3.57 | ||||||||||||||||||||||||||||||||||||||||||||||||||||||||||||||||||||||||||||||||||||||||||||||||||||||||||||||
| Less distributions | ||||||||||||||||||||||||||||||||||||||||||||||||||||||||||||||||||||||||||||||||||||||||||||||||||||||||||||||||||||||
| From net investment income | — | (0.27 | ) | — | (0.28 | ) | (0.05 | ) | — | |||||||||||||||||||||||||||||||||||||||||||||||||||||||||||||||||||||||||||||||||||||||||||||||||||||||||||||
| From net realized gain | — | (3.56 | ) | (0.72 | ) | (1.16 | ) | — | — | |||||||||||||||||||||||||||||||||||||||||||||||||||||||||||||||||||||||||||||||||||||||||||||||||||||||||||||
| Total distributions | — | (3.83 | ) | (0.72 | ) | (1.44 | ) | (0.05 | ) | — | ||||||||||||||||||||||||||||||||||||||||||||||||||||||||||||||||||||||||||||||||||||||||||||||||||||||||||||
| Net asset value, end of period | $20.82 | $21.55 | $24.50 | $21.22 | $19.94 | $20.93 | ||||||||||||||||||||||||||||||||||||||||||||||||||||||||||||||||||||||||||||||||||||||||||||||||||||||||||||||||
| Total return (%)4,5 | (3.39 | ) 6 | 5.07 | 19.07 | 14.00 | (4.47 | ) | 20.56 | ||||||||||||||||||||||||||||||||||||||||||||||||||||||||||||||||||||||||||||||||||||||||||||||||||||||||||||||
| Ratios and supplemental data | ||||||||||||||||||||||||||||||||||||||||||||||||||||||||||||||||||||||||||||||||||||||||||||||||||||||||||||||||||||||
| Net assets, end of period (in millions) | $2 | $2 | $2 | $1 | $1 | $1 | ||||||||||||||||||||||||||||||||||||||||||||||||||||||||||||||||||||||||||||||||||||||||||||||||||||||||||||||||
| Ratios (as a percentage of average net assets): | ||||||||||||||||||||||||||||||||||||||||||||||||||||||||||||||||||||||||||||||||||||||||||||||||||||||||||||||||||||||
| Expenses before reductions | 2.61 | 7 | 3.19 | 3.29 | 3.92 | 4.00 | 4.24 | |||||||||||||||||||||||||||||||||||||||||||||||||||||||||||||||||||||||||||||||||||||||||||||||||||||||||||||||
| Expenses including reductions | 2.20 | 7 | 2.34 | 2.30 | 2.30 | 2.33 | 2.40 | |||||||||||||||||||||||||||||||||||||||||||||||||||||||||||||||||||||||||||||||||||||||||||||||||||||||||||||||
| Net investment income | 0.99 | 7 | — | 8 | 0.46 | 0.47 | 0.63 | 0.04 | ||||||||||||||||||||||||||||||||||||||||||||||||||||||||||||||||||||||||||||||||||||||||||||||||||||||||||||||
| Portfolio turnover (%) | 46 | 204 | 42 | 61 | 55 | 48 | ||||||||||||||||||||||||||||||||||||||||||||||||||||||||||||||||||||||||||||||||||||||||||||||||||||||||||||||||
| 1 | Six months ended 8-31-15. Unaudited. | ||||||||||||||||||||||||||||||||||||||||||||||||||||||||||||||||||||||||||||||||||
| 2 | Based on average daily shares outstanding. | ||||||||||||||||||||||||||||||||||||||||||||||||||||||||||||||||||||||||||||||||||
| 3 | Less than $0.005 per share. | ||||||||||||||||||||||||||||||||||||||||||||||||||||||||||||||||||||||||||||||||||
| 4 | Total returns would have been lower had certain expenses not been reduced during the applicable periods. | ||||||||||||||||||||||||||||||||||||||||||||||||||||||||||||||||||||||||||||||||||
| 5 | Does not reflect the effect of sales charges, if any. | ||||||||||||||||||||||||||||||||||||||||||||||||||||||||||||||||||||||||||||||||||
| 6 | Not annualized. | ||||||||||||||||||||||||||||||||||||||||||||||||||||||||||||||||||||||||||||||||||
| 7 | Annualized. | ||||||||||||||||||||||||||||||||||||||||||||||||||||||||||||||||||||||||||||||||||
| 8 | Less than 0.005%. | ||||||||||||||||||||||||||||||||||||||||||||||||||||||||||||||||||||||||||||||||||
| Class C Shares Period ended | 8-31-15 | 1 | 2-28-15 | 2-28-14 | 2-28-13 | 2-29-12 | 2-28-11 | |||||||||||||||||||||||||||||||||||||||||||||||||||||||||||||||||||||||||||||||||||||||||||||||||||||||||||||||
| Per share operating performance | ||||||||||||||||||||||||||||||||||||||||||||||||||||||||||||||||||||||||||||||||||||||||||||||||||||||||||||||||||||||
| Net asset value, beginning of period | $21.49 | $24.45 | $21.18 | $19.91 | $20.91 | $17.34 | ||||||||||||||||||||||||||||||||||||||||||||||||||||||||||||||||||||||||||||||||||||||||||||||||||||||||||||||||
| Net investment income (loss)2 | 0.06 | (0.03 | ) | 0.07 | 0.10 | 0.10 | 0.01 | |||||||||||||||||||||||||||||||||||||||||||||||||||||||||||||||||||||||||||||||||||||||||||||||||||||||||||||||
| Net realized and unrealized gain (loss) on investments | (0.78 | ) | 0.92 | 3.92 | 2.61 | (1.05 | ) | 3.56 | ||||||||||||||||||||||||||||||||||||||||||||||||||||||||||||||||||||||||||||||||||||||||||||||||||||||||||||||
| Total from investment operations | (0.72 | ) | 0.89 | 3.99 | 2.71 | (0.95 | ) | 3.57 | ||||||||||||||||||||||||||||||||||||||||||||||||||||||||||||||||||||||||||||||||||||||||||||||||||||||||||||||
| Less distributions | ||||||||||||||||||||||||||||||||||||||||||||||||||||||||||||||||||||||||||||||||||||||||||||||||||||||||||||||||||||||
| From net investment income | — | (0.29 | ) | — | (0.28 | ) | (0.05 | ) | — | |||||||||||||||||||||||||||||||||||||||||||||||||||||||||||||||||||||||||||||||||||||||||||||||||||||||||||||
| From net realized gain | — | (3.56 | ) | (0.72 | ) | (1.16 | ) | — | — | |||||||||||||||||||||||||||||||||||||||||||||||||||||||||||||||||||||||||||||||||||||||||||||||||||||||||||||
| Total distributions | — | (3.85 | ) | (0.72 | ) | (1.44 | ) | (0.05 | ) | — | ||||||||||||||||||||||||||||||||||||||||||||||||||||||||||||||||||||||||||||||||||||||||||||||||||||||||||||
| Net asset value, end of period | $20.77 | $21.49 | $24.45 | $21.18 | $19.91 | $20.91 | ||||||||||||||||||||||||||||||||||||||||||||||||||||||||||||||||||||||||||||||||||||||||||||||||||||||||||||||||
| Total return (%)3,4 | (3.35 | ) 5 | 5.11 | 19.05 | 13.97 | (4.52 | ) | 20.59 | ||||||||||||||||||||||||||||||||||||||||||||||||||||||||||||||||||||||||||||||||||||||||||||||||||||||||||||||
| Ratios and supplemental data | ||||||||||||||||||||||||||||||||||||||||||||||||||||||||||||||||||||||||||||||||||||||||||||||||||||||||||||||||||||||
| Net assets, end of period (in millions) | $67 | $13 | $7 | $2 | $2 | $1 | ||||||||||||||||||||||||||||||||||||||||||||||||||||||||||||||||||||||||||||||||||||||||||||||||||||||||||||||||
| Ratios (as a percentage of average net assets): | ||||||||||||||||||||||||||||||||||||||||||||||||||||||||||||||||||||||||||||||||||||||||||||||||||||||||||||||||||||||
| Expenses before reductions | 2.12 | 6 | 2.40 | 2.62 | 3.32 | 3.34 | 3.45 | |||||||||||||||||||||||||||||||||||||||||||||||||||||||||||||||||||||||||||||||||||||||||||||||||||||||||||||||
| Expenses including reductions | 2.11 | 6 | 2.30 | 2.30 | 2.30 | 2.33 | 2.40 | |||||||||||||||||||||||||||||||||||||||||||||||||||||||||||||||||||||||||||||||||||||||||||||||||||||||||||||||
| Net investment income (loss) | 0.59 | 6 | (0.11 | ) | 0.32 | 0.48 | 0.52 | 0.03 | ||||||||||||||||||||||||||||||||||||||||||||||||||||||||||||||||||||||||||||||||||||||||||||||||||||||||||||||
| Portfolio turnover (%) | 46 | 204 | 42 | 61 | 55 | 48 | ||||||||||||||||||||||||||||||||||||||||||||||||||||||||||||||||||||||||||||||||||||||||||||||||||||||||||||||||
| 1 | Six months ended 8-31-15. Unaudited. | ||||||||||||||||||||||||||||||||||||||||||||||||||||||||||||||||||||||||||||||||||
| 2 | Based on average daily shares outstanding. | ||||||||||||||||||||||||||||||||||||||||||||||||||||||||||||||||||||||||||||||||||
| 3 | Does not reflect the effect of sales charges, if any. | ||||||||||||||||||||||||||||||||||||||||||||||||||||||||||||||||||||||||||||||||||
| 4 | Total returns would have been lower had certain expenses not been reduced during the applicable periods. | ||||||||||||||||||||||||||||||||||||||||||||||||||||||||||||||||||||||||||||||||||
| 5 | Not annualized. | ||||||||||||||||||||||||||||||||||||||||||||||||||||||||||||||||||||||||||||||||||
| 6 | Annualized. | ||||||||||||||||||||||||||||||||||||||||||||||||||||||||||||||||||||||||||||||||||
| Class I Shares Period ended | 8-31-15 | 1 | 2-28-15 | 2-28-14 | 2-28-13 | 2-29-12 | 2-28-11 | |||||||||||||||||||||||||||||||||||||||||||||||||||||||||||||||||||||||||||||||||||||||||||||||||||||||||||||||
| Per share operating performance | ||||||||||||||||||||||||||||||||||||||||||||||||||||||||||||||||||||||||||||||||||||||||||||||||||||||||||||||||||||||
| Net asset value, beginning of period | $21.67 | $24.62 | $21.31 | $20.01 | $21.04 | $17.40 | ||||||||||||||||||||||||||||||||||||||||||||||||||||||||||||||||||||||||||||||||||||||||||||||||||||||||||||||||
| Net investment income2 | 0.19 | 0.35 | 0.31 | 0.43 | 0.37 | 0.23 | ||||||||||||||||||||||||||||||||||||||||||||||||||||||||||||||||||||||||||||||||||||||||||||||||||||||||||||||||
| Net realized and unrealized gain (loss) on investments | (0.81 | ) | 0.81 | 3.95 | 2.53 | (1.12 | ) | 3.60 | ||||||||||||||||||||||||||||||||||||||||||||||||||||||||||||||||||||||||||||||||||||||||||||||||||||||||||||||
| Total from investment operations | (0.62 | ) | 1.16 | 4.26 | 2.96 | (0.75 | ) | 3.83 | ||||||||||||||||||||||||||||||||||||||||||||||||||||||||||||||||||||||||||||||||||||||||||||||||||||||||||||||
| Less distributions | ||||||||||||||||||||||||||||||||||||||||||||||||||||||||||||||||||||||||||||||||||||||||||||||||||||||||||||||||||||||
| From net investment income | — | (0.55 | ) | (0.23 | ) | (0.50 | ) | (0.28 | ) | (0.19 | ) | |||||||||||||||||||||||||||||||||||||||||||||||||||||||||||||||||||||||||||||||||||||||||||||||||||||||||||
| From net realized gain | — | (3.56 | ) | (0.72 | ) | (1.16 | ) | — | — | |||||||||||||||||||||||||||||||||||||||||||||||||||||||||||||||||||||||||||||||||||||||||||||||||||||||||||||
| Total distributions | — | (4.11 | ) | (0.95 | ) | (1.66 | ) | (0.28 | ) | (0.19 | ) | |||||||||||||||||||||||||||||||||||||||||||||||||||||||||||||||||||||||||||||||||||||||||||||||||||||||||||
| Net asset value, end of period | $21.05 | $21.67 | $24.62 | $21.31 | $20.01 | $21.04 | ||||||||||||||||||||||||||||||||||||||||||||||||||||||||||||||||||||||||||||||||||||||||||||||||||||||||||||||||
| Total return (%)3 | (2.86 | ) 4 | 6.33 | 20.31 | 15.23 | (3.42 | ) | 22.08 | ||||||||||||||||||||||||||||||||||||||||||||||||||||||||||||||||||||||||||||||||||||||||||||||||||||||||||||||
| Ratios and supplemental data | ||||||||||||||||||||||||||||||||||||||||||||||||||||||||||||||||||||||||||||||||||||||||||||||||||||||||||||||||||||||
| Net assets, end of period (in millions) | $612 | $152 | $290 | $79 | $162 | $204 | ||||||||||||||||||||||||||||||||||||||||||||||||||||||||||||||||||||||||||||||||||||||||||||||||||||||||||||||||
| Ratios (as a percentage of average net assets): | ||||||||||||||||||||||||||||||||||||||||||||||||||||||||||||||||||||||||||||||||||||||||||||||||||||||||||||||||||||||
| Expenses before reductions | 1.08 | 5 | 1.19 | 1.21 | 1.27 | 1.20 | 1.14 | |||||||||||||||||||||||||||||||||||||||||||||||||||||||||||||||||||||||||||||||||||||||||||||||||||||||||||||||
| Expenses including reductions | 1.08 | 5 | 1.18 | 1.21 | 1.25 | 1.20 | 1.14 | |||||||||||||||||||||||||||||||||||||||||||||||||||||||||||||||||||||||||||||||||||||||||||||||||||||||||||||||
| Net investment income | 1.68 | 5 | 1.46 | 1.33 | 2.09 | 1.88 | 1.21 | |||||||||||||||||||||||||||||||||||||||||||||||||||||||||||||||||||||||||||||||||||||||||||||||||||||||||||||||
| Portfolio turnover (%) | 46 | 204 | 42 | 61 | 55 | 48 | ||||||||||||||||||||||||||||||||||||||||||||||||||||||||||||||||||||||||||||||||||||||||||||||||||||||||||||||||
| 1 | Six months ended 8-31-15. Unaudited. | ||||||||||||||||||||||||||||||||||||||||||||||||||||||||||||||||||||||||||||||||||
| 2 | Based on average daily shares outstanding. | ||||||||||||||||||||||||||||||||||||||||||||||||||||||||||||||||||||||||||||||||||
| 3 | Total returns would have been lower had certain expenses not been reduced during the applicable periods. | ||||||||||||||||||||||||||||||||||||||||||||||||||||||||||||||||||||||||||||||||||
| 4 | Not annualized. | ||||||||||||||||||||||||||||||||||||||||||||||||||||||||||||||||||||||||||||||||||
| 5 | Annualized. | ||||||||||||||||||||||||||||||||||||||||||||||||||||||||||||||||||||||||||||||||||
| Class R2 Shares Period ended | 8-31-15 | 1,2 | |||||||||||||||||||||||||||
| Per share operating performance | |||||||||||||||||||||||||||||
| Net asset value, beginning of period | $21.46 | ||||||||||||||||||||||||||||
| Net investment income3 | 0.06 | ||||||||||||||||||||||||||||
| Net realized and unrealized loss on investments | (0.53 | ) | |||||||||||||||||||||||||||
| Total from investment operations | (0.47 | ) | |||||||||||||||||||||||||||
| Net asset value, end of period | $20.99 | ||||||||||||||||||||||||||||
| Total return (%)4 | (2.19 | ) 5 | |||||||||||||||||||||||||||
| Ratios and supplemental data | |||||||||||||||||||||||||||||
| Net assets, end of period (in millions) | $1 | ||||||||||||||||||||||||||||
| Ratios (as a percentage of average net assets): | |||||||||||||||||||||||||||||
| Expenses before reductions | 3.06 | 6 | |||||||||||||||||||||||||||
| Expenses including reductions | 1.69 | 6 | |||||||||||||||||||||||||||
| Net investment income (loss) | 0.65 | 6 | |||||||||||||||||||||||||||
| Portfolio turnover (%) | 46 | 7 | |||||||||||||||||||||||||||
| 1 | The inception date for Class R2 shares is 3-27-15. | |||||||||||||||||||||||||||||||||||||
| 2 | Period ended 8-31-15. Unaudited. | |||||||||||||||||||||||||||||||||||||
| 3 | Based on average daily shares outstanding. | |||||||||||||||||||||||||||||||||||||
| 4 | Total returns would have been lower had certain expenses not been reduced during the period. | |||||||||||||||||||||||||||||||||||||
| 5 | Not annualized. | |||||||||||||||||||||||||||||||||||||
| 6 | Annualized. | |||||||||||||||||||||||||||||||||||||
| 7 | The portfolio turnover is shown for the period from 3-1-15 to 8-31-15. | |||||||||||||||||||||||||||||||||||||
| Class R4 Shares Period ended | 8-31-15 | 1,2 | |||||||||||||||||||||||||||
| Per share operating performance | |||||||||||||||||||||||||||||
| Net asset value, beginning of period | $21.46 | ||||||||||||||||||||||||||||
| Net investment income3 | 0.07 | ||||||||||||||||||||||||||||
| Net realized and unrealized loss on investments | (0.52 | ) | |||||||||||||||||||||||||||
| Total from investment operations | (0.45 | ) | |||||||||||||||||||||||||||
| Net asset value, end of period | $21.01 | ||||||||||||||||||||||||||||
| Total return (%)4 | (2.10 | ) 5 | |||||||||||||||||||||||||||
| Ratios and supplemental data | |||||||||||||||||||||||||||||
| Net assets, end of period (in millions) | $1 | ||||||||||||||||||||||||||||
| Ratios (as a percentage of average net assets): | |||||||||||||||||||||||||||||
| Expenses before reductions | 3.89 | 6 | |||||||||||||||||||||||||||
| Expenses including reductions | 1.44 | 6 | |||||||||||||||||||||||||||
| Net investment income | 0.77 | 6 | |||||||||||||||||||||||||||
| Portfolio turnover (%) | 46 | 7 | |||||||||||||||||||||||||||
| 1 | The inception date for Class R4 shares is 3-27-15. | |||||||||||||||||||||||||||||||||||||
| 2 | Period ended 8-31-15. Unaudited. | |||||||||||||||||||||||||||||||||||||
| 3 | Based on average daily shares outstanding. | |||||||||||||||||||||||||||||||||||||
| 4 | Total returns would have been lower had certain expenses not been reduced during the period. | |||||||||||||||||||||||||||||||||||||
| 5 | Not annualized. | |||||||||||||||||||||||||||||||||||||
| 6 | Annualized. | |||||||||||||||||||||||||||||||||||||
| 7 | The portfolio turnover is shown for the period from 3-1-15 to 8-31-15. | |||||||||||||||||||||||||||||||||||||
| Class R6 Shares Period ended | 8-31-15 | 1,2 | |||||||||||||||||||||||||||
| Per share operating performance | |||||||||||||||||||||||||||||
| Net asset value, beginning of period | $21.46 | ||||||||||||||||||||||||||||
| Net investment income3 | 0.14 | ||||||||||||||||||||||||||||
| Net realized and unrealized loss on investments | (0.54 | ) | |||||||||||||||||||||||||||
| Total from investment operations | (0.40 | ) | |||||||||||||||||||||||||||
| Net asset value, end of period | $21.06 | ||||||||||||||||||||||||||||
| Total return (%)4 | (1.86 | ) 5 | |||||||||||||||||||||||||||
| Ratios and supplemental data | |||||||||||||||||||||||||||||
| Net assets, end of period (in millions) | $1 | ||||||||||||||||||||||||||||
| Ratios (as a percentage of average net assets): | |||||||||||||||||||||||||||||
| Expenses before reductions | 4.45 | 6 | |||||||||||||||||||||||||||
| Expenses including reductions | 1.00 | 6 | |||||||||||||||||||||||||||
| Net investment income (loss) | 1.53 | 6 | |||||||||||||||||||||||||||
| Portfolio turnover (%) | 46 | 7 | |||||||||||||||||||||||||||
| 1 | The inception date for Class R6 shares is 3-27-15. | |||||||||||||||||||||||||||||||||||||
| 2 | Period ended 8-31-15. Unaudited. | |||||||||||||||||||||||||||||||||||||
| 3 | Based on average daily shares outstanding. | |||||||||||||||||||||||||||||||||||||
| 4 | Total returns would have been lower had certain expenses not been reduced during the period. | |||||||||||||||||||||||||||||||||||||
| 5 | Not annualized. | |||||||||||||||||||||||||||||||||||||
| 6 | Annualized. | |||||||||||||||||||||||||||||||||||||
| 7 | The portfolio turnover is shown for the period from 3-1-15 to 8-31-15. | |||||||||||||||||||||||||||||||||||||
| Class 1 Shares Period ended | 8-31-15 | 1 | 2-28-15 | 2-28-14 | 2-28-13 | 2-29-12 | 2-28-11 | |||||||||||||||||||||||||||||||||||||||||||||||||||||||||||||||||||||||||||||||||||||||||||||||||||||||||||||||
| Per share operating performance | ||||||||||||||||||||||||||||||||||||||||||||||||||||||||||||||||||||||||||||||||||||||||||||||||||||||||||||||||||||||
| Net asset value, beginning of period | $21.65 | $24.61 | $21.30 | $20.00 | $21.02 | $17.38 | ||||||||||||||||||||||||||||||||||||||||||||||||||||||||||||||||||||||||||||||||||||||||||||||||||||||||||||||||
| Net investment income2 | 0.23 | 0.28 | 0.37 | 0.34 | 0.36 | 0.23 | ||||||||||||||||||||||||||||||||||||||||||||||||||||||||||||||||||||||||||||||||||||||||||||||||||||||||||||||||
| Net realized and unrealized gain (loss) on investments | (0.83 | ) | 0.90 | 3.92 | 2.63 | (1.09 | ) | 3.60 | ||||||||||||||||||||||||||||||||||||||||||||||||||||||||||||||||||||||||||||||||||||||||||||||||||||||||||||||
| Total from investment operations | (0.60 | ) | 1.18 | 4.29 | 2.97 | (0.73 | ) | 3.83 | ||||||||||||||||||||||||||||||||||||||||||||||||||||||||||||||||||||||||||||||||||||||||||||||||||||||||||||||
| Less distributions | ||||||||||||||||||||||||||||||||||||||||||||||||||||||||||||||||||||||||||||||||||||||||||||||||||||||||||||||||||||||
| From net investment income | — | (0.58 | ) | (0.26 | ) | (0.51 | ) | (0.29 | ) | (0.19 | ) | |||||||||||||||||||||||||||||||||||||||||||||||||||||||||||||||||||||||||||||||||||||||||||||||||||||||||||
| From net realized gain | — | (3.56 | ) | (0.72 | ) | (1.16 | ) | — | — | |||||||||||||||||||||||||||||||||||||||||||||||||||||||||||||||||||||||||||||||||||||||||||||||||||||||||||||
| Total distributions | — | (4.14 | ) | (0.98 | ) | (1.67 | ) | (0.29 | ) | (0.19 | ) | |||||||||||||||||||||||||||||||||||||||||||||||||||||||||||||||||||||||||||||||||||||||||||||||||||||||||||
| Net asset value, end of period | $21.05 | $21.65 | $24.61 | $21.30 | $20.00 | $21.02 | ||||||||||||||||||||||||||||||||||||||||||||||||||||||||||||||||||||||||||||||||||||||||||||||||||||||||||||||||
| Total return (%)3 | (2.77 | ) 4 | 6.39 | 20.43 | 15.29 | (3.33 | ) | 22.11 | ||||||||||||||||||||||||||||||||||||||||||||||||||||||||||||||||||||||||||||||||||||||||||||||||||||||||||||||
| Ratios and supplemental data | ||||||||||||||||||||||||||||||||||||||||||||||||||||||||||||||||||||||||||||||||||||||||||||||||||||||||||||||||||||||
| Net assets, end of period (in millions) | $31 | $20 | $16 | $11 | $9 | $8 | ||||||||||||||||||||||||||||||||||||||||||||||||||||||||||||||||||||||||||||||||||||||||||||||||||||||||||||||||
| Ratios (as a percentage of average net assets): | ||||||||||||||||||||||||||||||||||||||||||||||||||||||||||||||||||||||||||||||||||||||||||||||||||||||||||||||||||||||
| Expenses before reductions | 1.02 | 5 | 1.10 | 1.12 | 1.19 | 1.16 | 1.13 | |||||||||||||||||||||||||||||||||||||||||||||||||||||||||||||||||||||||||||||||||||||||||||||||||||||||||||||||
| Expenses including reductions | 1.01 | 5 | 1.09 | 1.12 | 1.15 | 1.14 | 1.13 | |||||||||||||||||||||||||||||||||||||||||||||||||||||||||||||||||||||||||||||||||||||||||||||||||||||||||||||||
| Net investment income | 2.05 | 5 | 1.18 | 1.59 | 1.68 | 1.83 | 1.21 | |||||||||||||||||||||||||||||||||||||||||||||||||||||||||||||||||||||||||||||||||||||||||||||||||||||||||||||||
| Portfolio turnover (%) | 46 | 204 | 42 | 61 | 55 | 48 | ||||||||||||||||||||||||||||||||||||||||||||||||||||||||||||||||||||||||||||||||||||||||||||||||||||||||||||||||
| 1 | Six months ended 8-31-15. Unaudited. | ||||||||||||||||||||||||||||||||||||||||||||||||||||||||||||||||||||||||||||||||||
| 2 | Based on average daily shares outstanding. | ||||||||||||||||||||||||||||||||||||||||||||||||||||||||||||||||||||||||||||||||||
| 3 | Total returns would have been lower had certain expenses not been reduced during the applicable periods. | ||||||||||||||||||||||||||||||||||||||||||||||||||||||||||||||||||||||||||||||||||
| 4 | Not annualized. | ||||||||||||||||||||||||||||||||||||||||||||||||||||||||||||||||||||||||||||||||||
| 5 | Annualized. | ||||||||||||||||||||||||||||||||||||||||||||||||||||||||||||||||||||||||||||||||||
| Class NAV Shares Period ended | 8-31-15 | 1,2 | |||||||||||||||||||||||||||
| Per share operating performance | |||||||||||||||||||||||||||||
| Net asset value, beginning of period | $22.66 | ||||||||||||||||||||||||||||
| Net investment income3 | 0.07 | ||||||||||||||||||||||||||||
| Net realized and unrealized loss on investments | (1.68 | ) | |||||||||||||||||||||||||||
| Total from investment operations | (1.61 | ) | |||||||||||||||||||||||||||
| Net asset value, end of period | $21.05 | ||||||||||||||||||||||||||||
| Total return (%)4 | (7.11 | ) 5 | |||||||||||||||||||||||||||
| Ratios and supplemental data | |||||||||||||||||||||||||||||
| Net assets, end of period (in millions) | $92 | ||||||||||||||||||||||||||||
| Ratios (as a percentage of average net assets): | |||||||||||||||||||||||||||||
| Expenses before reductions | 0.95 | 6 | |||||||||||||||||||||||||||
| Expenses including reductions | 0.94 | 6 | |||||||||||||||||||||||||||
| Net investment income (loss) | 1.31 | 6 | |||||||||||||||||||||||||||
| Portfolio turnover (%) | 46 | 7 | |||||||||||||||||||||||||||
| 1 | The inception date for Class NAV shares is 6-2-15. | |||||||||||||||||||||||||||||||||||||
| 2 | Period ended 8-31-15. Unaudited. | |||||||||||||||||||||||||||||||||||||
| 3 | Based on average daily shares outstanding. | |||||||||||||||||||||||||||||||||||||
| 4 | Total returns would have been lower had certain expenses not been reduced during the period. | |||||||||||||||||||||||||||||||||||||
| 5 | Not annualized. | |||||||||||||||||||||||||||||||||||||
| 6 | Annualized. | |||||||||||||||||||||||||||||||||||||
| 7 | The portfolio turnover is shown for the period from 3-1-15 to 8-31-15. | |||||||||||||||||||||||||||||||||||||
Note 1 — Organization
John Hancock International Growth Fund (the fund) is a series of John Hancock Funds III (the Trust), an open-end management investment company organized as a Massachusetts business trust and registered under the Investment Company Act of 1940, as amended (the 1940 Act). The investment objective of the fund is to seek high total return primarily through capital appreciation.
The fund may offer multiple classes of shares. The shares currently offered are detailed in the Statement of assets and liabilities. Class A and Class C shares are offered to all investors. Class B shares are closed to new investors. Class I shares are offered to institutions and certain investors. Class R2 and Class R4 shares are available only to certain retirement plans. Class R6 shares are available only to certain retirement plans, institutions and other investors. Class 1 shares are offered only to certain affiliates of Manulife Financial Corporation (MFC). Class NAV shares are offered to John Hancock affiliated funds of funds and certain 529 plans. Shareholders of each class have exclusive voting rights to matters that affect that class. The distribution and service fees, if any, and transfer agent fees for each class may differ. Class B shares convert to Class A shares eight years after purchase.
Note 2 — Significant accounting policies
The financial statements have been prepared in conformity with accounting principles generally accepted in the United States of America (US GAAP), which require management to make certain estimates and assumptions as of the date of the financial statements. Actual results could differ from those estimates and those differences could be significant. The fund qualifies as an investment company under Topic 946 of Accounting Standards Codification of US GAAP.
Events or transactions occurring after the end of the fiscal period through the date that the financial statements were issued have been evaluated in the preparation of the financial statements. The following summarizes the significant accounting policies of the fund:
Security valuation. Investments are stated at value as of the close of regular trading on the New York Stock Exchange (NYSE), normally at 4:00 p.m., Eastern Time. In order to value the securities, the fund uses the following valuation techniques: Equity securities held by the fund are valued at the last sale price or official closing price on the exchange where the security was acquired or most likely will be sold. In the event there were no sales during the day or closing prices are not available, the securities are valued using the last available bid price. Investment by the fund in open-end mutual funds, including John Hancock Collateral Trust (JHCT), are valued at their respective net asset values each business day. Foreign securities and currencies are valued in U.S. dollars, based on foreign currency exchange rates supplied by an independent pricing vendor. Securities that trade only in the over-the-counter (OTC) market are valued using bid prices.
Other portfolio securities and assets, for which reliable market quotations are not readily available, are valued at fair value as determined in good faith by the fund's Pricing Committee following procedures established by the Board of Trustees. The frequency with which these fair valuation procedures are used cannot be predicted and fair value of securities may differ significantly from the value that would have been used had a ready market for such securities existed. Trading in foreign securities may be completed before the daily close of trading on the NYSE. Significant events at the issuer or market level may affect the values of securities between the time when the valuation of the securities is generally determined and the close of the NYSE. If a significant event occurs, these securities may be fair valued, as determined in good faith by the fund's Pricing Committee, following procedures established by the Board of Trustees. The fund uses fair value adjustment factors provided by an independent pricing vendor to value certain foreign securities in order to adjust for events that may occur between the close of foreign exchanges or markets and the close of the NYSE.
The fund uses a three-tier hierarchy to prioritize the pricing assumptions, referred to as inputs, used in valuation techniques to measure fair value. Level 1 includes securities valued using quoted prices in active markets for identical securities. Level 2 includes securities valued using other significant observable inputs. Observable inputs may include quoted prices for similar
27
securities, interest rates, prepayment speeds and credit risk. Prices for securities valued using these inputs are received from independent pricing vendors and brokers and are based on an evaluation of the inputs described. Level 3 includes securities valued using significant unobservable inputs when market prices are not readily available or reliable, including the fund's own assumptions in determining the fair value of investments. Factors used in determining value may include market or issuer specific events or trends, changes in interest rates and credit quality. The inputs or methodology used for valuing securities are not necessarily an indication of the risks associated with investing in those securities. Changes in valuation techniques and related inputs may result in transfers into or out of an assigned level within the disclosure hierarchy.
The following is a summary of the values by input classification of the fund's investments as of August 31, 2015, by major security category or type:
| Total value at 8-31-15 | Level 1 quoted price | Level 2 significant observable inputs | Level 3 significant unobservable inputs | ||
| Common stocks | |||||
| Belgium | $23,410,196 | — | $23,410,196 | — | |
| Canada | 18,225,565 | $18,225,565 | — | — | |
| China | 35,700,847 | — | 35,700,847 | — | |
| Denmark | 69,597,871 | — | 69,597,871 | — | |
| Finland | 13,758,860 | — | 13,758,860 | — | |
| France | 60,375,242 | — | 60,375,242 | — | |
| Germany | 32,855,305 | — | 32,855,305 | — | |
| Hong Kong | 32,503,279 | — | 32,503,279 | — | |
| India | 78,712,593 | 33,607,285 | 45,105,308 | — | |
| Ireland | 29,589,788 | 29,589,788 | — | — | |
| Israel | 17,081,226 | 17,081,226 | — | — | |
| Japan | 76,141,193 | — | 76,141,193 | — | |
| Netherlands | 45,480,538 | 29,401,516 | 16,079,022 | — | |
| Singapore | 15,139,956 | 15,139,956 | — | — | |
| Switzerland | 126,690,889 | — | 126,690,889 | — | |
| Taiwan | 58,598,962 | 31,333,333 | 27,265,629 | — | |
| United Kingdom | 371,934,753 | 15,740,248 | 356,194,505 | — | |
| United States | 49,496,862 | 49,496,862 | — | — | |
| Total investments in securities | $1,155,293,925 | $239,615,779 | $915,678,146 | — | |
Security transactions and related investment income. Investment security transactions are accounted for on a trade date plus one basis for daily net asset value calculations. However, for financial reporting purposes, investment transactions are reported on trade date. Dividend income is recorded on the ex-date, except for dividends of foreign securities where the dividend may not be known until after the ex-date. In those cases, dividend income, net of withholding taxes, is recorded when the fund becomes aware of the dividends. Foreign taxes are provided for based on the fund's understanding of the tax rules and rates that exist in the foreign markets in which it invests. Gains and losses on securities sold are determined on the basis of identified cost and may include proceeds from litigation.
Securities lending. The fund may lend its securities to earn additional income. The fund receives cash collateral from the borrower in an amount not less than the market value of the loaned securities. The fund will invest its collateral in JHCT, an affiliate of the fund, which has a floating net asset value and is registered with the Securities and Exchange Commission as an investment company. JHCT invests cash received as collateral as part of the securities lending program in short-term
28
money market investments. The fund will receive the benefit of any gains and bear any losses generated by JHCT with respect to the cash collateral.
If a borrower fails to return loaned securities when due, then the lending agent is responsible and indemnifies the fund for the lent securities. The lending agent uses the collateral received from the borrower to purchase replacement securities of the same issue, type, class and series of the loaned securities. If the value of the collateral is less than the purchase cost of replacement securities, the lending agent is responsible for satisfying the shortfall but only to the extent that the shortfall is not due to any decrease in the value of JHCT.
Although the risk of the loss of the securities lent is mitigated by receiving collateral from the borrower and through lending agent indemnification, the fund could experience a delay in recovering securities or could experience a lower than expected return if the borrower fails to return the securities on a timely basis. The fund may receive compensation for lending its securities by retaining a portion of the return on the investment of the collateral and compensation from fees earned from borrowers of the securities. Net income received from JHCT is a component of securities lending income as recorded on the Statement of operations.
Obligations to repay collateral received by the fund is shown on the Statement of assets and liabilities as Payable upon return of securities loaned.
Foreign currency translation. Assets, including investments and liabilities denominated in foreign currencies, are translated into U.S. dollar values each day at the prevailing exchange rate. Purchases and sales of securities, income and expenses are translated into U.S. dollars at the prevailing exchange rate on the date of the transaction. The effect of changes in foreign currency exchange rates on the value of securities is reflected as a component of the realized and unrealized gains (losses) on investments.
Funds that invest internationally generally carry more risk than funds that invest strictly in U.S. securities. These risks are heightened for investments in emerging markets. Risks can result from differences in economic and political conditions, regulations, market practices (including higher transaction costs), accounting standards and other factors. Foreign investments are also subject to a decline in the value of a foreign currency versus the U.S. dollar, which reduces the dollar value of securities denominated in that currency.
Foreign taxes. The fund may be subject to withholding tax on income and/or capital gains or repatriation taxes imposed by certain countries in which the fund invests. Taxes are accrued based upon investment income, realized gains or unrealized appreciation.
Line of credit. The fund may borrow from banks for temporary or emergency purposes, including meeting redemption requests that otherwise might require the untimely sale of securities. Pursuant to the fund's custodian agreement, the custodian may loan money to the fund to make properly authorized payments. The fund is obligated to repay the custodian for any overdraft, including any related costs or expenses. The custodian may have a lien, security interest or security entitlement in any fund property that is not otherwise segregated or pledged, to the extent of any overdraft, and to the maximum extent permitted by law.
Effective June 30, 2015, the fund and other affiliated funds entered into a syndicated line of credit agreement, with Citibank, N.A. as the administrative agent, that enables them to participate in a $750 million unsecured committed line of credit. Prior to June 30, 2015, the fund and other affiliated funds had an agreement with Citibank that enabled them to participate in a $300 million unsecured committed line of credit. A commitment fee, payable at the end of each calendar quarter, based on the average daily unused portion of the effective line of credit, is charged to each participating fund on a pro rata basis and is reflected in other expenses on the Statement of operations. Commitment fees for the six months ended August 31, 2015, were $156. For the six months ended August 31, 2015, the fund had no borrowings under either line of credit.
29
Expenses. Within the John Hancock group of funds complex, expenses that are directly attributable to an individual fund are allocated to such fund. Expenses that are not readily attributable to a specific fund are allocated among all funds in an equitable manner, taking into consideration, among other things, the nature and type of expense and the fund's relative net assets. Expense estimates are accrued in the period to which they relate and adjustments are made when actual amounts are known.
Class allocations. Income, common expenses and realized and unrealized gains (losses) are determined at the fund level and allocated daily to each class of shares based on the net assets of the class. Class-specific expenses, such as distribution and service fees, if any, and transfer agent fees, for all classes, are calculated daily at the class level based on the net assets of each class and the specific expense rates applicable to each class.Through June 30, 2015, class-specific expenses, such as state registration fees and printing and postage, for all classes were calculated daily at the class level based on the net assets of each class and the specific expense rates applicable to each class.
Federal income taxes. The fund intends to continue to qualify as a regulated investment company by complying with the applicable provisions of the Internal Revenue Code and will not be subject to federal income tax on taxable income that is distributed to shareholders. Therefore, no federal income tax provision is required.
As of February 28, 2015, the fund had no uncertain tax positions that would require financial statement recognition, derecognition or disclosure. The fund's federal tax returns are subject to examination by the Internal Revenue Service for a period of three years.
Distribution of income and gains. Distributions to shareholders from net investment income and net realized gains, if any, are recorded on the ex-date. The fund generally declares and pays dividends and capital gain distributions, if any, annually.
Distributions paid by the fund with respect to each class of shares are calculated in the same manner, at the same time and in the same amount, except for the effect of class level expenses that may be applied differently to each class.
Such distributions, on a tax basis, are determined in conformity with income tax regulations, which may differ from US GAAP.
Capital accounts within the financial statements are adjusted for permanent book-tax differences. These adjustments have no impact on net assets or the results of operations. Temporary book-tax differences, if any, will reverse in a subsequent period. Book-tax differences are primarily attributable to foreign currency transactions, passive foreign investment companies, wash sale loss deferrals and treating a portion of the proceeds from redemptions as distributions for tax purposes.
Note 3 — Guarantees and indemnifications
Under the Trust's organizational documents, its Officers and Trustees are indemnified against certain liabilities arising out of the performance of their duties to the Trust, including the fund. Additionally, in the normal course of business, the fund enters into contracts with service providers that contain general indemnification clauses. The fund's maximum exposure under these arrangements is unknown, as this would involve future claims that may be made against the fund that have not yet occurred. The risk of material loss from such claims is considered remote.
Note 4 — Fees and transactions with affiliates
John Hancock Advisers, LLC (the Advisor) serves as investment advisor for the fund. John Hancock Funds, LLC (the Distributor), an affiliate of the Advisor, serves as principal underwriter of the fund. The Advisor and the Distributor are indirect, wholly owned subsidiaries of MFC.
Management fee. The fund has an investment management agreement with the Advisor under which the fund pays a daily management fee to the Advisor, on an annual basis, equal to the sum of (a) 0.900% of the first $500 million of the
30
fund's average daily net assets; (b) 0.850% of the next $500 million of the fund's average daily net assets, and (c) 0.800% of the fund's average daily net assets in excess of $1 billion. The Advisor has a subadvisory agreement with Wellington Management Company LLP. The fund is not responsible for payment of the subadvisory fees.
The Advisor has contractually agreed to waive a portion of its management fee and/or reimburse expenses for certain funds of the John Hancock group of funds complex, including the fund (the participating portfolios). This waiver is based upon aggregate net assets of all the participating portfolios. The amount of the reimbursement is calculated daily and allocated among all the participating portfolios in proportion to the daily net assets of each fund. During the six months ended August 31, 2015, this waiver amounted to 0.01% of the fund's average net assets on an annualized basis. This arrangement may be amended or terminated at any time by the Advisor upon notice to the fund and with the approval of the Board of Trustees.
The Advisor has contractually agreed to waive fees and/or reimburse certain expenses for each share class of the fund. This agreement excludes taxes, brokerage commissions, interest expense, litigation and indemnification expenses and other extraordinary expenses not incurred in the ordinary course of the fund's business, acquired fees and expenses paid indirectly and short dividend expense. The fee waivers and/or reimbursements are such that these expenses will not exceed 1.24%, 1.15%, 1.69%, and 1.44% of average net assets for Class I, Class 1, Class R2, and Class R4 shares, respectively. The current expense limitation agreement will remain in effect through June 30, 2016, unless renewed by mutual agreement of the fund and the Advisor based upon a determination that this is appropriate under the circumstances at the time. Prior to July 1, 2015, Class A and Class C shares had fee waivers and/or reimbursement such that the expenses would not exceed 1.60% and 2.30% for Class A and Class C shares, respectively.
Prior to July 1, 2015, the Advisor contractually agreed to waive and/or reimburse all class specific expenses for Class B shares of the fund, including Rule 12b-1 fees and transfer agency fees and service fees, as applicable, to the extent they exceed 1.30% of average annual net assets (on an annualized basis) attributable to Class B shares (the Class Expense Waiver).
The Advisor has contractually agreed to waive and/or reimburse all class specific expenses for Class R6 shares of the fund to the extent they exceed 0.00% of average annual net assets, on an annualized basis. The expense limitation expires on June 30, 2016, unless renewed by mutual agreement of the fund and the Advisor based upon a determination that this is appropriate under the circumstances at the time.
The expense reductions described above amounted to the following for the six months ended August 31, 2015:
| Class | Expense reductions | Class | Expense reductions | |
| Class A | $10,064 | Class R4 | $3,482 | |
| Class B | 3,949 | Class R6 | 4,076 | |
| Class C | 1,502 | Class 1 | 1,011 | |
| Class I | 15,414 | Class NAV | 1,853 | |
| Class R2 | 3,060 | Total | $44,411 |
The investment management fees, including the impact of the waivers and reimbursements as described above, incurred for the six months ended August 31, 2015, were equivalent to a net annual effective rate of 0.87% of the fund's average daily net assets.
Accounting and legal services. Pursuant to a service agreement, the fund reimburses the Advisor for all expenses associated with providing the administrative, financial, legal, accounting and recordkeeping services to the fund, including the preparation of all tax returns, periodic reports to shareholders and regulatory reports, among other services. These expenses are allocated to each share class based on its relative net assets at the time the expense was incurred. These accounting and legal services fees incurred for the six months ended August 31, 2015 amounted to an annual rate of 0.01% of the fund's average daily net assets.
31
Distribution and service plans. The fund has a distribution agreement with the Distributor. The fund has adopted distribution and service plans with respect to Class A, Class B, Class C, Class R2, Class R4, and Class 1 shares pursuant to Rule 12b-1 under the 1940 Act, to pay the Distributor for services provided as the distributor of shares of the fund. In addition, under a service plan for Class R2 and Class R4 shares, the fund pays for certain other services. The fund may pay up to the following contractual rates of distribution and service fees under these arrangements, expressed as an annual percentage of average daily net assets for each class of the fund's shares.
| Class | Rule 12b-1 fee | Service fee |
| Class A | 0.30% | — |
| Class B | 1.00% | — |
| Class C | 1.00% | — |
| Class R2 | 0.25% | 0.25% |
| Class R4 | 0.25% | 0.10% |
| Class 1 | 0.05% | — |
The fund's Distributor has contractually agreed to waive 0.10% of Rule 12b-1 fees for Class R4 shares. The current waiver agreement expires on June 30, 2016 unless renewed by mutual agreement of the fund and the Distributor based upon a determination that this is appropriate under the circumstances at the time. This contractual waiver amounted to $142 for Class R4 shares for the six months ended August 31, 2015.
Sales charges. Class A shares are assessed up-front sales charges, which resulted in payments to the Distributor amounting to $1,882,971 for the six months ended August 31, 2015. Of this amount, $317,054 was retained and used for printing prospectuses, advertising, sales literature and other purposes, $1,563,122 was paid as sales commissions to broker-dealers and $2,795 was paid as sales commissions to sales personnel of Signator Investors, Inc., a broker-dealer affiliate of the Advisor.
Class A, Class B and Class C shares may be subject to contingent deferred sales charges (CDSCs). Certain Class A shares that are acquired through purchases of $1 million or more and are redeemed within one year of purchase are subject to a 1.00% sales charge. Class B shares that are redeemed within six years of purchase are subject to CDSCs, at declining rates, beginning at 5.00%. Class C shares that are redeemed within one year of purchase are subject to a 1.00% CDSC. CDSCs are applied to the lesser of the current market value at the time of redemption or the original purchase cost of the shares being redeemed. Proceeds from CDSCs are used to compensate the Distributor for providing distribution-related services in connection with the sale of these shares. During the six months ended August 31, 2015, CDSCs received by the Distributor amounted to $2,417, $7,111 and $7,620 for Class A, Class B and Class C shares, respectively.
Transfer agent fees. The fund has a transfer agent agreement with John Hancock Signature Services, Inc. (Signature Services), an affiliate of the Advisor. The transfer agent fees paid to Signature Services are determined based on the cost to Signature Services (Signature Services Cost) of providing recordkeeping services. It also includes out-of-pocket expenses, including payments made to third-parties for recordkeeping services provided to their clients who invest in one or more John Hancock funds. In addition, Signature Services Cost may be reduced by certain fees that Signature Services receives in connection with retirement and small accounts. Signature Services Cost is calculated monthly and allocated, as applicable, to five categories of share classes: Retail Share and Institutional Share Classes of Non-Municipal Bond Funds, Class R6 Shares, Retirement Share Classes and Municipal Bond Share Classes. Within each of these categories, the applicable costs are allocated to the affected John Hancock affiliated funds and/or classes, based on the relative average daily net assets.
32
Class level expenses. Class level expenses for the six months ended August 31, 2015 were:
| Class | Distribution and service fees | Transfer agent fees | State registration fees | Printing and postage |
| Class A | $388,993 | $162,634 | $9,707 | $6,476 |
| Class B | 9,587 | 1,205 | 4,782 | 147 |
| Class C | 193,024 | 24,180 | 4,909 | 606 |
| Class I | — | 222,346 | 6,454 | 6,686 |
| Class R2 | 872 | 35 | 3,760 | 28 |
| Class R4 | 455 | 22 | 3,761 | 8 |
| Class R6 | — | 18 | 4,040 | 8 |
| Class 1 | 6,540 | — | — | — |
| Total | $599,471 | $410,440 | $37,413 | $13,959 |
Effective July 1, 2015, state registration fees and printing and postage are treated as fund level expenses and are not included in the table above. For the period July 1, 2015 to August 31, 2015, state registration and printing and postage amounted to $20,392 and $9,811, respectively.
Trustee expenses. The fund compensates each Trustee who is not an employee of the Advisor or its affiliates. The costs of paying Trustee compensation and expenses are allocated to each fund based on its net assets relative to other funds within the John Hancock group of funds complex.
Note 5 — Fund share transactions
Transactions in fund shares for the six months ended August 31, 2015, and for the year ended February 28, 2015, were as follows:
| Six months ended 8-31-15 | Year ended 2-28-15 | |||||||||||||||||||||||||
| Shares | Amount | Shares | Amount | |||||||||||||||||||||||
| Class A shares | ||||||||||||||||||||||||||
| Sold | 13,487,648 | $299,158,516 | 3,872,773 | $89,197,062 | ||||||||||||||||||||||
| Distributions reinvested | — | — | 870,844 | 17,190,462 | ||||||||||||||||||||||
| Repurchased | (1,679,342 | ) | (36,603,810 | ) | (3,537,619 | ) | (86,355,594 | ) | ||||||||||||||||||
| Net increase | 11,808,306 | $262,554,706 | 1,205,998 | $20,031,930 | ||||||||||||||||||||||
| Class B shares | ||||||||||||||||||||||||||
| Sold | 30,872 | $679,879 | 11,751 | $269,871 | ||||||||||||||||||||||
| Distributions reinvested | — | — | 11,409 | 224,646 | ||||||||||||||||||||||
| Repurchased | (10,207 | ) | (225,123 | ) | (17,977 | ) | (410,047 | ) | ||||||||||||||||||
| Net increase | 20,665 | $454,756 | 5,183 | $84,470 | ||||||||||||||||||||||
| Class C shares | ||||||||||||||||||||||||||
| Sold | 2,743,633 | $60,250,618 | 353,368 | $7,865,929 | ||||||||||||||||||||||
| Distributions reinvested | — | — | 58,230 | 1,143,641 | ||||||||||||||||||||||
| Repurchased | (141,873 | ) | (3,067,687 | ) | (92,860 | ) | (2,139,704 | ) | ||||||||||||||||||
| Net increase | 2,601,760 | $57,182,931 | 318,738 | $6,869,866 | ||||||||||||||||||||||
| Class I shares | ||||||||||||||||||||||||||
| Sold | 28,558,921 | $635,417,082 | 7,959,907 | $188,904,055 | ||||||||||||||||||||||
| Distributions reinvested | — | — | 959,666 | 18,953,405 | ||||||||||||||||||||||
| Repurchased | (6,541,490 | ) | (146,645,644 | ) | (13,666,278 | ) | (328,851,005 | ) | ||||||||||||||||||
| Net increase (decrease) | 22,017,431 | $488,771,438 | (4,746,705 | ) | ($120,993,545 | ) | ||||||||||||||||||||
33
| Six months ended 8-31-15 | Year ended 2-28-15 | |||||||||||||||||||||||||
| Shares | Amount | Shares | Amount | |||||||||||||||||||||||
| Class R2 shares1 | ||||||||||||||||||||||||||
| Sold | 45,125 | $1,008,335 | — | — | ||||||||||||||||||||||
| Repurchased | (258 | ) | (5,725 | ) | — | — | ||||||||||||||||||||
| Net increase | 44,867 | $1,002,610 | — | — | ||||||||||||||||||||||
| Class R4 shares1 | ||||||||||||||||||||||||||
| Sold | 60,077 | $1,340,124 | — | — | ||||||||||||||||||||||
| Repurchased | (2,168 | ) | (45,983 | ) | — | — | ||||||||||||||||||||
| Net increase | 57,909 | $1,294,141 | — | — | ||||||||||||||||||||||
| Class R6 shares1 | ||||||||||||||||||||||||||
| Sold | 60,688 | $1,349,201 | — | — | ||||||||||||||||||||||
| Repurchased | (173 | ) | (3,629 | ) | — | — | ||||||||||||||||||||
| Net increase | 60,515 | $1,345,572 | — | — | ||||||||||||||||||||||
| Class 1 shares | ||||||||||||||||||||||||||
| Sold | 622,513 | $13,913,785 | 269,172 | $6,025,547 | ||||||||||||||||||||||
| Distributions reinvested | — | — | 137,367 | 2,711,616 | ||||||||||||||||||||||
| Repurchased | (62,810 | ) | (1,380,735 | ) | (142,058 | ) | (3,345,834 | ) | ||||||||||||||||||
| Net increase | 559,703 | $12,533,050 | 264,481 | $5,391,329 | ||||||||||||||||||||||
| Class NAV shares2 | ||||||||||||||||||||||||||
| Sold | 4,640,333 | $104,930,308 | — | — | ||||||||||||||||||||||
| Repurchased | (266,883 | ) | (5,858,104 | ) | — | — | ||||||||||||||||||||
| Net increase | 4,373,450 | $99,072,204 | — | — | ||||||||||||||||||||||
| Total net increase (decrease) | 41,544,606 | $924,211,408 | (2,952,305 | ) | ($88,615,950 | ) | ||||||||||||||||||||
1 The inception date for Class R2, Class R4 and Class R6 shares is 3-27-15.
2 The inception date for Class NAV shares is 6-2-15.
Affiliates of the fund owned 100% of shares of beneficial interest of Class 1 and Class NAV on August 31, 2015.
Note 6 — Purchase and sale of securities
Purchases and sales of securities, other than short-term investments, amounted to $1,007,236,779 and $344,426,245, respectively, for the six months ended August 31, 2015.
34
Continuation of Investment Advisory and Subadvisory Agreements
Evaluation of Advisory and Subadvisory Agreements by the Board of Trustees
This section describes the evaluation by the Board of Trustees (the Board) of John Hancock Funds III (the Trust) of the Advisory Agreement (the Advisory Agreement) with John Hancock Advisers, LLC (the Advisor) and the Subadvisory Agreement (the Subadvisory Agreement) with Wellington Management Company LLP (the Subadvisor), for John Hancock International Growth Fund (the fund). The Advisory Agreement and Subadvisory Agreement are collectively referred to as the Agreements. Prior to the June 23-25, 2015 meeting at which the Agreements were approved, the Board also discussed and considered information regarding the proposed continuation of the Agreements at an in-person meeting held on May 21-22, 2015.
Approval of Advisory and Subadvisory Agreements
At in-person meetings held on June 23-25, 2015, the Board, including the Trustees who are not considered to be interested persons of the Trust under the Investment Company Act of 1940, as amended (the 1940 Act) (the Independent Trustees), reapproved for an annual period the continuation of the Advisory Agreement between the Trust and the Advisor and the Subadvisory Agreement between the Advisor and the Subadvisor with respect to the fund.
In considering the Advisory Agreement and the Subadvisory Agreement, the Board received in advance of the meetings a variety of materials relating to the fund, the Advisor and the Subadvisor, including comparative performance, fee and expense information for a peer group of similar funds prepared by an independent third-party provider of mutual fund data, performance information for an applicable benchmark index; and, with respect to the Subadvisor, comparative performance information for comparably managed accounts, as applicable, and other information provided by the Advisor and the Subadvisor regarding the nature, extent and quality of services provided by the Advisor and the Subadvisor under their respective Agreements, as well as information regarding the Advisor's revenues and costs of providing services to the fund and any compensation paid to affiliates of the Advisor. At the meetings at which the renewal of the Advisory Agreement and Subadvisory Agreement are considered, particular focus is given to information concerning fund performance, comparability of fees and total expenses, and profitability. However, the Board notes that the evaluation process with respect to the Advisor and the Subadvisor is an ongoing one. In this regard, the Board also took into account discussions with management and information provided to the Board at prior meetings with respect to the services provided by the Advisor and the Subadvisor to the fund, including quarterly performance reports prepared by management containing reviews of investment results and prior presentations from the Subadvisor with respect to the fund. The Board also considered the nature, quality, and extent of non-advisory services, if any, to be provided to the fund by the Advisor's affiliates, including distribution services.
Throughout the process, the Board asked questions of and requested additional information from management. The Board is assisted by counsel for the Trust and the Independent Trustees are also separately assisted by independent legal counsel throughout the process. The Independent Trustees also received a memorandum from their independent legal counsel discussing the legal standards for their consideration of the proposed continuation of the Agreements and discussed the proposed continuation of the Agreements in private sessions with their independent legal counsel at which no representatives of management were present.
Approval of Advisory Agreement
In approving the Advisory Agreement with respect to the fund, the Board, including the Independent Trustees, considered a variety of factors, including those discussed below. The Board also considered other factors (including conditions and trends prevailing generally in the economy, the securities markets, and the industry) and does not treat any single factor as determinative, and each Trustee may attribute different weights to different factors. The Board's conclusions may be based in part on its consideration of the advisory and subadvisory arrangements in prior years and on the Board's ongoing regular review of fund performance and operations throughout the year.
35
Nature, extent, and quality of services. Among the information received by the Board from the Advisor relating to the nature, extent, and quality of services provided to the fund, the Board reviewed information provided by the Advisor relating to its operations and personnel, descriptions of its organizational and management structure, and information regarding the Advisor's compliance and regulatory history, including its Form ADV. The Board also noted that on a regular basis it receives and reviews information from the Trust's Chief Compliance Officer (CCO) regarding the fund's compliance policies and procedures established pursuant to Rule 38a-1 under the 1940 Act. The Board also considered the Advisor's risk management processes. The Board considered that the Advisor is responsible for the management of the day-to-day operations of the fund, including, but not limited to, general supervision of and coordination of the services provided by the Subadvisor, and is also responsible for monitoring and reviewing the activities of the Subadvisor and other third-party service providers.
In considering the nature, extent, and quality of the services provided by the Advisor, the Trustees also took into account their knowledge of the Advisor's management and the quality of the performance of the Advisor's duties, through Board meetings, discussions and reports during the preceding year and through each Trustee's experience as a Trustee of the Trust and of the other trusts in the John Hancock group of funds complex (the John Hancock Fund Complex).
In the course of their deliberations regarding the Advisory Agreement, the Board considered, among other things:
| (a) | the skills and competency with which the Advisor has in the past managed the Trust's affairs and its subadvisory relationship, the Advisor's oversight and monitoring of the Subadvisor's investment performance and compliance programs, such as the Subadvisor's compliance with fund policies and objectives, review of brokerage matters, including with respect to trade allocation and best execution and the Advisor's timeliness in responding to performance issues; | |
| (b) | the background, qualifications and skills of the Advisor's personnel; | |
| (c) | the Advisor's compliance policies and procedures and its responsiveness to regulatory changes and mutual fund industry developments; | |
| (d) | the Advisor's administrative capabilities, including its ability to supervise the other service providers for the fund; | |
| (e) | the financial condition of the Advisor and whether it has the financial wherewithal to provide a high level and quality of services to the fund; and | |
| (f) | the Advisor's reputation and experience in serving as an investment advisor to the Trust and the benefit to shareholders of investing in funds that are part of a family of funds offering a variety of investments. |
The Board concluded that the Advisor may reasonably be expected to continue to provide a high quality of services under the Advisory Agreement with respect to the fund.
Investment performance. In considering the fund's performance, the Board noted that it reviews at its regularly scheduled meetings information about the fund's performance results. In connection with the consideration of the Advisory Agreement, the Board:
| (a) | reviewed information prepared by management regarding the fund's performance; | |
| (b) | considered the comparative performance of an applicable benchmark index; | |
| (c) | considered the performance of comparable funds, if any, as included in the report prepared by an independent third-party provider of fund data; and | |
| (d) | took into account the Advisor's analysis of the fund's performance and its plans and recommendations regarding the Trust's subadvisory arrangements generally. |
The Board noted that the fund outperformed its benchmark index and its peer group average for the one-, three- and five-year periods ended December 31, 2014. The Board also noted that the fund's favorable performance relative to the
36
benchmark index and peer group for the one-, three- and five-year periods. The Board concluded that the fund's performance has generally been in line with or outperformed the historical performance of comparable funds and the fund's benchmark index.
Fees and expenses. The Board reviewed comparative information prepared by an independent third-party provider of mutual fund data, including, among other data, the fund's contractual and net management fees (and subadvisory fees, to the extent available) and total expenses as compared to similarly situated investment companies deemed to be comparable to the fund. The Board considered the fund's ranking within a smaller group of peer funds chosen by the independent third-party provider, as well as the fund's ranking within a broader group of funds. In comparing the fund's contractual and net management fees to those of comparable funds, the Board noted that such fees include both advisory and administrative costs. The Board noted that net management fees and total expenses for the fund are higher than the peer group median.
The Board took into account management's discussion of the fund's expenses, including action taken that will further reduce certain fund expenses. The Board also took into account management's discussion with respect to the advisory/subadvisory fee structure, including the amount of the advisory fee retained by the Advisor after payment of the subadvisory fee. The Board also noted that the Advisor pays the subadvisory fee, and that such fees are negotiated at arm's length with respect to the Subadvisor. In addition, the Board took into account that management had agreed to implement an overall fee waiver across the complex, including the fund, which is discussed further below. The Board also noted actions taken over the past several years to reduce the fund's operating expenses. The Board also noted that, in addition, the Advisor is currently waiving fees and/or reimbursing expenses with respect to the fund and that the fund has breakpoints in its contractual management fee schedule that reduces management fees as assets increase. The Board reviewed information provided by the Advisor concerning the investment advisory fee charged by the Advisor or one of its advisory affiliates to other clients (including other funds in the John Hancock Fund Complex) having similar investment mandates, if any. The Board considered any differences between the Advisor's and Subadvisor's services to the fund and the services they provide to other comparable clients or funds. The Board concluded that the advisory fee paid with respect to the fund is reasonable.
Profitability/indirect benefits. In considering the costs of the services to be provided and the profits to be realized by the Advisor and its affiliates from the Advisor's relationship with the Trust, the Board:
| (a) | reviewed financial information of the Advisor; | |||||||
| (b) | reviewed and considered information presented by the Advisor regarding the net profitability to the Advisor and its affiliates with respect to the fund; | |||||||
| (c) | received and reviewed profitability information with respect to the John Hancock Fund Complex as a whole; | |||||||
| (d) | received information with respect to the Advisor's allocation methodologies used in preparing the profitability data; | |||||||
| (e) | considered that the John Hancock insurance companies that are affiliates of the Advisor, as shareholders of the Trust directly or through their separate accounts, receive certain tax credits or deductions relating to foreign taxes paid and dividends received by certain funds of the Trust and noted that these tax benefits, which are not available to participants in qualified retirement plans under applicable income tax law, are reflected in the profitability information reviewed by the Board; | |||||||
| (f) | considered that the Advisor also provides administrative services to the fund on a cost basis pursuant to an administrative services agreement; | |||||||
| (g) | noted that affiliates of the Advisor provide transfer agency services and distribution services to the fund, and that the fund's distributor also receives Rule 12b-1 payments to support distribution of the fund; | |||||||
| (h) | noted that the Advisor also derives reputational and other indirect benefits from providing advisory services to the fund; | |||||||
| (i) | noted that the subadvisory fee for the fund is paid by the Advisor and is negotiated at arm's length; and |
37
| (j) | considered that the Advisor should be entitled to earn a reasonable level of profits in exchange for the level of services it provides to the fund and the entrepreneurial risk that it assumes as Advisor. |
Based upon its review, the Board concluded that the level of profitability, if any, of the Advisor and its affiliates from their relationship with the fund was reasonable and not excessive.
Economies of scale. In considering the extent to which economies of scale would be realized as the fund grows and whether fee levels reflect these economies of scale for the benefit of fund shareholders, the Board:
| (a) | considered that the Advisor has contractually agreed to waive a portion of its management fee for certain funds of the John Hancock Fund Complex, including the fund (the participating portfolios) or otherwise reimburse the expenses of the participating portfolios (the reimbursement). This waiver is based upon aggregate net assets of all the participating portfolios. The amount of the reimbursement is calculated daily and allocated among all the participating portfolios in proportion to the daily net assets of each fund; | |
| (b) | reviewed the fund's advisory fee structure and concluded that: (i) the fund's fee structure contains breakpoints at the subadvisory fee level and that such breakpoints are reflected as breakpoints in the advisory fees for the fund; and (ii) although economies of scale cannot be measured with precision, these arrangements permit shareholders of the fund to benefit from economies of scale if the fund grows. The Board also took into account management's discussion of the fund's advisory fee structure; and | |
| (c) | the Board also considered the effect of the fund's growth in size on its performance and fees. The Board also noted that if the fund's assets increase over time, the fund may realize other economies of scale. |
Approval of Subadvisory Agreement
In making its determination with respect to approval of the Subadvisory Agreement, the Board reviewed:
| (1) | information relating to the Subadvisor's business, including current subadvisory services to the Trust (and other funds in the John Hancock Fund Complex); | |
| (2) | the historical and current performance of the fund and comparative performance information relating to an applicable benchmark index and comparable funds; | |
| (3) | the subadvisory fee for the fund, including any breakpoints, and to the extent available, comparable fee information prepared by an independent third party provider of fund data; and | |
| (4) | information relating to the nature and scope of any material relationships and their significance to the Trust's Advisor and Subadvisor. |
Nature, extent, and quality of services. With respect to the services provided by the Subadvisor, the Board received information provided to the Board by the Subadvisor, including the Subadvisor's Form ADV, as well as took into account information presented throughout the past year. The Board considered the Subadvisor's current level of staffing and its overall resources, as well as received information relating to the Subadvisor's compensation program. The Board reviewed the Subadvisor's history and investment experience, as well as information regarding the qualifications, background, and responsibilities of the Subadvisor's investment and compliance personnel who provide services to the fund. The Board also considered, among other things, the Subadvisor's compliance program and any disciplinary history. The Board also considered the Subadvisor's risk assessment and monitoring process. The Board reviewed the Subadvisor's regulatory history, including whether it was involved in any regulatory actions or investigations as well as material litigation, and any settlements and amelioratory actions undertaken, as appropriate. The Board noted that the Advisor conducts regular, periodic reviews of the Subadvisor and its operations, including regarding investment processes and organizational and staffing matters. The Board also noted that the Trust's CCO and his staff conduct regular, periodic compliance reviews with the Subadvisor and present reports to the Independent Trustees regarding the same, which includes evaluating the
38
regulatory compliance systems of the Subadvisor and procedures reasonably designed to assure compliance with the federal securities laws. The Board also took into account the financial condition of the Subadvisor.
The Board considered the Subadvisor's investment process and philosophy. The Board took into account that the Subadvisor's responsibilities include the development and maintenance of an investment program for the fund that is consistent with the fund's investment objective, the selection of investment securities and the placement of orders for the purchase and sale of such securities, as well as the implementation of compliance controls related to performance of these services. The Board also received information with respect to the Subadvisor's brokerage policies and practices, including with respect to best execution and soft dollars.
Subadvisor compensation. In considering the cost of services to be provided by the Subadvisor and the profitability to the Subadvisor of its relationship with the fund, the Board noted that the fees under the Subadvisory Agreement are paid by the Advisor and not the fund.
The Board also relied on the ability of the Advisor to negotiate the Subadvisory Agreement with the Subadvisor, which is not affiliated with the Advisor, and the fees thereunder at arm's length. As a result, the costs of the services to be provided and the profits to be realized by the Subadvisor from its relationship with the Trust were not a material factor in the Board's consideration of the Subadvisory Agreement.
The Board also received information regarding the nature and scope (including their significance to the Advisor and its affiliates and to the Subadvisor) of any material relationships with respect to the Subadvisor, which include arrangements in which the Subadvisor or its affiliates provide advisory, distribution, or management services in connection with financial products sponsored by the Advisor or its affiliates, and may include other registered investment companies, a 529 education savings plan, managed separate accounts and exempt group annuity contracts sold to qualified plans. The Board also received information and took into account any other potential conflicts of interest the Advisor might have in connection with the Subadvisory Agreement.
In addition, the Board considered other potential indirect benefits that the Subadvisor and its affiliates may receive from the Subadvisor's relationship with the fund, such as the opportunity to provide advisory services to additional funds in the John Hancock Fund Complex and reputational benefits.
Subadvisory fees. The Board considered that the fund pays an advisory fee to the Advisor and that, in turn, the Advisor pays a subadvisory fee to the Subadvisor. As noted above, the Board also considered the fund's subadvisory fees as compared to similarly situated investment companies deemed to be comparable to the fund as included in the report prepared by the independent third party provider of fund data, to the extent available. The Board noted that the limited size of the Lipper peer group was not sufficient for comparative purposes. The Board also took into account the subadvisory fees paid by the Advisor to the Subadvisor with respect to the fund and compared them to fees charged by the Subadvisor to manage other subadvised portfolios and portfolios not subject to regulation under the 1940 Act, as applicable.
Subadvisor performance. As noted above, the Board considered the fund's performance as compared to the fund's peer group and the benchmark index and noted that the Board reviews information about the fund's performance results at its regularly scheduled meetings. The Board noted the Advisor's expertise and resources in monitoring the performance, investment style and risk-adjusted performance of the Subadvisor. The Board was mindful of the Advisor's focus on the Subadvisor's performance. The Board also noted the Subadvisor's long-term performance record for similar accounts, as applicable.
The Board's decision to approve the Subadvisory Agreement was based on a number of determinations, including the following:
| (1) | the Subadvisor has extensive experience and demonstrated skills as a manager; | |||||||
| (2) | the performance of the fund has generally been in line with or outperformed the historical performance of comparable funds and the fund's benchmark index; |
39
| (3) | the subadvisory fee is reasonable in relation to the level and quality of services being provided; and | |||||||
| (4) | noted that the subadvisory fees are paid by the Advisor not the fund and that the subadvisory fee breakpoints are reflected as breakpoints in the advisory fees for the fund in order to permit shareholders to benefit from economies of scale if the fund grows. | |||||||
| * * * | ||||||||
Based on the Board's evaluation of all factors that the Board deemed to be material, including those factors described above, the Board, including the Independent Trustees, concluded that renewal of the Advisory Agreement and the Subadvisory Agreement would be in the best interest of the fund and its shareholders. Accordingly, the Board, and the Independent Trustees voting separately, approved the Advisory Agreement and Subadvisory Agreement for an additional one-year period.
40
Trustees James M. Oates, Chairperson Officers Andrew G. Arnott John J. Danello Francis V. Knox, Jr. Charles A. Rizzo Salvatore Schiavone | Investment advisor John Hancock Advisers, LLC Subadvisor Wellington Management Company LLP Principal distributor John Hancock Funds, LLC Custodian Citibank. N.A. Transfer agent John Hancock Signature Services, Inc. Legal counsel K&L Gates LLP |
*Member of the Audit Committee
†Non-Independent Trustee
#Effective 3-10-15
The fund's proxy voting policies and procedures, as well as the fund proxy voting record for the most recent twelve-month period ended June 30, are available free of charge on the Securities and Exchange Commission (SEC) website at sec.gov or on our website.
The fund's complete list of portfolio holdings, for the first and third fiscal quarters, is filed with the SEC on Form N-Q. The fund's Form N-Q is available on our website and the SEC's website, sec.gov, and can be reviewed and copied (for a fee) at the SEC's Public Reference Room in Washington, DC. Call 800-SEC-0330 to receive information on the operation of the SEC's Public Reference Room.
We make this information on your fund, as well as monthly portfolio holdings, and other fund details available on our website at jhinvestments.com or by calling 800-225-5291.
| You can also contact us: | |||
| 800-225-5291 jhinvestments.com | Regular mail: John Hancock Signature Services, Inc. | Express mail: John Hancock Signature Services, Inc. | |
41
Family of funds
DOMESTIC EQUITY FUNDS Balanced Blue Chip Growth Classic Value Disciplined Value Disciplined Value Mid Cap Equity Income Fundamental All Cap Core Fundamental Large Cap Core Fundamental Large Cap Value Large Cap Equity New Opportunities Select Growth Small Cap Equity Small Cap Value Small Company Strategic Growth U.S. Equity U.S. Global Leaders Growth Value Equity GLOBAL AND INTERNATIONAL EQUITY FUNDS Disciplined Value International Emerging Markets Emerging Markets Equity Global Equity Global Shareholder Yield Greater China Opportunities International Core International Growth International Small Company International Value Equity INCOME FUNDS Bond California Tax-Free Income Core High Yield Emerging Markets Debt Floating Rate Income Focused High Yield Global Income Government Income High Yield Municipal Bond Income | INCOME FUNDS (continued) Investment Grade Bond Money Market Short Duration Credit Opportunities Spectrum Income Strategic Income Opportunities Tax-Free Bond ALTERNATIVE AND SPECIALTY FUNDS Absolute Return Currency Alternative Asset Allocation Enduring Equity Financial Industries Global Absolute Return Strategies Global Conservative Absolute Return Natural Resources Redwood Regional Bank Seaport Technical Opportunities ASSET ALLOCATION Income Allocation Fund Lifestyle Aggressive Portfolio Lifestyle Balanced Portfolio Lifestyle Conservative Portfolio Lifestyle Growth Portfolio Lifestyle Moderate Portfolio Retirement Choices Portfolios (2010-2055) Retirement Living Portfolios (2010-2055) Retirement Living II Portfolios (2010-2055) CLOSED-END FUNDS Financial Opportunities Hedged Equity & Income Income Securities Trust Investors Trust Preferred Income Preferred Income II Preferred Income III Premium Dividend Tax-Advantaged Dividend Income Tax-Advantaged Global Shareholder Yield |
The fund's investment objectives, risks, charges, and expenses are included in the prospectus and should be considered carefully before investing. For a prospectus, contact your financial professional, call John Hancock Investments at 800-225-5291, or visit the fund's website at jhinvestments.com. Please read the prospectus carefully before investing or sending money.
John Hancock Investments
A trusted brand
John Hancock Investments is a premier asset manager representing
one of America's most trusted brands, with a heritage of financial
stewardship dating back to 1862. Helping our shareholders pursue
their financial goals is at the core of everything we do. It's why we
support the role of professional financial advice and operate with the
highest standards of conduct and integrity.
A better way to invest
We build funds based on investor needs, then search the world to find
proven portfolio teams with specialized expertise in those strategies.
As a manager of managers, we apply vigorous oversight to ensure that
they continue to meet our uncompromising standards and serve the
best interests of our shareholders.
Results for investors
Our unique approach to asset management enables us to provide
a diverse set of investments backed by some of the world's best
managers, along with strong risk-adjusted returns across asset classes.
| | John Hancock Funds, LLC n Member FINRA, SIPC 601 Congress Street n Boston, MA 02210-2805 800-225-5291 n jhinvestments.com | |
| This report is for the information of the shareholders of John Hancock International Growth Fund. It is not authorized for distribution to prospective investors unless preceded or accompanied by a prospectus. | ||
| MF250813 | 87SA 8/15 10/15 | |
John Hancock
Global Shareholder Yield Fund
Semiannual report 8/31/15
A message to shareholders
Dear shareholder,
The global financial markets were especially rocky in mid-2015. The pullback we had anticipated for some months took place in August, and U.S. equities experienced their first official correction—a decline of more than 10% in the stock market—in more than four years. Fixed-income securities fared better than stocks but remain roughly flat for the year to date. There were several headwinds restraining stock prices from moving higher all year, but the trigger for this summer's correction was the news of slowing economic growth in China and the effect that might have on global growth. For the time being, global economic data continues to be a leading driver of markets worldwide.
The asset managers in our network believe, on balance, that investors should stay the course when it comes to U.S. equities. Our economy continues to grow at a healthy pace, driven by strong housing and jobs data, falling commodity prices, solid consumer spending, and low inflation. While the U.S. Federal Reserve (Fed) chose to leave the federal funds rate unchanged at its September meeting, Fed Chair Janet Yellen cited a number of positives in the U.S. economy and signaled that the Fed will likely raise interest rates soon in response to stronger growth. Although market movements are unpredictable, this summer's correction may prove to be not much more than a necessary breather before the market resumes its upward trend.
Introducing John Hancock Multifactor Exchange-Traded Funds (ETFs)
We believe investors benefit from a combination of active and passive strategies in their portfolios. That's why, for years, we've offered actively managed funds to our shareholders, alongside asset allocation portfolios that employ a mix of active and passive strategies. That same thinking is what led us to team up with Dimensional Fund Advisors—a company regarded as one of the pioneers in strategic beta investing—for the launch of the passively managed John Hancock Multifactor ETFs.* Each ETF seeks to track a custom index built upon decades of academic research into the factors that drive higher expected returns: smaller capitalizations, lower valuations, and higher profitability. For nearly 30 years, it's just the kind of time-tested approach we have looked for as a manager of managers. For more information, visit our website at jhinvestments.com/etf.
On behalf of everyone at John Hancock Investments, I'd like to take this opportunity to welcome new shareholders and thank existing shareholders for the continued trust you've placed in us.
Sincerely,
Andrew G. Arnott
President and Chief Executive Officer
John Hancock Investments
This commentary reflects the CEO's views as of August 31, 2015. They are subject to change at any time. For more up-to-date information, you can visit our website at jhinvestments.com.
| * | Strategic beta investing EFTs seek to improve upon cap-weighted strategies by tracking a custom index that combines active management insight with the discipline of a rules-based approach. |
John Hancock
Global Shareholder Yield Fund
1
INVESTMENT OBJECTIVE
The fund seeks to provide a high level of income as its primary objective. Capital appreciation is a secondary investment objective.
AVERAGE ANNUAL TOTAL RETURNS AS OF 8/31/15 (%)
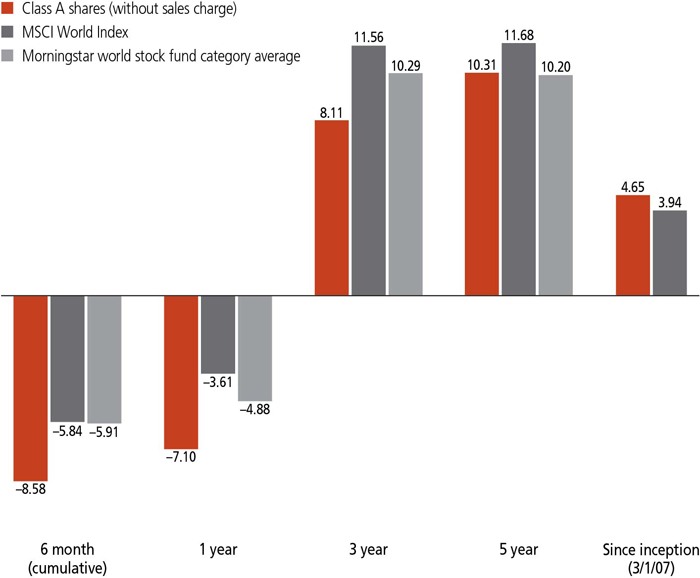
The MSCI World Index (gross of foreign withholding tax on dividends) is a free float-adjusted market capitalization weighted index that is designed to measure the equity market performance of developed markets.
It is not possible to invest directly in an index. Index figures do not reflect expenses or sales charges, which would result in lower returns.
Figures from Morningstar, Inc. include reinvested distributions and do not take into account sales charges. Actual load-adjusted performance is lower.
The past performance shown here reflects reinvested distributions and the beneficial effect of any expense reductions, and does not guarantee future results. Returns for periods shorter than one year are cumulative, and results for other share classes will vary. Shares will fluctuate in value and, when redeemed, may be worth more or less than their original cost. Current performance may be lower or higher than the performance cited, and can be found at jhinvestments.com or by calling 800-225-5291. For further information on the fund's objectives, risks, and strategy, see the fund's prospectuses.
2
PERFORMANCE HIGHLIGHTS OVER THE LAST SIX MONTHS
Global stocks fell
Global equity indexes generally declined for the period amid heightened volatility driven by slowing economic growth in China.
The fund declined
The fund declined in value and trailed the performance of its benchmark, the MSCI World Index.
Financials detracted
The fund's holdings in the financials sector detracted the most from performance.
SECTOR COMPOSITION AS OF 8/31/15 (%)
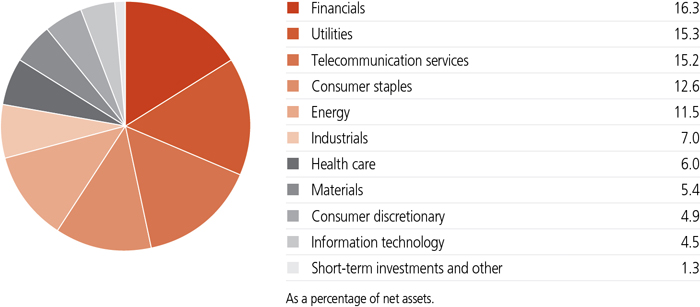
A note about risks
Foreign investing, especially in emerging markets, has additional risks, such as currency and market volatility and political and social instability, and illiquid securities may be difficult to sell at a price approximating their value. The value of a company's equity securities is subject to changes in the company's financial condition and overall market and economic conditions. Actively trading securities can increase transaction costs (thus lowering performance) and taxable distributions. Hedging, derivatives, and other strategic transactions may increase volatility and result in losses if not successful. Fund distributions generally depend on income from underlying investments and may vary or cease altogether in the future. Please see the fund's prospectuses for additional risks.
3

Eric L. Sappenfield
Portfolio Manager
Epoch
Can you describe the market environment over the past six months?
Global stocks were generally lower for the six-month period as equity markets worldwide grew increasingly volatile. Although geopolitical turmoil in the Middle East and uncertainty surrounding a possible interest-rate hike by the U.S. Federal Reserve were contributing factors, the primary cause of the global market volatility was China. Signs of slowing growth in the world's second-largest economy led to reduced demand for commodities, hurting the economies of countries dependent on commodity exports, as well as China's regional trading partners. A sharp decline in China's equity market—despite the government's substantial efforts to prevent it—and a devaluation of the Chinese yuan late in the period also unsettled global equity markets.
From a regional perspective, most developed markets posted similar returns for the six-month period, with the United States holding up slightly better than the Europe and Asia/Pacific regions. Emerging markets faced considerably larger declines as many emerging economies were hit hardest by the slowdown in China.
Turning to the portfolio, how would you characterize the fund's performance during the six-month period?
The fund declined in value despite capturing cash dividends, share buybacks, and debt reduction through a diversified portfolio of companies that continued to grow free cash flow. We seek out companies that generate strong free cash flow and allocate those cash flows in a way that creates shareholder value. Given our focus on shareholder yield, we are particularly interested in companies that commit to returning a meaningful portion of their cash flows to shareholders, such as paying out dividends, buying back stock, or paying down debt.
Although investor demand for yield remained robust during the period, selected portfolio holdings with high dividend yields underperformed, contributing to the fund's negative overall return. Nonetheless, our risk management process limited the influence of any single stock on the overall level of shareholder yield.
4
Can you give some examples of stocks that detracted from fund performance?
Fund holdings in the financials sector detracted the most from performance, most notably two real estate investment trusts (REITs)—private prison operator Corrections Corp. of America and healthcare facilities owner Health Care REIT, Inc. Corrections Corp., the largest owner of privatized correctional and detention facilities in the United States, lowered its full-year earnings guidance because of a decline in the California inmate population as the state moved forward with a plan to reduce prison overcrowding. Despite posting solid overall earnings, Health Care REIT underperformed primarily due to concerns about rising interest rates. Nonetheless, both companies continued to reward their shareholders with attractive and growing dividends.
Other detractors included telecommunication services provider CenturyLink, Inc., fertilizer producer Potash Corp. of Saskatchewan, Inc., and energy company Kinder Morgan, Inc. CenturyLink lowered its earnings outlook for 2015 amid weaker wholesale revenues, Potash faced declining fertilizer prices and an uncertain acquisition, and Kinder Morgan came under pressure from weaker demand for energy.
Let's shift gears and talk about some positive contributors. What holdings aided fund performance during the reporting period?
The fund's holdings in the tobacco industry performed well over the last six months thanks to industry consolidation. Reynolds American, Inc., the fund's leading contributor for the six-month period, acquired Lorillard, Inc. (another fund holding that we tendered in the acquisition) in June
TOP 10 HOLDINGS AS OF 8/31/15 (%)
| Philip Morris International, Inc. | 2.1 |
| National Grid PLC | 1.9 |
| Kinder Morgan, Inc. | 1.9 |
| AT&T, Inc. | 1.9 |
| Vodafone Group PLC | 1.9 |
| Verizon Communications, Inc. | 1.8 |
| BCE, Inc. | 1.8 |
| Potash Corp. of Saskatchewan, Inc. | 1.6 |
| Health Care REIT, Inc. | 1.6 |
| Muenchener Rueckversicherungs AG | 1.6 |
| TOTAL | 18.1 |
| As a percentage of net assets. | |
| Cash and cash equivalents are not included. | |
5
Stock selection in the utilities sector, the fund's largest sector weighting on average during the six-month period, also added value. The top contributor in this sector was TECO Energy, Inc., a Florida-based electric utility. TECO continued to generate solid cash flow growth, and the stock rallied as the company indicated it was exploring the possibility of a sale. Shortly after the end of the period, TECO agreed to be acquired by Canadian utility Emera Inc.
Other notable contributors to fund performance included U.S. biotechnology firm AbbVie, Inc., French infrastructure contractor Vinci SA, and French financial services provider SCOR SE. We eliminated AbbVie from the portfolio prior to the end of the period.
What changes did you make to the portfolio over the past six months?
Given the heightened market volatility over the last six months, portfolio turnover was higher than the fund's historical average as we took advantage of opportunities to improve the fund's shareholder yield. During the reporting period, we closed out positions in 14 companies and added 14 new stocks to the portfolio.
TOP 10 COUNTRIES AS OF 8/31/15 (%)
| United States | 46.0 |
| United Kingdom | 15.4 |
| France | 8.2 |
| Canada | 6.5 |
| Germany | 6.3 |
| Australia | 4.0 |
| Norway | 2.9 |
| Switzerland | 2.8 |
| Italy | 1.5 |
| Netherlands | 1.4 |
| TOTAL | 95.0 |
| As a percentage of net assets. | |
| Cash and cash equivalents are not included. |
6
In addition to AbbVie, we sold U.K. water utility United Utilities Group PLC, Swiss pharmaceutical firm Novartis AG, U.S. chemicals producer E.I. du Pont de Nemours & Company, Dutch publishing company Wolters Kluwer NV, and U.S. consumer electronics maker Apple, Inc.
Among new holdings in the portfolio were U.S. document services company Iron Mountain, Inc., U.S. power producer Entergy Corp., U.S. energy company Exxon Mobil Corp., British construction and engineering firm Amec Foster Wheeler PLC, and Canadian telecommunication services provider TELUS Corp.
How was the fund positioned at the end of the period?
We remain focused on pursuing companies that provide superior shareholder value by growing cash flows and returning them to shareholders in the form of dividends, share buybacks, and debt reduction. The fund's sector weightings are driven entirely by individual stock selection and our investment decision-making process. That said, the largest sector weightings in the portfolio at the end of the period were financials, utilities, and telecommunication services. In contrast, the information technology and consumer discretionary sectors represented the smallest weightings in the portfolio.
The recent increase in equity market volatility presents both challenges and opportunities. We believe the best opportunities are found in companies generating strong free cash flow and possessing management teams with a history of wise capital allocation and shareholder value creation.
MANAGED BY
| | Eric L. Sappenfield On the fund since inception Investing since 1986 |
 | William W. Priest, CFA, CPA On the fund since inception Investing since 1965 |
 | John Tobin, Ph.D., CFA On the fund since 2014 Investing since 1981 |
 | Kera Van Valen, CFA On the fund since 2014 Investing since 2001 |
 | Michael A. Welhoelter, CFA On the fund since inception Investing since 1986 |
![]()
7
TOTAL RETURNS FOR THE PERIOD ENDED AUGUST 31, 2015
| Average annual total returns (%) with maximum sales charge | Cumulative total returns (%) with maximum sales charge | SEC 30-day yield (%) subsidized | SEC 30-day yield (%) unsubsidized1 | ||||||||||||||||||||||||||||||||
| 1-year | 5-year | Since inception | 6-month | 5-year | Since inception | as of 8-31-15 | as of 8-31-15 | ||||||||||||||||||||||||||||
| Class A | -11.77 | 9.18 | 4.01 | 2 | -13.15 | 55.13 | 39.72 | 2 | 2.43 | 2.43 | |||||||||||||||||||||||||
| Class B | -12.15 | 9.23 | 3.89 | 2 | -13.52 | 55.52 | 38.34 | 2 | 1.82 | 1.81 | |||||||||||||||||||||||||
| Class C | -8.63 | 9.56 | 3.92 | 2 | -9.88 | 57.86 | 38.63 | 2 | 1.81 | 1.81 | |||||||||||||||||||||||||
| Class I3 | -6.86 | 10.72 | 5.08 | 2 | -8.57 | 66.41 | 52.38 | 2 | 2.90 | 2.89 | |||||||||||||||||||||||||
| Class R23,4 | -7.22 | 9.78 | 3.73 | 2 | -8.71 | 59.43 | 36.56 | 2 | 2.36 | 2.35 | |||||||||||||||||||||||||
| Class R63,4 | -6.74 | 10.79 | 5.08 | 2 | -8.45 | 66.91 | 52.45 | 2 | 3.00 | 2.98 | |||||||||||||||||||||||||
| Class NAV3 | -6.74 | 10.85 | 5.89 | 5 | -8.44 | 67.37 | 52.22 | 5 | 3.02 | 3.01 | |||||||||||||||||||||||||
| Index† | -3.61 | 11.68 | 3.94 | 2 | -5.84 | 73.75 | 38.93 | 2 | — | — | |||||||||||||||||||||||||
Performance figures assume all distributions have been reinvested. Figures reflect maximum sales charges on Class A shares of 5%, and the applicable contingent deferred sales charge (CDSC) on Class B and Class C shares. The Class B shares' CDSC declines annually between years 1 to 6 according to the following schedule: 5%, 4%, 3%, 3%, 2%, and 1%. No sales charge will be assessed after the sixth year. Class C shares sold within one year of purchase are subject to a 1% CDSC. Sales charges are not applicable to Class I, Class R2, Class R6, and Class NAV shares.
The expense ratios of the fund, both net (including any fee waivers and/or expense limitations) and gross (excluding any fee waivers and/or expense limitations), are set forth according to the most recent publicly available prospectuses for the fund and may differ from those disclosed in the Financial highlights tables in this report. Had the fee waivers and expense limitations not been in place, gross expenses would apply. The expense ratios are as follows:
| Class A | Class B | Class C | Class I | Class R2 | Class R6 | Class NAV | |
| Gross (%) | 1.28 | 1.98 | 1.98 | 0.97 | 1.38 | 0.87 | 0.85 |
| Net (%) | 1.28 | 1.98 | 1.98 | 0.97 | 1.38 | 0.85 | 0.85 |
Please refer to the most recent prospectus and annual or semiannual report for more information on expenses and any expense limitation arrangements for each class.
The returns reflect past results and should not be considered indicative of future performance. The return and principal value of an investment will fluctuate so that shares, when redeemed, may be worth more or less than their original cost. Due to market volatility and other factors, the fund's current performance may be higher or lower than the performance shown. For current to the most recent month-end performance data, please call 800-225-5291 or visit the fund's website at jhinvestments.com.
The performance table above and the chart on the next page do not reflect the deduction of taxes that a shareholder would pay on fund distributions or the redemption of fund shares. The fund's performance results reflect any applicable fee waivers or expense reductions, without which the expenses would increase and results would have been less favorable.
| † | Index is the MSCI World Index. |
See the following page for footnotes.
8
This chart and table show what happened to a hypothetical $10,000 investment in John Hancock Global Shareholder Yield Fund for the share classes and periods indicated, assuming all distributions were reinvested. For comparison, we've shown the same investment in the MSCI World Index.
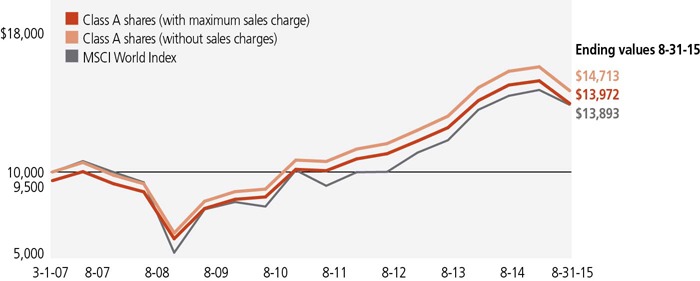
| Start date | With maximum sales charge ($) | Without sales charge ($) | Index ($) | |
| Class B6 | 3-1-07 | 13,834 | 13,834 | 13,893 |
| Class C6 | 3-1-07 | 13,863 | 13,863 | 13,893 |
| Class I3 | 3-1-07 | 15,238 | 15,238 | 13,893 |
| Class R23,4 | 3-1-07 | 13,656 | 13,656 | 13,893 |
| Class R63,4 | 3-1-07 | 15,245 | 15,245 | 13,893 |
| Class NAV3 | 4-28-08 | 15,222 | 15,222 | 13,239 |
The MSCI World Index (gross of foreign withholding tax on dividends) is a free float-adjusted market capitalization weighted index that is designed to measure the equity market performance of developed markets.
It is not possible to invest directly in an index. Index figures do not reflect expenses or sales charges, which would result in lower returns.
Footnotes related to performance pages
| 1 | Unsubsidized yields reflect what the yield would have been without the effect of reimbursements and waivers. |
| 2 | From 3-1-07. |
| 3 | For certain types of investors, as described in the fund's prospectuses. |
| 4 | Class R6 and Class R2 shares were first offered 9-1-11 and 3-1-12, respectively. The returns prior to these dates are those of Class A shares that have been recalculated to apply the gross fees and expenses of Class R6 and Class R2 shares, as applicable. |
| 5 | From 4-28-08. |
| 6 | The contingent deferred sales charge is not applicable. |
9
These examples are intended to help you understand your ongoing operating expenses of investing in the fund so you can compare these costs with the ongoing costs of investing in other mutual funds.
Understanding fund expenses
As a shareholder of the fund, you incur two types of costs:
| • | Transaction costs, which include sales charges (loads) on purchases or redemptions (varies by share class), minimum account fee charge, etc. |
| • | Ongoing operating expenses, including management fees, distribution and service fees (if applicable), and other fund expenses. |
We are presenting only your ongoing operating expenses here.
Actual expenses/actual returns
This example is intended to provide information about the fund's actual ongoing operating expenses, and is based on the fund's actual return. It assumes an account value of $1,000.00 on March 1, 2015, with the same investment held until August 31, 2015.
| Beginning Account value on 3-1-2015 | Ending value on 8-31-2015 | Expenses paid during period ended 8-31-20151 | Annualized expense ratio | |
| Class A | $1,000.00 | $914.20 | $6.17 | 1.28% |
| Class B | 1,000.00 | 909.80 | 9.80 | 2.04% |
| Class C | 1,000.00 | 910.20 | 9.52 | 1.98% |
| Class I | 1,000.00 | 914.30 | 4.63 | 0.96% |
| Class R2 | 1,000.00 | 912.90 | 7.08 | 1.47% |
| Class R6 | 1,000.00 | 915.50 | 4.05 | 0.84% |
| Class NAV | 1,000.00 | 915.60 | 4.05 | 0.84% |
Together with the value of your account, you may use this information to estimate the operating expenses that you paid over the period. Simply divide your account value at August 31, 2015, by $1,000.00, then multiply it by the "expenses paid" for your share class from the table above. For example, for an account value of $8,600.00, the operating expenses should be calculated as follows:
10
Hypothetical example for comparison purposes
This table allows you to compare the fund's ongoing operating expenses with those of any other fund. It provides an example of the fund's hypothetical account values and hypothetical expenses based on each class's actual expense ratio and an assumed 5% annualized return before expenses (which is not the fund's actual return). It assumes an account value of $1,000.00 on March 1, 2015, with the same investment held until August 31, 2015. Look in any other fund shareholder report to find its hypothetical example and you will be able to compare these expenses. Please remember that these hypothetical account values and expenses may not be used to estimate the actual ending account balance or expenses you paid for the period.
| Beginning Account value on 3-1-2015 | Ending value on 8-31-2015 | Expenses paid during period ended 8-31-20151 | Annualized expense ratio | |
| Class A | $1,000.00 | $1,018.80 | $6.50 | 1.28% |
| Class B | 1,000.00 | 1,014.90 | 10.34 | 2.04% |
| Class C | 1,000.00 | 1,015.20 | 10.05 | 1.98% |
| Class I | 1,000.00 | 1,020.40 | 4.89 | 0.96% |
| Class R2 | 1,000.00 | 1,017.80 | 7.47 | 1.47% |
| Class R6 | 1,000.00 | 1,021.00 | 4.28 | 0.84% |
| Class NAV | 1,000.00 | 1,021.00 | 4.28 | 0.84% |
Remember, these examples do not include any transaction costs, therefore, these examples will not help you to determine the relative total costs of owning different funds. If transaction costs were included, your expenses would have been higher. See the prospectuses for details regarding transaction costs.
| 1 | Expenses are equal to the fund's annualized expense ratio multiplied by the average account value over the period, multiplied by 184/366 (to reflect the one-half year period). |
11
Fund's investments
| As of 8-31-15 (unaudited) | ||||||||||||||
| Shares | Value | |||||||||||||
| Common stocks 98.7% | $2,324,710,599 | |||||||||||||
| (Cost $2,251,302,509) | ||||||||||||||
| Australia 4.0% | 93,774,835 | |||||||||||||
| BHP Billiton, Ltd. | 745,630 | 13,658,175 | ||||||||||||
| Commonwealth Bank of Australia | 280,230 | 14,971,602 | ||||||||||||
| Sonic Healthcare, Ltd. | 893,690 | 13,161,441 | ||||||||||||
| Telstra Corp., Ltd. | 7,374,030 | 30,252,821 | ||||||||||||
| Westpac Banking Corp. | 978,631 | 21,730,796 | ||||||||||||
| Canada 6.5% | 152,121,635 | |||||||||||||
| BCE, Inc. | 1,030,980 | 41,690,587 | ||||||||||||
| Potash Corp. of Saskatchewan, Inc. | 1,472,373 | 38,281,698 | ||||||||||||
| Rogers Communications, Inc., Class B | 1,064,740 | 36,346,514 | ||||||||||||
| Shaw Communications, Inc., Class B | 845,050 | 16,976,795 | ||||||||||||
| TELUS Corp. | 575,454 | 18,826,041 | ||||||||||||
| France 8.2% | 194,525,657 | |||||||||||||
| AXA SA | 694,900 | 17,503,765 | ||||||||||||
| Electricite de France SA | 1,154,960 | 24,913,414 | ||||||||||||
| Sanofi | 144,895 | 14,252,062 | ||||||||||||
| SCOR SE | 814,400 | 28,665,013 | ||||||||||||
| Total SA | 745,610 | 34,377,242 | ||||||||||||
| Unibail-Rodamco SE | 118,465 | 30,755,962 | ||||||||||||
| Vinci SA | 409,360 | 26,331,365 | ||||||||||||
| Vivendi SA | 718,188 | 17,726,834 | ||||||||||||
| Germany 6.3% | 147,504,964 | |||||||||||||
| Allianz SE | 114,230 | 18,200,526 | ||||||||||||
| BASF SE | 301,460 | 24,221,263 | ||||||||||||
| Daimler AG | 268,650 | 21,533,436 | ||||||||||||
| Deutsche Post AG | 454,810 | 12,494,700 | ||||||||||||
| Deutsche Telekom AG | 1,005,865 | 17,158,514 | ||||||||||||
| Muenchener Rueckversicherungs AG | 204,110 | 37,440,196 | ||||||||||||
| Siemens AG | 166,020 | 16,456,329 | ||||||||||||
| Italy 1.5% | 34,974,747 | |||||||||||||
| Terna Rete Elettrica Nazionale SpA | 7,514,610 | 34,974,747 | ||||||||||||
| Netherlands 1.4% | 33,426,124 | |||||||||||||
| Royal Dutch Shell PLC, ADR, Class A | 631,635 | 33,426,124 | ||||||||||||
| Norway 2.9% | 67,487,323 | |||||||||||||
| Orkla ASA | 2,429,430 | 17,910,527 | ||||||||||||
| Statoil ASA | 2,206,070 | 33,622,640 | ||||||||||||
| Yara International ASA | 357,530 | 15,954,156 | ||||||||||||
| Shares | Value | |||||||||||||
| Singapore 1.3% | $29,626,142 | |||||||||||||
| Singapore Exchange, Ltd. | 2,676,174 | 13,781,070 | ||||||||||||
| Singapore Telecommunications, Ltd. | 5,970,497 | 15,845,072 | ||||||||||||
| Spain 0.7% | 16,512,624 | |||||||||||||
| Gas Natural SDG SA | 816,470 | 16,512,624 | ||||||||||||
| Sweden 1.0% | 24,342,698 | |||||||||||||
| Svenska Handelsbanken AB, A Shares | 1,631,995 | 24,342,698 | ||||||||||||
| Switzerland 2.8% | 65,794,229 | |||||||||||||
| Nestle SA | 186,160 | 13,713,833 | ||||||||||||
| Roche Holding AG | 61,355 | 16,702,330 | ||||||||||||
| Swisscom AG | 65,543 | 35,378,066 | ||||||||||||
| Taiwan 0.7% | 17,330,986 | |||||||||||||
| Taiwan Semiconductor Manufacturing Company, Ltd., ADR | 871,780 | 17,330,986 | ||||||||||||
| United Kingdom 15.4% | 363,898,440 | |||||||||||||
| Aberdeen Asset Management PLC | 2,668,500 | 12,952,841 | ||||||||||||
| Amec Foster Wheeler PLC | 1,525,270 | 18,724,435 | ||||||||||||
| AstraZeneca PLC, ADR | 1,016,180 | 31,786,110 | ||||||||||||
| BAE Systems PLC | 4,181,970 | 28,785,938 | ||||||||||||
| British American Tobacco PLC | 559,460 | 29,624,690 | ||||||||||||
| GlaxoSmithKline PLC | 1,670,010 | 34,097,513 | ||||||||||||
| Imperial Tobacco Group PLC | 725,535 | 34,922,741 | ||||||||||||
| National Grid PLC | 3,415,170 | 44,996,910 | ||||||||||||
| Pearson PLC | 1,075,670 | 18,648,366 | ||||||||||||
| Rio Tinto PLC | 434,680 | 15,870,400 | ||||||||||||
| SSE PLC | 1,476,535 | 33,087,805 | ||||||||||||
| Unilever PLC | 412,530 | 16,544,428 | ||||||||||||
| Vodafone Group PLC | 12,736,212 | 43,856,263 | ||||||||||||
| United States 46.0% | 1,083,390,195 | |||||||||||||
| Altria Group, Inc. | 674,995 | 36,166,234 | ||||||||||||
| Ameren Corp. | 595,785 | 24,004,178 | ||||||||||||
| Arthur J. Gallagher & Company | 285,180 | 12,468,070 | ||||||||||||
| AT&T, Inc. | 1,333,020 | 44,256,264 | ||||||||||||
| Automatic Data Processing, Inc. | 179,570 | 13,884,352 | ||||||||||||
| CenturyLink, Inc. | 1,134,510 | 30,677,150 | ||||||||||||
| CME Group, Inc. | 198,600 | 18,755,784 | ||||||||||||
| ConocoPhillips | 520,535 | 25,584,295 | ||||||||||||
| Corrections Corp. of America | 864,085 | 25,386,817 | ||||||||||||
| Duke Energy Corp. | 517,598 | 36,702,874 | ||||||||||||
| Emerson Electric Company | 326,420 | 15,576,762 | ||||||||||||
| Entergy Corp. | 450,030 | 29,400,460 | ||||||||||||
| Enterprise Products Partners LP | 967,590 | 27,198,955 | ||||||||||||
| Exxon Mobil Corp. | 252,085 | 18,966,875 | ||||||||||||
| Shares | Value | |||||||||||||
| United States (continued) | ||||||||||||||
| Health Care REIT, Inc. | 599,940 | $38,006,199 | ||||||||||||
| Iron Mountain, Inc. | 1,116,010 | 31,627,723 | ||||||||||||
| Kimberly-Clark Corp. | 203,890 | 21,720,402 | ||||||||||||
| Kinder Morgan, Inc. | 1,387,856 | 44,980,413 | ||||||||||||
| KLA-Tencor Corp. | 263,010 | 13,179,431 | ||||||||||||
| Lockheed Martin Corp. | 139,440 | 28,052,539 | ||||||||||||
| McDonald's Corp. | 260,910 | 24,791,668 | ||||||||||||
| Merck & Company, Inc. | 317,960 | 17,122,146 | ||||||||||||
| Microchip Technology, Inc. | 376,010 | 15,980,425 | ||||||||||||
| Microsoft Corp. | 290,440 | 12,639,949 | ||||||||||||
| Occidental Petroleum Corp. | 457,305 | 33,387,838 | ||||||||||||
| People's United Financial, Inc. | 1,082,740 | 16,782,470 | ||||||||||||
| PepsiCo, Inc. | 154,180 | 14,327,947 | ||||||||||||
| Pfizer, Inc. | 441,510 | 14,225,452 | ||||||||||||
| Philip Morris International, Inc. | 606,270 | 48,380,346 | ||||||||||||
| PPL Corp. | 1,090,150 | 33,783,749 | ||||||||||||
| Regal Entertainment Group, Class A | 876,730 | 16,675,405 | ||||||||||||
| Reynolds American, Inc. | 436,292 | 36,539,455 | ||||||||||||
| RR Donnelley & Sons Company | 1,353,430 | 21,248,851 | ||||||||||||
| Seagate Technology PLC | 636,525 | 32,717,385 | ||||||||||||
| TECO Energy, Inc. | 1,566,490 | 33,005,944 | ||||||||||||
| The Coca-Cola Company | 328,520 | 12,917,406 | ||||||||||||
| The Dow Chemical Company | 457,350 | 20,013,636 | ||||||||||||
| The Procter & Gamble Company | 189,030 | 13,358,750 | ||||||||||||
| The Southern Company | 398,250 | 17,288,033 | ||||||||||||
| Verizon Communications, Inc. | 947,099 | 43,576,025 | ||||||||||||
| Waste Management, Inc. | 297,860 | 14,910,872 | ||||||||||||
| WEC Energy Group, Inc. | 684,476 | 32,615,281 | ||||||||||||
| Wells Fargo & Company | 384,500 | 20,505,385 | ||||||||||||
| Rights 0.0% | $31,736 | |||||||||||||
| (Cost $0) | ||||||||||||||
| Commonwealth Bank of Australia (Expiration Date: 9-9-15; Strike Price: AUD 71.50) (I) | 12,562 | 31,736 | ||||||||||||
| Yield (%) | Shares | Value | ||||||||||||
| Short-term investments 0.8% | $19,240,326 | |||||||||||||
| (Cost $19,240,326) | ||||||||||||||
| Money market funds 0.8% | 19,240,326 | |||||||||||||
| Fidelity Institutional Money Market Government Portfolio | 0.0100(Y | ) | 19,240,326 | 19,240,326 | ||||||||||
| Total investments (Cost $2,270,542,835)† 99.5% | $2,343,982,661 | |||||||||||||
| Other assets and liabilities, net 0.5% | $12,866,827 | |||||||||||||
| Total net assets 100.0% | $2,356,849,488 | |||||||||||||
| The percentage shown for each investment category is the total value of the category as a percentage of the net assets of the fund. | ||||||||||||||
| Key to Currency Abbreviations | ||||||||||||||
| AUD | Australian Dollar | |||||||||||||
| Key to Security Abbreviations and Legend | ||||||||||||||
| ADR | American Depositary Receipts | |||||||||||||
| REIT | Real Estate Investment Trust | |||||||||||||
| (I) | Non-income producing security. | |||||||||||||
| (Y) | The rate shown is the annualized seven-day yield as of 8-31-15. | |||||||||||||
| † | At 8-31-15, the aggregate cost of investment securities for federal income tax purposes was $2,276,462,713. Net unrealized appreciation aggregated $67,519,948, of which $223,454,348 related to appreciated investment securities and $155,934,400 related to depreciated investment securities. | |||||||||||||
Financial statements
STATEMENT OF ASSETS AND LIABILITIES 8-31-15 (unaudited)
| Assets | ||||||||||||||||||||||
| Investments, at value (Cost $2,270,542,835) | $2,343,982,661 | |||||||||||||||||||||
| Foreign currency, at value (Cost $2,321,078) | 2,311,124 | |||||||||||||||||||||
| Receivable for fund shares sold | 4,301,074 | |||||||||||||||||||||
| Dividends and interest receivable | 14,190,124 | |||||||||||||||||||||
| Other receivables and prepaid expenses | 127,421 | |||||||||||||||||||||
| Total assets | 2,364,912,404 | |||||||||||||||||||||
| Liabilities | ||||||||||||||||||||||
| Payable for fund shares repurchased | 7,485,494 | |||||||||||||||||||||
| Payable to affiliates | ||||||||||||||||||||||
| Accounting and legal services fees | 29,674 | |||||||||||||||||||||
| Transfer agent fees | 184,525 | |||||||||||||||||||||
| Distribution and service fees | 227 | |||||||||||||||||||||
| Trustees' fees | 7,257 | |||||||||||||||||||||
| Other liabilities and accrued expenses | 355,739 | |||||||||||||||||||||
| Total liabilities | 8,062,916 | |||||||||||||||||||||
| Net assets | $2,356,849,488 | |||||||||||||||||||||
| Net assets consist of | ||||||||||||||||||||||
| Paid-in capital | $2,167,464,847 | |||||||||||||||||||||
| Undistributed net investment income | 14,524,365 | |||||||||||||||||||||
| Accumulated net realized gain (loss) on investments and foreign currency transactions | 101,656,198 | |||||||||||||||||||||
| Net unrealized appreciation (depreciation) on investments and translation of assets and liabilities in foreign currencies | 73,204,078 | |||||||||||||||||||||
| Net assets | $2,356,849,488 | |||||||||||||||||||||
| Net asset value per share | ||||||||||||||||||||||
| Based on net asset values and shares outstanding - The fund has an unlimited number of shares authorized with no par value | ||||||||||||||||||||||
| Class A ($518,412,364 ÷ 48,928,046 shares)1 | $10.60 | |||||||||||||||||||||
| Class B ($13,770,065 ÷ 1,300,336 shares)1 | $10.59 | |||||||||||||||||||||
| Class C ($151,485,589 ÷ 14,295,101 shares)1 | $10.60 | |||||||||||||||||||||
| Class I ($1,051,610,530 ÷ 98,884,919 shares) | $10.63 | |||||||||||||||||||||
| Class R2 ($1,051,071 ÷ 98,914 shares) | $10.63 | |||||||||||||||||||||
| Class R6 ($876,078 ÷ 82,475 shares) | $10.62 | |||||||||||||||||||||
| Class NAV ($619,643,791 ÷ 58,288,990 shares) | $10.63 | |||||||||||||||||||||
| Maximum offering price per share | ||||||||||||||||||||||
| Class A (net assets value per share ÷ 95%)2 | $11.16 | |||||||||||||||||||||
| 1 | Redemption price per share is equal to net asset value less any applicable contingent deferred sales charge. | |||||||||||||||||||
| 2 | On single retail sales of less than $50,000. On sales of $50,000 or more and on group sales the offering price is reduced. | |||||||||||||||||||
STATEMENT OF OPERATIONS For the six months ended 8-31-15 (unaudited)
| Investment income | ||||||||||||||||||||||||||||||||||||||||
| Dividends | $72,074,955 | |||||||||||||||||||||||||||||||||||||||
| Interest | 436 | |||||||||||||||||||||||||||||||||||||||
| Less foreign taxes withheld | (6,363,713 | ) | ||||||||||||||||||||||||||||||||||||||
| Total investment income | 65,711,678 | |||||||||||||||||||||||||||||||||||||||
| Expenses | ||||||||||||||||||||||||||||||||||||||||
| Investment management fees | 10,610,178 | |||||||||||||||||||||||||||||||||||||||
| Distribution and service fees | 1,775,453 | |||||||||||||||||||||||||||||||||||||||
| Accounting and legal services fees | 170,908 | |||||||||||||||||||||||||||||||||||||||
| Transfer agent fees | 1,157,778 | |||||||||||||||||||||||||||||||||||||||
| Trustees' fees | 19,280 | |||||||||||||||||||||||||||||||||||||||
| State registration fees | 105,101 | |||||||||||||||||||||||||||||||||||||||
| Printing and postage | 84,719 | |||||||||||||||||||||||||||||||||||||||
| Professional fees | 55,365 | |||||||||||||||||||||||||||||||||||||||
| Custodian fees | 278,094 | |||||||||||||||||||||||||||||||||||||||
| Registration and filing fees | 37,164 | |||||||||||||||||||||||||||||||||||||||
| Other | 20,114 | |||||||||||||||||||||||||||||||||||||||
| Total expenses | 14,314,154 | |||||||||||||||||||||||||||||||||||||||
| Less expense reductions | (113,425 | ) | ||||||||||||||||||||||||||||||||||||||
| Net expenses | 14,200,729 | |||||||||||||||||||||||||||||||||||||||
| Net investment income | 51,510,949 | |||||||||||||||||||||||||||||||||||||||
| Realized and unrealized gain (loss) | ||||||||||||||||||||||||||||||||||||||||
| Net realized gain (loss) on | ||||||||||||||||||||||||||||||||||||||||
| Investments and foreign currency transactions | 94,046,746 | |||||||||||||||||||||||||||||||||||||||
| 94,046,746 | ||||||||||||||||||||||||||||||||||||||||
| Change in net unrealized appreciation (depreciation) of | ||||||||||||||||||||||||||||||||||||||||
| Investments and translation of assets and liabilities in foreign currencies | (375,059,087 | ) | ||||||||||||||||||||||||||||||||||||||
| (375,059,087 | ) | |||||||||||||||||||||||||||||||||||||||
| Net realized and unrealized loss | (281,012,341 | ) | ||||||||||||||||||||||||||||||||||||||
| Decrease in net assets from operations | ($229,501,392 | ) | ||||||||||||||||||||||||||||||||||||||
STATEMENTS OF CHANGES IN NET ASSETS
| Six months ended 8-31-15 | Year ended 2-28-15 | |||||||||||||||||||||||||||||||||||||||||||||||
| (unaudited) | ||||||||||||||||||||||||||||||||||||||||||||||||
| Increase (decrease) in net assets | ||||||||||||||||||||||||||||||||||||||||||||||||
| From operations | ||||||||||||||||||||||||||||||||||||||||||||||||
| Net investment income | $51,510,949 | $78,990,253 | ||||||||||||||||||||||||||||||||||||||||||||||
| Net realized gain | 94,046,746 | 61,397,066 | ||||||||||||||||||||||||||||||||||||||||||||||
| Change in net unrealized appreciation (depreciation) | (375,059,087 | ) | 48,574,230 | |||||||||||||||||||||||||||||||||||||||||||||
| Increase (decrease) in net assets resulting from operations | (229,501,392 | ) | 188,961,549 | |||||||||||||||||||||||||||||||||||||||||||||
| Distributions to shareholders | ||||||||||||||||||||||||||||||||||||||||||||||||
| From net investment income | ||||||||||||||||||||||||||||||||||||||||||||||||
| Class A | (9,062,815 | ) | (20,928,672 | ) | ||||||||||||||||||||||||||||||||||||||||||||
| Class B | (184,080 | ) | (486,696 | ) | ||||||||||||||||||||||||||||||||||||||||||||
| Class C | (2,055,864 | ) | (4,343,243 | ) | ||||||||||||||||||||||||||||||||||||||||||||
| Class I | (21,073,403 | ) | (42,929,623 | ) | ||||||||||||||||||||||||||||||||||||||||||||
| Class R2 | (20,045 | ) | (29,513 | ) | ||||||||||||||||||||||||||||||||||||||||||||
| Class R6 | (15,012 | ) | (12,521 | ) | ||||||||||||||||||||||||||||||||||||||||||||
| Class NAV | (12,116,673 | ) | (27,036,853 | ) | ||||||||||||||||||||||||||||||||||||||||||||
| From net realized gain | ||||||||||||||||||||||||||||||||||||||||||||||||
| Class A | — | (19,485,409 | ) | |||||||||||||||||||||||||||||||||||||||||||||
| Class B | — | (590,390 | ) | |||||||||||||||||||||||||||||||||||||||||||||
| Class C | — | (5,577,950 | ) | |||||||||||||||||||||||||||||||||||||||||||||
| Class I | — | (42,201,354 | ) | |||||||||||||||||||||||||||||||||||||||||||||
| Class R2 | — | (36,286 | ) | |||||||||||||||||||||||||||||||||||||||||||||
| Class R6 | — | (12,656 | ) | |||||||||||||||||||||||||||||||||||||||||||||
| Class NAV | — | (24,485,458 | ) | |||||||||||||||||||||||||||||||||||||||||||||
| Total distributions | (44,527,892 | ) | (188,156,624 | ) | ||||||||||||||||||||||||||||||||||||||||||||
| From fund share transactions | (74,984,526 | ) | 461,724,827 | |||||||||||||||||||||||||||||||||||||||||||||
| Total increase (decrease) | (349,013,810 | ) | 462,529,752 | |||||||||||||||||||||||||||||||||||||||||||||
| Net assets | ||||||||||||||||||||||||||||||||||||||||||||||||
| Beginning of period | 2,705,863,298 | 2,243,333,546 | ||||||||||||||||||||||||||||||||||||||||||||||
| End of period | $2,356,849,488 | $2,705,863,298 | ||||||||||||||||||||||||||||||||||||||||||||||
| Undistributed net investment income | $14,524,365 | $7,541,308 | ||||||||||||||||||||||||||||||||||||||||||||||
Financial highlights
| Class A Shares Period ended | 8-31-15 | 1 | 2-28-15 | 2-28-14 | 2-28-13 | 2-29-12 | 2-28-11 | |||||||||||||||||||||||||||||||||||||||||||||||||||||||||||||||||||||||||||||||||||||||||||||||||||||||||||||||
| Per share operating performance | ||||||||||||||||||||||||||||||||||||||||||||||||||||||||||||||||||||||||||||||||||||||||||||||||||||||||||||||||||||||
| Net asset value, beginning of period | $11.78 | $11.74 | $10.46 | $9.81 | $9.50 | $8.10 | ||||||||||||||||||||||||||||||||||||||||||||||||||||||||||||||||||||||||||||||||||||||||||||||||||||||||||||||||
| Net investment income2 | 0.21 | 0.36 | 0.45 | 3 | 0.29 | 0.26 | 0.24 | |||||||||||||||||||||||||||||||||||||||||||||||||||||||||||||||||||||||||||||||||||||||||||||||||||||||||||||||
| Net realized and unrealized gain (loss) on investments | (1.21 | ) | 0.55 | 1.57 | 0.63 | 0.29 | 1.40 | |||||||||||||||||||||||||||||||||||||||||||||||||||||||||||||||||||||||||||||||||||||||||||||||||||||||||||||||
| Total from investment operations | (1.00 | ) | 0.91 | 2.02 | 0.92 | 0.55 | 1.64 | |||||||||||||||||||||||||||||||||||||||||||||||||||||||||||||||||||||||||||||||||||||||||||||||||||||||||||||||
| Less distributions | ||||||||||||||||||||||||||||||||||||||||||||||||||||||||||||||||||||||||||||||||||||||||||||||||||||||||||||||||||||||
| From net investment income | (0.18 | ) | (0.44 | ) | �� | (0.31 | ) | (0.27 | ) | (0.24 | ) | (0.24 | ) | |||||||||||||||||||||||||||||||||||||||||||||||||||||||||||||||||||||||||||||||||||||||||||||||||||||||||
| From net realized gain | — | (0.43 | ) | (0.43 | ) | — | — | — | ||||||||||||||||||||||||||||||||||||||||||||||||||||||||||||||||||||||||||||||||||||||||||||||||||||||||||||||
| Total distributions | (0.18 | ) | (0.87 | ) | (0.74 | ) | (0.27 | ) | (0.24 | ) | (0.24 | ) | ||||||||||||||||||||||||||||||||||||||||||||||||||||||||||||||||||||||||||||||||||||||||||||||||||||||||||
| Net asset value, end of period | $10.60 | $11.78 | $11.74 | $10.46 | $9.81 | $9.50 | ||||||||||||||||||||||||||||||||||||||||||||||||||||||||||||||||||||||||||||||||||||||||||||||||||||||||||||||||
| Total return (%)4,5 | (8.58 | ) 6 | 8.10 | 19.85 | 9.66 | 5.98 | 20.64 | |||||||||||||||||||||||||||||||||||||||||||||||||||||||||||||||||||||||||||||||||||||||||||||||||||||||||||||||
| Ratios and supplemental data | ||||||||||||||||||||||||||||||||||||||||||||||||||||||||||||||||||||||||||||||||||||||||||||||||||||||||||||||||||||||
| Net assets, end of period (in millions) | $518 | $580 | $553 | $276 | $215 | $56 | ||||||||||||||||||||||||||||||||||||||||||||||||||||||||||||||||||||||||||||||||||||||||||||||||||||||||||||||||
| Ratios (as a percentage of average net assets): | ||||||||||||||||||||||||||||||||||||||||||||||||||||||||||||||||||||||||||||||||||||||||||||||||||||||||||||||||||||||
| Expenses before reductions | 1.29 | 7 | 1.33 | 1.34 | 1.43 | 1.53 | 1.55 | |||||||||||||||||||||||||||||||||||||||||||||||||||||||||||||||||||||||||||||||||||||||||||||||||||||||||||||||
| Expenses including reductions | 1.28 | 7 | 1.32 | 1.34 | 1.42 | 1.42 | 1.55 | |||||||||||||||||||||||||||||||||||||||||||||||||||||||||||||||||||||||||||||||||||||||||||||||||||||||||||||||
| Net investment income | 3.68 | 7 | 2.99 | 4.01 | 3 | 2.92 | 2.78 | 2.80 | ||||||||||||||||||||||||||||||||||||||||||||||||||||||||||||||||||||||||||||||||||||||||||||||||||||||||||||||
| Portfolio turnover (%) | 23 | 23 | 40 | 21 | 19 | 39 | ||||||||||||||||||||||||||||||||||||||||||||||||||||||||||||||||||||||||||||||||||||||||||||||||||||||||||||||||
| 1 | Six months ended 8-31-15. Unaudited | ||||||||||||||||||||||||||||||||||||||||||||||||||||||||||||||||||||||||||||||||||
| 2 | Based on average daily shares outstanding. | ||||||||||||||||||||||||||||||||||||||||||||||||||||||||||||||||||||||||||||||||||
| 3 | Net Investment income per share and the percentage of average net assets reflects special dividends received by the fund, which amounted to $0.08 and 0.72%, respectively. | ||||||||||||||||||||||||||||||||||||||||||||||||||||||||||||||||||||||||||||||||||
| 4 | Does not reflect the effect of sales charges, if any. | ||||||||||||||||||||||||||||||||||||||||||||||||||||||||||||||||||||||||||||||||||
| 5 | Total returns would have been lower had certain expenses not been reduced during the applicable periods. | ||||||||||||||||||||||||||||||||||||||||||||||||||||||||||||||||||||||||||||||||||
| 6 | Not annualized. | ||||||||||||||||||||||||||||||||||||||||||||||||||||||||||||||||||||||||||||||||||
| 7 | Annualized. | ||||||||||||||||||||||||||||||||||||||||||||||||||||||||||||||||||||||||||||||||||
| Class B Shares Period ended | 8-31-15 | 1 | 2-28-15 | 2-28-14 | 2-28-13 | 2-29-12 | 2-28-11 | |||||||||||||||||||||||||||||||||||||||||||||||||||||||||||||||||||||||||||||||||||||||||||||||||||||||||||||||
| Per share operating performance | ||||||||||||||||||||||||||||||||||||||||||||||||||||||||||||||||||||||||||||||||||||||||||||||||||||||||||||||||||||||
| Net asset value, beginning of period | $11.78 | $11.74 | $10.46 | $9.81 | $9.49 | $8.10 | ||||||||||||||||||||||||||||||||||||||||||||||||||||||||||||||||||||||||||||||||||||||||||||||||||||||||||||||||
| Net investment income2 | 0.17 | 0.27 | 0.35 | 3 | 0.22 | 0.20 | 0.19 | |||||||||||||||||||||||||||||||||||||||||||||||||||||||||||||||||||||||||||||||||||||||||||||||||||||||||||||||
| Net realized and unrealized gain (loss) on investments | (1.22 | ) | 0.55 | 1.58 | 0.64 | 0.29 | 1.38 | |||||||||||||||||||||||||||||||||||||||||||||||||||||||||||||||||||||||||||||||||||||||||||||||||||||||||||||||
| Total from investment operations | (1.05 | ) | 0.82 | 1.93 | 0.86 | 0.49 | 1.57 | |||||||||||||||||||||||||||||||||||||||||||||||||||||||||||||||||||||||||||||||||||||||||||||||||||||||||||||||
| Less distributions | ||||||||||||||||||||||||||||||||||||||||||||||||||||||||||||||||||||||||||||||||||||||||||||||||||||||||||||||||||||||
| From net investment income | (0.14 | ) | (0.35 | ) | (0.22 | ) | (0.21 | ) | (0.17 | ) | (0.18 | ) | ||||||||||||||||||||||||||||||||||||||||||||||||||||||||||||||||||||||||||||||||||||||||||||||||||||||||||
| From net realized gain | — | (0.43 | ) | (0.43 | ) | — | — | — | ||||||||||||||||||||||||||||||||||||||||||||||||||||||||||||||||||||||||||||||||||||||||||||||||||||||||||||||
| Total distributions | (0.14 | ) | (0.78 | ) | (0.65 | ) | (0.21 | ) | (0.17 | ) | (0.18 | ) | ||||||||||||||||||||||||||||||||||||||||||||||||||||||||||||||||||||||||||||||||||||||||||||||||||||||||||
| Net asset value, end of period | $10.59 | $11.78 | $11.74 | $10.46 | $9.81 | $9.49 | ||||||||||||||||||||||||||||||||||||||||||||||||||||||||||||||||||||||||||||||||||||||||||||||||||||||||||||||||
| Total return (%)4,5 | (9.02 | ) 6 | 7.26 | 18.95 | 8.90 | 5.33 | 19.65 | |||||||||||||||||||||||||||||||||||||||||||||||||||||||||||||||||||||||||||||||||||||||||||||||||||||||||||||||
| Ratios and supplemental data | ||||||||||||||||||||||||||||||||||||||||||||||||||||||||||||||||||||||||||||||||||||||||||||||||||||||||||||||||||||||
| Net assets, end of period (in millions) | $14 | $17 | $17 | $11 | $8 | $2 | ||||||||||||||||||||||||||||||||||||||||||||||||||||||||||||||||||||||||||||||||||||||||||||||||||||||||||||||||
| Ratios (as a percentage of average net assets): | ||||||||||||||||||||||||||||||||||||||||||||||||||||||||||||||||||||||||||||||||||||||||||||||||||||||||||||||||||||||
| Expenses before reductions | 2.05 | 7 | 2.10 | 2.15 | 2.29 | 2.54 | 2.91 | |||||||||||||||||||||||||||||||||||||||||||||||||||||||||||||||||||||||||||||||||||||||||||||||||||||||||||||||
| Expenses including reductions | 2.04 | 7 | 2.10 | 2.12 | 2.12 | 2.11 | 2.25 | |||||||||||||||||||||||||||||||||||||||||||||||||||||||||||||||||||||||||||||||||||||||||||||||||||||||||||||||
| Net investment income | 2.93 | 7 | 2.24 | 3.11 | 3 | 2.21 | 2.17 | 2.18 | ||||||||||||||||||||||||||||||||||||||||||||||||||||||||||||||||||||||||||||||||||||||||||||||||||||||||||||||
| Portfolio turnover (%) | 23 | 23 | 40 | 21 | 19 | 39 | ||||||||||||||||||||||||||||||||||||||||||||||||||||||||||||||||||||||||||||||||||||||||||||||||||||||||||||||||
| 1 | Six months ended 8-31-15. Unaudited | ||||||||||||||||||||||||||||||||||||||||||||||||||||||||||||||||||||||||||||||||||
| 2 | Based on average daily shares outstanding. | ||||||||||||||||||||||||||||||||||||||||||||||||||||||||||||||||||||||||||||||||||
| 3 | Net Investment income per share and the percentage of average net assets reflects special dividends received by the fund, which amounted to $0.08 and 0.72%, respectively. | ||||||||||||||||||||||||||||||||||||||||||||||||||||||||||||||||||||||||||||||||||
| 4 | Does not reflect the effect of sales charges, if any. | ||||||||||||||||||||||||||||||||||||||||||||||||||||||||||||||||||||||||||||||||||
| 5 | Total returns would have been lower had certain expenses not been reduced during the applicable periods. | ||||||||||||||||||||||||||||||||||||||||||||||||||||||||||||||||||||||||||||||||||
| 6 | Not annualized. | ||||||||||||||||||||||||||||||||||||||||||||||||||||||||||||||||||||||||||||||||||
| 7 | Annualized. | ||||||||||||||||||||||||||||||||||||||||||||||||||||||||||||||||||||||||||||||||||
| Class C Shares Period ended | 8-31-15 | 1 | 2-28-15 | 2-28-14 | 2-28-13 | 2-29-12 | 2-28-11 | |||||||||||||||||||||||||||||||||||||||||||||||||||||||||||||||||||||||||||||||||||||||||||||||||||||||||||||||
| Per share operating performance | ||||||||||||||||||||||||||||||||||||||||||||||||||||||||||||||||||||||||||||||||||||||||||||||||||||||||||||||||||||||
| Net asset value, beginning of period | $11.79 | $11.74 | $10.46 | $9.81 | $9.50 | $8.10 | ||||||||||||||||||||||||||||||||||||||||||||||||||||||||||||||||||||||||||||||||||||||||||||||||||||||||||||||||
| Net investment income2 | 0.17 | 0.27 | 0.36 | 3 | 0.22 | 0.20 | 0.18 | |||||||||||||||||||||||||||||||||||||||||||||||||||||||||||||||||||||||||||||||||||||||||||||||||||||||||||||||
| Net realized and unrealized gain (loss) on investments | (1.22 | ) | 0.56 | 1.58 | 0.64 | 0.28 | 1.40 | |||||||||||||||||||||||||||||||||||||||||||||||||||||||||||||||||||||||||||||||||||||||||||||||||||||||||||||||
| Total from investment operations | (1.05 | ) | 0.83 | 1.94 | 0.86 | 0.48 | 1.58 | |||||||||||||||||||||||||||||||||||||||||||||||||||||||||||||||||||||||||||||||||||||||||||||||||||||||||||||||
| Less distributions | ||||||||||||||||||||||||||||||||||||||||||||||||||||||||||||||||||||||||||||||||||||||||||||||||||||||||||||||||||||||
| From net investment income | (0.14 | ) | (0.35 | ) | (0.23 | ) | (0.21 | ) | (0.17 | ) | (0.18 | ) | ||||||||||||||||||||||||||||||||||||||||||||||||||||||||||||||||||||||||||||||||||||||||||||||||||||||||||
| From net realized gain | — | (0.43 | ) | (0.43 | ) | — | — | — | ||||||||||||||||||||||||||||||||||||||||||||||||||||||||||||||||||||||||||||||||||||||||||||||||||||||||||||||
| Total distributions | (0.14 | ) | (0.78 | ) | (0.66 | ) | (0.21 | ) | (0.17 | ) | (0.18 | ) | ||||||||||||||||||||||||||||||||||||||||||||||||||||||||||||||||||||||||||||||||||||||||||||||||||||||||||
| Net asset value, end of period | $10.60 | $11.79 | $11.74 | $10.46 | $9.81 | $9.50 | ||||||||||||||||||||||||||||||||||||||||||||||||||||||||||||||||||||||||||||||||||||||||||||||||||||||||||||||||
| Total return (%)4,5 | (8.98 | ) 6 | 7.42 | 18.97 | 8.90 | 5.22 | 19.78 | |||||||||||||||||||||||||||||||||||||||||||||||||||||||||||||||||||||||||||||||||||||||||||||||||||||||||||||||
| Ratios and supplemental data | ||||||||||||||||||||||||||||||||||||||||||||||||||||||||||||||||||||||||||||||||||||||||||||||||||||||||||||||||||||||
| Net assets, end of period (in millions) | $151 | $168 | $127 | $65 | $45 | $11 | ||||||||||||||||||||||||||||||||||||||||||||||||||||||||||||||||||||||||||||||||||||||||||||||||||||||||||||||||
| Ratios (as a percentage of average net assets): | ||||||||||||||||||||||||||||||||||||||||||||||||||||||||||||||||||||||||||||||||||||||||||||||||||||||||||||||||||||||
| Expenses before reductions | 1.99 | 7 | 2.03 | 2.05 | 2.15 | 2.29 | 2.39 | |||||||||||||||||||||||||||||||||||||||||||||||||||||||||||||||||||||||||||||||||||||||||||||||||||||||||||||||
| Expenses including reductions | 1.98 | 7 | 2.02 | 2.05 | 2.12 | 2.11 | 2.25 | |||||||||||||||||||||||||||||||||||||||||||||||||||||||||||||||||||||||||||||||||||||||||||||||||||||||||||||||
| Net investment income | 2.98 | 7 | 2.24 | 3.22 | 3 | 2.22 | 2.13 | 2.10 | ||||||||||||||||||||||||||||||||||||||||||||||||||||||||||||||||||||||||||||||||||||||||||||||||||||||||||||||
| Portfolio turnover (%) | 23 | 23 | 40 | 21 | 19 | 39 | ||||||||||||||||||||||||||||||||||||||||||||||||||||||||||||||||||||||||||||||||||||||||||||||||||||||||||||||||
| 1 | Six months ended 8-31-15. Unaudited | ||||||||||||||||||||||||||||||||||||||||||||||||||||||||||||||||||||||||||||||||||
| 2 | Based on average daily shares outstanding. | ||||||||||||||||||||||||||||||||||||||||||||||||||||||||||||||||||||||||||||||||||
| 3 | Net Investment income per share and the percentage of average net assets reflects special dividends received by the fund, which amounted to $0.08 and 0.72%, respectively. | ||||||||||||||||||||||||||||||||||||||||||||||||||||||||||||||||||||||||||||||||||
| 4 | Does not reflect the effect of sales charges, if any. | ||||||||||||||||||||||||||||||||||||||||||||||||||||||||||||||||||||||||||||||||||
| 5 | Total returns would have been lower had certain expenses not been reduced during the applicable periods. | ||||||||||||||||||||||||||||||||||||||||||||||||||||||||||||||||||||||||||||||||||
| 6 | Not annualized. | ||||||||||||||||||||||||||||||||||||||||||||||||||||||||||||||||||||||||||||||||||
| 7 | Annualized. | ||||||||||||||||||||||||||||||||||||||||||||||||||||||||||||||||||||||||||||||||||
| Class I Shares Period ended | 8-31-15 | 1 | 2-28-15 | 2-28-14 | 2-28-13 | 2-29-12 | 2-28-11 | |||||||||||||||||||||||||||||||||||||||||||||||||||||||||||||||||||||||||||||||||||||||||||||||||||||||||||||||
| Per share operating performance | ||||||||||||||||||||||||||||||||||||||||||||||||||||||||||||||||||||||||||||||||||||||||||||||||||||||||||||||||||||||
| Net asset value, beginning of period | $11.83 | $11.78 | $10.49 | $9.84 | $9.53 | $8.13 | ||||||||||||||||||||||||||||||||||||||||||||||||||||||||||||||||||||||||||||||||||||||||||||||||||||||||||||||||
| Net investment income2 | 0.23 | 0.39 | 0.47 | 3 | 0.31 | 0.32 | 0.29 | |||||||||||||||||||||||||||||||||||||||||||||||||||||||||||||||||||||||||||||||||||||||||||||||||||||||||||||||
| Net realized and unrealized gain (loss) on investments | (1.23 | ) | 0.56 | 1.59 | 0.65 | 0.27 | 1.38 | |||||||||||||||||||||||||||||||||||||||||||||||||||||||||||||||||||||||||||||||||||||||||||||||||||||||||||||||
| Total from investment operations | (1.00 | ) | 0.95 | 2.06 | 0.96 | 0.59 | 1.67 | |||||||||||||||||||||||||||||||||||||||||||||||||||||||||||||||||||||||||||||||||||||||||||||||||||||||||||||||
| Less distributions | ||||||||||||||||||||||||||||||||||||||||||||||||||||||||||||||||||||||||||||||||||||||||||||||||||||||||||||||||||||||
| From net investment income | (0.20 | ) | (0.47 | ) | (0.34 | ) | (0.31 | ) | (0.28 | ) | (0.27 | ) | ||||||||||||||||||||||||||||||||||||||||||||||||||||||||||||||||||||||||||||||||||||||||||||||||||||||||||
| From net realized gain | — | (0.43 | ) | (0.43 | ) | — | — | — | ||||||||||||||||||||||||||||||||||||||||||||||||||||||||||||||||||||||||||||||||||||||||||||||||||||||||||||||
| Total distributions | (0.20 | ) | (0.90 | ) | (0.77 | ) | (0.31 | ) | (0.28 | ) | (0.27 | ) | ||||||||||||||||||||||||||||||||||||||||||||||||||||||||||||||||||||||||||||||||||||||||||||||||||||||||||
| Net asset value, end of period | $10.63 | $11.83 | $11.78 | $10.49 | $9.84 | $9.53 | ||||||||||||||||||||||||||||||||||||||||||||||||||||||||||||||||||||||||||||||||||||||||||||||||||||||||||||||||
| Total return (%)4 | (8.57 | ) 5 | 8.50 | 20.28 | 10.07 | 6.45 | 21.09 | |||||||||||||||||||||||||||||||||||||||||||||||||||||||||||||||||||||||||||||||||||||||||||||||||||||||||||||||
| Ratios and supplemental data | ||||||||||||||||||||||||||||||||||||||||||||||||||||||||||||||||||||||||||||||||||||||||||||||||||||||||||||||||||||||
| Net assets, end of period (in millions) | $1,052 | $1,242 | $893 | $641 | $249 | $123 | ||||||||||||||||||||||||||||||||||||||||||||||||||||||||||||||||||||||||||||||||||||||||||||||||||||||||||||||||
| Ratios (as a percentage of average net assets): | ||||||||||||||||||||||||||||||||||||||||||||||||||||||||||||||||||||||||||||||||||||||||||||||||||||||||||||||||||||||
| Expenses before reductions | 0.97 | 6 | 1.01 | 1.01 | 1.05 | 1.12 | 1.09 | |||||||||||||||||||||||||||||||||||||||||||||||||||||||||||||||||||||||||||||||||||||||||||||||||||||||||||||||
| Expenses including reductions | 0.96 | 6 | 1.00 | 1.01 | 1.03 | 0.97 | 1.08 | |||||||||||||||||||||||||||||||||||||||||||||||||||||||||||||||||||||||||||||||||||||||||||||||||||||||||||||||
| Net investment income | 4.00 | 6 | 3.24 | 4.19 | 3 | 3.10 | 3.43 | 3.40 | ||||||||||||||||||||||||||||||||||||||||||||||||||||||||||||||||||||||||||||||||||||||||||||||||||||||||||||||
| Portfolio turnover (%) | 23 | 23 | 40 | 21 | 19 | 39 | ||||||||||||||||||||||||||||||||||||||||||||||||||||||||||||||||||||||||||||||||||||||||||||||||||||||||||||||||
| 1 | Six months ended 8-31-15. Unaudited. | ||||||||||||||||||||||||||||||||||||||||||||||||||||||||||||||||||||||||||||||||||
| 2 | Based on average daily shares outstanding. | ||||||||||||||||||||||||||||||||||||||||||||||||||||||||||||||||||||||||||||||||||
| 3 | Net Investment income per share and the percentage of average net assets reflects special dividends received by the fund, which amounted to $0.08 and 0.72%, respectively. | ||||||||||||||||||||||||||||||||||||||||||||||||||||||||||||||||||||||||||||||||||
| 4 | Total returns would have been lower had certain expenses not been reduced during the applicable periods. | ||||||||||||||||||||||||||||||||||||||||||||||||||||||||||||||||||||||||||||||||||
| 5 | Not annualized. | ||||||||||||||||||||||||||||||||||||||||||||||||||||||||||||||||||||||||||||||||||
| 6 | Annualized. | ||||||||||||||||||||||||||||||||||||||||||||||||||||||||||||||||||||||||||||||||||
| Class R2 Shares Period ended | 8-31-15 | 1 | 2-28-15 | 2-28-14 | 2-28-13 | 2 | ||||||||||||||||||||||||||||||||||||||||||||||||||||||||||||||||||||||||||||||||
| Per share operating performance | ||||||||||||||||||||||||||||||||||||||||||||||||||||||||||||||||||||||||||||||||||||||
| Net asset value, beginning of period | $11.82 | $11.78 | $10.49 | $9.84 | ||||||||||||||||||||||||||||||||||||||||||||||||||||||||||||||||||||||||||||||||||
| Net investment income3 | 0.20 | 0.31 | 0.50 | 4 | 0.29 | |||||||||||||||||||||||||||||||||||||||||||||||||||||||||||||||||||||||||||||||||
| Net realized and unrealized gain (loss) on investments | (1.22 | ) | 0.58 | 1.52 | 0.63 | |||||||||||||||||||||||||||||||||||||||||||||||||||||||||||||||||||||||||||||||||
| Total from investment operations | (1.02 | ) | 0.89 | 2.02 | 0.92 | |||||||||||||||||||||||||||||||||||||||||||||||||||||||||||||||||||||||||||||||||
| Less distributions | ||||||||||||||||||||||||||||||||||||||||||||||||||||||||||||||||||||||||||||||||||||||
| From net investment income | (0.17 | ) | (0.42 | ) | (0.30 | ) | (0.27 | ) | ||||||||||||||||||||||||||||||||||||||||||||||||||||||||||||||||||||||||||||||
| From net realized gain | — | (0.43 | ) | (0.43 | ) | — | ||||||||||||||||||||||||||||||||||||||||||||||||||||||||||||||||||||||||||||||||
| Total distributions | (0.17 | ) | (0.85 | ) | (0.73 | ) | (0.27 | ) | ||||||||||||||||||||||||||||||||||||||||||||||||||||||||||||||||||||||||||||||
| Net asset value, end of period | $10.63 | $11.82 | $11.78 | $10.49 | ||||||||||||||||||||||||||||||||||||||||||||||||||||||||||||||||||||||||||||||||||
| Total return (%)5 | (8.71 | ) 6 | 7.93 | 19.78 | 9.58 | |||||||||||||||||||||||||||||||||||||||||||||||||||||||||||||||||||||||||||||||||
| Ratios and supplemental data | ||||||||||||||||||||||||||||||||||||||||||||||||||||||||||||||||||||||||||||||||||||||
| Net assets, end of period (in millions) | $1 | $1 | $1 | — | 7 | |||||||||||||||||||||||||||||||||||||||||||||||||||||||||||||||||||||||||||||||||
| Ratios (as a percentage of average net assets): | ||||||||||||||||||||||||||||||||||||||||||||||||||||||||||||||||||||||||||||||||||||||
| Expenses before reductions | 2.24 | 8 | 3.22 | 8.52 | 19.42 | |||||||||||||||||||||||||||||||||||||||||||||||||||||||||||||||||||||||||||||||||
| Expenses including reductions | 1.47 | 8 | 1.47 | 1.47 | 1.47 | |||||||||||||||||||||||||||||||||||||||||||||||||||||||||||||||||||||||||||||||||
| Net investment income | 3.55 | 8 | 2.66 | 4.38 | 4 | 2.91 | ||||||||||||||||||||||||||||||||||||||||||||||||||||||||||||||||||||||||||||||||
| Portfolio turnover (%) | 23 | 23 | 40 | 21 | ||||||||||||||||||||||||||||||||||||||||||||||||||||||||||||||||||||||||||||||||||
| 1 | Six months ended 8-31-15. Unaudited. | ||||||||||||||||||||||||||||||||||||||||||||||||||||||||||||||||||||||||||||||||||
| 2 | The inception date for Class R2 shares is 3-1-12. | ||||||||||||||||||||||||||||||||||||||||||||||||||||||||||||||||||||||||||||||||||
| 3 | Based on average daily shares outstanding. | ||||||||||||||||||||||||||||||||||||||||||||||||||||||||||||||||||||||||||||||||||
| 4 | Net Investment income per share and the percentage of average net assets reflects special dividends received by the fund, which amounted to $0.08 and 0.72%, respectively. | ||||||||||||||||||||||||||||||||||||||||||||||||||||||||||||||||||||||||||||||||||
| 5 | Total returns would have been lower had certain expenses not been reduced during the applicable periods. | ||||||||||||||||||||||||||||||||||||||||||||||||||||||||||||||||||||||||||||||||||
| 6 | Not annualized. | ||||||||||||||||||||||||||||||||||||||||||||||||||||||||||||||||||||||||||||||||||
| 7 | Less than $500,000. | ||||||||||||||||||||||||||||||||||||||||||||||||||||||||||||||||||||||||||||||||||
| 8 | Annualized. | ||||||||||||||||||||||||||||||||||||||||||||||||||||||||||||||||||||||||||||||||||
| Class R6 Shares Period ended | 8-31-15 | 1 | 2-28-15 | 2-28-14 | 2-28-13 | 2-29-12 | 2 | |||||||||||||||||||||||||||||||||||||||||||||||||||||||||||||||||||||||||||||||||||||||||||||||||||||||||||||||
| Per share operating performance | ||||||||||||||||||||||||||||||||||||||||||||||||||||||||||||||||||||||||||||||||||||||||||||||||||||||||||||||||||||||
| Net asset value, beginning of period | $11.81 | $11.77 | $10.49 | $9.84 | $9.29 | |||||||||||||||||||||||||||||||||||||||||||||||||||||||||||||||||||||||||||||||||||||||||||||||||||||||||||||||||
| Net investment income3 | 0.24 | 0.39 | 0.48 | 4 | 0.33 | 0.13 | ||||||||||||||||||||||||||||||||||||||||||||||||||||||||||||||||||||||||||||||||||||||||||||||||||||||||||||||||
| Net realized and unrealized gain (loss) on investments | (1.22 | ) | 0.57 | 1.58 | 0.64 | 0.52 | ||||||||||||||||||||||||||||||||||||||||||||||||||||||||||||||||||||||||||||||||||||||||||||||||||||||||||||||||
| Total from investment operations | (0.98 | ) | 0.96 | 2.06 | 0.97 | 0.65 | ||||||||||||||||||||||||||||||||||||||||||||||||||||||||||||||||||||||||||||||||||||||||||||||||||||||||||||||||
| Less distributions | ||||||||||||||||||||||||||||||||||||||||||||||||||||||||||||||||||||||||||||||||||||||||||||||||||||||||||||||||||||||
| From net investment income | (0.21 | ) | (0.49 | ) | (0.35 | ) | (0.32 | ) | (0.10 | ) | ||||||||||||||||||||||||||||||||||||||||||||||||||||||||||||||||||||||||||||||||||||||||||||||||||||||||||||
| From net realized gain | — | (0.43 | ) | (0.43 | ) | — | — | |||||||||||||||||||||||||||||||||||||||||||||||||||||||||||||||||||||||||||||||||||||||||||||||||||||||||||||||
| Total distributions | (0.21 | ) | (0.92 | ) | (0.78 | ) | (0.32 | ) | (0.10 | ) | ||||||||||||||||||||||||||||||||||||||||||||||||||||||||||||||||||||||||||||||||||||||||||||||||||||||||||||
| Net asset value, end of period | $10.62 | $11.81 | $11.77 | $10.49 | $9.84 | |||||||||||||||||||||||||||||||||||||||||||||||||||||||||||||||||||||||||||||||||||||||||||||||||||||||||||||||||
| Total return (%)5 | (8.45 | ) 6 | 8.56 | 20.29 | 10.12 | 7.12 | 6 | |||||||||||||||||||||||||||||||||||||||||||||||||||||||||||||||||||||||||||||||||||||||||||||||||||||||||||||||
| Ratios and supplemental data | ||||||||||||||||||||||||||||||||||||||||||||||||||||||||||||||||||||||||||||||||||||||||||||||||||||||||||||||||||||||
| Net assets, end of period (in millions) | $1 | — | 7 | — | 7 | — | 7 | — | 7 | |||||||||||||||||||||||||||||||||||||||||||||||||||||||||||||||||||||||||||||||||||||||||||||||||||||||||||||
| Ratios (as a percentage of average net assets): | ||||||||||||||||||||||||||||||||||||||||||||||||||||||||||||||||||||||||||||||||||||||||||||||||||||||||||||||||||||||
| Expenses before reductions | 2.01 | 8 | 6.51 | 10.30 | 10.38 | 15.93 | 8 | |||||||||||||||||||||||||||||||||||||||||||||||||||||||||||||||||||||||||||||||||||||||||||||||||||||||||||||||
| Expenses including reductions | 0.84 | 8 | 0.87 | 0.97 | 0.97 | 0.97 | 8 | |||||||||||||||||||||||||||||||||||||||||||||||||||||||||||||||||||||||||||||||||||||||||||||||||||||||||||||||
| Net investment income | 4.24 | 8 | 3.32 | 4.26 | 4 | 3.29 | 2.82 | 8 | ||||||||||||||||||||||||||||||||||||||||||||||||||||||||||||||||||||||||||||||||||||||||||||||||||||||||||||||
| Portfolio turnover (%) | 23 | 23 | 40 | 21 | 19 | 9 | ||||||||||||||||||||||||||||||||||||||||||||||||||||||||||||||||||||||||||||||||||||||||||||||||||||||||||||||||
| 1 | Six months ended 8-31-15. Unaudited. | ||||||||||||||||||||||||||||||||||||||||||||||||||||||||||||||||||||||||||||||||||
| 2 | The inception date for Class R6 shares is 9-1-11. | ||||||||||||||||||||||||||||||||||||||||||||||||||||||||||||||||||||||||||||||||||
| 3 | Based on average daily shares outstanding. | ||||||||||||||||||||||||||||||||||||||||||||||||||||||||||||||||||||||||||||||||||
| 4 | Net Investment income per share and the percentage of average net assets reflects special dividends received by the fund, which amounted to $0.08 and 0.72%, respectively. | ||||||||||||||||||||||||||||||||||||||||||||||||||||||||||||||||||||||||||||||||||
| 5 | Total returns would have been lower had certain expenses not been reduced during the applicable periods. | ||||||||||||||||||||||||||||||||||||||||||||||||||||||||||||||||||||||||||||||||||
| 6 | Not annualized. | ||||||||||||||||||||||||||||||||||||||||||||||||||||||||||||||||||||||||||||||||||
| 7 | Less than $500,000. | ||||||||||||||||||||||||||||||||||||||||||||||||||||||||||||||||||||||||||||||||||
| 8 | Annualized. | ||||||||||||||||||||||||||||||||||||||||||||||||||||||||||||||||||||||||||||||||||
| 9 | The portfolio turnover is shown for the period from 3-1-11 to 2-29-12. | ||||||||||||||||||||||||||||||||||||||||||||||||||||||||||||||||||||||||||||||||||
| Class NAV Shares Period ended | 8-31-15 | 1 | 2-28-15 | 2-28-14 | 2-28-13 | 2-29-12 | 2-28-11 | |||||||||||||||||||||||||||||||||||||||||||||||||||||||||||||||||||||||||||||||||||||||||||||||||||||||||||||||
| Per share operating performance | ||||||||||||||||||||||||||||||||||||||||||||||||||||||||||||||||||||||||||||||||||||||||||||||||||||||||||||||||||||||
| Net asset value, beginning of period | $11.82 | $11.78 | $10.49 | $9.84 | $9.53 | $8.13 | ||||||||||||||||||||||||||||||||||||||||||||||||||||||||||||||||||||||||||||||||||||||||||||||||||||||||||||||||
| Net investment income2 | 0.24 | 0.41 | 0.49 | 3 | 0.35 | 0.29 | 0.30 | |||||||||||||||||||||||||||||||||||||||||||||||||||||||||||||||||||||||||||||||||||||||||||||||||||||||||||||||
| Net realized and unrealized gain (loss) on investments | (1.23 | ) | 0.55 | 1.59 | 0.62 | 0.31 | 1.38 | |||||||||||||||||||||||||||||||||||||||||||||||||||||||||||||||||||||||||||||||||||||||||||||||||||||||||||||||
| Total from investment operations | (0.99 | ) | 0.96 | 2.08 | 0.97 | 0.60 | 1.68 | |||||||||||||||||||||||||||||||||||||||||||||||||||||||||||||||||||||||||||||||||||||||||||||||||||||||||||||||
| Less distributions | ||||||||||||||||||||||||||||||||||||||||||||||||||||||||||||||||||||||||||||||||||||||||||||||||||||||||||||||||||||||
| From net investment income | (0.20 | ) | (0.49 | ) | (0.36 | ) | (0.32 | ) | (0.29 | ) | (0.28 | ) | ||||||||||||||||||||||||||||||||||||||||||||||||||||||||||||||||||||||||||||||||||||||||||||||||||||||||||
| From net realized gain | — | (0.43 | ) | (0.43 | ) | — | — | — | ||||||||||||||||||||||||||||||||||||||||||||||||||||||||||||||||||||||||||||||||||||||||||||||||||||||||||||||
| Total distributions | (0.20 | ) | (0.92 | ) | (0.79 | ) | (0.32 | ) | (0.29 | ) | (0.28 | ) | ||||||||||||||||||||||||||||||||||||||||||||||||||||||||||||||||||||||||||||||||||||||||||||||||||||||||||
| Net asset value, end of period | $10.63 | $11.82 | $11.78 | $10.49 | $9.84 | $9.53 | ||||||||||||||||||||||||||||||||||||||||||||||||||||||||||||||||||||||||||||||||||||||||||||||||||||||||||||||||
| Total return (%)4 | (8.44 | ) 5 | 8.57 | 20.47 | 10.17 | 6.53 | 21.19 | |||||||||||||||||||||||||||||||||||||||||||||||||||||||||||||||||||||||||||||||||||||||||||||||||||||||||||||||
| Ratios and supplemental data | ||||||||||||||||||||||||||||||||||||||||||||||||||||||||||||||||||||||||||||||||||||||||||||||||||||||||||||||||||||||
| Net assets, end of period (in millions) | $620 | $696 | $653 | $944 | $1,019 | $162 | ||||||||||||||||||||||||||||||||||||||||||||||||||||||||||||||||||||||||||||||||||||||||||||||||||||||||||||||||
| Ratios (as a percentage of average net assets): | ||||||||||||||||||||||||||||||||||||||||||||||||||||||||||||||||||||||||||||||||||||||||||||||||||||||||||||||||||||||
| Expenses before reductions | 0.85 | 6 | 0.88 | 0.88 | 0.90 | 0.99 | 0.99 | |||||||||||||||||||||||||||||||||||||||||||||||||||||||||||||||||||||||||||||||||||||||||||||||||||||||||||||||
| Expenses including reductions | 0.84 | 6 | 0.87 | 0.87 | 0.89 | 0.94 | 0.99 | |||||||||||||||||||||||||||||||||||||||||||||||||||||||||||||||||||||||||||||||||||||||||||||||||||||||||||||||
| Net investment income | 4.11 | 6 | 3.42 | 4.35 | 3 | 3.56 | 3.11 | 3.49 | ||||||||||||||||||||||||||||||||||||||||||||||||||||||||||||||||||||||||||||||||||||||||||||||||||||||||||||||
| Portfolio turnover (%) | 23 | 23 | 40 | 21 | 19 | 39 | ||||||||||||||||||||||||||||||||||||||||||||||||||||||||||||||||||||||||||||||||||||||||||||||||||||||||||||||||
| 1 | Six months ended 8-31-15. Unaudited. | ||||||||||||||||||||||||||||||||||||||||||||||||||||||||||||||||||||||||||||||||||
| 2 | Based on average daily shares outstanding. | ||||||||||||||||||||||||||||||||||||||||||||||||||||||||||||||||||||||||||||||||||
| 3 | Net Investment income per share and the percentage of average net assets reflects special dividends received by the fund, which amounted to $0.08 and 0.72%, respectively. | ||||||||||||||||||||||||||||||||||||||||||||||||||||||||||||||||||||||||||||||||||
| 4 | Total returns would have been lower had certain expenses not been reduced during the applicable periods. | ||||||||||||||||||||||||||||||||||||||||||||||||||||||||||||||||||||||||||||||||||
| 5 | Not annualized. | ||||||||||||||||||||||||||||||||||||||||||||||||||||||||||||||||||||||||||||||||||
| 6 | Annualized. | ||||||||||||||||||||||||||||||||||||||||||||||||||||||||||||||||||||||||||||||||||
Note 1 — Organization
John Hancock Global Shareholder Yield Fund (the fund) is a series of John Hancock Funds III (the Trust), an open-end management investment company organized as a Massachusetts business trust and registered under the Investment Company Act of 1940, as amended (the 1940 Act). The investment objective of the fund is to seek to provide a high level of income. Capital appreciation is a secondary investment objective.
The fund may offer multiple classes of shares. The shares currently offered are detailed in the Statement of assets and liabilities. Class A and Class C shares are offered to all investors. Class B shares are closed to new investors. Class I shares are offered to institutions and certain investors. Class R2 shares are available only to certain retirement plans. Class R6 shares are only available to certain retirement plans, institutions and other investors. Class NAV shares are offered to John Hancock affiliated funds of funds and certain 529 plans. Shareholders of each class have exclusive voting rights to matters that affect that class. The distribution and service fees, if any, and transfer agent fees for each class may differ. Class B shares convert to Class A shares eight years after purchase.
Note 2 — Significant accounting policies
The financial statements have been prepared in conformity with accounting principles generally accepted in the United States of America (US GAAP), which require management to make certain estimates and assumptions as of the date of the financial statements. Actual results could differ from those estimates and those differences could be significant. The fund qualifies as an investment company under Topic 946 of Accounting Standards Codification of US GAAP.
Events or transactions occurring after the end of the fiscal period through the date that the financial statements were issued have been evaluated in the preparation of the financial statements. The following summarizes the significant accounting policies of the fund:
Security valuation. Investments are stated at value as of the close of regular trading on the New York Stock Exchange (NYSE), normally at 4:00 p.m., Eastern Time. In order to value the securities, the fund uses the following valuation techniques: Equity securities held by the fund are valued at the last sale price or official closing price on the exchange where the security was acquired or most likely will be sold. In the event there were no sales during the day or closing prices are not available, the securities are valued using the last available bid price. Investments by the fund in open-end mutual funds are valued at their respective net asset values each business day. Foreign securities and currencies are valued in U.S. dollars, based on foreign currency exchange rates supplied by an independent pricing vendor. Securities that trade only in the over-the-counter (OTC) market are valued using bid prices.
Other portfolio securities and assets, for which reliable market quotations are not readily available, are valued at fair value as determined in good faith by the fund's Pricing Committee following procedures established by the Board of Trustees. The frequency with which these fair valuation procedures are used cannot be predicted and fair value of securities may differ significantly from the value that would have been used had a ready market for such securities existed. Trading in foreign securities may be completed before the daily close of trading on the NYSE. Significant events at the issuer or market level may affect the values of securities between the time when the valuation of the securities is generally determined and the close of the NYSE. If a significant event occurs, these securities may be fair valued, as determined in good faith by the fund's Pricing Committee, following procedures established by the Board of Trustees. The fund uses fair value adjustment factors provided by an independent pricing vendor to value certain foreign securities in order to adjust for events that may occur between the close of foreign exchanges or markets and the close of the NYSE.
The fund uses a three-tier hierarchy to prioritize the pricing assumptions, referred to as inputs, used in valuation techniques to measure fair value. Level 1 includes securities valued using quoted prices in active markets for identical securities. Level 2 includes securities valued using other significant observable inputs. Observable inputs may include quoted prices for similar securities, interest rates, prepayment speeds and credit risk. Prices for securities valued using these inputs are received from independent pricing vendors and brokers and are based on an evaluation of the inputs described. Level 3 includes securities valued using significant unobservable inputs when market prices are not readily available or reliable, including the fund's own assumptions in determining the fair value of investments. Factors used in determining value may include market or
26
issuer specific events or trends, changes in interest rates and credit quality. The inputs or methodology used for valuing securities are not necessarily an indication of the risks associated with investing in those securities. Changes in valuation techniques and related inputs may result in transfers into or out of an assigned level within the disclosure hierarchy.
The following is a summary of the values by input classification of the fund's investments as of August 31, 2015 by major security category or type:
| Total value at 8-31-15 | Level 1 quoted price | Level 2 significant observable inputs | Level 3 significant unobservable inputs | ||
| Common stocks | |||||
| Australia | $93,774,835 | — | $93,774,835 | — | |
| Canada | 152,121,635 | $152,121,635 | — | — | |
| France | 194,525,657 | — | 194,525,657 | — | |
| Germany | 147,504,964 | — | 147,504,964 | — | |
| Italy | 34,974,747 | — | 34,974,747 | — | |
| Netherlands | 33,426,124 | 33,426,124 | — | — | |
| Norway | 67,487,323 | — | 67,487,323 | — | |
| Singapore | 29,626,142 | — | 29,626,142 | — | |
| Spain | 16,512,624 | — | 16,512,624 | — | |
| Sweden | 24,342,698 | — | 24,342,698 | — | |
| Switzerland | 65,794,229 | — | 65,794,229 | — | |
| Taiwan | 17,330,986 | 17,330,986 | — | — | |
| United Kingdom | 363,898,440 | 31,786,110 | 332,112,330 | — | |
| United States | 1,083,390,195 | 1,083,390,195 | — | — | |
| Rights | 31,736 | — | 31,736 | — | |
| Short-term investments | 19,240,326 | 19,240,326 | — | — | |
| Total investments in securities | $2,343,982,661 | $1,337,295,376 | $1,006,687,285 | — | |
Security transactions and related investment income. Investment security transactions are accounted for on a trade date plus one basis for daily net asset value calculations. However, for financial reporting purposes, investment transactions are reported on trade date. Interest income is accrued as earned. Dividend income is recorded on the ex-date, except for dividends of foreign securities where the dividend may not be known until after the ex-date. In those cases, dividend income, net of withholding taxes, is recorded when the fund becomes aware of the dividends. Distributions received on securities that represent a tax return of capital or capital gain are recorded as a reduction of cost of investments and/or as a realized gain if amounts are estimable. Foreign taxes are provided for based on the fund's understanding of the tax rules and rates that exist in the foreign markets in which it invests. Gains and losses on securities sold are determined on the basis of identified cost and may include proceeds from litigation.
Foreign currency translation. Assets, including investments and liabilities denominated in foreign currencies, are translated into U.S. dollar values each day at the prevailing exchange rate. Purchases and sales of securities, income and expenses are translated into U.S. dollars at the prevailing exchange rate on the date of the transaction. The effect of changes in foreign currency exchange rates on the value of securities is reflected as a component of the realized and unrealized gains (losses) on investments.
Funds that invest internationally generally carry more risk than funds that invest strictly in U.S. securities. Risks can result from differences in economic and political conditions, regulations, market practices (including higher transaction costs), accounting standards and other factors. Foreign investments are also subject to a decline in the value of a foreign currency versus the U.S. dollar, which reduces the dollar value of securities denominated in that currency.
27
Foreign taxes. The fund may be subject to withholding tax on income and/or capital gains or repatriation taxes imposed by certain countries in which the fund invests. Taxes are accrued based upon investment income, realized gains or unrealized appreciation.
Line of credit. The fund may borrow from banks for temporary or emergency purposes, including meeting redemption requests that otherwise might require the untimely sale of securities. Pursuant to the fund's custodian agreement, the custodian may loan money to the fund to make properly authorized payments. The fund is obligated to repay the custodian for any overdraft, including any related costs or expenses. The custodian may have a lien, security interest or security entitlement in any fund property that is not otherwise segregated or pledged, to the extent of any overdraft, and to the maximum extent permitted by law.
Effective June 30, 2015, the fund and other affiliated funds entered into a syndicated line of credit agreement, with Citibank N.A. as the administrative agent, that enables them to participate in a $750 million unsecured committed line of credit. Prior to June 30, 2015, the fund and other affiliated funds had an agreement with Citibank that enabled them to participate in a $300 million unsecured committed line of credit. A commitment fee, payable at the end of each calendar quarter, based on the average daily unused portion of the effective line of credit, is charged to each participating fund on a pro rata basis and is reflected in other expenses on the Statement of operations. Commitment fees for the six months ended were $328. For the six months ended month August 31, 2015, the fund had no borrowings under either line of credit.
Expenses. Within the John Hancock group of funds complex, expenses that are directly attributable to an individual fund are allocated to such fund. Expenses that are not readily attributable to a specific fund are allocated among all funds in an equitable manner, taking into consideration, among other things, the nature and type of expense and the fund's relative net assets. Expense estimates are accrued in the period to which they relate and adjustments are made when actual amounts are known.
Class allocations. Income, common expenses and realized and unrealized gains (losses) are determined at the fund level and allocated daily to each class of shares based on the net assets of the class. Class-specific expenses, such as distribution and service fees, if any, and transfer agent fees, for all classes, are calculated daily at the class level based on the net assets of each class and the specific expense rates applicable to each class. Through June 30, 2015, class-specific expenses, such as state registration fees and printing and postage, for all classes were calculated daily at the class level based on the net assets of each class and the specific expense rates applicable to each class.
Federal income taxes. The fund intends to continue to qualify as a regulated investment company by complying with the applicable provisions of the Internal Revenue Code and will not be subject to federal income tax on taxable income that is distributed to shareholders. Therefore, no federal income tax provision is required.
As of February 28, 2015, the fund had no uncertain tax positions that would require financial statement recognition, derecognition or disclosure. The fund's federal tax returns are subject to examination by the Internal Revenue Service for a period of three years.
Distribution of income and gains. Distributions to shareholders from net investment income and net realized gains, if any, are recorded on the ex-date. The fund generally declares and pays dividends quarterly and capital gain distributions, if any, annually.
Distributions paid by the fund with respect to each class of shares are calculated in the same manner, at the same time and in the same amount, except for the effect of class level expenses that may be applied differently to each class.
Such distributions, on a tax basis, are determined in conformity with income tax regulations, which may differ from US GAAP.
Capital accounts within the financial statements are adjusted for permanent book-tax differences. These adjustments have no impact on net assets or the results of operations. Temporary book-tax differences, if any, will reverse in a subsequent period. Book-tax differences are primarily attributable to wash sale loss deferrals and partnerships.
28
Note 3 — Guarantees and indemnifications
Under the Trust's organizational documents, its Officers and Trustees are indemnified against certain liabilities arising out of the performance of their duties to the Trust, including the fund. Additionally, in the normal course of business, the fund enters into contracts with service providers that contain general indemnification clauses. The fund's maximum exposure under these arrangements is unknown, as this would involve future claims that may be made against the fund that have not yet occurred. The risk of material loss from such claims is considered remote.
Note 4 — Fees and transactions with affiliates
John Hancock Advisers, LLC (the Advisor) serves as investment advisor for the fund. John Hancock Funds, LLC (the Distributor), an affiliate of the Advisor, serves as principal underwriter of the fund. The Advisor and the Distributor are indirect, wholly owned subsidiaries of Manulife Financial Corporation (MFC).
Management fee. The fund has an investment management agreement with the Advisor under which the fund pays a daily management fee to the Advisor, on an annual basis equal to 0.800% of average daily net assets. The Advisor has a subadvisory agreement with Epoch Investment Partners, Inc. The fund is not responsible for payment of the subadvisory fees.
The Advisor has contractually agreed to waive a portion of its management fee and/or reimburse expenses for certain funds of the John Hancock group of funds complex, including the fund (the participating portfolios). This waiver is based upon aggregate net assets of all the participating portfolios. The amount of the reimbursement is calculated daily and allocated among all the participating portfolios in proportion to the daily net assets of each fund. During the six months ended August 31, 2015, this waiver amounted to 0.01% of the fund's average net assets on an annualized basis. This arrangement may be amended or terminated at any time by the Advisor upon notice to the fund and with the approval of the Board of Trustees.
The Advisor has contractually agreed to waive all or a portion of its management fee and/or reimburse or pay operating expenses of the fund to the extent necessary to maintain the fund's total operating expenses at 1.47% for Class R2 shares, excluding certain expenses such as taxes, brokerage commissions, interest expense, litigation and indemnification expenses and other extraordinary expenses not incurred in the ordinary course of the fund's business, acquired fund fees and short dividend expense. The expense limitation expires on June 30, 2016, unless renewed by mutual agreement of the fund and the Advisor based upon a determination that this is appropriate under the circumstances at the time. Prior to July 1, 2015, Class R6 shares had waivers and/or reimbursement such that expenses would not exceed 0.97% for Class R6 shares.
Prior to July 1, 2015, the Advisor contractually agreed to waive and/or reimburse all class specific expenses for Class B shares of the fund, including Rule 12b-1 fees and transfer agency fees and service fees, as applicable, to the extent they exceed 1.30% of average annual net assets (on an annualized basis) attributable to Class B shares (the Class Expense Waiver).
The Advisor has contractually agreed to waive and/or reimburse all class specific expenses for Class R6 shares of the fund to the extent they exceed 0.00% of average annual net assets, on an annualized basis. The expense limitation expires on June 30, 2016, unless renewed by mutual agreement of the fund and the advisor based upon a determination that this is appropriate under the circumstances at the time.
The expense reductions described above amounted to the following for the six months ended August 31, 2015:
| Class | Expense reductions | Class | Expense reductions | |
| Class A | $22,326 | Class R2 | $4,879 | |
| Class B | 607 | Class R6 | 5,281 | |
| Class C | 6,511 | Class NAV | 26,513 | |
| Class I | 47,308 | Total | $113,425 |
The investment management fees, including the impact of the waivers and reimbursements as described above, incurred for the six months ended August 31, 2015 were equivalent to a net annual effective rate of 0.79% of the fund's average daily net assets.
29
Accounting and legal services. Pursuant to a service agreement, the fund reimburses the Advisor for all expenses associated with providing the administrative, financial, legal, accounting and recordkeeping services to the fund, including the preparation of all tax returns, periodic reports to shareholders and regulatory reports, among other services. These expenses are allocated to each share class based on its relative net assets at the time the expense was incurred. These accounting and legal services fees incurred for the six months ended August 31, 2015 amounted to an annual rate of 0.01% of the fund's average daily net assets.
Distribution and service plans. The fund has a distribution agreement with the Distributor. The fund has adopted distribution and service plans with respect to Class A, Class B, Class C and Class R2 shares pursuant to Rule 12b-1 under the 1940 Act, to pay the Distributor for services provided as the distributor of shares of the fund. In addition, under a service plan for Class R2 shares, the fund pays for certain other services. The fund may pay up to the following contractual rates of distribution and service fees under these arrangements, expressed as an annual percentage of average daily net assets for each class of the fund's shares.
| Class | Rule 12b-1 Fee | Service Fee |
| Class A | 0.30% | — |
| Class B | 1.00% | — |
| Class C | 1.00% | — |
| Class R2 | 0.25% | 0.25% |
Sales charges. Class A shares are assessed up-front sales charges, which resulted in payments to the Distributor amounting to $1,844,482 for the six months ended August 31, 2015. Of this amount, $317,021 was retained and used for printing prospectuses, advertising, sales literature and other purposes, $1,525,279 was paid as sales commissions to broker-dealers and $2,182 was paid as sales commissions to sales personnel of Signator Investors, Inc., a broker-dealer affiliate of the Advisor.
Class A, Class B and Class C shares may be subject to contingent deferred sales charges (CDSCs). Certain Class A shares that are acquired through purchases of $1 million or more and are redeemed within one year of purchase are subject to a 1.00% sales charge. Class B shares that are redeemed within six years of purchase are subject to CDSCs, at declining rates, beginning at 5.00%. Class C shares that are redeemed within one year of purchase are subject to a 1.00% CDSC. CDSCs are applied to the lesser of the current market value at the time of redemption or the original purchase cost of the shares being redeemed. Proceeds from CDSCs are used to compensate the Distributor for providing distribution-related services in connection with the sale of these shares. During the six months ended August 31, 2015, CDSCs received by the Distributor amounted to $4,263, $9,140 and $11,399 for Class A, Class B and Class C shares, respectively.
Transfer agent fees. The fund has a transfer agent agreement with John Hancock Signature Services, Inc. (Signature Services), an affiliate of the Advisor. The transfer agent fees paid to Signature Services are determined based on the cost to Signature Services (Signature Services Cost) of providing recordkeeping services. It also includes out-of-pocket expenses, including payments made to third-parties for recordkeeping services provided to their clients who invest in one or more John Hancock funds. In addition, Signature Services Cost may be reduced by certain fees that Signature Services receives in connection with retirement and small accounts. Signature Services Cost is calculated monthly and allocated, as applicable, to five categories of share classes: Retail Share and Institutional Share Classes of Non-Municipal Bond Funds, Class R6 Shares, Retirement Share Classes and Municipal Bond Share Classes. Within each of these categories, the applicable costs are allocated to the affected John Hancock affiliated funds and/or classes, based on the relative average daily net assets.
Class level expenses. Class level expenses for the six months ended August 31, 2015 were:
| Class | Distribution and service fees | Transfer agent fees | State registration fees | Printing and postage | |||||||||||||
| Class A | $859,302 | $362,444 | $18,682 | $18,279 | |||||||||||||
| Class B | 77,948 | 9,867 | 5,175 | 465 | |||||||||||||
| Class C | 835,114 | 105,668 | 8,046 | 3,479 | |||||||||||||
30
| Class | Distribution and service fees | Transfer agent fees | State registration fees | Printing and postage | |||||||||||||
| Class I | — | 679,628 | 24,944 | 31,112 | |||||||||||||
| Class R2 | 3,089 | 100 | 5,563 | 62 | |||||||||||||
| Class R6 | — | 71 | 5,119 | 56 | |||||||||||||
| Class NAV | — | — | — | — | |||||||||||||
| Total | $1,775,453 | $1,157,778 | $67,529 | $53,453 | |||||||||||||
Effective July 1, 2015, state registration fees and printing and postage are treated as fund level expenses and are not included in the table above. For the period July 1, 2015 to August 31, 2015, state registration and printing and postage amounted to $37,572 and $31,266, respectively.
Trustee expenses. The fund compensates each Trustee who is not an employee of the Advisor or its affiliates. The costs of paying Trustee compensation and expenses are allocated to each fund based on its net assets relative to other funds within the John Hancock group of funds complex.
Note 5 — Fund share transactions
Transactions in fund shares for the six months ended August 31, 2015 and for the year ended February 28, 2015 were as follows:
| Six months ended 8-31-15 | Year ended 2-28-15 | |||||||||||||||||||||||||
| Shares | Amount | Shares | Amount | |||||||||||||||||||||||
| Class A shares | ||||||||||||||||||||||||||
| Sold | 7,613,218 | $86,509,265 | 20,719,507 | $248,267,051 | ||||||||||||||||||||||
| Distributions reinvested | 788,016 | 8,930,615 | 3,469,242 | 39,825,466 | ||||||||||||||||||||||
| Repurchased | (8,714,936 | ) | (98,170,776 | ) | (22,029,303 | ) | (258,739,581 | ) | ||||||||||||||||||
| Net increase (decrease) | (313,702 | ) | ($2,730,896 | ) | 2,159,446 | $29,352,936 | ||||||||||||||||||||
| Class B shares | ||||||||||||||||||||||||||
| Sold | 15,209 | $174,208 | 166,047 | $1,961,689 | ||||||||||||||||||||||
| Distributions reinvested | 12,951 | 146,781 | 74,877 | 856,685 | ||||||||||||||||||||||
| Repurchased | (138,798 | ) | (1,572,548 | ) | (238,338 | ) | (2,849,017 | ) | ||||||||||||||||||
| Net increase (decrease) | (110,638 | ) | ($1,251,559 | ) | 2,586 | ($30,643 | ) | |||||||||||||||||||
| Class C shares | ||||||||||||||||||||||||||
| Sold | 1,776,017 | $20,299,782 | 4,752,670 | $56,729,485 | ||||||||||||||||||||||
| Distributions reinvested | 167,528 | 1,899,039 | 781,411 | 8,933,617 | ||||||||||||||||||||||
| Repurchased | (1,930,210 | ) | (21,790,057 | ) | (2,090,014 | ) | (24,867,403 | ) | ||||||||||||||||||
| Net increase | 13,335 | $408,764 | 3,444,067 | $40,795,699 | ||||||||||||||||||||||
| Class I shares | ||||||||||||||||||||||||||
| Sold | 14,375,427 | $163,552,154 | 44,841,443 | $538,638,175 | ||||||||||||||||||||||
| Distributions reinvested | 1,808,051 | 20,555,889 | 7,155,019 | 82,144,457 | ||||||||||||||||||||||
| Repurchased | (22,341,849 | ) | (249,634,726 | ) | (22,743,540 | ) | (270,635,958 | ) | ||||||||||||||||||
| Net increase (decrease) | (6,158,371 | ) | ($65,526,683 | ) | 292,252,922 | $350,146,674 | ||||||||||||||||||||
| Class R2 shares | ||||||||||||||||||||||||||
| Sold | 18,310 | $206,757 | 75,096 | $890,451 | ||||||||||||||||||||||
| Distributions reinvested | 1,604 | 18,226 | 4,971 | 56,777 | ||||||||||||||||||||||
| Repurchased | (34,454 | ) | (382,660 | ) | (11,879 | ) | (134,980 | ) | ||||||||||||||||||
| Net increase (decrease) | (14,540 | ) | ($157,677 | ) | 68,188 | $812,248 | ||||||||||||||||||||
31
| Six months ended 8-31-15 | Year ended 2-28-15 | |||||||||||||||||||||||||
| Shares | Amount | Shares | Amount | |||||||||||||||||||||||
| Class R6 shares | ||||||||||||||||||||||||||
| Sold | 65,863 | $746,635 | 16,700 | $197,531 | ||||||||||||||||||||||
| Distributions reinvested | 1,130 | 12,804 | 1,336 | 15,272 | ||||||||||||||||||||||
| Repurchased | (19,375 | ) | (216,097 | ) | (2,266 | ) | (26,284 | ) | ||||||||||||||||||
| Net increase | 47,618 | $543,342 | 15,770 | $186,519 | ||||||||||||||||||||||
| Class NAV shares | ||||||||||||||||||||||||||
| Sold | 769,472 | $8,771,868 | 5,275,151 | $63,578,517 | ||||||||||||||||||||||
| Distributions reinvested | 1,065,887 | 12,116,673 | 4,483,816 | 51,522,311 | ||||||||||||||||||||||
| Repurchased | (2,453,456 | ) | (27,158,358 | ) | (6,277,534 | ) | (74,639,434 | ) | ||||||||||||||||||
| Net increase (decrease) | (618,097 | ) | ($6,269,817 | ) | 3,481,433 | $40,461,394 | ||||||||||||||||||||
| Total net increase (decrease) | (7,154,395 | ) | ($74,984,526 | ) | 38,424,412 | $461,724,827 | ||||||||||||||||||||
Affiliates of the fund owned 100% of shares of beneficial interest of Class NAV on August 31, 2015.
Note 6 — Purchase and sale of securities
Purchases and sales of securities, other than short-term investments, amounted to $579,031,293 and $601,293,077, respectively, for the six months ended August 31, 2015.
Note 7 — Investment by affiliated funds
Certain investors in the fund are affiliated funds that are managed by the Advisor and its affiliates. The affiliated funds do not invest in the fund for the purpose of exercising management or control; however, this investment may represent a significant portion of the fund's net assets. At August 31, 2015, funds within the John Hancock group of funds complex held 26.2% of the fund's net assets. The following funds had an affiliate ownership of 5% or more of the fund's net assets:
| Fund | Affiliate concentration |
| John Hancock Lifestyle Growth Portfolio | 8.3% |
| John Hancock Lifestyle Balanced Portfolio | 8.2% |
32
Continuation of Investment Advisory and Subadvisory Agreements
Evaluation of Advisory and Subadvisory Agreements by the Board of Trustees
This section describes the evaluation by the Board of Trustees (the Board) of John Hancock Funds III (the Trust) of the Advisory Agreement (the Advisory Agreement) with John Hancock Advisers, LLC (the Advisor) and the Subadvisory Agreement (the Subadvisory Agreement) with Epoch Investment Partners, Inc. (the Subadvisor), for John Hancock Global Shareholder Yield Fund (the fund). The Advisory Agreement and Subadvisory Agreement are collectively referred to as the Agreements. Prior to the June 23-25, 2015 meeting at which the Agreements were approved, the Board also discussed and considered information regarding the proposed continuation of the Agreements at an in-person meeting held on May 21-22, 2015.
Approval of Advisory and Subadvisory Agreements
At in-person meetings held on June 23-25, 2015, the Board, including the Trustees who are not considered to be interested persons of the Trust under the Investment Company Act of 1940, as amended (the 1940 Act) (the Independent Trustees), reapproved for an annual period the continuation of the Advisory Agreement between the Trust and the Advisor and the Subadvisory Agreement between the Advisor and the Subadvisor with respect to the fund.
In considering the Advisory Agreement and the Subadvisory Agreement, the Board received in advance of the meetings a variety of materials relating to the fund, the Advisor and the Subadvisor, including comparative performance, fee and expense information for a peer group of similar funds prepared by an independent third-party provider of mutual fund data, performance information for an applicable benchmark index; and, with respect to the Subadvisor, comparative performance information for comparably managed accounts, as applicable, and other information provided by the Advisor and the Subadvisor regarding the nature, extent and quality of services provided by the Advisor and the Subadvisor under their respective Agreements, as well as information regarding the Advisor's revenues and costs of providing services to the fund and any compensation paid to affiliates of the Advisor. At the meetings at which the renewal of the Advisory Agreement and Subadvisory Agreement are considered, particular focus is given to information concerning fund performance, comparability of fees and total expenses, and profitability. However, the Board notes that the evaluation process with respect to the Advisor and the Subadvisor is an ongoing one. In this regard, the Board also took into account discussions with management and information provided to the Board at prior meetings with respect to the services provided by the Advisor and the Subadvisor to the fund, including quarterly performance reports prepared by management containing reviews of investment results and prior presentations from the Subadvisor with respect to the fund. The Board also considered the nature, quality, and extent of non-advisory services, if any, to be provided to the fund by the Advisor's affiliates, including distribution services.
Throughout the process, the Board asked questions of and requested additional information from management. The Board is assisted by counsel for the Trust and the Independent Trustees are also separately assisted by independent legal counsel throughout the process. The Independent Trustees also received a memorandum from their independent legal counsel discussing the legal standards for their consideration of the proposed continuation of the Agreements and discussed the proposed continuation of the Agreements in private sessions with their independent legal counsel at which no representatives of management were present.
Approval of Advisory Agreement
In approving the Advisory Agreement with respect to the fund, the Board, including the Independent Trustees, considered a variety of factors, including those discussed below. The Board also considered other factors (including conditions and trends prevailing generally in the economy, the securities markets, and the industry) and does not treat any single factor as determinative, and each Trustee may attribute different weights to different factors. The Board's conclusions may be based in part on its consideration of the advisory and subadvisory arrangements in prior years and on the Board's ongoing regular review of fund performance and operations throughout the year.
33
Nature, extent, and quality of services. Among the information received by the Board from the Advisor relating to the nature, extent, and quality of services provided to the fund, the Board reviewed information provided by the Advisor relating to its operations and personnel, descriptions of its organizational and management structure, and information regarding the Advisor's compliance and regulatory history, including its Form ADV. The Board also noted that on a regular basis it receives and reviews information from the Trust's Chief Compliance Officer (CCO) regarding the fund's compliance policies and procedures established pursuant to Rule 38a-1 under the 1940 Act. The Board also considered the Advisor's risk management processes. The Board considered that the Advisor is responsible for the management of the day-to-day operations of the fund, including, but not limited to, general supervision of and coordination of the services provided by the Subadvisor, and is also responsible for monitoring and reviewing the activities of the Subadvisor and other third-party service providers.
In considering the nature, extent, and quality of the services provided by the Advisor, the Trustees also took into account their knowledge of the Advisor's management and the quality of the performance of the Advisor's duties, through Board meetings, discussions and reports during the preceding year and through each Trustee's experience as a Trustee of the Trust and of the other trusts in the John Hancock group of funds complex (the John Hancock Fund Complex).
In the course of their deliberations regarding the Advisory Agreement, the Board considered, among other things:
| (a) | the skills and competency with which the Advisor has in the past managed the Trust's affairs and its subadvisory relationship, the Advisor's oversight and monitoring of the Subadvisor's investment performance and compliance programs, such as the Subadvisor's compliance with fund policies and objectives, review of brokerage matters, including with respect to trade allocation and best execution and the Advisor's timeliness in responding to performance issues; | |
| (b) | the background, qualifications and skills of the Advisor's personnel; | |
| (c) | the Advisor's compliance policies and procedures and its responsiveness to regulatory changes and mutual fund industry developments; | |
| (d) | the Advisor's administrative capabilities, including its ability to supervise the other service providers for the fund; | |
| (e) | the financial condition of the Advisor and whether it has the financial wherewithal to provide a high level and quality of services to the fund; and | |
| (f) | the Advisor's reputation and experience in serving as an investment advisor to the Trust and the benefit to shareholders of investing in funds that are part of a family of funds offering a variety of investments. |
The Board concluded that the Advisor may reasonably be expected to continue to provide a high quality of services under the Advisory Agreement with respect to the fund.
Investment performance. In considering the fund's performance, the Board noted that it reviews at its regularly scheduled meetings information about the fund's performance results. In connection with the consideration of the Advisory Agreement, the Board:
| (a) | reviewed information prepared by management regarding the fund's performance; | |
| (b) | considered the comparative performance of an applicable benchmark index; | |
| (c) | considered the performance of comparable funds, if any, as included in the report prepared by an independent third-party provider of fund data; and | |
| (d) | took into account the Advisor's analysis of the fund's performance and its plans and recommendations regarding the Trust's subadvisory arrangements generally. |
The Board noted that the fund outperformed its benchmark index and its peer group average for the one- and five-year periods ended December 31, 2014. The Board also noted that the fund underperformed its benchmark index and its peer
34
group average for the three-year period ended December 31, 2014. The Board noted the fund's favorable performance relative to the benchmark index and peer group for the one- and five-year periods. The Board concluded that the fund's performance has generally been in line with or outperformed the historical performance of comparable funds and the fund's benchmark index.
Fees and expenses. The Board reviewed comparative information prepared by an independent third-party provider of mutual fund data, including, among other data, the fund's contractual and net management fees (and subadvisory fees, to the extent available) and total expenses as compared to similarly situated investment companies deemed to be comparable to the fund. The Board considered the fund's ranking within a smaller group of peer funds chosen by the independent third-party provider, as well as the fund's ranking within a broader group of funds. In comparing the fund's contractual and net management fees to those of comparable funds, the Board noted that such fees include both advisory and administrative costs. The Board noted that net management fees for the fund are higher than the peer group median and that total expenses for the fund are equal to the peer group median.
The Board took into account management's discussion of the fund's expenses, including actions taken that have reduced certain fund expenses. The Board also took into account management's discussion with respect to the advisory/subadvisory fee structure, including the amount of the advisory fee retained by the Advisor after payment of the subadvisory fee. The Board also noted that the Advisor pays the subadvisory fee, and that such fees are negotiated at arm's length with respect to the Subadvisor. In addition, the Board took into account that management had agreed to implement an overall fee waiver across the complex, including the fund, which is discussed further below. The Board also noted actions taken over the past several years to reduce the fund's operating expenses. The Board also noted that, in addition, the Advisor is currently waiving fees and/or reimbursing expenses with respect to the fund. The Board reviewed information provided by the Advisor concerning the investment advisory fee charged by the Advisor or one of its advisory affiliates to other clients (including other funds in the John Hancock Fund Complex) having similar investment mandates, if any. The Board considered any differences between the Advisor's and Subadvisor's services to the fund and the services they provide to other comparable clients or funds. The Board concluded that the advisory fee paid with respect to the fund is reasonable.
Profitability/indirect benefits. In considering the costs of the services to be provided and the profits to be realized by the Advisor and its affiliates from the Advisor's relationship with the Trust, the Board:
| (a) | reviewed financial information of the Advisor; | |||||||
| (b) | reviewed and considered information presented by the Advisor regarding the net profitability to the Advisor and its affiliates with respect to the fund; | |||||||
| (c) | received and reviewed profitability information with respect to the John Hancock Fund Complex as a whole; | |||||||
| (d) | received information with respect to the Advisor's allocation methodologies used in preparing the profitability data; | |||||||
| (e) | considered that the John Hancock insurance companies that are affiliates of the Advisor, as shareholders of the Trust directly or through their separate accounts, receive certain tax credits or deductions relating to foreign taxes paid and dividends received by certain funds of the Trust and noted that these tax benefits, which are not available to participants in qualified retirement plans under applicable income tax law, are reflected in the profitability information reviewed by the Board; | |||||||
| (f) | considered that the Advisor also provides administrative services to the fund on a cost basis pursuant to an administrative services agreement; | |||||||
| (g) | noted that affiliates of the Advisor provide transfer agency services and distribution services to the fund, and that the fund's distributor also receives Rule 12b-1 payments to support distribution of the fund; | |||||||
| (h) | noted that the Advisor also derives reputational and other indirect benefits from providing advisory services to the fund; | |||||||
| (i) | noted that the subadvisory fee for the fund is paid by the Advisor and is negotiated at arm's length; and |
35
| (j) | considered that the Advisor should be entitled to earn a reasonable level of profits in exchange for the level of services it provides to the fund and the entrepreneurial risk that it assumes as Advisor. |
Based upon its review, the Board concluded that the level of profitability, if any, of the Advisor and its affiliates from their relationship with the fund was reasonable and not excessive.
Economies of scale. In considering the extent to which economies of scale would be realized as the fund grows and whether fee levels reflect these economies of scale for the benefit of fund shareholders, the Board:
| (a) | considered that the Advisor has contractually agreed to waive a portion of its management fee for certain funds of the John Hancock Fund Complex, including the fund (the participating portfolios) or otherwise reimburse the expenses of the participating portfolios (the reimbursement). This waiver is based upon aggregate net assets of all the participating portfolios. The amount of the reimbursement is calculated daily and allocated among all the participating portfolios in proportion to the daily net assets of each fund; | |
| (b) | the Board also took into account management's discussion of the fund's advisory fee structure; and | |
| (c) | the Board also considered the effect of the fund's growth in size on its performance and fees. The Board also noted that if the fund's assets increase over time, the fund may realize other economies of scale. |
Approval of Subadvisory Agreement
In making its determination with respect to approval of the Subadvisory Agreement, the Board reviewed:
| (1) | information relating to the Subadvisor's business, including current subadvisory services to the Trust (and other funds in the John Hancock Fund Complex); | |
| (2) | the historical and current performance of the fund and comparative performance information relating to an applicable benchmark index and comparable funds; | |
| (3) | the subadvisory fee for the fund and to the extent available, comparable fee information prepared by an independent third party provider of fund data; and | |
| (4) | information relating to the nature and scope of any material relationships and their significance to the Trust's Advisor and Subadvisor. |
Nature, extent, and quality of services. With respect to the services provided by the Subadvisor, the Board received information provided to the Board by the Subadvisor, including the Subadvisor's Form ADV, as well as took into account information presented throughout the past year. The Board considered the Subadvisor's current level of staffing and its overall resources, as well as received information relating to the Subadvisor's compensation program. The Board reviewed the Subadvisor's history and investment experience, as well as information regarding the qualifications, background, and responsibilities of the Subadvisor's investment and compliance personnel who provide services to the fund. The Board also considered, among other things, the Subadvisor's compliance program and any disciplinary history. The Board also considered the Subadvisor's risk assessment and monitoring process. The Board reviewed the Subadvisor's regulatory history, including whether it was involved in any regulatory actions or investigations as well as material litigation, and any settlements and amelioratory actions undertaken, as appropriate. The Board noted that the Advisor conducts regular, periodic reviews of the Subadvisor and its operations, including regarding investment processes and organizational and staffing matters. The Board also noted that the Trust's CCO and his staff conduct regular, periodic compliance reviews with the Subadvisor and present reports to the Independent Trustees regarding the same, which includes evaluating the regulatory compliance systems of the Subadvisor and procedures reasonably designed to assure compliance with the federal securities laws. The Board also took into account the financial condition of the Subadvisor.
The Board considered the Subadvisor's investment process and philosophy. The Board took into account that the Subadvisor's responsibilities include the development and maintenance of an investment program for the fund that is
36
consistent with the fund's investment objective, the selection of investment securities and the placement of orders for the purchase and sale of such securities, as well as the implementation of compliance controls related to performance of these services. The Board also received information with respect to the Subadvisor's brokerage policies and practices, including with respect to best execution and soft dollars.
Subadvisor compensation. In considering the cost of services to be provided by the Subadvisor and the profitability to the Subadvisor of its relationship with the fund, the Board noted that the fees under the Subadvisory Agreement are paid by the Advisor and not the fund.
The Board also relied on the ability of the Advisor to negotiate the Subadvisory Agreement with the Subadvisor, which is not affiliated with the Advisor, and the fees thereunder at arm's length. As a result, the costs of the services to be provided and the profits to be realized by the Subadvisor from its relationship with the Trust were not a material factor in the Board's consideration of the Subadvisory Agreement.
The Board also received information regarding the nature and scope (including their significance to the Advisor and its affiliates and to the Subadvisor) of any material relationships with respect to the Subadvisor, which include arrangements in which the Subadvisor or its affiliates provide advisory, distribution, or management services in connection with financial products sponsored by the Advisor or its affiliates, and may include other registered investment companies, a 529 education savings plan, managed separate accounts and exempt group annuity contracts sold to qualified plans. The Board also received information and took into account any other potential conflicts of interest the Advisor might have in connection with the Subadvisory Agreement.
In addition, the Board considered other potential indirect benefits that the Subadvisor and its affiliates may receive from the Subadvisor's relationship with the fund, such as the opportunity to provide advisory services to additional funds in the John Hancock Fund Complex and reputational benefits.
Subadvisory fees. The Board considered that the fund pays an advisory fee to the Advisor and that, in turn, the Advisor pays a subadvisory fee to the Subadvisor. As noted above, the Board also considered the fund's subadvisory fees as compared to similarly situated investment companies deemed to be comparable to the fund as included in the report prepared by the independent third party provider of fund data, to the extent available. The Board noted that the limited size of the Lipper peer group was not sufficient for comparative purposes. The Board also took into account the subadvisory fees paid by the Advisor to the Subadvisor with respect to the fund and compared them to fees charged by the Subadvisor to manage other subadvised portfolios and portfolios not subject to regulation under the 1940 Act, as applicable.
Subadvisor performance. As noted above, the Board considered the fund's performance as compared to the fund's peer group and the benchmark index and noted that the Board reviews information about the fund's performance results at its regularly scheduled meetings. The Board noted the Advisor's expertise and resources in monitoring the performance, investment style and risk-adjusted performance of the Subadvisor. The Board was mindful of the Advisor's focus on the Subadvisor's performance. The Board also noted the Subadvisor's long-term performance record for similar accounts, as applicable.
The Board's decision to approve the Subadvisory Agreement was based on a number of determinations, including the following:
| (1) | the Subadvisor has extensive experience and demonstrated skills as a manager; | |
| (2) | the performance of the fund has generally been in line with or outperformed the historical performance of comparable funds and the fund's benchmark index; | |
| (3) | the subadvisory fee is reasonable in relation to the level and quality of services being provided; and | |
| (4) | noted that the subadvisory fees are paid by the Advisor not the fund. | |
| * * * | ||
37
38
Trustees James M. Oates, Chairperson Officers Andrew G. Arnott John J. Danello Francis V. Knox, Jr. Charles A. Rizzo Salvatore Schiavone | Investment advisor John Hancock Advisers, LLC Subadvisor Epoch Investment Partners, Inc. Principal distributor John Hancock Funds, LLC Custodian Citibank, N.A. Transfer agent John Hancock Signature Services, Inc. Legal counsel K&L Gates LLP |
*Member of the Audit Committee
†Non-Independent Trustee
#Effective 3-10-15
The fund's proxy voting policies and procedures, as well as the fund proxy voting record for the most recent twelve-month period ended June 30, are available free of charge on the Securities and Exchange Commission (SEC) website at sec.gov or on our website.
The fund's complete list of portfolio holdings, for the first and third fiscal quarters, is filed with the SEC on Form N-Q. The fund's Form N-Q is available on our website and the SEC's website, sec.gov, and can be reviewed and copied (for a fee) at the SEC's Public Reference Room in Washington, DC. Call 800-SEC-0330 to receive information on the operation of the SEC's Public Reference Room.
We make this information on your fund, as well as monthly portfolio holdings, and other fund details available on our website at jhinvestments.com or by calling 800-225-5291.
| You can also contact us: | |||
| 800-225-5291 jhinvestments.com | Regular mail: John Hancock Signature Services, Inc. | Express mail: John Hancock Signature Services, Inc. | |
39
Family of funds
DOMESTIC EQUITY FUNDS Balanced Blue Chip Growth Classic Value Disciplined Value Disciplined Value Mid Cap Equity Income Fundamental All Cap Core Fundamental Large Cap Core Fundamental Large Cap Value Large Cap Equity New Opportunities Select Growth Small Cap Equity Small Cap Value Small Company Strategic Growth U.S. Equity U.S. Global Leaders Growth Value Equity GLOBAL AND INTERNATIONAL EQUITY FUNDS Disciplined Value International Emerging Markets Emerging Markets Equity Global Equity Global Shareholder Yield Greater China Opportunities International Core International Growth International Small Company International Value Equity INCOME FUNDS Bond California Tax-Free Income Core High Yield Emerging Markets Debt Floating Rate Income Focused High Yield Global Income Government Income High Yield Municipal Bond Income | INCOME FUNDS (continued) Investment Grade Bond Money Market Short Duration Credit Opportunities Spectrum Income Strategic Income Opportunities Tax-Free Bond ALTERNATIVE AND SPECIALTY FUNDS Absolute Return Currency Alternative Asset Allocation Enduring Equity Financial Industries Global Absolute Return Strategies Global Conservative Absolute Return Natural Resources Redwood Regional Bank Seaport Technical Opportunities ASSET ALLOCATION Income Allocation Fund Lifestyle Aggressive Portfolio Lifestyle Balanced Portfolio Lifestyle Conservative Portfolio Lifestyle Growth Portfolio Lifestyle Moderate Portfolio Retirement Choices Portfolios (2010-2055) Retirement Living Portfolios (2010-2055) Retirement Living II Portfolios (2010-2055) CLOSED-END FUNDS Financial Opportunities Hedged Equity & Income Income Securities Trust Investors Trust Preferred Income Preferred Income II Preferred Income III Premium Dividend Tax-Advantaged Dividend Income Tax-Advantaged Global Shareholder Yield |
The fund's investment objectives, risks, charges, and expenses are included in the prospectus and should be considered carefully before investing. For a prospectus, contact your financial professional, call John Hancock Investments at 800-225-5291, or visit the fund's website at jhinvestments.com. Please read the prospectus carefully before investing or sending money.
John Hancock Investments
A trusted brand
John Hancock Investments is a premier asset manager representing
one of America's most trusted brands, with a heritage of financial
stewardship dating back to 1862. Helping our shareholders pursue
their financial goals is at the core of everything we do. It's why we
support the role of professional financial advice and operate with the
highest standards of conduct and integrity.
A better way to invest
We build funds based on investor needs, then search the world to find
proven portfolio teams with specialized expertise in those strategies.
As a manager of managers, we apply vigorous oversight to ensure that
they continue to meet our uncompromising standards and serve the
best interests of our shareholders.
Results for investors
Our unique approach to asset management enables us to provide
a diverse set of investments backed by some of the world's best
managers, along with strong risk-adjusted returns across asset classes.
| | John Hancock Funds, LLC n Member FINRA, SIPC 601 Congress Street n Boston, MA 02210-2805 800-225-5291 n jhinvestments.com | |
| This report is for the information of the shareholders of John Hancock Global Shareholder Yield Fund. It is not authorized for distribution to prospective investors unless preceded or accompanied by a prospectus. | ||
| MF250810 | 320SA 8/15 10/15 | |
ITEM 2. CODE OF ETHICS.
Not applicable at this time.
ITEM 3. AUDIT COMMITTEE FINANCIAL EXPERT.
Not applicable at this time.
ITEM 4. PRINCIPAL ACCOUNTANT FEES AND SERVICES.
Not applicable at this time.
ITEM 5. AUDIT COMMITTEE OF LISTED REGISTRANTS.
Not applicable at this time.
ITEM 6. SCHEDULE OF INVESTMENTS.
| (a) | This schedule is included as part of the Report to shareholders filed under Item 1 of this form. | |
| (b) | Not applicable. |
ITEM 7. DISCLOSURE OF PROXY VOTING POLICIES AND PROCEDURES FOR CLOSED-END MANAGEMENT INVESTMENT COMPANIES.
Not applicable.
ITEM 8. PORTFOLIO MANAGERS OF CLOSED-END MANAGEMENT INVESTMENT COMPANIES.
Not applicable.
ITEM 9. PURCHASES OF EQUITY SECURITIES BY CLOSED-END MANAGEMENT INVESTMENT COMPANY AND AFFILIATED PURCHASERS.
Not applicable.
ITEM 10. SUBMISSION OF MATTERS TO A VOTE OF SECURITY HOLDERS.
Not applicable.
ITEM 11. CONTROLS AND PROCEDURES.
(a) EVALUATION OF DISCLOSURE CONTROLS AND PROCEDURES. The registrant maintains disclosure controls and procedures that are designed to ensure that information required to be disclosed in this Form N-CSR is recorded, processed, summarized and reported within the time periods specified in the rules and forms of the Securities and Exchange Commission. Such disclosure and procedures include controls and procedures designed to ensure that such information is accumulated and communicated to the registrant’s management, including its principal executive officer and principal financial officer, as appropriate, to allow timely decisions regarding required disclosure.
Within 90 days prior to the filing date of this Form N-CSR, the registrant had carried out an evaluation, under the supervision and with the participation of the registrant’s management, including the registrant’s principal executive officer and the registrant’s principal financial officer, of the effectiveness of the design and operation of the registrant’s disclosure controls and
procedures relating to information required to be disclosed on Form N-CSR. Based on such evaluation, the registrant’s principal executive officer and principal financial officer concluded that the registrant’s disclosure controls and procedures are operating effectively to ensure that:
(i) information required to be disclosed in this Form N-CSR is recorded, processed, summarized and reported within the periods specified in the rules and forms of the Securities and Exchange Commission, and
(ii) information is accumulated and communicated to the registrant’s management, including its principal executive officer and principal financial officer, as appropriate, to allow timely decisions regarding required disclosure.
(b) CHANGE IN REGISTRANT’S INTERNAL CONTROL: Not applicable.
ITEM 12. EXHIBITS.
(a) The certification required by Rule 30a-2(a) under the 1940 Act.
(b) The certification required by Rule 30a-2(b) under the 1940 Act.
(c)(1) Submission of Matters to a Vote of Security Holders is attached. See attached “John Hancock Funds – Nominating, Governance and Administration Committee Charter.”
(c)(2) Contact person at the registrant.
SIGNATURES
Pursuant to the requirements of the Securities Exchange Act of 1934 and the Investment Company Act of 1940, the registrant has duly caused this report to be signed on its behalf by the undersigned, thereunto duly authorized.
John Hancock Funds III
By:
/s/ Andrew Arnott
------------------------------
Andrew Arnott
President
Date: October 23, 2015
Pursuant to the requirements of the Securities Exchange Act of 1934 and the Investment Company Act of 1940, this report has been signed below by the following persons on behalf of the registrant and in the capacities and on the dates indicated.
By:
/s/ Andrew Arnott
------------------------------
Andrew Arnott
President
Date: October 23, 2015
By:
/s/ Charles A. Rizzo
------------------------------
Charles A. Rizzo
Chief Financial Officer
Date: October 23, 2015