 Member Audio/ Web Conference July 28, 2011 Exhibit 99.1 |
 2 Cautionary Statement Regarding Forward- Looking Information and Adjusted Information Data set forth in these slides includes unaudited data. This document contains “forward-looking statements”- that is, statements related to future, not past, events. In this context, forward-looking statements often address our expected future business and financial performance, and often contain words such as “expect,” “anticipate,” “intend,” “plan,” “believe,” “seek,” or “will.” These uncertainties may cause our actual future results to be materially different than those expressed in our forward-looking statements. Forward looking statements by their nature address matters that are, to different degrees, uncertain. Actual performance or events may differ materially from that expected or implied in forward-looking statements because of many factors. Such factors may include but are not limited to, other than temporary impairment of investment securities, regulatory and accounting rule adjustments or requirements, changes in interest rates, changes in projected business volumes, changes in prepayment speeds on mortgage assets the cost of our funding, changes in our membership profile, the withdrawal of one or more large members, competitive pressures, shifts in demand for our products and consolidated obligations, changes in the System’s debt rating or the Bank’s rating, general economic conditions (including effects on among other things, mortgage-backed securities), applicable Bank policy requirements for retained earnings levels and the ratio of market value of equity to par value of Bank capital stock, the Bank's ability to maintain adequate capital levels (including meeting applicable regulatory capital requirements), business and capital plan adjustments and amendments, legislative and regulatory actions or approvals, interest-rate volatility, our ability to appropriately manage our cost of funds and the cost-effectiveness of our funding, hedging and asset-liability management activities. We undertake no obligation to revise or update publicly any forward-looking statements for any reason. This document also contains non-GAAP financial information. Because of the nature of (1) OTTI charges and (2) the gains (losses) on sales of OTTI securities, the Bank believes that adjusting net income for these items and evaluating results as adjusted (which the Bank defines as "core earnings") is important in order to understand how the Bank is performing with respect to its primary business operations and to provide meaningful comparisons to prior periods. Core earnings are considered to be a non-GAAP measurement. Management uses this information in its internal analysis of results and believes that this information may be informative to investors in gauging the quality of our financial performance, identifying trends in our results and providing meaningful period-to-period comparisons. |
 3 2011 2010 Over/ (Under) Net interest income before provision (benefit) for credit losses 75.2 $ 118.1 $ (42.9) $ Provision (benefit) for credit losses 4.0 (1.4) 5.4 Net OTTI losses (31.3) (138.3) 107.0 All other income (loss) 12.6 (8.2) 20.8 Other expenses 31.9 31.3 0.6 Income (loss) before assessments 20.6 (58.3) 78.9 AHP/REFCORP 5.4 - 5.4 GAAP net income (loss) 15.2 $ (58.3) $ 73.5 $ Net interest margin (bps) 29 38 (9) Six Months Ended June 30, Financial Highlights – Statement of Operations (in millions) |
 4 Quarterly Core Earnings 2011 2011 2nd Qtr 1st Qtr 4th Qtr 3rd Qtr 2nd Qtr GAAP net income (loss) 12.7 $ 2.5 $ 21.5 $ 45.1 $ (68.2) $ Adjustments: Net OTTI credit losses (10.8) (20.5) (13.1) (7.0) (110.7) Gains on sales of OTTI securities 7.3 - - 8.4 - AHP/REFCORP 0.9 5.4 6.9 11.6 13.8 Core earnings 15.3 $ 17.6 $ 27.7 $ 32.1 $ 28.7 $ 2010 (in millions) 4 |
 5 Financial Highlights – Selected Balance Sheet 2011 2010 Amount YTD - Average: Advances (par) 26,005 $ 37,148 $ (11,143) $ (30) % Total investments 21,392 18,945 2,447 13 Total assets 53,399 62,541 (9,142) (15) June 30, Dec 31, 2011 2010 Amount PLMBS (par) 4,275 $ 5,070 $ (795) $ (16) % Retained earnings 412 397 15 4 AOCI (132) (223) 91 41 Percent Over/(Under) Over/(Under) Six months ended June 30, Percent (in millions) (in millions) |
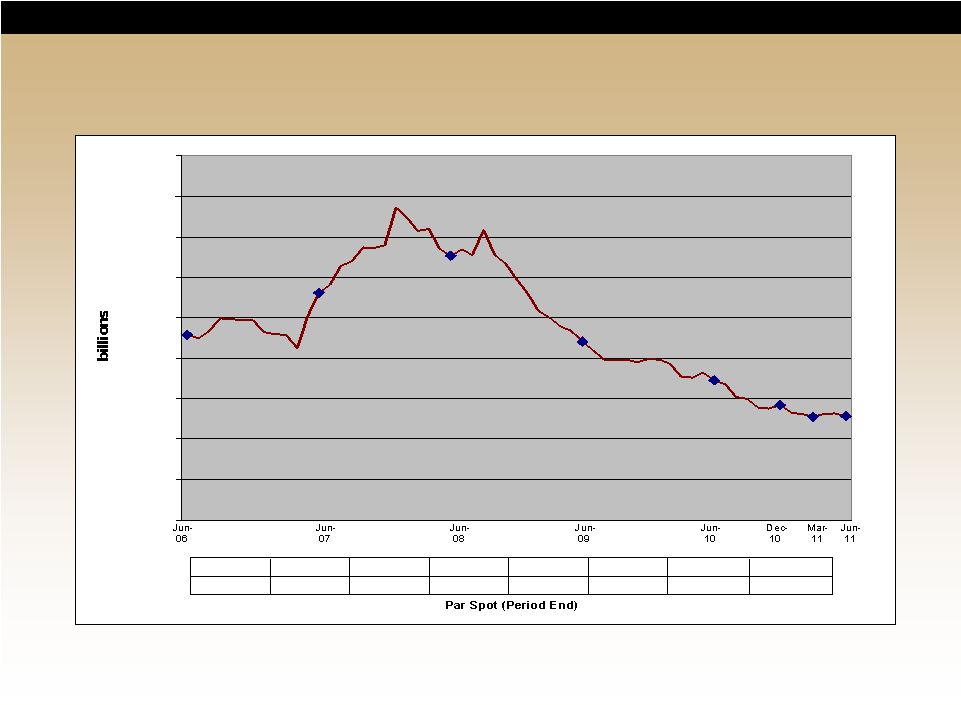 6 Advance Trend - 10.0 20.0 30.0 40.0 50.0 60.0 70.0 80.0 90.0 Jun-06 Jun-07 Jun-08 Jun-09 Jun-10 Dec-10 Mar-11 Jun-11 $45.8 $56.1 $65.4 $44.1 $34.5 $28.4 $25.5 $25.7 |
 7 Second quarter update process resulted in more pessimistic House Price Index (HPI) assumptions • Overall housing prices 1.4% lower than first quarter projections • HPI timeline to trough extended until first quarter 2012 Loss severity increased approximately 1 percentage point on Alt-A and 3 percentage points on Prime due to lengthening of foreclosure timelines OTTI – Second Quarter 2011 Assumption Changes Security Performance Overall portfolio performance measured by 60+ day delinquencies is stabilizing Certain Alt-A 2007 and 2006 vintage bonds continue to experience deterioration Credit enhancement levels continue to decline as losses are realized |
 8 Net OTTI Recognized At June 30, 2011, 51 securities had an OTTI credit loss recorded with current par of $2.4 billion. This represents 56% of the PLMBS portfolio No new CUSIPs were determined to be other-than-temporarily impaired in second quarter 2011 Actual cash losses of approximately $13 million life-to-date One Prime 2007 vintage OTTI security sold in April. Par balance $163 million, second largest PLMBS by par. Life-to-date $32 million in OTTI credit losses Total Credit Losses Par Balance 2nd Qtr 1st Qtr Full Year Life-to- Life-to-Date 6/30/11 2011 2011 2010 Date % of Par Private label MBS Prime 1,257 $ 3 $ 7 $ 109 $ 215 $ 17.1 % Alt-A 1,098 7 13 48 205 18.7 Subprime & HELOC 34 1 �� - 1 8 23.5 Total 2,389 $ 11 $ 20 $ 158 $ 428 $ 17.9 % (in millions) |
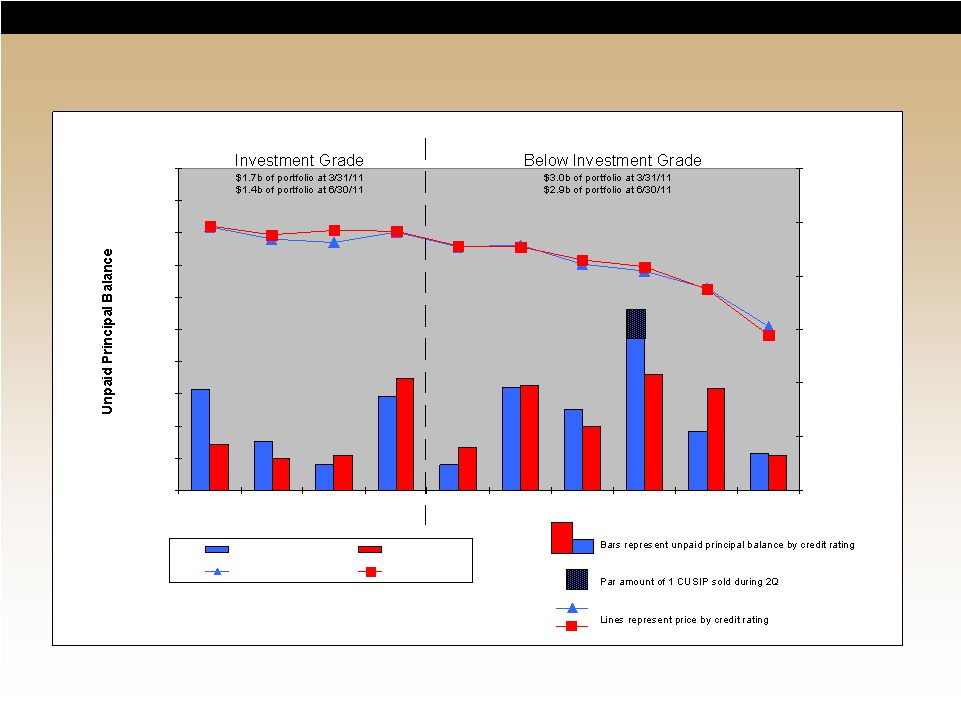 9 PLMBS Portfolio – Ratings and Price - 200 400 600 800 1,000 1,200 1,400 1,600 1,800 2,000 AAA AA A BBB BB B CCC CC C D Millions 0 20 40 60 80 100 120 Price 03/31/2011 06/30/2011 03/31/2011 06/30/2011 |
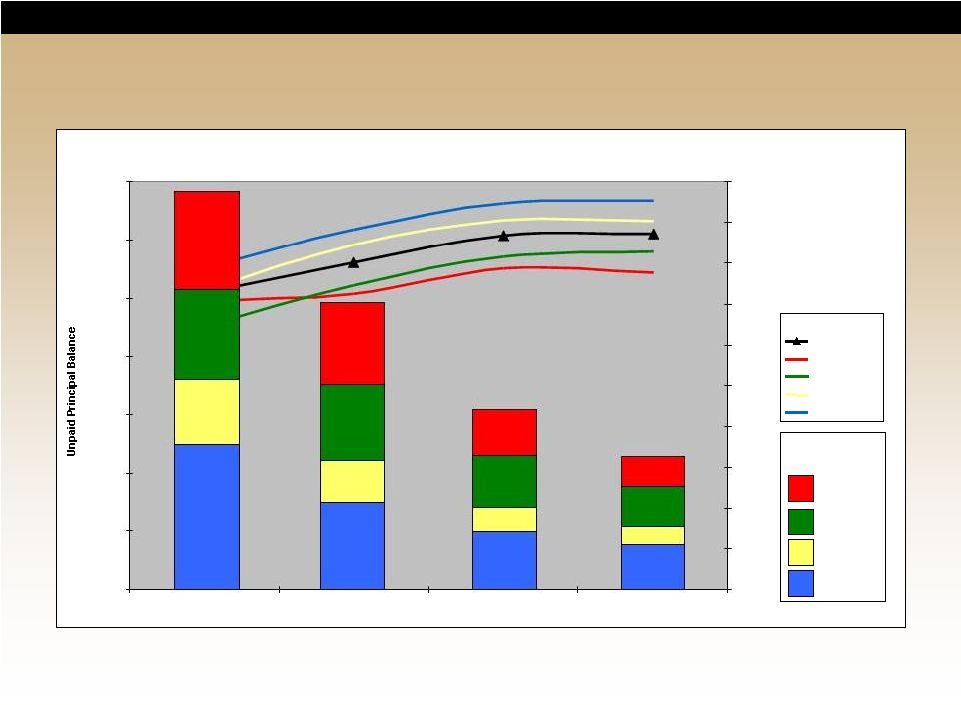 10 PLMBS - Par and Price By Vintage 2,000 3,000 4,000 5,000 6,000 7,000 8,000 9,000 12/31/2008 12/31/2009 12/31/2010 06/30/2011 0 10 20 30 40 50 60 70 80 90 100 Millions Price Total Portfolio 2007 2006 2005 2004 & Earlier 2004 & Earlier 2005 2006 2007 Bars represent proportion of unpaid principal balance Lines represent prices |
 11 Capital and Risk-Based Requirements June 30, March 31, Dec 31, 2011 2011 2010 Permanent capital (1) 4,108 $ 4,238 $ 4,418 $ Risk-based capital requirement: Credit risk capital 693 $ 777 $ 798 $ Market risk capital 398 484 448 Operations risk capital 327 379 374 Total risk-based capital requirement 1,418 $ 1,640 $ 1,620 $ Excess permanent capital 2,690 $ 2,598 $ 2,798 $ Percentage of requirement 290% 258% 273% Capital ratio (4% minimum) 7.9% 8.1% 8.3% Leverage ratio (5% minimum) 11.9% 12.2% 12.4% Market value/capital stock (MV/CS) 97.9% 97.3% 93.3% (in millions) (1) Permanent capital includes excess stock of $1,730, $1,905, and $1,897 at June 30, 2011, March 31, 2011 and December 31, 2010 respectively. First quarter 2011 capital classification “adequately capitalized.” However, our regulator has maintained concerns regarding our level of retained earnings and the poor quality of the PLMBS portfolio. |
 12 Partial excess capital stock repurchase • Effective date: July 28, 2011 • Payment date: July 29, 2011 No significant impact on: • Risk and capital adequacy measures • Members’ excess ownership percentage Decisions for any future repurchases and/or dividend payment will be based on the following: • MV/CS > 87.5% • Positive GAAP earnings which are sustainable for the foreseeable future • Increased retained earnings • Reduced negative AOCI levels • Adequate excess regulatory capital Excess Stock Repurchase |
 13 Questions? |