 Member Audio/Web Conference November 2, 2012 Exhibit 99.1 |
 Cautionary Statement Regarding Forward- Looking Information and Adjusted Information 2 Data set forth in these slides includes unaudited data. This document contains “forward-looking statements”- that is, statements related to future, not past, events. In this context, forward-looking statements often address our expected future business and financial performance, and often contain words such as “expect,” “anticipate,” “intend,” “plan,” “believe,” “seek,” or “will.” These uncertainties may cause our actual future results to be materially different than those expressed in our forward-looking statements. Forward looking statements by their nature address matters that are, to different degrees, uncertain. Actual performance or events may differ materially from that expected or implied in forward-looking statements because of many factors. Such factors may include, but are not limited to, other than temporary impairment of investment securities, regulatory and accounting rule adjustments or requirements, changes in interest rates, changes in projected business volumes, changes in prepayment speeds on mortgage assets, the cost of our funding, changes in our membership profile, the withdrawal of one or more large members, competitive pressures, shifts in demand for our products and consolidated obligations, changes in the System’s debt rating or the Bank’s rating, general economic conditions (including effects on among other things, mortgage-backed securities), applicable Bank policy requirements for retained earnings levels and the ratio of market value of equity to par value of Bank capital stock, the Bank’s ability to maintain adequate capital levels (including meeting applicable regulatory capital requirements), business and capital plan adjustments and amendments, legislative and regulatory actions or approvals, interest-rate volatility, our ability to appropriately manage our cost of funds and the cost-effectiveness of our funding, hedging and asset-liability management activities. We undertake no obligation to revise or update publicly any forward-looking statements for any reason. This document also contains non- GAAP financial information. Because of the nature of (1) OTTI charges and (2) gain on the sale of the Bank’s Lehman derivatives claim, the Bank believes that adjusting net income for these items and evaluating results as adjusted (which the Bank defines as “adjusted earnings”) is important in order to understand how the Bank is performing with respect to its primary business operations and to provide meaningful comparisons to prior periods. Adjusted earnings are considered to be a non-GAAP measurement. Management uses this information in its internal analysis of results and believes that this information may be informative to investors in gauging the quality of our financial performance, identifying trends in our results and providing meaningful period-to-period comparisons. |
 Financial Highlights – Statement of Income (in millions) 3 2012 2011 Over/ (Under) Net interest income 142.1 $ 112.7 $ 29.4 $ Provision for credit losses - 6.3 (6.3) Net OTTI credit losses (11.0) (37.5) 26.5 All other income 8.3 9.6 (1.3) Other expenses 52.7 44.2 8.5 Income before assessments 86.7 34.3 52.4 AHP/REFCORP 8.7 7.2 1.5 GAAP net income 78.0 $ 27.1 $ 50.9 $ Net interest margin (bps) 34 29 5 Nine months ended September 30, |
 Quarterly Adjusted Earnings 3Qtr 12 2Qtr 12 1Qtr 12 4Qtr 11 3Qtr 11 GAAP net income 33.0 $ 23.2 $ 21.8 $ 10.9 $ 11.9 $ Adjustments: Net OTTI credit losses (0.2) (3.6) (7.2) (7.6) (6.2) Sale of Lehman claim 1.9 AHP 0.4 0.7 0.7 0.4 Adjusted earnings 33.2 $ 26.4 $ 28.3 $ 17.8 $ 15.8 $ Prepayment fees on advances, net 2.2 $ 7.4 $ 4.7 $ 5.0 $ 1.4 $ (in millions) 4 |
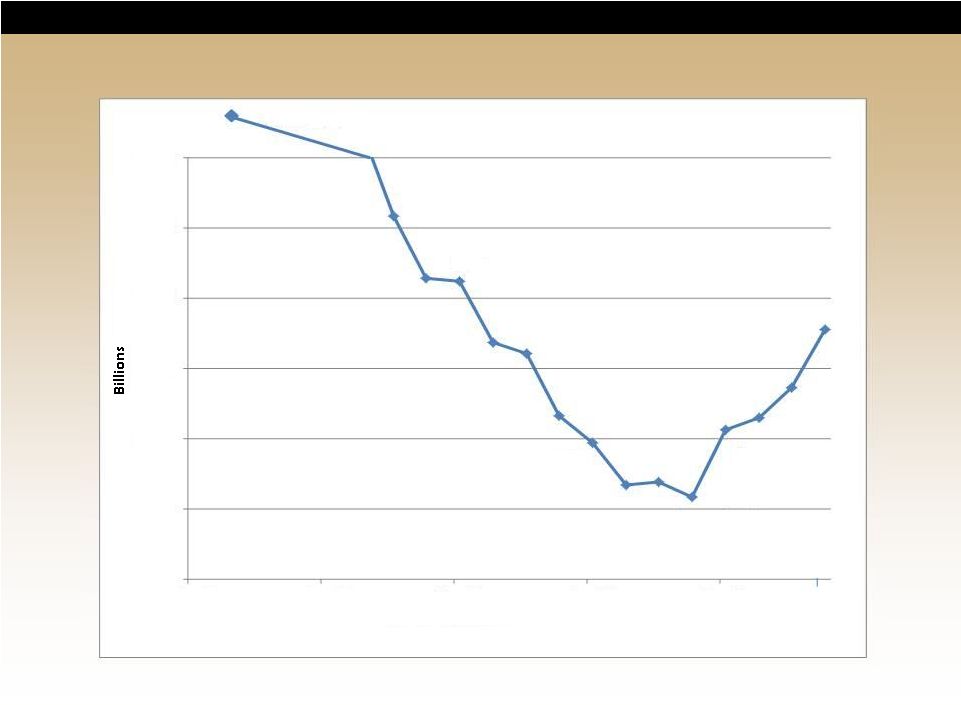 Quarterly Advance Trend 5 $41.2 $29.7 $25.8 $30.6 $37.7 $20.0 $25.0 $30.0 $35.0 $40.0 $45.0 $50.0 Dec-07 Dec-08 Dec-09 Dec-10 Dec-11 Period End Balances Sep-12 $73.5 Mar-08 Sep-11 |
 Financial Highlights – Selected Balance Sheet (in millions) (in millions) 6 2012 2011 Amount Average: Total assets 56,899 $ 52,512 $ 4,387 $ 8 % Advances 32,802 26,973 5,829 22 Total investments 19,810 20,792 (982) (5) Sept 30, Dec 31, 2012 2011 Amount Spot: Advances 37,739 $ 30,605 $ 7,134 $ 23 % PLMBS (par) 3,125 3,794 (669) (18) Retained earnings 511 435 76 17 Total AOCI 28 (162) 190 117 Percent Over/(Under) Over/(Under) Nine months ended September 30, Percent |
 • OTTI credit losses totaled $186 thousand in third quarter 2012 and $453 million life-to-date • No new CUSIPs were determined to be other-than-temporarily impaired in the third quarter of 2012 • Life-to-date, 51 securities have had an OTTI credit loss recorded with current par of $1.8 billion. This represents 58% of the PLMBS portfolio • Actual cash losses were approximately $43 million life-to-date • PLMBS portfolio performance has stabilized in terms of delinquencies • Credit enhancement levels continue to decline as foreclosures make their way through the system • Significant increases in cash flows caused an increase in yield on certain OTTI PLMBS resulting in $2.2 million and $21.6 million of interest income during the third quarter of 2012, and life-to-date, respectively OTTI 7 |
 Capital and Risk-Based Requirements Sept 30, June 30, Dec 31, 2012 2012 2011 Permanent capital (1) 3,791 $ 3,796 $ 3,871 $ Risk-based capital requirement: Credit risk capital 651 $ 648 $ 678 $ Market risk capital 129 105 139 Operations risk capital 234 225 245 Total risk-based capital requirement 1,014 $ 978 $ 1,062 $ Excess permanent capital 2,777 $ 2,818 $ 2,809 $ Percentage of requirement 374% 388% 365% Capital ratio (4% minimum) 6.3% 6.8% 7.4% Leverage ratio (5% minimum) 9.5% 10.2% 11.2% Market value/capital stock (MV/CS) 112.2% 105.7% 96.9% (in millions) (1) Permanent capital includes excess capital stock of $796, $1,037, and $1,294 at September 30, 2012, June 30, 2012 and December 31, 2011, respectively. Second quarter 2012 capital classification “adequately capitalized.” However, our regulator has maintained concerns regarding our level of retained earnings and the poor quality of the PLMBS portfolio. 8 |
 • Dividend declared based on third quarter 2012 results Equal to third quarter 2012 average three-month LIBOR (annual yield of 0.43%) Based on average stock outstanding for third quarter 2012 Payment date: October 31, 2012 • Partial excess capital stock repurchase Excess capital stock repurchased – approximately $300 million Effective date: October 30, 2012 Payment date: October 31, 2012 • No significant impact on: Risk and capital adequacy measures Members’ excess ownership percentage • Decisions for any future repurchases and/or dividend payments will be based on the following: Increased retained earnings PLMBS AOCI levels Adequate excess regulatory capital MV/CS > 90% Positive GAAP earnings which are sustainable for the foreseeable future Dividend Payment & Excess Stock Repurchase 9 |
 Member Audio/Web Conference November 2, 2012 |