Table of Contents
UNITED STATES
SECURITIES AND EXCHANGE COMMISSION
Washington, D.C. 20549
FORM N-CSR
CERTIFIED SHAREHOLDER REPORT OF
REGISTERED MANAGEMENT INVESTMENT COMPANIES
Investment Company Act file number 811-21780
MFS SERIES TRUST XII
(Exact name of registrant as specified in charter)
111 Huntington Avenue, Boston, Massachusetts 02199
(Address of principal executive offices) (Zip code)
Susan S. Newton
Massachusetts Financial Services Company
111 Huntington Avenue
Boston, Massachusetts 02199
(Name and address of agents for service)
Registrant’s telephone number, including area code: (617) 954-5000
Date of fiscal year end: April 30*
Date of reporting period: April 30, 2015
| * | This Form N-CSR pertains to the following series of the Registrant: MFS Lifetime Income Fund**, MFS Lifetime 2015 Fund, MFS Lifetime 2020 Fund, MFS Lifetime 2025 Fund, MFS Lifetime 2030 Fund, MFS Lifetime 2035 Fund, MFS Lifetime 2040 Fund, MFS Lifetime 2045 Fund, MFS Lifetime 2050 Fund and MFS Lifetime 2055 Fund. The remaining series of the Registrant, MFS Equity Opportunities Fund, has a fiscal year end of October 31. Effective June 20, 2014, MFS Lifetime 2010 Fund was acquired by MFS Lifetime Retirement Income Fund and terminated as a series of the Registrant. |
| ** | Effective August 28, 2014, MFS Lifetime Retirement Income Fund was redesignated MFS Lifetime Income Fund. |
Table of Contents
| ITEM 1. | REPORTS TO STOCKHOLDERS. |
Table of Contents
ANNUAL REPORT
April 30, 2015

MFS® LIFETIME® FUNDS
MFS® Lifetime® Income Fund (formerly MFS® Lifetime® Retirement Income Fund)
MFS® Lifetime® 2015 Fund
MFS® Lifetime® 2020 Fund
MFS® Lifetime® 2025 Fund
MFS® Lifetime® 2030 Fund
MFS® Lifetime® 2035 Fund
MFS® Lifetime® 2040 Fund
MFS® Lifetime® 2045 Fund
MFS® Lifetime® 2050 Fund
MFS® Lifetime® 2055 Fund

LTF-ANN
Table of Contents
MFS® LIFETIME® FUNDS
The report is prepared for the general information of shareholders. It is authorized for distribution to prospective investors only when preceded or accompanied by a current prospectus.
NOT FDIC INSURED Ÿ MAY LOSE VALUE Ÿ NO BANK GUARANTEE
Table of Contents

Dear Shareholders:
Global economic expansion slowed in early 2015 as the pace of U.S. growth decelerated sharply. Harsh weather hurt U.S. domestic demand, and a strong dollar made exports more expensive. Also contributing to weakness were a slow, tentative eurozone economic recovery, a steady downturn in China’s pace of growth and ongoing sluggishness in Japan.
Asian and European central banks are making concerted stimulus efforts. The European Central Bank’s quantitative easing program shows early signs of gaining traction. The People’s Bank of China has introduced a series of targeted monetary policy actions. The Bank of Japan remains focused on its target of 2% consumer price inflation.
With little sign of inflation, the U.S. Federal Reserve has remained accommodative in the face of these global headwinds, though interest rate increases are expected to begin later this year.
The world’s financial markets have become increasingly complex in recent years. Now more than ever, it is important to understand companies on a global basis. At MFS®, we believe our integrated research platform, collaborative culture, active risk management process and long-term focus give us a research advantage.
As investors, we aim to add long-term value. We believe this approach will serve you well as you work with your financial advisor to reach your investment objectives.
Respectfully,

Robert J. Manning
Chairman
MFS Investment Management
June 16, 2015
The opinions expressed in this letter are subject to change and may not be relied upon for investment advice. No forecasts can be guaranteed.
1
Table of Contents
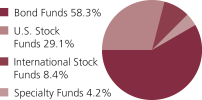
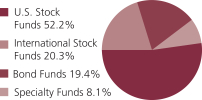
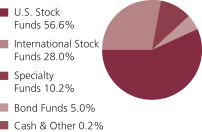
MFS Lifetime Income Fund
Portfolio target allocation
| Portfolio holdings | ||||
| MFS Limited Maturity Fund | 20.1% | |||
| MFS Total Return Bond Fund | 20.0% | |||
| MFS Inflation-Adjusted Bond Fund | 10.0% | |||
| MFS Government Securities Fund | 10.0% | |||
| MFS Global Bond Fund | 5.0% | |||
| MFS Value Fund | 4.0% | |||
| MFS Research Fund | 3.9% | |||
| MFS Growth Fund | 3.9% | |||
| MFS High Income Fund | 3.0% | |||
| MFS Research International Fund | 3.0% | |||
| MFS Mid Cap Value Fund | 3.0% | |||
| MFS Mid Cap Growth Fund | 2.9% | |||
| MFS Emerging Markets Debt Fund | 2.0% | |||
| MFS Absolute Return Fund | 2.0% | |||
| MFS Commodity Strategy Fund | 1.0% | |||
| MFS Emerging Markets Debt Local Currency Fund | 1.0% | |||
| MFS International Growth Fund | 1.0% | |||
| MFS International Value Fund | 1.0% | |||
| MFS Global Real Estate Fund | 1.0% | |||
| MFS New Discovery Value Fund | 1.0% | |||
| MFS New Discovery Fund | 1.0% | |||
| Cash & Other | 0.2% |
Portfolio actual allocation
Cash & Other can include cash, other assets less liabilities, and short-term securities.
Percentages are based on net assets as of 4/30/15.
The portfolio is actively managed and current holdings may be different.
2
Table of Contents
Portfolio Composition – continued
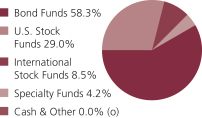
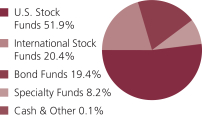
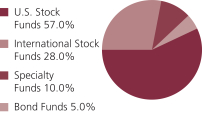
MFS Lifetime 2015 Fund
Portfolio target allocation
| Portfolio holdings | ||||
| MFS Total Return Bond Fund | 19.5% | |||
| MFS Limited Maturity Fund | 19.2% | |||
| MFS Government Securities Fund | 10.0% | |||
| MFS Inflation-Adjusted Bond Fund | 10.0% | |||
| MFS Global Bond Fund | 5.0% | |||
| MFS Value Fund | 4.1% | |||
| MFS Research Fund | 4.1% | |||
| MFS Growth Fund | 4.1% | |||
| MFS High Income Fund | 3.2% | |||
| MFS Research International Fund | 3.1% | |||
| MFS Mid Cap Value Fund | 3.1% | |||
| MFS Mid Cap Growth Fund | 3.0% | |||
| MFS Emerging Markets Debt Fund | 2.1% | |||
| MFS Absolute Return Fund | 2.0% | |||
| MFS Emerging Markets Debt Local Currency Fund | 1.1% | |||
| MFS International Growth Fund | 1.1% | |||
| MFS International Value Fund | 1.1% | |||
| MFS Commodity Strategy Fund | 1.0% | |||
| MFS Global Real Estate Fund | 1.0% | |||
| MFS New Discovery Value Fund | 1.0% | |||
| MFS New Discovery Fund | 1.0% | |||
| Cash & Other | 0.2% |
Portfolio actual allocation
Cash & Other can include cash, other assets less liabilities, and short-term securities.
Percentages are based on net assets as of 4/30/15.
The portfolio is actively managed and current holdings may be different.
3
Table of Contents
Portfolio Composition – continued
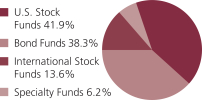
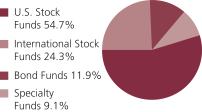
MFS Lifetime 2020 Fund
Portfolio target allocation
| Portfolio holdings | ||||
| MFS Total Return Bond Fund | 14.4% | |||
| MFS Government Securities Fund | 10.0% | |||
| MFS Inflation-Adjusted Bond Fund | 9.7% | |||
| MFS Limited Maturity Fund | 9.1% | |||
| MFS Value Fund | 6.2% | |||
| MFS Research Fund | 6.2% | |||
| MFS Growth Fund | 6.1% | |||
| MFS High Income Fund | 5.1% | |||
| MFS Global Bond Fund | 5.0% | |||
| MFS Mid Cap Value Fund | 4.3% | |||
| MFS Mid Cap Growth Fund | 4.2% | |||
| MFS Research International Fund | 4.2% | |||
| MFS Emerging Markets Debt Fund | 3.0% | |||
| MFS International Growth Fund | 2.1% | |||
| MFS International Value Fund | 2.1% | |||
| MFS Emerging Markets Debt Local Currency Fund | 2.0% | |||
| MFS Absolute Return Fund | 1.9% | |||
| MFS Commodity Strategy Fund | 1.2% | |||
| MFS Global Real Estate Fund | 1.1% | |||
| MFS New Discovery Value Fund | 1.0% | |||
| MFS New Discovery Fund | 1.0% | |||
| MFS International New Discovery Fund | 0.1% | |||
| Cash & Other (o) | 0.0% |
Portfolio actual allocation
| (o) | Less than 0.1%. |
Cash & Other can include cash, other assets less liabilities, and short-term securities.
Percentages are based on net assets as of 4/30/15.
The portfolio is actively managed and current holdings may be different.
4
Table of Contents
Portfolio Composition – continued
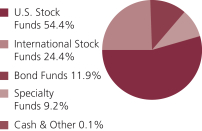
MFS Lifetime 2025 Fund
Portfolio target allocation
| Portfolio holdings | ||||
| MFS Government Securities Fund | 9.2% | |||
| MFS Value Fund | 8.2% | |||
| MFS Growth Fund | 8.2% | |||
| MFS Research Fund | 8.0% | |||
| MFS Total Return Bond Fund | 7.6% | |||
| MFS Mid Cap Value Fund | 7.1% | |||
| MFS Mid Cap Growth Fund | 7.1% | |||
| MFS Inflation-Adjusted Bond Fund | 6.8% | |||
| MFS Research International Fund | 6.1% | |||
| MFS High Income Fund | 5.1% | |||
| MFS Global Bond Fund | 4.8% | |||
| MFS Commodity Strategy Fund | 3.2% | |||
| MFS International Growth Fund | 3.2% | |||
| MFS International Value Fund | 3.1% | |||
| MFS Emerging Markets Debt Fund | 3.0% | |||
| MFS Global Real Estate Fund | 2.0% | |||
| MFS Emerging Markets Debt Local Currency Fund | 2.0% | |||
| MFS New Discovery Value Fund | 1.5% | |||
| MFS New Discovery Fund | 1.5% | |||
| MFS International New Discovery Fund | 1.1% | |||
| MFS Absolute Return Fund | 1.0% | |||
| MFS Emerging Markets Equity Fund | 0.1% | |||
| Cash & Other | 0.1% |
Portfolio actual allocation
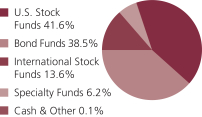
Cash & Other can include cash, other assets less liabilities, and short-term securities.
Percentages are based on net assets as of 4/30/15.
The portfolio is actively managed and current holdings may be different.
5
Table of Contents
Portfolio Composition – continued
MFS Lifetime 2030 Fund
Portfolio target allocation
| Portfolio holdings | ||||
| MFS Value Fund | 11.0% | |||
| MFS Growth Fund | 11.0% | |||
| MFS Mid Cap Value Fund | 9.0% | |||
| MFS Mid Cap Growth Fund | 9.0% | |||
| MFS Research Fund | 7.9% | |||
| MFS Research International Fund | 7.1% | |||
| MFS International Growth Fund | 5.1% | |||
| MFS International Value Fund | 5.1% | |||
| MFS Inflation-Adjusted Bond Fund | 4.9% | |||
| MFS High Income Fund | 4.8% | |||
| MFS Commodity Strategy Fund | 4.1% | |||
| MFS Global Real Estate Fund | 3.1% | |||
| MFS Total Return Bond Fund | 3.0% | |||
| MFS Emerging Markets Debt Fund | 2.9% | |||
| MFS International New Discovery Fund | 2.1% | |||
| MFS New Discovery Value Fund | 2.0% | |||
| MFS New Discovery Fund | 2.0% | |||
| MFS Emerging Markets Debt Local Currency Fund | 1.9% | |||
| MFS Global Bond Fund | 1.9% | |||
| MFS Emerging Markets Equity Fund | 1.0% | |||
| MFS Absolute Return Fund | 1.0% | |||
| Cash & Other | 0.1% |
Portfolio actual allocation
Cash & Other can include cash, other assets less liabilities, and short-term securities.
Percentages are based on net assets as of 4/30/15.
The portfolio is actively managed and current holdings may be different.
6
Table of Contents
Portfolio Composition – continued
MFS Lifetime 2035 Fund
Portfolio target allocation
| Portfolio holdings | ||||
| MFS Value Fund | 11.5% | |||
| MFS Growth Fund | 11.4% | |||
| MFS Mid Cap Value Fund | 9.5% | |||
| MFS Mid Cap Growth Fund | 9.5% | |||
| MFS Research Fund | 8.0% | |||
| MFS Research International Fund | 7.6% | |||
| MFS International Growth Fund | 6.1% | |||
| MFS International Value Fund | 6.1% | |||
| MFS Commodity Strategy Fund | 4.6% | |||
| MFS Global Real Estate Fund | 4.1% | |||
| MFS Inflation-Adjusted Bond Fund | 3.7% | |||
| MFS International New Discovery Fund | 3.1% | |||
| MFS Total Return Bond Fund | 2.7% | |||
| MFS High Income Fund | 2.3% | |||
| MFS New Discovery Value Fund | 2.3% | |||
| MFS New Discovery Fund | 2.2% | |||
| MFS Emerging Markets Equity Fund | 1.5% | |||
| MFS Emerging Markets Debt Fund | 1.4% | |||
| MFS Emerging Markets Debt Local Currency Fund | 0.9% | |||
| MFS Global Bond Fund | 0.9% | |||
| MFS Absolute Return Fund | 0.5% | |||
| Cash & Other | 0.1% |
Portfolio actual allocation
Cash & Other can include cash, other assets less liabilities, and short-term securities.
Percentages are based on net assets as of 4/30/15.
The portfolio is actively managed and current holdings may be different.
7
Table of Contents
Portfolio Composition – continued
MFS Lifetime 2040 Fund
Portfolio target allocation

| Portfolio holdings | ||||
| MFS Value Fund | 12.0% | |||
| MFS Growth Fund | 11.9% | |||
| MFS Mid Cap Value Fund | 9.9% | |||
| MFS Mid Cap Growth Fund | 9.9% | |||
| MFS Research International Fund | 8.1% | |||
| MFS Research Fund | 8.0% | |||
| MFS International Growth Fund | 7.1% | |||
| MFS International Value Fund | 7.0% | |||
| MFS Commodity Strategy Fund | 5.1% | |||
| MFS Global Real Estate Fund | 5.0% | |||
| MFS International New Discovery Fund | 4.0% | |||
| MFS Inflation-Adjusted Bond Fund | 2.5% | |||
| MFS Total Return Bond Fund | 2.5% | |||
| MFS New Discovery Value Fund | 2.5% | |||
| MFS New Discovery Fund | 2.4% | |||
| MFS Emerging Markets Equity Fund | 2.0% | |||
| Cash & Other | 0.1% |
Portfolio actual allocation

Cash & Other can include cash, other assets less liabilities, and short-term securities.
Percentages are based on net assets as of 4/30/15.
The portfolio is actively managed and current holdings may be different.
8
Table of Contents
Portfolio Composition – continued
MFS Lifetime 2045 Fund
Portfolio target allocation

| Portfolio holdings | ||||
| MFS Value Fund | 12.0% | |||
| MFS Growth Fund | 11.9% | |||
| MFS Mid Cap Value Fund | 9.9% | |||
| MFS Mid Cap Growth Fund | 9.9% | |||
| MFS Research International Fund | 8.0% | |||
| MFS Research Fund | 7.9% | |||
| MFS International Growth Fund | 7.0% | |||
| MFS International Value Fund | 7.0% | |||
| MFS Commodity Strategy Fund | 5.2% | |||
| MFS Global Real Estate Fund | 5.0% | |||
| MFS International New Discovery Fund | 4.0% | |||
| MFS Inflation-Adjusted Bond Fund | 2.5% | |||
| MFS Total Return Bond Fund | 2.5% | |||
| MFS New Discovery Value Fund | 2.5% | |||
| MFS New Discovery Fund | 2.5% | |||
| MFS Emerging Markets Equity Fund | 2.0% | |||
| Cash & Other | 0.2% |
Portfolio actual allocation
Cash & Other can include cash, other assets less liabilities, and short-term securities.
Percentages are based on net assets as of 4/30/15.
The portfolio is actively managed and current holdings may be different.
9
Table of Contents
Portfolio Composition – continued
MFS Lifetime 2050 Fund
Portfolio target allocation

| Portfolio holdings | ||||
| MFS Value Fund | 11.9% | |||
| MFS Growth Fund | 11.9% | |||
| MFS Mid Cap Value Fund | 10.0% | |||
| MFS Mid Cap Growth Fund | 9.9% | |||
| MFS Research International Fund | 8.0% | |||
| MFS Research Fund | 8.0% | |||
| MFS International Growth Fund | 7.0% | |||
| MFS International Value Fund | 7.0% | |||
| MFS Commodity Strategy Fund | 5.1% | |||
| MFS Global Real Estate Fund | 5.0% | |||
| MFS International New Discovery Fund | 4.0% | |||
| MFS Total Return Bond Fund | 2.5% | |||
| MFS Inflation-Adjusted Bond Fund | 2.5% | |||
| MFS New Discovery Value Fund | 2.5% | |||
| MFS New Discovery Fund | 2.5% | |||
| MFS Emerging Markets Equity Fund | 2.0% | |||
| Cash & Other | 0.2% |
Portfolio actual allocation

Cash & Other can include cash, other assets less liabilities, and short-term securities.
Percentages are based on net assets as of 4/30/15.
The portfolio is actively managed and current holdings may be different.
10
Table of Contents
Portfolio Composition – continued
MFS Lifetime 2055 Fund
Portfolio target allocation
| Portfolio holdings | ||||
| MFS Value Fund | 11.8% | |||
| MFS Growth Fund | 11.8% | |||
| MFS Mid Cap Value Fund | 9.9% | |||
| MFS Mid Cap Growth Fund | 9.9% | |||
| MFS Research International Fund | 7.9% | |||
| MFS Research Fund | 7.9% | |||
| MFS International Growth Fund | 6.9% | |||
| MFS International Value Fund | 6.9% | |||
| MFS Commodity Strategy Fund | 5.1% | |||
| MFS Global Real Estate Fund | 4.9% | |||
| MFS International New Discovery Fund | 4.0% | |||
| MFS Total Return Bond Fund | 2.5% | |||
| MFS Inflation-Adjusted Bond Fund | 2.5% | |||
| MFS New Discovery Value Fund | 2.5% | |||
| MFS New Discovery Fund | 2.4% | |||
| MFS Emerging Markets Equity Fund | 2.0% | |||
| Cash & Other | 1.1% |
Portfolio actual allocation
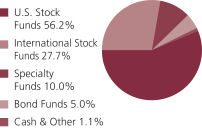
Cash & Other can include cash, other assets less liabilities, and short-term securities.
Percentages are based on net assets as of 4/30/15.
The portfolio is actively managed and current holdings may be different.
11
Table of Contents
MFS Lifetime Funds
Market Environment
A generally risk-friendly environment persisted from early in the period until mid-2014. While geopolitical tensions flared in the Middle East and Russia/Ukraine, any market setbacks were short-lived as improving economic growth in the US, coupled with prospects for easier monetary policy in regions with slowing growth, such as Japan, Europe and China, supported risk assets. For example, the European Central Bank (“ECB”) cut policy interest rates into negative territory and expectations were high for additional rate cuts and the announcement of non-conventional easing measures. Similarly, toward the middle of the period the Bank of Japan surprised markets with fresh stimulus measures given lackluster growth trends. The related decline in developed market government bond yields and credit spreads were also supportive for equity markets.
A dominant trend in the second half of the period was the ongoing rise in US equities alongside a decline in US bond yields. The uptrend in US corporate margins and profits continued throughout the second half of 2014, but a rising dollar and a sharp decline in commodity prices, particularly crude oil prices, negatively impacted credit markets, particularly US high yield and emerging market debt. The higher weightings of oil and gas credits in these asset classes resulted in widening spreads and increased volatility. Toward the end of the period, declining inflation and inflation expectations caused a mini-wave of global easing highlighted by the ECB’s decision to commence a potentially open-ended phase of quantitative easing (“QE”), supporting risk assets as well as government bond prices, while the US dollar continues to benefit from the perception that Federal Reserve (“Fed”) tightening is likely to occur later in 2015.
MFS Lifetime Income Fund
Summary of Results
For the twelve months ended April 30, 2015, Class A shares of the MFS Lifetime Income Fund (“fund”) provided a total return of 3.66%, at net asset value. This compares with a return of 4.46% for the fund’s benchmark, the Barclays U.S. Aggregate Bond Index. The fund’s other benchmark, the MFS Lifetime Income Fund Blended Index (formerly MFS Lifetime Retirement Income Fund Blended Index) (“Blended Index”), generated a return of 5.82%. The Blended Index reflects the blended returns of equity and fixed income market indices, with percentage allocations to each index designed to resemble the equity and fixed income allocations of the fund. The market indices and related percentage allocations used to compile the Blended Index are set forth in the Performance Summary.
Factors Affecting Performance
During the reporting period, equity markets generally outperformed bond markets. However, within the US equity component of the portfolio, allocations to value and small/mid cap funds, such as the MFS Value Fund, MFS Mid Cap Value Fund and MFS New Discovery Fund, detracted from relative performance. Conversely, the fund’s investment in the MFS Mid Cap Growth Fund supported relative results as growth outperformed value in the US. On an absolute basis, international equities lagged US equities. Selection within international funds, particularly the MFS International Value Fund, was a positive contributor to relative performance.
Within the fixed income segment of the portfolio, the MFS Limited Maturity Fund, MFS Global Bond Fund and MFS Inflation-Adjusted Bond Fund detracted from relative performance as global and short duration bond funds underperformed the more interest rate sensitive Barclays U.S. Aggregate Bond Index. In addition, the majority of the underlying funds within this segment also underperformed their respective benchmarks. On the positive side, the fund’s allocation to the MFS Emerging Markets Debt Fund contributed to relative performance over the reporting period.
Within the specialty funds segment, the MFS Commodity Strategy Fund held back relative performance while the MFS Global Real Estate Fund contributed to relative results.
MFS Lifetime 2015 Fund
Summary of Results
For the twelve months ended April 30, 2015, Class A shares of the MFS Lifetime 2015 Fund (“fund”) provided a total return of 3.92%, at net asset value. This compares with a return of 4.46% for the fund’s benchmark, the Barclays U.S. Aggregate Bond Index. The fund’s other benchmark, the MFS Lifetime 2015 Fund Blended Index (“Blended Index”), generated a return of 5.94%. The Blended Index reflects the blended returns of equity and fixed income market indices, with percentage allocations to each index designed to resemble the equity and fixed income allocations of the fund. The market indices and related percentage allocations used to compile the Blended Index are set forth in the Performance Summary.
Factors Affecting Performance
During the reporting period, equity markets generally outperformed bond markets. However, within the US equity component of the portfolio, allocations to value and small/mid cap funds, such as the MFS Value Fund, MFS Mid Cap Value Fund and MFS New Discovery Fund, detracted from relative performance. Conversely, the fund’s investment in the MFS Mid Cap Growth Fund supported relative results as growth outperformed value in the US. On an absolute basis, international equities lagged US equities. Selection within international funds, particularly the MFS International Value Fund, was a positive contributor to relative performance.
12
Table of Contents
Management Review – continued
Within the fixed income segment of the portfolio, the MFS Limited Maturity Fund, MFS Global Bond Fund and MFS Inflation-Adjusted Bond Fund detracted from relative performance as global and short duration bond funds underperformed the more interest rate sensitive Barclays U.S. Aggregate Bond Index. In addition, the majority of the underlying funds within this segment also underperformed their respective benchmarks. On the positive side, the fund’s allocation to the MFS Emerging Markets Debt Fund contributed to relative performance over the reporting period.
Within the specialty funds segment, the MFS Commodity Strategy Fund held back relative performance while the MFS Global Real Estate Fund contributed to relative results.
MFS Lifetime 2020 Fund
Summary of Results
For the twelve months ended April 30, 2015, Class A shares of the MFS Lifetime 2020 Fund (“fund”) provided a total return of 4.76%, at net asset value. This compares with a return of 12.98% for the fund’s benchmark, the Standard & Poor’s 500 Stock Index. The fund’s other benchmark, the MFS Lifetime 2020 Fund Blended Index (“Blended Index”), generated a return of 6.49%. The Blended Index reflects the blended returns of equity and fixed income market indices, with percentage allocations to each index designed to resemble the equity and fixed income allocations of the fund. The market indices and related percentage allocations used to compile the Blended Index are set forth in the Performance Summary.
Factors Affecting Performance
During the reporting period, equity markets generally outperformed bond markets. However, within the US equity component of the portfolio, allocations to value and small/mid cap funds, such as the MFS Value Fund, MFS Mid Cap Value Fund and MFS New Discovery Fund, detracted from relative performance. Conversely, the fund’s investment in the MFS Mid Cap Growth Fund supported relative results as growth outperformed value in the US. On an absolute basis, international equities lagged US equities. Selection within international funds, particularly the MFS International Value Fund, was a positive contributor to relative performance.
Within the fixed income segment of the portfolio, the MFS Global Bond Fund, MFS Limited Maturity Fund and MFS Inflation-Adjusted Bond Fund detracted from relative performance as global and short duration bond funds underperformed the more interest rate sensitive Barclays U.S. Aggregate Bond Index. In addition, the majority of the underlying funds within this segment underperformed their respective benchmarks.
Within the specialty funds segment, the MFS Commodity Strategy Fund held back relative performance while the MFS Global Real Estate Fund contributed to relative results.
MFS Lifetime 2025 Fund
Summary of Results
For the twelve months ended April 30, 2015, Class A shares of the MFS Lifetime 2025 Fund (“fund”) provided a total return of 5.64%, at net asset value. This compares with a return of 12.98% for the fund’s benchmark, the Standard & Poor’s 500 Stock Index. The fund’s other benchmark, the MFS Lifetime 2025 Fund Blended Index (“Blended Index”), generated a return of 6.88%. The Blended Index reflects the blended returns of equity and fixed income market indices, with percentage allocations to each index designed to resemble the equity and fixed income allocations of the fund. The market indices and related percentage allocations used to compile the Blended Index are set forth in the Performance Summary.
Factors Affecting Performance
During the reporting period, equity markets generally outperformed bond markets. However, within the US equity component of the portfolio, allocations to value and small/mid cap funds, such as the MFS Value Fund, MFS Mid Cap Value Fund and MFS New Discovery Fund, detracted from relative performance. Conversely, the fund’s investment in the MFS Mid Cap Growth Fund supported relative results as growth outperformed value in the US. On an absolute basis, international equities lagged US equities. Selection within international funds, particularly the MFS International Value Fund, was a positive contributor to relative performance.
Within the fixed income segment of the portfolio, the MFS Global Bond Fund detracted from relative performance as global bond funds underperformed the more interest rate sensitive Barclays U.S. Aggregate Bond Index. In addition, the majority of the underlying funds within this segment underperformed their respective benchmarks.
Within the specialty funds segment, the MFS Commodity Strategy Fund held back relative performance while the MFS Global Real Estate Fund contributed to relative results.
MFS Lifetime 2030 Fund
Summary of Results
For the twelve months ended April 30, 2015, Class A shares of the MFS Lifetime 2030 Fund (“fund”) provided a total return of 6.37%, at net asset value. This compares with a return of 12.98% for the fund’s benchmark, the Standard & Poor’s 500 Stock Index. The fund’s other benchmark, the MFS Lifetime 2030 Fund Blended Index (“Blended Index”), generated a return of 7.26%. The
13
Table of Contents
Management Review – continued
Blended Index reflects the blended returns of equity and fixed income market indices, with percentage allocations to each index designed to resemble the equity and fixed income allocations of the fund. The market indices and related percentage allocations used to compile the Blended Index are set forth in the Performance Summary.
Factors Affecting Performance
During the reporting period, equity markets generally outperformed bond markets. However, within the US equity component of the portfolio, allocations to value and small/mid cap funds, such as the MFS Value Fund, MFS Mid Cap Value Fund and MFS New Discovery Fund, detracted from relative performance. Conversely, the fund’s investment in the MFS Mid Cap Growth Fund supported relative results as growth outperformed value in the US. On an absolute basis, international equities lagged US equities. Selection within international funds, particularly the MFS International Value Fund, was a positive contributor to relative performance.
Within the fixed income segment of the portfolio, the MFS Global Bond Fund detracted from relative performance as global bond funds underperformed the more interest rate sensitive Barclays U.S. Aggregate Bond Index. In addition, the majority of the underlying funds within this segment underperformed their respective benchmarks.
Within the specialty funds segment, the MFS Commodity Strategy Fund held back relative performance while the MFS Global Real Estate Fund contributed to relative results.
MFS Lifetime 2035 Fund
Summary of Results
For the twelve months ended April 30, 2015, Class A shares of the MFS Lifetime 2035 Fund (“fund”) provided a total return of 6.72%, at net asset value. This compares with a return of 12.98% for the fund’s benchmark, the Standard & Poor’s 500 Stock Index. The fund’s other benchmark, the MFS Lifetime 2035 Fund Blended Index (“Blended Index”), generated a return of 7.26%. The Blended Index reflects the blended returns of equity and fixed income market indices, with percentage allocations to each index designed to resemble the equity and fixed income allocations of the fund. The market indices and related percentage allocations used to compile the Blended Index are set forth in the Performance Summary.
Factors Affecting Performance
During the reporting period, equity markets generally outperformed bond markets. However, within the US equity component of the portfolio, allocations to value and small/mid cap funds, such as the MFS Value Fund, MFS Mid Cap Value Fund and MFS New Discovery Fund, detracted from relative performance. Conversely, the fund’s investment in the MFS Mid Cap Growth Fund supported relative results as growth outperformed value in the US. On an absolute basis, international equities lagged US equities. Selection within international funds, particularly the MFS International Value Fund, was a positive contributor to relative performance.
Within the fixed income segment of the portfolio, the MFS Global Bond Fund detracted from relative performance as global bond funds underperformed the more interest rate sensitive Barclays U.S. Aggregate Bond Index. In addition, the majority of the underlying funds within this segment underperformed their respective benchmarks.
Within the specialty funds segment, the MFS Commodity Strategy Fund held back relative performance while the MFS Global Real Estate Fund contributed to relative results.
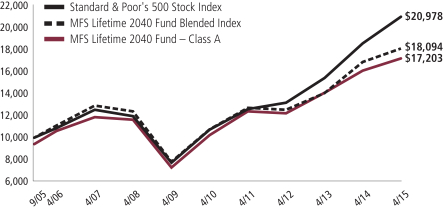
MFS Lifetime 2040 Fund
Summary of Results
For the twelve months ended April 30, 2015, Class A shares of the MFS Lifetime 2040 Fund (“fund”) provided a total return of 6.97%, at net asset value. This compares with a return of 12.98% for the fund’s benchmark, the Standard & Poor’s 500 Stock Index. The fund’s other benchmark, the MFS Lifetime 2040 Fund Blended Index (“Blended Index”), generated a return of 7.28%. The Blended Index reflects the blended returns of equity and fixed income market indices, with percentage allocations to each index designed to resemble the equity and fixed income allocations of the fund. The market indices and related percentage allocations used to compile the Blended Index are set forth in the Performance Summary.
Factors Affecting Performance
During the reporting period, equity markets generally outperformed bond markets. However, within the US equity component of the portfolio, allocations to value and small/mid cap funds, such as the MFS Value Fund, MFS Mid Cap Value Fund and MFS New Discovery Fund, detracted from relative performance. Conversely, the fund’s investment in the MFS Mid Cap Growth Fund supported relative results as growth outperformed value in the US. On an absolute basis, international equities lagged US equities. Selection within international funds, particularly the MFS International Value Fund, was a positive contributor to relative performance.
Within the fixed income segment of the portfolio, the MFS Inflation-Adjusted Bond Fund detracted from relative performance as this fund underperformed the Barclays U.S. Aggregate Bond Index.
Within the specialty funds segment, the MFS Commodity Strategy Fund held back relative performance while the MFS Global Real Estate Fund contributed to relative results.
14
Table of Contents
Management Review – continued
MFS Lifetime 2045 Fund
Summary of Results
For the twelve months ended April 30, 2015, Class A shares of the MFS Lifetime 2045 Fund (“fund”) provided a total return of 6.95%, at net asset value. This compares with a return of 12.98% for the fund’s benchmark, the Standard & Poor’s 500 Stock Index. The fund’s other benchmark, the MFS Lifetime 2045 Fund Blended Index (“Blended Index”), generated a return of 7.28%. The Blended Index reflects the blended returns of equity and fixed income market indices, with percentage allocations to each index designed to resemble the equity and fixed income allocations of the fund. The market indices and related percentage allocations used to compile the Blended Index are set forth in the Performance Summary.
Factors Affecting Performance
During the reporting period, equity markets generally outperformed bond markets. However, within the US equity component of the portfolio, allocations to value and small/mid cap funds, such as the MFS Value Fund, MFS Mid Cap Value Fund and MFS New Discovery Fund, detracted from relative performance. Conversely, the fund’s investment in the MFS Mid Cap Growth Fund supported relative results as growth outperformed value in the US. On an absolute basis, international equities lagged US equities. Selection within international funds, particularly the MFS International Value Fund, was a positive contributor to relative performance.
Within the fixed income segment of the portfolio, the MFS Inflation-Adjusted Bond Fund detracted from relative performance as this fund underperformed the Barclays U.S. Aggregate Bond Index.
Within the specialty funds segment, the MFS Commodity Strategy Fund held back relative performance while the MFS Global Real Estate Fund contributed to relative results.
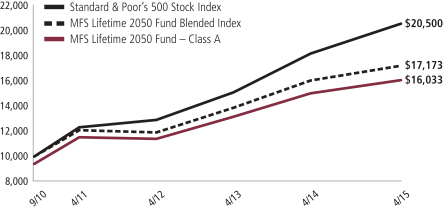
MFS Lifetime 2050 Fund
Summary of Results
For the twelve months ended April 30, 2015, Class A shares of the MFS Lifetime 2050 Fund (“fund”) provided a total return of 6.92%, at net asset value. This compares with a return of 12.98% for the fund’s benchmark, the Standard & Poor’s 500 Stock Index. The fund’s other benchmark, the MFS Lifetime 2050 Fund Blended Index (“Blended Index”), generated a return of 7.28%. The Blended Index reflects the blended returns of equity and fixed income market indices, with percentage allocations to each index designed to resemble the equity and fixed income allocations of the fund. The market indices and related percentage allocations used to compile the Blended Index are set forth in the Performance Summary.
Factors Affecting Performance
During the reporting period, equity markets generally outperformed bond markets. However, within the US equity component of the portfolio, allocations to value and small/mid cap funds, such as the MFS Value Fund, MFS Mid Cap Value Fund and MFS New Discovery Fund, detracted from relative performance. Conversely, the fund’s investment in the MFS Mid Cap Growth Fund supported relative results as growth outperformed value in the US. On an absolute basis, international equities lagged US equities. Selection within international funds, particularly the MFS International Value Fund, was a positive contributor to relative performance.
Within the fixed income segment of the portfolio, the MFS Inflation-Adjusted Bond Fund detracted from relative performance as this fund underperformed the Barclays U.S. Aggregate Bond Index.
Within the specialty funds segment, the MFS Commodity Strategy Fund held back relative performance while the MFS Global Real Estate Fund contributed to relative results.
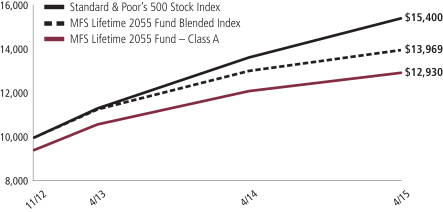
MFS Lifetime 2055 Fund
Summary of Results
For the twelve months ended April 30, 2015, Class A shares of the MFS Lifetime 2055 Fund (“fund”) provided a total return of 6.90%, at net asset value. This compares with a return of 12.98% for the fund’s benchmark, the Standard & Poor’s 500 Stock Index. The fund’s other benchmark, the MFS Lifetime 2055 Fund Blended Index (“Blended Index”), generated a return of 7.28%. The Blended Index reflects the blended returns of equity and fixed income market indices, with percentage allocations to each index designed to resemble the equity and fixed income allocations of the fund. The market indices and related percentage allocations used to compile the Blended Index are set forth in the Performance Summary.
Factors Affecting Performance
During the reporting period, equity markets generally outperformed bond markets. However, within the US equity component of the portfolio, allocations to value and small/mid cap funds, such as the MFS Value Fund, MFS Mid Cap Value Fund and MFS New Discovery Fund, detracted from relative performance. Conversely, the fund’s investment in the MFS Mid Cap Growth Fund supported relative results as growth outperformed value in the US. On an absolute basis, international equities lagged US equities. Selection within international funds, particularly the MFS International Value Fund, was a positive contributor to relative performance.
15
Table of Contents
Management Review – continued
Within the fixed income segment of the portfolio, the MFS Inflation-Adjusted Bond Fund detracted from relative performance as this fund underperformed the Barclays U.S. Aggregate Bond Index.
Within the specialty funds segment, the MFS Commodity Strategy Fund held back relative performance while the MFS Global Real Estate Fund contributed to relative results.
Respectfully,
Joseph Flaherty
Portfolio Manager
Note to Shareholders: Effective August 28, 2014, MFS Lifetime Retirement Income Fund changed its name to MFS Lifetime Income Fund.
The views expressed in this report are those of the portfolio manager only through the end of the period of the report as stated on the cover and do not necessarily reflect the views of MFS or any other person in the MFS organization. These views are subject to change at any time based on market or other conditions, and MFS disclaims any responsibility to update such views. These views may not be relied upon as investment advice or an indication of trading intent on behalf of any MFS portfolio. References to specific securities are not recommendations of such securities, and may not be representative of any MFS portfolio’s current or future investments.
16
Table of Contents
PERFORMANCE SUMMARY THROUGH 4/30/15
The following charts illustrate a representative class of each fund’s historical performance in comparison to its benchmark(s). Performance results include the deduction of the maximum applicable sales charge and reflect the percentage change in net asset value, including reinvestment of dividends and capital gains distributions. The performance of other share classes will be greater than or less than that of the class depicted below. Benchmarks are unmanaged and may not be invested in directly. Benchmark returns do not reflect sales charges, commissions or expenses. (See Notes to Performance Summary.)
Performance data shown represents past performance and is no guarantee of future results. Investment return and principal value fluctuate so your shares, when sold, may be worth more or less than the original cost; current performance may be lower or higher than quoted. The performance shown does not reflect the deduction of taxes, if any, that a shareholder would pay on fund distributions or the redemption of fund shares.
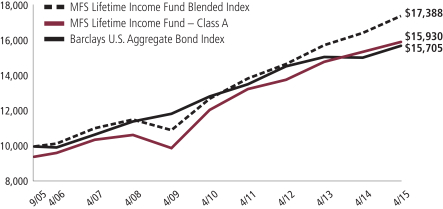
MFS Lifetime Income Fund
Growth of a hypothetical $10,000 investment (t)
Average annual total returns through 4/30/15
Without sales charge
| Share Class | Class inception date | 1-yr | 5-yr | Life (t) | ||||||||
| A | 9/29/05 | 3.66% | 5.70% | 5.63% | ||||||||
| B | 9/29/05 | 2.89% | 4.90% | 4.88% | ||||||||
| C | 9/29/05 | 2.89% | 4.90% | 4.88% | ||||||||
| I | 9/29/05 | 4.00% | 5.96% | 5.94% | ||||||||
| R1 | 9/29/05 | 2.88% | 4.90% | 4.86% | ||||||||
| R2 | 9/29/05 | 3.40% | 5.44% | 5.37% | ||||||||
| R3 | 9/29/05 | 3.74% | 5.70% | 5.64% | ||||||||
| R4 | 9/29/05 | 3.92% | 5.94% | 5.91% | ||||||||
| 529A | 1/08/15 | N/A | N/A | 2.07% | ||||||||
| 529B | 1/08/15 | N/A | N/A | 1.83% | ||||||||
| 529C | 1/08/15 | N/A | N/A | 1.83% |
17
Table of Contents
Performance Summary – continued
| Comparative benchmarks | ||||||||||||
| Share Class | 1-yr | 5-yr | Life (t) | |||||||||
| Barclays U.S. Aggregate Bond Index (f) | 4.46% | 4.12% | 4.82% | |||||||||
| MFS Lifetime Income Fund Blended Index (f)(z) | 5.82% | 6.47% | 5.94% | |||||||||
| Bloomberg Commodity Index (f) | (24.69)% | (5.02)% | (4.27)% | |||||||||
| FTSE EPRA/NAREIT Developed Real Estate Index (f) | 10.88% | 11.18% | 6.60% | |||||||||
| MSCI EAFE Index (f) | 2.10% | 7.89% | 5.18% | |||||||||
| Standard & Poor’s 500 Stock Index (f) | 12.98% | 14.33% | 8.03% | |||||||||
| With sales charge | ||||||||||||
A With Initial Sales Charge (5.75%) | (2.30)% | 4.46% | 4.98% | |||||||||
B With CDSC (Declining over six years from 4% to 0%) (v) | (1.11)% | 4.57% | 4.88% | |||||||||
C With CDSC (1% for 12 months) (v) | 1.89% | 4.90% | 4.88% | |||||||||
529A With Initial Sales Charge (5.75%) | N/A | N/A | (3.80)% | |||||||||
529B With CDSC (Declining over six years from 4% to 0%) (v) | N/A | N/A | (2.17)% | |||||||||
529C With CDSC (1% for 12 months) (v) | N/A | N/A | 0.83% | |||||||||
CDSC – Contingent Deferred Sales Charge.
Class I, R1, R2, R3, and R4 shares do not have a sales charge.
| (f) | Source: FactSet Research Systems Inc. |
| (t) | For the period from the class inception date through the stated period end. The comparative benchmark performance information provided for the “life” period is from the inception date of the Class A shares. (See Notes to Performance Summary.) |
| (v) | Assuming redemption at the end of the applicable period. |
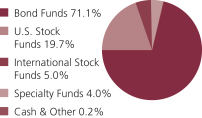
| (z) | The weights of the components of the blended benchmark (MFS Lifetime Income Fund Blended Index (formerly MFS Lifetime Retirement Income Fund Blended Index)) are comprised of 73% Barclays U.S. Aggregate Bond Index, 20% Standard & Poor’s 500 Stock Index, 5% MSCI EAFE Index, 1% FTSE EPRA/NAREIT Developed Real Estate Index, and 1% Bloomberg Commodity Index. |
See Benchmark Definitions and Notes to Performance Summary
18
Table of Contents
Performance Summary – continued
MFS Lifetime 2015 Fund
Growth of a hypothetical $10,000 investment (t)
Average annual total returns through 4/30/15
Without sales charge
| Share Class | Class inception date | 1-yr | Life (t) | |||||||
| A | 11/02/12 | 3.92% | 5.49% | |||||||
| B | 11/02/12 | 3.09% | 4.69% | |||||||
| C | 11/02/12 | 3.12% | 4.69% | |||||||
| I | 11/02/12 | 4.04% | 5.72% | |||||||
| R1 | 11/02/12 | 3.03% | 4.67% | |||||||
| R2 | 11/02/12 | 3.59% | 5.21% | |||||||
| R3 | 11/02/12 | 3.90% | 5.46% | |||||||
| R4 | 11/02/12 | 4.04% | 5.72% | |||||||
| Comparative benchmarks | ||||||||||
| Barclays U.S. Aggregate Bond Index (f) | 4.46% | 2.08% | ||||||||
| MFS Lifetime 2015 Fund Blended Index (f)(z) | 5.94% | 6.53% | ||||||||
| Bloomberg Commodity Index (f) | (24.69)% | (12.06)% | ||||||||
| FTSE EPRA/NAREIT Developed Real Estate Index (f) | 10.88% | 10.96% | ||||||||
| MSCI EAFE Index (f) | 2.10% | 12.90% | ||||||||
| Standard & Poor’s 500 Stock Index (f) | 12.98% | 18.91% | ||||||||
| With sales charge | ||||||||||
A With Initial Sales Charge (5.75%) | (2.06)% | 3.02% | ||||||||
B With CDSC (Declining over six years from 4% to 0%) (v) | (0.91)% | 3.56% | ||||||||
C With CDSC (1% for 12 months) (v) | 2.12% | 4.69% | ||||||||
CDSC – Contingent Deferred Sales Charge.
Class I, R1, R2, R3, and R4 shares do not have a sales charge.
| (f) | Source: FactSet Research Systems Inc. |
| (t) | For the period from the class inception date through the stated period end. (See Notes to Performance Summary.) |
| (v) | Assuming redemption at the end of the applicable period. |
19
Table of Contents
Performance Summary – continued
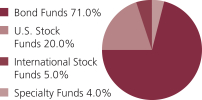
| (z) | The weights of the components of the blended benchmark (MFS Lifetime 2015 Fund Blended Index) are designed to change systematically over time on a preset schedule. The table below depicts the individual component weights (in percent) at the beginning and at the end of the reporting period: |
| 4/30/15 | 4/30/14 | |||||||||
| Barclays U.S. Aggregate Bond Index | 71.90% | 69.70% | ||||||||
| Standard & Poor’s 500 Stock Index | 20.80% | 22.40% | ||||||||
| MSCI EAFE Index | 5.30% | 5.90% | ||||||||
| Bloomberg Commodity Index | 1.00% | 1.00% | ||||||||
| FTSE EPRA/NAREIT Developed Real Estate Index | 1.00% | 1.00% | ||||||||
See Benchmark Definitions and Notes to Performance Summary
20
Table of Contents
Performance Summary – continued
MFS Lifetime 2020 Fund
Growth of a hypothetical $10,000 investment (t)
Average annual total returns through 4/30/15
Without sales charge
| Share Class | Class inception date | 1-yr | 5-yr | Life (t) | ||||||||
| A | 9/29/05 | 4.76% | 7.82% | 5.92% | ||||||||
| B | 9/29/05 | 3.96% | 7.01% | 5.16% | ||||||||
| C | 9/29/05 | 3.97% | 7.02% | 5.17% | ||||||||
| I | 9/29/05 | 5.03% | 8.09% | 6.22% | ||||||||
| R1 | 9/29/05 | 3.99% | 7.02% | 5.15% | ||||||||
| R2 | 9/29/05 | 4.48% | 7.54% | 5.66% | ||||||||
| R3 | 9/29/05 | 4.72% | 7.83% | 5.93% | ||||||||
| R4 | 9/29/05 | 4.96% | 8.07% | 6.19% | ||||||||
| Comparative benchmarks | ||||||||||||
| Standard & Poor’s 500 Stock Index (f) | 12.98% | 14.33% | 8.03% | |||||||||
| MFS Lifetime 2020 Fund Blended Index (f)(z) | 6.49% | 8.09% | 5.85% | |||||||||
| Barclays U.S. Aggregate Bond Index (f) | 4.46% | 4.12% | 4.82% | |||||||||
| Bloomberg Commodity Index (f) | (24.69)% | (5.02)% | (4.27)% | |||||||||
| FTSE EPRA/NAREIT Developed Real Estate Index (f) | 10.88% | 11.18% | 6.60% | |||||||||
| MSCI EAFE Index (f) | 2.10% | 7.89% | 5.18% | |||||||||
| With sales charge | ||||||||||||
A With Initial Sales Charge (5.75%) | (1.27)% | 6.55% | 5.27% | |||||||||
B With CDSC (Declining over six years from 4% to 0%) (v) | (0.04)% | 6.71% | 5.16% | |||||||||
C With CDSC (1% for 12 months) (v) | 2.97% | 7.02% | 5.17% | |||||||||
CDSC – Contingent Deferred Sales Charge.
Class I, R1, R2, R3, and R4 shares do not have a sales charge.
| (f) | Source: FactSet Research Systems Inc. |
| (t) | For the period from the class inception date through the stated period end. (See Notes to Performance Summary.) |
| (v) | Assuming redemption at the end of the applicable period. |
21
Table of Contents
Performance Summary – continued
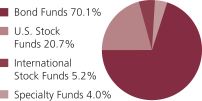
| (z) | The weights of the components of the blended benchmark (MFS Lifetime 2020 Fund Blended Index) are designed to change systematically over time on a preset schedule. The table below depicts the individual component weights (in percent) at the beginning and at the end of the reporting period: |
| 4/30/15 | 4/30/14 | |||||||||
| Barclays U.S. Aggregate Bond Index | 59.90% | 55.70% | ||||||||
| Standard & Poor’s 500 Stock Index | 29.30% | 31.90% | ||||||||
| MSCI EAFE Index | 8.50% | 9.50% | ||||||||
| Bloomberg Commodity Index | 1.20% | 1.60% | ||||||||
| FTSE EPRA/NAREIT Developed Real Estate Index | 1.10% | 1.30% | ||||||||
See Benchmark Definitions and Notes to Performance Summary
22
Table of Contents
Performance Summary – continued
MFS Lifetime 2025 Fund
Growth of a hypothetical $10,000 investment (t)
Average annual total returns through 4/30/15
Without sales charge
| Share Class | Class inception date | 1-yr | Life (t) | |||||||
| A | 11/02/12 | 5.64% | 10.40% | |||||||
| B | 11/02/12 | 4.83% | 9.55% | |||||||
| C | 11/02/12 | 4.86% | 9.55% | |||||||
| I | 11/02/12 | 5.89% | 10.64% | |||||||
| R1 | 11/02/12 | 4.88% | 9.56% | |||||||
| R2 | 11/02/12 | 5.42% | 10.12% | |||||||
| R3 | 11/02/12 | 5.65% | 10.36% | |||||||
| R4 | 11/02/12 | 5.88% | 10.64% | |||||||
| Comparative benchmarks | ||||||||||
| Standard & Poor’s 500 Stock Index (f) | 12.98% | 18.91% | ||||||||
| MFS Lifetime 2025 Fund Blended Index (f)(z) | 6.88% | 11.12% | ||||||||
| Barclays U.S. Aggregate Bond Index (f) | 4.46% | 2.08% | ||||||||
| Bloomberg Commodity Index (f) | (24.69)% | (12.06)% | ||||||||
| FTSE EPRA/NAREIT Developed Real Estate Index (f) | 10.88% | 10.96% | ||||||||
| MSCI EAFE Index (f) | 2.10% | 12.90% | ||||||||
| With sales charge | ||||||||||
A With Initial Sales Charge (5.75%) | (0.44)% | 7.81% | ||||||||
B With CDSC (Declining over six years from 4% to 0%) (v) | 0.83% | 8.49% | ||||||||
C With CDSC (1% for 12 months) (v) | 3.86% | 9.55% | ||||||||
CDSC – Contingent Deferred Sales Charge.
Class I, R1, R2, R3, and R4 shares do not have a sales charge.
| (f) | Source: FactSet Research Systems Inc. |
| (t) | For the period from the class inception date through the stated period end. (See Notes to Performance Summary.) |
| (v) | Assuming redemption at the end of the applicable period. |
23
Table of Contents
Performance Summary – continued
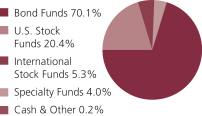
| (z) | The weights of the components of the blended benchmark (MFS Lifetime 2025 Fund Blended Index) are designed to change systematically over time on a preset schedule. The table below depicts the individual component weights (in percent) at the beginning and at the end of the reporting period: |
| 4/30/15 | 4/30/14 | |||||||||
| Standard & Poor’s 500 Stock Index | 42.10% | 44.30% | ||||||||
| Barclays U.S. Aggregate Bond Index | 39.00% | 35.00% | ||||||||
| MSCI EAFE Index | 13.70% | 15.10% | ||||||||
| Bloomberg Commodity Index | 3.10% | 3.30% | ||||||||
| FTSE EPRA/NAREIT Developed Real Estate Index | 2.10% | 2.30% | ||||||||
See Benchmark Definitions and Notes to Performance Summary
24
Table of Contents
Performance Summary – continued
MFS Lifetime 2030 Fund
Growth of a hypothetical $10,000 investment (t)
Average annual total returns through 4/30/15
Without sales charge
| Share Class | Class inception date | 1-yr | 5-yr | Life (t) | ||||||||
| A | 9/29/05 | 6.37% | 10.28% | 6.39% | ||||||||
| B | 9/29/05 | 5.59% | 9.45% | 5.63% | ||||||||
| C | 9/29/05 | 5.51% | 9.44% | 5.62% | ||||||||
| I | 9/29/05 | 6.57% | 10.53% | 6.69% | ||||||||
| R1 | 9/29/05 | 5.48% | 9.44% | 5.60% | ||||||||
| R2 | 9/29/05 | 6.07% | 10.00% | 6.12% | ||||||||
| R3 | 9/29/05 | 6.37% | 10.27% | 6.38% | ||||||||
| R4 | 9/29/05 | 6.58% | 10.53% | 6.66% | ||||||||
| Comparative benchmarks | ||||||||||||
| Standard & Poor’s 500 Stock Index (f) | 12.98% | 14.33% | 8.03% | |||||||||
| MFS Lifetime 2030 Fund Blended Index (f)(z) | 7.26% | 10.33% | 6.27% | |||||||||
| Barclays U.S. Aggregate Bond Index (f) | 4.46% | 4.12% | 4.82% | |||||||||
| Bloomberg Commodity Index (f) | (24.69)% | (5.02)% | (4.27)% | |||||||||
| FTSE EPRA/NAREIT Developed Real Estate Index (f) | 10.88% | 11.18% | 6.60% | |||||||||
| MSCI EAFE Index (f) | 2.10% | 7.89% | 5.18% | |||||||||
| With sales charge | ||||||||||||
A With Initial Sales Charge (5.75%) | 0.26% | 8.98% | 5.73% | |||||||||
B With CDSC (Declining over six years from 4% to 0%) (v) | 1.59% | 9.17% | 5.63% | |||||||||
C With CDSC (1% for 12 months) (v) | 4.51% | 9.44% | 5.62% | |||||||||
CDSC – Contingent Deferred Sales Charge.
Class I, R1, R2, R3, and R4 shares do not have a sales charge.
| (f) | Source: FactSet Research Systems Inc. |
| (t) | For the period from the class inception date through the stated period end. (See Notes to Performance Summary.) |
| (v) | Assuming redemption at the end of the applicable period. |
25
Table of Contents
Performance Summary – continued
| (z) | The weights of the components of the blended benchmark (MFS Lifetime 2030 Fund Blended Index) are designed to change systematically over time on a preset schedule. The table below depicts the individual component weights (in percent) at the beginning and at the end of the reporting period: |
| 4/30/15 | 4/30/14 | |||||||||
| Standard & Poor’s 500 Stock Index | 52.25% | 52.77% | ||||||||
| MSCI EAFE Index | 20.40% | 21.23% | ||||||||
| Barclays U.S. Aggregate Bond Index | 20.20% | 18.55% | ||||||||
| Bloomberg Commodity Index | 4.05% | 4.15% | ||||||||
| FTSE EPRA/NAREIT Developed Real Estate Index | 3.10% | 3.30% | ||||||||
See Benchmark Definitions and Notes to Performance Summary
26
Table of Contents
Performance Summary – continued
MFS Lifetime 2035 Fund
Growth of a hypothetical $10,000 investment (t)

Average annual total returns through 4/30/15
Without sales charge
| Share Class | Class inception date | 1-yr | Life (t) | |||||||||
| A | 11/02/12 | 6.72% | 13.01% | |||||||||
| B | 11/02/12 | 5.88% | 12.17% | |||||||||
| C | 11/02/12 | 5.89% | 12.18% | |||||||||
| I | 11/02/12 | 6.98% | 13.30% | |||||||||
| R1 | 11/02/12 | 5.90% | 12.17% | |||||||||
| R2 | 11/02/12 | 6.38% | 12.73% | |||||||||
| R3 | 11/02/12 | 6.61% | 13.02% | |||||||||
| R4 | 11/02/12 | 6.98% | 13.30% | |||||||||
| Comparative benchmarks | ||||||||||||
| Standard & Poor’s 500 Stock Index (f) | 12.98% | 18.91% | ||||||||||
| MFS Lifetime 2035 Fund Blended Index (f)(z) | 7.26% | 13.86% | ||||||||||
| Barclays U.S. Aggregate Bond Index (f) | 4.46% | 2.08% | ||||||||||
| Bloomberg Commodity Index (f) | (24.69)% | (12.06)% | ||||||||||
| FTSE EPRA/NAREIT Developed Real Estate Index (f) | 10.88% | 10.96% | ||||||||||
| MSCI EAFE Index (f) | 2.10% | 12.90% | ||||||||||
| With sales charge | ||||||||||||
A With Initial Sales Charge (5.75%) | 0.58% | 10.36% | ||||||||||
B With CDSC (Declining over six years from 4% to 0%) (v) | 1.88% | 11.15% | ||||||||||
C With CDSC (1% for 12 months) (v) | 4.89% | 12.18% | ||||||||||
CDSC – Contingent Deferred Sales Charge.
Class I, R1, R2, R3, and R4 shares do not have a sales charge.
| (f) | Source: FactSet Research Systems Inc. |
| (t) | For the period from the class inception date through the stated period end. (See Notes to Performance Summary.) |
| (v) | Assuming redemption at the end of the applicable period. |
27
Table of Contents
Performance Summary – continued
| (z) | The weights of the components of the blended benchmark (MFS Lifetime 2035 Fund Blended Index) are designed to change systematically over time on a preset schedule. The table below depicts the individual component weights (in percent) at the beginning and at the end of the reporting period: |
| 4/30/15 | 4/30/14 | |||||||||
| Standard & Poor’s 500 Stock Index | 54.75% | 55.25% | ||||||||
| MSCI EAFE Index | 24.40% | 25.20% | ||||||||
| Barclays U.S. Aggregate Bond Index | 12.20% | 10.60% | ||||||||
| Bloomberg Commodity Index | 4.55% | 4.65% | ||||||||
| FTSE EPRA/NAREIT Developed Real Estate Index | 4.10% | 4.30% | ||||||||
See Benchmark Definitions and Notes to Performance Summary
28
Table of Contents
Performance Summary – continued
MFS Lifetime 2040 Fund
Growth of a hypothetical $10,000 investment (t)
Average annual total returns through 4/30/15
Without sales charge
| Share Class | Class inception date | 1-yr | 5-yr | Life (t) | ||||||||
| A | 9/29/05 | 6.97% | 10.89% | 6.48% | ||||||||
| B | 9/29/05 | 6.16% | 10.08% | 5.72% | ||||||||
| C | 9/29/05 | 6.21% | 10.07% | 5.73% | ||||||||
| I | 9/29/05 | 7.24% | 11.18% | 6.78% | ||||||||
| R1 | 9/29/05 | 6.18% | 10.07% | 5.70% | ||||||||
| R2 | 9/29/05 | 6.68% | 10.62% | 6.22% | ||||||||
| R3 | 9/29/05 | 6.97% | 10.89% | 6.49% | ||||||||
| R4 | 9/29/05 | 7.25% | 11.17% | 6.76% | ||||||||
| Comparative benchmarks | ||||||||||||
| Standard & Poor’s 500 Stock Index (f) | 12.98% | 14.33% | 8.03% | |||||||||
| MFS Lifetime 2040 Fund Blended Index (f)(z) | 7.28% | 10.96% | 6.38% | |||||||||
| Barclays U.S. Aggregate Bond Index (f) | 4.46% | 4.12% | 4.82% | |||||||||
| Bloomberg Commodity Index (f) | (24.69)% | (5.02)% | (4.27)% | |||||||||
| FTSE EPRA/NAREIT Developed Real Estate Index (f) | 10.88% | 11.18% | 6.60% | |||||||||
| MSCI EAFE Index (f) | 2.10% | 7.89% | 5.18% | |||||||||
| With sales charge | ||||||||||||
A With Initial Sales Charge (5.75%) | 0.82% | 9.59% | 5.82% | |||||||||
B With CDSC (Declining over six years from 4% to 0%) (v) | 2.16% | 9.81% | 5.72% | |||||||||
C With CDSC (1% for 12 months) (v) | 5.21% | 10.07% | 5.73% | |||||||||
CDSC – Contingent Deferred Sales Charge.
Class I, R1, R2, R3, and R4 shares do not have a sales charge.
| (f) | Source: FactSet Research Systems Inc. |
| (t) | For the period from the class inception date through the stated period end. (See Notes to Performance Summary.) |
| (v) | Assuming redemption at the end of the applicable period. |
29
Table of Contents
Performance Summary – continued
| (z) | The weights of the components of the blended benchmark (MFS Lifetime 2040 Fund Blended Index) are designed to change systematically over time on a preset schedule. The table below depicts the individual component weights (in percent) at the beginning and at the end of the reporting period: |
| 4/30/15 | 4/30/14 | |||||||||
| Standard & Poor’s 500 Stock Index | 57.00% | 57.00% | ||||||||
| MSCI EAFE Index | 28.00% | 28.00% | ||||||||
| Barclays U.S. Aggregate Bond Index | 5.00% | 5.00% | ||||||||
| Bloomberg Commodity Index | 5.00% | 5.00% | ||||||||
| FTSE EPRA/NAREIT Developed Real Estate Index | 5.00% | 5.00% | ||||||||
See Benchmark Definitions and Notes to Performance Summary
30
Table of Contents
Performance Summary – continued
MFS Lifetime 2045 Fund
Growth of a hypothetical $10,000 investment (t)

Average annual total returns through 4/30/15
Without sales charge
| Share Class | Class inception date | 1-yr | Life (t) | |||||||||
| A | 11/02/12 | 6.95% | 13.58% | |||||||||
| B | 11/02/12 | 6.19% | 12.65% | |||||||||
| C | 11/02/12 | 6.17% | 12.66% | |||||||||
| I | 11/02/12 | 7.21% | 13.79% | |||||||||
| R1 | 11/02/12 | 6.13% | 12.66% | |||||||||
| R2 | 11/02/12 | 6.74% | 13.24% | |||||||||
| R3 | 11/02/12 | 6.92% | 13.50% | |||||||||
| R4 | 11/02/12 | 7.13% | 13.75% | |||||||||
| Comparative benchmarks | ||||||||||||
| Standard & Poor’s 500 Stock Index (f) | 12.98% | 18.91% | ||||||||||
| MFS Lifetime 2045 Fund Blended Index (f)(z) | 7.28% | 14.35% | ||||||||||
| Barclays U.S. Aggregate Bond Index (f) | 4.46% | 2.08% | ||||||||||
| Bloomberg Commodity Index (f) | (24.69)% | (12.06)% | ||||||||||
| FTSE EPRA/NAREIT Developed Real Estate Index (f) | 10.88% | 10.96% | ||||||||||
| MSCI EAFE Index (f) | 2.10% | 12.90% | ||||||||||
| With sales charge | ||||||||||||
A With Initial Sales Charge (5.75%) | 0.80% | 10.91% | ||||||||||
B With CDSC (Declining over six years from 4% to 0%) (v) | 2.19% | 11.64% | ||||||||||
C With CDSC (1% for 12 months) (v) | 5.17% | 12.66% | ||||||||||
CDSC – Contingent Deferred Sales Charge.
Class I, R1, R2, R3, and R4 shares do not have a sales charge.
| (f) | Source: FactSet Research Systems Inc. |
| (t) | For the period from the class inception date through the stated period end. (See Notes to Performance Summary.) |
| (v) | Assuming redemption at the end of the applicable period. |
31
Table of Contents
Performance Summary – continued
| (z) | The weights of the components of the blended benchmark (MFS Lifetime 2045 Fund Blended Index) are designed to change systematically over time on a preset schedule. The table below depicts the individual component weights (in percent) at the beginning and at the end of the reporting period: |
| 4/30/15 | 4/30/14 | |||||||||
| Standard & Poor’s 500 Stock Index | 57.00% | 57.00% | ||||||||
| MSCI EAFE Index | 28.00% | 28.00% | ||||||||
| Barclays U.S. Aggregate Bond Index | 5.00% | 5.00% | ||||||||
| Bloomberg Commodity Index | 5.00% | 5.00% | ||||||||
| FTSE EPRA/NAREIT Developed Real Estate Index | 5.00% | 5.00% | ||||||||
See Benchmark Definitions and Notes to Performance Summary
32
Table of Contents
Performance Summary – continued
MFS Lifetime 2050 Fund
Growth of a hypothetical $10,000 investment (t)
Average annual total returns through 4/30/15
Without sales charge
| Share Class | Class inception date | 1-yr | Life (t) | |||||||||
| A | 9/15/10 | 6.92% | 12.17% | |||||||||
| B | 9/15/10 | 6.14% | 11.33% | |||||||||
| C | 9/15/10 | 6.13% | 11.33% | |||||||||
| I | 9/15/10 | 7.16% | 12.45% | |||||||||
| R1 | 9/15/10 | 6.14% | 11.33% | |||||||||
| R2 | 9/15/10 | 6.67% | 11.89% | |||||||||
| R3 | 9/15/10 | 6.95% | 12.18% | |||||||||
| R4 | 9/15/10 | 7.23% | 12.45% | |||||||||
| Comparative benchmarks | ||||||||||||
| Standard & Poor’s 500 Stock Index (f) | 12.98% | 16.78% | ||||||||||
| MFS Lifetime 2050 Fund Blended Index (f)(z) | 7.28% | 12.40% | ||||||||||
| Barclays U.S. Aggregate Bond Index (f) | 4.46% | 3.48% | ||||||||||
| Bloomberg Commodity Index (f) | (24.69)% | (5.91)% | ||||||||||
| FTSE EPRA/NAREIT Developed Real Estate Index (f) | 10.88% | 11.18% | ||||||||||
| MSCI EAFE Index (f) | 2.10% | 8.49% | ||||||||||
| With sales charge | ||||||||||||
A With Initial Sales Charge (5.75%) | 0.77% | 10.75% | ||||||||||
B With CDSC (Declining over six years from 4% to 0%) (v) | 2.14% | 11.04% | ||||||||||
C With CDSC (1% for 12 months) (v) | 5.13% | 11.33% | ||||||||||
CDSC – Contingent Deferred Sales Charge.
Class I, R1, R2, R3, and R4 shares do not have a sales charge.
| (f) | Source: FactSet Research Systems Inc. |
| (t) | For the period from the class inception date through the stated period end. (See Notes to Performance Summary.) |
| (v) | Assuming redemption at the end of the applicable period. |
33
Table of Contents
Performance Summary – continued
| (z) | The weights of the components of the blended benchmark (MFS Lifetime 2050 Fund Blended Index) are designed to change systematically over time on a preset schedule. The table below depicts the individual component weights (in percent) at the beginning and at the end of the reporting period: |
| 4/30/15 | 4/30/14 | |||||||||
| Standard & Poor’s 500 Stock Index | 57.00% | 57.00% | ||||||||
| MSCI EAFE Index | 28.00% | 28.00% | ||||||||
| Barclays U.S. Aggregate Bond Index | 5.00% | 5.00% | ||||||||
| Bloomberg Commodity Index | 5.00% | 5.00% | ||||||||
| FTSE EPRA/NAREIT Developed Real Estate Index | 5.00% | 5.00% | ||||||||
See Benchmark Definitions and Notes to Performance Summary
34
Table of Contents
Performance Summary – continued
MFS Lifetime 2055 Fund
Growth of a hypothetical $10,000 investment (t)
Average annual total returns through 4/30/15
Without sales charge
| Share Class | Class inception date | 1-yr | Life (t) | |||||||||
| A | 11/02/12 | 6.90% | 13.52% | |||||||||
| B | 11/02/12 | 6.13% | 12.68% | |||||||||
| C | 11/02/12 | 6.17% | 12.69% | |||||||||
| I | 11/02/12 | 7.14% | 13.81% | |||||||||
| R1 | 11/02/12 | 6.14% | 12.69% | |||||||||
| R2 | 11/02/12 | 6.63% | 13.23% | |||||||||
| R3 | 11/02/12 | 6.95% | 13.55% | |||||||||
| R4 | 11/02/12 | 7.23% | 13.81% | |||||||||
| Comparative benchmarks | ||||||||||||
| Standard & Poor’s 500 Stock Index (f) | 12.98% | 18.91% | ||||||||||
| MFS Lifetime 2055 Fund Blended Index (f)(z) | 7.28% | 14.35% | ||||||||||
| Barclays U.S. Aggregate Bond Index (f) | 4.46% | 2.08% | ||||||||||
| Bloomberg Commodity Index (f) | (24.69)% | (12.06)% | ||||||||||
| FTSE EPRA/NAREIT Developed Real Estate Index (f) | 10.88% | 10.96% | ||||||||||
| MSCI EAFE Index (f) | 2.10% | 12.90% | ||||||||||
| With sales charge | ||||||||||||
A With Initial Sales Charge (5.75%) | 0.76% | 10.86% | ||||||||||
B With CDSC (Declining over six years from 4% to 0%) (v) | 2.13% | 11.67% | ||||||||||
C With CDSC (1% for 12 months) (v) | 5.17% | 12.69% | ||||||||||
CDSC – Contingent Deferred Sales Charge.
Class I, R1, R2, R3, and R4 shares do not have a sales charge.
| (f) | Source: FactSet Research Systems Inc. |
| (t) | For the period from the class inception date through the stated period end. (See Notes to Performance Summary.) |
| (v) | Assuming redemption at the end of the applicable period. |
35
Table of Contents
Performance Summary – continued
| (z) | The weights of the components of the blended benchmark (MFS Lifetime 2055 Fund Blended Index) are designed to change systematically over time on a preset schedule. The table below depicts the individual component weights (in percent) at the beginning and at the end of the reporting period: |
| 4/30/15 | 4/30/14 | |||||||||
| Standard & Poor’s 500 Stock Index | 57.00% | 57.00% | ||||||||
| MSCI EAFE Index | 28.00% | 28.00% | ||||||||
| Barclays U.S. Aggregate Bond Index | 5.00% | 5.00% | ||||||||
| Bloomberg Commodity Index | 5.00% | 5.00% | ||||||||
| FTSE EPRA/NAREIT Developed Real Estate Index | 5.00% | 5.00% | ||||||||
Benchmark Definitions
Barclays U.S. Aggregate Bond Index – a market capitalization-weighted index that measures the performance of the U.S. investment-grade, fixed rate bond market, with index components for government and corporate securities, mortgage pass-through securities, and asset-backed securities with at least one year to final maturity.
Bloomberg Commodity Index (formerly known as Dow Jones-UBS Commodity Index) – a highly liquid and diversified benchmark for the commodity futures market. The index tracks trades on futures contracts for physical commodities, such as energy (petroleum, gas), precious metals (gold, silver), industrial metals (zinc, copper), grains (corn, wheat), livestock (pork bellies), among others, and are traded in a variety of currencies.
FTSE EPRA/NAREIT Developed Real Estate Index – measures the performance of eligible real estate equities worldwide that generate a majority of their revenue and income through the ownership, disposure and development of income-producing real estate.
MSCI EAFE Index – a market capitalization-weighted index that is designed to measure equity market performance in the developed markets, excluding the U.S. and Canada.
Standard & Poor’s 500 Stock Index – a market capitalization-weighted index of 500 widely held equity securities, designed to measure broad U.S. equity performance.
It is not possible to invest directly in an index.
Notes to Performance Summary
Class 529 shares, which currently are only offered by the MFS Lifetime Income Fund, are only available in conjunction with qualified tuition programs, such as the MFS 529 Savings Plan. There also is an additional fee, which is detailed in the program description, on qualified tuition programs. If this fee was reflected, the performance for Class 529 shares would have been lower. This annual fee is waived for Oregon residents and for those accounts with assets of $25,000 or more.
Average annual total return represents the average annual change in value for each share class for the periods presented. Life returns are presented where the share class has less than 10 years of performance history and represent the average annual total return from the class inception date to the stated period end date. As the fund’s share classes may have different inception dates, the life returns may represent different time periods and may not be comparable.
Performance results reflect any applicable expense subsidies and waivers in effect during the periods shown. Without such subsidies and waivers each fund’s performance results would be less favorable. Please see the prospectus and financial statements for complete details.
Performance results do not include adjustments made for financial reporting purposes in accordance with U.S. generally accepted accounting principles and may differ from amounts reported in the financial highlights.
From time to time the funds may receive proceeds from litigation settlements, without which performance would be lower.
36
Table of Contents
Fund expenses borne by the shareholders during the period, November 1, 2014 through April 30, 2015
As a shareholder of the funds, you incur two types of costs: (1) transaction costs, including sales charges (loads) on certain purchase or redemption payments, and (2) ongoing costs, including distribution and service (12b-1) fees; and other fund expenses. These examples are intended to help you understand your ongoing costs (in dollars) of investing in the funds and to compare these costs with the ongoing costs of investing in other mutual funds.
In addition to the fees and expenses which each fund bears directly, each fund indirectly bears a pro rata share of the fees and expenses of the underlying funds in which each fund invests. Because the underlying funds have varied expenses and fee levels and each fund may own different proportions of the underlying funds at different times, the amount of fees and expenses incurred indirectly by each fund will vary. If these transactional and indirect costs were included, your costs would have been higher.
These examples are based on an investment of $1,000 invested at the beginning of the period and held for the entire period November 1, 2014 through April 30, 2015.
Actual Expenses
The first line for each share class in the following tables provides information about actual account values and actual expenses. You may use the information in this line, together with the amount you invested, to estimate the expenses that you paid over the period. Simply divide your account value by $1,000 (for example, an $8,600 account value divided by $1,000 = 8.6), then multiply the result by the number in the first line under the heading entitled “Expenses Paid During Period” to estimate the expenses you paid on your account during this period.
Hypothetical Example for Comparison Purposes
The second line for each share class in the following tables provides information about hypothetical account values and hypothetical expenses based on each fund’s actual expense ratio and an assumed rate of return of 5% per year before expenses, which is not each fund’s actual return. The hypothetical account values and expenses may not be used to estimate the actual ending account balance or expenses you paid for the period. You may use this information to compare the ongoing costs of investing in each fund and other funds. To do so, compare this 5% hypothetical example with the 5% hypothetical examples that appear in the shareholder reports of the other funds.
Please note that the expenses shown in the tables are meant to highlight your ongoing costs only and do not reflect any transactional costs, such as sales charges (loads). Therefore, the second line for each share class in the tables is useful in comparing ongoing costs only, and will not help you determine the relative total costs of owning different funds. In addition, if these transactional costs were included, your costs would have been higher.
37
Table of Contents
Expense Tables – continued
MFS LIFETIME INCOME FUND
| Share Class | Annualized Expense Ratio | Beginning Account Value 11/01/14 | Ending Account Value | Expenses Paid During 11/01/14-4/30/15 | ||||||||||||||
| A | Actual | 0.25% | $1,000.00 | $1,018.29 | $1.25 | |||||||||||||
| Hypothetical (h) | 0.25% | $1,000.00 | $1,023.55 | $1.25 | ||||||||||||||
| B | Actual | 1.00% | $1,000.00 | $1,014.49 | $4.99 | |||||||||||||
| Hypothetical (h) | 1.00% | $1,000.00 | $1,019.84 | $5.01 | ||||||||||||||
| C | Actual | 1.00% | $1,000.00 | $1,015.32 | $5.00 | |||||||||||||
| Hypothetical (h) | 1.00% | $1,000.00 | $1,019.84 | $5.01 | ||||||||||||||
| I | Actual | 0.00% | $1,000.00 | $1,020.39 | $0.00 | |||||||||||||
| Hypothetical (h) | 0.00% | $1,000.00 | $1,024.79 | $0.00 | ||||||||||||||
| R1 | Actual | 1.00% | $1,000.00 | $1,014.48 | $4.99 | |||||||||||||
| Hypothetical (h) | 1.00% | $1,000.00 | $1,019.84 | $5.01 | ||||||||||||||
| R2 | Actual | 0.50% | $1,000.00 | $1,017.85 | $2.50 | |||||||||||||
| Hypothetical (h) | 0.50% | $1,000.00 | $1,022.32 | $2.51 | ||||||||||||||
| R3 | Actual | 0.25% | $1,000.00 | $1,019.12 | $1.25 | |||||||||||||
| Hypothetical (h) | 0.25% | $1,000.00 | $1,023.55 | $1.25 | ||||||||||||||
| R4 | Actual | 0.00% | $1,000.00 | $1,020.39 | $0.00 | |||||||||||||
| Hypothetical (h) | 0.00% | $1,000.00 | $1,024.79 | $0.00 | ||||||||||||||
| 529A | Actual (i) | 0.30% | $1,000.00 | $1,020.71 | $0.94 | |||||||||||||
| Hypothetical (h) | 0.30% | $1,000.00 | $1,023.31 | $1.51 | ||||||||||||||
| 529B | Actual (i) | 1.04% | $1,000.00 | $1,018.31 | $3.25 | |||||||||||||
| Hypothetical (h) | 1.04% | $1,000.00 | $1,019.64 | $5.21 | ||||||||||||||
| 529C | Actual (i) | 1.05% | $1,000.00 | $1,018.31 | $3.28 | |||||||||||||
| Hypothetical (h) | 1.05% | $1,000.00 | $1,019.59 | $5.26 | ||||||||||||||
| (h) | 5% class return per year before expenses. |
| (i) | For the period from the class inception, January 8, 2015, through the stated period end. |
| (p) | “Expenses Paid During Period” are equal to each class’s annualized expense ratio, as shown above, multiplied by the average account value over the period, multiplied by 181/365 (to reflect the one-half year period), except for Actual Expenses of classes 529A, 529B, and 529C, which is multiplied by 113/365 (to reflect the period from the commencement of the classes’ investment operations, January 8, 2015, through April 30, 2015). For Hypothetical Expenses paid, it is assumed that classes 529A, 529B, and 529C were in existence for the entire six month period ended April 30, 2015. Expenses paid do not include any applicable sales charges (loads). If these transaction costs had been included, your costs would have been higher. In addition to the fees and expenses which the fund bears directly, the fund indirectly bears a pro rata share of the fees and expenses of the underlying funds in which the fund invests. If these indirect costs were included, your costs would have been higher. |
Notes to Expense Table
For the MFS Lifetime Income Fund, each class with a Rule 12b-1 service fee is subject to a rebate of a portion of such fee. Such rebates are included in the expense ratios above and are outside of the expense limitation arrangement. For Class 529B shares, this rebate reduced the expense ratio above by 0.01%. See Note 3 in the Notes to Financial Statements for additional information.
38
Table of Contents
Expense Tables – continued
MFS LIFETIME 2015 FUND
| Share Class | Annualized Expense Ratio | Beginning Account Value 11/01/14 | Ending Account Value | Expenses Paid During 11/01/14-4/30/15 | ||||||||||||||
| A | Actual | 0.25% | $1,000.00 | $1,020.12 | $1.25 | |||||||||||||
| Hypothetical (h) | 0.25% | $1,000.00 | $1,023.55 | $1.25 | ||||||||||||||
| B | Actual | 1.00% | $1,000.00 | $1,015.69 | $5.00 | |||||||||||||
| Hypothetical (h) | 1.00% | $1,000.00 | $1,019.84 | $5.01 | ||||||||||||||
| C | Actual | 1.00% | $1,000.00 | $1,015.96 | $5.00 | |||||||||||||
| Hypothetical (h) | 1.00% | $1,000.00 | $1,019.84 | $5.01 | ||||||||||||||
| I | Actual | 0.00% | $1,000.00 | $1,020.49 | $0.00 | |||||||||||||
| Hypothetical (h) | 0.00% | $1,000.00 | $1,024.79 | $0.00 | ||||||||||||||
| R1 | Actual | 1.00% | $1,000.00 | $1,015.12 | $5.00 | |||||||||||||
| Hypothetical (h) | 1.00% | $1,000.00 | $1,019.84 | $5.01 | ||||||||||||||
| R2 | Actual | 0.50% | $1,000.00 | $1,017.84 | $2.50 | |||||||||||||
| Hypothetical (h) | 0.50% | $1,000.00 | $1,022.32 | $2.51 | ||||||||||||||
| R3 | Actual | 0.25% | $1,000.00 | $1,019.96 | $1.25 | |||||||||||||
| Hypothetical (h) | 0.25% | $1,000.00 | $1,023.55 | $1.25 | ||||||||||||||
| R4 | Actual | 0.00% | $1,000.00 | $1,020.47 | $0.00 | |||||||||||||
| Hypothetical (h) | 0.00% | $1,000.00 | $1,024.79 | $0.00 | ||||||||||||||
| (h) | 5% class return per year before expenses. |
| (p) | “Expenses Paid During Period” are equal to each class’s annualized expense ratio, as shown above, multiplied by the average account value over the period, multiplied by 181/365 (to reflect the one-half year period). Expenses paid do not include any applicable sales charges (loads). If these transaction costs had been included, your costs would have been higher. In addition to the fees and expenses which the fund bears directly, the fund indirectly bears a pro rata share of the fees and expenses of the underlying funds in which the fund invests. If these indirect costs were included, your costs would have been higher. |
39
Table of Contents
Expense Tables – continued
MFS LIFETIME 2020 FUND
| Share Class | Annualized Expense Ratio | Beginning Account Value 11/01/14 | Ending Account Value | Expenses Paid During 11/01/14-4/30/15 | ||||||||||||||
| A | Actual | 0.25% | $1,000.00 | $1,024.23 | $1.25 | |||||||||||||
| Hypothetical (h) | 0.25% | $1,000.00 | $1,023.55 | $1.25 | ||||||||||||||
| B | Actual | 1.00% | $1,000.00 | $1,020.06 | $5.01 | |||||||||||||
| Hypothetical (h) | 1.00% | $1,000.00 | $1,019.84 | $5.01 | ||||||||||||||
| C | Actual | 1.00% | $1,000.00 | $1,020.74 | $5.01 | |||||||||||||
| Hypothetical (h) | 1.00% | $1,000.00 | $1,019.84 | $5.01 | ||||||||||||||
| I | Actual | 0.00% | $1,000.00 | $1,025.51 | $0.00 | |||||||||||||
| Hypothetical (h) | 0.00% | $1,000.00 | $1,024.79 | $0.00 | ||||||||||||||
| R1 | Actual | 1.00% | $1,000.00 | $1,020.39 | $5.01 | |||||||||||||
| Hypothetical (h) | 1.00% | $1,000.00 | $1,019.84 | $5.01 | ||||||||||||||
| R2 | Actual | 0.50% | $1,000.00 | $1,022.88 | $2.51 | |||||||||||||
| Hypothetical (h) | 0.50% | $1,000.00 | $1,022.32 | $2.51 | ||||||||||||||
| R3 | Actual | 0.25% | $1,000.00 | $1,024.62 | $1.25 | |||||||||||||
| Hypothetical (h) | 0.25% | $1,000.00 | $1,023.55 | $1.25 | ||||||||||||||
| R4 | Actual | 0.00% | $1,000.00 | $1,024.79 | $0.00 | |||||||||||||
| Hypothetical (h) | 0.00% | $1,000.00 | $1,024.79 | $0.00 | ||||||||||||||
| (h) | 5% class return per year before expenses. |
| (p) | “Expenses Paid During Period” are equal to each class’s annualized expense ratio, as shown above, multiplied by the average account value over the period, multiplied by 181/365 (to reflect the one-half year period). Expenses paid do not include any applicable sales charges (loads). If these transaction costs had been included, your costs would have been higher. In addition to the fees and expenses which the fund bears directly, the fund indirectly bears a pro rata share of the fees and expenses of the underlying funds in which the fund invests. If these indirect costs were included, your costs would have been higher. |
40
Table of Contents
Expense Tables – continued
MFS LIFETIME 2025 FUND
| Share Class | Annualized Expense Ratio | Beginning Account Value 11/01/14 | Ending Account Value | Expenses Paid During 11/01/14-4/30/15 | ||||||||||||||
| A | Actual | 0.23% | $1,000.00 | $1,031.04 | $1.16 | |||||||||||||
| Hypothetical (h) | 0.23% | $1,000.00 | $1,023.65 | $1.15 | ||||||||||||||
| B | Actual | 1.00% | $1,000.00 | $1,027.35 | $5.03 | |||||||||||||
| Hypothetical (h) | 1.00% | $1,000.00 | $1,019.84 | $5.01 | ||||||||||||||
| C | Actual | 1.00% | $1,000.00 | $1,026.72 | $5.03 | |||||||||||||
| Hypothetical (h) | 1.00% | $1,000.00 | $1,019.84 | $5.01 | ||||||||||||||
| I | Actual | 0.00% | $1,000.00 | $1,031.82 | $0.00 | |||||||||||||
| Hypothetical (h) | 0.00% | $1,000.00 | $1,024.79 | $0.00 | ||||||||||||||
| R1 | Actual | 1.00% | $1,000.00 | $1,027.04 | $5.03 | |||||||||||||
| Hypothetical (h) | 1.00% | $1,000.00 | $1,019.84 | $5.01 | ||||||||||||||
| R2 | Actual | 0.50% | $1,000.00 | $1,029.76 | $2.52 | |||||||||||||
| Hypothetical (h) | 0.50% | $1,000.00 | $1,022.32 | $2.51 | ||||||||||||||
| R3 | Actual | 0.25% | $1,000.00 | $1,030.29 | $1.26 | |||||||||||||
| Hypothetical (h) | 0.25% | $1,000.00 | $1,023.55 | $1.25 | ||||||||||||||
| R4 | Actual | 0.00% | $1,000.00 | $1,031.80 | $0.00 | |||||||||||||
| Hypothetical (h) | 0.00% | $1,000.00 | $1,024.79 | $0.00 | ||||||||||||||
| (h) | 5% class return per year before expenses. |
| (p) | “Expenses Paid During Period” are equal to each class’s annualized expense ratio, as shown above, multiplied by the average account value over the period, multiplied by 181/365 (to reflect the one-half year period). Expenses paid do not include any applicable sales charges (loads). If these transaction costs had been included, your costs would have been higher. In addition to the fees and expenses which the fund bears directly, the fund indirectly bears a pro rata share of the fees and expenses of the underlying funds in which the fund invests. If these indirect costs were included, your costs would have been higher. |
Notes to Expense Table
For the MFS Lifetime 2025 Fund, each class with a Rule 12b-1 service fee is subject to a rebate of a portion of such fee. Such rebates are included in the expense ratios above and are outside of the expense limitation arrangement. For Class A shares, this rebate reduced the expense ratio above by 0.02%. See Note 3 in the Notes to Financial Statements for additional information.
41
Table of Contents
Expense Tables – continued
MFS LIFETIME 2030 FUND
| Share Class | Annualized Expense Ratio | Beginning Account Value 11/01/14 | Ending Account Value | Expenses Paid During 11/01/14-4/30/15 | ||||||||||||||
| A | Actual | 0.25% | $1,000.00 | $1,036.86 | $1.26 | |||||||||||||
| Hypothetical (h) | 0.25% | $1,000.00 | $1,023.55 | $1.25 | ||||||||||||||
| B | Actual | 1.00% | $1,000.00 | $1,033.29 | $5.04 | |||||||||||||
| Hypothetical (h) | 1.00% | $1,000.00 | $1,019.84 | $5.01 | ||||||||||||||
| C | Actual | 1.00% | $1,000.00 | $1,032.47 | $5.04 | |||||||||||||
| Hypothetical (h) | 1.00% | $1,000.00 | $1,019.84 | $5.01 | ||||||||||||||
| I | Actual | 0.00% | $1,000.00 | $1,038.26 | $0.00 | |||||||||||||
| Hypothetical (h) | 0.00% | $1,000.00 | $1,024.79 | $0.00 | ||||||||||||||
| R1 | Actual | 1.00% | $1,000.00 | $1,033.05 | $5.04 | |||||||||||||
| Hypothetical (h) | 1.00% | $1,000.00 | $1,019.84 | $5.01 | ||||||||||||||
| R2 | Actual | 0.50% | $1,000.00 | $1,035.90 | $2.52 | |||||||||||||
| Hypothetical (h) | 0.50% | $1,000.00 | $1,022.32 | $2.51 | ||||||||||||||
| R3 | Actual | 0.25% | $1,000.00 | $1,036.83 | $1.26 | |||||||||||||
| Hypothetical (h) | 0.25% | $1,000.00 | $1,023.55 | $1.25 | ||||||||||||||
| R4 | Actual | 0.00% | $1,000.00 | $1,038.32 | $0.00 | |||||||||||||
| Hypothetical (h) | 0.00% | $1,000.00 | $1,024.79 | $0.00 | ||||||||||||||
| (h) | 5% class return per year before expenses. |
| (p) | “Expenses Paid During Period” are equal to each class’s annualized expense ratio, as shown above, multiplied by the average account value over the period, multiplied by 181/365 (to reflect the one-half year period). Expenses paid do not include any applicable sales charges (loads). If these transaction costs had been included, your costs would have been higher. In addition to the fees and expenses which the fund bears directly, the fund indirectly bears a pro rata share of the fees and expenses of the underlying funds in which the fund invests. If these indirect costs were included, your costs would have been higher. |
42
Table of Contents
Expense Tables – continued
MFS LIFETIME 2035 FUND
| Share Class | Annualized Expense Ratio | Beginning Account Value 11/01/14 | Ending Account Value | Expenses Paid During 11/01/14-4/30/15 | ||||||||||||||
| A | Actual | 0.24% | $1,000.00 | $1,040.35 | $1.21 | |||||||||||||
| Hypothetical (h) | 0.24% | $1,000.00 | $1,023.60 | $1.20 | ||||||||||||||
| B | Actual | 1.00% | $1,000.00 | $1,036.15 | $5.05 | |||||||||||||
| Hypothetical (h) | 1.00% | $1,000.00 | $1,019.84 | $5.01 | ||||||||||||||
| C | Actual | 1.00% | $1,000.00 | $1,036.24 | $5.05 | |||||||||||||
| Hypothetical (h) | 1.00% | $1,000.00 | $1,019.84 | $5.01 | ||||||||||||||
| I | Actual | 0.00% | $1,000.00 | $1,042.20 | $0.00 | |||||||||||||
| Hypothetical (h) | 0.00% | $1,000.00 | $1,024.79 | $0.00 | ||||||||||||||
| R1 | Actual | 1.00% | $1,000.00 | $1,036.41 | $5.05 | |||||||||||||
| Hypothetical (h) | 1.00% | $1,000.00 | $1,019.84 | $5.01 | ||||||||||||||
| R2 | Actual | 0.50% | $1,000.00 | $1,038.66 | $2.53 | |||||||||||||
| Hypothetical (h) | 0.50% | $1,000.00 | $1,022.32 | $2.51 | ||||||||||||||
| R3 | Actual | 0.25% | $1,000.00 | $1,040.15 | $1.26 | |||||||||||||
| Hypothetical (h) | 0.25% | $1,000.00 | $1,023.55 | $1.25 | ||||||||||||||
| R4 | Actual | 0.00% | $1,000.00 | $1,042.20 | $0.00 | |||||||||||||
| Hypothetical (h) | 0.00% | $1,000.00 | $1,024.79 | $0.00 | ||||||||||||||
| (h) | 5% class return per year before expenses. |
| (p) | “Expenses Paid During Period” are equal to each class’s annualized expense ratio, as shown above, multiplied by the average account value over the period, multiplied by 181/365 (to reflect the one-half year period). Expenses paid do not include any applicable sales charges (loads). If these transaction costs had been included, your costs would have been higher. In addition to the fees and expenses which the fund bears directly, the fund indirectly bears a pro rata share of the fees and expenses of the underlying funds in which the fund invests. If these indirect costs were included, your costs would have been higher. |
Notes to Expense Table
For the MFS Lifetime 2035 Fund, each class with a Rule 12b-1 service fee is subject to a rebate of a portion of such fee. Such rebates are included in the expense ratios above and are outside of the expense limitation arrangement. For Class A shares, this rebate reduced the expense ratio above by 0.01%. See Note 3 in the Notes to Financial Statements for additional information.
43
Table of Contents
Expense Tables – continued
MFS LIFETIME 2040 FUND
| Share Class | Annualized Expense Ratio | Beginning Account Value 11/01/14 | Ending Account Value | Expenses Paid During 11/01/14-4/30/15 | ||||||||||||||
| A | Actual | 0.25% | $1,000.00 | $1,043.09 | $1.27 | |||||||||||||
| Hypothetical (h) | 0.25% | $1,000.00 | $1,023.55 | $1.25 | ||||||||||||||
| B | Actual | 1.00% | $1,000.00 | $1,039.27 | $5.06 | |||||||||||||
| Hypothetical (h) | 1.00% | $1,000.00 | $1,019.84 | $5.01 | ||||||||||||||
| C | Actual | 1.00% | $1,000.00 | $1,039.51 | $5.06 | |||||||||||||
| Hypothetical (h) | 1.00% | $1,000.00 | $1,019.84 | $5.01 | ||||||||||||||
| I | Actual | 0.00% | $1,000.00 | $1,044.43 | $0.00 | |||||||||||||
| Hypothetical (h) | 0.00% | $1,000.00 | $1,024.79 | $0.00 | ||||||||||||||
| R1 | Actual | 1.00% | $1,000.00 | $1,039.37 | $5.06 | |||||||||||||
| Hypothetical (h) | 1.00% | $1,000.00 | $1,019.84 | $5.01 | ||||||||||||||
| R2 | Actual | 0.50% | $1,000.00 | $1,041.55 | $2.53 | |||||||||||||
| Hypothetical (h) | 0.50% | $1,000.00 | $1,022.32 | $2.51 | ||||||||||||||
| R3 | Actual | 0.25% | $1,000.00 | $1,043.80 | $1.27 | |||||||||||||
| Hypothetical (h) | 0.25% | $1,000.00 | $1,023.55 | $1.25 | ||||||||||||||
| R4 | Actual | 0.00% | $1,000.00 | $1,044.46 | $0.00 | |||||||||||||
| Hypothetical (h) | 0.00% | $1,000.00 | $1,024.79 | $0.00 | ||||||||||||||
| (h) | 5% class return per year before expenses. |
| (p) | “Expenses Paid During Period” are equal to each class’s annualized expense ratio, as shown above, multiplied by the average account value over the period, multiplied by 181/365 (to reflect the one-half year period). Expenses paid do not include any applicable sales charges (loads). If these transaction costs had been included, your costs would have been higher. In addition to the fees and expenses which the fund bears directly, the fund indirectly bears a pro rata share of the fees and expenses of the underlying funds in which the fund invests. If these indirect costs were included, your costs would have been higher. |
44
Table of Contents
Expense Tables – continued
MFS LIFETIME 2045 FUND
| Share Class | Annualized Expense Ratio | Beginning Account Value 11/01/14 | Ending Account Value | Expenses Paid During 11/01/14-4/30/15 | ||||||||||||||
| A | Actual | 0.24% | $1,000.00 | $1,043.68 | $1.22 | |||||||||||||
| Hypothetical (h) | 0.24% | $1,000.00 | $1,023.60 | $1.20 | ||||||||||||||
| B | Actual | 1.00% | $1,000.00 | $1,039.43 | $5.06 | |||||||||||||
| Hypothetical (h) | 1.00% | $1,000.00 | $1,019.84 | $5.01 | ||||||||||||||
| C | Actual | 1.00% | $1,000.00 | $1,039.25 | $5.06 | |||||||||||||
| Hypothetical (h) | 1.00% | $1,000.00 | $1,019.84 | $5.01 | ||||||||||||||
| I | Actual | 0.00% | $1,000.00 | $1,044.67 | $0.00 | |||||||||||||
| Hypothetical (h) | 0.00% | $1,000.00 | $1,024.79 | $0.00 | ||||||||||||||
| R1 | Actual | 1.00% | $1,000.00 | $1,039.68 | $5.06 | |||||||||||||
| Hypothetical (h) | 1.00% | $1,000.00 | $1,019.84 | $5.01 | ||||||||||||||
| R2 | Actual | 0.50% | $1,000.00 | $1,042.41 | $2.53 | |||||||||||||
| Hypothetical (h) | 0.50% | $1,000.00 | $1,022.32 | $2.51 | ||||||||||||||
| R3 | Actual | 0.25% | $1,000.00 | $1,042.61 | $1.27 | |||||||||||||
| Hypothetical (h) | 0.25% | $1,000.00 | $1,023.55 | $1.25 | ||||||||||||||
| R4 | Actual | 0.00% | $1,000.00 | $1,043.87 | $0.00 | |||||||||||||
| Hypothetical (h) | 0.00% | $1,000.00 | $1,024.79 | $0.00 | ||||||||||||||
| (h) | 5% class return per year before expenses. |
| (p) | “Expenses Paid During Period” are equal to each class’s annualized expense ratio, as shown above, multiplied by the average account value over the period, multiplied by 181/365 (to reflect the one-half year period). Expenses paid do not include any applicable sales charges (loads). If these transaction costs had been included, your costs would have been higher. In addition to the fees and expenses which the fund bears directly, the fund indirectly bears a pro rata share of the fees and expenses of the underlying funds in which the fund invests. If these indirect costs were included, your costs would have been higher. |
Notes to Expense Table
For the MFS Lifetime 2045 Fund, each class with a Rule 12b-1 service fee is subject to a rebate of a portion of such fee. Such rebates are included in the expense ratios above and are outside of the expense limitation arrangement. For Class A shares, this rebate reduced the expense ratio above by 0.01%. See Note 3 in the Notes to Financial Statements for additional information.
45
Table of Contents
Expense Tables – continued
MFS LIFETIME 2050 FUND
| Share Class | Annualized Expense Ratio | Beginning Account Value 11/01/14 | Ending Account Value | Expenses Paid During 11/01/14-4/30/15 | ||||||||||||||
| A | Actual | 0.25% | $1,000.00 | $1,043.06 | $1.27 | |||||||||||||
| Hypothetical (h) | 0.25% | $1,000.00 | $1,023.55 | $1.25 | ||||||||||||||
| B | Actual | 1.00% | $1,000.00 | $1,038.58 | $5.05 | |||||||||||||
| Hypothetical (h) | 1.00% | $1,000.00 | $1,019.84 | $5.01 | ||||||||||||||
| C | Actual | 1.00% | $1,000.00 | $1,039.11 | $5.06 | |||||||||||||
| Hypothetical (h) | 1.00% | $1,000.00 | $1,019.84 | $5.01 | ||||||||||||||
| I | Actual | 0.00% | $1,000.00 | $1,044.02 | $0.00 | |||||||||||||
| Hypothetical (h) | 0.00% | $1,000.00 | $1,024.79 | $0.00 | ||||||||||||||
| R1 | Actual | 1.00% | $1,000.00 | $1,038.55 | $5.05 | |||||||||||||
| Hypothetical (h) | 1.00% | $1,000.00 | $1,019.84 | $5.01 | ||||||||||||||
| R2 | Actual | 0.50% | $1,000.00 | $1,041.76 | $2.53 | |||||||||||||
| Hypothetical (h) | 0.50% | $1,000.00 | $1,022.32 | $2.51 | ||||||||||||||
| R3 | Actual | 0.25% | $1,000.00 | $1,043.19 | $1.27 | |||||||||||||
| Hypothetical (h) | 0.25% | $1,000.00 | $1,023.55 | $1.25 | ||||||||||||||
| R4 | Actual | 0.00% | $1,000.00 | $1,044.70 | $0.00 | |||||||||||||
| Hypothetical (h) | 0.00% | $1,000.00 | $1,024.79 | $0.00 | ||||||||||||||
| (h) | 5% class return per year before expenses. |
| (p) | “Expenses Paid During Period” are equal to each class’s annualized expense ratio, as shown above, multiplied by the average account value over the period, multiplied by 181/365 (to reflect the one-half year period). Expenses paid do not include any applicable sales charges (loads). If these transaction costs had been included, your costs would have been higher. In addition to the fees and expenses which the fund bears directly, the fund indirectly bears a pro rata share of the fees and expenses of the underlying funds in which the fund invests. If these indirect costs were included, your costs would have been higher. |
46
Table of Contents
Expense Tables – continued
MFS LIFETIME 2055 FUND
| Share Class | Annualized Expense Ratio | Beginning Account Value 11/01/14 | Ending Account Value | Expenses Paid During 11/01/14-4/30/15 | ||||||||||||||
| A | Actual | 0.25% | $1,000.00 | $1,042.44 | $1.27 | |||||||||||||
| Hypothetical (h) | 0.25% | $1,000.00 | $1,023.55 | $1.25 | ||||||||||||||
| B | Actual | 1.00% | $1,000.00 | $1,038.85 | $5.06 | |||||||||||||
| Hypothetical (h) | 1.00% | $1,000.00 | $1,019.84 | $5.01 | ||||||||||||||
| C | Actual | 1.00% | $1,000.00 | $1,039.12 | $5.06 | |||||||||||||
| Hypothetical (h) | 1.00% | $1,000.00 | $1,019.84 | $5.01 | ||||||||||||||
| I | Actual | 0.00% | $1,000.00 | $1,044.81 | $0.00 | |||||||||||||
| Hypothetical (h) | 0.00% | $1,000.00 | $1,024.79 | $0.00 | ||||||||||||||
| R1 | Actual | 1.00% | $1,000.00 | $1,038.98 | $5.06 | |||||||||||||
| Hypothetical (h) | 1.00% | $1,000.00 | $1,019.84 | $5.01 | ||||||||||||||
| R2 | Actual | 0.50% | $1,000.00 | $1,041.38 | $2.53 | |||||||||||||
| Hypothetical (h) | 0.50% | $1,000.00 | $1,022.32 | $2.51 | ||||||||||||||
| R3 | Actual | 0.25% | $1,000.00 | $1,042.93 | $1.27 | |||||||||||||
| Hypothetical (h) | 0.25% | $1,000.00 | $1,023.55 | $1.25 | ||||||||||||||
| R4 | Actual | 0.00% | $1,000.00 | $1,044.00 | $0.00 | |||||||||||||
| Hypothetical (h) | 0.00% | $1,000.00 | $1,024.79 | $0.00 | ||||||||||||||
| (h) | 5% class return per year before expenses. |
| (p) | “Expenses Paid During Period” are equal to each class’s annualized expense ratio, as shown above, multiplied by the average account value over the period, multiplied by 181/365 (to reflect the one-half year period). Expenses paid do not include any applicable sales charges (loads). If these transaction costs had been included, your costs would have been higher. In addition to the fees and expenses which the fund bears directly, the fund indirectly bears a pro rata share of the fees and expenses of the underlying funds in which the fund invests. If these indirect costs were included, your costs would have been higher. |
47
Table of Contents
4/30/15
The Portfolio of Investments is a complete list of all securities owned by your fund. It is categorized by broad-based asset classes.
MFS LIFETIME INCOME FUND
| Underlying Affiliated Funds - 99.8% | ||||||||
| Issuer | Shares/Par | Value ($) | ||||||
| MFS Absolute Return Fund - Class R5 | 1,148,747 | $ | 10,993,508 | |||||
| MFS Commodity Strategy Fund - Class R5 (v) | 798,738 | 5,599,154 | ||||||
| MFS Emerging Markets Debt Fund - Class R5 | 738,664 | 11,043,034 | ||||||
| MFS Emerging Markets Debt Local Currency Fund - Class R5 | 712,954 | 5,525,393 | ||||||
| MFS Global Bond Fund - Class R5 | 3,163,368 | 27,616,199 | ||||||
| MFS Global Real Estate Fund - Class R5 | 335,202 | 5,440,335 | ||||||
| MFS Government Securities Fund - Class R5 | 5,403,905 | 55,011,749 | ||||||
| MFS Growth Fund - Class R5 | 293,971 | 21,633,312 | ||||||
| MFS High Income Fund - Class R5 | 4,674,326 | 16,593,858 | ||||||
| MFS Inflation-Adjusted Bond Fund - Class R5 | 5,216,982 | 55,039,160 | ||||||
| MFS International Growth Fund - Class R5 | 193,896 | 5,491,137 | ||||||
| MFS International Value Fund - Class R5 | 150,944 | 5,462,678 | ||||||
| MFS Limited Maturity Fund - Class R5 | 18,325,377 | 110,135,517 | ||||||
| MFS Mid Cap Growth Fund - Class R5 | 1,072,685 | 16,197,548 | ||||||
| MFS Mid Cap Value Fund - Class R5 | 775,586 | 16,318,320 | ||||||
| MFS New Discovery Fund - Class R5 | 204,722 | 5,312,541 | ||||||
| MFS New Discovery Value Fund - Class R5 | 411,255 | 5,428,566 | ||||||
| MFS Research Fund - Class R5 | 557,139 | 21,778,577 | ||||||
| MFS Research International Fund - Class R5 | 926,737 | 16,449,581 | ||||||
| MFS Total Return Bond Fund - Class R5 | 10,034,020 | 109,972,863 | ||||||
| MFS Value Fund - Class R5 | 621,456 | 21,831,740 | ||||||
| Total Underlying Affiliated Funds (Identified Cost, $502,324,155) | $ | 548,874,770 | ||||||
| Money Market Funds - 0.1% | ||||||||
| MFS Institutional Money Market Portfolio, 0.09%, at Cost and Net Asset Value (v) | 459,319 | $ | 459,319 | |||||
| Total Investments (Identified Cost, $502,783,474) | $ | 549,334,089 | ||||||
| Other Assets, Less Liabilities - 0.1% | 646,205 | |||||||
| Net Assets - 100.0% | $ | 549,980,294 | ||||||
See Portfolio Footnotes and Notes to Financial Statements
48
Table of Contents
Portfolios of Investments – continued
MFS LIFETIME 2015 FUND
| Underlying Affiliated Funds - 99.8% | ||||||||
| Issuer | Shares/Par | Value ($) | ||||||
| MFS Absolute Return Fund - Class R5 | 108,428 | $ | 1,037,654 | |||||
| MFS Commodity Strategy Fund - Class R5 (v) | 76,123 | 533,624 | ||||||
| MFS Emerging Markets Debt Fund - Class R5 | 72,934 | 1,090,359 | ||||||
| MFS Emerging Markets Debt Local Currency Fund - Class R5 | 73,733 | 571,428 | ||||||
| MFS Global Bond Fund - Class R5 | 299,144 | 2,611,531 | ||||||
| MFS Global Real Estate Fund - Class R5 | 31,738 | 515,101 | ||||||
| MFS Government Securities Fund - Class R5 | 509,685 | 5,188,593 | ||||||
| MFS Growth Fund - Class R5 | 29,016 | 2,135,288 | ||||||
| MFS High Income Fund - Class R5 | 467,389 | 1,659,232 | ||||||
| MFS Inflation-Adjusted Bond Fund - Class R5 | 491,306 | 5,183,275 | ||||||
| MFS International Growth Fund - Class R5 | 19,985 | 565,984 | ||||||
| MFS International Value Fund - Class R5 | 15,550 | 562,763 | ||||||
| MFS Limited Maturity Fund - Class R5 | 1,654,434 | 9,943,148 | ||||||
| MFS Mid Cap Growth Fund - Class R5 | 104,421 | 1,576,764 | ||||||
| MFS Mid Cap Value Fund - Class R5 | 75,463 | 1,587,736 | ||||||
| MFS New Discovery Fund - Class R5 | 19,376 | 502,820 | ||||||
| MFS New Discovery Value Fund - Class R5 | 38,914 | 513,663 | ||||||
| MFS Research Fund - Class R5 | 54,995 | 2,149,768 | ||||||
| MFS Research International Fund - Class R5 | 90,385 | 1,604,332 | ||||||
| MFS Total Return Bond Fund - Class R5 | 925,780 | 10,146,549 | ||||||
| MFS Value Fund - Class R5 | 61,323 | 2,154,267 | ||||||
| Total Underlying Affiliated Funds (Identified Cost, $49,771,480) | $ | 51,833,879 | ||||||
| Money Market Funds - 0.2% | ||||||||
| MFS Institutional Money Market Portfolio, 0.09%, at Cost and Net Asset Value (v) | 132,138 | $ | 132,138 | |||||
| Total Investments (Identified Cost, $49,903,618) | $ | 51,966,017 | ||||||
| Other Assets, Less Liabilities - (0.0)% | (5,481) | |||||||
| Net Assets - 100.0% | $ | 51,960,536 | ||||||
See Portfolio Footnotes and Notes to Financial Statements
49
Table of Contents
Portfolios of Investments – continued
MFS LIFETIME 2020 FUND
| Underlying Affiliated Funds - 100.0% | ||||||||
| Issuer | Shares/Par | Value ($) | ||||||
| MFS Absolute Return Fund - Class R5 | 726,200 | $ | 6,949,737 | |||||
| MFS Commodity Strategy Fund - Class R5 (v) | 632,482 | 4,433,702 | ||||||
| MFS Emerging Markets Debt Fund - Class R5 | 736,486 | 11,010,462 | ||||||
| MFS Emerging Markets Debt Local Currency Fund - Class R5 | 952,304 | 7,380,358 | ||||||
| MFS Global Bond Fund - Class R5 | 2,093,779 | 18,278,688 | ||||||
| MFS Global Real Estate Fund - Class R5 | 242,441 | 3,934,815 | ||||||
| MFS Government Securities Fund - Class R5 | 3,566,820 | 36,310,229 | ||||||
| MFS Growth Fund - Class R5 | 302,401 | 22,253,700 | ||||||
| MFS High Income Fund - Class R5 | 5,162,004 | 18,325,116 | ||||||
| MFS Inflation-Adjusted Bond Fund - Class R5 | 3,352,589 | 35,369,813 | ||||||
| MFS International Growth Fund - Class R5 | 271,415 | 7,686,483 | ||||||
| MFS International New Discovery Fund - Class R5 | 11,449 | 342,431 | ||||||
| MFS International Value Fund - Class R5 | 210,802 | 7,628,920 | ||||||
| MFS Limited Maturity Fund - Class R5 | 5,494,568 | 33,022,351 | ||||||
| MFS Mid Cap Growth Fund - Class R5 | 1,017,858 | 15,369,655 | ||||||
| MFS Mid Cap Value Fund - Class R5 | 733,189 | 15,426,302 | ||||||
| MFS New Discovery Fund - Class R5 | 143,479 | 3,723,275 | ||||||
| MFS New Discovery Value Fund - Class R5 | 285,957 | 3,774,634 | ||||||
| MFS Research Fund - Class R5 | 572,063 | 22,361,929 | ||||||
| MFS Research International Fund - Class R5 | 865,645 | 15,365,198 | ||||||
| MFS Total Return Bond Fund - Class R5 | 4,757,242 | 52,139,374 | ||||||
| MFS Value Fund - Class R5 | 636,848 | 22,372,472 | ||||||
| Total Underlying Affiliated Funds (Identified Cost, $309,884,287) | $ | 363,459,644 | ||||||
| Money Market Funds - 0.0% | ||||||||
| MFS Institutional Money Market Portfolio, 0.09%, at Cost and Net Asset Value (v) | 115,762 | $ | 115,762 | |||||
| Total Investments (Identified Cost, $310,000,049) | $ | 363,575,406 | ||||||
| Other Assets, Less Liabilities - 0.0% | 59,907 | |||||||
| Net Assets - 100.0% | $ | 363,635,313 | ||||||
See Portfolio Footnotes and Notes to Financial Statements
50
Table of Contents
Portfolios of Investments – continued
MFS LIFETIME 2025 FUND
| Underlying Affiliated Funds - 99.9% | ||||||||
| Issuer | Shares/Par | Value ($) | ||||||
| MFS Absolute Return Fund - Class R5 | 135,448 | $ | 1,296,235 | |||||
| MFS Commodity Strategy Fund - Class R5 (v) | 587,168 | 4,116,046 | ||||||
| MFS Emerging Markets Debt Fund - Class R5 | 261,593 | 3,910,808 | ||||||
| MFS Emerging Markets Debt Local Currency Fund - Class R5 | 338,504 | 2,623,409 | ||||||
| MFS Emerging Markets Equity Fund - Class R5 | 3,962 | 119,287 | ||||||
| MFS Global Bond Fund - Class R5 | 709,122 | 6,190,639 | ||||||
| MFS Global Real Estate Fund - Class R5 | 165,268 | 2,682,306 | ||||||
| MFS Government Securities Fund - Class R5 | 1,164,875 | 11,858,425 | ||||||
| MFS Growth Fund - Class R5 | 143,594 | 10,567,080 | ||||||
| MFS High Income Fund - Class R5 | 1,839,457 | 6,530,074 | ||||||
| MFS Inflation-Adjusted Bond Fund - Class R5 | 839,670 | 8,858,523 | ||||||
| MFS International Growth Fund - Class R5 | 145,048 | 4,107,773 | ||||||
| MFS International New Discovery Fund - Class R5 | 47,164 | 1,410,688 | ||||||
| MFS International Value Fund - Class R5 | 112,982 | 4,088,817 | ||||||
| MFS Mid Cap Growth Fund - Class R5 | 607,984 | 9,180,566 | ||||||
| MFS Mid Cap Value Fund - Class R5 | 438,148 | 9,218,633 | ||||||
| MFS New Discovery Fund - Class R5 | 75,263 | 1,953,070 | ||||||
| MFS New Discovery Value Fund - Class R5 | 150,109 | 1,981,444 | ||||||
| MFS Research Fund - Class R5 | 262,869 | 10,275,541 | ||||||
| MFS Research International Fund - Class R5 | 443,086 | 7,864,769 | ||||||
| MFS Total Return Bond Fund - Class R5 | 896,169 | 9,822,016 | ||||||
| MFS Value Fund - Class R5 | 302,805 | 10,637,554 | ||||||
| Total Underlying Affiliated Funds (Identified Cost, $120,791,004) | $ | 129,293,703 | ||||||
| Money Market Funds - 0.1% | ||||||||
| MFS Institutional Money Market Portfolio, 0.09%, at Cost and Net Asset Value (v) | 175,511 | $ | 175,511 | |||||
| Total Investments (Identified Cost, $120,966,515) | $ | 129,469,214 | ||||||
| Other Assets, Less Liabilities - (0.0)% | (60,483) | |||||||
| Net Assets - 100.0% | $ | 129,408,731 | ||||||
See Portfolio Footnotes and Notes to Financial Statements
51
Table of Contents
Portfolios of Investments – continued
MFS LIFETIME 2030 FUND
| Underlying Affiliated Funds - 99.9% | ||||||||
| Issuer | Shares/Par | Value ($) | ||||||
| MFS Absolute Return Fund - Class R5 | 407,793 | $ | 3,902,580 | |||||
| MFS Commodity Strategy Fund - Class R5 (v) | 2,414,842 | 16,928,045 | ||||||
| MFS Emerging Markets Debt Fund - Class R5 | 786,522 | 11,758,509 | ||||||
| MFS Emerging Markets Debt Local Currency Fund - Class R5 | 1,016,461 | 7,877,576 | ||||||
| MFS Emerging Markets Equity Fund - Class R5 | 141,680 | 4,265,987 | ||||||
| MFS Global Bond Fund - Class R5 | 897,515 | 7,835,305 | ||||||
| MFS Global Real Estate Fund - Class R5 | 771,999 | 12,529,552 | ||||||
| MFS Growth Fund - Class R5 | 607,663 | 44,717,952 | ||||||
| MFS High Income Fund - Class R5 | 5,529,551 | 19,629,906 | ||||||
| MFS Inflation-Adjusted Bond Fund - Class R5 | 1,890,956 | 19,949,588 | ||||||
| MFS International Growth Fund - Class R5 | 734,976 | 20,814,529 | ||||||
| MFS International New Discovery Fund - Class R5 | 286,164 | 8,559,178 | ||||||
| MFS International Value Fund - Class R5 | 572,072 | 20,703,271 | ||||||
| MFS Mid Cap Growth Fund - Class R5 | 2,426,163 | 36,635,061 | ||||||
| MFS Mid Cap Value Fund - Class R5 | 1,744,754 | 36,709,625 | ||||||
| MFS New Discovery Fund - Class R5 | 313,930 | 8,146,471 | ||||||
| MFS New Discovery Value Fund - Class R5 | 620,810 | 8,194,688 | ||||||
| MFS Research Fund - Class R5 | 830,445 | 32,462,088 | ||||||
| MFS Research International Fund - Class R5 | 1,622,394 | 28,797,499 | ||||||
| MFS Total Return Bond Fund - Class R5 | 1,108,500 | 12,149,161 | ||||||
| MFS Value Fund - Class R5 | 1,276,787 | 44,853,510 | ||||||
| Total Underlying Affiliated Funds (Identified Cost, $331,043,860) | $ | 407,420,081 | ||||||
| Money Market Funds - 0.1% | ||||||||
| MFS Institutional Money Market Portfolio, 0.09%, at Cost and Net Asset Value (v) | 325,286 | $ | 325,286 | |||||
| Total Investments (Identified Cost, $331,369,146) | $ | 407,745,367 | ||||||
| Other Assets, Less Liabilities - (0.0)% | (143,143) | |||||||
| Net Assets - 100.0% | $ | 407,602,224 | ||||||
See Portfolio Footnotes and Notes to Financial Statements
52
Table of Contents
Portfolios of Investments – continued
MFS LIFETIME 2035 FUND
| Underlying Affiliated Funds - 99.9% | ||||||||
| Issuer | Shares/Par | Value ($) | ||||||
| MFS Absolute Return Fund - Class R5 | 50,975 | $ | 487,831 | |||||
| MFS Commodity Strategy Fund - Class R5 (v) | 702,122 | 4,921,874 | ||||||
| MFS Emerging Markets Debt Fund - Class R5 | 98,175 | 1,467,716 | ||||||
| MFS Emerging Markets Debt Local Currency Fund - Class R5 | 126,652 | 981,552 | ||||||
| MFS Emerging Markets Equity Fund - Class R5 | 54,456 | 1,639,670 | ||||||
| MFS Global Bond Fund - Class R5 | 112,174 | 979,280 | ||||||
| MFS Global Real Estate Fund - Class R5 | 266,973 | 4,332,965 | ||||||
| MFS Growth Fund - Class R5 | 165,044 | 12,145,559 | ||||||
| MFS High Income Fund - Class R5 | 689,914 | 2,449,195 | ||||||
| MFS Inflation-Adjusted Bond Fund - Class R5 | 368,316 | 3,885,737 | ||||||
| MFS International Growth Fund - Class R5 | 229,115 | 6,488,538 | ||||||
| MFS International New Discovery Fund - Class R5 | 110,033 | 3,291,087 | ||||||
| MFS International Value Fund - Class R5 | 178,644 | 6,465,142 | ||||||
| MFS Mid Cap Growth Fund - Class R5 | 664,682 | 10,036,699 | ||||||
| MFS Mid Cap Value Fund - Class R5 | 480,080 | 10,100,888 | ||||||
| MFS New Discovery Fund - Class R5 | 90,869 | 2,358,052 | ||||||
| MFS New Discovery Value Fund - Class R5 | 181,724 | 2,398,751 | ||||||
| MFS Research Fund - Class R5 | 216,527 | 8,464,056 | ||||||
| MFS Research International Fund - Class R5 | 452,676 | 8,034,991 | ||||||
| MFS Total Return Bond Fund - Class R5 | 265,653 | 2,911,555 | ||||||
| MFS Value Fund - Class R5 | 348,651 | 12,248,111 | ||||||
| Total Underlying Affiliated Funds (Identified Cost, $97,948,239) | $ | 106,089,249 | ||||||
| Money Market Funds - 0.1% | ||||||||
| MFS Institutional Money Market Portfolio, 0.09%, at Cost and Net Asset Value (v) | 127,597 | $ | 127,597 | |||||
| Total Investments (Identified Cost, $98,075,836) | $ | 106,216,846 | ||||||
| Other Assets, Less Liabilities - (0.0)% | (21,474) | |||||||
| Net Assets - 100.0% | $ | 106,195,372 | ||||||
See Portfolio Footnotes and Notes to Financial Statements
53
Table of Contents
Portfolios of Investments – continued
MFS LIFETIME 2040 FUND
| Underlying Affiliated Funds - 99.9% | ||||||||
| Issuer | Shares/Par | Value ($) | ||||||
| MFS Commodity Strategy Fund - Class R5 (v) | 2,284,977 | $ | 16,017,687 | |||||
| MFS Emerging Markets Equity Fund - Class R5 | 207,518 | 6,248,379 | ||||||
| MFS Global Real Estate Fund - Class R5 | 951,132 | 15,436,865 | ||||||
| MFS Growth Fund - Class R5 | 501,672 | 36,918,053 | ||||||
| MFS Inflation-Adjusted Bond Fund - Class R5 | 736,598 | 7,771,113 | ||||||
| MFS International Growth Fund - Class R5 | 772,666 | 21,881,912 | ||||||
| MFS International New Discovery Fund - Class R5 | 418,740 | 12,524,526 | ||||||
| MFS International Value Fund - Class R5 | 600,090 | 21,717,251 | ||||||
| MFS Mid Cap Growth Fund - Class R5 | 2,035,310 | 30,733,186 | ||||||
| MFS Mid Cap Value Fund - Class R5 | 1,466,299 | 30,850,941 | ||||||
| MFS New Discovery Fund - Class R5 | 293,767 | 7,623,261 | ||||||
| MFS New Discovery Value Fund - Class R5 | 584,322 | 7,713,051 | ||||||
| MFS Research Fund - Class R5 | 632,099 | 24,708,748 | ||||||
| MFS Research International Fund - Class R5 | 1,409,536 | 25,019,264 | ||||||
| MFS Total Return Bond Fund - Class R5 | 707,507 | 7,754,277 | ||||||
| MFS Value Fund - Class R5 | 1,056,120 | 37,101,496 | ||||||
| Total Underlying Affiliated Funds (Identified Cost, $246,232,870) | $ | 310,020,010 | ||||||
| Money Market Funds - 0.1% | ||||||||
| MFS Institutional Money Market Portfolio, 0.09%, at Cost and Net Asset Value (v) | 283,753 | $ | 283,753 | |||||
| Total Investments (Identified Cost, $246,516,623) | $ | 310,303,763 | ||||||
| Other Assets, Less Liabilities - (0.0)% | (16,713) | |||||||
| Net Assets - 100.0% | $ | 310,287,050 | ||||||
| MFS LIFETIME 2045 FUND | ||||||||
| Underlying Affiliated Funds - 99.8% | ||||||||
| Issuer | Shares/Par | Value ($) | ||||||
| MFS Commodity Strategy Fund - Class R5 (v) | 456,832 | $ | 3,202,395 | |||||
| MFS Emerging Markets Equity Fund - Class R5 | 41,279 | 1,242,899 | ||||||
| MFS Global Real Estate Fund - Class R5 | 190,351 | 3,089,401 | ||||||
| MFS Growth Fund - Class R5 | 100,199 | 7,373,643 | ||||||
| MFS Inflation-Adjusted Bond Fund - Class R5 | 147,740 | 1,558,652 | ||||||
| MFS International Growth Fund - Class R5 | 153,893 | 4,358,250 | ||||||
| MFS International New Discovery Fund - Class R5 | 83,260 | 2,490,294 | ||||||
| MFS International Value Fund - Class R5 | 119,768 | 4,334,405 | ||||||
| MFS Mid Cap Growth Fund - Class R5 | 407,442 | 6,152,372 | ||||||
| MFS Mid Cap Value Fund - Class R5 | 293,584 | 6,177,000 | ||||||
| MFS New Discovery Fund - Class R5 | 58,717 | 1,523,711 | ||||||
| MFS New Discovery Value Fund - Class R5 | 116,786 | 1,541,578 | ||||||
| MFS Research Fund - Class R5 | 126,291 | 4,936,732 | ||||||
| MFS Research International Fund - Class R5 | 280,121 | 4,972,142 | ||||||
| MFS Total Return Bond Fund - Class R5 | 142,203 | 1,558,547 | ||||||
| MFS Value Fund - Class R5 | 211,346 | 7,424,601 | ||||||
| Total Underlying Affiliated Funds (Identified Cost, $57,307,105) | $ | 61,936,622 | ||||||
| Money Market Funds - 0.2% | ||||||||
| MFS Institutional Money Market Portfolio, 0.09%, at Cost and Net Asset Value (v) | 126,102 | $ | 126,102 | |||||
| Total Investments (Identified Cost, $57,433,207) | $ | 62,062,724 | ||||||
| Other Assets, Less Liabilities - (0.0)% | (7,281) | |||||||
| Net Assets - 100.0% | $ | 62,055,443 | ||||||
See Portfolio Footnotes and Notes to Financial Statements
54
Table of Contents
Portfolios of Investments – continued
MFS LIFETIME 2050 FUND
| Underlying Affiliated Funds - 99.8% | ||||||||
| Issuer | Shares/Par | Value ($) | ||||||
| MFS Commodity Strategy Fund - Class R5 (v) | 666,622 | $ | 4,673,021 | |||||
| MFS Emerging Markets Equity Fund - Class R5 | 60,028 | 1,807,440 | ||||||
| MFS Global Real Estate Fund - Class R5 | 278,526 | 4,520,475 | ||||||
| MFS Growth Fund - Class R5 | 146,870 | 10,808,177 | ||||||
| MFS Inflation-Adjusted Bond Fund - Class R5 | 216,046 | 2,279,288 | ||||||
| MFS International Growth Fund - Class R5 | 224,972 | 6,371,218 | ||||||
| MFS International New Discovery Fund - Class R5 | 121,719 | 3,640,614 | ||||||
| MFS International Value Fund - Class R5 | 175,055 | 6,335,225 | ||||||
| MFS Mid Cap Growth Fund - Class R5 | 597,199 | 9,017,701 | ||||||
| MFS Mid Cap Value Fund - Class R5 | 429,627 | 9,039,350 | ||||||
| MFS New Discovery Fund - Class R5 | 86,263 | 2,238,520 | ||||||
| MFS New Discovery Value Fund - Class R5 | 170,743 | 2,253,813 | ||||||
| MFS Research Fund - Class R5 | 184,790 | 7,223,446 | ||||||
| MFS Research International Fund - Class R5 | 409,752 | 7,273,094 | ||||||
| MFS Total Return Bond Fund - Class R5 | 208,040 | 2,280,121 | ||||||
| MFS Value Fund - Class R5 | 308,948 | 10,853,356 | ||||||
| Total Underlying Affiliated Funds (Identified Cost, $80,746,720) | $ | 90,614,859 | ||||||
| Money Market Funds - 0.4% | ||||||||
| MFS Institutional Money Market Portfolio, 0.09%, at Cost and Net Asset Value (v) | 371,340 | $ | 371,340 | |||||
| Total Investments (Identified Cost, $81,118,060) | $ | 90,986,199 | ||||||
| Other Assets, Less Liabilities - (0.2)% | (205,921) | |||||||
| Net Assets - 100.0% | $ | 90,780,278 | ||||||
| MFS LIFETIME 2055 FUND | ||||||||
| Underlying Affiliated Funds - 98.9% | ||||||||
| Issuer | Shares/Par | Value ($) | ||||||
| MFS Commodity Strategy Fund - Class R5 (v) | 79,829 | $ | 559,598 | |||||
| MFS Emerging Markets Equity Fund - Class R5 | 7,220 | 217,393 | ||||||
| MFS Global Real Estate Fund - Class R5 | 33,550 | 544,519 | ||||||
| MFS Growth Fund - Class R5 | 17,721 | 1,304,099 | ||||||
| MFS Inflation-Adjusted Bond Fund - Class R5 | 25,982 | 274,114 | ||||||
| MFS International Growth Fund - Class R5 | 27,048 | 765,999 | ||||||
| MFS International New Discovery Fund - Class R5 | 14,588 | 436,339 | ||||||
| MFS International Value Fund - Class R5 | 21,072 | 762,613 | ||||||
| MFS Mid Cap Growth Fund - Class R5 | 72,084 | 1,088,467 | ||||||
| MFS Mid Cap Value Fund - Class R5 | 51,777 | 1,089,385 | ||||||
| MFS New Discovery Fund - Class R5 | 10,450 | 271,185 | ||||||
| MFS New Discovery Value Fund - Class R5 | 20,595 | 271,851 | ||||||
| MFS Research Fund - Class R5 | 22,269 | 870,482 | ||||||
| MFS Research International Fund - Class R5 | 49,153 | 872,471 | ||||||
| MFS Total Return Bond Fund - Class R5 | 25,027 | 274,301 | ||||||
| MFS Value Fund - Class R5 | 37,212 | 1,307,271 | ||||||
| Total Underlying Affiliated Funds (Identified Cost, $10,288,727) | $ | 10,910,087 | ||||||
| Money Market Funds - 1.2% | ||||||||
| MFS Institutional Money Market Portfolio, 0.09%, at Cost and Net Asset Value (v) | 130,040 | $ | 130,040 | |||||
| Total Investments (Identified Cost, $10,418,767) | $ | 11,040,127 | ||||||
| Other Assets, Less Liabilities - (0.1)% | (14,400) | |||||||
| Net Assets - 100.0% | $ | 11,025,727 | ||||||
Portfolio Footnotes:
| (v) | Underlying affiliated fund that is available only to investment companies managed by MFS. The rate quoted for the MFS Institutional Money Market Portfolio is the annualized seven-day yield of the fund at period end. |
See Notes to Financial Statements
55
Table of Contents
Financial Statements
STATEMENTS OF ASSETS AND LIABILITIES
At 4/30/15
These statements represent each fund’s balance sheet, which details the assets and liabilities comprising the total value of each fund.
| MFS Lifetime Income Fund | MFS Lifetime 2015 Fund | MFS Lifetime 2020 Fund | MFS Lifetime 2025 Fund | MFS Lifetime 2030 Fund | ||||||||||||||||
| Assets | ||||||||||||||||||||
| Investments | ||||||||||||||||||||
Underlying affiliated funds, at value (Identified cost, $502,783,474, $49,903,618, $310,000,049, $120,966,515, and $331,369,146, respectively) | $549,334,089 | $51,966,017 | $363,575,406 | $129,469,214 | $407,745,367 | |||||||||||||||
| Receivables for | ||||||||||||||||||||
Investments sold | 780,727 | 15,292 | 219,368 | — | 86,169 | |||||||||||||||
Fund shares sold | 8,803,844 | 22,969 | 4,586,756 | 190,637 | 7,696,230 | |||||||||||||||
Receivable from investment adviser | 151,120 | 20,540 | 73,269 | 29,571 | 105,039 | |||||||||||||||
Other assets | 2,064 | 349 | 1,610 | 600 | 1,627 | |||||||||||||||
Total assets | $559,071,844 | $52,025,167 | $368,456,409 | $129,690,022 | $415,634,432 | |||||||||||||||
| Liabilities | ||||||||||||||||||||
| Payables for | ||||||||||||||||||||
Distributions | $15,676 | $— | $— | $— | $— | |||||||||||||||
Investments purchased | 77,181 | 23,122 | 601,704 | 221,940 | 2,015,475 | |||||||||||||||
Fund shares reacquired | 8,780,694 | 763 | 4,050,613 | 381 | 5,816,155 | |||||||||||||||
Payable to affiliates | ||||||||||||||||||||
Shareholder servicing costs | 118,943 | 5,482 | 118,310 | 18,168 | 143,476 | |||||||||||||||
Distribution and service fees | 15,565 | 209 | 4,993 | 475 | 5,623 | |||||||||||||||
Program manager fee | 208 | — | — | — | — | |||||||||||||||
Payable for independent Trustees’ compensation | 6 | 2 | 20 | 10 | 12 | |||||||||||||||
Accrued expenses and other liabilities | 83,277 | 35,053 | 45,456 | 40,317 | 51,467 | |||||||||||||||
Total liabilities | $9,091,550 | $64,631 | $4,821,096 | $281,291 | $8,032,208 | |||||||||||||||
Net assets | $549,980,294 | $51,960,536 | $363,635,313 | $129,408,731 | $407,602,224 | |||||||||||||||
| Net assets consist of | ||||||||||||||||||||
| Paid-in capital | $507,323,855 | $49,513,816 | $310,270,949 | $118,933,309 | $330,972,584 | |||||||||||||||
Unrealized appreciation (depreciation) on investments | 46,550,615 | 2,062,399 | 53,575,357 | 8,502,699 | 76,376,221 | |||||||||||||||
Accumulated net realized gain (loss) on investments | (3,920,078 | ) | 108,142 | (1,775,514 | ) | 1,494,384 | (577,935 | ) | ||||||||||||
Undistributed net investment income | 25,902 | 276,179 | 1,564,521 | 478,339 | 831,354 | |||||||||||||||
Net assets | $549,980,294 | $51,960,536 | $363,635,313 | $129,408,731 | $407,602,224 | |||||||||||||||
56
Table of Contents
Statements of Assets and Liabilities – continued
| MFS Lifetime Income Fund | MFS Lifetime 2015 Fund | MFS Lifetime 2020 Fund | MFS Lifetime 2025 Fund | MFS Lifetime 2030 Fund | ||||||||||||||||
Net assets | ||||||||||||||||||||
Class A | $126,211,871 | $1,718,140 | $45,845,550 | $8,807,078 | $42,886,863 | |||||||||||||||
Class B | 20,719,743 | 189,797 | 6,605,442 | 1,034,623 | 8,413,992 | |||||||||||||||
Class C | 162,868,492 | 878,076 | 18,427,963 | 2,212,688 | 15,520,831 | |||||||||||||||
Class I | 29,661,353 | 159,799 | 7,311,918 | 1,888,966 | 11,665,463 | |||||||||||||||
Class R1 | 5,605,829 | 116,955 | 6,356,590 | 162,734 | 8,165,490 | |||||||||||||||
Class R2 | 28,527,749 | 1,964,585 | 68,262,678 | 4,200,303 | 79,911,509 | |||||||||||||||
Class R3 | 25,641,292 | 4,739,963 | 51,379,566 | 12,732,221 | 71,752,813 | |||||||||||||||
Class R4 | 75,335,782 | 42,193,221 | 159,445,606 | 98,370,118 | 169,285,263 | |||||||||||||||
Class 529A | 47,993,218 | — | — | — | — | |||||||||||||||
Class 529B | 3,427,685 | — | — | — | — | |||||||||||||||
Class 529C | 23,987,280 | — | — | — | — | |||||||||||||||
Total net assets | $549,980,294 | $51,960,536 | $363,635,313 | $129,408,731 | $407,602,224 | |||||||||||||||
Shares of beneficial interest outstanding | ||||||||||||||||||||
Class A | 10,267,028 | 157,976 | 3,391,106 | 722,318 | 2,947,985 | |||||||||||||||
Class B | 1,685,273 | 17,527 | 492,471 | 85,436 | 585,685 | |||||||||||||||
Class C | 13,251,630 | 81,474 | 1,389,967 | 183,287 | 1,085,775 | |||||||||||||||
Class I | 2,412,053 | 14,663 | 537,640 | 154,579 | 797,159 | |||||||||||||||
Class R1 | 455,580 | 10,767 | 473,837 | 13,373 | 567,632 | |||||||||||||||
Class R2 | 2,319,739 | 181,086 | 5,081,805 | 345,180 | 5,538,620 | |||||||||||||||
Class R3 | 2,085,446 | 435,809 | 3,798,396 | 1,044,210 | 4,941,780 | |||||||||||||||
Class R4 | 6,126,721 | 3,870,456 | 11,737,714 | 8,047,838 | 11,587,773 | |||||||||||||||
Class 529A | 4,717,068 | — | — | — | — | |||||||||||||||
Class 529B | 336,874 | — | — | — | — | |||||||||||||||
Class 529C | 2,357,530 | — | — | — | — | |||||||||||||||
Total shares of beneficial interest outstanding | 46,014,942 | 4,769,758 | 26,902,936 | 10,596,221 | 28,052,409 | |||||||||||||||
Class A shares | ||||||||||||||||||||
Net asset value per share | ||||||||||||||||||||
(net assets/shares of beneficial interest outstanding) | $12.29 | $10.88 | $13.52 | $12.19 | $14.55 | |||||||||||||||
Offering price per share (100 / 94.25 x net asset value per share) | $13.04 | $11.54 | $14.34 | $12.93 | $15.44 | |||||||||||||||
Class B shares | ||||||||||||||||||||
Net asset value and offering price per share | ||||||||||||||||||||
(net assets/shares of beneficial interest outstanding) | $12.29 | $10.83 | $13.41 | $12.11 | $14.37 | |||||||||||||||
Class C shares | ||||||||||||||||||||
Net asset value and offering price per share | ||||||||||||||||||||
(net assets/shares of beneficial interest outstanding) | $12.29 | $10.78 | $13.26 | $12.07 | $14.29 | |||||||||||||||
Class I shares | ||||||||||||||||||||
Net asset value, offering price, and redemption price per share | ||||||||||||||||||||
(net assets/shares of beneficial interest outstanding) | $12.30 | $10.90 | $13.60 | $12.22 | $14.63 | |||||||||||||||
Class R1 shares | ||||||||||||||||||||
Net asset value, offering price, and redemption price per share | ||||||||||||||||||||
(net assets/shares of beneficial interest outstanding) | $12.30 | $10.86 | $13.42 | $12.17 | $14.39 | |||||||||||||||
Class R2 shares | ||||||||||||||||||||
Net asset value, offering price, and redemption price per share | ||||||||||||||||||||
(net assets/shares of beneficial interest outstanding) | $12.30 | $10.85 | $13.43 | $12.17 | $14.43 | |||||||||||||||
Class R3 shares | ||||||||||||||||||||
Net asset value, offering price, and redemption price per share | ||||||||||||||||||||
(net assets/shares of beneficial interest outstanding) | $12.30 | $10.88 | $13.53 | $12.19 | $14.52 | |||||||||||||||
57
Table of Contents
Statements of Assets and Liabilities – continued
| MFS Lifetime Income Fund | MFS Lifetime 2015 Fund | MFS Lifetime 2020 Fund | MFS Lifetime 2025 Fund | MFS Lifetime 2030 Fund | ||||||||||||||||
Class R4 shares | ||||||||||||||||||||
Net asset value, offering price, and redemption price per share | ||||||||||||||||||||
(net assets/shares of beneficial interest outstanding) | $12.30 | $10.90 | $13.58 | $12.22 | $14.61 | |||||||||||||||
Class 529A shares | ||||||||||||||||||||
Net asset value and redemption price per share | ||||||||||||||||||||
(net assets/shares of beneficial interest outstanding) | $10.17 | $— | $— | $— | $— | |||||||||||||||
Offering price per share (100 / 94.25 x net asset value per share) | $10.79 | $— | $— | $— | $— | |||||||||||||||
Class 529B shares | ||||||||||||||||||||
Net asset value and offering price per share | ||||||||||||||||||||
(net assets/shares of beneficial interest outstanding) | $10.17 | $— | $— | $— | $— | |||||||||||||||
Class 529C shares | ||||||||||||||||||||
Net asset value and offering price per share | ||||||||||||||||||||
(net assets/shares of beneficial interest outstanding) | $10.17 | $— | $— | $— | $— | |||||||||||||||
Shares outstanding are rounded for presentation purposes.
On sales of $50,000 or more, the maximum offering prices of Class A and Class 529A shares are reduced. A contingent deferred sales charge may be imposed on redemptions of Class A, Class B, Class C, Class 529B, and Class 529C shares.
See Notes to Financial Statements
58
Table of Contents
Statements of Assets and Liabilities – continued
| MFS Lifetime 2035 Fund | MFS Lifetime 2040 Fund | MFS Lifetime 2045 Fund | MFS Lifetime 2050 Fund | MFS Lifetime 2055 Fund | ||||||||||||||||
| Assets | ||||||||||||||||||||
| Investments | ||||||||||||||||||||
Underlying affiliated funds, at value (Identified cost, $98,075,836, $246,516,623, $57,433,207, $81,118,060, and $10,418,767, respectively) | $106,216,846 | $310,303,763 | $62,062,724 | $90,986,199 | $11,040,127 | |||||||||||||||
| Receivables for | ||||||||||||||||||||
Investments sold | 239,558 | 50,958 | 21,559 | 3,204 | 4,339 | |||||||||||||||
Fund shares sold | 107,968 | 6,511,936 | 131,356 | 1,702,378 | 74,890 | |||||||||||||||
Receivable from investment adviser | 29,262 | 93,084 | 24,227 | 50,257 | 19,295 | |||||||||||||||
Other assets | 466 | 1,329 | 337 | 470 | 115 | |||||||||||||||
Total assets | $106,594,100 | $316,961,070 | $62,240,203 | $92,742,508 | $11,138,766 | |||||||||||||||
| Liabilities | ||||||||||||||||||||
| Payables for | ||||||||||||||||||||
Investments purchased | $100,713 | $993,640 | $131,194 | $453,168 | $75,842 | |||||||||||||||
Fund shares reacquired | 240,067 | 5,498,097 | 3,992 | 1,428,308 | 262 | |||||||||||||||
Payable to affiliates | ||||||||||||||||||||
Shareholder servicing costs | 16,837 | 127,976 | 10,598 | 37,738 | 1,454 | |||||||||||||||
Distribution and service fees | 533 | 3,859 | 256 | 749 | 146 | |||||||||||||||
Payable for independent Trustees’ compensation | 8 | 6 | 8 | 9 | 9 | |||||||||||||||
Accrued expenses and other liabilities | 40,570 | 50,442 | 38,712 | 42,258 | 35,326 | |||||||||||||||
Total liabilities | $398,728 | $6,674,020 | $184,760 | $1,962,230 | $113,039 | |||||||||||||||
Net assets | $106,195,372 | $310,287,050 | $62,055,443 | $90,780,278 | $11,025,727 | |||||||||||||||
| Net assets consist of | ||||||||||||||||||||
| Paid-in capital | $96,284,477 | $244,985,632 | $56,407,018 | $79,698,490 | $10,290,167 | |||||||||||||||
Unrealized appreciation (depreciation) on investments | 8,141,010 | 63,787,140 | 4,629,517 | 9,868,139 | 621,360 | |||||||||||||||
Accumulated net realized gain (loss) on investments | 1,604,776 | 1,387,655 | 971,378 | 1,164,807 | 112,465 | |||||||||||||||
Undistributed net investment income | 165,109 | 126,623 | 47,530 | 48,842 | 1,735 | |||||||||||||||
Net assets | $106,195,372 | $310,287,050 | $62,055,443 | $90,780,278 | $11,025,727 | |||||||||||||||
59
Table of Contents
Statements of Assets and Liabilities – continued
| MFS Lifetime 2035 Fund | MFS Lifetime 2040 Fund | MFS Lifetime 2045 Fund | MFS Lifetime 2050 Fund | MFS Lifetime 2055 Fund | ||||||||||||||||
Net assets | ||||||||||||||||||||
Class A | $6,352,983 | $26,564,017 | $2,811,282 | $5,730,475 | $1,035,996 | |||||||||||||||
Class B | 950,076 | 4,432,284 | 407,982 | 828,368 | 244,146 | |||||||||||||||
Class C | 1,965,010 | 11,839,975 | 909,302 | 1,835,178 | 1,031,374 | |||||||||||||||
Class I | 3,506,925 | 8,679,067 | 1,108,251 | 1,131,672 | 391,310 | |||||||||||||||
Class R1 | 179,750 | 5,527,569 | 172,160 | 376,880 | 141,334 | |||||||||||||||
Class R2 | 3,758,101 | 61,126,834 | 1,768,780 | 13,029,657 | 773,250 | |||||||||||||||
Class R3 | 12,388,543 | 38,523,690 | 7,566,332 | 9,088,624 | 2,352,683 | |||||||||||||||
Class R4 | 77,093,984 | 153,593,614 | 47,311,354 | 58,759,424 | 5,055,634 | |||||||||||||||
Total net assets | $106,195,372 | $310,287,050 | $62,055,443 | $90,780,278 | $11,025,727 | |||||||||||||||
Shares of beneficial interest outstanding | ||||||||||||||||||||
Class A | 490,352 | 1,790,923 | 213,967 | 360,753 | 78,695 | |||||||||||||||
Class B | 73,764 | 301,289 | 31,239 | 52,710 | 18,612 | |||||||||||||||
Class C | 153,170 | 813,930 | 69,738 | 117,376 | 79,121 | |||||||||||||||
Class I | 269,802 | 581,281 | 84,216 | 71,377 | 29,655 | |||||||||||||||
Class R1 | 13,904 | 378,184 | 13,143 | 24,090 | 10,759 | |||||||||||||||
Class R2 | 290,582 | 4,149,582 | 135,067 | 828,230 | 58,837 | |||||||||||||||
Class R3 | 954,888 | 2,598,218 | 576,071 | 575,319 | 178,687 | |||||||||||||||
Class R4 | 5,932,425 | 10,293,011 | 3,596,459 | 3,707,877 | 383,103 | |||||||||||||||
Total shares of beneficial interest outstanding | 8,178,887 | 20,906,418 | 4,719,900 | 5,737,732 | 837,469 | |||||||||||||||
Class A shares | ||||||||||||||||||||
Net asset value per share | ||||||||||||||||||||
(net assets/shares of beneficial interest outstanding) | $12.96 | $14.83 | $13.14 | $15.88 | $13.16 | |||||||||||||||
Offering price per share (100/94.25 x net asset value per share) | $13.75 | $15.73 | $13.94 | $16.85 | $13.96 | |||||||||||||||
Class B shares | ||||||||||||||||||||
Net asset value and offering price per share | ||||||||||||||||||||
(net assets/shares of beneficial interest outstanding) | $12.88 | $14.71 | $13.06 | $15.72 | $13.12 | |||||||||||||||
Class C shares | ||||||||||||||||||||
Net asset value and offering price per share | ||||||||||||||||||||
(net assets/shares of beneficial interest outstanding) | $12.83 | $14.55 | $13.04 | $15.63 | $13.04 | |||||||||||||||
Class I shares | ||||||||||||||||||||
Net asset value, offering price, and redemption price per share | ||||||||||||||||||||
(net assets/shares of beneficial interest outstanding) | $13.00 | $14.93 | $13.16 | $15.85 | $13.20 | |||||||||||||||
Class R1 shares | ||||||||||||||||||||
Net asset value, offering price, and redemption price per share | ||||||||||||||||||||
(net assets/shares of beneficial interest outstanding) | $12.93 | $14.62 | $13.10 | $15.64 | $13.14 | |||||||||||||||
Class R2 shares | ||||||||||||||||||||
Net asset value, offering price, and redemption price per share | ||||||||||||||||||||
(net assets/shares of beneficial interest outstanding) | $12.93 | $14.73 | $13.10 | $15.73 | $13.14 | |||||||||||||||
Class R3 shares | ||||||||||||||||||||
Net asset value, offering price, and redemption price per share | ||||||||||||||||||||
(net assets/shares of beneficial interest outstanding) | $12.97 | $14.83 | $13.13 | $15.80 | $13.17 | |||||||||||||||
Class R4 shares | ||||||||||||||||||||
Net asset value, offering price, and redemption price per share | ||||||||||||||||||||
(net assets/shares of beneficial interest outstanding) | $13.00 | $14.92 | $13.15 | $15.85 | $13.20 | |||||||||||||||
Shares outstanding are rounded for presentation purposes.
On sales of $50,000 or more, the maximum offering price of Class A shares is reduced. A contingent deferred sales charge may be imposed on redemptions of Class A, Class B, and Class C shares.
See Notes to Financial Statements
60
Table of Contents
Financial Statements
Year ended 4/30/15
These statements describe how much each fund earned in investment income and accrued in expenses. They also describe any gains or losses generated by each fund’s operations.
| MFS Lifetime Income Fund | MFS Lifetime 2015 Fund | MFS Lifetime 2020 Fund | MFS Lifetime 2025 Fund | MFS Lifetime 2030 Fund | ||||||||||||||||
| Net investment income | ||||||||||||||||||||
Dividends from underlying affiliated funds | $8,970,567 | $940,558 | $6,879,929 | $1,906,582 | $5,706,029 | |||||||||||||||
| Expenses | ||||||||||||||||||||
Distribution and service fees | 2,430,120 | 33,788 | 932,770 | 91,937 | 976,679 | |||||||||||||||
Shareholder servicing costs | 345,478 | 15,168 | 359,027 | 42,134 | 454,659 | |||||||||||||||
Program manager fees | 22,189 | — | — | — | — | |||||||||||||||
Administrative services fee | 17,500 | 17,500 | 17,500 | 17,500 | 17,500 | |||||||||||||||
Independent Trustees’ compensation | 9,772 | 1,631 | 9,526 | 3,294 | 9,535 | |||||||||||||||
Custodian fee | 34,734 | 11,836 | 23,107 | 13,806 | 23,500 | |||||||||||||||
Shareholder communications | 55,555 | 7,652 | 29,959 | 10,879 | 30,991 | |||||||||||||||
Audit and tax fees | 34,038 | 33,181 | 34,015 | 33,194 | 34,003 | |||||||||||||||
Legal fees | 500 | 976 | 3,206 | 1,417 | 3,360 | |||||||||||||||
Registration fees | 157,684 | 96,459 | 110,457 | 105,706 | 124,077 | |||||||||||||||
Miscellaneous | 21,889 | 12,159 | 18,612 | 12,972 | 17,633 | |||||||||||||||
Total expenses | $3,129,459 | $230,350 | $1,538,179 | $332,839 | $1,691,937 | |||||||||||||||
Fees paid indirectly | (2 | ) | (1 | ) | — | (1 | ) | (2 | ) | |||||||||||
Reduction of expenses by investment adviser and distributor | (689,062 | ) | (196,345 | ) | (604,224 | ) | (241,807 | ) | (716,001 | ) | ||||||||||
Net expenses | $2,440,395 | $34,004 | $933,955 | $91,031 | $975,934 | |||||||||||||||
Net investment income | $6,530,172 | $906,554 | $5,945,974 | $1,815,551 | $4,730,095 | |||||||||||||||
| Realized and unrealized gain (loss) on investments | ||||||||||||||||||||
| Realized gain (loss) (identified cost basis) | ||||||||||||||||||||
Investments in underlying affiliated funds | $(1,372,967 | ) | $(138,898 | ) | $2,565,884 | $(266,765 | ) | $(1,329,815 | ) | |||||||||||
Capital gain distributions from underlying affiliated funds | 4,914,083 | 557,677 | 5,344,797 | 2,420,829 | 9,872,867 | |||||||||||||||
Net realized gain (loss) on investments | $3,541,116 | $418,779 | $7,910,681 | $2,154,064 | $8,543,052 | |||||||||||||||
Change in unrealized appreciation (depreciation) on investments | $5,034,142 | $614,241 | $2,617,529 | $2,300,979 | $9,585,518 | |||||||||||||||
Net realized and unrealized gain (loss) on investments | $8,575,258 | $1,033,020 | $10,528,210 | $4,455,043 | $18,128,570 | |||||||||||||||
Change in net assets from operations | $15,105,430 | $1,939,574 | $16,474,184 | $6,270,594 | $22,858,665 | |||||||||||||||
See Notes to Financial Statements
61
Table of Contents
Statements of Operations – continued
| MFS Lifetime 2035 Fund | MFS Lifetime 2040 Fund | MFS Lifetime 2045 Fund | MFS Lifetime 2050 Fund | MFS Lifetime 2055 Fund | ||||||||||||||||
| Net investment income | ||||||||||||||||||||
Dividends from underlying affiliated funds | $1,179,671 | $3,515,172 | $583,148 | $924,688 | $91,724 | |||||||||||||||
| Expenses | ||||||||||||||||||||
Distribution and service fees | 73,515 | 670,519 | 36,792 | 108,723 | 18,775 | |||||||||||||||
Shareholder servicing costs | 40,059 | 407,537 | 24,047 | 127,013 | 6,080 | |||||||||||||||
Administrative services fee | 17,500 | 17,500 | 17,500 | 17,500 | 17,500 | |||||||||||||||
Independent Trustees’ compensation | 2,796 | 9,279 | 1,250 | 1,704 | 1,160 | |||||||||||||||
Custodian fee | 12,836 | 20,106 | 11,665 | 12,456 | 10,341 | |||||||||||||||
Shareholder communications | 11,852 | 29,082 | 10,391 | 16,988 | 8,116 | |||||||||||||||
Audit and tax fees | 33,185 | 33,976 | 33,175 | 33,365 | 33,165 | |||||||||||||||
Legal fees | 1,201 | 2,582 | 918 | 1,162 | 645 | |||||||||||||||
Registration fees | 103,803 | 108,049 | 99,313 | 97,973 | 94,604 | |||||||||||||||
Miscellaneous | 12,483 | 15,951 | 11,887 | 12,490 | 11,193 | |||||||||||||||
Total expenses | $309,230 | $1,314,581 | $246,938 | $429,374 | $201,579 | |||||||||||||||
Fees paid indirectly | (2 | ) | (3 | ) | (6 | ) | (9 | ) | (1 | ) | ||||||||||
Reduction of expenses by investment adviser and distributor | (235,685 | ) | (644,227 | ) | (210,237 | ) | (320,492 | ) | (182,786 | ) | ||||||||||
Net expenses | $73,543 | $670,351 | $36,695 | $108,873 | $18,792 | |||||||||||||||
Net investment income | $1,106,128 | $2,844,821 | $546,453 | $815,815 | $72,932 | |||||||||||||||
| Realized and unrealized gain (loss) on investments | ||||||||||||||||||||
| Realized gain (loss) (identified cost basis) | ||||||||||||||||||||
Investments in underlying affiliated funds | $(277,354 | ) | $(613,267 | ) | $(105,588 | ) | $(269,934 | ) | $(49,147 | ) | ||||||||||
Capital gain distributions from underlying affiliated funds | 2,454,800 | 8,363,322 | 1,390,624 | 2,186,304 | 217,225 | |||||||||||||||
Net realized gain (loss) on investments | $2,177,446 | $7,750,055 | $1,285,036 | $1,916,370 | $168,078 | |||||||||||||||
Change in unrealized appreciation (depreciation) on investments | $2,361,698 | $8,438,572 | $1,561,723 | $2,466,844 | $279,862 | |||||||||||||||
Net realized and unrealized gain (loss) on investments | $4,539,144 | $16,188,627 | $2,846,759 | $4,383,214 | $447,940 | |||||||||||||||
Change in net assets from operations | $5,645,272 | $19,033,448 | $3,393,212 | $5,199,029 | $520,872 | |||||||||||||||
See Notes to Financial Statements
62
Table of Contents
Financial Statements
STATEMENTS OF CHANGES IN NET ASSETS
These statements describe the increases and/or decreases in net assets resulting from operations, any distributions, and any shareholder transactions.
| Year ended 4/30/15 | MFS Lifetime Income Fund | MFS Lifetime 2015 Fund | MFS Lifetime 2020 Fund | MFS Lifetime 2025 Fund | MFS Lifetime 2030 Fund | |||||||||||||||
| Change in net assets | ||||||||||||||||||||
| From operations | ||||||||||||||||||||
| Net investment income | $6,530,172 | $906,554 | $5,945,974 | $1,815,551 | $4,730,095 | |||||||||||||||
Net realized gain (loss) on investments | 3,541,116 | 418,779 | 7,910,681 | 2,154,064 | 8,543,052 | |||||||||||||||
Net unrealized gain (loss) on investments | 5,034,142 | 614,241 | 2,617,529 | 2,300,979 | 9,585,518 | |||||||||||||||
Change in net assets from operations | $15,105,430 | $1,939,574 | $16,474,184 | $6,270,594 | $22,858,665 | |||||||||||||||
| Distributions declared to shareholders | ||||||||||||||||||||
| From net investment income | $(7,353,766 | ) | $(988,045 | ) | $(6,966,115 | ) | $(2,006,055 | ) | $(5,947,098 | ) | ||||||||||
From net realized gain on investments | (2,865,201 | ) | (259,049 | ) | — | (725,059 | ) | — | ||||||||||||
Total distributions declared to shareholders | $(10,218,967 | ) | $(1,247,094 | ) | $(6,966,115 | ) | $(2,731,114 | ) | $(5,947,098 | ) | ||||||||||
Change in net assets from fund share transactions | $204,450,062 | $5,125,392 | $(167,716 | ) | $39,802,544 | $48,845,006 | ||||||||||||||
Total change in net assets | $209,336,525 | $5,817,872 | $9,340,353 | $43,342,024 | $65,756,573 | |||||||||||||||
| Net assets | ||||||||||||||||||||
| At beginning of period | 340,643,769 | 46,142,664 | 354,294,960 | 86,066,707 | 341,845,651 | |||||||||||||||
At end of period | $549,980,294 | $51,960,536 | $363,635,313 | $129,408,731 | $407,602,224 | |||||||||||||||
Undistributed net investment income included in net assets at end of period | $25,902 | $276,179 | $1,564,521 | $478,339 | $831,354 | |||||||||||||||
| Year ended 4/30/15 | MFS Lifetime 2035 Fund | MFS Lifetime 2040 Fund | MFS Lifetime 2045 Fund | MFS Lifetime 2050 Fund | MFS Lifetime 2055 Fund | |||||||||||||||
| Change in net assets | ||||||||||||||||||||
| From operations | ||||||||||||||||||||
| Net investment income | $1,106,128 | $2,844,821 | $546,453 | $815,815 | $72,932 | |||||||||||||||
Net realized gain (loss) on investments | 2,177,446 | 7,750,055 | 1,285,036 | 1,916,370 | 168,078 | |||||||||||||||
Net unrealized gain (loss) on investments | 2,361,698 | 8,438,572 | 1,561,723 | 2,466,844 | 279,862 | |||||||||||||||
Change in net assets from operations | $5,645,272 | $19,033,448 | $3,393,212 | $5,199,029 | $520,872 | |||||||||||||||
| Distributions declared to shareholders | ||||||||||||||||||||
| From net investment income | $(1,365,005 | ) | $(4,040,019 | ) | $(723,927 | ) | $(1,124,008 | ) | $(103,000 | ) | ||||||||||
From net realized gain on investments | (645,454 | ) | (577,059 | ) | (343,276 | ) | (531,065 | ) | (36,309 | ) | ||||||||||
Total distributions declared to shareholders | $(2,010,459 | ) | $(4,617,078 | ) | $(1,067,203 | ) | $(1,655,073 | ) | $(139,309 | ) | ||||||||||
Change in net assets from fund share transactions | $41,476,172 | $44,445,957 | $27,887,643 | $29,097,848 | $6,255,203 | |||||||||||||||
Total change in net assets | $45,110,985 | $58,862,327 | $30,213,652 | $32,641,804 | $6,636,766 | |||||||||||||||
| Net assets | ||||||||||||||||||||
| At beginning of period | 61,084,387 | 251,424,723 | 31,841,791 | 58,138,474 | 4,388,961 | |||||||||||||||
At end of period | $106,195,372 | $310,287,050 | $62,055,443 | $90,780,278 | $11,025,727 | |||||||||||||||
Undistributed net investment income included in net assets at end of period | $165,109 | $126,623 | $47,530 | $48,842 | $1,735 | |||||||||||||||
See Notes to Financial Statements
63
Table of Contents
Statements of Changes in Net Assets – continued
| Year ended 4/30/14 | MFS Lifetime Income Fund | MFS Lifetime 2015 Fund | MFS Lifetime 2020 Fund | MFS Lifetime 2025 Fund | MFS Lifetime 2030 Fund | |||||||||||||||
| Change in net assets | ||||||||||||||||||||
| From operations | ||||||||||||||||||||
| Net investment income | $5,260,127 | $819,331 | $5,960,348 | $1,199,643 | $3,701,543 | |||||||||||||||
Net realized gain (loss) on investments | 1,842,265 | 259,991 | 3,630,714 | 808,260 | 4,388,533 | |||||||||||||||
Net unrealized gain (loss) on investments | 4,352,194 | 871,233 | 12,980,494 | 4,699,230 | 26,344,985 | |||||||||||||||
Change in net assets from operations | $11,454,586 | $1,950,555 | $22,571,556 | $6,707,133 | $34,435,061 | |||||||||||||||
| Distributions declared to shareholders | ||||||||||||||||||||
| From net investment income | $(5,682,746 | ) | $(710,099 | ) | $(5,530,035 | ) | $(1,130,056 | ) | $(4,250,110 | ) | ||||||||||
From net realized gain on investments | (484,253 | ) | (62,172 | ) | — | (80,640 | ) | — | ||||||||||||
Total distributions declared to shareholders | $(6,166,999 | ) | $(772,271 | ) | $(5,530,035 | ) | $(1,210,696 | ) | $(4,250,110 | ) | ||||||||||
Change in net assets from fund share transactions | $55,473,637 | $15,061,468 | $47,195,429 | $35,718,208 | $78,252,232 | |||||||||||||||
Total change in net assets | $60,761,224 | $16,239,752 | $64,236,950 | $41,214,645 | $108,437,183 | |||||||||||||||
| Net assets | ||||||||||||||||||||
| At beginning of period | 279,882,545 | 29,902,912 | 290,058,010 | 44,852,062 | 233,408,468 | |||||||||||||||
At end of period | $340,643,769 | $46,142,664 | $354,294,960 | $86,066,707 | $341,845,651 | |||||||||||||||
Undistributed net investment income included in net assets at end of period | $14,783 | $265,903 | $1,813,212 | $345,996 | $727,787 | |||||||||||||||
| Year ended 4/30/14 | MFS Lifetime 2035 Fund | MFS Lifetime 2040 Fund | MFS Lifetime 2045 Fund | MFS Lifetime 2050 Fund | MFS Lifetime 2055 Fund | |||||||||||||||
| Change in net assets | ||||||||||||||||||||
| From operations | ||||||||||||||||||||
| Net investment income | $598,282 | $2,006,928 | $273,242 | $469,964 | $22,523 | |||||||||||||||
Net realized gain (loss) on investments | 744,480 | 3,638,316 | 401,119 | 691,759 | 34,501 | |||||||||||||||
Net unrealized gain (loss) on investments | 4,547,693 | 22,832,201 | 2,410,342 | 4,536,720 | 245,476 | |||||||||||||||
Change in net assets from operations | $5,890,455 | $28,477,445 | $3,084,703 | $5,698,443 | $302,500 | |||||||||||||||
| Distributions declared to shareholders | ||||||||||||||||||||
| From net investment income | $(710,034 | ) | $(2,760,025 | ) | $(345,019 | ) | $(610,024 | ) | $(29,999 | ) | ||||||||||
From net realized gain on investments | (28,546 | ) | — | (20,030 | ) | — | (6,004 | ) | ||||||||||||
Total distributions declared to shareholders | $(738,580 | ) | $(2,760,025 | ) | $(365,049 | ) | $(610,024 | ) | $(36,003 | ) | ||||||||||
Change in net assets from fund share transactions | $26,900,287 | $43,018,800 | $14,745,948 | $23,806,578 | $3,015,335 | |||||||||||||||
Total change in net assets | $32,052,162 | $68,736,220 | $17,465,602 | $28,894,997 | $3,281,832 | |||||||||||||||
| Net assets | ||||||||||||||||||||
| At beginning of period | 29,032,225 | 182,688,503 | 14,376,189 | 29,243,477 | 1,107,129 | |||||||||||||||
At end of period | $61,084,387 | $251,424,723 | $31,841,791 | $58,138,474 | $4,388,961 | |||||||||||||||
Undistributed net investment income included in net assets at end of period | $89,315 | $149,281 | $31,453 | $51,550 | $1,727 | |||||||||||||||
See Notes to Financial Statements
64
Table of Contents
Financial Statements
MFS LIFETIME INCOME FUND
The financial highlights table is intended to help you understand the fund financial performance for the past 5 years (or life of a particular share class, if shorter). Certain information reflects financial results for a single fund share. The total returns in the table represent the rate by which an investor would have earned (or lost) on an investment in the fund share class (assuming reinvestment of all distributions) held for the entire period.
| Years ended 4/30 | ||||||||||||||||||||
| Class A | 2015 | 2014 | 2013 | 2012 | 2011 | |||||||||||||||
Net asset value, beginning of period | $12.15 | $11.97 | $11.40 | $11.31 | $10.59 | |||||||||||||||
| Income (loss) from investment operations | ||||||||||||||||||||
| Net investment income (d)(l) | $0.21 | $0.23 | $0.25 | $0.31 | $0.28 | |||||||||||||||
Net realized and unrealized gain (loss) on investments | 0.22 | 0.22 | 0.59 | 0.12 | 0.74 | |||||||||||||||
Total from investment operations | $0.43 | $0.45 | $0.84 | $0.43 | $1.02 | |||||||||||||||
| Less distributions declared to shareholders | ||||||||||||||||||||
| From net investment income | $(0.22 | ) | $(0.25 | ) | $(0.27 | ) | $(0.34 | ) | $(0.30 | ) | ||||||||||
From net realized gain on investments | (0.07 | ) | (0.02 | ) | — | — | — | |||||||||||||
Total distributions declared to shareholders | $(0.29 | ) | $(0.27 | ) | $(0.27 | ) | $(0.34 | ) | $(0.30 | ) | ||||||||||
Net asset value, end of period (x) | $12.29 | $12.15 | $11.97 | $11.40 | $11.31 | |||||||||||||||
Total return (%) (r)(s)(t)(x) | 3.66 | 3.81 | 7.46 | 3.92 | 9.81 | |||||||||||||||
| Ratios (%) (to average net assets) and Supplemental data: | ||||||||||||||||||||
| Expenses before expense reductions (f)(h) | 0.39 | 0.39 | 0.40 | 0.44 | 0.52 | |||||||||||||||
Expenses after expense reductions (f)(h) | 0.25 | 0.25 | 0.25 | 0.25 | 0.28 | |||||||||||||||
Net investment income (l) | 1.68 | 1.95 | 2.16 | 2.82 | 2.61 | |||||||||||||||
Portfolio turnover | 14 | 10 | 8 | 14 | 20 | |||||||||||||||
Net assets at end of period (000 omitted) | $126,212 | $108,202 | $108,914 | $61,183 | $36,345 | |||||||||||||||
| Years ended 4/30 | ||||||||||||||||||||
| Class B | 2015 | 2014 | 2013 | 2012 | 2011 | |||||||||||||||
Net asset value, beginning of period | $12.15 | $11.97 | $11.41 | $11.32 | $10.60 | |||||||||||||||
| Income (loss) from investment operations | ||||||||||||||||||||
| Net investment income (d)(l) | $0.11 | $0.15 | $0.16 | $0.23 | $0.20 | |||||||||||||||
Net realized and unrealized gain (loss) on investments | 0.23 | 0.21 | 0.58 | 0.12 | 0.74 | |||||||||||||||
Total from investment operations | $0.34 | $0.36 | $0.74 | $0.35 | $0.94 | |||||||||||||||
| Less distributions declared to shareholders | ||||||||||||||||||||
| From net investment income | $(0.13 | ) | $(0.16 | ) | $(0.18 | ) | $(0.26 | ) | $(0.22 | ) | ||||||||||
From net realized gain on investments | (0.07 | ) | (0.02 | ) | — | — | — | |||||||||||||
Total distributions declared to shareholders | $(0.20 | ) | $(0.18 | ) | $(0.18 | ) | $(0.26 | ) | $(0.22 | ) | ||||||||||
Net asset value, end of period (x) | $12.29 | $12.15 | $11.97 | $11.41 | $11.32 | |||||||||||||||
Total return (%) (r)(s)(t)(x) | 2.89 | 3.04 | 6.57 | 3.15 | 8.99 | |||||||||||||||
| Ratios (%) (to average net assets) and Supplemental data: | ||||||||||||||||||||
| Expenses before expense reductions (f)(h) | 1.14 | 1.14 | 1.15 | 1.19 | 1.27 | |||||||||||||||
Expenses after expense reductions (f)(h) | 1.00 | 1.00 | 1.00 | 1.00 | 1.03 | |||||||||||||||
Net investment income (l) | 0.93 | 1.22 | 1.41 | 2.07 | 1.85 | |||||||||||||||
Portfolio turnover | 14 | 10 | 8 | 14 | 20 | |||||||||||||||
Net assets at end of period (000 omitted) | $20,720 | $18,577 | $17,243 | $11,082 | $5,419 | |||||||||||||||
See Notes to Financial Statements
65
Table of Contents
Financial Highlights – continued
MFS LIFETIME INCOME FUND – continued
| Years ended 4/30 | ||||||||||||||||||||
| Class C | 2015 | 2014 | 2013 | 2012 | 2011 | |||||||||||||||
Net asset value, beginning of period | $12.15 | $11.97 | $11.41 | $11.31 | $10.60 | |||||||||||||||
| Income (loss) from investment operations | ||||||||||||||||||||
| Net investment income (d)(l) | $0.11 | $0.15 | $0.16 | $0.23 | $0.20 | |||||||||||||||
Net realized and unrealized gain (loss) on investments | 0.23 | 0.21 | 0.58 | 0.13 | 0.73 | |||||||||||||||
Total from investment operations | $0.34 | $0.36 | $0.74 | $0.36 | $0.93 | |||||||||||||||
| Less distributions declared to shareholders | ||||||||||||||||||||
| From net investment income | $(0.13 | ) | $(0.16 | ) | $(0.18 | ) | $(0.26 | ) | $(0.22 | ) | ||||||||||
From net realized gain on investments | (0.07 | ) | (0.02 | ) | — | — | — | |||||||||||||
Total distributions declared to shareholders | $(0.20 | ) | $(0.18 | ) | $(0.18 | ) | $(0.26 | ) | $(0.22 | ) | ||||||||||
Net asset value, end of period (x) | $12.29 | $12.15 | $11.97 | $11.41 | $11.31 | |||||||||||||||
Total return (%) (r)(s)(t)(x) | 2.89 | 3.04 | 6.57 | 3.24 | 8.89 | |||||||||||||||
| Ratios (%) (to average net assets) and Supplemental data: | ||||||||||||||||||||
| Expenses before expense reductions (f)(h) | 1.14 | 1.14 | 1.15 | 1.19 | 1.26 | |||||||||||||||
Expenses after expense reductions (f)(h) | 1.00 | 1.00 | 1.00 | 1.00 | 1.03 | |||||||||||||||
Net investment income (l) | 0.93 | 1.22 | 1.40 | 2.07 | 1.82 | |||||||||||||||
Portfolio turnover | 14 | 10 | 8 | 14 | 20 | |||||||||||||||
Net assets at end of period (000 omitted) | $162,868 | $129,848 | $82,969 | $61,848 | $32,200 | |||||||||||||||
| Years ended 4/30 | ||||||||||||||||||||
| Class I | 2015 | 2014 | 2013 | 2012 | 2011 | |||||||||||||||
Net asset value, beginning of period | $12.15 | $11.98 | $11.41 | $11.32 | $10.60 | |||||||||||||||
| Income (loss) from investment operations | ||||||||||||||||||||
| Net investment income (d)(l) | $0.23 | $0.27 | $0.28 | $0.34 | $0.32 | |||||||||||||||
Net realized and unrealized gain (loss) on investments | 0.25 | 0.20 | 0.59 | 0.12 | 0.73 | |||||||||||||||
Total from investment operations | $0.48 | $0.47 | $0.87 | $0.46 | $1.05 | |||||||||||||||
| Less distributions declared to shareholders | ||||||||||||||||||||
| From net investment income | $(0.26 | ) | $(0.28 | ) | $(0.30 | ) | $(0.37 | ) | $(0.33 | ) | ||||||||||
From net realized gain on investments | (0.07 | ) | (0.02 | ) | — | — | — | |||||||||||||
Total distributions declared to shareholders | $(0.33 | ) | $(0.30 | ) | $(0.30 | ) | $(0.37 | ) | $(0.33 | ) | ||||||||||
Net asset value, end of period (x) | $12.30 | $12.15 | $11.98 | $11.41 | $11.32 | |||||||||||||||
Total return (%) (r)(s)(x) | 4.00 | 3.99 | 7.72 | 4.18 | 10.07 | |||||||||||||||
| Ratios (%) (to average net assets) and Supplemental data: | ||||||||||||||||||||
| Expenses before expense reductions (f)(h) | 0.14 | 0.14 | 0.15 | 0.19 | 0.26 | |||||||||||||||
Expenses after expense reductions (f)(h) | 0.00 | 0.00 | 0.00 | 0.00 | 0.01 | |||||||||||||||
Net investment income (l) | 1.92 | 2.23 | 2.39 | 3.03 | 2.91 | |||||||||||||||
Portfolio turnover | 14 | 10 | 8 | 14 | 20 | |||||||||||||||
Net assets at end of period (000 omitted) | $29,661 | $26,507 | $19,403 | $8,556 | $5,375 | |||||||||||||||
See Notes to Financial Statements
66
Table of Contents
Financial Highlights – continued
MFS LIFETIME INCOME FUND – continued
| Years ended 4/30 | ||||||||||||||||||||
| Class R1 | 2015 | 2014 | 2013 | 2012 | 2011 | |||||||||||||||
Net asset value, beginning of period | $12.16 | $11.98 | $11.41 | $11.32 | $10.61 | |||||||||||||||
| Income (loss) from investment operations | ||||||||||||||||||||
| Net investment income (d)(l) | $0.12 | $0.15 | $0.16 | $0.23 | $0.21 | |||||||||||||||
Net realized and unrealized gain (loss) on investments | 0.22 | 0.21 | 0.59 | 0.12 | 0.72 | |||||||||||||||
Total from investment operations | $0.34 | $0.36 | $0.75 | $0.35 | $0.93 | |||||||||||||||
| Less distributions declared to shareholders | ||||||||||||||||||||
| From net investment income | $(0.13 | ) | $(0.16 | ) | $(0.18 | ) | $(0.26 | ) | $(0.22 | ) | ||||||||||
From net realized gain on investments | (0.07 | ) | (0.02 | ) | — | — | — | |||||||||||||
Total distributions declared to shareholders | $(0.20 | ) | $(0.18 | ) | $(0.18 | ) | $(0.26 | ) | $(0.22 | ) | ||||||||||
Net asset value, end of period (x) | $12.30 | $12.16 | $11.98 | $11.41 | $11.32 | |||||||||||||||
Total return (%) (r)(s)(x) | 2.88 | 3.04 | 6.66 | 3.15 | 8.89 | |||||||||||||||
| Ratios (%) (to average net assets) and Supplemental data: | ||||||||||||||||||||
| Expenses before expense reductions (f)(h) | 1.14 | 1.14 | 1.15 | 1.20 | 1.25 | |||||||||||||||
Expenses after expense reductions (f)(h) | 1.00 | 1.00 | 1.00 | 1.00 | 1.02 | |||||||||||||||
Net investment income (l) | 0.95 | 1.22 | 1.43 | 2.05 | 1.90 | |||||||||||||||
Portfolio turnover | 14 | 10 | 8 | 14 | 20 | |||||||||||||||
Net assets at end of period (000 omitted) | $5,606 | $2,368 | $2,503 | $2,831 | $3,507 | |||||||||||||||
| Years ended 4/30 | ||||||||||||||||||||
| Class R2 | 2015 | 2014 | 2013 | 2012 | 2011 | |||||||||||||||
Net asset value, beginning of period | $12.16 | $11.98 | $11.41 | $11.32 | $10.60 | |||||||||||||||
| Income (loss) from investment operations | ||||||||||||||||||||
| Net investment income (d)(l) | $0.18 | $0.21 | $0.23 | $0.27 | $0.25 | |||||||||||||||
Net realized and unrealized gain (loss) on investments | 0.22 | 0.21 | 0.58 | 0.13 | 0.74 | |||||||||||||||
Total from investment operations | $0.40 | $0.42 | $0.81 | $0.40 | $0.99 | |||||||||||||||
| Less distributions declared to shareholders | ||||||||||||||||||||
| From net investment income | $(0.19 | ) | $(0.22 | ) | $(0.24 | ) | $(0.31 | ) | $(0.27 | ) | ||||||||||
From net realized gain on investments | (0.07 | ) | (0.02 | ) | — | — | — | |||||||||||||
Total distributions declared to shareholders | $(0.26 | ) | $(0.24 | ) | $(0.24 | ) | $(0.31 | ) | $(0.27 | ) | ||||||||||
Net asset value, end of period (x) | $12.30 | $12.16 | $11.98 | $11.41 | $11.32 | |||||||||||||||
Total return (%) (r)(s)(x) | 3.40 | 3.55 | 7.19 | 3.66 | 9.53 | |||||||||||||||
| Ratios (%) (to average net assets) and Supplemental data: | ||||||||||||||||||||
| Expenses before expense reductions (f)(h) | 0.64 | 0.64 | 0.65 | 0.70 | 0.77 | |||||||||||||||
Expenses after expense reductions (f)(h) | 0.50 | 0.50 | 0.50 | 0.50 | 0.53 | |||||||||||||||
Net investment income (l) | 1.46 | 1.72 | 1.95 | 2.46 | 2.35 | |||||||||||||||
Portfolio turnover | 14 | 10 | 8 | 14 | 20 | |||||||||||||||
Net assets at end of period (000 omitted) | $28,528 | $7,506 | $8,640 | $8,799 | $12,771 | |||||||||||||||
See Notes to Financial Statements
67
Table of Contents
Financial Highlights – continued
MFS LIFETIME INCOME FUND – continued
| Years ended 4/30 | ||||||||||||||||||||
| Class R3 | 2015 | 2014 | 2013 | 2012 | 2011 | |||||||||||||||
Net asset value, beginning of period | $12.15 | $11.97 | $11.41 | $11.31 | $10.60 | |||||||||||||||
| Income (loss) from investment operations | ||||||||||||||||||||
| Net investment income (d)(l) | $0.21 | $0.23 | $0.25 | $0.33 | $0.28 | |||||||||||||||
Net realized and unrealized gain (loss) on investments | 0.23 | 0.22 | 0.58 | 0.11 | 0.73 | |||||||||||||||
Total from investment operations | $0.44 | $0.45 | $0.83 | $0.44 | $1.01 | |||||||||||||||
| Less distributions declared to shareholders | ||||||||||||||||||||
| From net investment income | $(0.22 | ) | $(0.25 | ) | $(0.27 | ) | $(0.34 | ) | $(0.30 | ) | ||||||||||
From net realized gain on investments | (0.07 | ) | (0.02 | ) | — | — | — | |||||||||||||
Total distributions declared to shareholders | $(0.29 | ) | $(0.27 | ) | $(0.27 | ) | $(0.34 | ) | $(0.30 | ) | ||||||||||
Net asset value, end of period (x) | $12.30 | $12.15 | $11.97 | $11.41 | $11.31 | |||||||||||||||
Total return (%) (r)(s)(x) | 3.74 | 3.81 | 7.37 | 4.01 | 9.70 | |||||||||||||||
| Ratios (%) (to average net assets) and Supplemental data: | ||||||||||||||||||||
| Expenses before expense reductions (f)(h) | 0.39 | 0.39 | 0.40 | 0.44 | 0.52 | |||||||||||||||
Expenses after expense reductions (f)(h) | 0.25 | 0.25 | 0.25 | 0.25 | 0.28 | |||||||||||||||
Net investment income (l) | 1.68 | 1.96 | 2.15 | 2.95 | 2.60 | |||||||||||||||
Portfolio turnover | 14 | 10 | 8 | 14 | 20 | |||||||||||||||
Net assets at end of period (000 omitted) | $25,641 | $14,526 | $14,704 | $11,705 | $5,883 | |||||||||||||||
| Years ended 4/30 | ||||||||||||||||||||
| Class R4 | 2015 | 2014 | 2013 | 2012 | 2011 | |||||||||||||||
Net asset value, beginning of period | $12.16 | $11.98 | $11.42 | $11.32 | $10.61 | |||||||||||||||
| Income (loss) from investment operations | ||||||||||||||||||||
| Net investment income (d)(l) | $0.24 | $0.27 | $0.28 | $0.32 | $0.31 | |||||||||||||||
Net realized and unrealized gain (loss) on investments | 0.23 | 0.21 | 0.58 | 0.15 | 0.73 | |||||||||||||||
Total from investment operations | $0.47 | $0.48 | $0.86 | $0.47 | $1.04 | |||||||||||||||
| Less distributions declared to shareholders | ||||||||||||||||||||
| From net investment income | $(0.26 | ) | $(0.28 | ) | $(0.30 | ) | $(0.37 | ) | $(0.33 | ) | ||||||||||
From net realized gain on investments | (0.07 | ) | (0.02 | ) | — | — | — | |||||||||||||
Total distributions declared to shareholders | $(0.33 | ) | $(0.30 | ) | $(0.30 | ) | $(0.37 | ) | $(0.33 | ) | ||||||||||
Net asset value, end of period (x) | $12.30 | $12.16 | $11.98 | $11.42 | $11.32 | |||||||||||||||
Total return (%) (r)(s)(x) | 3.92 | 4.07 | 7.63 | 4.27 | 9.97 | |||||||||||||||
| Ratios (%) (to average net assets) and Supplemental data: | ||||||||||||||||||||
| Expenses before expense reductions (f)(h) | 0.14 | 0.14 | 0.15 | 0.19 | 0.27 | |||||||||||||||
Expenses after expense reductions (f)(h) | 0.00 | 0.00 | 0.00 | 0.00 | 0.03 | |||||||||||||||
Net investment income (l) | 1.93 | 2.22 | 2.41 | 2.88 | 2.82 | |||||||||||||||
Portfolio turnover | 14 | 10 | 8 | 14 | 20 | |||||||||||||||
Net assets at end of period (000 omitted) | $75,336 | $33,109 | $25,505 | $967 | $134 | |||||||||||||||
See Notes to Financial Statements
68
Table of Contents
Financial Highlights – continued
MFS LIFETIME INCOME FUND – continued
| Class 529A | Period ended 4/30/15 (i) | |||
Net asset value, beginning of period | $10.00 | |||
| Income (loss) from investment operations | ||||
| Net investment income (d)(l) | $0.02 | |||
Net realized and unrealized gain (loss) on investments | 0.19 | |||
Total from investment operations | $0.21 | |||
| Less distributions declared to shareholders | ||||
From net investment income | $(0.04 | ) | ||
Net asset value, end of period (x) | $10.17 | |||
Total return (%) (r)(s)(t)(x) | 2.07 | (n) | ||
| Ratios (%) (to average net assets) and Supplemental data: | ||||
| Expenses before expense reductions (f)(h) | 0.53 | (a) | ||
Expenses after expense reductions (f)(h) | 0.30 | (a) | ||
Net investment income (l) | 0.70 | (a) | ||
Portfolio turnover | 14 | |||
Net assets at end of period (000 omitted) | $47,993 | |||
| Class 529B | Period ended 4/30/15 (i) | |||
Net asset value, beginning of period | $10.00 | |||
| Income (loss) from investment operations | ||||
| Net investment income (d)(l) | $(0.00 | )(w) | ||
Net realized and unrealized gain (loss) on investments | 0.18 | |||
Total from investment operations | $0.18 | |||
| Less distributions declared to shareholders | ||||
From net investment income | $(0.01 | ) | ||
Net asset value, end of period (x) | $10.17 | |||
Total return (%) (r)(s)(t)(x) | 1.83 | (n) | ||
| Ratios (%) (to average net assets) and Supplemental data: | ||||
| Expenses before expense reductions (f)(h) | 1.28 | (a) | ||
Expenses after expense reductions (f)(h) | 1.04 | (a) | ||
Net investment income (l) | (0.05 | )(a) | ||
Portfolio turnover | 14 | |||
Net assets at end of period (000 omitted) | $3,428 | |||
See Notes to Financial Statements
69
Table of Contents
Financial Highlights – continued
MFS LIFETIME INCOME FUND – continued
| Class 529C | Period ended 4/30/15 (i) | |||
Net asset value, beginning of period | $10.00 | |||
| Income (loss) from investment operations | ||||
| Net investment income (d)(l) | $(0.00 | )(w) | ||
Net realized and unrealized gain (loss) on investments | 0.18 | |||
Total from investment operations | $0.18 | |||
| Less distributions declared to shareholders | ||||
From net investment income | $(0.01 | ) | ||
Net asset value, end of period (x) | $10.17 | |||
Total return (%) (r)(s)(t)(x) | 1.83 | (n) | ||
| Ratios (%) (to average net assets) and Supplemental data: | ||||
| Expenses before expense reductions (f)(h) | 1.28 | (a) | ||
Expenses after expense reductions (f)(h) | 1.05 | (a) | ||
Net investment income (l) | (0.05 | )(a) | ||
Portfolio turnover | 14 | |||
Net assets at end of period (000 omitted) | $23,987 | |||
| (a) | Annualized. |
| (d) | Per share data is based on average shares outstanding. |
| (f) | Ratios do not reflect reductions from fees paid indirectly, if applicable. |
| (h) | In addition to the fees and expenses which the fund bears directly, the fund indirectly bears a pro rata share of the fees and expenses of the underlying affiliated funds in which the fund invests. Accordingly, the expense ratio for the fund reflects only those fees and expenses borne directly by the fund. Because the underlying affiliated funds have varied expense and fee levels and the fund may own different proportions of the underlying affiliated funds at different times, the amount of fees and expenses incurred indirectly by the fund will vary. |
| (i) | For the period from the class inception, January 8, 2015, through the stated period end. |
| (l) | Recognition of net investment income by the fund may be affected by the timing of the declaration of dividends by the underlying affiliated funds in which the fund invests. The ratios and per share amounts do not include net investment income of the underlying affiliated funds in which the fund invests. |
| (n) | Not annualized. |
| (r) | Certain expenses have been reduced without which performance would have been lower. |
| (s) | From time to time the fund may receive proceeds from litigation settlements, without which performance would be lower. |
| (t) | Total returns do not include any applicable sales charges. |
| (w) | Per share amount was less than $0.01. |
| (x) | The net asset values per share and total returns have been calculated on net assets which include adjustments made in accordance with U.S. generally accepted accounting principles required at period end for financial reporting purposes. |
See Notes to Financial Statements
70
Table of Contents
Financial Highlights – continued
MFS LIFETIME 2015 FUND
The financial highlights table is intended to help you understand the fund financial performance for the past 5 years (or life of a particular share class, if shorter). Certain information reflects financial results for a single fund share. The total returns in the table represent the rate by which an investor would have earned (or lost) on an investment in the fund share class (assuming reinvestment of all distributions) held for the entire period.
| Years ended 4/30 | Period ended 4/30/13 (c) | |||||||||||
| Class A | 2015 | 2014 | ||||||||||
Net asset value, beginning of period | $10.72 | $10.45 | $10.00 | |||||||||
| Income (loss) from investment operations | ||||||||||||
| Net investment income (d)(l) | $0.18 | $0.21 | $0.11 | |||||||||
Net realized and unrealized gain (loss) on investments | 0.24 | 0.26 | 0.41 | |||||||||
Total from investment operations | $0.42 | $0.47 | $0.52 | |||||||||
| Less distributions declared to shareholders | ||||||||||||
| From net investment income | $(0.20 | ) | $(0.18 | ) | $(0.07 | ) | ||||||
From net realized gain on investments | (0.06 | ) | (0.02 | ) | — | |||||||
Total distributions declared to shareholders | $(0.26 | ) | $(0.20 | ) | $(0.07 | ) | ||||||
Net asset value, end of period (x) | $10.88 | $10.72 | $10.45 | |||||||||
Total return (%) (r)(s)(t)(x) | 3.92 | 4.52 | 5.20 | (n) | ||||||||
| Ratios (%) (to average net assets) and Supplemental data: | ||||||||||||
| Expenses before expense reductions (f)(h) | 0.65 | 0.70 | 8.83 | (a) | ||||||||
Expenses after expense reductions (f)(h) | 0.25 | 0.25 | 0.25 | (a) | ||||||||
Net investment income (l) | 1.67 | 1.99 | 2.21 | (a) | ||||||||
Portfolio turnover | 22 | 17 | 6 | (n) | ||||||||
Net assets at end of period (000 omitted) | $1,718 | $1,511 | $221 | |||||||||
| Years ended 4/30 | Period ended 4/30/13 (c) | |||||||||||
| Class B | 2015 | 2014 | ||||||||||
Net asset value, beginning of period | $10.70 | $10.42 | $10.00 | |||||||||
| Income (loss) from investment operations | ||||||||||||
| Net investment income (d)(l) | $0.10 | $0.13 | $0.08 | |||||||||
Net realized and unrealized gain (loss) on investments | 0.23 | 0.27 | 0.39 | |||||||||
Total from investment operations | $0.33 | $0.40 | $0.47 | |||||||||
| Less distributions declared to shareholders | ||||||||||||
| From net investment income | $(0.14 | ) | $(0.10 | ) | $(0.05 | ) | ||||||
From net realized gain on investments | (0.06 | ) | (0.02 | ) | — | |||||||
Total distributions declared to shareholders | $(0.20 | ) | $(0.12 | ) | $(0.05 | ) | ||||||
Net asset value, end of period (x) | $10.83 | $10.70 | $10.42 | |||||||||
Total return (%) (r)(s)(t)(x) | 3.09 | 3.80 | 4.76 | (n) | ||||||||
| Ratios (%) (to average net assets) and Supplemental data: | ||||||||||||
| Expenses before expense reductions (f)(h) | 1.40 | 1.47 | 10.44 | (a) | ||||||||
Expenses after expense reductions (f)(h) | 1.00 | 1.00 | 1.00 | (a) | ||||||||
Net investment income (l) | 0.91 | 1.22 | 1.56 | (a) | ||||||||
Portfolio turnover | 22 | 17 | 6 | (n) | ||||||||
Net assets at end of period (000 omitted) | $190 | $136 | $105 | |||||||||
See Notes to Financial Statements
71
Table of Contents
Financial Highlights – continued
MFS LIFETIME 2015 FUND – continued
| Years ended 4/30 | Period ended 4/30/13 (c) | |||||||||||
| Class C | 2015 | 2014 | ||||||||||
Net asset value, beginning of period | $10.66 | $10.42 | $10.00 | |||||||||
| Income (loss) from investment operations | ||||||||||||
| Net investment income (d)(l) | $0.11 | $0.13 | $0.08 | |||||||||
Net realized and unrealized gain (loss) on investments | 0.22 | 0.26 | 0.39 | |||||||||
Total from investment operations | $0.33 | $0.39 | $0.47 | |||||||||
| Less distributions declared to shareholders | ||||||||||||
| From net investment income | $(0.15 | ) | $(0.13 | ) | $(0.05 | ) | ||||||
From net realized gain on investments | (0.06 | ) | (0.02 | ) | — | |||||||
Total distributions declared to shareholders | $(0.21 | ) | $(0.15 | ) | $(0.05 | ) | ||||||
Net asset value, end of period (x) | $10.78 | $10.66 | $10.42 | |||||||||
Total return (%) (r)(s)(t)(x) | 3.12 | 3.77 | 4.76 | (n) | ||||||||
| Ratios (%) (to average net assets) and Supplemental data: | ||||||||||||
| Expenses before expense reductions (f)(h) | 1.40 | 1.45 | 10.43 | (a) | ||||||||
Expenses after expense reductions (f)(h) | 1.00 | 1.00 | 1.00 | (a) | ||||||||
Net investment income (l) | 0.99 | 1.27 | 1.56 | (a) | ||||||||
Portfolio turnover | 22 | 17 | 6 | (n) | ||||||||
Net assets at end of period (000 omitted) | $878 | $410 | $106 | |||||||||
| Years ended 4/30 | Period ended 4/30/13 (c) | |||||||||||
| Class I | 2015 | 2014 | ||||||||||
Net asset value, beginning of period | $10.75 | $10.46 | $10.00 | |||||||||
| Income (loss) from investment operations | ||||||||||||
| Net investment income (d)(l) | $0.21 | $0.23 | $0.13 | |||||||||
Net realized and unrealized gain (loss) on investments | 0.22 | 0.27 | 0.40 | |||||||||
Total from investment operations | $0.43 | $0.50 | $0.53 | �� | ||||||||
| Less distributions declared to shareholders | ||||||||||||
| From net investment income | $(0.22 | ) | $(0.19 | ) | $(0.07 | ) | ||||||
From net realized gain on investments | (0.06 | ) | (0.02 | ) | — | |||||||
Total distributions declared to shareholders | $(0.28 | ) | $(0.21 | ) | $(0.07 | ) | ||||||
Net asset value, end of period (x) | $10.90 | $10.75 | $10.46 | |||||||||
Total return (%) (r)(s)(x) | 4.04 | 4.83 | 5.33 | (n) | ||||||||
| Ratios (%) (to average net assets) and Supplemental data: | ||||||||||||
| Expenses before expense reductions (f)(h) | 0.40 | 0.47 | 9.43 | (a) | ||||||||
Expenses after expense reductions (f)(h) | 0.00 | 0.00 | 0.00 | (a) | ||||||||
Net investment income (l) | 1.91 | 2.19 | 2.55 | (a) | ||||||||
Portfolio turnover | 22 | 17 | 6 | (n) | ||||||||
Net assets at end of period (000 omitted) | $160 | $192 | $105 | |||||||||
See Notes to Financial Statements
72
Table of Contents
Financial Highlights – continued
MFS LIFETIME 2015 FUND – continued
| Years ended 4/30 | Period ended 4/30/13 (c) | |||||||||||
| Class R1 | 2015 | 2014 | ||||||||||
Net asset value, beginning of period | $10.71 | $10.42 | $10.00 | |||||||||
| Income (loss) from investment operations | ||||||||||||
| Net investment income (d)(l) | $0.10 | $0.13 | $0.08 | |||||||||
Net realized and unrealized gain (loss) on investments | 0.23 | 0.27 | 0.39 | |||||||||
Total from investment operations | $0.33 | $0.40 | $0.47 | |||||||||
| Less distributions declared to shareholders | ||||||||||||
| From net investment income | $(0.12 | ) | $(0.09 | ) | $(0.05 | ) | ||||||
From net realized gain on investments | (0.06 | ) | (0.02 | ) | — | |||||||
Total distributions declared to shareholders | $(0.18 | ) | $(0.11 | ) | $(0.05 | ) | ||||||
Net asset value, end of period (x) | $10.86 | $10.71 | $10.42 | |||||||||
Total return (%) (r)(s)(x) | 3.03 | 3.83 | 4.76 | (n) | ||||||||
| Ratios (%) (to average net assets) and Supplemental data: | ||||||||||||
| Expenses before expense reductions (f)(h) | 1.40 | 1.47 | 10.44 | (a) | ||||||||
Expenses after expense reductions (f)(h) | 1.00 | 1.00 | 1.00 | (a) | ||||||||
Net investment income (l) | 0.90 | 1.21 | 1.56 | (a) | ||||||||
Portfolio turnover | 22 | 17 | 6 | (n) | ||||||||
Net assets at end of period (000 omitted) | $117 | $109 | $105 | |||||||||
| Years ended 4/30 | Period ended 4/30/13 (c) | |||||||||||
| Class R2 | 2015 | 2014 | ||||||||||
Net asset value, beginning of period | $10.70 | $10.44 | $10.00 | |||||||||
| Income (loss) from investment operations | ||||||||||||
| Net investment income (d)(l) | $0.15 | $0.18 | $0.10 | |||||||||
Net realized and unrealized gain (loss) on investments | 0.23 | 0.27 | 0.40 | |||||||||
Total from investment operations | $0.38 | $0.45 | $0.50 | |||||||||
| Less distributions declared to shareholders | ||||||||||||
| From net investment income | $(0.17 | ) | $(0.17 | ) | $(0.06 | ) | ||||||
From net realized gain on investments | (0.06 | ) | (0.02 | ) | — | |||||||
Total distributions declared to shareholders | $(0.23 | ) | $(0.19 | ) | $(0.06 | ) | ||||||
Net asset value, end of period (x) | $10.85 | $10.70 | $10.44 | |||||||||
Total return (%) (r)(s)(x) | 3.59 | 4.30 | 5.04 | (n) | ||||||||
| Ratios (%) (to average net assets) and Supplemental data: | ||||||||||||
| Expenses before expense reductions (f)(h) | 0.90 | 0.94 | 9.93 | (a) | ||||||||
Expenses after expense reductions (f)(h) | 0.50 | 0.50 | 0.50 | (a) | ||||||||
Net investment income (l) | 1.41 | 1.74 | 2.06 | (a) | ||||||||
Portfolio turnover | 22 | 17 | 6 | (n) | ||||||||
Net assets at end of period (000 omitted) | $1,965 | $1,591 | $105 | |||||||||
See Notes to Financial Statements
73
Table of Contents
Financial Highlights – continued
MFS LIFETIME 2015 FUND – continued
| Years ended 4/30 | Period ended 4/30/13 (c) | |||||||||||
| Class R3 | 2015 | 2014 | ||||||||||
Net asset value, beginning of period | $10.72 | $10.44 | $10.00 | |||||||||
| Income (loss) from investment operations | ||||||||||||
| Net investment income (d)(l) | $0.18 | $0.21 | $0.09 | |||||||||
Net realized and unrealized gain (loss) on investments | 0.24 | 0.27 | 0.42 | |||||||||
Total from investment operations | $0.42 | $0.48 | $0.51 | |||||||||
| Less distributions declared to shareholders | ||||||||||||
| From net investment income | $(0.20 | ) | $(0.18 | ) | $(0.07 | ) | ||||||
From net realized gain on investments | (0.06 | ) | (0.02 | ) | — | |||||||
Total distributions declared to shareholders | $(0.26 | ) | $(0.20 | ) | $(0.07 | ) | ||||||
Net asset value, end of period (x) | $10.88 | $10.72 | $10.44 | |||||||||
Total return (%) (r)(s)(x) | 3.90 | 4.58 | 5.09 | (n) | ||||||||
| Ratios (%) (to average net assets) and Supplemental data: | ||||||||||||
| Expenses before expense reductions (f)(h) | 0.65 | 0.71 | 2.85 | (a) | ||||||||
Expenses after expense reductions (f)(h) | 0.25 | 0.25 | 0.25 | (a) | ||||||||
Net investment income (l) | 1.63 | 2.00 | 1.78 | (a) | ||||||||
Portfolio turnover | 22 | 17 | 6 | (n) | ||||||||
Net assets at end of period (000 omitted) | $4,740 | $3,515 | $1,781 | |||||||||
| Years ended 4/30 | Period ended 4/30/13 (c) | |||||||||||
| Class R4 | 2015 | 2014 | ||||||||||
Net asset value, beginning of period | $10.75 | $10.45 | $10.00 | |||||||||
| Income (loss) from investment operations | ||||||||||||
| Net investment income (d)(l) | $0.21 | $0.23 | $0.10 | |||||||||
Net realized and unrealized gain (loss) on investments | 0.22 | 0.28 | 0.42 | |||||||||
Total from investment operations | $0.43 | $0.51 | $0.52 | |||||||||
| Less distributions declared to shareholders | ||||||||||||
| From net investment income | $(0.22 | ) | $(0.19 | ) | $(0.07 | ) | ||||||
From net realized gain on investments | (0.06 | ) | (0.02 | ) | — | |||||||
Total distributions declared to shareholders | $(0.28 | ) | $(0.21 | ) | $(0.07 | ) | ||||||
Net asset value, end of period (x) | $10.90 | $10.75 | $10.45 | |||||||||
Total return (%) (r)(s)(x) | 4.04 | 4.93 | 5.23 | (n) | ||||||||
| Ratios (%) (to average net assets) and Supplemental data: | ||||||||||||
| Expenses before expense reductions (f)(h) | 0.40 | 0.46 | 0.46 | (a) | ||||||||
Expenses after expense reductions (f)(h) | 0.00 | 0.00 | 0.00 | (a) | ||||||||
Net investment income (l) | 1.92 | 2.23 | 1.93 | (a) | ||||||||
Portfolio turnover | 22 | 17 | 6 | (n) | ||||||||
Net assets at end of period (000 omitted) | $42,193 | $38,679 | $27,376 | |||||||||
See Notes to Financial Statements
74
Table of Contents
Financial Highlights – continued
MFS LIFETIME 2015 FUND – continued
| (a) | Annualized. |
| (c) | For the period from the commencement of the fund’s investment operations, November 2, 2012, through the stated period end. |
| (d) | Per share data is based on average shares outstanding. |
| (f) | Ratios do not reflect reductions from fees paid indirectly, if applicable. |
| (h) | In addition to the fees and expenses which the fund bears directly, the fund indirectly bears a pro rata share of the fees and expenses of the underlying affiliated funds in which the fund invests. Accordingly, the expense ratio for the fund reflects only those fees and expenses borne directly by the fund. Because the underlying affiliated funds have varied expense and fee levels and the fund may own different proportions of the underlying affiliated funds at different times, the amount of fees and expenses incurred indirectly by the fund will vary. |
| (l) | Recognition of net investment income by the fund may be affected by the timing of the declaration of dividends by the underlying affiliated funds in which the fund invests. The ratios and per share amounts do not include net investment income of the underlying affiliated funds in which the fund invests. |
| (n) | Not annualized. |
| (r) | Certain expenses have been reduced without which performance would have been lower. |
| (s) | From time to time the fund may receive proceeds from litigation settlements, without which performance would be lower. |
| (t) | Total returns do not include any applicable sales charges. |
| (x) | The net asset values per share and total returns have been calculated on net assets which include adjustments made in accordance with U.S. generally accepted accounting principles required at period end for financial reporting purposes. |
See Notes to Financial Statements
75
Table of Contents
Financial Highlights – continued
MFS LIFETIME 2020 FUND
The financial highlights table is intended to help you understand the fund financial performance for the past 5 years. Certain information reflects financial results for a single fund share. The total returns in the table represent the rate by which an investor would have earned (or lost) on an investment in the fund share class (assuming reinvestment of all distributions) held for the entire period.
| Years ended 4/30 | ||||||||||||||||||||
| Class A | 2015 | 2014 | 2013 | 2012 | 2011 | |||||||||||||||
Net asset value, beginning of period | $13.16 | $12.49 | $11.54 | $11.61 | $10.30 | |||||||||||||||
| Income (loss) from investment operations | ||||||||||||||||||||
| Net investment income (d)(l) | $0.22 | $0.25 | $0.23 | $0.25 | $0.20 | |||||||||||||||
Net realized and unrealized gain (loss) on investments | 0.40 | 0.64 | 0.95 | (0.02 | )(g) | 1.34 | ||||||||||||||
Total from investment operations | $0.62 | $0.89 | $1.18 | $0.23 | $1.54 | |||||||||||||||
| Less distributions declared to shareholders | ||||||||||||||||||||
From net investment income | $(0.26 | ) | $(0.22 | ) | $(0.23 | ) | $(0.30 | ) | $(0.23 | ) | ||||||||||
Net asset value, end of period (x) | $13.52 | $13.16 | $12.49 | $11.54 | $11.61 | |||||||||||||||
Total return (%) (r)(s)(t)(x) | 4.76 | 7.18 | 10.34 | 2.15 | 15.11 | |||||||||||||||
| Ratios (%) (to average net assets) and Supplemental data: | ||||||||||||||||||||
| Expenses before expense reductions (f)(h) | 0.42 | 0.40 | 0.42 | 0.43 | 0.44 | |||||||||||||||
Expenses after expense reductions (f)(h) | 0.25 | 0.25 | 0.25 | 0.25 | 0.28 | |||||||||||||||
Net investment income (l) | 1.62 | 1.96 | 1.94 | 2.27 | 1.91 | |||||||||||||||
Portfolio turnover | 18 | 12 | 15 | 14 | 19 | |||||||||||||||
Net assets at end of period (000 omitted) | $45,846 | $55,682 | $39,924 | $33,245 | $27,869 | |||||||||||||||
| Years ended 4/30 | ||||||||||||||||||||
| Class B | 2015 | 2014 | 2013 | 2012 | 2011 | |||||||||||||||
Net asset value, beginning of period | $13.06 | $12.40 | $11.45 | $11.52 | $10.23 | |||||||||||||||
| Income (loss) from investment operations | ||||||||||||||||||||
| Net investment income (d)(l) | $0.12 | $0.14 | $0.14 | $0.17 | $0.12 | |||||||||||||||
Net realized and unrealized gain (loss) on investments | 0.39 | 0.64 | 0.96 | (0.03 | )(g) | 1.33 | ||||||||||||||
Total from investment operations | $0.51 | $0.78 | $1.10 | $0.14 | $1.45 | |||||||||||||||
| Less distributions declared to shareholders | ||||||||||||||||||||
From net investment income | $(0.16 | ) | $(0.12 | ) | $(0.15 | ) | $(0.21 | ) | $(0.16 | ) | ||||||||||
Net asset value, end of period (x) | $13.41 | $13.06 | $12.40 | $11.45 | $11.52 | |||||||||||||||
Total return (%) (r)(s)(t)(x) | 3.96 | 6.33 | 9.65 | 1.36 | 14.23 | |||||||||||||||
| Ratios (%) (to average net assets) and Supplemental data: | ||||||||||||||||||||
| Expenses before expense reductions (f)(h) | 1.17 | 1.15 | 1.17 | 1.18 | 1.19 | |||||||||||||||
Expenses after expense reductions (f)(h) | 1.00 | 1.00 | 1.00 | 1.00 | 1.03 | |||||||||||||||
Net investment income (l) | 0.93 | 1.12 | 1.19 | 1.51 | 1.16 | |||||||||||||||
Portfolio turnover | 18 | 12 | 15 | 14 | 19 | |||||||||||||||
Net assets at end of period (000 omitted) | $6,605 | $7,055 | $6,777 | $5,820 | $5,649 | |||||||||||||||
See Notes to Financial Statements
76
Table of Contents
Financial Highlights – continued
MFS LIFETIME 2020 FUND – continued
| Years ended 4/30 | ||||||||||||||||||||
| Class C | 2015 | 2014 | 2013 | 2012 | 2011 | |||||||||||||||
Net asset value, beginning of period | $12.92 | $12.27 | $11.34 | $11.43 | $10.16 | |||||||||||||||
| Income (loss) from investment operations | ||||||||||||||||||||
| Net investment income (d)(l) | $0.12 | $0.14 | $0.14 | $0.17 | $0.12 | |||||||||||||||
Net realized and unrealized gain (loss) on investments | 0.39 | 0.64 | 0.94 | (0.03 | )(g) | 1.32 | ||||||||||||||
Total from investment operations | $0.51 | $0.78 | $1.08 | $0.14 | $1.44 | |||||||||||||||
| Less distributions declared to shareholders | ||||||||||||||||||||
From net investment income | $(0.17 | ) | $(0.13 | ) | $(0.15 | ) | $(0.23 | ) | $(0.17 | ) | ||||||||||
Net asset value, end of period (x) | $13.26 | $12.92 | $12.27 | $11.34 | $11.43 | |||||||||||||||
Total return (%) (r)(s)(t)(x) | 3.97 | 6.36 | 9.64 | 1.33 | 14.27 | |||||||||||||||
| Ratios (%) (to average net assets) and Supplemental data: | ||||||||||||||||||||
| Expenses before expense reductions (f)(h) | 1.17 | 1.15 | 1.17 | 1.18 | 1.19 | |||||||||||||||
Expenses after expense reductions (f)(h) | 1.00 | 1.00 | 1.00 | 1.00 | 1.03 | |||||||||||||||
Net investment income (l) | 0.92 | 1.13 | 1.19 | 1.54 | 1.17 | |||||||||||||||
Portfolio turnover | 18 | 12 | 15 | 14 | 19 | |||||||||||||||
Net assets at end of period (000 omitted) | $18,428 | $18,515 | $16,209 | $11,862 | $9,727 | |||||||||||||||
| Years ended 4/30 | ||||||||||||||||||||
| Class I | 2015 | 2014 | 2013 | 2012 | 2011 | |||||||||||||||
Net asset value, beginning of period | $13.24 | $12.56 | $11.59 | $11.66 | $10.34 | |||||||||||||||
| Income (loss) from investment operations | ||||||||||||||||||||
| Net investment income (d)(l) | $0.26 | $0.27 | $0.26 | $0.28 | $0.23 | |||||||||||||||
Net realized and unrealized gain (loss) on investments | 0.40 | 0.66 | 0.97 | (0.03 | )(g) | 1.34 | ||||||||||||||
Total from investment operations | $0.66 | $0.93 | $1.23 | $0.25 | $1.57 | |||||||||||||||
| Less distributions declared to shareholders | ||||||||||||||||||||
From net investment income | $(0.30 | ) | $(0.25 | ) | $(0.26 | ) | $(0.32 | ) | $(0.25 | ) | ||||||||||
Net asset value, end of period (x) | $13.60 | $13.24 | $12.56 | $11.59 | $11.66 | |||||||||||||||
Total return (%) (r)(s)(x) | 5.03 | 7.42 | 10.73 | 2.38 | 15.39 | |||||||||||||||
| Ratios (%) (to average net assets) and Supplemental data: | ||||||||||||||||||||
| Expenses before expense reductions (f)(h) | 0.17 | 0.15 | 0.17 | 0.18 | 0.19 | |||||||||||||||
Expenses after expense reductions (f)(h) | 0.00 | 0.00 | 0.00 | 0.00 | 0.03 | |||||||||||||||
Net investment income (l) | 1.93 | 2.10 | 2.18 | 2.50 | 2.19 | |||||||||||||||
Portfolio turnover | 18 | 12 | 15 | 14 | 19 | |||||||||||||||
Net assets at end of period (000 omitted) | $7,312 | $2,916 | $2,778 | $1,948 | $1,488 | |||||||||||||||
See Notes to Financial Statements
77
Table of Contents
Financial Highlights – continued
MFS LIFETIME 2020 FUND – continued
| Years ended 4/30 | ||||||||||||||||||||
| Class R1 | 2015 | 2014 | 2013 | 2012 | 2011 | |||||||||||||||
Net asset value, beginning of period | $13.06 | $12.39 | $11.43 | $11.50 | $10.20 | |||||||||||||||
| Income (loss) from investment operations | ||||||||||||||||||||
| Net investment income (d)(l) | $0.12 | $0.14 | $0.14 | $0.17 | $0.12 | |||||||||||||||
Net realized and unrealized gain (loss) on investments | 0.40 | 0.64 | 0.96 | (0.03 | )(g) | 1.33 | ||||||||||||||
Total from investment operations | $0.52 | $0.78 | $1.10 | $0.14 | $1.45 | |||||||||||||||
| Less distributions declared to shareholders | ||||||||||||||||||||
From net investment income | $(0.16 | ) | $(0.11 | ) | $(0.14 | ) | $(0.21 | ) | $(0.15 | ) | ||||||||||
Net asset value, end of period (x) | $13.42 | $13.06 | $12.39 | $11.43 | $11.50 | |||||||||||||||
Total return (%) (r)(s)(x) | 3.99 | 6.35 | 9.65 | 1.32 | 14.26 | |||||||||||||||
| Ratios (%) (to average net assets) and Supplemental data: | ||||||||||||||||||||
| Expenses before expense reductions (f)(h) | 1.17 | 1.15 | 1.18 | 1.18 | 1.19 | |||||||||||||||
Expenses after expense reductions (f)(h) | 1.00 | 1.00 | 1.00 | 1.00 | 1.03 | |||||||||||||||
Net investment income (l) | 0.93 | 1.12 | 1.19 | 1.50 | 1.14 | |||||||||||||||
Portfolio turnover | 18 | 12 | 15 | 14 | 19 | |||||||||||||||
Net assets at end of period (000 omitted) | $6,357 | $7,494 | $8,293 | $8,804 | $9,509 | |||||||||||||||
| Years ended 4/30 | ||||||||||||||||||||
| Class R2 | 2015 | 2014 | 2013 | 2012 | 2011 | |||||||||||||||
Net asset value, beginning of period | $13.08 | $12.42 | $11.46 | $11.54 | $10.24 | |||||||||||||||
| Income (loss) from investment operations | ||||||||||||||||||||
| Net investment income (d)(l) | $0.19 | $0.21 | $0.20 | $0.22 | $0.18 | |||||||||||||||
Net realized and unrealized gain (loss) on investments | 0.39 | 0.64 | 0.96 | (0.03 | )(g) | 1.33 | ||||||||||||||
Total from investment operations | $0.58 | $0.85 | $1.16 | $0.19 | $1.51 | |||||||||||||||
| Less distributions declared to shareholders | ||||||||||||||||||||
From net investment income | $(0.23 | ) | $(0.19 | ) | $(0.20 | ) | $(0.27 | ) | $(0.21 | ) | ||||||||||
Net asset value, end of period (x) | $13.43 | $13.08 | $12.42 | $11.46 | $11.54 | |||||||||||||||
Total return (%) (r)(s)(x) | 4.48 | 6.83 | 10.21 | 1.82 | 14.84 | |||||||||||||||
| Ratios (%) (to average net assets) and Supplemental data: | ||||||||||||||||||||
| Expenses before expense reductions (f)(h) | 0.67 | 0.65 | 0.68 | 0.68 | 0.69 | |||||||||||||||
Expenses after expense reductions (f)(h) | 0.50 | 0.50 | 0.50 | 0.50 | 0.53 | |||||||||||||||
Net investment income (l) | 1.42 | 1.63 | 1.68 | 2.02 | 1.66 | |||||||||||||||
Portfolio turnover | 18 | 12 | 15 | 14 | 19 | |||||||||||||||
Net assets at end of period (000 omitted) | $68,263 | $71,178 | $65,371 | $67,060 | $61,509 | |||||||||||||||
See Notes to Financial Statements
78
Table of Contents
Financial Highlights – continued
MFS LIFETIME 2020 FUND – continued
| Years ended 4/30 | ||||||||||||||||||||
| Class R3 | 2015 | 2014 | 2013 | 2012 | 2011 | |||||||||||||||
Net asset value, beginning of period | $13.18 | $12.50 | $11.54 | $11.62 | $10.30 | |||||||||||||||
| Income (loss) from investment operations | ||||||||||||||||||||
| Net investment income (d)(l) | $0.22 | $0.24 | $0.23 | $0.25 | $0.20 | |||||||||||||||
Net realized and unrealized gain (loss) on investments | 040 | 0.66 | 0.96 | (0.03 | )(g) | 1.35 | ||||||||||||||
Total from investment operations | $0.62 | $0.90 | $1.19 | $0.22 | $1.55 | |||||||||||||||
| Less distributions declared to shareholders | ||||||||||||||||||||
From net investment income | $(0.27 | ) | $(0.22 | ) | $(0.23 | ) | $(0.30 | ) | $(0.23 | ) | ||||||||||
Net asset value, end of period (x) | $13.53 | $13.18 | $12.50 | $11.54 | $11.62 | |||||||||||||||
Total return (%) (r)(s)(x) | 4.72 | 7.20 | 10.46 | 2.06 | 15.18 | |||||||||||||||
| Ratios (%) (to average net assets) and Supplemental data: | ||||||||||||||||||||
| Expenses before expense reductions (f)(h) | 0.42 | 0.40 | 0.42 | 0.43 | 0.44 | |||||||||||||||
Expenses after expense reductions (f)(h) | 0.25 | 0.25 | 0.25 | 0.25 | 0.28 | |||||||||||||||
Net investment income (l) | 1.67 | 1.86 | 1.94 | 2.27 | 1.91 | |||||||||||||||
Portfolio turnover | 18 | 12 | 15 | 14 | 19 | |||||||||||||||
Net assets at end of period (000 omitted) | $51,380 | $44,145 | $41,188 | $23,615 | $19,344 | |||||||||||||||
| Years ended 4/30 | ||||||||||||||||||||
| Class R4 | 2015 | 2014 | 2013 | 2012 | 2011 | |||||||||||||||
Net asset value, beginning of period | $13.23 | $12.55 | $11.58 | $11.65 | $10.34 | |||||||||||||||
| Income (loss) from investment operations | ||||||||||||||||||||
| Net investment income (d)(l) | $0.26 | $0.27 | $0.27 | $0.29 | $0.21 | |||||||||||||||
Net realized and unrealized gain (loss) on investments | 0.39 | 0.66 | 0.96 | (0.04 | )(g) | 1.35 | ||||||||||||||
Total from investment operations | $0.65 | $0.93 | $1.23 | $0.25 | $1.56 | |||||||||||||||
| Less distributions declared to shareholders | ||||||||||||||||||||
From net investment income | $(0.30 | ) | $(0.25 | ) | $(0.26 | ) | $(0.32 | ) | $(0.25 | ) | ||||||||||
Net asset value, end of period (x) | $13.58 | $13.23 | $12.55 | $11.58 | $11.65 | |||||||||||||||
Total return (%) (r)(s)(x) | 4.96 | 7.42 | 10.74 | 2.39 | 15.29 | |||||||||||||||
| Ratios (%) (to average net assets) and Supplemental data: | ||||||||||||||||||||
| Expenses before expense reductions (f)(h) | 0.17 | 0.15 | 0.16 | 0.18 | 0.19 | |||||||||||||||
Expenses after expense reductions (f)(h) | 0.00 | 0.00 | 0.00 | 0.00 | 0.05 | |||||||||||||||
Net investment income (l) | 1.94 | 2.13 | 2.21 | 2.61 | 2.03 | |||||||||||||||
Portfolio turnover | 18 | 12 | 15 | 14 | 19 | |||||||||||||||
Net assets at end of period (000 omitted) | $159,446 | $147,311 | $109,518 | $1,583 | $441 | |||||||||||||||
| (d) | Per share data is based on average shares outstanding. |
| (f) | Ratios do not reflect reductions from fees paid indirectly, if applicable. |
| (g) | The per share amount varies from the net realized and unrealized gain/loss for the period because of the timing of sales of fund shares and the per share amount of realized and unrealized gains and losses at such time. |
| (h) | In addition to the fees and expenses which the fund bears directly, the fund indirectly bears a pro rata share of the fees and expenses of the underlying affiliated funds in which the fund invests. Accordingly, the expense ratio for the fund reflects only those fees and expenses borne directly by the fund. Because the underlying affiliated funds have varied expense and fee levels and the fund may own different proportions of the underlying affiliated funds at different times, the amount of fees and expenses incurred indirectly by the fund will vary. |
| (l) | Recognition of net investment income by the fund may be affected by the timing of the declaration of dividends by the underlying affiliated funds in which the fund invests. The ratios and per share amounts do not include net investment income of the underlying affiliated funds in which the fund invests. |
| (r) | Certain expenses have been reduced without which performance would have been lower. |
| (s) | From time to time the fund may receive proceeds from litigation settlements, without which performance would be lower. |
| (t) | Total returns do not include any applicable sales charges. |
| (x) | The net asset values per share and total returns have been calculated on net assets which include adjustments made in accordance with U.S. generally accepted accounting principles required at period end for financial reporting purposes. |
See Notes to Financial Statements
79
Table of Contents
Financial Highlights – continued
MFS LIFETIME 2025 FUND
The financial highlights table is intended to help you understand the fund financial performance for the past 5 years (or life of a particular share class, if shorter). Certain information reflects financial results for a single fund share. The total returns in the table represent the rate by which an investor would have earned (or lost) on an investment in the fund share class (assuming reinvestment of all distributions) held for the entire period.
| Years ended 4/30 | Period ended 4/30/13 (c) | |||||||||||
| Class A | 2015 | 2014 | ||||||||||
Net asset value, beginning of period | $11.81 | $10.86 | $10.00 | |||||||||
| Income (loss) from investment operations | ||||||||||||
| Net investment income (d)(l) | $0.19 | $0.20 | $0.09 | |||||||||
Net realized and unrealized gain (loss) on investments | 0.47 | 0.94 | 0.86 | |||||||||
Total from investment operations | $0.66 | $1.14 | $0.95 | |||||||||
| Less distributions declared to shareholders | ||||||||||||
| From net investment income | $(0.20 | ) | $(0.18 | ) | $(0.09 | ) | ||||||
From net realized gain on investments | (0.08 | ) | (0.01 | ) | — | |||||||
Total distributions declared to shareholders | $(0.28 | ) | $(0.19 | ) | $(0.09 | ) | ||||||
Net asset value, end of period (x) | $12.19 | $11.81 | $10.86 | |||||||||
Total return (%) (r)(s)(t)(x) | 5.64 | 10.52 | 9.61 | (n) | ||||||||
| Ratios (%) (to average net assets) and Supplemental data: | ||||||||||||
| Expenses before expense reductions (f)(h) | 0.48 | 0.52 | 7.31 | (a) | ||||||||
Expenses after expense reductions (f)(h) | 0.23 | 0.25 | 0.25 | (a) | ||||||||
Net investment income (l) | 1.58 | 1.74 | 1.75 | (a) | ||||||||
Portfolio turnover | 13 | 10 | 8 | (n) | ||||||||
Net assets at end of period (000 omitted) | $8,807 | $4,238 | $380 | |||||||||
| Years ended 4/30 | Period ended 4/30/13 (c) | |||||||||||
| Class B | 2015 | 2014 | ||||||||||
Net asset value, beginning of period | $11.75 | $10.83 | $10.00 | |||||||||
| Income (loss) from investment operations | ||||||||||||
| Net investment income (d)(l) | $0.10 | $0.10 | $0.04 | |||||||||
Net realized and unrealized gain (loss) on investments | 0.47 | 0.94 | 0.87 | |||||||||
Total from investment operations | $0.57 | $1.04 | $0.91 | |||||||||
| Less distributions declared to shareholders | ||||||||||||
| From net investment income | $(0.13 | ) | $(0.11 | ) | $(0.08 | ) | ||||||
From net realized gain on investments | (0.08 | ) | (0.01 | ) | — | |||||||
Total distributions declared to shareholders | $(0.21 | ) | $(0.12 | ) | $(0.08 | ) | ||||||
Net asset value, end of period (x) | $12.11 | $11.75 | $10.83 | |||||||||
Total return (%) (r)(s)(t)(x) | 4.83 | 9.68 | 9.19 | (n) | ||||||||
| Ratios (%) (to average net assets) and Supplemental data: | ||||||||||||
| Expenses before expense reductions (f)(h) | 1.23 | 1.28 | 7.38 | (a) | ||||||||
Expenses after expense reductions (f)(h) | 1.00 | 1.00 | 1.00 | (a) | ||||||||
Net investment income (l) | 0.83 | 0.87 | 0.86 | (a) | ||||||||
Portfolio turnover | 13 | 10 | 8 | (n) | ||||||||
Net assets at end of period (000 omitted) | $1,035 | $754 | $343 | |||||||||
See Notes to Financial Statements
80
Table of Contents
Financial Highlights – continued
MFS LIFETIME 2025 FUND – continued
| Years ended 4/30 | Period ended 4/30/13 (c) | |||||||||||
| Class C | 2015 | 2014 | ||||||||||
Net asset value, beginning of period | $11.71 | $10.83 | $10.00 | |||||||||
| Income (loss) from investment operations | ||||||||||||
| Net investment income (d)(l) | $0.10 | $0.13 | $0.07 | |||||||||
Net realized and unrealized gain (loss) on investments | 0.47 | 0.91 | 0.84 | |||||||||
Total from investment operations | $0.57 | $1.04 | $0.91 | |||||||||
| Less distributions declared to shareholders | ||||||||||||
| From net investment income | $(0.13 | ) | $(0.15 | ) | $(0.08 | ) | ||||||
From net realized gain on investments | (0.08 | ) | (0.01 | ) | — | |||||||
Total distributions declared to shareholders | $(0.21 | ) | $(0.16 | ) | $(0.08 | ) | ||||||
Net asset value, end of period (x) | $12.07 | $11.71 | $10.83 | |||||||||
Total return (%) (r)(s)(t)(x) | 4.86 | 9.65 | 9.19 | (n) | ||||||||
| Ratios (%) (to average net assets) and Supplemental data: | ||||||||||||
| Expenses before expense reductions (f)(h) | 1.23 | 1.27 | 9.16 | (a) | ||||||||
Expenses after expense reductions (f)(h) | 1.00 | 1.00 | 1.00 | (a) | ||||||||
Net investment income (l) | 0.80 | 1.15 | 1.30 | (a) | ||||||||
Portfolio turnover | 13 | 10 | 8 | (n) | ||||||||
Net assets at end of period (000 omitted) | $2,213 | $1,376 | $171 | |||||||||
| Years ended 4/30 | Period ended 4/30/13 (c) | |||||||||||
| Class I | 2015 | 2014 | ||||||||||
Net asset value, beginning of period | $11.83 | $10.87 | $10.00 | |||||||||
| Income (loss) from investment operations | ||||||||||||
| Net investment income (d)(l) | $0.23 | $0.24 | $0.12 | |||||||||
Net realized and unrealized gain (loss) on investments | 0.46 | 0.92 | 0.85 | |||||||||
Total from investment operations | $0.69 | $1.16 | $0.97 | |||||||||
| Less distributions declared to shareholders | ||||||||||||
| From net investment income | $(0.22 | ) | $(0.19 | ) | $(0.10 | ) | ||||||
From net realized gain on investments | (0.08 | ) | (0.01 | ) | — | |||||||
Total distributions declared to shareholders | $(0.30 | ) | $(0.20 | ) | $(0.10 | ) | ||||||
Net asset value, end of period (x) | $12.22 | $11.83 | $10.87 | |||||||||
Total return (%) (r)(s)(x) | 5.89 | 10.72 | 9.76 | (n) | ||||||||
| Ratios (%) (to average net assets) and Supplemental data: | ||||||||||||
| Expenses before expense reductions (f)(h) | 0.23 | 0.27 | 9.11 | (a) | ||||||||
Expenses after expense reductions (f)(h) | 0.00 | 0.00 | 0.00 | (a) | ||||||||
Net investment income (l) | 1.87 | 2.09 | 2.45 | (a) | ||||||||
Portfolio turnover | 13 | 10 | 8 | (n) | ||||||||
Net assets at end of period (000 omitted) | $1,889 | $443 | $110 | |||||||||
See Notes to Financial Statements
81
Table of Contents
Financial Highlights – continued
MFS LIFETIME 2025 FUND – continued
| Years ended 4/30 | Period ended 4/30/13 (c) | |||||||||||
| Class R1 | 2015 | 2014 | ||||||||||
Net asset value, beginning of period | $11.78 | $10.83 | $10.00 | |||||||||
| Income (loss) from investment operations | ||||||||||||
| Net investment income (d)(l) | $0.09 | $0.10 | $0.07 | |||||||||
Net realized and unrealized gain (loss) on investments | 0.48 | 0.94 | 0.84 | |||||||||
Total from investment operations | $0.57 | $1.04 | $0.91 | |||||||||
| Less distributions declared to shareholders | ||||||||||||
| From net investment income | $(0.10 | ) | $(0.08 | ) | $(0.08 | ) | ||||||
From net realized gain on investments | (0.08 | ) | (0.01 | ) | — | |||||||
Total distributions declared to shareholders | $(0.18 | ) | $(0.09 | ) | $(0.08 | ) | ||||||
Net asset value, end of period (x) | $12.17 | $11.78 | $10.83 | |||||||||
Total return (%) (r)(s)(x) | 4.88 | 9.63 | 9.19 | (n) | ||||||||
| Ratios (%) (to average net assets) and Supplemental data: | ||||||||||||
| Expenses before expense reductions (f)(h) | 1.23 | 1.29 | 10.12 | (a) | ||||||||
Expenses after expense reductions (f)(h) | 1.00 | 1.00 | 1.00 | (a) | ||||||||
Net investment income (l) | 0.73 | 0.85 | 1.45 | (a) | ||||||||
Portfolio turnover | 13 | 10 | 8 | (n) | ||||||||
Net assets at end of period (000 omitted) | $163 | $120 | $109 | |||||||||
| Years ended 4/30 | Period ended 4/30/13 (c) | |||||||||||
| Class R2 | 2015 | 2014 | ||||||||||
Net asset value, beginning of period | $11.78 | $10.85 | $10.00 | |||||||||
| Income (loss) from investment operations | ||||||||||||
| Net investment income (d)(l) | $0.15 | $0.13 | $0.10 | |||||||||
Net realized and unrealized gain (loss) on investments | 0.49 | 0.97 | 0.84 | |||||||||
Total from investment operations | $0.64 | $1.10 | $0.94 | |||||||||
| Less distributions declared to shareholders | ||||||||||||
| From net investment income | $(0.17 | ) | $(0.16 | ) | $(0.09 | ) | ||||||
From net realized gain on investments | (0.08 | ) | (0.01 | ) | — | |||||||
Total distributions declared to shareholders | $(0.25 | ) | $(0.17 | ) | $(0.09 | ) | ||||||
Net asset value, end of period (x) | $12.17 | $11.78 | $10.85 | |||||||||
Total return (%) (r)(s)(x) | 5.42 | 10.19 | 9.48 | (n) | ||||||||
| Ratios (%) (to average net assets) and Supplemental data: | ||||||||||||
| Expenses before expense reductions (f)(h) | 0.73 | 0.76 | 9.60 | (a) | ||||||||
Expenses after expense reductions (f)(h) | 0.50 | 0.50 | 0.50 | (a) | ||||||||
Net investment income (l) | 1.27 | 1.09 | 1.95 | (a) | ||||||||
Portfolio turnover | 13 | 10 | 8 | (n) | ||||||||
Net assets at end of period (000 omitted) | $4,200 | $3,799 | $121 | |||||||||
See Notes to Financial Statements
82
Table of Contents
Financial Highlights – continued
MFS LIFETIME 2025 FUND – continued
| Years ended 4/30 | Period ended 4/30/13 (c) | |||||||||||
| Class R3 | 2015 | 2014 | ||||||||||
Net asset value, beginning of period | $11.80 | $10.86 | $10.00 | |||||||||
| Income (loss) from investment operations | ||||||||||||
| Net investment income (d)(l) | $0.17 | $0.19 | $0.06 | |||||||||
Net realized and unrealized gain (loss) on investments | 0.49 | 0.93 | 0.89 | |||||||||
Total from investment operations | $0.66 | $1.12 | $0.95 | |||||||||
| Less distributions declared to shareholders | ||||||||||||
| From net investment income | $(0.19 | ) | $(0.17 | ) | $(0.09 | ) | ||||||
From net realized gain on investments | (0.08 | ) | (0.01 | ) | — | |||||||
Total distributions declared to shareholders | $(0.27 | ) | $(0.18 | ) | $(0.09 | ) | ||||||
Net asset value, end of period (x) | $12.19 | $11.80 | $10.86 | |||||||||
Total return (%) (r)(s)(x) | 5.65 | 10.39 | 9.62 | (n) | ||||||||
| Ratios (%) (to average net assets) and Supplemental data: | ||||||||||||
| Expenses before expense reductions (f)(h) | 0.48 | 0.53 | 1.74 | (a) | ||||||||
Expenses after expense reductions (f)(h) | 0.25 | 0.25 | 0.25 | (a) | ||||||||
Net investment income (l) | 1.45 | 1.70 | 1.13 | (a) | ||||||||
Portfolio turnover | 13 | 10 | 8 | (n) | ||||||||
Net assets at end of period (000 omitted) | $12,732 | $8,877 | $3,065 | |||||||||
| Years ended 4/30 | Period ended 4/30/13 (c) | |||||||||||
| Class R4 | 2015 | 2014 | ||||||||||
Net asset value, beginning of period | $11.83 | $10.87 | $10.00 | |||||||||
| Income (loss) from investment operations | ||||||||||||
| Net investment income (d)(l) | $0.22 | $0.21 | $0.07 | |||||||||
Net realized and unrealized gain (loss) on investments | 0.47 | 0.95 | 0.90 | |||||||||
Total from investment operations | $0.69 | $1.16 | $0.97 | |||||||||
| Less distributions declared to shareholders | ||||||||||||
| From net investment income | $(0.22 | ) | $(0.19 | ) | $(0.10 | ) | ||||||
From net realized gain on investments | (0.08 | ) | (0.01 | ) | — | |||||||
Total distributions declared to shareholders | $(0.30 | ) | $(0.20 | ) | $(0.10 | ) | ||||||
Net asset value, end of period (x) | $12.22 | $11.83 | $10.87 | |||||||||
Total return (%) (r)(s)(x) | 5.88 | 10.72 | 9.76 | (n) | ||||||||
| Ratios (%) (to average net assets) and Supplemental data: | ||||||||||||
| Expenses before expense reductions (f)(h) | 0.23 | 0.28 | 0.33 | (a) | ||||||||
Expenses after expense reductions (f)(h) | 0.00 | 0.00 | 0.00 | (a) | ||||||||
Net investment income (l) | 1.82 | 1.88 | 1.28 | (a) | ||||||||
Portfolio turnover | 13 | 10 | 8 | (n) | ||||||||
Net assets at end of period (000 omitted) | $98,370 | $66,460 | $40,552 | |||||||||
See Notes to Financial Statements
83
Table of Contents
Financial Highlights – continued
MFS LIFETIME 2025 FUND – continued
| (a) | Annualized. |
| (c) | For the period from the commencement of the fund’s investment operations, November 2, 2012, through the stated period end. |
| (d) | Per share data is based on average shares outstanding. |
| (f) | Ratios do not reflect reductions from fees paid indirectly, if applicable. |
| (h) | In addition to the fees and expenses which the fund bears directly, the fund indirectly bears a pro rata share of the fees and expenses of the underlying affiliated funds in which the fund invests. Accordingly, the expense ratio for the fund reflects only those fees and expenses borne directly by the fund. Because the underlying affiliated funds have varied expense and fee levels and the fund may own different proportions of the underlying affiliated funds at different times, the amount of fees and expenses incurred indirectly by the fund will vary. |
| (l) | Recognition of net investment income by the fund may be affected by the timing of the declaration of dividends by the underlying affiliated funds in which the fund invests. The ratios and per share amounts do not include net investment income of the underlying affiliated funds in which the fund invests. |
| (n) | Not annualized. |
| (r) | Certain expenses have been reduced without which performance would have been lower. |
| (s) | From time to time the fund may receive proceeds from litigation settlements, without which performance would be lower. |
| (t) | Total returns do not include any applicable sales charges. |
| (x) | The net asset values per share and total returns have been calculated on net assets which include adjustments made in accordance with U.S. generally accepted accounting principles required at period end for financial reporting purposes. |
See Notes to Financial Statements
84
Table of Contents
Financial Highlights – continued
MFS LIFETIME 2030 FUND
The financial highlights table is intended to help you understand the fund financial performance for the past 5 years Certain information reflects financial results for a single fund share. The total returns in the table represent the rate by which an investor would have earned (or lost) on an investment in the fund share class (assuming reinvestment of all distributions) held for the entire period.
| Years ended 4/30 | ||||||||||||||||||||
| Class A | 2015 | 2014 | 2013 | 2012 | 2011 | |||||||||||||||
Net asset value, beginning of period | $13.90 | $12.51 | $11.10 | $11.39 | $9.66 | |||||||||||||||
| Income (loss) from investment operations | ||||||||||||||||||||
| Net investment income (d)(l) | $0.18 | $0.17 | $0.15 | $0.15 | $0.11 | |||||||||||||||
Net realized and unrealized gain (loss) on investments | 0.70 | 1.41 | 1.42 | (0.23 | ) | 1.78 | ||||||||||||||
Total from investment operations | $0.88 | $1.58 | $1.57 | $(0.08 | ) | $1.89 | ||||||||||||||
| Less distributions declared to shareholders | ||||||||||||||||||||
From net investment income | $(0.23 | ) | $(0.19 | ) | $(0.16 | ) | $(0.21 | ) | $(0.16 | ) | ||||||||||
Net asset value, end of period (x) | $14.55 | $13.90 | $12.51 | $11.10 | $11.39 | |||||||||||||||
Total return (%) (r)(s)(t)(x) | 6.37 | 12.67 | 14.24 | (0.49 | ) | 19.70 | ||||||||||||||
| Ratios (%) (to average net assets) and Supplemental data: | ||||||||||||||||||||
| Expenses before expense reductions (f)(h) | 0.44 | 0.41 | 0.46 | 0.47 | 0.50 | |||||||||||||||
Expenses after expense reductions (f)(h) | 0.24 | 0.24 | 0.25 | 0.25 | 0.28 | |||||||||||||||
Net investment income (l) | 1.29 | 1.30 | 1.32 | 1.40 | 1.13 | |||||||||||||||
Portfolio turnover | 11 | 6 | 13 | 12 | 15 | |||||||||||||||
Net assets at end of period (000 omitted) | $42,887 | $39,929 | $26,738 | $18,822 | $15,665 | |||||||||||||||
| Years ended 4/30 | ||||||||||||||||||||
| Class B | 2015 | 2014 | 2013 | 2012 | 2011 | |||||||||||||||
Net asset value, beginning of period | $13.73 | $12.37 | $10.99 | $11.27 | $9.58 | |||||||||||||||
| Income (loss) from investment operations | ||||||||||||||||||||
| Net investment income (d)(l) | $0.07 | $0.07 | $0.07 | $0.07 | $0.04 | |||||||||||||||
Net realized and unrealized gain (loss) on investments | 0.69 | 1.39 | 1.39 | (0.21 | ) | 1.74 | ||||||||||||||
Total from investment operations | $0.76 | $1.46 | $1.46 | $(0.14 | ) | $1.78 | ||||||||||||||
| Less distributions declared to shareholders | ||||||||||||||||||||
From net investment income | $(0.12 | ) | $(0.10 | ) | $(0.08 | ) | $(0.14 | ) | $(0.09 | ) | ||||||||||
Net asset value, end of period (x) | $14.37 | $13.73 | $12.37 | $10.99 | $11.27 | |||||||||||||||
Total return (%) (r)(s)(t)(x) | 5.59 | 11.82 | 13.39 | (1.16 | ) | 18.69 | ||||||||||||||
| Ratios (%) (to average net assets) and Supplemental data: | ||||||||||||||||||||
| Expenses before expense reductions (f)(h) | 1.19 | 1.16 | 1.21 | 1.22 | 1.25 | |||||||||||||||
Expenses after expense reductions (f)(h) | 1.00 | 1.00 | 1.00 | 1.00 | 1.03 | |||||||||||||||
Net investment income (l) | 0.53 | 0.53 | 0.60 | 0.63 | 0.37 | |||||||||||||||
Portfolio turnover | 11 | 6 | 13 | 12 | 15 | |||||||||||||||
Net assets at end of period (000 omitted) | $8,414 | $8,022 | $6,347 | $4,497 | $3,996 | |||||||||||||||
See Notes to Financial Statements
85
Table of Contents
Financial Highlights – continued
MFS LIFETIME 2030 FUND – continued
| Years ended 4/30 | ||||||||||||||||||||
| Class C | 2015 | 2014 | 2013 | 2012 | 2011 | |||||||||||||||
Net asset value, beginning of period | $13.67 | $12.33 | $10.94 | $11.24 | $9.56 | |||||||||||||||
| Income (loss) from investment operations | ||||||||||||||||||||
| Net investment income (d)(l) | $0.08 | $0.07 | $0.06 | $0.06 | $0.04 | |||||||||||||||
Net realized and unrealized gain (loss) on investments | 0.67 | 1.38 | 1.41 | (0.22 | ) | 1.75 | ||||||||||||||
Total from investment operations | $0.75 | $1.45 | $1.47 | $(0.16 | ) | $1.79 | ||||||||||||||
| Less distributions declared to shareholders | ||||||||||||||||||||
From net investment income | $(0.13 | ) | $(0.11 | ) | $(0.08 | ) | $(0.14 | ) | $(0.11 | ) | ||||||||||
Net asset value, end of period (x) | $14.29 | $13.67 | $12.33 | $10.94 | $11.24 | |||||||||||||||
Total return (%) (r)(s)(t)(x) | 5.51 | 11.78 | 13.48 | (1.27 | ) | 18.81 | ||||||||||||||
| Ratios (%) (to average net assets) and Supplemental data: | ||||||||||||||||||||
| Expenses before expense reductions (f)(h) | 1.19 | 1.16 | 1.21 | 1.22 | 1.25 | |||||||||||||||
Expenses after expense reductions (f)(h) | 1.00 | 1.00 | 1.00 | 1.00 | 1.02 | |||||||||||||||
Net investment income (l) | 0.55 | 0.55 | 0.57 | 0.62 | 0.39 | |||||||||||||||
Portfolio turnover | 11 | 6 | 13 | 12 | 15 | |||||||||||||||
Net assets at end of period (000 omitted) | $15,521 | $13,791 | $8,949 | $6,861 | $5,594 | |||||||||||||||
| Years ended 4/30 | ||||||||||||||||||||
| Class I | 2015 | 2014 | 2013 | 2012 | 2011 | |||||||||||||||
Net asset value, beginning of period | $13.98 | $12.58 | $11.15 | $11.43 | $9.70 | |||||||||||||||
| Income (loss) from investment operations | ||||||||||||||||||||
| Net investment income (d)(l) | $0.23 | $0.21 | $0.18 | $0.17 | $0.14 | |||||||||||||||
Net realized and unrealized gain (loss) on investments | 0.68 | 1.41 | 1.43 | (0.21 | ) | 1.77 | ||||||||||||||
Total from investment operations | $0.91 | $1.62 | $1.61 | $(0.04 | ) | $1.91 | ||||||||||||||
| Less distributions declared to shareholders | ||||||||||||||||||||
From net investment income | $(0.26 | ) | $(0.22 | ) | $(0.18 | ) | $(0.24 | ) | $(0.18 | ) | ||||||||||
Net asset value, end of period (x) | $14.63 | $13.98 | $12.58 | $11.15 | $11.43 | |||||||||||||||
Total return (%) (r)(s)(x) | 6.57 | 12.90 | 14.60 | (0.17 | ) | 19.85 | ||||||||||||||
| Ratios (%) (to average net assets) and Supplemental data: | ||||||||||||||||||||
| Expenses before expense reductions (f)(h) | 0.20 | 0.16 | 0.21 | 0.22 | 0.25 | |||||||||||||||
Expenses after expense reductions (f)(h) | 0.00 | 0.00 | 0.00 | 0.00 | 0.03 | |||||||||||||||
Net investment income (l) | 1.61 | 1.54 | 1.60 | 1.59 | 1.35 | |||||||||||||||
Portfolio turnover | 11 | 6 | 13 | 12 | 15 | |||||||||||||||
Net assets at end of period (000 omitted) | $11,665 | $8,067 | $6,207 | $4,121 | $3,009 | |||||||||||||||
See Notes to Financial Statements
86
Table of Contents
Financial Highlights – continued
MFS LIFETIME 2030 FUND – continued
| Years ended 4/30 | ||||||||||||||||||||
| Class R1 | 2015 | 2014 | 2013 | 2012 | 2011 | |||||||||||||||
Net asset value, beginning of period | $13.75 | $12.39 | $10.99 | $11.28 | $9.57 | |||||||||||||||
| Income (loss) from investment operations | ||||||||||||||||||||
| Net investment income (d)(l) | $0.09 | $0.07 | $0.07 | $0.07 | $0.03 | |||||||||||||||
Net realized and unrealized gain (loss) on investments | 0.67 | 1.39 | 1.41 | (0.23 | ) | 1.76 | ||||||||||||||
Total from investment operations | $0.76 | $1.46 | $1.48 | $(0.16 | ) | $1.79 | ||||||||||||||
| Less distributions declared to shareholders | ||||||||||||||||||||
From net investment income | $(0.12 | ) | $(0.10 | ) | $(0.08 | ) | $(0.13 | ) | $(0.08 | ) | ||||||||||
Net asset value, end of period (x) | $14.39 | $13.75 | $12.39 | $10.99 | $11.28 | |||||||||||||||
Total return (%) (r)(s)(x) | 5.56 | 11.79 | 13.51 | (1.26 | ) | 18.76 | ||||||||||||||
| Ratios (%) (to average net assets) and Supplemental data: | ||||||||||||||||||||
| Expenses before expense reductions (f)(h) | 1.19 | 1.16 | 1.21 | 1.22 | 1.25 | |||||||||||||||
Expenses after expense reductions (f)(h) | 1.00 | 1.00 | 1.00 | 1.00 | 1.03 | |||||||||||||||
Net investment income (l) | 0.61 | 0.56 | 0.58 | 0.63 | 0.35 | |||||||||||||||
Portfolio turnover | 11 | 6 | 13 | 12 | 15 | |||||||||||||||
Net assets at end of period (000 omitted) | $8,165 | $10,816 | $9,253 | $7,355 | $6,558 | |||||||||||||||
| Years ended 4/30 | ||||||||||||||||||||
| Class R2 | 2015 | 2014 | 2013 | 2012 | 2011 | |||||||||||||||
Net asset value, beginning of period | $13.79 | $12.42 | $11.01 | $11.30 | $9.59 | |||||||||||||||
| Income (loss) from investment operations | ||||||||||||||||||||
| Net investment income (d)(l) | $0.14 | $0.14 | $0.12 | $0.12 | $0.09 | |||||||||||||||
Net realized and unrealized gain (loss) on investments | 0.69 | 1.39 | 1.42 | (0.22 | ) | 1.76 | ||||||||||||||
Total from investment operations | $0.83 | $1.53 | $1.54 | $(0.10 | ) | $1.85 | ||||||||||||||
| Less distributions declared to shareholders | ||||||||||||||||||||
From net investment income | $(0.19 | ) | $(0.16 | ) | $(0.13 | ) | $(0.19 | ) | $(0.14 | ) | ||||||||||
Net asset value, end of period (x) | $14.43 | $13.79 | $12.42 | $11.01 | $11.30 | |||||||||||||||
Total return (%) (r)(s)(x) | 6.07 | 12.34 | 14.05 | (0.75 | ) | 19.38 | ||||||||||||||
| Ratios (%) (to average net assets) and Supplemental data: | ||||||||||||||||||||
| Expenses before expense reductions (f)(h) | 0.69 | 0.66 | 0.71 | 0.72 | 0.75 | |||||||||||||||
Expenses after expense reductions (f)(h) | 0.50 | 0.50 | 0.50 | 0.50 | 0.53 | |||||||||||||||
Net investment income (l) | 1.01 | 1.04 | 1.08 | 1.14 | 0.88 | |||||||||||||||
Portfolio turnover | 11 | 6 | 13 | 12 | 15 | |||||||||||||||
Net assets at end of period (000 omitted) | $79,912 | $73,435 | $59,251 | $54,704 | $48,253 | |||||||||||||||
See Notes to Financial Statements
87
Table of Contents
Financial Highlights – continued
MFS LIFETIME 2030 FUND – continued
| Years ended 4/30 | ||||||||||||||||||||
| Class R3 | 2015 | 2014 | 2013 | 2012 | 2011 | |||||||||||||||
Net asset value, beginning of period | $13.87 | $12.49 | $11.08 | $11.37 | $9.64 | |||||||||||||||
| Income (loss) from investment operations | ||||||||||||||||||||
| Net investment income (d)(l) | $0.18 | $0.18 | $0.15 | $0.14 | $0.11 | |||||||||||||||
Net realized and unrealized gain (loss) on investments | 0.70 | 1.39 | 1.42 | (0.22 | ) | 1.78 | ||||||||||||||
Total from investment operations | $0.88 | $1.57 | $1.57 | $(0.08 | ) | $1.89 | ||||||||||||||
| Less distributions declared to shareholders | ||||||||||||||||||||
From net investment income | $(0.23 | ) | $(0.19 | ) | $(0.16 | ) | $(0.21 | ) | $(0.16 | ) | ||||||||||
Net asset value, end of period (x) | $14.52 | $13.87 | $12.49 | $11.08 | $11.37 | |||||||||||||||
Total return (%) (r)(s)(x) | 6.37 | 12.63 | 14.26 | (0.50 | ) | 19.73 | ||||||||||||||
| Ratios (%) (to average net assets) and Supplemental data: | ||||||||||||||||||||
| Expenses before expense reductions (f)(h) | 0.44 | 0.41 | 0.46 | 0.47 | 0.50 | |||||||||||||||
Expenses after expense reductions (f)(h) | 0.25 | 0.25 | 0.25 | 0.25 | 0.28 | |||||||||||||||
Net investment income (l) | 1.27 | 1.34 | 1.30 | 1.36 | 1.14 | |||||||||||||||
Portfolio turnover | 11 | 6 | 13 | 12 | 15 | |||||||||||||||
Net assets at end of period (000 omitted) | $71,753 | $57,969 | $35,972 | $25,364 | $18,169 | |||||||||||||||
| Years ended 4/30 | ||||||||||||||||||||
| Class R4 | 2015 | 2014 | 2013 | 2012 | 2011 | |||||||||||||||
Net asset value, beginning of period | $13.96 | $12.56 | $11.14 | $11.42 | $9.69 | |||||||||||||||
| Income (loss) from investment operations | ||||||||||||||||||||
| Net investment income (d)(l) | $0.22 | $0.21 | $0.20 | $0.17 | $0.14 | |||||||||||||||
Net realized and unrealized gain (loss) on investments | 0.69 | 1.41 | 1.40 | (0.21 | ) | 1.77 | ||||||||||||||
Total from investment operations | $0.91 | $1.62 | $1.60 | $(0.04 | ) | $1.91 | ||||||||||||||
| Less distributions declared to shareholders | ||||||||||||||||||||
From net investment income | $(0.26 | ) | $(0.22 | ) | $(0.18 | ) | $(0.24 | ) | $(0.18 | ) | ||||||||||
Net asset value, end of period (x) | $14.61 | $13.96 | $12.56 | $11.14 | $11.42 | |||||||||||||||
Total return (%) (r)(s)(x) | 6.58 | 12.93 | 14.53 | (0.17 | ) | 19.87 | ||||||||||||||
| Ratios (%) (to average net assets) and Supplemental data: | ||||||||||||||||||||
| Expenses before expense reductions (f)(h) | 0.20 | 0.16 | 0.19 | 0.22 | 0.25 | |||||||||||||||
Expenses after expense reductions (f)(h) | 0.00 | 0.00 | 0.00 | 0.00 | 0.03 | |||||||||||||||
Net investment income (l) | 1.56 | 1.57 | 1.72 | 1.60 | 1.42 | |||||||||||||||
Portfolio turnover | 11 | 6 | 13 | 12 | 15 | |||||||||||||||
Net assets at end of period (000 omitted) | $169,285 | $129,817 | $80,692 | $902 | $702 | |||||||||||||||
| (d) | Per share data is based on average shares outstanding. |
| (f) | Ratios do not reflect reductions from fees paid indirectly, if applicable. |
| (h) | In addition to the fees and expenses which the fund bears directly, the fund indirectly bears a pro rata share of the fees and expenses of the underlying affiliated funds in which the fund invests. Accordingly, the expense ratio for the fund reflects only those fees and expenses borne directly by the fund. Because the underlying affiliated funds have varied expense and fee levels and the fund may own different proportions of the underlying affiliated funds at different times, the amount of fees and expenses incurred indirectly by the fund will vary. |
| (l) | Recognition of net investment income by the fund may be affected by the timing of the declaration of dividends by the underlying affiliated funds in which the fund invests. The ratios and per share amounts do not include net investment income of the underlying affiliated funds in which the fund invests. |
| (r) | Certain expenses have been reduced without which performance would have been lower. |
| (s) | From time to time the fund may receive proceeds from litigation settlements, without which performance would be lower. |
| (t) | Total returns do not include any applicable sales charges. |
| (x) | The net asset values per share and total returns have been calculated on net assets which include adjustments made in accordance with U.S. generally accepted accounting principles required at period end for financial reporting purposes. |
See Notes to Financial Statements
88
Table of Contents
Financial Highlights – continued
MFS LIFETIME 2035 FUND
The financial highlights table is intended to help you understand the fund financial performance for the past 5 years (or life of a particular share class, if shorter). Certain information reflects financial results for a single fund share. The total returns in the table represent the rate by which an investor would have earned (or lost) on an investment in the fund share class (assuming reinvestment of all distributions) held for the entire period.
| Years ended 4/30 | Period ended 4/30/13 (c) | |||||||||||
| Class A | 2015 | 2014 | ||||||||||
Net asset value, beginning of period | $12.41 | $11.07 | $10.00 | |||||||||
| Income (loss) from investment operations | ||||||||||||
| Net investment income (d)(l) | $0.15 | $0.16 | $0.07 | |||||||||
Net realized and unrealized gain (loss) on investments | 0.67 | 1.35 | 1.11 | |||||||||
Total from investment operations | $0.82 | $1.51 | $1.18 | |||||||||
| Less distributions declared to shareholders | ||||||||||||
| From net investment income | $(0.18 | ) | $(0.16 | ) | $(0.11 | ) | ||||||
From net realized gain on investments | (0.09 | ) | (0.01 | ) | — | |||||||
Total distributions declared to shareholders | $(0.27 | ) | $(0.17 | ) | $(0.11 | ) | ||||||
Net asset value, end of period (x) | $12.96 | $12.41 | $11.07 | |||||||||
Total return (%) (r)(s)(t)(x) | 6.72 | 13.61 | 11.89 | (n) | ||||||||
| Ratios (%) (to average net assets) and Supplemental data: | ||||||||||||
| Expenses before expense reductions (f)(h) | 0.54 | 0.63 | 6.19 | (a) | ||||||||
Expenses after expense reductions (f)(h) | 0.24 | 0.24 | 0.25 | (a) | ||||||||
Net investment income (l) | 1.19 | 1.33 | 1.33 | (a) | ||||||||
Portfolio turnover | 8 | 8 | 3 | (n) | ||||||||
Net assets at end of period (000 omitted) | $6,353 | $3,502 | $671 | |||||||||
| Years ended 4/30 | Period ended 4/30/13 (c) | |||||||||||
| Class B | 2015 | 2014 | ||||||||||
Net asset value, beginning of period | $12.36 | $11.05 | $10.00 | |||||||||
| Income (loss) from investment operations | ||||||||||||
| Net investment income (d)(l) | $0.04 | $0.03 | $0.05 | |||||||||
Net realized and unrealized gain (loss) on investments | 0.68 | 1.38 | 1.09 | |||||||||
Total from investment operations | $0.72 | $1.41 | $1.14 | |||||||||
| Less distributions declared to shareholders | ||||||||||||
| From net investment income | $(0.11 | ) | $(0.09 | ) | $(0.09 | ) | ||||||
From net realized gain on investments | (0.09 | ) | (0.01 | ) | — | |||||||
Total distributions declared to shareholders | $(0.20 | ) | $(0.10 | ) | $(0.09 | ) | ||||||
Net asset value, end of period (x) | $12.88 | $12.36 | $11.05 | |||||||||
Total return (%) (r)(s)(t)(x) | 5.88 | 12.75 | 11.54 | (n) | ||||||||
| Ratios (%) (to average net assets) and Supplemental data: | ||||||||||||
| Expenses before expense reductions (f)(h) | 1.29 | 1.40 | 8.13 | (a) | ||||||||
Expenses after expense reductions (f)(h) | 1.00 | 1.00 | 1.00 | (a) | ||||||||
Net investment income (l) | 0.33 | 0.27 | 0.94 | (a) | ||||||||
Portfolio turnover | 8 | 8 | 3 | (n) | ||||||||
Net assets at end of period (000 omitted) | $950 | $404 | $186 | |||||||||
See Notes to Financial Statements
89
Table of Contents
Financial Highlights – continued
MFS LIFETIME 2035 FUND – continued
| Years ended 4/30 | Period ended 4/30/13 (c) | |||||||||||
| Class C | 2015 | 2014 | ||||||||||
Net asset value, beginning of period | $12.32 | $11.05 | $10.00 | |||||||||
| Income (loss) from investment operations | ||||||||||||
| Net investment income (d)(l) | $0.05 | $0.05 | $0.06 | |||||||||
Net realized and unrealized gain (loss) on investments | 0.67 | 1.36 | 1.08 | |||||||||
Total from investment operations | $0.72 | $1.41 | $1.14 | |||||||||
| Less distributions declared to shareholders | ||||||||||||
| From net investment income | $(0.12 | ) | $(0.13 | ) | $(0.09 | ) | ||||||
From net realized gain on investments | (0.09 | ) | (0.01 | ) | — | |||||||
Total distributions declared to shareholders | $(0.21 | ) | $(0.14 | ) | $(0.09 | ) | ||||||
Net asset value, end of period (x) | $12.83 | $12.32 | $11.05 | |||||||||
Total return (%) (r)(s)(t)(x) | 5.89 | 12.76 | 11.54 | (n) | ||||||||
| Ratios (%) (to average net assets) and Supplemental data: | ||||||||||||
| Expenses before expense reductions (f)(h) | 1.29 | 1.37 | 9.03 | (a) | ||||||||
Expenses after expense reductions (f)(h) | 1.00 | 1.00 | 1.00 | (a) | ||||||||
Net investment income (l) | 0.39 | 0.45 | 1.11 | (a) | ||||||||
Portfolio turnover | 8 | 8 | 3 | (n) | ||||||||
Net assets at end of period (000 omitted) | $1,965 | $907 | �� | $136 | ||||||||
| Years ended 4/30 | Period ended 4/30/13 (c) | |||||||||||
| Class I | 2015 | 2014 | ||||||||||
Net asset value, beginning of period | $12.44 | $11.09 | $10.00 | |||||||||
| Income (loss) from investment operations | ||||||||||||
| Net investment income (d)(l) | $0.17 | $0.17 | $0.11 | |||||||||
Net realized and unrealized gain (loss) on investments | 0.69 | 1.36 | 1.09 | |||||||||
Total from investment operations | $0.86 | $1.53 | $1.20 | |||||||||
| Less distributions declared to shareholders | ||||||||||||
| From net investment income | $(0.21 | ) | $(0.17 | ) | $(0.11 | ) | ||||||
From net realized gain on investments | (0.09 | ) | (0.01 | ) | — | |||||||
Total distributions declared to shareholders | $(0.30 | ) | $(0.18 | ) | $(0.11 | ) | ||||||
Net asset value, end of period (x) | $13.00 | $12.44 | $11.09 | |||||||||
Total return (%) (r)(s)(x) | 6.98 | 13.80 | 12.13 | (n) | ||||||||
| Ratios (%) (to average net assets) and Supplemental data: | ||||||||||||
| Expenses before expense reductions (f)(h) | 0.29 | 0.39 | 8.23 | (a) | ||||||||
Expenses after expense reductions (f)(h) | 0.00 | 0.00 | 0.00 | (a) | ||||||||
Net investment income (l) | 1.36 | 1.39 | 2.16 | (a) | ||||||||
Portfolio turnover | 8 | 8 | 3 | (n) | ||||||||
Net assets at end of period (000 omitted) | $3,507 | $1,417 | $112 | |||||||||
See Notes to Financial Statements
90
Table of Contents
Financial Highlights – continued
MFS LIFETIME 2035 FUND – continued
| Years ended 4/30 | Period ended 4/30/13 (c) | |||||||||||
| Class R1 | 2015 | 2014 | ||||||||||
Net asset value, beginning of period | $12.39 | $11.05 | $10.00 | |||||||||
| Income (loss) from investment operations | ||||||||||||
| Net investment income (d)(l) | $0.04 | $0.03 | $0.06 | |||||||||
Net realized and unrealized gain (loss) on investments | 0.68 | 1.38 | 1.08 | |||||||||
Total from investment operations | $0.72 | $1.41 | $1.14 | |||||||||
| Less distributions declared to shareholders | ||||||||||||
| From net investment income | $(0.09 | ) | $(0.06 | ) | $(0.09 | ) | ||||||
From net realized gain on investments | (0.09 | ) | (0.01 | ) | — | |||||||
Total distributions declared to shareholders | $(0.18 | ) | $(0.07 | ) | $(0.09 | ) | ||||||
Net asset value, end of period (x) | $12.93 | $12.39 | $11.05 | |||||||||
Total return (%) (r)(s)(x) | 5.90 | 12.73 | 11.54 | (n) | ||||||||
| Ratios (%) (to average net assets) and Supplemental data: | ||||||||||||
| Expenses before expense reductions (f)(h) | 1.29 | 1.41 | 9.24 | (a) | ||||||||
Expenses after expense reductions (f)(h) | 1.00 | 1.00 | 1.00 | (a) | ||||||||
Net investment income (l) | 0.35 | 0.29 | 1.17 | (a) | ||||||||
Portfolio turnover | 8 | 8 | 3 | (n) | ||||||||
Net assets at end of period (000 omitted) | $180 | $126 | $112 | |||||||||
| Years ended 4/30 | Period ended 4/30/13 (c) | |||||||||||
| Class R2 | 2015 | 2014 | ||||||||||
Net asset value, beginning of period | $12.39 | $11.07 | $10.00 | |||||||||
| Income (loss) from investment operations | ||||||||||||
| Net investment income (d)(l) | $0.11 | $0.11 | $0.08 | |||||||||
Net realized and unrealized gain (loss) on investments | 0.67 | 1.36 | 1.09 | |||||||||
Total from investment operations | $0.78 | $1.47 | $1.17 | |||||||||
| Less distributions declared to shareholders | ||||||||||||
| From net investment income | $(0.15 | ) | $(0.14 | ) | $(0.10 | ) | ||||||
From net realized gain on investments | (0.09 | ) | (0.01 | ) | — | |||||||
Total distributions declared to shareholders | $(0.24 | ) | $(0.15 | ) | $(0.10 | ) | ||||||
Net asset value, end of period (x) | $12.93 | $12.39 | $11.07 | |||||||||
Total return (%) (r)(s)(x) | 6.38 | 13.31 | 11.84 | (n) | ||||||||
| Ratios (%) (to average net assets) and Supplemental data: | ||||||||||||
| Expenses before expense reductions (f)(h) | 0.79 | 0.87 | 7.87 | (a) | ||||||||
Expenses after expense reductions (f)(h) | 0.50 | 0.50 | 0.50 | (a) | ||||||||
Net investment income (l) | 0.86 | 0.94 | 1.50 | (a) | ||||||||
Portfolio turnover | 8 | 8 | 3 | (n) | ||||||||
Net assets at end of period (000 omitted) | $3,758 | $2,718 | $320 | |||||||||
See Notes to Financial Statements
91
Table of Contents
Financial Highlights – continued
MFS LIFETIME 2035 FUND – continued
| Years ended 4/30 | Period ended 4/30/13 (c) | |||||||||||
| Class R3 | 2015 | 2014 | ||||||||||
Net asset value, beginning of period | $12.43 | $11.08 | $10.00 | |||||||||
| Income (loss) from investment operations | ||||||||||||
| Net investment income (d)(l) | $0.14 | $0.13 | $0.03 | |||||||||
Net realized and unrealized gain (loss) on investments | 0.67 | 1.38 | 1.16 | |||||||||
Total from investment operations | $0.81 | $1.51 | $1.19 | |||||||||
| Less distributions declared to shareholders | ||||||||||||
| From net investment income | $(0.18 | ) | $(0.15 | ) | $(0.11 | ) | ||||||
From net realized gain on investments | (0.09 | ) | (0.01 | ) | — | |||||||
Total distributions declared to shareholders | $(0.27 | ) | $(0.16 | ) | $(0.11 | ) | ||||||
Net asset value, end of period (x) | $12.97 | $12.43 | $11.08 | |||||||||
Total return (%) (r)(s)(x) | 6.61 | 13.65 | 11.98 | (n) | ||||||||
| Ratios (%) (to average net assets) and Supplemental data: | ||||||||||||
| Expenses before expense reductions (f)(h) | 0.54 | 0.64 | 1.80 | (a) | ||||||||
Expenses after expense reductions (f)(h) | 0.25 | 0.25 | 0.25 | (a) | ||||||||
Net investment income (l) | 1.08 | 1.10 | 0.53 | (a) | ||||||||
Portfolio turnover | 8 | 8 | 3 | (n) | ||||||||
Net assets at end of period (000 omitted) | $12,389 | $6,246 | $2,431 | |||||||||
| Years ended 4/30 | Period ended 4/30/13 (c) | |||||||||||
| Class R4 | 2015 | 2014 | ||||||||||
Net asset value, beginning of period | $12.44 | $11.08 | $10.00 | |||||||||
| Income (loss) from investment operations | ||||||||||||
| Net investment income (d)(l) | $0.19 | $0.16 | $0.03 | |||||||||
Net realized and unrealized gain (loss) on investments | 0.67 | 1.38 | 1.16 | |||||||||
Total from investment operations | $0.86 | $1.54 | $1.19 | |||||||||
| Less distributions declared to shareholders | ||||||||||||
| From net investment income | $(0.21 | ) | $(0.17 | ) | $(0.11 | ) | ||||||
From net realized gain on investments | (0.09 | ) | (0.01 | ) | — | |||||||
Total distributions declared to shareholders | $(0.30 | ) | $(0.18 | ) | $(0.11 | ) | ||||||
Net asset value, end of period (x) | $13.00 | $12.44 | $11.08 | |||||||||
Total return (%) (r)(s)(x) | 6.98 | 13.90 | 12.03 | (n) | ||||||||
| Ratios (%) (to average net assets) and Supplemental data: | ||||||||||||
| Expenses before expense reductions (f)(h) | 0.29 | 0.39 | 0.47 | (a) | ||||||||
Expenses after expense reductions (f)(h) | 0.00 | 0.00 | 0.00 | (a) | ||||||||
Net investment income (l) | 1.49 | 1.35 | 0.59 | (a) | ||||||||
Portfolio turnover | 8 | 8 | 3 | (n) | ||||||||
Net assets at end of period (000 omitted) | $77,094 | $45,765 | $25,065 | |||||||||
See Notes to Financial Statements
92
Table of Contents
Financial Highlights – continued
MFS LIFETIME 2035 FUND – continued
| (a) | Annualized. |
| (c) | For the period from the commencement of the fund’s investment operations, November 2, 2012, through the stated period end. |
| (d) | Per share data is based on average shares outstanding. |
| (f) | Ratios do not reflect reductions from fees paid indirectly, if applicable. |
| (h) | In addition to the fees and expenses which the fund bears directly, the fund indirectly bears a pro rata share of the fees and expenses of the underlying affiliated funds in which the fund invests. Accordingly, the expense ratio for the fund reflects only those fees and expenses borne directly by the fund. Because the underlying affiliated funds have varied expense and fee levels and the fund may own different proportions of the underlying affiliated funds at different times, the amount of fees and expenses incurred indirectly by the fund will vary. |
| (l) | Recognition of net investment income by the fund may be affected by the timing of the declaration of dividends by the underlying affiliated funds in which the fund invests. The ratios and per share amounts do not include net investment income of the underlying affiliated funds in which the fund invests. |
| (n) | Not annualized. |
| (r) | Certain expenses have been reduced without which performance would have been lower. |
| (s) | From time to time the fund may receive proceeds from litigation settlements, without which performance would be lower. |
| (t) | Total returns do not include any applicable sales charges. |
| (x) | The net asset values per share and total returns have been calculated on net assets which include adjustments made in accordance with U.S. generally accepted accounting principles required at period end for financial reporting purposes. |
See Notes to Financial Statements
93
Table of Contents
Financial Highlights – continued
MFS LIFETIME 2040 FUND
The financial highlights table is intended to help you understand the fund financial performance for the past 5 years. Certain information reflects financial results for a single fund share. The total returns in the table represent the rate by which an investor would have earned (or lost) on an investment in the fund share class (assuming reinvestment of all distributions) held for the entire period.
| Years ended 4/30 | ||||||||||||||||||||
| Class A | 2015 | 2014 | 2013 | 2012 | 2011 | |||||||||||||||
Net asset value, beginning of period | $14.09 | $12.49 | $10.96 | $11.31 | $9.49 | |||||||||||||||
| Income (loss) from investment operations | ||||||||||||||||||||
| Net investment income (d)(l) | $0.14 | $0.13 | $0.11 | $0.10 | $0.08 | |||||||||||||||
Net realized and unrealized gain (loss) on investments | 0.84 | 1.64 | 1.55 | (0.27 | ) | 1.88 | ||||||||||||||
Total from investment operations | $0.98 | $1.77 | $1.66 | $(0.17 | ) | $1.96 | ||||||||||||||
| Less distributions declared to shareholders | ||||||||||||||||||||
| From net investment income | $(0.21 | ) | $(0.17 | ) | $(0.13 | ) | $(0.18 | ) | $(0.14 | ) | ||||||||||
From net realized gain on investments | (0.03 | ) | — | — | — | — | ||||||||||||||
Total distributions declared to shareholders | $(0.24 | ) | $(0.17 | ) | $(0.13 | ) | $(0.18 | ) | $(0.14 | ) | ||||||||||
Net asset value, end of period (x) | $14.83 | $14.09 | $12.49 | $10.96 | $11.31 | |||||||||||||||
Total return (%) (r)(s)(t)(x) | 6.97 | 14.18 | 15.25 | (1.36 | ) | 20.78 | ||||||||||||||
| Ratios (%) (to average net assets) and Supplemental data: | ||||||||||||||||||||
| Expenses before expense reductions (f)(h) | 0.48 | 0.45 | 0.53 | 0.55 | 0.59 | |||||||||||||||
Expenses after expense reductions (f)(h) | 0.25 | 0.24 | 0.25 | 0.25 | 0.28 | |||||||||||||||
| Net investment income (l) | 0.99 | 0.97 | 1.02 | 0.97 | 0.85 | |||||||||||||||
Portfolio turnover | 10 | 8 | 16 | 13 | 14 | |||||||||||||||
Net assets at end of period (000 omitted) | $26,564 | $25,674 | $17,207 | $12,700 | $10,260 | |||||||||||||||
| Years ended 4/30 | ||||||||||||||||||||
| Class B | 2015 | 2014 | 2013 | 2012 | 2011 | |||||||||||||||
Net asset value, beginning of period | $13.98 | $12.41 | $10.90 | $11.25 | $9.44 | |||||||||||||||
| Income (loss) from investment operations | ||||||||||||||||||||
| Net investment income (d)(l) | $0.03 | $0.02 | $0.03 | $0.02 | $0.01 | |||||||||||||||
Net realized and unrealized gain (loss) on investments | 0.83 | 1.62 | 1.54 | (0.27 | ) | 1.87 | ||||||||||||||
Total from investment operations | $0.86 | $1.64 | $1.57 | $(0.25 | ) | $1.88 | ||||||||||||||
| Less distributions declared to shareholders | ||||||||||||||||||||
| From net investment income | $(0.10 | ) | $(0.07 | ) | $(0.06 | ) | $(0.10 | ) | $(0.07 | ) | ||||||||||
From net realized gain on investments | (0.03 | ) | — | — | — | — | ||||||||||||||
Total distributions declared to shareholders | $(0.13 | ) | $(0.07 | ) | $(0.06 | ) | $(0.10 | ) | $(0.07 | ) | ||||||||||
Net asset value, end of period (x) | $14.71 | $13.98 | $12.41 | $10.90 | $11.25 | |||||||||||||||
Total return (%) (r)(s)(t)(x) | 6.16 | 13.26 | 14.42 | (2.09 | ) | 20.00 | ||||||||||||||
| Ratios (%) (to average net assets) and Supplemental data: | ||||||||||||||||||||
| Expenses before expense reductions (f)(h) | 1.23 | 1.20 | 1.28 | 1.30 | 1.34 | |||||||||||||||
Expenses after expense reductions (f)(h) | 1.00 | 1.00 | 1.00 | 1.00 | 1.03 | |||||||||||||||
Net investment income (l) | 0.23 | 0.16 | 0.29 | 0.21 | 0.11 | |||||||||||||||
Portfolio turnover | 10 | 8 | 16 | 13 | 14 | |||||||||||||||
Net assets at end of period (000 omitted) | $4,432 | $4,155 | $3,369 | $2,498 | $2,244 | |||||||||||||||
See Notes to Financial Statements
94
Table of Contents
Financial Highlights – continued
MFS LIFETIME 2040 FUND – continued
| Years ended 4/30 | ||||||||||||||||||||
| Class C | 2015 | 2014 | 2013 | 2012 | 2011 | |||||||||||||||
Net asset value, beginning of period | $13.83 | $12.28 | $10.79 | $11.16 | $9.38 | |||||||||||||||
| Income (loss) from investment operations | ||||||||||||||||||||
| Net investment income (d)(l) | $0.04 | $0.02 | $0.03 | $0.03 | $0.01 | |||||||||||||||
Net realized and unrealized gain (loss) on investments | 0.82 | 1.61 | 1.52 | (0.28 | ) | 1.85 | ||||||||||||||
Total from investment operations | $0.86 | $1.63 | $1.55 | $(0.25 | ) | $1.86 | ||||||||||||||
| Less distributions declared to shareholders | ||||||||||||||||||||
| From net investment income | $(0.11 | ) | $(0.08 | ) | $(0.06 | ) | $(0.12 | ) | $(0.08 | ) | ||||||||||
From net realized gain on investments | (0.03 | ) | — | — | — | — | ||||||||||||||
Total distributions declared to shareholders | $(0.14 | ) | $(0.08 | ) | $(0.06 | ) | $(0.12 | ) | $(0.08 | ) | ||||||||||
Net asset value, end of period (x) | $14.55 | $13.83 | $12.28 | $10.79 | $11.16 | |||||||||||||||
Total return (%) (r)(s)(t)(x) | 6.21 | 13.30 | 14.40 | (2.14 | ) | 19.93 | ||||||||||||||
| Ratios (%) (to average net assets) and Supplemental data: | ||||||||||||||||||||
| Expenses before expense reductions (f)(h) | 1.23 | 1.20 | 1.27 | 1.30 | 1.34 | |||||||||||||||
Expenses after expense reductions (f)(h) | 1.00 | 1.00 | 1.00 | 1.00 | 1.03 | |||||||||||||||
| Net investment income (l) | 0.26 | 0.14 | 0.28 | 0.26 | 0.12 | |||||||||||||||
Portfolio turnover | 10 | 8 | 16 | 13 | 14 | |||||||||||||||
Net assets at end of period (000 omitted) | $11,840 | $10,639 | $8,046 | $5,663 | $3,597 | |||||||||||||||
| Years ended 4/30 | ||||||||||||||||||||
| Class I | 2015 | 2014 | 2013 | 2012 | 2011 | |||||||||||||||
Net asset value, beginning of period | $14.18 | $12.57 | $11.02 | $11.37 | $9.53 | |||||||||||||||
| Income (loss) from investment operations | ||||||||||||||||||||
| Net investment income (d)(l) | $0.19 | $0.16 | $0.14 | $0.12 | $0.11 | |||||||||||||||
Net realized and unrealized gain (loss) on investments | 0.83 | 1.64 | 1.56 | (0.27 | ) | 1.89 | ||||||||||||||
Total from investment operations | $1.02 | $1.80 | $1.70 | $(0.15 | ) | $2.00 | ||||||||||||||
| Less distributions declared to shareholders | ||||||||||||||||||||
| From net investment income | $(0.24 | ) | $(0.19 | ) | $(0.15 | ) | $(0.20 | ) | $(0.16 | ) | ||||||||||
From net realized gain on investments | (0.03 | ) | — | — | — | — | ||||||||||||||
Total distributions declared to shareholders | $(0.27 | ) | $(0.19 | ) | $(0.15 | ) | $(0.20 | ) | $(0.16 | ) | ||||||||||
Net asset value, end of period (x) | $14.93 | $14.18 | $12.57 | $11.02 | $11.37 | |||||||||||||||
Total return (%) (r)(s)(x) | 7.24 | 14.38 | 15.61 | (1.12 | ) | 21.16 | ||||||||||||||
| Ratios (%) (to average net assets) and Supplemental data: | ||||||||||||||||||||
| Expenses before expense reductions (f)(h) | 0.23 | 0.21 | 0.28 | 0.30 | 0.34 | |||||||||||||||
Expenses after expense reductions (f)(h) | 0.00 | 0.00 | 0.00 | 0.00 | 0.03 | |||||||||||||||
Net investment income (l) | 1.30 | 1.20 | 1.27 | 1.19 | 1.11 | |||||||||||||||
Portfolio turnover | 10 | 8 | 16 | 13 | 14 | |||||||||||||||
Net assets at end of period (000 omitted) | $8,679 | $8,344 | $5,754 | $4,030 | $2,972 | |||||||||||||||
See Notes to Financial Statements
95
Table of Contents
Financial Highlights – continued
MFS LIFETIME 2040 FUND – continued
| Years ended 4/30 | ||||||||||||||||||||
| Class R1 | 2015 | 2014 | 2013 | 2012 | 2011 | |||||||||||||||
Net asset value, beginning of period | $13.88 | $12.32 | $10.81 | $11.18 | $9.39 | |||||||||||||||
| Income (loss) from investment operations | ||||||||||||||||||||
| Net investment income (d)(l) | $0.04 | $0.03 | $0.03 | $0.03 | $0.01 | |||||||||||||||
Net realized and unrealized gain (loss) on investments | 0.82 | 1.61 | 1.53 | (0.28 | ) | 1.85 | ||||||||||||||
Total from investment operations | $0.86 | $1.64 | $1.56 | $(0.25 | ) | $1.86 | ||||||||||||||
| Less distributions declared to shareholders | ||||||||||||||||||||
| From net investment income | $(0.09 | ) | $(0.08 | ) | $(0.05 | ) | $(0.12 | ) | $(0.07 | ) | ||||||||||
From net realized gain on investments | (0.03 | ) | — | — | — | — | ||||||||||||||
Total distributions declared to shareholders | $(0.12 | ) | $(0.08 | ) | $(0.05 | ) | $(0.12 | ) | $(0.07 | ) | ||||||||||
Net asset value, end of period (x) | $14.62 | $13.88 | $12.32 | $10.81 | $11.18 | |||||||||||||||
Total return (%) (r)(s)(x) | 6.18 | 13.32 | 14.44 | (2.12 | ) | 19.90 | ||||||||||||||
| Ratios (%) (to average net assets) and Supplemental data: | ||||||||||||||||||||
| Expenses before expense reductions (f)(h) | 1.22 | 1.20 | 1.28 | 1.30 | 1.34 | |||||||||||||||
Expenses after expense reductions (f)(h) | 1.00 | 1.00 | 1.00 | 1.00 | 1.03 | |||||||||||||||
| Net investment income (l) | 0.28 | 0.22 | 0.24 | 0.25 | 0.09 | |||||||||||||||
Portfolio turnover | 10 | 8 | 16 | 13 | 14 | |||||||||||||||
Net assets at end of period (000 omitted) | $5,528 | $7,993 | $6,368 | $5,728 | $5,204 | |||||||||||||||
| Years ended 4/30 | ||||||||||||||||||||
| Class R2 | 2015 | 2014 | 2013 | 2012 | 2011 | |||||||||||||||
Net asset value, beginning of period | $14.00 | $12.41 | $10.89 | $11.24 | $9.43 | |||||||||||||||
| Income (loss) from investment operations | ||||||||||||||||||||
| Net investment income (d)(l) | $0.11 | $0.09 | $0.08 | $0.07 | $0.06 | |||||||||||||||
Net realized and unrealized gain (loss) on investments | 0.82 | 1.63 | 1.54 | (0.27 | ) | 1.87 | ||||||||||||||
Total from investment operations | $0.93 | $1.72 | $1.62 | $(0.20 | ) | $1.93 | ||||||||||||||
| Less distributions declared to shareholders | ||||||||||||||||||||
| From net investment income | $(0.17 | ) | $(0.13 | ) | $(0.10 | ) | $(0.15 | ) | $(0.12 | ) | ||||||||||
From net realized gain on investments | (0.03 | ) | — | — | — | — | ||||||||||||||
Total distributions declared to shareholders | $(0.20 | ) | $(0.13 | ) | $(0.10 | ) | $(0.15 | ) | $(0.12 | ) | ||||||||||
Net asset value, end of period (x) | $14.73 | $14.00 | $12.41 | $10.89 | $11.24 | |||||||||||||||
Total return (%) (r)(s)(x) | 6.68 | 13.91 | 14.93 | (1.62 | ) | 20.58 | ||||||||||||||
| Ratios (%) (to average net assets) and Supplemental data: | ||||||||||||||||||||
| Expenses before expense reductions (f)(h) | 0.73 | 0.70 | 0.78 | 0.80 | 0.84 | |||||||||||||||
Expenses after expense reductions (f)(h) | 0.50 | 0.50 | 0.50 | 0.50 | 0.53 | |||||||||||||||
Net investment income (l) | 0.76 | 0.67 | 0.74 | 0.71 | 0.63 | |||||||||||||||
Portfolio turnover | 10 | 8 | 16 | �� | 13 | 14 | ||||||||||||||
Net assets at end of period (000 omitted) | $61,127 | $54,916 | $45,142 | $45,458 | $38,606 | |||||||||||||||
See Notes to Financial Statements
96
Table of Contents
Financial Highlights – continued
MFS LIFETIME 2040 FUND – continued
| Years ended 4/30 | ||||||||||||||||||||
| Class R3 | 2015 | 2014 | 2013 | 2012 | 2011 | |||||||||||||||
Net asset value, beginning of period | $14.09 | $12.49 | $10.96 | $11.31 | $9.49 | |||||||||||||||
| Income (loss) from investment operations | ||||||||||||||||||||
| Net investment income (d)(l) | $0.14 | $0.12 | $0.11 | $0.10 | $0.08 | |||||||||||||||
Net realized and unrealized gain (loss) on investments | 0.84 | 1.65 | 1.55 | (0.27 | ) | 1.88 | ||||||||||||||
Total from investment operations | $0.98 | $1.77 | $1.66 | $(0.17 | ) | $1.96 | ||||||||||||||
| Less distributions declared to shareholders | ||||||||||||||||||||
| From net investment income | $(0.21 | ) | $(0.17 | ) | $(0.13 | ) | $(0.18 | ) | $(0.14 | ) | ||||||||||
From net realized gain on investments | (0.03 | ) | — | — | — | — | ||||||||||||||
Total distributions declared to shareholders | $(0.24 | ) | $(0.17 | ) | $(0.13 | ) | $(0.18 | ) | $(0.14 | ) | ||||||||||
Net asset value, end of period (x) | $14.83 | $14.09 | $12.49 | $10.96 | $11.31 | |||||||||||||||
Total return (%) (r)(s)(x) | 6.97 | 14.17 | 15.26 | (1.37 | ) | 20.78 | ||||||||||||||
| Ratios (%) (to average net assets) and Supplemental data: | ||||||||||||||||||||
| Expenses before expense reductions (f)(h) | 0.48 | 0.45 | 0.52 | 0.55 | 0.59 | |||||||||||||||
Expenses after expense reductions (f)(h) | 0.25 | 0.25 | 0.25 | 0.25 | 0.28 | |||||||||||||||
| Net investment income (l) | 0.98 | 0.91 | 0.95 | 0.94 | 0.86 | |||||||||||||||
Portfolio turnover | 10 | 8 | 16 | 13 | 14 | |||||||||||||||
Net assets at end of period (000 omitted) | $38,524 | $30,202 | $19,518 | $10,073 | $7,752 | |||||||||||||||
| Years ended 4/30 | ||||||||||||||||||||
| Class R4 | 2015 | 2014 | 2013 | 2012 | 2011 | |||||||||||||||
Net asset value, beginning of period | $14.17 | $12.56 | $11.01 | $11.36 | $9.53 | |||||||||||||||
| Income (loss) from investment operations | ||||||||||||||||||||
| Net investment income (d)(l) | $0.19 | $0.16 | $0.18 | $0.13 | $0.11 | |||||||||||||||
Net realized and unrealized gain (loss) on investments | 0.83 | 1.64 | 1.52 | (0.28 | ) | 1.88 | ||||||||||||||
Total from investment operations | $1.02 | $1.80 | $1.70 | $(0.15 | ) | $1.99 | ||||||||||||||
| Less distributions declared to shareholders | ||||||||||||||||||||
| From net investment income | $(0.24 | ) | $(0.19 | ) | $(0.15 | ) | $(0.20 | ) | $(0.16 | ) | ||||||||||
From net realized gain on investments | (0.03 | ) | — | — | — | — | ||||||||||||||
Total distributions declared to shareholders | $(0.27 | ) | $(0.19 | ) | $(0.15 | ) | $(0.20 | ) | $(0.16 | ) | ||||||||||
Net asset value, end of period (x) | $14.92 | $14.17 | $12.56 | $11.01 | $11.36 | |||||||||||||||
Total return (%) (r)(s)(x) | 7.25 | 14.39 | 15.62 | (1.12 | ) | 21.05 | ||||||||||||||
| Ratios (%) (to average net assets) and Supplemental data: | ||||||||||||||||||||
| Expenses before expense reductions (f)(h) | 0.24 | 0.20 | 0.24 | 0.30 | 0.35 | |||||||||||||||
Expenses after expense reductions (f)(h) | 0.00 | 0.00 | 0.00 | 0.00 | 0.03 | |||||||||||||||
Net investment income (l) | 1.30 | 1.19 | 1.50 | 1.20 | 1.11 | |||||||||||||||
Portfolio turnover | 10 | 8 | 16 | 13 | 14 | |||||||||||||||
Net assets at end of period (000 omitted) | $153,594 | $109,501 | $77,285 | $771 | $499 | |||||||||||||||
See Notes to Financial Statements
97
Table of Contents
Financial Highlights – continued
MFS LIFETIME 2040 FUND – continued
| (d) | Per share data is based on average shares outstanding. |
| (f) | Ratios do not reflect reductions from fees paid indirectly, if applicable. |
| (h) | In addition to the fees and expenses which the fund bears directly, the fund indirectly bears a pro rata share of the fees and expenses of the underlying affiliated funds in which the fund invests. Accordingly, the expense ratio for the fund reflects only those fees and expenses borne directly by the fund. Because the underlying affiliated funds have varied expense and fee levels and the fund may own different proportions of the underlying affiliated funds at different times, the amount of fees and expenses incurred indirectly by the fund will vary. |
| (l) | Recognition of net investment income by the fund may be affected by the timing of the declaration of dividends by the underlying affiliated funds in which the fund invests. The ratios and per share amounts do not include net investment income of the underlying affiliated funds in which the fund invests. |
| (r) | Certain expenses have been reduced without which performance would have been lower. |
| (s) | From time to time the fund may receive proceeds from litigation settlements, without which performance would be lower. |
| (t) | Total returns do not include any applicable sales charges. |
| (x) | The net asset values per share and total returns have been calculated on net assets which include adjustments made in accordance with U.S. generally accepted accounting principles required at period end for financial reporting purposes. |
See Notes to Financial Statements
98
Table of Contents
Financial Highlights – continued
MFS LIFETIME 2045 FUND
The financial highlights table is intended to help you understand the fund financial performance for the past 5 years (or life of a particular share class, if shorter). Certain information reflects financial results for a single fund share. The total returns in the table represent the rate by which an investor would have earned (or lost) on an investment in the fund share class (assuming reinvestment of all distributions) held for the entire period.
| Years ended 4/30 | Period ended | |||||||||||
| Class A | 2015 | 2014 | ||||||||||
Net asset value, beginning of period | $12.55 | $11.12 | $10.00 | |||||||||
| Income (loss) from investment operations | ||||||||||||
| Net investment income (d)(l) | $0.13 | $0.13 | $0.08 | |||||||||
Net realized and unrealized gain (loss) on investments | 0.73 | 1.47 | 1.14 | |||||||||
Total from investment operations | $0.86 | $1.60 | $1.22 | |||||||||
| Less distributions declared to shareholders | ||||||||||||
| From net investment income | $(0.18 | ) | $(0.16 | ) | $(0.10 | ) | ||||||
From net realized gain on investments | (0.09 | ) | (0.01 | ) | — | |||||||
Total distributions declared to shareholders | $(0.27 | ) | $(0.17 | ) | �� | $(0.10 | ) | |||||
Net asset value, end of period (x) | $13.14 | $12.55 | $11.12 | |||||||||
Total return (%) (r)(s)(t)(x) | 6.95 | 14.36 | 12.30 | (n) | ||||||||
| Ratios (%) (to average net assets) and Supplemental data: | ||||||||||||
| Expenses before expense reductions (f)(h) | 0.72 | 0.94 | 7.61 | (a) | ||||||||
Expenses after expense reductions (f)(h) | 0.24 | 0.22 | 0.25 | (a) | ||||||||
Net investment income (l) | 1.02 | 1.10 | 1.46 | (a) | ||||||||
Portfolio turnover | 7 | 10 | 5 | (n) | ||||||||
Net assets at end of period (000 omitted) | $2,811 | $1,403 | $208 | |||||||||
| Years ended 4/30 | Period ended 4/30/13 (c) | |||||||||||
| Class B | 2015 | 2014 | ||||||||||
Net asset value, beginning of period | $12.47 | $11.09 | $10.00 | |||||||||
| Income (loss) from investment operations | ||||||||||||
| Net investment income (d)(l) | $0.03 | $0.03 | $0.05 | |||||||||
Net realized and unrealized gain (loss) on investments | 0.73 | 1.44 | 1.13 | |||||||||
Total from investment operations | $0.76 | $1.47 | $1.18 | |||||||||
| Less distributions declared to shareholders | ||||||||||||
| From net investment income | $(0.08 | ) | $(0.08 | ) | $(0.09 | ) | ||||||
From net realized gain on investments | (0.09 | ) | (0.01 | ) | — | |||||||
Total distributions declared to shareholders | $(0.17 | ) | $(0.09 | ) | $(0.09 | ) | ||||||
Net asset value, end of period (x) | $13.06 | $12.47 | $11.09 | |||||||||
Total return (%) (r)(s)(t)(x) | 6.19 | 13.27 | 11.88 | (n) | ||||||||
| Ratios (%) (to average net assets) and Supplemental data: | ||||||||||||
| Expenses before expense reductions (f)(h) | 1.48 | 1.74 | 9.69 | (a) | ||||||||
Expenses after expense reductions (f)(h) | 1.00 | 1.00 | 1.00 | (a) | ||||||||
Net investment income (l) | 0.22 | 0.23 | 0.90 | (a) | ||||||||
Portfolio turnover | 7 | 10 | 5 | (n) | ||||||||
Net assets at end of period (000 omitted) | $408 | $325 | $143 | |||||||||
See Notes to Financial Statements
99
Table of Contents
Financial Highlights – continued
MFS LIFETIME 2045 FUND – continued
| Years ended 4/30 | Period ended 4/30/13 (c) | |||||||||||
| Class C | 2015 | 2014 | ||||||||||
Net asset value, beginning of period | $12.48 | $11.09 | $10.00 | |||||||||
| Income (loss) from investment operations | ||||||||||||
| Net investment income (d)(l) | $0.04 | $0.02 | $0.03 | |||||||||
Net realized and unrealized gain (loss) on investments | 0.72 | 1.45 | 1.15 | |||||||||
Total from investment operations | $0.76 | $1.47 | $1.18 | |||||||||
| Less distributions declared to shareholders | ||||||||||||
| From net investment income | $(0.11 | ) | $(0.07 | ) | $(0.09 | ) | ||||||
From net realized gain on investments | (0.09 | ) | (0.01 | ) | — | |||||||
Total distributions declared to shareholders | $(0.20 | ) | $(0.08 | ) | $(0.09 | ) | ||||||
Net asset value, end of period (x) | $13.04 | $12.48 | $11.09 | |||||||||
Total return (%) (r)(s)(t)(x) | 6.17 | 13.29 | 11.92 | (n) | ||||||||
| Ratios (%) (to average net assets) and Supplemental data: | ||||||||||||
| Expenses before expense reductions (f)(h) | 1.47 | 1.74 | 9.35 | (a) | ||||||||
Expenses after expense reductions (f)(h) | 1.00 | 1.00 | 1.00 | (a) | ||||||||
Net investment income (l) | 0.33 | 0.16 | 0.49 | (a) | ||||||||
Portfolio turnover | 7 | 10 | 5 | (n) | ||||||||
Net assets at end of period (000 omitted) | $909 | $421 | $197 | |||||||||
| Years ended 4/30 | Period ended 4/30/13 (c) | |||||||||||
| Class I | 2015 | 2014 | ||||||||||
Net asset value, beginning of period | $12.56 | $11.13 | $10.00 | |||||||||
| Income (loss) from investment operations | ||||||||||||
| Net investment income (d)(l) | $0.20 | $0.14 | $0.11 | |||||||||
Net realized and unrealized gain (loss) on investments | 0.69 | 1.47 | 1.12 | |||||||||
Total from investment operations | $0.89 | $1.61 | $1.23 | |||||||||
| Less distributions declared to shareholders | ||||||||||||
| From net investment income | $(0.20 | ) | $(0.17 | ) | $(0.10 | ) | ||||||
From net realized gain on investments | (0.09 | ) | (0.01 | ) | — | |||||||
Total distributions declared to shareholders | $(0.29 | ) | $(0.18 | ) | $(0.10 | ) | ||||||
Net asset value, end of period (x) | $13.16 | $12.56 | $11.13 | |||||||||
Total return (%) (r)(s)(x) | 7.21 | 14.46 | 12.45 | (n) | ||||||||
| Ratios (%) (to average net assets) and Supplemental data: | ||||||||||||
| Expenses before expense reductions (f)(h) | 0.46 | 0.74 | 9.30 | (a) | ||||||||
Expenses after expense reductions (f)(h) | 0.00 | 0.00 | 0.00 | (a) | ||||||||
Net investment income (l) | 1.53 | 1.17 | 2.10 | (a) | ||||||||
Portfolio turnover | 7 | 10 | 5 | (n) | ||||||||
Net assets at end of period (000 omitted) | $1,108 | $241 | $112 | |||||||||
See Notes to Financial Statements
100
Table of Contents
Financial Highlights – continued
MFS LIFETIME 2045 FUND – continued
| Years ended 4/30 | Period ended 4/30/13 (c) | |||||||||||
| Class R1 | 2015 | 2014 | ||||||||||
Net asset value, beginning of period | $12.51 | $11.10 | $10.00 | |||||||||
| Income (loss) from investment operations | ||||||||||||
| Net investment income (d)(l) | $0.02 | $0.02 | $0.06 | |||||||||
Net realized and unrealized gain (loss) on investments | 0.74 | 1.45 | 1.13 | |||||||||
Total from investment operations | $0.76 | $1.47 | $1.19 | |||||||||
| Less distributions declared to shareholders | ||||||||||||
| From net investment income | $(0.08 | ) | $(0.05 | ) | $(0.09 | ) | ||||||
From net realized gain on investments | (0.09 | ) | (0.01 | ) | — | |||||||
Total distributions declared to shareholders | $(0.17 | ) | $(0.06 | ) | $(0.09 | ) | ||||||
Net asset value, end of period (x) | $13.10 | �� | $12.51 | $11.10 | ||||||||
Total return (%) (r)(s)(x) | 6.13 | 13.28 | 11.97 | (n) | ||||||||
| Ratios (%) (to average net assets) and Supplemental data: | ||||||||||||
| Expenses before expense reductions (f)(h) | 1.48 | 1.77 | 10.30 | (a) | ||||||||
Expenses after expense reductions (f)(h) | 1.00 | 1.00 | 1.00 | (a) | ||||||||
Net investment income (l) | 0.19 | 0.15 | 1.10 | (a) | ||||||||
Portfolio turnover | 7 | 10 | 5 | (n) | ||||||||
Net assets at end of period (000 omitted) | $172 | $127 | $112 | |||||||||
| Years ended 4/30 | Period ended 4/30/13 (c) | |||||||||||
| Class R2 | 2015 | 2014 | ||||||||||
Net asset value, beginning of period | $12.51 | $11.11 | $10.00 | |||||||||
| Income (loss) from investment operations | ||||||||||||
| Net investment income (d)(l) | $0.09 | $0.09 | $0.08 | |||||||||
Net realized and unrealized gain (loss) on investments | 0.74 | 1.45 | 1.13 | |||||||||
Total from investment operations | $0.83 | $1.54 | $1.21 | |||||||||
| Less distributions declared to shareholders | ||||||||||||
| From net investment income | $(0.15 | ) | $(0.13 | ) | $(0.10 | ) | ||||||
From net realized gain on investments | (0.09 | ) | (0.01 | ) | — | |||||||
Total distributions declared to shareholders | $(0.24 | ) | $(0.14 | ) | $(0.10 | ) | ||||||
Net asset value, end of period (x) | $13.10 | $12.51 | $11.11 | |||||||||
Total return (%) (r)(s)(x) | 6.74 | 13.89 | 12.16 | (n) | ||||||||
| Ratios (%) (to average net assets) and Supplemental data: | ||||||||||||
| Expenses before expense reductions (f)(h) | 0.97 | 1.18 | 9.80 | (a) | ||||||||
Expenses after expense reductions (f)(h) | 0.50 | 0.50 | 0.50 | (a) | ||||||||
Net investment income (l) | 0.71 | 0.77 | 1.60 | (a) | ||||||||
Portfolio turnover | 7 | 10 | 5 | (n) | ||||||||
Net assets at end of period (000 omitted) | $1,769 | $887 | $112 | |||||||||
See Notes to Financial Statements
101
Table of Contents
Financial Highlights – continued
MFS LIFETIME 2045 FUND – continued
| Years ended 4/30 | Period ended 4/30/13 (c) | |||||||||||
| Class R3 | 2015 | 2014 | ||||||||||
Net asset value, beginning of period | $12.54 | $11.13 | $10.00 | |||||||||
| Income (loss) from investment operations | ||||||||||||
| Net investment income (d)(l) | $0.11 | $0.12 | $0.03 | |||||||||
Net realized and unrealized gain (loss) on investments | 0.75 | 1.45 | 1.20 | |||||||||
Total from investment operations | $0.86 | $1.57 | $1.23 | |||||||||
| Less distributions declared to shareholders | ||||||||||||
| From net investment income | $(0.18 | ) | $(0.15 | ) | $(0.10 | ) | ||||||
From net realized gain on investments | (0.09 | ) | (0.01 | ) | — | |||||||
Total distributions declared to shareholders | $(0.27 | ) | $(0.16 | ) | $(0.10 | ) | ||||||
Net asset value, end of period (x) | $13.13 | $12.54 | $11.13 | |||||||||
Total return (%) (r)(s)(x) | 6.92 | 14.11 | 12.40 | (n) | ||||||||
| Ratios (%) (to average net assets) and Supplemental data: | ||||||||||||
| Expenses before expense reductions (f)(h) | 0.72 | 0.97 | 3.04 | (a) | ||||||||
Expenses after expense reductions (f)(h) | 0.25 | 0.25 | 0.25 | (a) | ||||||||
Net investment income (l) | 0.86 | 0.97 | 0.54 | (a) | ||||||||
Portfolio turnover | 7 | 10 | 5 | (n) | ||||||||
Net assets at end of period (000 omitted) | $7,566 | $3,383 | $1,253 | |||||||||
| Years ended 4/30 | Period ended 4/30/13 (c) | |||||||||||
| Class R4 | 2015 | 2014 | ||||||||||
Net asset value, beginning of period | $12.56 | $11.13 | $10.00 | |||||||||
| Income (loss) from investment operations | ||||||||||||
| Net investment income (d)(l) | $0.17 | $0.15 | $0.02 | |||||||||
Net realized and unrealized gain (loss) on investments | 0.71 | 1.46 | 1.21 | |||||||||
Total from investment operations | $0.88 | $1.61 | $1.23 | |||||||||
| Less distributions declared to shareholders | ||||||||||||
| From net investment income | $(0.20 | ) | $(0.17 | ) | $(0.10 | ) | ||||||
From net realized gain on investments | (0.09 | ) | (0.01 | ) | — | |||||||
Total distributions declared to shareholders | $(0.29 | ) | $(0.18 | ) | $(0.10 | ) | ||||||
Net asset value, end of period (x) | $13.15 | $12.56 | $11.13 | |||||||||
Total return (%) (r)(s)(x) | 7.13 | 14.46 | 12.45 | (n) | ||||||||
| Ratios (%) (to average net assets) and Supplemental data: | ||||||||||||
| Expenses before expense reductions (f)(h) | 0.47 | 0.74 | 0.88 | (a) | ||||||||
Expenses after expense reductions (f)(h) | 0.00 | 0.00 | 0.00 | (a) | ||||||||
Net investment income (l) | 1.34 | 1.22 | 0.46 | (a) | ||||||||
Portfolio turnover | 7 | 10 | 5 | (n) | ||||||||
Net assets at end of period (000 omitted) | $47,311 | $25,056 | $12,238 | |||||||||
See Notes to Financial Statements
102
Table of Contents
Financial Highlights – continued
MFS LIFETIME 2045 FUND – continued
| (a) | Annualized. |
| (c) | For the period from the commencement of the fund’s investment operations, November 2, 2012, through the stated period end. |
| (d) | Per share data is based on average shares outstanding. |
| (f) | Ratios do not reflect reductions from fees paid indirectly, if applicable. |
| (h) | In addition to the fees and expenses which the fund bears directly, the fund indirectly bears a pro rata share of the fees and expenses of the underlying affiliated funds in which the fund invests. Accordingly, the expense ratio for the fund reflects only those fees and expenses borne directly by the fund. Because the underlying affiliated funds have varied expense and fee levels and the fund may own different proportions of the underlying affiliated funds at different times, the amount of fees and expenses incurred indirectly by the fund will vary. |
| (l) | Recognition of net investment income by the fund may be affected by the timing of the declaration of dividends by the underlying affiliated funds in which the fund invests. The ratios and per share amounts do not include net investment income of the underlying affiliated funds in which the fund invests. |
| (n) | Not annualized. |
| (r) | Certain expenses have been reduced without which performance would have been lower. |
| (s) | From time to time the fund may receive proceeds from litigation settlements, without which performance would be lower. |
| (t) | Total returns do not include any applicable sales charges. |
| (x) | The net asset values per share and total returns have been calculated on net assets which include adjustments made in accordance with U.S. generally accepted accounting principles required at period end for financial reporting purposes. |
See Notes to Financial Statements
103
Table of Contents
Financial Highlights – continued
MFS LIFETIME 2050 FUND
The financial highlights table is intended to help you understand the fund financial performance for the past 5 years (or life of a particular share class, if shorter). Certain information reflects financial results for a single fund share. The total returns in the table represent the rate by which an investor would have earned (or lost) on an investment in the fund share class (assuming reinvestment of all distributions) held for the entire period.
| Years ended 4/30 | Period ended 4/30/11 (c) | |||||||||||||||||||
| Class A | 2015 | 2014 | 2013 | 2012 | ||||||||||||||||
Net asset value, beginning of period | $15.17 | $13.45 | $11.79 | $12.08 | $10.00 | |||||||||||||||
| Income (loss) from investment operations | ||||||||||||||||||||
| Net investment income (d)(l) | $0.15 | $0.14 | $0.13 | $0.07 | $0.11 | |||||||||||||||
Net realized and unrealized gain (loss) on investments | 0.89 | 1.76 | 1.66 | (0.22 | ) | 2.10 | ||||||||||||||
Total from investment operations | $1.04 | $1.90 | $1.79 | $(0.15 | ) | $2.21 | ||||||||||||||
| Less distributions declared to shareholders | ||||||||||||||||||||
| From net investment income | $(0.22 | ) | $(0.18 | ) | $(0.13 | ) | $(0.12 | ) | $(0.13 | ) | ||||||||||
From net realized gain on investments | (0.11 | ) | — | — | (0.02 | ) | — | |||||||||||||
Total distributions declared to shareholders | $(0.33 | ) | $(0.18 | ) | $(0.13 | ) | $(0.14 | ) | $(0.13 | ) | ||||||||||
Net asset value, end of period (x) | $15.88 | $15.17 | $13.45 | $11.79 | $12.08 | |||||||||||||||
Total return (%) (r)(s)(t)(x) | 6.92 | 14.14 | 15.26 | (1.03 | ) | 22.20 | (n) | |||||||||||||
| Ratios (%) (to average net assets) and Supplemental data: | ||||||||||||||||||||
| Expenses before expense reductions (f)(h) | 0.69 | 0.76 | 1.92 | 4.95 | 4.60 | (a) | ||||||||||||||
Expenses after expense reductions (f)(h) | 0.25 | 0.25 | 0.25 | 0.25 | 0.25 | (a) | ||||||||||||||
Net investment income (l) | 0.99 | 1.00 | 1.05 | 0.66 | 1.60 | (a) | ||||||||||||||
Portfolio turnover | 9 | 9 | 14 | 69 | 4 | (n) | ||||||||||||||
Net assets at end of period (000 omitted) | $5,730 | $4,726 | $1,916 | $655 | $1,836 | |||||||||||||||
| Years ended 4/30 | Period ended 4/30/11 (c) | |||||||||||||||||||
| Class B | 2015 | 2014 | 2013 | 2012 | ||||||||||||||||
Net asset value, beginning of period | $15.01 | $13.32 | $11.69 | $12.06 | $10.00 | |||||||||||||||
| Income (loss) from investment operations | ||||||||||||||||||||
| Net investment income (d)(l) | $0.04 | $0.02 | $0.03 | $0.02 | $0.03 | |||||||||||||||
Net realized and unrealized gain (loss) on investments | 0.89 | 1.74 | 1.65 | (0.26 | ) | 2.13 | ||||||||||||||
Total from investment operations | $0.93 | $1.76 | $1.68 | $(0.24 | ) | $2.16 | ||||||||||||||
| Less distributions declared to shareholders | ||||||||||||||||||||
| From net investment income | $(0.11 | ) | $(0.07 | ) | $(0.05 | ) | $(0.11 | ) | $(0.10 | ) | ||||||||||
From net realized gain on investments | (0.11 | ) | — | — | (0.02 | ) | — | |||||||||||||
Total distributions declared to shareholders | $(0.22 | ) | $(0.07 | ) | $(0.05 | ) | $(0.13 | ) | $(0.10 | ) | ||||||||||
Net asset value, end of period (x) | $15.72 | $15.01 | $13.32 | $11.69 | $12.06 | |||||||||||||||
Total return (%) (r)(s)(t)(x) | 6.21 | 13.24 | 14.41 | (1.84 | ) | 21.70 | (n) | |||||||||||||
| Ratios (%) (to average net assets) and Supplemental data: | ||||||||||||||||||||
| Expenses before expense reductions (f)(h) | 1.44 | 1.51 | 2.87 | 6.38 | 6.80 | (a) | ||||||||||||||
Expenses after expense reductions (f)(h) | 1.00 | 1.00 | 1.00 | 1.00 | 1.00 | (a) | ||||||||||||||
Net investment income (l) | 0.23 | 0.13 | 0.29 | 0.16 | 0.46 | (a) | ||||||||||||||
Portfolio turnover | 9 | 9 | 14 | 69 | 4 | (n) | ||||||||||||||
Net assets at end of period (000 omitted) | $828 | $671 | $446 | $329 | $172 | |||||||||||||||
See Notes to Financial Statements
104
Table of Contents
Financial Highlights – continued
MFS LIFETIME 2050 FUND – continued
| Years ended 4/30 | Period ended 4/30/11 (c) | |||||||||||||||||||
| Class C | 2015 | 2014 | 2013 | 2012 | ||||||||||||||||
Net asset value, beginning of period | $14.96 | $13.30 | $11.68 | $12.06 | $10.00 | |||||||||||||||
| Income (loss) from investment operations | ||||||||||||||||||||
| Net investment income (d)(l) | $0.04 | $0.03 | $0.04 | $0.03 | $0.04 | |||||||||||||||
Net realized and unrealized gain (loss) on investments | 0.87 | 1.73 | 1.63 | (0.27 | ) | 2.12 | ||||||||||||||
Total from investment operations | $0.91 | $1.76 | $1.67 | $(0.24 | ) | $2.16 | ||||||||||||||
| Less distributions declared to shareholders | ||||||||||||||||||||
| From net investment income | $(0.13 | ) | $(0.10 | ) | $(0.05 | ) | $(0.12 | ) | $(0.10 | ) | ||||||||||
From net realized gain on investments | (0.11 | ) | — | — | (0.02 | ) | — | |||||||||||||
Total distributions declared to shareholders | $(0.24 | ) | $(0.10 | ) | $(0.05 | ) | $(0.14 | ) | $(0.10 | ) | ||||||||||
Net asset value, end of period (x) | $15.63 | $14.96 | $13.30 | $11.68 | $12.06 | |||||||||||||||
Total return (%) (r)(s)(t)(x) | 6.13 | 13.25 | 14.36 | (1.79 | ) | 21.70 | (n) | |||||||||||||
| Ratios (%) (to average net assets) and Supplemental data: | ||||||||||||||||||||
| Expenses before expense reductions (f)(h) | 1.44 | 1.51 | 2.83 | 6.49 | 6.87 | (a) | ||||||||||||||
Expenses after expense reductions (f)(h) | 1.00 | 1.00 | 1.00 | 1.00 | 1.00 | (a) | ||||||||||||||
Net investment income (l) | 0.28 | 0.18 | 0.30 | 0.24 | 0.52 | (a) | ||||||||||||||
Portfolio turnover | 9 | 9 | 14 | 69 | 4 | (n) | ||||||||||||||
Net assets at end of period (000 omitted) | $1,835 | $1,195 | $468 | $267 | $167 | |||||||||||||||
| Years ended 4/30 | Period ended 4/30/11 (c) | |||||||||||||||||||
| Class I | 2015 | 2014 | 2013 | 2012 | ||||||||||||||||
Net asset value, beginning of period | $15.14 | $13.41 | $11.75 | $12.10 | $10.00 | |||||||||||||||
| Income (loss) from investment operations | ||||||||||||||||||||
| Net investment income (d)(l) | $0.20 | $0.17 | $0.15 | $0.15 | $0.11 | |||||||||||||||
Net realized and unrealized gain (loss) on investments | 0.87 | 1.76 | 1.66 | (0.27 | ) | 2.12 | ||||||||||||||
Total from investment operations | $1.07 | $1.93 | $1.81 | $(0.12 | ) | $2.23 | ||||||||||||||
| Less distributions declared to shareholders | ||||||||||||||||||||
| From net investment income | $(0.25 | ) | $(0.20 | ) | $(0.15 | ) | $(0.21 | ) | $(0.13 | ) | ||||||||||
From net realized gain on investments | (0.11 | ) | — | — | (0.02 | ) | — | |||||||||||||
Total distributions declared to shareholders | $(0.36 | ) | $(0.20 | ) | $(0.15 | ) | $(0.23 | ) | $(0.13 | ) | ||||||||||
Net asset value, end of period (x) | $15.85 | $15.14 | $13.41 | $11.75 | $12.10 | |||||||||||||||
Total return (%) (r)(s)(x) | 7.16 | 14.43 | 15.50 | (0.77 | ) | 22.45 | (n) | |||||||||||||
| Ratios (%) (to average net assets) and Supplemental data: | ||||||||||||||||||||
| Expenses before expense reductions (f)(h) | 0.44 | 0.51 | 1.85 | 5.44 | 5.79 | (a) | ||||||||||||||
Expenses after expense reductions (f)(h) | 0.00 | 0.00 | 0.00 | 0.00 | 0.00 | (a) | ||||||||||||||
Net investment income (l) | 1.31 | 1.20 | 1.21 | 1.33 | 1.55 | (a) | ||||||||||||||
Portfolio turnover | 9 | 9 | 14 | 69 | 4 | (n) | ||||||||||||||
Net assets at end of period (000 omitted) | $1,132 | $840 | $542 | $368 | $155 | |||||||||||||||
See Notes to Financial Statements
105
Table of Contents
Financial Highlights – continued
MFS LIFETIME 2050 FUND – continued
| Years ended 4/30 | Period ended 4/30/11 (c) | |||||||||||||||||||
| Class R1 | 2015 | 2014 | 2013 | 2012 | ||||||||||||||||
Net asset value, beginning of period | $14.98 | $13.31 | $11.69 | $12.06 | $10.00 | |||||||||||||||
| Income (loss) from investment operations | ||||||||||||||||||||
| Net investment income (d)(l) | $0.12 | $0.02 | $0.05 | $0.02 | $0.04 | |||||||||||||||
Net realized and unrealized gain (loss) on investments | 0.79 | 1.74 | 1.62 | (0.26 | ) | 2.12 | ||||||||||||||
Total from investment operations | $0.91 | $1.76 | $1.67 | $(0.24 | ) | $2.16 | ||||||||||||||
| Less distributions declared to shareholders | ||||||||||||||||||||
| From net investment income | $(0.14 | ) | $(0.09 | ) | $(0.05 | ) | $(0.11 | ) | $(0.10 | ) | ||||||||||
From net realized gain on investments | (0.11 | ) | — | — | (0.02 | ) | — | |||||||||||||
Total distributions declared to shareholders | $(0.25 | ) | $(0.09 | ) | $(0.05 | ) | $(0.13 | ) | $(0.10 | ) | ||||||||||
Net asset value, end of period (x) | $15.64 | $14.98 | $13.31 | $11.69 | $12.06 | |||||||||||||||
Total return (%) (r)(s)(x) | 6.14 | 13.24 | 14.38 | (1.81 | ) | 21.70 | (n) | |||||||||||||
| Ratios (%) (to average net assets) and Supplemental data: | ||||||||||||||||||||
| Expenses before expense reductions (f)(h) | 1.42 | 1.51 | 2.87 | 6.47 | 7.00 | (a) | ||||||||||||||
Expenses after expense reductions (f)(h) | 1.00 | 1.00 | 1.00 | 1.00 | 1.00 | (a) | ||||||||||||||
Net investment income (l) | 0.77 | 0.16 | 0.38 | 0.21 | 0.58 | (a) | ||||||||||||||
Portfolio turnover | 9 | 9 | 14 | 69 | 4 | (n) | ||||||||||||||
Net assets at end of period (000 omitted) | $377 | $567 | $250 | $182 | $122 | |||||||||||||||
| Years ended 4/30 | Period ended 4/30/11 (c) | |||||||||||||||||||
| Class R2 | 2015 | 2014 | 2013 | 2012 | ||||||||||||||||
Net asset value, beginning of period | $15.04 | $13.34 | $11.71 | $12.08 | $10.00 | |||||||||||||||
| Income (loss) from investment operations | ||||||||||||||||||||
| Net investment income (d)(l) | $0.12 | $0.10 | $0.10 | $0.07 | $0.07 | |||||||||||||||
Net realized and unrealized gain (loss) on investments | 0.87 | 1.75 | 1.63 | (0.25 | ) | 2.13 | ||||||||||||||
Total from investment operations | $0.99 | $1.85 | $1.73 | $(0.18 | ) | $2.20 | ||||||||||||||
| Less distributions declared to shareholders | ||||||||||||||||||||
| From net investment income | $(0.19 | ) | $(0.15 | ) | $(0.10 | ) | $(0.17 | ) | $(0.12 | ) | ||||||||||
From net realized gain on investments | (0.11 | ) | — | — | (0.02 | ) | — | |||||||||||||
Total distributions declared to shareholders | $(0.30 | ) | $(0.15 | ) | $(0.10 | ) | $(0.19 | ) | $(0.12 | ) | ||||||||||
Net asset value, end of period (x) | $15.73 | $15.04 | $13.34 | $11.71 | $12.08 | |||||||||||||||
Total return (%) (r)(s)(x) | 6.67 | 13.87 | 14.88 | (1.28 | ) | 22.07 | (n) | |||||||||||||
| Ratios (%) (to average net assets) and Supplemental data: | ||||||||||||||||||||
| Expenses before expense reductions (f)(h) | 0.94 | 1.01 | 2.27 | 5.96 | 6.50 | (a) | ||||||||||||||
Expenses after expense reductions (f)(h) | 0.50 | 0.50 | 0.50 | 0.50 | 0.50 | (a) | ||||||||||||||
Net investment income (l) | 0.81 | 0.67 | 0.81 | 0.66 | 1.08 | (a) | ||||||||||||||
Portfolio turnover | 9 | 9 | 14 | 69 | 4 | (n) | ||||||||||||||
Net assets at end of period (000 omitted) | $13,030 | $6,975 | $3,282 | $1,627 | $122 | |||||||||||||||
See Notes to Financial Statements
106
Table of Contents
Financial Highlights – continued
MFS LIFETIME 2050 FUND – continued
| Years ended 4/30 | Period ended 4/30/11 (c) | |||||||||||||||||||
| Class R3 | 2015 | 2014 | 2013 | 2012 | ||||||||||||||||
Net asset value, beginning of period | $15.09 | $13.37 | $11.73 | $12.09 | $10.00 | |||||||||||||||
| Income (loss) from investment operations | ||||||||||||||||||||
| Net investment income (d)(l) | $0.14 | $0.13 | $0.12 | $0.09 | $0.09 | |||||||||||||||
Net realized and unrealized gain (loss) on investments | 0.90 | 1.77 | 1.65 | (0.24 | ) | 2.12 | ||||||||||||||
Total from investment operations | $1.04 | $1.90 | $1.77 | $(0.15 | ) | $2.21 | ||||||||||||||
| Less distributions declared to shareholders | ||||||||||||||||||||
| From net investment income | $(0.22 | ) | $(0.18 | ) | $(0.13 | ) | $(0.19 | ) | $(0.12 | ) | ||||||||||
From net realized gain on investments | (0.11 | ) | — | — | (0.02 | ) | — | |||||||||||||
Total distributions declared to shareholders | $(0.33 | ) | $(0.18 | ) | $(0.13 | ) | $(0.21 | ) | $(0.12 | ) | ||||||||||
Net asset value, end of period (x) | $15.80 | $15.09 | $13.37 | $11.73 | $12.09 | |||||||||||||||
Total return (%) (r)(s)(x) | 6.95 | 14.19 | 15.17 | (1.04 | ) | 22.26 | (n) | |||||||||||||
| Ratios (%) (to average net assets) and Supplemental data: | ||||||||||||||||||||
| Expenses before expense reductions (f)(h) | 0.69 | 0.76 | 1.82 | 5.30 | 6.17 | (a) | ||||||||||||||
Expenses after expense reductions (f)(h) | 0.25 | 0.25 | 0.25 | 0.25 | 0.25 | (a) | ||||||||||||||
Net investment income (l) | 0.90 | 0.90 | 0.95 | 0.79 | 1.28 | (a) | ||||||||||||||
Portfolio turnover | 9 | 9 | 14 | 69 | 4 | (n) | ||||||||||||||
Net assets at end of period (000 omitted) | $9,089 | $4,941 | $2,694 | $585 | $144 | |||||||||||||||
| Years ended 4/30 | Period ended 4/30/11 (c) | |||||||||||||||||||
| Class R4 | 2015 | 2014 | 2013 | 2012 | ||||||||||||||||
Net asset value, beginning of period | $15.13 | $13.40 | $11.75 | $12.10 | $10.00 | |||||||||||||||
| Income (loss) from investment operations | ||||||||||||||||||||
| Net investment income (d)(l) | $0.20 | $0.18 | $0.19 | $0.13 | $0.11 | |||||||||||||||
Net realized and unrealized gain (loss) on investments | 0.88 | 1.75 | 1.61 | (0.25 | ) | 2.12 | ||||||||||||||
Total from investment operations | $1.08 | $1.93 | $1.80 | $(0.12 | ) | $2.23 | ||||||||||||||
| Less distributions declared to shareholders | ||||||||||||||||||||
| From net investment income | $(0.25 | ) | $(0.20 | ) | $(0.15 | ) | $(0.21 | ) | $(0.13 | ) | ||||||||||
From net realized gain on investments | (0.11 | ) | — | — | (0.02 | ) | — | |||||||||||||
Total distributions declared to shareholders | $(0.36 | ) | $(0.20 | ) | $(0.15 | ) | $(0.23 | ) | $(0.13 | ) | ||||||||||
Net asset value, end of period (x) | $15.85 | $15.13 | $13.40 | $11.75 | $12.10 | |||||||||||||||
Total return (%) (r)(s)(x) | 7.23 | 14.44 | 15.41 | (0.77 | ) | 22.45 | (n) | |||||||||||||
| Ratios (%) (to average net assets) and Supplemental data: | ||||||||||||||||||||
| Expenses before expense reductions (f)(h) | 0.44 | 0.51 | 0.93 | 5.50 | 6.00 | (a) | ||||||||||||||
Expenses after expense reductions (f)(h) | 0.00 | 0.00 | 0.00 | 0.00 | 0.00 | (a) | ||||||||||||||
Net investment income (l) | 1.28 | 1.22 | 1.51 | 1.19 | 1.58 | (a) | ||||||||||||||
Portfolio turnover | 9 | 9 | 14 | 69 | 4 | (n) | ||||||||||||||
Net assets at end of period (000 omitted) | $58,759 | $38,224 | $19,646 | $138 | $122 | |||||||||||||||
See Notes to Financial Statements
107
Table of Contents
Financial Highlights – continued
MFS LIFETIME 2050 FUND – continued
| (a) | Annualized. |
| (c) | For the period from the commencement of the fund’s investment operations, September 15, 2010, through the stated period end. |
| (d) | Per share data is based on average shares outstanding. |
| (f) | Ratios do not reflect reductions from fees paid indirectly, if applicable. |
| (h) | In addition to the fees and expenses which the fund bears directly, the fund indirectly bears a pro rata share of the fees and expenses of the underlying affiliated funds in which the fund invests. Accordingly, the expense ratio for the fund reflects only those fees and expenses borne directly by the fund. Because the underlying affiliated funds have varied expense and fee levels and the fund may own different proportions of the underlying affiliated funds at different times, the amount of fees and expenses incurred indirectly by the fund will vary. |
| (l) | Recognition of net investment income by the fund may be affected by the timing of the declaration of dividends by the underlying affiliated funds in which the fund invests. The ratios and per share amounts do not include net investment income of the underlying affiliated funds in which the fund invests. |
| (n) | Not annualized. |
| (r) | Certain expenses have been reduced without which performance would have been lower. |
| (s) | From time to time the fund may receive proceeds from litigation settlements, without which performance would be lower. |
| (t) | Total returns do not include any applicable sales charges. |
| (x) | The net asset values per share and total returns have been calculated on net assets which include adjustments made in accordance with U.S. generally accepted accounting principles required at period end for financial reporting purposes. |
See Notes to Financial Statements
108
Table of Contents
Financial Highlights – continued
MFS LIFETIME 2055 FUND
The financial highlights table is intended to help you understand the fund financial performance for the past 5 years (or life of a particular share class, if shorter). Certain information reflects financial results for a single fund share. The total returns in the table represent the rate by which an investor would have earned (or lost) on an investment in the fund share class (assuming reinvestment of all distributions) held for the entire period.
| Years ended 4/30 | Period ended 4/30/13 (c) | |||||||||||
| Class A | 2015 | 2014 | ||||||||||
Net asset value, beginning of period | $12.54 | $11.12 | $10.00 | |||||||||
| Income (loss) from investment operations | ||||||||||||
| Net investment income (d)(l) | $0.14 | $0.12 | $0.09 | |||||||||
Net realized and unrealized gain (loss) on investments | 0.72 | 1.45 | 1.14 | |||||||||
Total from investment operations | $0.86 | $1.57 | $1.23 | |||||||||
| Less distributions declared to shareholders | ||||||||||||
| From net investment income | $(0.18 | ) | $(0.13 | ) | $(0.11 | ) | ||||||
From net realized gain on investments | (0.06 | ) | (0.02 | ) | — | |||||||
Total distributions declared to shareholders | $(0.24 | ) | $(0.15 | ) | $(0.11 | ) | ||||||
Net asset value, end of period (x) | $13.16 | $12.54 | $11.12 | |||||||||
Total return (%) (r)(s)(t)(x) | 6.90 | 14.17 | 12.40 | (n) | ||||||||
| Ratios (%) (to average net assets) and Supplemental data: | ||||||||||||
| Expenses before expense reductions (f)(h) | 2.84 | 7.18 | 12.11 | (a) | ||||||||
Expenses after expense reductions (f)(h) | 0.25 | 0.25 | 0.25 | (a) | ||||||||
Net investment income (l) | 1.10 | 0.97 | 1.74 | (a) | ||||||||
Portfolio turnover | 18 | 20 | 3 | (n) | ||||||||
Net assets at end of period (000 omitted) | $1,036 | $428 | $143 | |||||||||
| Years ended 4/30 | Period ended 4/30/13 (c) | |||||||||||
| Class B | 2015 | 2014 | ||||||||||
Net asset value, beginning of period | $12.51 | $11.09 | $10.00 | |||||||||
| Income (loss) from investment operations | ||||||||||||
| Net investment income (d)(l) | $0.03 | $0.01 | $0.06 | |||||||||
Net realized and unrealized gain (loss) on investments | 0.73 | 1.46 | 1.13 | |||||||||
Total from investment operations | $0.76 | $1.47 | $1.19 | |||||||||
| Less distributions declared to shareholders | ||||||||||||
| From net investment income | $(0.09 | ) | $(0.03 | ) | $(0.10 | ) | ||||||
From net realized gain on investments | (0.06 | ) | (0.02 | ) | — | |||||||
Total distributions declared to shareholders | $(0.15 | ) | $(0.05 | ) | $(0.10 | ) | ||||||
Net asset value, end of period (x) | $13.12 | $12.51 | $11.09 | |||||||||
Total return (%) (r)(s)(t)(x) | 6.13 | 13.34 | 11.96 | (n) | ||||||||
| Ratios (%) (to average net assets) and Supplemental data: | ||||||||||||
| Expenses before expense reductions (f)(h) | 3.67 | 8.83 | 13.29 | (a) | ||||||||
Expenses after expense reductions (f)(h) | 1.00 | 1.00 | 1.00 | (a) | ||||||||
Net investment income (l) | 0.26 | 0.11 | 1.10 | (a) | ||||||||
Portfolio turnover | 18 | 20 | 3 | (n) | ||||||||
Net assets at end of period (000 omitted) | $244 | $148 | $112 | |||||||||
See Notes to Financial Statements
109
Table of Contents
Financial Highlights – continued
MFS LIFETIME 2055 FUND – continued
| Years ended 4/30 | Period ended 4/30/13 (c) | |||||||||||
| Class C | 2015 | 2014 | ||||||||||
Net asset value, beginning of period | $12.45 | $11.09 | $10.00 | |||||||||
| Income (loss) from investment operations | ||||||||||||
| Net investment income (d)(l) | $0.05 | $0.06 | $0.05 | |||||||||
Net realized and unrealized gain (loss) on investments | 0.71 | 1.41 | 1.14 | |||||||||
Total from investment operations | $0.76 | $1.47 | $1.19 | |||||||||
| Less distributions declared to shareholders | ||||||||||||
| From net investment income | $(0.11 | ) | $(0.09 | ) | $(0.10 | ) | ||||||
From net realized gain on investments | (0.06 | ) | (0.02 | ) | — | |||||||
Total distributions declared to shareholders | $(0.17 | ) | $(0.11 | ) | $(0.10 | ) | ||||||
Net asset value, end of period (x) | $13.04 | $12.45 | $11.09 | |||||||||
Total return (%) (r)(s)(t)(x) | 6.17 | 13.32 | 11.96 | (n) | ||||||||
| Ratios (%) (to average net assets) and Supplemental data: | ||||||||||||
| Expenses before expense reductions (f)(h) | 3.61 | 7.52 | 13.05 | (a) | ||||||||
Expenses after expense reductions (f)(h) | 1.00 | 1.00 | 1.00 | (a) | ||||||||
Net investment income (l) | 0.37 | 0.46 | 1.03 | (a) | ||||||||
Portfolio turnover | 18 | 20 | 3 | (n) | ||||||||
Net assets at end of period (000 omitted) | $1,031 | $494 | $129 | |||||||||
| Years ended 4/30 | Period ended 4/30/13 (c) | |||||||||||
| Class I | 2015 | 2014 | ||||||||||
Net asset value, beginning of period | $12.57 | $11.13 | $10.00 | |||||||||
| Income (loss) from investment operations | ||||||||||||
| Net investment income (d)(l) | $0.12 | $0.14 | $0.11 | |||||||||
Net realized and unrealized gain (loss) on investments | 0.77 | 1.47 | 1.13 | |||||||||
Total from investment operations | $0.89 | $1.61 | $1.24 | |||||||||
| Less distributions declared to shareholders | ||||||||||||
| From net investment income | $(0.20 | ) | $(0.15 | ) | $(0.11 | ) | ||||||
From net realized gain on investments | (0.06 | ) | (0.02 | ) | — | |||||||
Total distributions declared to shareholders | $(0.26 | ) | $(0.17 | ) | $(0.11 | ) | ||||||
Net asset value, end of period (x) | $13.20 | $12.57 | $11.13 | |||||||||
Total return (%) (r)(s)(x) | 7.14 | 14.50 | 12.55 | (n) | ||||||||
| Ratios (%) (to average net assets) and Supplemental data: | ||||||||||||
| Expenses before expense reductions (f)(h) | 2.80 | 6.45 | 12.29 | (a) | ||||||||
Expenses after expense reductions (f)(h) | 0.00 | 0.00 | 0.00 | (a) | ||||||||
Net investment income (l) | 0.95 | 1.13 | 2.10 | (a) | ||||||||
Portfolio turnover | 18 | 20 | 3 | (n) | ||||||||
Net assets at end of period (000 omitted) | $391 | $477 | $113 | |||||||||
See Notes to Financial Statements
110
Table of Contents
Financial Highlights – continued
MFS LIFETIME 2055 FUND – continued
| Years ended 4/30 | Period ended 4/30/13 (c) | |||||||||||
| Class R1 | 2015 | 2014 | ||||||||||
Net asset value, beginning of period | $12.51 | $11.09 | $10.00 | |||||||||
| Income (loss) from investment operations | ||||||||||||
| Net investment income (d)(l) | $0.03 | $0.02 | $0.06 | |||||||||
Net realized and unrealized gain (loss) on investments | 0.73 | 1.45 | 1.13 | |||||||||
Total from investment operations | $0.76 | $1.47 | $1.19 | |||||||||
| Less distributions declared to shareholders | ||||||||||||
| From net investment income | $(0.07 | ) | $(0.03 | ) | $(0.10 | ) | ||||||
From net realized gain on investments | (0.06 | ) | (0.02 | ) | — | |||||||
Total distributions declared to shareholders | $(0.13 | ) | $(0.05 | ) | $(0.10 | ) | ||||||
Net asset value, end of period (x) | $13.14 | $12.51 | $11.09 | |||||||||
Total return (%) (r)(s)(x) | 6.14 | 13.34 | 11.96 | (n) | ||||||||
| Ratios (%) (to average net assets) and Supplemental data: | ||||||||||||
| Expenses before expense reductions (f)(h) | 3.71 | 8.98 | 13.29 | (a) | ||||||||
Expenses after expense reductions (f)(h) | 1.00 | 1.00 | 1.00 | (a) | ||||||||
Net investment income (l) | 0.21 | 0.15 | 1.10 | (a) | ||||||||
Portfolio turnover | 18 | 20 | 3 | (n) | ||||||||
Net assets at end of period (000 omitted) | $141 | $127 | $112 | |||||||||
| Years ended 4/30 | Period ended 4/30/13 (c) | |||||||||||
| Class R2 | 2015 | 2014 | ||||||||||
Net asset value, beginning of period | $12.53 | $11.11 | $10.00 | |||||||||
| Income (loss) from investment operations | ||||||||||||
| Net investment income (d)(l) | $0.09 | $0.07 | $0.08 | |||||||||
Net realized and unrealized gain (loss) on investments | 0.73 | 1.47 | 1.13 | |||||||||
Total from investment operations | $0.82 | $1.54 | $1.21 | |||||||||
| Less distributions declared to shareholders | ||||||||||||
| From net investment income | $(0.15 | ) | $(0.10 | ) | $(0.10 | ) | ||||||
From net realized gain on investments | (0.06 | ) | (0.02 | ) | — | |||||||
Total distributions declared to shareholders | $(0.21 | ) | $(0.12 | ) | $(0.10 | ) | ||||||
Net asset value, end of period (x) | $13.14 | $12.53 | $11.11 | |||||||||
Total return (%) (r)(s)(x) | 6.63 | 13.88 | 12.25 | (n) | ||||||||
| Ratios (%) (to average net assets) and Supplemental data: | ||||||||||||
| Expenses before expense reductions (f)(h) | 3.11 | 7.83 | 12.78 | (a) | ||||||||
Expenses after expense reductions (f)(h) | 0.50 | 0.50 | 0.50 | (a) | ||||||||
Net investment income (l) | 0.73 | 0.60 | 1.60 | (a) | ||||||||
Portfolio turnover | 18 | 20 | 3 | (n) | ||||||||
Net assets at end of period (000 omitted) | $773 | $260 | $112 | |||||||||
See Notes to Financial Statements
111
Table of Contents
Financial Highlights – continued
MFS LIFETIME 2055 FUND – continued
| Years ended 4/30 | Period ended 4/30/13 (c) | |||||||||||
| Class R3 | 2015 | 2014 | ||||||||||
Net asset value, beginning of period | $12.54 | $11.12 | $10.00 | |||||||||
| Income (loss) from investment operations | ||||||||||||
| Net investment income (d)(l) | $0.11 | $0.12 | $0.07 | |||||||||
Net realized and unrealized gain (loss) on investments | 0.75 | 1.45 | 1.16 | |||||||||
Total from investment operations | $0.86 | $1.57 | $1.23 | |||||||||
| Less distributions declared to shareholders | ||||||||||||
| From net investment income | $(0.17 | ) | $(0.13 | ) | $(0.11 | ) | ||||||
From net realized gain on investments | (0.06 | ) | (0.02 | ) | — | |||||||
Total distributions declared to shareholders | $(0.23 | ) | $(0.15 | ) | $(0.11 | ) | ||||||
Net asset value, end of period (x) | $13.17 | $12.54 | $11.12 | |||||||||
Total return (%) (r)(s)(x) | 6.95 | 14.18 | 12.40 | (n) | ||||||||
| Ratios (%) (to average net assets) and Supplemental data: | ||||||||||||
| Expenses before expense reductions (f)(h) | 2.81 | 7.04 | 11.17 | (a) | ||||||||
Expenses after expense reductions (f)(h) | 0.25 | 0.25 | 0.25 | (a) | ||||||||
Net investment income (l) | 0.84 | 0.97 | 1.42 | (a) | ||||||||
Portfolio turnover | 18 | 20 | 3 | (n) | ||||||||
Net assets at end of period (000 omitted) | $2,353 | $894 | $239 | |||||||||
| Years ended 4/30 | Period ended 4/30/13 (c) | |||||||||||
| Class R4 | 2015 | 2014 | ||||||||||
Net asset value, beginning of period | $12.56 | $11.13 | $10.00 | |||||||||
| Income (loss) from investment operations | ||||||||||||
| Net investment income (d)(l) | $0.18 | $0.15 | $0.10 | |||||||||
Net realized and unrealized gain (loss) on investments | 0.72 | 1.45 | 1.14 | |||||||||
Total from investment operations | $0.90 | $1.60 | $1.24 | |||||||||
| Less distributions declared to shareholders | ||||||||||||
| From net investment income | $(0.20 | ) | $(0.15 | ) | $(0.11 | ) | ||||||
From net realized gain on investments | (0.06 | ) | (0.02 | ) | — | |||||||
Total distributions declared to shareholders | $(0.26 | ) | $(0.17 | ) | $(0.11 | ) | ||||||
Net asset value, end of period (x) | $13.20 | $12.56 | $11.13 | |||||||||
Total return (%) (r)(s)(x) | 7.23 | 14.41 | 12.55 | (n) | ||||||||
| Ratios (%) (to average net assets) and Supplemental data: | ||||||||||||
| Expenses before expense reductions (f)(h) | 2.51 | 5.94 | 11.79 | (a) | ||||||||
Expenses after expense reductions (f)(h) | 0.00 | 0.00 | 0.00 | (a) | ||||||||
Net investment income (l) | 1.42 | 1.24 | 1.98 | (a) | ||||||||
Portfolio turnover | 18 | 20 | 3 | (n) | ||||||||
Net assets at end of period (000 omitted) | $5,056 | $1,560 | $147 | |||||||||
See Notes to Financial Statements
112
Table of Contents
Financial Highlights – continued
MFS LIFETIME 2055 FUND – continued
| (a) | Annualized. |
| (c) | For the period from the commencement of the fund’s investment operations, November 2, 2012, through the stated period end. |
| (d) | Per share data is based on average shares outstanding. |
| (f) | Ratios do not reflect reductions from fees paid indirectly, if applicable. |
| (h) | In addition to the fees and expenses which the fund bears directly, the fund indirectly bears a pro rata share of the fees and expenses of the underlying affiliated funds in which the fund invests. Accordingly, the expense ratio for the fund reflects only those fees and expenses borne directly by the fund. Because the underlying affiliated funds have varied expense and fee levels and the fund may own different proportions of the underlying affiliated funds at different times, the amount of fees and expenses incurred indirectly by the fund will vary. |
| (l) | Recognition of net investment income by the fund may be affected by the timing of the declaration of dividends by the underlying affiliated funds in which the fund invests. The ratios and per share amounts do not include net investment income of the underlying affiliated funds in which the fund invests. |
| (n) | Not annualized. |
| (r) | Certain expenses have been reduced without which performance would have been lower. |
| (s) | From time to time the fund may receive proceeds from litigation settlements, without which performance would be lower. |
| (t) | Total returns do not include any applicable sales charges. |
| (x) | The net asset values per share and total returns have been calculated on net assets which include adjustments made in accordance with U.S. generally accepted accounting principles required at period end for financial reporting purposes. |
See Notes to Financial Statements
113
Table of Contents
| (1) | Business and Organization |
MFS Lifetime Income Fund (formerly MFS Lifetime Retirement Income Fund), MFS Lifetime 2015 Fund, MFS Lifetime 2020 Fund, MFS Lifetime 2025 Fund, MFS Lifetime 2030 Fund, MFS Lifetime 2035 Fund, MFS Lifetime 2040 Fund, MFS Lifetime 2045 Fund, MFS Lifetime 2050 Fund, and MFS Lifetime 2055 Fund (the funds) are each a diversified series of MFS Series Trust XII (the trust). The trust is organized as a Massachusetts business trust and is registered under the Investment Company Act of 1940, as amended, as an open-end management investment company.
The funds are each investment companies and accordingly follow the investment company accounting and reporting guidance of the Financial Accounting Standards Board (FASB) Accounting Standards Codification Topic 946 Financial Services – Investment Companies.
| (2) | Significant Accounting Policies |
General – The preparation of financial statements in conformity with U.S. generally accepted accounting principles requires management to make estimates and assumptions that affect the reported amounts of assets and liabilities, and disclosure of contingent assets and liabilities at the date of the financial statements and the reported amounts of increases and decreases in net assets from operations during the reporting period. Actual results could differ from those estimates. In the preparation of these financial statements, management has evaluated subsequent events occurring after the date of the funds’ Statements of Assets and Liabilities through the date that the financial statements were issued.
Each fund is a “fund-of-funds”, which invests the majority of its assets in other MFS mutual funds (hereafter referred to as “underlying affiliated funds” or “underlying funds”), which may have different fiscal year ends than the funds. The underlying funds, in turn, may engage in a number of investment techniques and practices, which involve certain risks. Certain underlying funds invest their portfolio in high-yield securities rated below investment grade. Investments in high-yield securities involve greater degrees of credit and market risk than investments in higher-rated securities and tend to be more sensitive to economic conditions. Certain underlying funds invest a significant portion of their assets in asset-backed and/or mortgage-backed securities. The value of these securities may depend, in part, on the issuer’s or borrower’s credit quality or ability to pay principal and interest when due and may fall if an issuer or borrower defaults on its obligation to pay principal or interest or if the instrument’s credit rating is downgraded by a credit rating agency. U.S. Government securities not supported as to the payment of principal or interest by the U.S. Treasury, such as those issued by Fannie Mae, Freddie Mac, and the Federal Home Loan Banks, are subject to greater credit risk than are U.S. Government securities supported by the U.S. Treasury, such as those issued by Ginnie Mae. Certain underlying funds invest in commodity-linked structured notes as part of their principal investment strategy. These structured notes are subject to prepayment, basis and counterparty risks. Certain underlying funds invest in foreign securities, including securities of emerging market issuers. Investments in foreign securities are vulnerable to the effects of changes in the relative values of the local currency and the U.S. dollar and to the effects of changes in each country’s legal, political, and economic environment. The markets of emerging markets countries are generally more volatile than the markets of developed countries with more mature economies. All of the risks of investing in foreign securities previously described are heightened when investing in emerging markets countries.
The accounting policies of the underlying funds in which each fund invests are outlined in the underlying funds’ shareholder reports, which are available without charge by calling 1-800-225-2606, at mfs.com and on the Securities and Exchange Commission (SEC) web site at http://www.sec.gov or at the SEC’s public reference room in Washington, D.C. The underlying funds’ shareholder reports are not covered by this report.
In June 2014, FASB issued Accounting Standards Update 2014-11, Transfers and Servicing (Topic 860) – Repurchase-to-Maturity Transactions, Repurchase Financings, and Disclosures (“ASU 2014-11”). ASU 2014-11 changes the accounting for repurchase-to-maturity transactions (i.e., repurchase agreements that settle at the same time as the maturity of the transferred financial asset) and enhances the required disclosures for repurchase agreements and other similar transactions. Although still evaluating the potential impacts of ASU 2014-11 to the funds, management expects that the impact of each fund’s adoption will be limited to additional financial statement disclosures which would first be effective for interim reporting periods beginning after March 15, 2015.
Investment Valuations – Open-end investment companies (underlying funds) are generally valued at their net asset value per share. The investments of underlying funds managed by the adviser are valued as described below. For purposes of this policy disclosure, “fund” also refers to the underlying funds in which the fund-of-funds invests.
Equity securities, including restricted equity securities, are generally valued at the last sale or official closing price as provided by a third-party pricing service on the market or exchange on which they are primarily traded. Equity securities, for which there were no sales reported that day, are generally valued at the last quoted daily bid quotation as provided by a third-party pricing service on the market or exchange on which such securities are primarily traded. Equity securities held short, for which there were no sales reported for that day, are generally valued at the last quoted daily ask quotation as provided by a third-party pricing service on the market or exchange on which such securities are primarily traded. Debt instruments and floating rate loans, including restricted debt instruments, are generally valued at an evaluated or composite bid as provided by a third-party pricing service. Short-term
114
Table of Contents
Notes to Financial Statements – continued
instruments with a maturity at issuance of 60 days or less may be valued at amortized cost, which approximates market value. Exchange-traded options are generally valued at the last sale or official closing price as provided by a third-party pricing service on the exchange on which such options are primarily traded. Exchange-traded options for which there were no sales reported that day are generally valued at the last daily bid quotation as provided by a third-party pricing service on the exchange on which such options are primarily traded. Options not traded on an exchange are generally valued at a broker/dealer bid quotation. Foreign currency options are generally valued at valuations provided by a third-party pricing service. Futures contracts are generally valued at last posted settlement price as provided by a third-party pricing service on the market on which they are primarily traded. Futures contracts for which there were no trades that day for a particular position are generally valued at the closing bid quotation as provided by a third-party pricing service on the market on which such futures contracts are primarily traded. Forward foreign currency exchange contracts are generally valued at the mean of bid and asked prices for the time period interpolated from rates provided by a third-party pricing service for proximate time periods. Swap agreements are generally valued at valuations provided by a third-party pricing service, which for cleared swaps includes an evaluation of any trading activity at the clearinghouses. Open-end investment companies are generally valued at net asset value per share. Securities and other assets, including commodity-linked structured notes, generally valued on the basis of information from a third-party pricing service may also be valued at a broker/dealer bid quotation. Values obtained from third-party pricing services can utilize both transaction data and market information such as yield, quality, coupon rate, maturity, type of issue, trading characteristics, and other market data. The values of foreign securities and other assets and liabilities expressed in foreign currencies are converted to U.S. dollars using the mean of bid and asked prices for rates provided by a third-party pricing service.
The Board of Trustees has delegated primary responsibility for determining or causing to be determined the value of the fund’s investments (including any fair valuation) to the adviser pursuant to valuation policies and procedures approved by the Board. If the adviser determines that reliable market quotations are not readily available, investments are valued at fair value as determined in good faith by the adviser in accordance with such procedures under the oversight of the Board of Trustees. Under the fund’s valuation policies and procedures, market quotations are not considered to be readily available for most types of debt instruments and floating rate loans and many types of derivatives. These investments are generally valued at fair value based on information from third-party pricing services. In addition, investments may be valued at fair value if the adviser determines that an investment’s value has been materially affected by events occurring after the close of the exchange or market on which the investment is principally traded (such as foreign exchange or market) and prior to the determination of the fund’s net asset value, or after the halting of trading of a specific security where trading does not resume prior to the close of the exchange or market on which the security is principally traded. Events that occur on a frequent basis after foreign markets close (such as developments in foreign markets and significant movements in the U.S. markets) and prior to the determination of the fund’s net asset value may be deemed to have a material effect on the value of securities traded in foreign markets. Accordingly, the fund’s foreign equity securities may often be valued at fair value. The adviser generally relies on third-party pricing services or other information (such as the correlation with price movements of similar securities in the same or other markets; the type, cost and investment characteristics of the security; the business and financial condition of the issuer; and trading and other market data) to assist in determining whether to fair value and at what value to fair value an investment. The value of an investment for purposes of calculating the fund’s net asset value can differ depending on the source and method used to determine value. When fair valuation is used, the value of an investment used to determine the fund’s net asset value may differ from quoted or published prices for the same investment. There can be no assurance that the fund could obtain the fair value assigned to an investment if it were to sell the investment at the same time at which the fund determines its net asset value per share.
Various inputs are used in determining the value of each fund’s assets or liabilities. These inputs are categorized into three broad levels. In certain cases, the inputs used to measure fair value may fall into different levels of the fair value hierarchy. In such cases, an investment’s level within the fair value hierarchy is based on the lowest level of input that is significant to the fair value measurement. Each fund’s assessment of the significance of a particular input to the fair value measurement in its entirety requires judgment, and considers factors specific to the investment. Level 1 includes unadjusted quoted prices in active markets for identical assets or liabilities. Level 2 includes other significant observable market-based inputs (including quoted prices for similar securities, interest rates, prepayment speed, and credit risk). Level 3 includes unobservable inputs, which may include the adviser’s own assumptions in determining the fair value of investments.
115
Table of Contents
Notes to Financial Statements – continued
The following is a summary of the levels used as of April 30, 2015 in valuing each fund’s assets or liabilities:
| Level 1 | Level 2 | Level 3 | Total | |||||||||||||
MFS Lifetime Income Fund | ||||||||||||||||
| Investments at Value | ||||||||||||||||
| Mutual Funds | $549,334,089 | $— | $— | $549,334,089 | ||||||||||||
MFS Lifetime 2015 Fund | ||||||||||||||||
| Investments at Value | ||||||||||||||||
| Mutual Funds | $51,966,017 | $— | $— | $51,966,017 | ||||||||||||
MFS Lifetime 2020 Fund | ||||||||||||||||
| Investments at Value | ||||||||||||||||
| Mutual Funds | $363,575,406 | $— | $— | $363,575,406 | ||||||||||||
MFS Lifetime 2025 Fund | ||||||||||||||||
| Investments at Value | ||||||||||||||||
| Mutual Funds | $129,469,214 | $— | $— | $129,469,214 | ||||||||||||
MFS Lifetime 2030 Fund | ||||||||||||||||
| Investments at Value | ||||||||||||||||
| Mutual Funds | $407,745,367 | $— | $— | $407,745,367 | ||||||||||||
MFS Lifetime 2035 Fund | ||||||||||||||||
| Investments at Value | ||||||||||||||||
| Mutual Funds | $106,216,846 | $— | $— | $106,216,846 | ||||||||||||
MFS Lifetime 2040 Fund | ||||||||||||||||
| Investments at Value | ||||||||||||||||
| Mutual Funds | $310,303,763 | $— | $— | $310,303,763 | ||||||||||||
MFS Lifetime 2045 Fund | ||||||||||||||||
| Investments at Value | ||||||||||||||||
| Mutual Funds | $62,062,724 | $— | $— | $62,062,724 | ||||||||||||
MFS Lifetime 2050 Fund | ||||||||||||||||
| Investments at Value | ||||||||||||||||
| Mutual Funds | $90,986,199 | $— | $— | $90,986,199 | ||||||||||||
MFS Lifetime 2055 Fund | ||||||||||||||||
| Investments at Value | ||||||||||||||||
| Mutual Funds | $11,040,127 | $— | $— | $11,040,127 | ||||||||||||
For further information regarding security characteristics, see the Portfolio of Investments. Please refer to the underlying funds’ shareholder reports for further information regarding the levels used in valuing the underlying funds’ assets or liabilities.
Derivatives – Each fund does not invest in derivatives directly. Each fund does invest in underlying funds that may use derivatives for different purposes, primarily to increase or decrease exposure to a particular market or segment of the market, or security, to increase or decrease interest rate or currency exposure, or as alternatives to direct investments. Derivatives are used for hedging or non-hedging purposes. While hedging can reduce or eliminate losses, it can also reduce or eliminate gains. When the underlying funds use derivatives as an investment to increase market exposure, or for hedging purposes, gains and losses from derivative instruments may be substantially greater than the derivative’s original cost.
Indemnifications – Under each fund’s organizational documents, its officers and Trustees may be indemnified against certain liabilities and expenses arising out of the performance of their duties to the fund. Additionally, in the normal course of business, each fund enters into agreements with service providers that may contain indemnification clauses. Each fund’s maximum exposure under these agreements is unknown as this would involve future claims that may be made against the funds that have not yet occurred.
Investment Transactions and Income – Investment transactions are recorded on the trade date. Interest income is recorded on an accrual basis. All premium and discount is amortized or accreted for financial statement purposes in accordance with U.S. generally accepted accounting principles. Distributions of income and capital gains from the underlying funds are recorded on the ex-dividend
116
Table of Contents
Notes to Financial Statements – continued
date. Recognition of net investment income by each fund is affected by the timing of the declaration of distributions by the underlying funds in which each fund invests. In determining the net gain or loss on securities sold, the cost of securities is determined on the identified cost basis.
Each fund and/or the underlying funds may receive proceeds from litigation settlements. Any proceeds received from litigation involving portfolio holdings are reflected in the Statements of Operations in realized gain/loss if the security has been disposed of by the fund or in unrealized gain/loss if the security is still held by the fund. Any other proceeds from litigation not related to portfolio holdings are reflected as other income in the Statements of Operations.
Fees Paid Indirectly – Each fund’s custody fee may be reduced according to an arrangement that measures the value of U.S. dollars deposited with the custodian by each fund. This amount, for the year ended April 30, 2015, is shown as a reduction of total expenses in the Statements of Operations. In the case of the MFS Lifetime 2020 Fund, custody fees were not reduced.
Tax Matters and Distributions – Each fund intends to qualify as a regulated investment company, as defined under Subchapter M of the Internal Revenue Code, and to distribute all of its taxable income, including realized capital gains. As a result, no provision for federal income tax is required. Each fund’s federal tax returns, when filed, will remain subject to examination by the Internal Revenue Service for a three year period. Management has analyzed each fund’s tax positions taken on federal and state tax returns for all open tax years and does not believe that there are any uncertain tax positions that require recognition of a tax liability.
Distributions to shareholders are recorded on the ex-dividend date. Income and capital gain distributions are determined in accordance with income tax regulations, which may differ from U.S. generally accepted accounting principles. Certain capital accounts in the financial statements are periodically adjusted for permanent differences in order to reflect their tax character. These adjustments have no impact on net assets or net asset value per share. Temporary differences which arise from recognizing certain items of income, expense, gain or loss in different periods for financial statement and tax purposes will reverse at some time in the future. Distributions in excess of net investment income or net realized gains are temporary overdistributions for financial statement purposes resulting from differences in the recognition or classification of income or distributions for financial statement and tax purposes.
Book/tax differences primarily relate to wash sale loss deferrals and treating a portion of the proceeds from redemptions as a distribution for tax purposes.
The tax character of distributions declared to shareholders for the last two fiscal years is as follows:
| Year ended 4/30/15 | MFS Lifetime Income Fund | MFS Lifetime 2015 Fund | MFS Lifetime 2020 Fund | MFS Lifetime 2025 Fund | MFS Lifetime 2030 Fund | |||||||||||||||
| Ordinary income (including any short-term capital gains) | $8,137,930 | $1,087,089 | $6,966,115 | $2,079,078 | $5,947,098 | |||||||||||||||
| Long-term capital gains | 2,081,037 | 160,005 | — | 652,036 | — | |||||||||||||||
| Total distributions | $10,218,967 | $1,247,094 | $6,966,115 | $2,731,114 | $5,947,098 | |||||||||||||||
| Year ended 4/30/15 | MFS Lifetime 2035 Fund | MFS Lifetime 2040 Fund | MFS Lifetime 2045 Fund | MFS Lifetime 2050 Fund | MFS Lifetime 2055 Fund | |||||||||||||||
| Ordinary income (including any short-term capital gains) | $1,388,333 | $4,165,075 | $737,229 | $1,131,032 | $104,304 | |||||||||||||||
| Long-term capital gains | 622,126 | 452,003 | 329,974 | 524,041 | 35,005 | |||||||||||||||
| Total distributions | $2,010,459 | $4,617,078 | $1,067,203 | $1,655,073 | $139,309 | |||||||||||||||
| Year ended 4/30/14 | MFS Lifetime Income Fund | MFS Lifetime 2015 Fund | MFS Lifetime 2020 Fund | MFS Lifetime 2025 Fund | MFS Lifetime 2030 Fund | |||||||||||||||
| Ordinary income (including any short-term capital gains) | $5,938,764 | $772,271 | $5,530,035 | $1,210,081 | $4,250,110 | |||||||||||||||
| Long-term capital gains | 228,235 | — | — | 615 | — | |||||||||||||||
| Total distributions | $6,166,999 | $772,271 | $5,530,035 | $1,210,696 | $4,250,110 | |||||||||||||||
| Year ended 4/30/14 | MFS Lifetime 2035 Fund | MFS Lifetime 2040 Fund | MFS Lifetime 2045 Fund | MFS Lifetime 2050 Fund | MFS Lifetime 2055 Fund | |||||||||||||||
| Ordinary income (including any short-term capital gains) | $731,047 | $2,760,025 | $360,031 | $610,024 | $33,001 | |||||||||||||||
| Long-term capital gains | 7,533 | — | 5,018 | — | 3,002 | |||||||||||||||
| Total distributions | $738,580 | $2,760,025 | $365,049 | $610,024 | $36,003 | |||||||||||||||
117
Table of Contents
Notes to Financial Statements – continued
The federal tax cost and the tax basis components of distributable earnings were as follows:
| As of 4/30/15 | MFS Lifetime Income Fund | MFS Lifetime 2015 Fund | MFS Lifetime 2020 Fund | MFS Lifetime 2025 Fund | MFS Lifetime 2030 Fund | |||||||||||||||
| Cost of investments | $510,605,686 | $50,236,893 | $316,830,970 | $121,416,805 | $338,152,032 | |||||||||||||||
| Gross appreciation | $43,219,673 | $2,239,398 | $50,164,888 | $9,357,800 | $73,779,145 | |||||||||||||||
| Gross depreciation | (4,491,270 | ) | (510,274 | ) | (3,420,452 | ) | (1,305,391 | ) | (4,185,810 | ) | ||||||||||
| Net unrealized appreciation (depreciation) | $38,728,403 | $1,729,124 | $46,744,436 | $8,052,409 | $69,593,335 | |||||||||||||||
| Undistributed ordinary income | 740,849 | 332,469 | 1,564,521 | 525,742 | 831,354 | |||||||||||||||
| Undistributed long-term capital gain | 3,564,662 | 385,127 | 5,055,407 | 1,897,271 | 6,204,951 | |||||||||||||||
| Other temporary differences | (377,475 | ) | — | — | — | — | ||||||||||||||
| As of 4/30/15 | MFS Lifetime 2035 Fund | MFS Lifetime 2040 Fund | MFS Lifetime 2045 Fund | MFS Lifetime 2050 Fund | MFS Lifetime 2055 Fund | |||||||||||||||
| Cost of investments | $98,440,920 | $251,663,164 | $57,597,642 | $81,622,358 | $10,482,762 | |||||||||||||||
| Gross appreciation | $8,616,345 | $61,790,033 | $4,912,503 | $10,128,358 | $617,370 | |||||||||||||||
| Gross depreciation | (840,419 | ) | (3,149,434 | ) | (447,421 | ) | (764,517 | ) | (60,005 | ) | ||||||||||
| Net unrealized appreciation (depreciation) | $7,775,926 | $58,640,599 | $4,465,082 | $9,363,841 | $557,365 | |||||||||||||||
| Undistributed ordinary income | 179,859 | 430,471 | 64,128 | 93,685 | 7,180 | |||||||||||||||
| Undistributed long-term capital gain | 1,955,110 | 6,230,348 | 1,119,215 | 1,624,262 | 171,015 | |||||||||||||||
Multiple Classes of Shares of Beneficial Interest – Each fund offers multiple classes of shares, which differ in their respective distribution, service, and program manager fees. For the MFS Lifetime Income Fund, income and common expenses are allocated to shareholders based on the value of settled shares outstanding of each class. For the MFS Lifetime Income Fund, realized and unrealized gain (loss) are allocated to shareholders based on the daily net assets of each class. For all other funds, income, realized and unrealized gain (loss), and common expenses are allocated to shareholders based on the daily net assets of each class. Dividends are declared separately for each class. Differences in per share dividend rates are generally due to differences in separate class expenses. Class B and Class 529B shares will convert to Class A and Class 529A shares, respectively, approximately eight years after purchase. Each fund’s distributions declared to shareholders as reported in the Statements of Changes in Net Assets are presented by class as follows:
From net investment income
MFS Lifetime Income Fund (i) | MFS Lifetime 2015 Fund | MFS Lifetime 2020 Fund | ||||||||||
Year ended 4/30/15 | Year ended 4/30/14 | Year ended 4/30/15 | Year ended 4/30/14 | Year ended | Year ended | |||||||
| Class A | $2,412,221 | $2,299,335 | $30,245 | $19,501 | $924,820 | $922,617 | ||||||
| Class B | 227,337 | 249,613 | 2,409 | 1,218 | 84,318 | 67,385 | ||||||
| Class C | 1,655,515 | 1,426,457 | 12,678 | 4,352 | 241,849 | 173,751 | ||||||
| Class I | 513,721 | 557,623 | 2,866 | 1,950 | 66,327 | 49,840 | ||||||
| Class R1 | 64,340 | 30,794 | 1,170 | 908 | 84,868 | 71,136 | ||||||
| Class R2 | 439,732 | 154,292 | 28,052 | 15,076 | 1,199,856 | 999,424 | ||||||
| Class R3 | 426,329 | 296,324 | 74,854 | 54,766 | 936,870 | 719,161 | ||||||
| Class R4 | 1,416,269 | 668,308 | 835,771 | 612,328 | 3,427,207 | 2,526,721 | ||||||
| Class 529A | 164,601 | — | — | — | — | — | ||||||
| Class 529B | 4,445 | — | — | — | — | — | ||||||
| Class 529C | 29,256 | — | — | — | — | — | ||||||
| Total | $7,353,766 | $5,682,746 | $988,045 | $710,099 | $6,966,115 | $5,530,035 | ||||||
| (i) | For Class 529A, Class 529B, and Class 529C, the period is from inception, January 8, 2015, through the stated period end. |
MFS Lifetime 2025 Fund | MFS Lifetime 2030 Fund | MFS Lifetime 2035 Fund | ||||||||||
Year ended | Year ended | Year ended | Year ended | Year ended | Year ended | |||||||
| Class A | $124,588 | $55,556 | $701,716 | $480,700 | $72,769 | $45,913 | ||||||
| Class B | 10,870 | 5,900 | 71,672 | 56,331 | 4,966 | 2,413 | ||||||
| Class C | 20,589 | 12,449 | 139,387 | 100,775 | 14,088 | 7,556 | ||||||
| Class I | 22,882 | 5,763 | 205,034 | 116,553 | 41,891 | 15,942 | ||||||
| Class R1 | 1,072 | 794 | 87,895 | 78,911 | 1,042 | 593 | ||||||
| Class R2 | 54,146 | 12,892 | 1,026,549 | 829,877 | 39,828 | 26,535 | ||||||
| Class R3 | 165,381 | 119,838 | 1,040,209 | 760,147 | 134,120 | 62,307 | ||||||
| Class R4 | 1,606,527 | 916,864 | 2,674,636 | 1,826,816 | 1,056,301 | 548,775 | ||||||
| Total | $2,006,055 | $1,130,056 | $5,947,098 | $4,250,110 | $1,365,005 | $710,034 | ||||||
118
Table of Contents
Notes to Financial Statements – continued
MFS Lifetime 2040 Fund | MFS Lifetime 2045 Fund | MFS Lifetime 2050 Fund | ||||||||||
Year ended | Year ended | Year ended | Year ended | Year ended | Year ended | |||||||
| Class A | $405,665 | $283,925 | $29,583 | $11,868 | $85,379 | $45,519 | ||||||
| Class B | 29,053 | 21,341 | 2,308 | 1,828 | 4,764 | 2,738 | ||||||
| Class C | 84,465 | 59,770 | 5,476 | 1,718 | 12,842 | 5,565 | ||||||
| Class I | 154,682 | 105,159 | 12,052 | 2,309 | 17,666 | 10,416 | ||||||
| Class R1 | 41,128 | 47,452 | 814 | 547 | 8,739 | 2,481 | ||||||
| Class R2 | 701,657 | 516,353 | 17,244 | 5,187 | 131,215 | 51,316 | ||||||
| Class R3 | 498,955 | 323,525 | 70,992 | 31,972 | 89,322 | 46,435 | ||||||
| Class R4 | 2,124,414 | 1,402,500 | 585,458 | 289,590 | 774,081 | 445,554 | ||||||
| Total | $4,040,019 | $2,760,025 | $723,927 | $345,019 | $1,124,008 | $610,024 | ||||||
MFS Lifetime 2055 Fund | ||||||||||||
Year ended 4/30/15 | Year ended 4/30/14 | |||||||||||
| Class A | $11,126 | $3,293 | ||||||||||
| Class B | 1,455 | 351 | ||||||||||
| Class C | 7,428 | 2,813 | ||||||||||
| Class I | 4,699 | 2,613 | ||||||||||
| Class R1 | 750 | 345 | ||||||||||
| Class R2 | 6,408 | 1,129 | ||||||||||
| Class R3 | 18,506 | 6,682 | ||||||||||
| Class R4 | 52,628 | 12,773 | ||||||||||
| Total | $103,000 | $29,999 | ||||||||||
From net realized gain on investments
MFS Lifetime Income Fund | MFS Lifetime 2015 Fund | MFS Lifetime 2025 Fund | ||||||||||
Year ended | Year ended | Year ended | Year ended | Year ended | Year ended | |||||||
| Class A | $831,447 | $163,914 | $8,636 | $1,782 | $47,572 | $4,139 | ||||||
| Class B | 128,697 | 28,977 | 970 | 208 | 6,623 | 686 | ||||||
| Class C | 959,062 | 170,424 | 4,700 | 543 | 12,381 | 1,096 | ||||||
| Class I | 144,985 | 38,261 | 729 | 168 | 7,956 | 402 | ||||||
| Class R1 | 37,474 | 3,581 | 576 | 168 | 793 | 132 | ||||||
| Class R2 | 187,251 | 13,047 | 9,152 | 1,492 | 25,137 | 1,063 | ||||||
| Class R3 | 147,505 | 21,614 | 21,556 | 5,140 | 66,041 | 9,121 | ||||||
| Class R4 | 428,780 | 44,435 | 212,730 | 52,671 | 558,556 | 64,001 | ||||||
| Total | $2,865,201 | $484,253 | $259,049 | $62,172 | $725,059 | $80,640 | ||||||
MFS Lifetime 2035 Fund | MFS Lifetime 2040 Fund | MFS Lifetime 2045 Fund | ||||||||||
Year ended | Year ended | Year ended | Year ended | Year ended | Year ended | |||||||
| Class A | $37,349 | $1,940 | $57,868 | $— | $15,208 | $717 | ||||||
| Class B | 4,304 | 178 | 8,735 | — | 2,531 | 210 | ||||||
| Class C | 11,231 | 382 | 23,649 | — | 4,540 | 220 | ||||||
| Class I | 18,967 | 622 | 19,027 | — | 5,494 | 130 | ||||||
| Class R1 | 1,053 | 67 | 14,145 | — | 954 | 95 | ||||||
| Class R2 | 24,751 | 1,228 | 121,019 | — | 10,457 | 370 | ||||||
| Class R3 | 69,536 | 2,712 | 71,303 | — | 37,204 | 2,022 | ||||||
| Class R4 | 478,263 | 21,417 | 261,313 | — | 266,888 | 16,266 | ||||||
| Total | $645,454 | $28,546 | $577,059 | $— | $343,276 | $20,030 | ||||||
119
Table of Contents
Notes to Financial Statements – continued
MFS Lifetime 2050 Fund | MFS Lifetime 2055 Fund | |||||||||||
Year ended | Year ended 4/30/14 | Year ended 4/30/15 | Year ended 4/30/14 | |||||||||
| Class A | $42,921 | $— | $3,838 | $626 | ||||||||
| Class B | 4,978 | — | 978 | 249 | ||||||||
| Class C | 10,835 | — | 4,074 | 756 | ||||||||
| Class I | 7,714 | — | 1,452 | 436 | ||||||||
| Class R1 | 6,737 | — | 627 | 248 | ||||||||
| Class R2 | 74,673 | — | 2,557 | 288 | ||||||||
| Class R3 | 45,193 | — | 6,524 | 1,267 | ||||||||
| Class R4 | 338,014 | — | 16,259 | 2,134 | ||||||||
| Total | $531,065 | $— | $36,309 | $6,004 | ||||||||
| (3) | Transactions with Affiliates |
Investment Adviser – Each fund has an investment advisory agreement with MFS to provide overall investment management and related administrative services and facilities to the funds. MFS receives no compensation under this agreement; however MFS receives management fees from the underlying MFS funds.
The investment adviser has agreed in writing to pay all of each fund’s operating expenses, excluding distribution and service fees, program manager fees, interest, taxes, extraordinary expenses, brokerage and transaction costs and investment-related expenses including fees and expenses associated with investments in investment companies and other similar investment vehicles. This written agreement will continue until modified by the funds’ Board of Trustees, but such agreement will continue at least until August 31, 2015. After August 31, 2015, MFS, under certain conditions, may increase such expense limitation to 0.10% annually of each fund’s average daily net assets for each class of shares without a vote of the funds’ Board of Trustees. Any increase above 0.10% would require a vote of the funds’ Board of Trustees. For the year ended April 30, 2015, this reduction amounted to the following for each fund and is included in the reduction of total expenses in the Statements of Operations:
| MFS Lifetime Income Fund | MFS Lifetime 2015 Fund | MFS Lifetime 2020 Fund | MFS Lifetime 2025 Fund | MFS Lifetime 2030 Fund | ||||
| $674,413 | $196,297 | $602,429 | $240,394 | $713,205 | ||||
| MFS Lifetime 2035 Fund | MFS Lifetime 2040 Fund | MFS Lifetime 2045 Fund | MFS Lifetime 2050 Fund | MFS Lifetime 2055 Fund | ||||
| $235,360 | $642,573 | $209,970 | $320,324 | $182,772 | ||||
In addition to the fees and expenses which each fund bears directly, each fund indirectly bears a pro rata share of the fees and expenses of the underlying funds in which each fund invests. Accordingly, the expense ratio for each fund reflects only those fees and expenses borne directly by each fund.
Distributor – MFS Fund Distributors, Inc. (MFD), a wholly-owned subsidiary of MFS, as distributor, received the following amounts for the year ended April 30, 2015, as its portion of the initial sales charge on sales of Class A and Class 529A shares of each fund:
| Class A | Class 529A | |||||||
| MFS Lifetime Income Fund | $114,387 | $4,611 | ||||||
| MFS Lifetime 2015 Fund | 1,455 | — | ||||||
| MFS Lifetime 2020 Fund | 27,929 | — | ||||||
| MFS Lifetime 2025 Fund | 15,050 | — | ||||||
| MFS Lifetime 2030 Fund | 30,317 | — | ||||||
| MFS Lifetime 2035 Fund | 12,080 | — | ||||||
| MFS Lifetime 2040 Fund | 20,173 | — | ||||||
| MFS Lifetime 2045 Fund | 7,749 | — | ||||||
| MFS Lifetime 2050 Fund | 7,803 | — | ||||||
| MFS Lifetime 2055 Fund | 3,135 | — | ||||||
The Board of Trustees has adopted a distribution plan for certain share classes pursuant to Rule 12b-1 of the Investment Company Act of 1940.
Each fund’s distribution plan provides that the funds will pay MFD for services provided by MFD and financial intermediaries in connection with the distribution and servicing of certain share classes. One component of the plan is a distribution fee paid to MFD and another component of the plan is a service fee paid to MFD. MFD may subsequently pay all, or a portion, of the distribution and/or service fees to financial intermediaries.
120
Table of Contents
Notes to Financial Statements – continued
Distribution Plan Fee Table:
| Class A | ||||||||||||||||||||
Distribution Fee Rate (d) | Service Fee Rate (d) | Total Plan (d) | Annual Effective Rate (e) | Distribution and Service Fee | ||||||||||||||||
| MFS Lifetime Income Fund | — | 0.25% | 0.25% | 0.25% | $326,791 | |||||||||||||||
| MFS Lifetime 2015 Fund | — | 0.25% | 0.25% | 0.25% | 4,032 | |||||||||||||||
| MFS Lifetime 2020 Fund | — | 0.25% | 0.25% | 0.25% | 133,713 | |||||||||||||||
| MFS Lifetime 2025 Fund | — | 0.25% | 0.25% | 0.23% | 16,623 | |||||||||||||||
| MFS Lifetime 2030 Fund | — | 0.25% | 0.25% | 0.24% | 107,904 | |||||||||||||||
| MFS Lifetime 2035 Fund | — | 0.25% | 0.25% | 0.24% | 11,728 | |||||||||||||||
| MFS Lifetime 2040 Fund | — | 0.25% | 0.25% | 0.25% | 70,931 | |||||||||||||||
| MFS Lifetime 2045 Fund | — | 0.25% | 0.25% | 0.24% | 5,073 | |||||||||||||||
| MFS Lifetime 2050 Fund | — | 0.25% | 0.25% | 0.25% | 14,949 | |||||||||||||||
| MFS Lifetime 2055 Fund | — | 0.25% | 0.25% | 0.25% | 1,763 | |||||||||||||||
| Class B | ||||||||||||||||||||
| Distribution Fee Rate (d) | Service Fee Rate (d) | Total Distribution Plan (d) | Annual Effective Rate (e) | Distribution Fee | ||||||||||||||||
| MFS Lifetime Income Fund | 0.75% | 0.25% | 1.00% | 1.00% | $209,284 | |||||||||||||||
| MFS Lifetime 2015 Fund | 0.75% | 0.25% | 1.00% | 1.00% | 1,578 | |||||||||||||||
| MFS Lifetime 2020 Fund | 0.75% | 0.25% | 1.00% | 1.00% | 68,660 | |||||||||||||||
| MFS Lifetime 2025 Fund | 0.75% | 0.25% | 1.00% | 1.00% | 9,344 | |||||||||||||||
| MFS Lifetime 2030 Fund | 0.75% | 0.25% | 1.00% | 1.00% | 81,328 | |||||||||||||||
| MFS Lifetime 2035 Fund | 0.75% | 0.25% | 1.00% | 1.00% | 5,969 | |||||||||||||||
| MFS Lifetime 2040 Fund | 0.75% | 0.25% | 1.00% | 1.00% | 42,949 | |||||||||||||||
| MFS Lifetime 2045 Fund | 0.75% | 0.25% | 1.00% | 1.00% | 3,513 | |||||||||||||||
| MFS Lifetime 2050 Fund | 0.75% | 0.25% | 1.00% | 1.00% | 6,987 | |||||||||||||||
| MFS Lifetime 2055 Fund | 0.75% | 0.25% | 1.00% | 1.00% | 1,970 | |||||||||||||||
| Class C | ||||||||||||||||||||
| Distribution Fee Rate (d) | Service Fee Rate (d) | Total Distribution Plan (d) | Annual Effective Rate (e) | Distribution and Service Fee | ||||||||||||||||
| MFS Lifetime Income Fund | 0.75% | 0.25% | 1.00% | 1.00% | $1,524,680 | |||||||||||||||
| MFS Lifetime 2015 Fund | 0.75% | 0.25% | 1.00% | 1.00% | 7,419 | |||||||||||||||
| MFS Lifetime 2020 Fund | 0.75% | 0.25% | 1.00% | 1.00% | 187,975 | |||||||||||||||
| MFS Lifetime 2025 Fund | 0.75% | 0.25% | 1.00% | 1.00% | 17,952 | |||||||||||||||
| MFS Lifetime 2030 Fund | 0.75% | 0.25% | 1.00% | 1.00% | 147,149 | |||||||||||||||
| MFS Lifetime 2035 Fund | 0.75% | 0.25% | 1.00% | 1.00% | 13,777 | |||||||||||||||
| MFS Lifetime 2040 Fund | 0.75% | 0.25% | 1.00% | 1.00% | 111,778 | |||||||||||||||
| MFS Lifetime 2045 Fund | 0.75% | 0.25% | 1.00% | 1.00% | 5,733 | |||||||||||||||
| MFS Lifetime 2050 Fund | 0.75% | 0.25% | 1.00% | 1.00% | 14,323 | |||||||||||||||
| MFS Lifetime 2055 Fund | 0.75% | 0.25% | 1.00% | 1.00% | 7,412 | |||||||||||||||
| Class R1 | ||||||||||||||||||||
| Distribution Fee Rate (d) | Service Fee Rate (d) | Total Distribution Plan (d) | Annual Effective Rate (e) | Distribution and Service Fee | ||||||||||||||||
| MFS Lifetime Income Fund | 0.75% | 0.25% | 1.00% | 1.00% | $58,808 | |||||||||||||||
| MFS Lifetime 2015 Fund | 0.75% | 0.25% | 1.00% | 1.00% | 1,113 | |||||||||||||||
| MFS Lifetime 2020 Fund | 0.75% | 0.25% | 1.00% | 1.00% | 71,960 | |||||||||||||||
| MFS Lifetime 2025 Fund | 0.75% | 0.25% | 1.00% | 1.00% | 1,280 | |||||||||||||||
| MFS Lifetime 2030 Fund | 0.75% | 0.25% | 1.00% | 1.00% | 94,117 | |||||||||||||||
| MFS Lifetime 2035 Fund | 0.75% | 0.25% | 1.00% | 1.00% | 1,407 | |||||||||||||||
| MFS Lifetime 2040 Fund | 0.75% | 0.25% | 1.00% | 1.00% | 66,741 | |||||||||||||||
| MFS Lifetime 2045 Fund | 0.75% | 0.25% | 1.00% | 1.00% | 1,357 | |||||||||||||||
| MFS Lifetime 2050 Fund | 0.75% | 0.25% | 1.00% | 1.00% | 6,495 | |||||||||||||||
| MFS Lifetime 2055 Fund | 0.75% | 0.25% | 1.00% | 1.00% | 1,316 | |||||||||||||||
121
Table of Contents
Notes to Financial Statements – continued
| Class R2 | ||||||||||||||||||||
| Distribution Fee Rate (d) | Service Fee Rate (d) | Total Distribution Plan (d) | Annual Effective Rate (e) | Distribution and Service Fee | ||||||||||||||||
| MFS Lifetime Income Fund | 0.25% | 0.25% | 0.50% | 0.50% | $136,040 | |||||||||||||||
| MFS Lifetime 2015 Fund | 0.25% | 0.25% | 0.50% | 0.50% | 8,808 | |||||||||||||||
| MFS Lifetime 2020 Fund | 0.25% | 0.25% | 0.50% | 0.50% | 348,812 | |||||||||||||||
| MFS Lifetime 2025 Fund | 0.25% | 0.25% | 0.50% | 0.50% | 19,424 | |||||||||||||||
| MFS Lifetime 2030 Fund | 0.25% | 0.25% | 0.50% | 0.50% | 382,476 | |||||||||||||||
| MFS Lifetime 2035 Fund | 0.25% | 0.25% | 0.50% | 0.50% | 16,638 | |||||||||||||||
| MFS Lifetime 2040 Fund | 0.25% | 0.25% | 0.50% | 0.50% | 290,342 | |||||||||||||||
| MFS Lifetime 2045 Fund | 0.25% | 0.25% | 0.50% | 0.50% | 7,258 | |||||||||||||||
| MFS Lifetime 2050 Fund | 0.25% | 0.25% | 0.50% | 0.50% | 48,712 | |||||||||||||||
| MFS Lifetime 2055 Fund | 0.25% | 0.25% | 0.50% | 0.50% | 2,604 | |||||||||||||||
| Class R3 | ||||||||||||||||||||
Distribution Fee Rate (d) | Service Fee Rate (d) | Total Distribution Plan (d) | Annual Effective Rate (e) | Distribution and Service Fee | ||||||||||||||||
| MFS Lifetime Income Fund | — | 0.25% | 0.25% | 0.25% | $58,073 | |||||||||||||||
| MFS Lifetime 2015 Fund | — | 0.25% | 0.25% | 0.25% | 10,838 | |||||||||||||||
| MFS Lifetime 2020 Fund | — | 0.25% | 0.25% | 0.25% | 121,650 | |||||||||||||||
| MFS Lifetime 2025 Fund | — | 0.25% | 0.25% | 0.25% | 27,314 | |||||||||||||||
| MFS Lifetime 2030 Fund | — | 0.25% | 0.25% | 0.25% | 163,705 | |||||||||||||||
| MFS Lifetime 2035 Fund | — | 0.25% | 0.25% | 0.25% | 23,996 | |||||||||||||||
| MFS Lifetime 2040 Fund | — | 0.25% | 0.25% | 0.25% | 87,778 | |||||||||||||||
| MFS Lifetime 2045 Fund | — | 0.25% | 0.25% | 0.25% | 13,858 | |||||||||||||||
| MFS Lifetime 2050 Fund | — | 0.25% | 0.25% | 0.25% | 17,257 | |||||||||||||||
| MFS Lifetime 2055 Fund | — | 0.25% | 0.25% | 0.25% | 3,710 | |||||||||||||||
| Class 529A (i) | ||||||||||||||||||||
Distribution Fee Rate (d) | Service Fee Rate (d) | Total Distribution Plan (d) | Annual Effective Rate (e) | Distribution and Service Fee | ||||||||||||||||
| MFS Lifetime Income Fund | — | 0.25% | 0.25% | 0.25% | $35,147 | |||||||||||||||
| Class 529B (i) | ||||||||||||||||||||
Distribution Fee Rate (d) | Service Fee Rate (d) | Total Distribution Plan (d) | Annual Effective Rate (e) | Distribution and Service Fee | ||||||||||||||||
| MFS Lifetime Income Fund | 0.75% | 0.25% | 1.00% | 0.99% | $10,621 | |||||||||||||||
| Class 529C (i) | ||||||||||||||||||||
Distribution Fee Rate (d) | Service Fee Rate (d) | Total Distribution Plan (d) | Annual Effective Rate (e) | Distribution and Service Fee | ||||||||||||||||
| MFS Lifetime Income Fund | 0.75% | 0.25% | 1.00% | 1.00% | $70,676 | |||||||||||||||
| MFS Lifetime Income Fund | MFS Lifetime 2015 Fund | MFS Lifetime 2020 Fund | MFS Lifetime 2025 Fund | MFS Lifetime 2030 Fund | ||||||||||||||||
| Total Distribution and Service Fees | $2,430,120 | $33,788 | $932,770 | $91,937 | $976,679 | |||||||||||||||
| MFS Lifetime 2035 Fund | MFS Lifetime 2040 Fund | MFS Lifetime 2045 Fund | MFS Lifetime 2050 Fund | MFS Lifetime 2055 Fund | ||||||||||||||||
| Total Distribution and Service Fees | $73,515 | $670,519 | $36,792 | $108,723 | $18,775 | |||||||||||||||
| (d) | In accordance with the distribution plan for certain classes, each fund pays distribution and/or service fees equal to these annual percentage rates of each class’s average daily net assets. The distribution and service fee rates disclosed by class represent the current rates in effect at the end of the reporting period. Any rate changes, if applicable, are detailed below. |
122
Table of Contents
Notes to Financial Statements – continued
| (e) | The annual effective rates represent actual fees incurred under the distribution plan for the year ended April 30, 2015 based on each class’s average daily net assets. MFD has voluntarily agreed to rebate a portion of each class’s 0.25% service fee attributable to accounts for which MFD retains the 0.25% service fee except for accounts attributable to MFS or its affiliates’ seed money. For the year ended April 30, 2015, these rebates amounted to the following, and are included in the reduction of total expenses in the Statements of Operations: |
| MFS Lifetime Income Fund (i) | MFS Lifetime 2020 Fund | MFS Lifetime 2025 Fund | MFS Lifetime 2030 Fund | MFS Lifetime 2035 Fund | ||||||||||||||||
| Class A | $2,337 | $1,245 | $1,320 | $2,344 | $257 | |||||||||||||||
| Class B | 13 | 178 | — | 12 | — | |||||||||||||||
| Class C | — | 4 | — | 79 | — | |||||||||||||||
| Class R2 | — | — | — | 1 | — | |||||||||||||||
| Class R3 | 1 | 2 | — | — | — | |||||||||||||||
| Class 529A | 558 | — | — | — | — | |||||||||||||||
| Class 529B | 57 | — | — | — | — | |||||||||||||||
| Class 529C | 157 | — | — | — | — | |||||||||||||||
| MFS Lifetime 2040 Fund | MFS Lifetime 2045 Fund | MFS Lifetime 2050 Fund | MFS Lifetime 2055 Fund | |||||||||||||||||
| Class A | $1,383 | $231 | $103 | $9 | ||||||||||||||||
| Class B | 3 | — | — | — | ||||||||||||||||
| Class R3 | 4 | — | — | — | ||||||||||||||||
| (i) | For Class 529A, Class 529B, and Class 529C, the period is from inception, January 8, 2015, through the stated period end. |
Certain Class A shares are subject to a contingent deferred sales charge (CDSC) in the event of a shareholder redemption within 18 months of purchase for shares purchased on or after August 1, 2012, and within 24 months of purchase for shares purchased prior to August 1, 2012. Class C and Class 529C shares are subject to a CDSC in the event of a shareholder redemption within 12 months of purchase. Class B and Class 529B shares are subject to a CDSC in the event of a shareholder redemption within six years of purchase. All contingent deferred sales charges are paid to MFD and during the year ended April 30, 2015, were as follows:
| CDSC Imposed | MFS Lifetime Income Fund | MFS Lifetime 2015 Fund | MFS Lifetime 2020 Fund | MFS Lifetime 2025 Fund | MFS Lifetime 2030 Fund | |||||||||||||||
| Class A | $64 | $— | $166 | $188 | $118 | |||||||||||||||
| Class B | 37,251 | 44 | 12,506 | 1,277 | 7,305 | |||||||||||||||
| Class C | 56,769 | 349 | 2,665 | 971 | 2,756 | �� | ||||||||||||||
| Class 529B | 200 | — | — | — | — | |||||||||||||||
| Class 529C | 84 | — | — | — | — | |||||||||||||||
| CDSC Imposed | MFS Lifetime 2035 Fund | MFS Lifetime 2040 Fund | MFS Lifetime 2045 Fund | MFS Lifetime 2050 Fund | MFS Lifetime 2055 Fund | |||||||||||||||
| Class A | $41 | $278 | $58 | $56 | $18 | |||||||||||||||
| Class B | 638 | 6,796 | 305 | 2,422 | — | |||||||||||||||
| Class C | 100 | 1,285 | 174 | 537 | 199 | |||||||||||||||
The MFS Lifetime Income Fund has entered into and may from time to time enter into contracts with program managers and other parties which administer the tuition programs through which an investment in the fund’s 529 share classes is made. The MFS Lifetime Income Fund has entered into an agreement with MFD pursuant to which MFD receives an annual fee of up to 0.10% of the average daily net assets attributable to each 529 share class. MFD has agreed to waive a portion of this fee in an amount equal to 0.05% of the average daily net assets for each 529 share class. This waiver agreement will expire on August 31, 2016, unless MFD elects to extend the waiver. For the period from the inception of the 529 classes on January 8, 2015 through April 30, 2015, this waiver amounted to $11,095 and is included in the reduction of total expenses in the Statement of Operations. The program manager fee incurred for the period from the inception of the 529 classes on January 8, 2015 through April 30, 2015 was equivalent to an annual effective rate of 0.05% of the average daily net assets attributable to each 529 share class. The services provided by MFD, or a third party with which MFD contracts, include recordkeeping and tax reporting and account services, as well as services designed to maintain the program’s compliance with the Internal Revenue Code and other regulatory requirements. Program manager fees and waivers for the MFS Lifetime Income Fund for the period from the inception of the 529 classes on January 8, 2015 through April 30, 2015, were as follows:
123
Table of Contents
Notes to Financial Statements – continued
| Fee | Waiver | |||||||
| Class 529A | $14,059 | $7,030 | ||||||
| Class 529B | 1,062 | 531 | ||||||
| Class 529C | 7,068 | 3,534 | ||||||
| Total Program Manager Fees and Waivers | $22,189 | $11,095 | ||||||
Shareholder Servicing Agent – MFS Service Center, Inc. (MFSC), a wholly-owned subsidiary of MFS, provides shareholder services and transfer agent services to the funds. Under a Special Servicing Agreement among MFS, certain MFS funds which invest in other MFS funds (“MFS fund-of-funds”) and certain underlying funds in which a MFS fund-of-funds invests (“underlying funds”), each underlying fund may pay a portion of each MFS fund-of-funds’ transfer agent-related expenses, including out-of-pocket and sub-accounting fees, to the extent such payments do not exceed the benefits realized or expected to be realized by the underlying fund from the investment in the underlying fund by the MFS fund-of-funds. For the year ended April 30, 2015, shareholder servicing expenses incurred by the funds, including out-of-pocket expenses, are disclosed in the Statements of Operations.
Administrator – MFS provides certain financial, legal, shareholder communications, compliance, and other administrative services to each fund. Under an administrative services agreement, each fund reimburses MFS the costs incurred to provide these services. Each fund pays an annual fixed amount of $17,500. The administrative services fee incurred for the year ended April 30, 2015 was equivalent to the following annual effective rates of each fund’s average daily net assets:
| MFS Lifetime Income Fund | MFS Lifetime 2015 Fund | MFS Lifetime 2020 Fund | MFS Lifetime 2025 Fund | MFS Lifetime 2030 Fund | ||||
| 0.0037% | 0.0357% | 0.0049% | 0.0165% | 0.0047% | ||||
MFS Lifetime 2035 Fund | MFS Lifetime 2040 Fund | MFS Lifetime 2045 Fund | MFS Lifetime 2050 Fund | MFS Lifetime 2055 Fund | ||||
| 0.0216% | 0.0063% | 0.0392% | 0.0241% | 0.2461% | ||||
Trustees’ and Officers’ Compensation – Each fund pays compensation to independent Trustees in the form of a retainer, attendance fees, and additional compensation to Board and Committee chairpersons. Each fund does not pay compensation directly to Trustees or officers of each fund who are also officers of the investment adviser, all of whom receive remuneration for their services to each fund from MFS. Certain officers and Trustees of each fund are officers or directors of MFS, MFD, and MFSC.
Other – Effective November 1, 2014, these funds and certain other funds managed by MFS (the funds) have entered into a service agreement (the ISO Agreement) which provides for payment of fees solely by the funds to Tarantino LLC in return for the provision of services of an Independent Senior Officer (ISO) for the funds. Frank L. Tarantino serves as the ISO and is an officer of the funds and the sole member of Tarantino LLC. The funds can terminate the ISO Agreement with Tarantino LLC at any time under the terms of the ISO Agreement. Prior to November 1, 2014, the funds had entered into services agreements (the Compliance Officer Agreements) which provided for payment of fees by the funds to Tarantino LLC and Griffin Compliance LLC in return for the provision of services of an Independent Chief Compliance Officer (ICCO) and Assistant ICCO, respectively, for the funds. Prior to November 1, 2014, Frank L. Tarantino served as the ICCO. Effective October 31, 2014, Mr. Tarantino resigned as ICCO and the Compliance Officer Agreement between the funds and Tarantino LLC was terminated. Prior to June 1, 2014, Robyn L. Griffin served as the Assistant ICCO and was an officer of the funds. Ms. Griffin is the sole member of Griffin Compliance LLC. Effective May 31, 2014, Ms. Griffin resigned as Assistant ICCO and the Compliance Officer Agreement between the funds and Griffin Compliance LLC was terminated. For the year ended April 30, 2015, the aggregate fees paid by each fund under these agreements amounted to the following and are included in “Miscellaneous” expense in the Statements of Operations:
| MFS Lifetime Income Fund | MFS Lifetime 2015 Fund | MFS Lifetime 2020 Fund | MFS Lifetime 2025 Fund | MFS Lifetime 2030 Fund | ||||
| $1,865 | $199 | $1,482 | $417 | $1,500 | ||||
| MFS Lifetime 2035 Fund | MFS Lifetime 2040 Fund | MFS Lifetime 2045 Fund | MFS Lifetime 2050 Fund | MFS Lifetime 2055 Fund | ||||
| $312 | $1,114 | $169 | $285 | $26 | ||||
MFS had agreed to reimburse the funds for a portion of the payments made by each fund for the services under the Compliance Officer agreements in the following amounts, which are included in the reduction of total expenses in the Statements of Operations. Additionally, MFS has agreed to bear all expenses associated with office space, other administrative support, and supplies provided to the ISO, ICCO, and Assistant ICCO.
| MFS Lifetime Income Fund | MFS Lifetime 2015 Fund | MFS Lifetime 2020 Fund | MFS Lifetime 2025 Fund | MFS Lifetime 2030 Fund | ||||
| $431 | $48 | $366 | $93 | $360 | ||||
| MFS Lifetime 2035 Fund | MFS Lifetime 2040 Fund | MFS Lifetime 2045 Fund | MFS Lifetime 2050 Fund | MFS Lifetime 2055 Fund | ||||
| $68 | $264 | $36 | $65 | $5 | ||||
124
Table of Contents
Notes to Financial Statements – continued
Each fund invests in the MFS Institutional Money Market Portfolio which is managed by MFS and seeks current income consistent with preservation of capital and liquidity. Income earned on this investment is included in “Dividends from underlying affiliated funds” in the Statements of Operations. This money market fund does not pay a management fee to MFS.
On January 7, 2015, MFS purchased 10,000 shares each of Class 529A, Class 529B, and Class 529C, for an aggregate amount of $100,000 of the MFS Lifetime Income Fund.
On September 11, 2013, MFS redeemed the following fund shares:
| Fund | Class | Shares | Amount | |||||||
| MFS Lifetime Retirement Income Fund | Class R4 | 6,702 | $78,816 | |||||||
| MFS Lifetime 2020 Fund | Class I | 6,291 | $79,581 | |||||||
| MFS Lifetime 2030 Fund | Class R5 | 6,133 | $80,158 | |||||||
| MFS Lifetime 2040 Fund | Class R5 | 15,833 | $209,312 | |||||||
| MFS Lifetime 2050 Fund | Class A | 10,362 | $146,519 | |||||||
| MFS Lifetime 2050 Fund | Class R2 | 10,375 | $145,354 | |||||||
| MFS Lifetime 2050 Fund | Class R3 | 10,419 | $146,491 | |||||||
At April 30, 2015, MFS held approximately 59%, 72%, and 96% of the outstanding shares of Class B, Class I, and Class R1, respectively, of MFS Lifetime 2015 Fund, 77% of the outstanding shares of Class R1 of MFS Lifetime 2025 Fund, 74% of the outstanding shares of Class R1 of MFS Lifetime 2035 Fund, 78% of the outstanding shares of Class R1 of MFS Lifetime 2045 Fund, and 55% and 95% of the outstanding shares of Class B and Class R1, respectively, of MFS Lifetime 2055 Fund.
| (4) | Portfolio Securities |
For the year ended April 30, 2015, purchases and sales of shares of underlying funds aggregated to the following:
MFS Lifetime Income Fund | MFS Lifetime 2015 Fund | MFS Lifetime 2020 Fund | MFS Lifetime 2025 Fund | MFS Lifetime 2030 Fund | ||||||||||||||||
| Purchases | $187,808,350 | $14,512,360 | $64,297,625 | $51,004,932 | $82,572,478 | |||||||||||||||
| Sales | $ 66,192,725 | $10,793,728 | $72,838,736 | $14,149,578 | $41,112,647 | |||||||||||||||
MFS Lifetime 2035 Fund | MFS Lifetime 2040 Fund | MFS Lifetime 2045 Fund | MFS Lifetime 2050 Fund | MFS Lifetime 2055 Fund | ||||||||||||||||
| Purchases | $45,692,482 | $66,852,517 | $29,747,178 | $33,478,402 | $7,273,957 | |||||||||||||||
| Sales | $6,425,365 | $28,105,738 | $3,081,815 | $6,337,749 | $1,293,021 | |||||||||||||||
| (5) | Shares of Beneficial Interest |
Each fund’s Declaration of Trust permits the Trustees to issue an unlimited number of full and fractional shares of beneficial interest. Transactions in fund shares were as follows:
| MFS Lifetime Income Fund | MFS Lifetime 2015 Fund | |||||||||||||||||||||||||||||||
| Year ended 4/30/15 (i) | Year ended 4/30/14 | Year ended 4/30/15 | Year ended 4/30/14 | |||||||||||||||||||||||||||||
| Shares | Amount | Shares | Amount | Shares | Amount | Shares | Amount | |||||||||||||||||||||||||
| Shares sold | ||||||||||||||||||||||||||||||||
Class A | 2,560,098 | $31,314,972 | 3,706,767 | $44,120,492 | 64,446 | $700,968 | 125,302 | $1,317,443 | ||||||||||||||||||||||||
Class B | 156,769 | 1,919,353 | 357,418 | 4,257,159 | 4,880 | 52,993 | 2,745 | 28,737 | ||||||||||||||||||||||||
Class C | 4,570,235 | 55,965,142 | 5,596,279 | 66,791,195 | 61,374 | 662,689 | 31,056 | 323,569 | ||||||||||||||||||||||||
Class I | 1,022,870 | 12,568,470 | 1,160,160 | 13,821,501 | 4,440 | 48,345 | 7,612 | 81,074 | ||||||||||||||||||||||||
Class R1 | 76,602 | 941,001 | 58,217 | 696,077 | 448 | 4,809 | — | — | ||||||||||||||||||||||||
Class R2 | 630,969 | 7,723,536 | 171,366 | 2,049,760 | 55,615 | 603,308 | 205,716 | 2,162,431 | ||||||||||||||||||||||||
Class R3 | 910,050 | 11,146,628 | 401,260 | 4,751,037 | 263,767 | 2,851,511 | 214,090 | 2,228,921 | ||||||||||||||||||||||||
Class R4 | 4,645,701 | 56,951,727 | 1,196,961 | 14,307,382 | 929,866 | 10,109,790 | 1,423,861 | 14,971,481 | ||||||||||||||||||||||||
Class 529A | 5,370,812 | 54,044,580 | — | — | — | — | — | — | ||||||||||||||||||||||||
Class 529B | 407,543 | 4,098,592 | — | — | — | — | — | — | ||||||||||||||||||||||||
Class 529C | 2,720,288 | 27,377,208 | — | — | — | — | — | — | ||||||||||||||||||||||||
| 23,071,937 | $264,051,209 | 12,648,428 | $150,794,603 | 1,384,836 | $15,034,413 | 2,010,382 | $21,113,656 | |||||||||||||||||||||||||
125
Table of Contents
Notes to Financial Statements – continued
| MFS Lifetime Income Fund | MFS Lifetime 2015 Fund | |||||||||||||||||||||||||||||||
| Year ended 4/30/15 (i) | Year ended 4/30/14 | Year ended 4/30/15 | Year ended 4/30/14 | |||||||||||||||||||||||||||||
| Shares | Amount | Shares | Amount | Shares | Amount | Shares | Amount | |||||||||||||||||||||||||
| Shares issued in connection with acquisition of MFS Lifetime 2010 Fund | ||||||||||||||||||||||||||||||||
Class A | 1,719,950 | $21,206,984 | ||||||||||||||||||||||||||||||
Class B | 255,666 | 3,152,365 | ||||||||||||||||||||||||||||||
Class C | 639,108 | 7,873,816 | ||||||||||||||||||||||||||||||
Class I | 41,771 | 515,034 | ||||||||||||||||||||||||||||||
Class R1 | 389,060 | 4,801,004 | ||||||||||||||||||||||||||||||
Class R2 | 1,984,019 | 24,462,958 | ||||||||||||||||||||||||||||||
Class R3 | 495,250 | 6,106,433 | ||||||||||||||||||||||||||||||
Class R4 | 128,658 | 1,586,352 | ||||||||||||||||||||||||||||||
| 5,653,482 | $69,704,946 | |||||||||||||||||||||||||||||||
| Shares issued to shareholders in reinvestment of distributions | ||||||||||||||||||||||||||||||||
Class A | 255,867 | $3,125,068 | 194,494 | $2,324,811 | 3,128 | $33,470 | 1,646 | $17,322 | ||||||||||||||||||||||||
Class B | 28,207 | 344,019 | 22,371 | 267,725 | 316 | 3,378 | 136 | 1,426 | ||||||||||||||||||||||||
Class C | 205,687 | 2,507,439 | 124,658 | 1,492,844 | 1,298 | 13,793 | 467 | 4,895 | ||||||||||||||||||||||||
Class I | 36,975 | 452,040 | 33,493 | 400,806 | 336 | 3,595 | 201 | 2,117 | ||||||||||||||||||||||||
Class R1 | 8,341 | 101,795 | 2,864 | 34,291 | 163 | 1,746 | 103 | 1,075 | ||||||||||||||||||||||||
Class R2 | 48,832 | 596,114 | 13,093 | 156,585 | 3,359 | 35,877 | 1,578 | 16,568 | ||||||||||||||||||||||||
Class R3 | 46,946 | 573,463 | 26,566 | 317,717 | 9,010 | 96,410 | 5,700 | 59,905 | ||||||||||||||||||||||||
Class R4 | 150,919 | 1,844,229 | 59,557 | 712,646 | 97,808 | 1,048,501 | 63,153 | 664,999 | ||||||||||||||||||||||||
Class 529A | 16,053 | 162,797 | — | — | — | — | — | — | ||||||||||||||||||||||||
Class 529B | 430 | 4,359 | — | — | — | — | — | — | ||||||||||||||||||||||||
Class 529C | 2,851 | 28,893 | — | — | — | — | — | — | ||||||||||||||||||||||||
| 801,108 | $9,740,216 | 477,096 | $5,707,425 | 115,418 | $1,236,770 | 72,984 | $768,307 | |||||||||||||||||||||||||
| Shares reacquired | ||||||||||||||||||||||||||||||||
Class A | (3,174,530 | ) | $(38,881,622 | ) | (4,092,956 | ) | $(48,819,589 | ) | (50,460 | ) | $(546,878 | ) | (7,234 | ) | $(75,638 | ) | ||||||||||||||||
Class B | (284,085 | ) | (3,481,139 | ) | (291,067 | ) | (3,476,917 | ) | (354 | ) | (3,814 | ) | (252 | ) | (2,648 | ) | ||||||||||||||||
Class C | (2,851,820 | ) | (34,908,771 | ) | (1,962,744 | ) | (23,416,049 | ) | (19,687 | ) | (210,936 | ) | (3,168 | ) | (33,627 | ) | ||||||||||||||||
Class I | (870,541 | ) | (10,648,387 | ) | (632,803 | ) | (7,562,119 | ) | (7,996 | ) | (87,239 | ) | — | — | ||||||||||||||||||
Class R1 | (213,194 | ) | (2,610,421 | ) | (75,241 | ) | (901,248 | ) | — | — | — | — | ||||||||||||||||||||
Class R2 | (961,512 | ) | (11,751,154 | ) | (288,290 | ) | (3,448,285 | ) | (26,568 | ) | (287,933 | ) | (68,676 | ) | (715,356 | ) | ||||||||||||||||
Class R3 | (562,088 | ) | (6,884,458 | ) | (460,458 | ) | (5,500,242 | ) | (164,841 | ) | (1,796,504 | ) | (62,463 | ) | (661,223 | ) | ||||||||||||||||
Class R4 | (1,522,457 | ) | (18,637,544 | ) | (662,114 | ) | (7,903,942 | ) | (756,873 | ) | (8,212,487 | ) | (505,999 | ) | (5,332,003 | ) | ||||||||||||||||
Class 529A | (669,797 | ) | (6,802,777 | ) | — | — | — | — | — | — | ||||||||||||||||||||||
Class 529B | (71,099 | ) | (721,637 | ) | — | — | — | — | — | — | ||||||||||||||||||||||
Class 529C | (365,609 | ) | (3,718,399 | ) | — | — | — | — | — | — | ||||||||||||||||||||||
| (11,546,732 | ) | $(139,046,309 | ) | (8,465,673 | ) | $(101,028,391 | ) | (1,026,779 | ) | $(11,145,791 | ) | (647,792 | ) | $(6,820,495 | ) | |||||||||||||||||
| Net change | ||||||||||||||||||||||||||||||||
Class A | 1,361,385 | $16,765,402 | (191,695 | ) | $(2,374,286 | ) | 17,114 | $187,560 | 119,714 | $1,259,127 | ||||||||||||||||||||||
Class B | 156,557 | 1,934,598 | 88,722 | 1,047,967 | 4,842 | 52,557 | 2,629 | 27,515 | ||||||||||||||||||||||||
Class C | 2,563,210 | 31,437,626 | 3,758,193 | 44,867,990 | 42,985 | 465,546 | 28,355 | 294,837 | ||||||||||||||||||||||||
Class I | 231,075 | 2,887,157 | 560,850 | 6,660,188 | (3,220 | ) | (35,299 | ) | 7,813 | 83,191 | ||||||||||||||||||||||
Class R1 | 260,809 | 3,233,379 | (14,160 | ) | (170,880 | ) | 611 | 6,555 | 103 | 1,075 | ||||||||||||||||||||||
Class R2 | 1,702,308 | 21,031,454 | (103,831 | ) | (1,241,940 | ) | 32,406 | 351,252 | 138,618 | 1,463,643 | ||||||||||||||||||||||
Class R3 | 890,158 | 10,942,066 | (32,632 | ) | (431,488 | ) | 107,936 | 1,151,417 | 157,327 | 1,627,603 | ||||||||||||||||||||||
Class R4 | 3,402,821 | 41,744,764 | 594,404 | 7,116,086 | 270,801 | 2,945,804 | 981,015 | 10,304,477 | ||||||||||||||||||||||||
Class 529A | 4,717,068 | 47,404,600 | — | — | — | — | — | — | ||||||||||||||||||||||||
Class 529B | 336,874 | 3,381,314 | — | — | — | — | — | — | ||||||||||||||||||||||||
Class 529C | 2,357,530 | 23,687,702 | — | — | — | — | — | — | ||||||||||||||||||||||||
| 17,979,795 | $204,450,062 | 4,659,851 | $55,473,637 | 473,475 | $5,125,392 | 1,435,574 | $15,061,468 | |||||||||||||||||||||||||
126
Table of Contents
Notes to Financial Statements – continued
| (i) | For Class 529A, Class 529B, and Class 529C, the period is from inception, January 8, 2015, through the stated period end. |
| MFS Lifetime 2020 Fund | MFS Lifetime 2025 Fund | |||||||||||||||||||||||||||||||
| Year ended 4/30/15 | Year ended 4/30/14 | Year ended 4/30/15 | Year ended 4/30/14 | |||||||||||||||||||||||||||||
| Shares | Amount | Shares | Amount | Shares | Amount | Shares | Amount | |||||||||||||||||||||||||
| Shares sold | ||||||||||||||||||||||||||||||||
Class A | 927,929 | $12,390,118 | 1,887,773 | $24,316,726 | 404,082 | $4,854,668 | 400,266 | $4,529,518 | ||||||||||||||||||||||||
Class B | 65,950 | 873,467 | 107,388 | 1,357,923 | 37,297 | 445,447 | 37,532 | 424,399 | ||||||||||||||||||||||||
Class C | 234,382 | 3,074,288 | 530,336 | 6,647,327 | 89,519 | 1,065,604 | 119,239 | 1,360,549 | ||||||||||||||||||||||||
Class I | 395,730 | 5,375,877 | 35,678 | 461,864 | 118,450 | 1,438,488 | 26,830 | 305,731 | ||||||||||||||||||||||||
Class R1 | 103,072 | 1,367,918 | 125,447 | 1,586,600 | 3,057 | 36,396 | — | — | ||||||||||||||||||||||||
Class R2 | 1,356,194 | 18,051,905 | 1,565,123 | 19,830,845 | 83,836 | 1,007,650 | 350,781 | 4,019,846 | ||||||||||||||||||||||||
Class R3 | 1,607,372 | 21,448,616 | 1,355,894 | 17,174,344 | 510,277 | 6,106,267 | 543,622 | 6,081,974 | ||||||||||||||||||||||||
Class R4 | 3,271,257 | 44,040,959 | 3,551,760 | 45,396,725 | 3,061,318 | 36,810,468 | 2,273,922 | 25,789,783 | ||||||||||||||||||||||||
| 7,961,886 | $106,623,148 | 9,159,399 | $116,772,354 | 4,307,836 | $51,764,988 | 3,752,192 | $42,511,800 | |||||||||||||||||||||||||
Shares issued to shareholders in reinvestment of distributions |
| |||||||||||||||||||||||||||||||
Class A | 65,551 | $869,205 | 68,742 | $886,776 | 14,102 | $168,094 | 4,992 | $57,851 | ||||||||||||||||||||||||
Class B | 6,276 | 82,785 | 4,958 | 63,661 | 1,474 | 17,493 | 570 | 6,586 | ||||||||||||||||||||||||
Class C | �� | 13,642 | 177,895 | 10,192 | 129,444 | 2,499 | 29,567 | 1,148 | 13,227 | |||||||||||||||||||||||
Class I | 4,755 | 63,379 | 3,753 | 48,670 | 2,585 | 30,837 | 532 | 6,166 | ||||||||||||||||||||||||
Class R1 | 6,434 | 84,868 | 5,540 | 71,136 | 156 | 1,865 | 80 | 927 | ||||||||||||||||||||||||
Class R2 | 86,166 | 1,136,542 | 75,139 | 964,787 | 6,396 | 76,108 | 1,206 | 13,955 | ||||||||||||||||||||||||
Class R3 | 70,600 | 936,870 | 55,663 | 719,161 | 19,415 | 231,423 | 11,136 | 128,959 | ||||||||||||||||||||||||
Class R4 | 257,491 | 3,427,183 | 194,963 | 2,526,721 | 181,330 | 2,165,083 | 84,557 | 980,866 | ||||||||||||||||||||||||
| 510,915 | $6,778,727 | 418,950 | $5,410,356 | 227,957 | $2,720,470 | 104,221 | $1,208,537 | |||||||||||||||||||||||||
| Shares reacquired | ||||||||||||||||||||||||||||||||
Class A | (1,832,780 | ) | $(24,599,591 | ) | (921,482 | ) | $(11,742,252 | ) | (54,761 | ) | $(659,780 | ) | (81,384 | ) | $(953,106 | ) | ||||||||||||||||
Class B | (119,814 | ) | (1,590,531 | ) | (118,751 | ) | (1,508,309 | ) | (17,546 | ) | (210,635 | ) | (5,604 | ) | (62,528 | ) | ||||||||||||||||
Class C | (291,149 | ) | (3,826,761 | ) | (428,429 | ) | (5,344,906 | ) | (26,215 | ) | (310,566 | ) | (18,683 | ) | (216,205 | ) | ||||||||||||||||
Class I | (82,988 | ) | (1,123,440 | ) | (40,406 | ) | (516,579 | ) | (3,915 | ) | (47,088 | ) | (1 | ) | (13 | ) | ||||||||||||||||
Class R1 | (209,400 | ) | (2,781,048 | ) | (226,543 | ) | (2,871,416 | ) | (2 | ) | (22 | ) | — | — | ||||||||||||||||||
Class R2 | (1,800,816 | ) | (23,871,509 | ) | (1,464,511 | ) | (18,526,464 | ) | (67,433 | ) | (806,219 | ) | (40,736 | ) | (450,544 | ) | ||||||||||||||||
Class R3 | (1,230,227 | ) | (16,476,891 | ) | (1,355,591 | ) | (17,303,858 | ) | (237,524 | ) | (2,873,053 | ) | (85,068 | ) | (979,070 | ) | ||||||||||||||||
Class R4 | (2,926,416 | ) | (39,299,820 | ) | (1,338,504 | ) | (17,173,497 | ) | (812,551 | ) | (9,775,551 | ) | (472,164 | ) | (5,340,663 | ) | ||||||||||||||||
| (8,493,590 | ) | $(113,569,591 | ) | (5,894,217 | ) | $(74,987,281 | ) | (1,219,947 | ) | $(14,682,914 | ) | (703,640 | ) | $(8,002,129 | ) | |||||||||||||||||
| Net change | ||||||||||||||||||||||||||||||||
Class A | (839,300 | ) | $(11,340,268 | ) | 1,035,033 | $13,461,250 | 363,423 | $4,362,982 | 323,874 | $3,634,263 | ||||||||||||||||||||||
Class B | (47,588 | ) | (634,279 | ) | (6,405 | ) | (86,725 | ) | 21,225 | 252,305 | 32,498 | 368,457 | ||||||||||||||||||||
Class C | (43,125 | ) | (574,578 | ) | 112,099 | 1,431,865 | 65,803 | 784,605 | 101,704 | 1,157,571 | ||||||||||||||||||||||
Class I | 317,497 | 4,315,816 | (975 | ) | (6,045 | ) | 117,120 | 1,422,237 | 27,361 | 311,884 | ||||||||||||||||||||||
Class R1 | (99,894 | ) | (1,328,262 | ) | (95,556 | ) | (1,213,680 | ) | 3,211 | 38,239 | 80 | 927 | ||||||||||||||||||||
Class R2 | (358,456 | ) | (4,683,062 | ) | 175,751 | 2,269,168 | 22,799 | 277,539 | 311,251 | 3,583,257 | ||||||||||||||||||||||
Class R3 | 447,745 | 5,908,595 | 55,966 | 589,647 | 292,168 | 3,464,637 | 469,690 | 5,231,863 | ||||||||||||||||||||||||
Class R4 | 602,332 | 8,168,322 | 2,408,219 | 30,749,949 | 2,430,097 | 29,200,000 | 1,886,315 | 21,429,986 | ||||||||||||||||||||||||
| (20,789 | ) | $(167,716 | ) | 3,684,132 | $47,195,429 | 3,315,846 | $39,802,544 | 3,152,773 | $35,718,208 | |||||||||||||||||||||||
127
Table of Contents
Notes to Financial Statements – continued
| MFS Lifetime 2030 Fund | MFS Lifetime 2035 Fund | |||||||||||||||||||||||||||||||
| Year ended 4/30/15 | Year ended 4/30/14 | Year ended 4/30/15 | Year ended 4/30/14 | |||||||||||||||||||||||||||||
| Shares | Amount | Shares | Amount | Shares | Amount | Shares | Amount | |||||||||||||||||||||||||
| Shares sold | ||||||||||||||||||||||||||||||||
Class A | 931,686 | $13,263,124 | 1,012,043 | $13,449,152 | 234,706 | $2,992,836 | 347,090 | $4,020,427 | ||||||||||||||||||||||||
Class B | 75,756 | 1,063,598 | 130,950 | 1,713,094 | 44,347 | 557,116 | 18,422 | 214,492 | ||||||||||||||||||||||||
Class C | 315,558 | 4,416,461 | 485,101 | 6,340,207 | 84,883 | 1,071,222 | 65,503 | 780,155 | ||||||||||||||||||||||||
Class I | 311,368 | 4,475,189 | 150,235 | 1,993,092 | 161,401 | 2,038,834 | 109,204 | 1,251,590 | ||||||||||||||||||||||||
Class R1 | 157,628 | 2,208,599 | 229,083 | 3,020,981 | 3,632 | 45,853 | — | — | ||||||||||||||||||||||||
Class R2 | 1,703,855 | 24,010,093 | 1,859,371 | 24,448,595 | 96,267 | 1,219,921 | 232,814 | 2,728,738 | ||||||||||||||||||||||||
Class R3 | 1,668,805 | 23,613,250 | 1,875,435 | 24,648,600 | 624,943 | 7,910,107 | 337,815 | 3,974,987 | ||||||||||||||||||||||||
Class R4 | 4,232,669 | 60,505,004 | 3,796,301 | 50,094,240 | 2,681,910 | 34,106,742 | 1,578,001 | 18,590,713 | ||||||||||||||||||||||||
| 9,397,325 | $133,555,318 | 9,538,519 | $125,707,961 | 3,932,089 | $49,942,631 | 2,688,849 | $31,561,102 | |||||||||||||||||||||||||
| Shares issued to shareholders in reinvestment of distributions | ||||||||||||||||||||||||||||||||
Class A | 45,837 | $649,048 | 32,602 | $445,665 | 8,655 | $109,049 | 3,916 | $47,853 | ||||||||||||||||||||||||
Class B | 5,008 | 70,208 | 4,000 | 54,164 | 738 | 9,270 | 212 | 2,591 | ||||||||||||||||||||||||
Class C | 8,008 | 111,709 | 5,458 | 73,579 | 1,666 | 20,846 | 620 | 7,535 | ||||||||||||||||||||||||
Class I | 14,351 | 204,221 | 8,444 | 116,016 | 4,819 | 60,858 | 1,353 | 16,564 | ||||||||||||||||||||||||
Class R1 | 6,260 | 87,895 | 5,824 | 78,911 | 166 | 2,095 | 54 | 660 | ||||||||||||||||||||||||
Class R2 | 69,810 | 981,531 | 59,729 | 810,520 | 5,045 | 63,519 | 2,274 | 27,763 | ||||||||||||||||||||||||
Class R3 | 73,565 | 1,040,209 | 55,729 | 760,147 | 16,138 | 203,656 | 5,312 | 65,019 | ||||||||||||||||||||||||
Class R4 | 188,222 | 2,674,636 | 133,247 | 1,826,816 | 121,502 | 1,534,564 | 46,584 | 570,192 | ||||||||||||||||||||||||
| 411,061 | $5,819,457 | 305,033 | $4,165,818 | 158,729 | $2,003,857 | 60,325 | $738,177 | |||||||||||||||||||||||||
| Shares reacquired | ||||||||||||||||||||||||||||||||
Class A | (901,891 | ) | $(12,894,217 | ) | (308,818 | ) | $(4,074,952 | ) | (35,172 | ) | $(448,064 | ) | (129,408 | ) | $(1,515,120 | ) | ||||||||||||||||
Class B | (79,325 | ) | (1,115,358 | ) | (63,611 | ) | (839,232 | ) | (4,008 | ) | (50,599 | ) | (2,800 | ) | (30,296 | ) | ||||||||||||||||
Class C | (246,652 | ) | (3,455,001 | ) | (207,582 | ) | (2,715,681 | ) | (6,989 | ) | (87,620 | ) | (4,844 | ) | (56,814 | ) | ||||||||||||||||
Class I | (105,619 | ) | (1,523,730 | ) | (75,110 | ) | (991,987 | ) | (10,336 | ) | (129,685 | ) | (6,750 | ) | (82,748 | ) | ||||||||||||||||
Class R1 | (383,086 | ) | (5,338,415 | ) | (195,089 | ) | (2,589,684 | ) | (42 | ) | (537 | ) | — | — | ||||||||||||||||||
Class R2 | (1,561,435 | ) | (21,910,456 | ) | (1,365,033 | ) | (18,025,640 | ) | (30,091 | ) | (383,014 | ) | (44,626 | ) | (517,044 | ) | ||||||||||||||||
Class R3 | (978,832 | ) | (13,884,450 | ) | (632,479 | ) | (8,385,164 | ) | (188,856 | ) | (2,406,131 | ) | (59,849 | ) | (718,260 | ) | ||||||||||||||||
Class R4 | (2,134,944 | ) | (30,408,142 | ) | (1,053,455 | ) | (13,999,207 | ) | (550,006 | ) | (6,964,666 | ) | (207,266 | ) | (2,478,710 | ) | ||||||||||||||||
| (6,391,784 | ) | $(90,529,769 | ) | (3,901,177 | ) | $(51,621,547 | ) | (825,500 | ) | $(10,470,316 | ) | (455,543 | ) | $(5,398,992 | ) | |||||||||||||||||
| Net change | ||||||||||||||||||||||||||||||||
Class A | 75,632 | $1,017,955 | 735,827 | $9,819,865 | 208,189 | $2,653,821 | 221,598 | $2,553,160 | ||||||||||||||||||||||||
Class B | 1,439 | 18,448 | 71,339 | 928,026 | 41,077 | 515,787 | 15,834 | 186,787 | ||||||||||||||||||||||||
Class C | 76,914 | 1,073,169 | 282,977 | 3,698,105 | 79,560 | 1,004,448 | 61,279 | 730,876 | ||||||||||||||||||||||||
Class I | 220,100 | 3,155,680 | 83,569 | 1,117,121 | 155,884 | 1,970,007 | 103,807 | 1,185,406 | ||||||||||||||||||||||||
Class R1 | (219,198 | ) | (3,041,921 | ) | 39,818 | 510,208 | 3,756 | 47,411 | 54 | 660 | ||||||||||||||||||||||
Class R2 | 212,230 | 3,081,168 | 554,067 | 7,233,475 | 71,221 | 900,426 | 190,462 | 2,239,457 | ||||||||||||||||||||||||
Class R3 | 763,538 | 10,769,009 | 1,298,685 | 17,023,583 | 452,225 | 5,707,632 | 283,278 | 3,321,746 | ||||||||||||||||||||||||
Class R4 | 2,285,947 | 32,771,498 | 2,876,093 | 37,921,849 | 2,253,406 | 28,676,640 | 1,417,319 | 16,682,195 | ||||||||||||||||||||||||
| 3,416,602 | $48,845,006 | 5,942,375 | $78,252,232 | 3,265,318 | $41,476,172 | 2,293,631 | $26,900,287 | |||||||||||||||||||||||||
128
Table of Contents
Notes to Financial Statements – continued
| MFS Lifetime 2040 Fund | MFS Lifetime 2045 Fund | |||||||||||||||||||||||||||||||
| Year ended 4/30/15 | Year ended 4/30/14 | Year ended 4/30/15 | Year ended 4/30/14 | |||||||||||||||||||||||||||||
| Shares | Amount | Shares | Amount | Shares | Amount | Shares | Amount | |||||||||||||||||||||||||
| Shares sold | ||||||||||||||||||||||||||||||||
Class A | 583,250 | $8,414,065 | 691,589 | $9,200,772 | 119,960 | $1,545,769 | 96,772 | $1,159,584 | ||||||||||||||||||||||||
Class B | 50,882 | 729,309 | 62,014 | 830,050 | 5,948 | 76,332 | 13,568 | 158,128 | ||||||||||||||||||||||||
Class C | 225,672 | 3,189,270 | 339,767 | 4,520,085 | 39,578 | 505,854 | 15,954 | 193,367 | ||||||||||||||||||||||||
Class I | 144,525 | 2,088,956 | 141,748 | 1,914,401 | 76,535 | 974,570 | 8,895 | 108,137 | ||||||||||||||||||||||||
Class R1 | 137,610 | 1,957,577 | 209,748 | 2,773,664 | 3,026 | 38,714 | — | — | ||||||||||||||||||||||||
Class R2 | 1,512,759 | 21,670,755 | 1,570,773 | 20,849,297 | 82,677 | 1,055,100 | 77,261 | 927,491 | ||||||||||||||||||||||||
Class R3 | 1,219,616 | 17,510,820 | 1,076,572 | 14,402,821 | 422,963 | 5,375,445 | 215,838 | 2,560,787 | ||||||||||||||||||||||||
Class R4 | 4,192,848 | 60,948,116 | 2,671,022 | 35,717,800 | 1,810,885 | 23,183,716 | 1,059,619 | 12,528,073 | ||||||||||||||||||||||||
| 8,067,162 | $116,508,868 | 6,763,233 | $90,208,890 | 2,561,572 | $32,755,500 | 1,487,907 | $17,635,567 | |||||||||||||||||||||||||
| Shares issued to shareholders in reinvestment of distributions | ||||||||||||||||||||||||||||||||
Class A | 29,699 | $427,966 | 19,041 | $264,480 | 3,426 | $43,713 | 1,017 | $12,585 | ||||||||||||||||||||||||
Class B | 2,548 | 36,492 | 1,462 | 20,193 | 371 | 4,720 | 121 | 1,496 | ||||||||||||||||||||||||
Class C | 4,925 | 69,733 | 2,650 | 36,225 | 594 | 7,544 | 153 | 1,887 | ||||||||||||||||||||||||
Class I | 11,883 | 172,192 | 7,450 | 104,074 | 1,374 | 17,546 | 197 | 2,439 | ||||||||||||||||||||||||
Class R1 | 3,884 | 55,273 | 3,461 | 47,452 | 139 | 1,768 | 52 | 642 | ||||||||||||||||||||||||
Class R2 | 54,587 | 781,672 | 36,303 | 501,350 | 2,123 | 27,021 | 450 | 5,557 | ||||||||||||||||||||||||
Class R3 | 39,601 | 570,258 | 23,292 | 323,525 | 8,479 | 108,196 | 2,750 | 33,994 | ||||||||||||||||||||||||
Class R4 | 164,760 | 2,385,727 | 100,466 | 1,402,500 | 66,746 | 852,346 | 24,746 | 305,856 | ||||||||||||||||||||||||
| 311,887 | $4,499,313 | 194,125 | $2,699,799 | 83,252 | $1,062,854 | 29,486 | $364,456 | |||||||||||||||||||||||||
| Shares reacquired | ||||||||||||||||||||||||||||||||
Class A | (643,773 | ) | $(9,394,745 | ) | (265,999 | ) | $(3,526,390 | ) | (21,205 | ) | $(273,114 | ) | (4,713 | ) | $(58,246 | ) | ||||||||||||||||
Class B | (49,320 | ) | (705,984 | ) | (37,825 | ) | (503,658 | ) | (1,159 | ) | (15,129 | ) | (487 | ) | (6,003 | ) | ||||||||||||||||
Class C | (185,828 | ) | (2,622,868 | ) | (228,313 | ) | (2,989,384 | ) | (4,127 | ) | (51,817 | ) | (211 | ) | (2,577 | ) | ||||||||||||||||
Class I | (163,415 | ) | (2,357,619 | ) | (18,801 | ) | (250,379 | ) | (12,887 | ) | (163,524 | ) | (1 | ) | (13 | ) | ||||||||||||||||
Class R1 | (339,213 | ) | (4,816,117 | ) | (154,146 | ) | (2,055,588 | ) | (161 | ) | (2,099 | ) | — | — | ||||||||||||||||||
Class R2 | (1,340,472 | ) | (19,137,651 | ) | (1,320,512 | ) | (17,542,695 | ) | (20,601 | ) | (261,610 | ) | (16,938 | ) | (206,106 | ) | ||||||||||||||||
Class R3 | (804,710 | ) | (11,610,248 | ) | (518,653 | ) | (6,922,489 | ) | (125,111 | ) | (1,608,305 | ) | (61,463 | ) | (738,493 | ) | ||||||||||||||||
Class R4 | (1,790,053 | ) | (25,916,992 | ) | (1,199,763 | ) | (16,099,306 | ) | (276,732 | ) | (3,555,113 | ) | (188,572 | ) | (2,242,637 | ) | ||||||||||||||||
| (5,316,784 | ) | $(76,562,224 | ) | (3,744,012 | ) | $(49,889,889 | ) | (461,983 | ) | $(5,930,711 | ) | (272,385 | ) | $(3,254,075 | ) | |||||||||||||||||
| Net change | ||||||||||||||||||||||||||||||||
Class A | (30,824 | ) | $(552,714 | ) | 444,631 | $5,938,862 | 102,181 | $1,316,368 | 93,076 | $1,113,923 | ||||||||||||||||||||||
Class B | 4,110 | 59,817 | 25,651 | 346,585 | 5,160 | 65,923 | 13,202 | 153,621 | ||||||||||||||||||||||||
Class C | 44,769 | 636,135 | 114,104 | 1,566,926 | 36,045 | 461,581 | 15,896 | 192,677 | ||||||||||||||||||||||||
Class I | (7,007 | ) | (96,471 | ) | 130,397 | 1,768,096 | 65,022 | 828,592 | 9,091 | 110,563 | ||||||||||||||||||||||
Class R1 | (197,719 | ) | (2,803,267 | ) | 59,063 | 765,528 | 3,004 | 38,383 | 52 | 642 | ||||||||||||||||||||||
Class R2 | 226,874 | 3,314,776 | 286,564 | 3,807,952 | 64,199 | 820,511 | 60,773 | 726,942 | ||||||||||||||||||||||||
Class R3 | 454,507 | 6,470,830 | 581,211 | 7,803,857 | 306,331 | 3,875,336 | 157,125 | 1,856,288 | ||||||||||||||||||||||||
Class R4 | 2,567,555 | 37,416,851 | 1,571,725 | 21,020,994 | 1,600,899 | 20,480,949 | 895,793 | 10,591,292 | ||||||||||||||||||||||||
| 3,062,265 | $44,445,957 | 3,213,346 | $43,018,800 | 2,182,841 | $27,887,643 | 1,245,008 | $14,745,948 | |||||||||||||||||||||||||
129
Table of Contents
Notes to Financial Statements – continued
| MFS Lifetime 2050 Fund | MFS Lifetime 2055 Fund | |||||||||||||||||||||||||||||||
| Year ended 4/30/15 | Year ended 4/30/14 | Year ended 4/30/15 | Year ended 4/30/14 | |||||||||||||||||||||||||||||
| Shares | Amount | Shares | Amount | Shares | Amount | Shares | Amount | |||||||||||||||||||||||||
| Shares sold | ||||||||||||||||||||||||||||||||
Class A | 231,058 | $3,586,661 | 206,063 | $2,962,634 | 49,093 | $631,060 | 21,491 | $259,356 | ||||||||||||||||||||||||
Class B | 12,589 | 194,967 | 13,718 | 196,672 | 6,600 | 85,030 | 1,724 | 21,300 | ||||||||||||||||||||||||
Class C | 47,804 | 732,195 | 49,000 | 707,061 | 41,449 | 528,479 | 27,843 | 335,396 | ||||||||||||||||||||||||
Class I | 24,271 | 375,474 | 16,697 | 237,178 | 12,545 | 161,510 | 29,576 | 365,835 | ||||||||||||||||||||||||
Class R1 | 33,826 | 517,923 | 22,180 | 320,496 | 535 | 6,885 | — | — | ||||||||||||||||||||||||
Class R2 | 560,957 | 8,642,068 | 348,363 | 5,024,846 | 44,196 | 566,543 | 11,177 | 137,448 | ||||||||||||||||||||||||
Class R3 | 409,522 | 6,256,662 | 207,727 | 2,965,098 | 144,688 | 1,844,790 | 59,688 | 709,361 | ||||||||||||||||||||||||
Class R4 | 1,930,848 | 29,838,718 | 1,583,399 | 22,647,422 | 310,429 | 3,992,604 | 132,613 | 1,589,144 | ||||||||||||||||||||||||
| 3,250,875 | $50,144,668 | 2,447,147 | $35,061,407 | 609,535 | $7,816,901 | 284,112 | $3,417,840 | |||||||||||||||||||||||||
| Shares issued to shareholders in reinvestment of distributions | ||||||||||||||||||||||||||||||||
Class A | 8,208 | $126,645 | 3,040 | $45,447 | 1,170 | $14,964 | 317 | $3,919 | ||||||||||||||||||||||||
Class B | 633 | 9,683 | 185 | 2,738 | 190 | 2,433 | 49 | 600 | ||||||||||||||||||||||||
Class C | 1,277 | 19,452 | 376 | 5,563 | 679 | 8,625 | 290 | 3,568 | ||||||||||||||||||||||||
Class I | 1,649 | 25,380 | 699 | 10,415 | 480 | 6,151 | 247 | 3,049 | ||||||||||||||||||||||||
Class R1 | 1,015 | 15,476 | 168 | 2,481 | 108 | 1,377 | 48 | 593 | ||||||||||||||||||||||||
Class R2 | 13,094 | 200,213 | 3,442 | 51,039 | 688 | 8,798 | 115 | 1,417 | ||||||||||||||||||||||||
Class R3 | 8,763 | 134,515 | 3,123 | 46,435 | 1,957 | 25,030 | 643 | 7,949 | ||||||||||||||||||||||||
Class R4 | 72,308 | 1,112,095 | 29,902 | 445,554 | 5,378 | 68,887 | 1,205 | 14,907 | ||||||||||||||||||||||||
| 106,947 | $1,643,459 | 40,935 | $609,672 | 10,650 | $136,265 | 2,914 | $36,002 | |||||||||||||||||||||||||
| Shares reacquired | ||||||||||||||||||||||||||||||||
Class A | (190,046 | ) | $(2,971,630 | ) | (40,040 | ) | $(574,310 | ) | (5,697 | ) | $(73,059 | ) | (527 | ) | $(6,399 | ) | ||||||||||||||||
Class B | (5,203 | ) | (80,881 | ) | (2,698 | ) | (39,265 | ) | (39 | ) | (497 | ) | (8 | ) | (100 | ) | ||||||||||||||||
Class C | (11,569 | ) | (175,936 | ) | (4,701 | ) | (67,956 | ) | (2,671 | ) | (34,208 | ) | (77 | ) | (951 | ) | ||||||||||||||||
Class I | (10,069 | ) | (157,842 | ) | (2,313 | ) | (33,562 | ) | (21,354 | ) | (262,034 | ) | (1,951 | ) | (24,221 | ) | ||||||||||||||||
Class R1 | (48,577 | ) | (736,552 | ) | (3,289 | ) | (47,765 | ) | (28 | ) | (356 | ) | — | — | ||||||||||||||||||
Class R2 | (209,548 | ) | (3,216,382 | ) | (134,088 | ) | (1,921,994 | ) | (6,792 | ) | (86,011 | ) | (651 | ) | (7,641 | ) | ||||||||||||||||
Class R3 | (170,429 | ) | (2,633,559 | ) | (84,831 | ) | (1,201,833 | ) | (39,236 | ) | (508,782 | ) | (10,560 | ) | (127,151 | ) | ||||||||||||||||
Class R4 | (821,641 | ) | (12,717,497 | ) | (553,127 | ) | (7,977,816 | ) | (56,891 | ) | (733,016 | ) | (22,870 | ) | (272,044 | ) | ||||||||||||||||
| (1,467,082 | ) | $(22,690,279 | ) | (825,087 | ) | $(11,864,501 | ) | (132,708 | ) | $(1,697,963 | ) | (36,644 | ) | $(438,507 | ) | |||||||||||||||||
| Net change | ||||||||||||||||||||||||||||||||
Class A | 49,220 | $741,676 | 169,063 | $2,433,771 | 44,566 | $572,965 | 21,281 | $256,876 | ||||||||||||||||||||||||
Class B | 8,019 | 123,769 | 11,205 | 160,145 | 6,751 | 86,966 | 1,765 | 21,800 | ||||||||||||||||||||||||
Class C | 37,512 | 575,711 | 44,675 | 644,668 | 39,457 | 502,896 | 28,056 | 338,013 | ||||||||||||||||||||||||
Class I | 15,851 | 243,012 | 15,083 | 214,031 | (8,329 | ) | (94,373 | ) | 27,872 | 344,663 | ||||||||||||||||||||||
Class R1 | (13,736 | ) | (203,153 | ) | 19,059 | 275,212 | 615 | 7,906 | 48 | 593 | ||||||||||||||||||||||
Class R2 | 364,503 | 5,625,899 | 217,717 | 3,153,891 | 38,092 | 489,330 | 10,641 | 131,224 | ||||||||||||||||||||||||
Class R3 | 247,856 | 3,757,618 | 126,019 | 1,809,700 | 107,409 | 1,361,038 | 49,771 | 590,159 | ||||||||||||||||||||||||
Class R4 | 1,181,515 | 18,233,316 | 1,060,174 | 15,115,160 | 258,916 | 3,328,475 | 110,948 | 1,332,007 | ||||||||||||||||||||||||
| 1,890,740 | $29,097,848 | 1,662,995 | $23,806,578 | 487,477 | $6,255,203 | 250,382 | $3,015,335 | |||||||||||||||||||||||||
| (6) | Line of Credit |
Each fund and certain other funds managed by MFS participate in a $1.25 billion unsecured committed line of credit, subject to a $1 billion sublimit, provided by a syndication of banks under a credit agreement. Borrowings may be made for temporary financing needs. Interest is charged to each fund, based on its borrowings, generally at a rate equal to the higher of the Federal Reserve funds rate or one month LIBOR plus an agreed upon spread. A commitment fee, based on the average daily, unused portion of the committed line of credit, is allocated among the participating funds at the end of each calendar quarter. In addition, each fund and
130
Table of Contents
Notes to Financial Statements – continued
other funds managed by MFS have established unsecured uncommitted borrowing arrangements with certain banks for temporary financing needs. Interest is charged to each fund, based on its borrowings, at a rate equal to the Federal Reserve funds rate plus an agreed upon spread. For the year ended April 30, 2015, each fund’s commitment fee and interest expense were equal to the following and are included in “Miscellaneous” expense in the Statements of Operations:
MFS Lifetime Income Fund | MFS Lifetime 2015 Fund | MFS Lifetime 2020 Fund | MFS Lifetime 2025 Fund | MFS Lifetime 2030 Fund | ||||||
| Commitment Fee | $1,506 | $169 | $1,263 | $359 | $1,289 | |||||
| Interest Expense | — | — | — | — | — | |||||
MFS Lifetime 2035 Fund | MFS Lifetime 2040 Fund | MFS Lifetime 2045 Fund | MFS Lifetime 2050 Fund | MFS Lifetime 2055 Fund | ||||||
| Commitment Fee | $264 | $948 | $137 | $246 | $24 | |||||
| Interest Expense | — | — | — | — | — | |||||
| (7) | Transactions in Underlying Affiliated Funds - Affiliated Issuers |
An affiliated issuer may be considered one in which the fund owns 5% or more of the outstanding voting securities, or a company which is under common control. For the purposes of this report, each fund assumes the following to be affiliated issuers:
| Lifetime Income Fund | ||||||||||||||||
Underlying Affiliated Funds | Beginning Share/Par Amount | Acquisitions Share/Par Amount | Dispositions Share/Par Amount | Ending Share/Par Amount | ||||||||||||
| MFS Absolute Return Fund | 703,201 | 508,792 | (63,246) | 1,148,747 | ||||||||||||
| MFS Commodity Strategy Fund | 366,259 | 503,234 | (70,755) | 798,738 | ||||||||||||
| MFS Emerging Markets Debt Fund | 228,257 | 571,122 | (60,715) | 738,664 | ||||||||||||
| MFS Emerging Markets Debt Local Currency Fund | — | 754,323 | (41,369) | 712,954 | ||||||||||||
| MFS Global Bond Fund | 1,783,306 | 1,564,724 | (184,662) | 3,163,368 | ||||||||||||
| MFS Global Real Estate Fund | 223,840 | 168,121 | (56,759) | 335,202 | ||||||||||||
| MFS Government Securities Fund | 3,391,560 | 2,421,841 | (409,496) | 5,403,905 | ||||||||||||
| MFS Growth Fund | 202,682 | 151,694 | (60,405) | 293,971 | ||||||||||||
| MFS High Income Fund | 2,806,788 | 2,258,506 | (390,968) | 4,674,326 | ||||||||||||
| MFS Inflation-Adjusted Bond Fund | 3,235,720 | 2,450,990 | (469,728) | 5,216,982 | ||||||||||||
| MFS Institutional Money Market Portfolio | 13 | 159,488,220 | (159,028,914) | 459,319 | ||||||||||||
| MFS International Growth Fund | 120,188 | 104,952 | (31,244) | 193,896 | ||||||||||||
| MFS International Value Fund | 99,184 | 78,747 | (26,987) | 150,944 | ||||||||||||
| MFS Limited Maturity Fund | 11,254,375 | 8,199,728 | (1,128,726) | 18,325,377 | ||||||||||||
| MFS Mid Cap Growth Fund | 733,199 | 589,955 | (250,469) | 1,072,685 | ||||||||||||
| MFS Mid Cap Value Fund | 501,592 | 429,051 | (155,057) | 775,586 | ||||||||||||
| MFS New Discovery Fund | 127,685 | 126,927 | (49,890) | 204,722 | ||||||||||||
| MFS New Discovery Value Fund | 258,369 | 246,360 | (93,474) | 411,255 | ||||||||||||
| MFS Research Fund | 368,343 | 293,558 | (104,762) | 557,139 | ||||||||||||
| MFS Research International Fund | 572,576 | 505,696 | (151,535) | 926,737 | ||||||||||||
| MFS Total Return Bond Fund | 6,881,078 | 4,777,693 | (1,624,751) | 10,034,020 | ||||||||||||
| MFS Value Fund | 408,212 | 322,048 | (108,804) | 621,456 | ||||||||||||
Underlying Affiliated Funds | Realized Gain (Loss) | Capital Gain Distributions | Dividend Income | Ending Value | ||||||||||||
| MFS Absolute Return Fund | $(32,382) | $— | $75,591 | $10,993,508 | ||||||||||||
| MFS Commodity Strategy Fund | (189,762) | — | 10,895 | 5,599,154 | ||||||||||||
| MFS Emerging Markets Debt Fund | (72,196) | — | 320,316 | 11,043,034 | ||||||||||||
| MFS Emerging Markets Debt Local Currency Fund | (11,819) | — | 120,112 | 5,525,393 | ||||||||||||
| MFS Global Bond Fund | (278,310) | — | 132,985 | 27,616,199 | ||||||||||||
| MFS Global Real Estate Fund | 13,405 | 71,905 | 128,294 | 5,440,335 | ||||||||||||
| MFS Government Securities Fund | (157,808) | 1,108,573 | 55,011,749 | |||||||||||||
| MFS Growth Fund | 108,793 | 705,316 | — | 21,633,312 | ||||||||||||
| MFS High Income Fund | (50,788) | — | 827,131 | 16,593,858 | ||||||||||||
| MFS Inflation-Adjusted Bond Fund | (395,685) | — | 695,497 | 55,039,160 | ||||||||||||
| MFS Institutional Money Market Portfolio | — | — | 1,435 | 459,319 | ||||||||||||
| MFS International Growth Fund | (38,503) | 42,920 | 74,796 | 5,491,137 | ||||||||||||
| MFS International Value Fund | (5,327) | 52,952 | 107,080 | 5,462,678 | ||||||||||||
131
Table of Contents
Notes to Financial Statements – continued
| Lifetime Income Fund | ||||||||||||||||
Underlying Affiliated Funds | Realized Gain (Loss) | Capital Gain Distributions | Dividend Income | Ending Value | ||||||||||||
| MFS Limited Maturity Fund | $(174,195) | $— | $1,288,328 | $110,135,517 | ||||||||||||
| MFS Mid Cap Growth Fund | 105,727 | 911,483 | — | 16,197,548 | ||||||||||||
| MFS Mid Cap Value Fund | 22,823 | 808,252 | 103,245 | 16,318,320 | ||||||||||||
| MFS New Discovery Fund | (46,269) | 324,559 | — | 5,312,541 | ||||||||||||
| MFS New Discovery Value Fund | (3,896) | 260,897 | 20,226 | 5,428,566 | ||||||||||||
| MFS Research Fund | (163,474) | 892,118 | 179,605 | 21,778,577 | ||||||||||||
| MFS Research International Fund | 76,580 | — | 362,688 | 16,449,581 | ||||||||||||
| MFS Total Return Bond Fund | (133,501) | 360,200 | 2,970,002 | 109,972,863 | ||||||||||||
MFS Value Fund | 53,620 | 483,481 | 443,768 | 21,831,740 | ||||||||||||
| $(1,372,967) | $4,914,083 | $8,970,567 | $549,334,089 | |||||||||||||
| Lifetime 2015 Fund | ||||||||||||||||
Underlying Affiliated Funds | Beginning Share/Par Amount | Acquisitions Share/Par Amount | Dispositions Share/Par Amount | Ending Share/Par Amount | ||||||||||||
| MFS Absolute Return Fund | 95,294 | 26,522 | (13,388) | 108,428 | ||||||||||||
| MFS Commodity Strategy Fund | 49,516 | 35,574 | (8,967) | 76,123 | ||||||||||||
| MFS Emerging Markets Debt Fund | 48,618 | 41,335 | (17,019) | 72,934 | ||||||||||||
| MFS Emerging Markets Debt Local Currency Fund | — | 83,050 | (9,317) | 73,733 | ||||||||||||
| MFS Global Bond Fund | 242,013 | 95,474 | (38,343) | 299,144 | ||||||||||||
| MFS Global Real Estate Fund | 30,310 | 9,808 | (8,380) | 31,738 | ||||||||||||
| MFS Government Securities Fund | 460,028 | 127,810 | (78,153) | 509,685 | ||||||||||||
| MFS Growth Fund | 31,336 | 8,306 | (10,626) | 29,016 | ||||||||||||
| MFS High Income Fund | 453,225 | 115,845 | (101,681) | 467,389 | ||||||||||||
| MFS Inflation-Adjusted Bond Fund | 438,507 | 140,303 | (87,504) | 491,306 | ||||||||||||
| MFS Institutional Money Market Portfolio | 13 | 14,298,643 | (14,166,518) | 132,138 | ||||||||||||
| MFS International Growth Fund | 20,957 | 5,984 | (6,956) | 19,985 | ||||||||||||
| MFS International Value Fund | 17,267 | 3,975 | (5,692) | 15,550 | ||||||||||||
| MFS Limited Maturity Fund | 1,308,246 | 490,706 | (144,518) | 1,654,434 | ||||||||||||
| MFS Mid Cap Growth Fund | 108,493 | 35,526 | (39,598) | 104,421 | ||||||||||||
| MFS Mid Cap Value Fund | 74,485 | 25,625 | (24,647) | 75,463 | ||||||||||||
| MFS New Discovery Fund | 17,044 | 9,885 | (7,553) | 19,376 | ||||||||||||
| MFS New Discovery Value Fund | 34,788 | 17,524 | (13,398) | 38,914 | ||||||||||||
| MFS Research Fund | 57,058 | 17,059 | (19,122) | 54,995 | ||||||||||||
| MFS Research International Fund | 85,107 | 30,794 | (25,516) | 90,385 | ||||||||||||
| MFS Total Return Bond Fund | 872,946 | 266,835 | (214,001) | 925,780 | ||||||||||||
| MFS Value Fund | 63,210 | 17,319 | (19,206) | 61,323 | ||||||||||||
Underlying Affiliated Funds | Realized Gain (Loss) | Capital Gain Distributions | Dividend Income | Ending Value | ||||||||||||
| MFS Absolute Return Fund | $(2,290) | $— | $7,673 | $1,037,654 | ||||||||||||
| MFS Commodity Strategy Fund | (16,070) | — | 1,170 | 533,624 | ||||||||||||
| MFS Emerging Markets Debt Fund | (19,165) | — | 39,475 | 1,090,359 | ||||||||||||
| MFS Emerging Markets Debt Local Currency Fund | (2,780) | — | 13,164 | 571,428 | ||||||||||||
| MFS Global Bond Fund | (41,802) | — | 17,951 | 2,611,531 | ||||||||||||
| MFS Global Real Estate Fund | 2,865 | 7,690 | 13,721 | 515,101 | ||||||||||||
| MFS Government Securities Fund | (19,214) | — | 113,089 | 5,188,593 | ||||||||||||
| MFS Growth Fund | 19,595 | 82,429 | — | 2,135,288 | ||||||||||||
| MFS High Income Fund | (6,412) | — | 94,648 | 1,659,232 | ||||||||||||
| MFS Inflation-Adjusted Bond Fund | (64,796) | — | 72,458 | 5,183,275 | ||||||||||||
| MFS Institutional Money Market Portfolio | — | — | 112 | 132,138 | ||||||||||||
| MFS International Growth Fund | 1,310 | 5,355 | 9,332 | 565,984 | ||||||||||||
| MFS International Value Fund | 6,056 | 6,607 | 13,359 | 562,763 | ||||||||||||
| MFS Limited Maturity Fund | (12,458) | — | 119,174 | 9,943,148 | ||||||||||||
| MFS Mid Cap Growth Fund | 14,306 | 102,749 | — | 1,576,764 | ||||||||||||
| MFS Mid Cap Value Fund | 7,313 | 91,140 | 11,643 | 1,587,736 | ||||||||||||
| MFS New Discovery Fund | (6,656) | 34,877 | — | 502,820 | ||||||||||||
132
Table of Contents
Notes to Financial Statements – continued
| Lifetime 2015 Fund – continued | ||||||||||||||||
Underlying Affiliated Funds | Realized Gain (Loss) | Capital Gain Distributions | Dividend Income | Ending Value | ||||||||||||
| MFS New Discovery Value Fund | $(444) | $30,393 | $2,165 | $513,663 | ||||||||||||
| MFS Research Fund | 15,424 | 103,151 | 20,766 | 2,149,768 | ||||||||||||
| MFS Research International Fund | (7,490) | — | 41,066 | 1,604,332 | ||||||||||||
| MFS Total Return Bond Fund | (18,341) | 37,149 | 300,996 | 10,146,549 | ||||||||||||
MFS Value Fund | 12,151 | 56,137 | 48,596 | 2,154,267 | ||||||||||||
| $(138,898) | $557,677 | $940,558 | $51,966,017 | |||||||||||||
| Lifetime 2020 Fund | ||||||||||||||||
Underlying Affiliated Funds | Beginning Share/Par Amount | Acquisitions Share/Par Amount | Dispositions Share/Par Amount | Ending Share/Par Amount | ||||||||||||
| MFS Absolute Return Fund | 625,802 | 157,625 | (57,227) | 726,200 | ||||||||||||
| MFS Commodity Strategy Fund | 604,263 | 154,579 | (126,360) | 632,482 | ||||||||||||
| MFS Emerging Markets Debt Fund | 713,032 | 122,516 | (99,062) | 736,486 | ||||||||||||
| MFS Emerging Markets Debt Local Currency Fund | — | 994,023 | (41,719) | 952,304 | ||||||||||||
| MFS Global Bond Fund | 1,856,838 | 418,077 | (181,136) | 2,093,779 | ||||||||||||
| MFS Global Real Estate Fund | 301,966 | 30,646 | (90,171) | 242,441 | ||||||||||||
| MFS Government Securities Fund | 3,526,552 | 538,368 | (498,100) | 3,566,820 | ||||||||||||
| MFS Growth Fund | 347,152 | 43,528 | (88,279) | 302,401 | ||||||||||||
| MFS High Income Fund | 4,867,914 | 906,992 | (612,902) | 5,162,004 | ||||||||||||
| MFS Inflation-Adjusted Bond Fund | 2,879,181 | 813,163 | (339,755) | 3,352,589 | ||||||||||||
| MFS Institutional Money Market Portfolio | 10 | 39,920,944 | (39,805,192) | 115,762 | ||||||||||||
| MFS International Growth Fund | 288,177 | 41,530 | (58,292) | 271,415 | ||||||||||||
| MFS International New Discovery Fund | 35,050 | 475 | (24,076) | 11,449 | ||||||||||||
| MFS International Value Fund | 237,584 | 25,537 | (52,319) | 210,802 | ||||||||||||
| MFS Limited Maturity Fund | 4,164,965 | 1,679,662 | (350,059) | 5,494,568 | ||||||||||||
| MFS Mid Cap Growth Fund | 1,237,604 | 178,688 | (398,434) | 1,017,858 | ||||||||||||
| MFS Mid Cap Value Fund | 849,726 | 123,534 | (240,071) | 733,189 | ||||||||||||
| MFS New Discovery Fund | 150,246 | 47,510 | (54,277) | 143,479 | ||||||||||||
| MFS New Discovery Value Fund | 305,464 | 75,711 | (95,218) | 285,957 | ||||||||||||
| MFS Research Fund | 631,387 | 96,527 | (155,851) | 572,063 | ||||||||||||
| MFS Research International Fund | 911,362 | 147,891 | (193,608) | 865,645 | ||||||||||||
| MFS Total Return Bond Fund | 5,061,653 | 1,022,118 | (1,326,529) | 4,757,242 | ||||||||||||
| MFS Value Fund | 700,552 | 93,243 | (156,947) | 636,848 | ||||||||||||
Underlying Affiliated Funds | Realized Gain (Loss) | Capital Gain Distributions | Dividend Income | Ending Value | ||||||||||||
| MFS Absolute Return Fund | $(28,114) | $— | $51,082 | $6,949,737 | ||||||||||||
| MFS Commodity Strategy Fund | (287,801) | — | 10,825 | 4,433,702 | ||||||||||||
| MFS Emerging Markets Debt Fund | (105,942) | — | 503,487 | 11,010,462 | ||||||||||||
| MFS Emerging Markets Debt Local Currency Fund | (12,035) | — | 163,023 | 7,380,358 | ||||||||||||
| MFS Global Bond Fund | (218,492) | — | 86,502 | 18,278,688 | ||||||||||||
| MFS Global Real Estate Fund | 85,799 | 62,674 | 111,824 | 3,934,815 | ||||||||||||
| MFS Government Securities Fund | (198,635) | — | 829,433 | 36,310,229 | ||||||||||||
| MFS Growth Fund | 751,756 | 853,465 | — | 22,253,700 | ||||||||||||
| MFS High Income Fund | (43,693) | — | 1,029,280 | 18,325,116 | ||||||||||||
| MFS Inflation-Adjusted Bond Fund | (309,475) | — | 485,360 | 35,369,813 | ||||||||||||
| MFS Institutional Money Market Portfolio | — | — | 205 | 115,762 | ||||||||||||
| MFS International Growth Fund | 39,573 | 70,078 | 122,123 | 7,686,483 | ||||||||||||
| MFS International New Discovery Fund | 240,382 | — | 8,297 | 342,431 | ||||||||||||
| MFS International Value Fund | 153,472 | 86,375 | 174,670 | 7,628,920 | ||||||||||||
| MFS Limited Maturity Fund | (48,182) | — | 389,370 | 33,022,351 | ||||||||||||
| MFS Mid Cap Growth Fund | 889,160 | 1,027,866 | — | 15,369,655 | ||||||||||||
| MFS Mid Cap Value Fund | 600,933 | 907,851 | 115,968 | 15,426,302 | ||||||||||||
| MFS New Discovery Fund | 4,121 | 264,383 | — | 3,723,275 | ||||||||||||
| MFS New Discovery Value Fund | 26,416 | 246,324 | 16,493 | 3,774,634 | ||||||||||||
133
Table of Contents
Notes to Financial Statements – continued
| Lifetime 2020 Fund – continued | ||||||||||||||||
Underlying Affiliated Funds | Realized Gain (Loss) | Capital Gain Distributions | Dividend Income | Ending Value | ||||||||||||
| MFS Research Fund | $615,339 | $1,061,260 | $213,658 | $22,361,929 | ||||||||||||
| MFS Research International Fund | 63,439 | — | 393,960 | 15,365,198 | ||||||||||||
| MFS Total Return Bond Fund | (158,181) | 188,380 | 1,653,510 | 52,139,374 | ||||||||||||
MFS Value Fund | 506,044 | 576,141 | 520,859 | 22,372,472 | ||||||||||||
| $2,565,884 | $5,344,797 | $6,879,929 | $363,575,406 | |||||||||||||
| Lifetime 2025 Fund | ||||||||||||||||
Underlying Affiliated Funds | Beginning Share/Par Amount | Acquisitions Share/Par Amount | Dispositions Share/Par Amount | Ending Share/Par Amount | ||||||||||||
| MFS Absolute Return Fund | 88,978 | 52,762 | (6,292) | 135,448 | ||||||||||||
| MFS Commodity Strategy Fund | 304,017 | 314,181 | (31,030) | 587,168 | ||||||||||||
| MFS Emerging Markets Debt Fund | 172,933 | 99,282 | (10,622) | 261,593 | ||||||||||||
| MFS Emerging Markets Debt Local Currency Fund | — | 346,155 | (7,651) | 338,504 | ||||||||||||
| MFS Emerging Markets Equity Fund | 7,884 | 679 | (4,601) | 3,962 | ||||||||||||
| MFS Global Bond Fund | 424,953 | 345,590 | (61,421) | 709,122 | ||||||||||||
| MFS Global Real Estate Fund | 129,028 | 53,219 | (16,979) | 165,268 | ||||||||||||
| MFS Government Securities Fund | 614,035 | 582,952 | (32,112) | 1,164,875 | ||||||||||||
| MFS Growth Fund | 113,536 | 47,665 | (17,607) | 143,594 | ||||||||||||
| MFS High Income Fund | 1,182,307 | 728,994 | (71,844) | 1,839,457 | ||||||||||||
| MFS Inflation-Adjusted Bond Fund | 409,077 | 458,967 | (28,374) | 839,670 | ||||||||||||
| MFS Institutional Money Market Portfolio | 13 | 37,184,260 | (37,008,762) | 175,511 | ||||||||||||
| MFS International Growth Fund | 108,158 | 52,287 | (15,397) | 145,048 | ||||||||||||
| MFS International New Discovery Fund | 37,375 | 15,325 | (5,536) | 47,164 | ||||||||||||
| MFS International Value Fund | 89,122 | 38,096 | (14,236) | 112,982 | ||||||||||||
| MFS Mid Cap Growth Fund | 468,109 | 219,234 | (79,359) | 607,984 | ||||||||||||
| MFS Mid Cap Value Fund | 319,760 | 161,752 | (43,364) | 438,148 | ||||||||||||
| MFS New Discovery Fund | 53,161 | 35,241 | (13,139) | 75,263 | ||||||||||||
| MFS New Discovery Value Fund | 107,660 | 60,519 | (18,070) | 150,109 | ||||||||||||
| MFS Research Fund | 186,460 | 98,999 | (22,590) | 262,869 | ||||||||||||
| MFS Research International Fund | 303,295 | 179,106 | (39,315) | 443,086 | ||||||||||||
| MFS Total Return Bond Fund | 746,649 | 528,109 | (378,589) | 896,169 | ||||||||||||
| MFS Value Fund | 227,861 | 105,045 | (30,101) | 302,805 | ||||||||||||
Underlying Affiliated Funds | Realized Gain (Loss) | Capital Gain Distributions | Dividend Income | Ending Value | ||||||||||||
| MFS Absolute Return Fund | $(1,070) | $— | $8,391 | $1,296,235 | ||||||||||||
| MFS Commodity Strategy Fund | (58,691) | — | 8,237 | 4,116,046 | ||||||||||||
| MFS Emerging Markets Debt Fund | (11,054) | — | 148,147 | 3,910,808 | ||||||||||||
| MFS Emerging Markets Debt Local Currency Fund | (2,761) | — | 55,988 | 2,623,409 | ||||||||||||
| MFS Emerging Markets Equity Fund | (10,121) | 4,046 | 1,898 | 119,287 | ||||||||||||
| MFS Global Bond Fund | (80,028) | — | 50,865 | 6,190,639 | ||||||||||||
| MFS Global Real Estate Fund | 2,738 | 37,319 | 66,586 | 2,682,306 | ||||||||||||
| MFS Government Securities Fund | (8,018) | — | 198,976 | 11,858,425 | ||||||||||||
| MFS Growth Fund | 13,591 | 360,766 | — | 10,567,080 | ||||||||||||
| MFS High Income Fund | (5,493) | — | 302,466 | 6,530,074 | ||||||||||||
| MFS Inflation-Adjusted Bond Fund | (22,328) | — | 76,996 | 8,858,523 | ||||||||||||
| MFS Institutional Money Market Portfolio | — | — | 223 | 175,511 | ||||||||||||
| MFS International Growth Fund | (10,002) | 34,563 | 60,233 | 4,107,773 | ||||||||||||
| MFS International New Discovery Fund | (755) | — | 19,068 | 1,410,688 | ||||||||||||
| MFS International Value Fund | (3,403) | 42,480 | 85,905 | 4,088,817 | ||||||||||||
| MFS Mid Cap Growth Fund | 3,422 | 533,314 | — | 9,180,566 | ||||||||||||
| MFS Mid Cap Value Fund | (2,716) | 474,986 | 60,674 | 9,218,633 | ||||||||||||
| MFS New Discovery Fund | (19,961) | 123,260 | — | 1,953,070 | ||||||||||||
| MFS New Discovery Value Fund | (3,104) | 102,272 | 7,684 | 1,981,444 | ||||||||||||
| MFS Research Fund | 1,970 | 430,307 | 86,631 | 10,275,541 | ||||||||||||
| MFS Research International Fund | (26,498) | — | 178,977 | 7,864,769 | ||||||||||||
| MFS Total Return Bond Fund | (30,294) | 31,137 | 281,751 | 9,822,016 | ||||||||||||
MFS Value Fund | 7,811 | 246,379 | 206,886 | 10,637,554 | ||||||||||||
| $(266,765) | $2,420,829 | $1,906,582 | $129,469,214 | |||||||||||||
134
Table of Contents
Notes to Financial Statements – continued
| Lifetime 2030 Fund | ||||||||||||||||
Underlying Affiliated Funds | Beginning Share/Par Amount | Acquisitions Share/Par Amount | Dispositions Share/Par Amount | Ending Share/Par Amount | ||||||||||||
| MFS Absolute Return Fund | 302,439 | 133,579 | (28,225) | 407,793 | ||||||||||||
| MFS Commodity Strategy Fund | 1,532,609 | 998,969 | (116,736) | 2,414,842 | ||||||||||||
| MFS Emerging Markets Debt Fund | 589,143 | 242,343 | (44,964) | 786,522 | ||||||||||||
| MFS Emerging Markets Debt Local Currency Fund | — | 1,030,388 | (13,927) | 1,016,461 | ||||||||||||
| MFS Emerging Markets Equity Fund | 125,354 | 33,656 | (17,330) | 141,680 | ||||||||||||
| MFS Global Bond Fund | 1,226,902 | 508,623 | (838,010) | 897,515 | ||||||||||||
| MFS Global Real Estate Fund | 741,369 | 133,934 | (103,304) | 771,999 | ||||||||||||
| MFS Growth Fund | 565,961 | 99,554 | (57,852) | 607,663 | ||||||||||||
| MFS High Income Fund | 4,026,075 | 1,838,997 | (335,521) | 5,529,551 | ||||||||||||
| MFS Inflation-Adjusted Bond Fund | 1,508,842 | 571,009 | (188,895) | 1,890,956 | ||||||||||||
| MFS Institutional Money Market Portfolio | 16 | 47,839,928 | (47,514,658) | 325,286 | ||||||||||||
| MFS International Growth Fund | 641,094 | 143,507 | (49,625) | 734,976 | ||||||||||||
| MFS International New Discovery Fund | 265,066 | 43,556 | (22,458) | 286,164 | ||||||||||||
| MFS International Value Fund | 529,115 | 94,284 | (51,327) | 572,072 | ||||||||||||
| MFS Mid Cap Growth Fund | 2,237,730 | 473,799 | (285,366) | 2,426,163 | ||||||||||||
| MFS Mid Cap Value Fund | 1,537,837 | 340,137 | (133,220) | 1,744,754 | ||||||||||||
| MFS New Discovery Fund | 263,035 | 101,011 | (50,116) | 313,930 | ||||||||||||
| MFS New Discovery Value Fund | 535,497 | 162,420 | (77,107) | 620,810 | ||||||||||||
| MFS Research Fund | 740,152 | 151,648 | (61,355) | 830,445 | ||||||||||||
| MFS Research International Fund | 1,370,185 | 361,249 | (109,040) | 1,622,394 | ||||||||||||
| MFS Total Return Bond Fund | 919,854 | 308,745 | (120,099) | 1,108,500 | ||||||||||||
| MFS Value Fund | 1,142,829 | 227,757 | (93,799) | 1,276,787 | ||||||||||||
Underlying Affiliated Funds | Realized Gain (Loss) | Capital Gain Distributions | Dividend Income | Ending Value | ||||||||||||
| MFS Absolute Return Fund | $(11,684) | $— | $26,524 | $3,902,580 | ||||||||||||
| MFS Commodity Strategy Fund | (203,500) | — | 35,280 | 16,928,045 | ||||||||||||
| MFS Emerging Markets Debt Fund | (48,660) | — | 470,183 | 11,758,509 | ||||||||||||
| MFS Emerging Markets Debt Local Currency Fund | (3,500) | — | 165,512 | 7,877,576 | ||||||||||||
| MFS Emerging Markets Equity Fund | (25,792) | 90,406 | 42,420 | 4,265,987 | ||||||||||||
| MFS Global Bond Fund | (936,325) | — | 44,888 | 7,835,305 | ||||||||||||
| MFS Global Real Estate Fund | 49,231 | 179,772 | 320,755 | 12,529,552 | ||||||||||||
| MFS Growth Fund | 108,686 | 1,564,452 | — | 44,717,952 | ||||||||||||
| MFS High Income Fund | (33,831) | — | 961,051 | 19,629,906 | ||||||||||||
| MFS Inflation-Adjusted Bond Fund | (161,200) | — | 258,148 | 19,949,588 | ||||||||||||
| MFS Institutional Money Market Portfolio | — | — | 277 | 325,286 | ||||||||||||
| MFS International Growth Fund | (48,735) | 176,886 | 308,255 | 20,814,529 | ||||||||||||
| MFS International New Discovery Fund | (3,999) | — | 117,067 | 8,559,178 | ||||||||||||
| MFS International Value Fund | (17,925) | 217,380 | 439,592 | 20,703,271 | ||||||||||||
| MFS Mid Cap Growth Fund | 71,893 | 2,191,324 | — | 36,635,061 | ||||||||||||
| MFS Mid Cap Value Fund | 2,224 | 1,943,565 | 248,268 | 36,709,625 | ||||||||||||
| MFS New Discovery Fund | (56,508) | 524,858 | — | 8,146,471 | ||||||||||||
| MFS New Discovery Value Fund | (9,767) | 464,198 | 32,767 | 8,194,688 | ||||||||||||
| MFS Research Fund | 67,621 | 1,416,243 | 285,124 | 32,462,088 | ||||||||||||
| MFS Research International Fund | (85,101) | — | 678,469 | 28,797,499 | ||||||||||||
| MFS Total Return Bond Fund | (17,507) | 42,250 | 331,469 | 12,149,161 | ||||||||||||
MFS Value Fund | 34,564 | 1,061,533 | 939,980 | 44,853,510 | ||||||||||||
| $(1,329,815) | $9,872,867 | $5,706,029 | $407,745,367 | |||||||||||||
| Lifetime 2035 Fund | ||||||||||||||||
Underlying Affiliated Funds | Beginning Share/Par Amount | Acquisitions Share/Par Amount | Dispositions Share/Par Amount | Ending Share/Par Amount | ||||||||||||
| MFS Absolute Return Fund | 22,555 | 29,814 | (1,394) | 50,975 | ||||||||||||
| MFS Commodity Strategy Fund | 305,918 | 436,324 | (40,120) | 702,122 | ||||||||||||
| MFS Emerging Markets Debt Fund | 43,881 | 56,844 | (2,550) | 98,175 | ||||||||||||
| MFS Emerging Markets Debt Local Currency | — | 129,426 | (2,774) | 126,652 | ||||||||||||
135
Table of Contents
Notes to Financial Statements – continued
| Lifetime 2035 Fund – continued | ||||||||||||||||
Underlying Affiliated Funds | Beginning Share/Par Amount | Acquisitions Share/Par Amount | Dispositions Share/Par Amount | Ending Share/Par Amount | ||||||||||||
| MFS Emerging Markets Equity Fund | 32,246 | 26,390 | (4,180) | 54,456 | ||||||||||||
| MFS Global Bond Fund | 91,339 | 108,246 | (87,411) | 112,174 | ||||||||||||
| MFS Global Real Estate Fund | 172,427 | 118,405 | (23,859) | 266,973 | ||||||||||||
| MFS Growth Fund | 105,750 | 69,257 | (9,963) | 165,044 | ||||||||||||
| MFS High Income Fund | 299,939 | 404,619 | (14,644) | 689,914 | ||||||||||||
| MFS Inflation-Adjusted Bond Fund | 197,079 | 197,934 | (26,697) | 368,316 | ||||||||||||
| MFS Institutional Money Market Portfolio | 11 | 38,518,042 | (38,390,456) | 127,597 | ||||||||||||
| MFS International Growth Fund | 135,872 | 104,319 | (11,076) | 229,115 | ||||||||||||
| MFS International New Discovery Fund | 67,914 | 47,714 | (5,595) | 110,033 | ||||||||||||
| MFS International Value Fund | 112,208 | 77,790 | (11,354) | 178,644 | ||||||||||||
| MFS Mid Cap Growth Fund | 422,036 | 282,286 | (39,640) | 664,682 | ||||||||||||
| MFS Mid Cap Value Fund | 289,184 | 209,808 | (18,912) | 480,080 | ||||||||||||
| MFS New Discovery Fund | 52,942 | 48,095 | (10,168) | 90,869 | ||||||||||||
| MFS New Discovery Value Fund | 107,516 | 86,916 | (12,708) | 181,724 | ||||||||||||
| MFS Research Fund | 132,224 | 92,856 | (8,553) | 216,527 | ||||||||||||
| MFS Research International Fund | 261,818 | 214,087 | (23,229) | 452,676 | ||||||||||||
| MFS Total Return Bond Fund | 150,295 | 133,549 | (18,191) | 265,653 | ||||||||||||
| MFS Value Fund | 213,150 | 149,534 | (14,033) | 348,651 | ||||||||||||
Underlying Affiliated Funds | Realized Gain (Loss) | Capital Gain Distributions | Dividend Income | Ending Value | ||||||||||||
| MFS Absolute Return Fund | $(247) | $— | $2,682 | $487,831 | ||||||||||||
| MFS Commodity Strategy Fund | (77,206) | — | 9,299 | 4,921,874 | ||||||||||||
| MFS Emerging Markets Debt Fund | (2,770) | — | 46,717 | 1,467,716 | ||||||||||||
| MFS Emerging Markets Debt Local Currency | (916) | — | 19,858 | 981,552 | ||||||||||||
| MFS Emerging Markets Equity Fund | (10,829) | 31,136 | 14,609 | 1,639,670 | ||||||||||||
| MFS Global Bond Fund | (68,548) | — | 10,475 | 979,280 | ||||||||||||
| MFS Global Real Estate Fund | (3,821) | 55,693 | 99,369 | 4,332,965 | ||||||||||||
| MFS Growth Fund | 2,570 | 379,835 | — | 12,145,559 | ||||||||||||
| MFS High Income Fund | (1,500) | — | 95,364 | 2,449,195 | ||||||||||||
| MFS Inflation-Adjusted Bond Fund | (20,716) | — | 38,004 | 3,885,737 | ||||||||||||
| MFS Institutional Money Market Portfolio | — | — | 212 | 127,597 | ||||||||||||
| MFS International Growth Fund | (17,960) | 49,796 | 86,779 | 6,488,538 | ||||||||||||
| MFS International New Discovery Fund | (6,183) | — | 40,251 | 3,291,087 | ||||||||||||
| MFS International Value Fund | (9,014) | 61,087 | 123,531 | 6,465,142 | ||||||||||||
| MFS Mid Cap Growth Fund | (3,934) | 543,202 | — | 10,036,699 | ||||||||||||
| MFS Mid Cap Value Fund | (5,140) | 481,702 | 61,532 | 10,100,888 | ||||||||||||
| MFS New Discovery Fund | (17,070) | 138,486 | — | 2,358,052 | ||||||||||||
| MFS New Discovery Value Fund | (4,258) | 110,971 | 8,643 | 2,398,751 | ||||||||||||
| MFS Research Fund | (2,334) | 333,020 | 67,045 | 8,464,056 | ||||||||||||
| MFS Research International Fund | (25,472) | — | 170,741 | 8,034,991 | ||||||||||||
| MFS Total Return Bond Fund | (1,471) | 9,092 | 66,286 | 2,911,555 | ||||||||||||
MFS Value Fund | (535) | 260,780 | 218,274 | 12,248,111 | ||||||||||||
| $(277,354) | $2,454,800 | $1,179,671 | $106,216,846 | |||||||||||||
| Lifetime 2040 Fund | ||||||||||||||||
Underlying Affiliated Funds | Beginning Share/Par Amount | Acquisitions Share/Par Amount | Dispositions Share/Par Amount | Ending Share/Par Amount | ||||||||||||
| MFS Commodity Strategy Fund | 1,353,552 | 1,076,306 | (144,881) | 2,284,977 | ||||||||||||
| MFS Emerging Markets Equity Fund | 161,506 | 69,444 | (23,432) | 207,518 | ||||||||||||
| MFS Global Real Estate Fund | 827,378 | 238,459 | (114,705) | 951,132 | ||||||||||||
| MFS Growth Fund | 448,513 | 100,308 | (47,149) | 501,672 | ||||||||||||
| MFS Inflation-Adjusted Bond Fund | 597,312 | 234,203 | (94,917) | 736,598 | ||||||||||||
| MFS Institutional Money Market Portfolio | 9 | 50,678,024 | (50,394,280) | 283,753 | ||||||||||||
| MFS International Growth Fund | 622,943 | 213,172 | (63,449) | 772,666 | ||||||||||||
| MFS International New Discovery Fund | 340,697 | 108,967 | (30,924) | 418,740 | ||||||||||||
136
Table of Contents
Notes to Financial Statements – continued
| Lifetime 2040 Fund – continued | ||||||||||||||||
Underlying Affiliated Funds | Beginning Share/Par Amount | Acquisitions Share/Par Amount | Dispositions Share/Par Amount | Ending Share/Par Amount | ||||||||||||
| MFS International Value Fund | 514,356 | 143,179 | (57,445) | 600,090 | ||||||||||||
| MFS Mid Cap Growth Fund | 1,800,938 | 464,104 | (229,732) | 2,035,310 | ||||||||||||
| MFS Mid Cap Value Fund | 1,237,301 | 347,034 | (118,036) | 1,466,299 | ||||||||||||
| MFS New Discovery Fund | 233,399 | 107,034 | (46,666) | 293,767 | ||||||||||||
| MFS New Discovery Value Fund | 475,662 | 183,020 | (74,360) | 584,322 | ||||||||||||
| MFS Research Fund | 544,660 | 134,814 | (47,375) | 632,099 | ||||||||||||
| MFS Research International Fund | 1,129,868 | 403,799 | (124,131) | 1,409,536 | ||||||||||||
| MFS Total Return Bond Fund | 577,511 | 212,708 | (82,712) | 707,507 | ||||||||||||
| MFS Value Fund | 905,347 | 222,613 | (71,840) | 1,056,120 | ||||||||||||
Underlying Affiliated Funds | Realized Gain (Loss) | Capital Gain Distributions | Dividend Income | Ending Value | ||||||||||||
| MFS Commodity Strategy Fund | $(304,893) | $— | $32,783 | $16,017,687 | ||||||||||||
| MFS Emerging Markets Equity Fund | (45,955) | 124,570 | 58,451 | 6,248,379 | ||||||||||||
| MFS Global Real Estate Fund | 27,786 | 216,950 | 387,088 | 15,436,865 | ||||||||||||
| MFS Growth Fund | 49,777 | 1,282,383 | — | 36,918,053 | ||||||||||||
| MFS Inflation-Adjusted Bond Fund | (78,463) | — | 100,879 | 7,771,113 | ||||||||||||
| MFS Institutional Money Market Portfolio | — | — | 347 | 283,753 | ||||||||||||
| MFS International Growth Fund | (71,423) | 180,443 | 314,455 | 21,881,912 | ||||||||||||
| MFS International New Discovery Fund | (25,318) | — | 164,429 | 12,524,526 | ||||||||||||
| MFS International Value Fund | (44,145) | 223,856 | 452,687 | 21,717,251 | ||||||||||||
| MFS Mid Cap Growth Fund | 14,110 | 1,824,357 | — | 30,733,186 | ||||||||||||
| MFS Mid Cap Value Fund | (12,059) | 1,620,490 | 206,999 | 30,850,941 | ||||||||||||
| MFS New Discovery Fund | (48,554) | 489,423 | — | 7,623,261 | ||||||||||||
| MFS New Discovery Value Fund | (9,466) | 425,089 | 30,573 | 7,713,051 | ||||||||||||
| MFS Research Fund | 34,017 | 1,071,768 | 215,773 | 24,708,748 | ||||||||||||
| MFS Research International Fund | (102,988) | — | 577,827 | 25,019,264 | ||||||||||||
| MFS Total Return Bond Fund | (12,535) | 27,447 | 209,713 | 7,754,277 | ||||||||||||
MFS Value Fund | 16,842 | 876,546 | 763,168 | 37,101,496 | ||||||||||||
| $(613,267) | $8,363,322 | $3,515,172 | $310,303,763 | |||||||||||||
| Lifetime 2045 Fund | ||||||||||||||||
Underlying Affiliated Funds | Beginning Share/Par Amount | Acquisitions Share/Par Amount | Dispositions Share/Par Amount | Ending Share/Par Amount | ||||||||||||
| MFS Commodity Strategy Fund | 171,357 | 308,412 | (22,937) | 456,832 | ||||||||||||
| MFS Emerging Markets Equity Fund | 20,497 | 23,488 | (2,706) | 41,279 | ||||||||||||
| MFS Global Real Estate Fund | 104,895 | 100,479 | (15,023) | 190,351 | ||||||||||||
| MFS Growth Fund | 56,798 | 48,796 | (5,395) | 100,199 | ||||||||||||
| MFS Inflation-Adjusted Bond Fund | 75,639 | 84,916 | (12,815) | 147,740 | ||||||||||||
| MFS Institutional Money Market Portfolio | 7,936 | 26,079,418 | (25,961,252) | 126,102 | ||||||||||||
| MFS International Growth Fund | 78,831 | 80,248 | (5,186) | 153,893 | ||||||||||||
| MFS International New Discovery Fund | 43,074 | 42,551 | (2,365) | 83,260 | ||||||||||||
| MFS International Value Fund | 65,075 | 60,177 | (5,484) | 119,768 | ||||||||||||
| MFS Mid Cap Growth Fund | 228,007 | 205,892 | (26,457) | 407,442 | ||||||||||||
| MFS Mid Cap Value Fund | 156,277 | 147,995 | (10,688) | 293,584 | ||||||||||||
| MFS New Discovery Fund | 29,700 | 36,468 | (7,451) | 58,717 | ||||||||||||
| MFS New Discovery Value Fund | 60,332 | 65,101 | (8,647) | 116,786 | ||||||||||||
| MFS Research Fund | 68,900 | 62,427 | (5,036) | 126,291 | ||||||||||||
| MFS Research International Fund | 142,831 | 147,848 | (10,558) | 280,121 | ||||||||||||
| MFS Total Return Bond Fund | 73,180 | 80,104 | (11,081) | 142,203 | ||||||||||||
| MFS Value Fund | 114,576 | 103,317 | (6,547) | 211,346 | ||||||||||||
137
Table of Contents
Notes to Financial Statements – continued
| Lifetime 2045 Fund – continued | ||||||||||||||||
Underlying Affiliated Funds | Realized Gain (Loss) | Capital Gain Distributions | Dividend Income | Ending Value | ||||||||||||
| MFS Commodity Strategy Fund | $(40,139) | $— | $5,452 | $3,202,395 | ||||||||||||
| MFS Emerging Markets Equity Fund | (6,489) | 21,302 | 9,996 | 1,242,899 | ||||||||||||
| MFS Global Real Estate Fund | (1,357) | 36,121 | 64,449 | 3,089,401 | ||||||||||||
| MFS Growth Fund | 2,079 | 211,649 | — | 7,373,643 | ||||||||||||
| MFS Inflation-Adjusted Bond Fund | (10,678) | — | 14,594 | 1,558,652 | ||||||||||||
| MFS Institutional Money Market Portfolio | — | — | 169 | 126,102 | ||||||||||||
| MFS International Growth Fund | (9,889) | 30,636 | 53,389 | 4,358,250 | ||||||||||||
| MFS International New Discovery Fund | (3,456) | — | 27,600 | 2,490,294 | ||||||||||||
| MFS International Value Fund | (5,886) | 37,540 | 75,916 | 4,334,405 | ||||||||||||
| MFS Mid Cap Growth Fund | (228) | 305,503 | — | 6,152,372 | ||||||||||||
| MFS Mid Cap Value Fund | (2,548) | 271,203 | 34,643 | 6,177,000 | ||||||||||||
| MFS New Discovery Fund | (11,798) | 81,901 | — | 1,523,711 | ||||||||||||
| MFS New Discovery Value Fund | (2,524) | 64,428 | 5,086 | 1,541,578 | ||||||||||||
| MFS Research Fund | 960 | 179,499 | 36,138 | 4,936,732 | ||||||||||||
| MFS Research International Fund | (13,025) | — | 97,286 | 4,972,142 | ||||||||||||
| MFS Total Return Bond Fund | (1,260) | 4,595 | 33,625 | 1,558,547 | ||||||||||||
MFS Value Fund | 650 | 146,247 | 124,805 | 7,424,601 | ||||||||||||
| $(105,588) | $1,390,624 | $583,148 | $62,062,724 | |||||||||||||
| Lifetime 2050 Fund | ||||||||||||||||
Underlying Affiliated Funds | Beginning Share/Par Amount | Acquisitions Share/Par Amount | Dispositions Share/Par Amount | Ending Share/Par Amount | ||||||||||||
| MFS Commodity Strategy Fund | 312,845 | 397,468 | (43,691) | 666,622 | ||||||||||||
| MFS Emerging Markets Equity Fund | 37,541 | 27,777 | (5,290) | 60,028 | ||||||||||||
| MFS Global Real Estate Fund | 190,900 | 112,747 | (25,121) | 278,526 | ||||||||||||
| MFS Growth Fund | 104,008 | 54,785 | (11,923) | 146,870 | ||||||||||||
| MFS Inflation-Adjusted Bond Fund | 138,227 | 98,869 | (21,050) | 216,046 | ||||||||||||
| MFS Institutional Money Market Portfolio | 8 | 25,904,757 | (25,533,425) | 371,340 | ||||||||||||
| MFS International Growth Fund | 143,448 | 93,812 | (12,288) | 224,972 | ||||||||||||
| MFS International New Discovery Fund | 78,697 | 49,667 | (6,645) | 121,719 | ||||||||||||
| MFS International Value Fund | 118,295 | 67,577 | (10,817) | 175,055 | ||||||||||||
| MFS Mid Cap Growth Fund | 417,936 | 227,860 | (48,597) | 597,199 | ||||||||||||
| MFS Mid Cap Value Fund | 285,548 | 165,668 | (21,589) | 429,627 | ||||||||||||
| MFS New Discovery Fund | 54,752 | 42,653 | (11,143) | 86,263 | ||||||||||||
| MFS New Discovery Value Fund | 110,746 | 75,615 | (15,618) | 170,743 | ||||||||||||
| MFS Research Fund | 125,985 | 70,350 | (11,545) | 184,790 | ||||||||||||
| MFS Research International Fund | 260,930 | 175,883 | (27,061) | 409,752 | ||||||||||||
| MFS Total Return Bond Fund | 133,620 | 93,249 | (18,829) | 208,040 | ||||||||||||
| MFS Value Fund | 208,764 | 119,434 | (19,250) | 308,948 | ||||||||||||
Underlying Affiliated Funds | Realized Gain (Loss) | Capital Gain Distributions | Dividend Income | Ending Value | ||||||||||||
| MFS Commodity Strategy Fund | $(98,579) | $— | $8,632 | $4,673,021 | ||||||||||||
| MFS Emerging Markets Equity Fund | (13,531) | 33,210 | 15,583 | 1,807,440 | ||||||||||||
| MFS Global Real Estate Fund | (4,142) | 57,123 | 101,921 | 4,520,475 | ||||||||||||
| MFS Growth Fund | (7,016) | 335,280 | — | 10,808,177 | ||||||||||||
| MFS Inflation-Adjusted Bond Fund | (19,348) | — | 25,578 | 2,279,288 | ||||||||||||
| MFS Institutional Money Market Portfolio | — | — | 194 | 371,340 | ||||||||||||
| MFS International Growth Fund | (20,820) | 47,739 | 83,194 | 6,371,218 | ||||||||||||
| MFS International New Discovery Fund | (9,114) | — | 43,215 | 3,640,614 | ||||||||||||
| MFS International Value Fund | (9,951) | 58,827 | 118,961 | 6,335,225 | ||||||||||||
| MFS Mid Cap Growth Fund | (12,923) | 477,988 | — | 9,017,701 | ||||||||||||
| MFS Mid Cap Value Fund | (9,387) | 424,792 | 54,262 | 9,039,350 | ||||||||||||
| MFS New Discovery Fund | (20,551) | 127,524 | — | 2,238,520 | ||||||||||||
| MFS New Discovery Value Fund | (4,464) | 106,780 | 7,974 | 2,253,813 | ||||||||||||
138
Table of Contents
Notes to Financial Statements – continued
| Lifetime 2050 Fund – continued | ||||||||||||||||
Underlying Affiliated Funds | Realized Gain (Loss) | Capital Gain Distributions | Dividend Income | Ending Value | ||||||||||||
| MFS Research Fund | $(5,587) | $281,624 | $56,698 | $7,223,446 | ||||||||||||
| MFS Research International Fund | (27,100) | — | 152,340 | 7,273,094 | ||||||||||||
| MFS Total Return Bond Fund | (2,888) | 7,204 | 54,955 | 2,280,121 | ||||||||||||
MFS Value Fund | (4,533) | 228,213 | 201,181 | 10,853,356 | ||||||||||||
| $(269,934) | $2,186,304 | $924,688 | $90,986,199 | |||||||||||||
| Lifetime 2055 Fund | ||||||||||||||||
Underlying Affiliated Funds | Beginning Share/Par Amount | Acquisitions Share/Par Amount | Dispositions Share/Par Amount | Ending Share/Par Amount | ||||||||||||
| MFS Commodity Strategy Fund | 23,625 | 63,565 | (7,361) | 79,829 | ||||||||||||
| MFS Emerging Markets Equity Fund | 2,836 | 5,160 | (776) | 7,220 | ||||||||||||
| MFS Global Real Estate Fund | 14,411 | 23,811 | (4,672) | 33,550 | ||||||||||||
| MFS Growth Fund | 7,851 | 12,216 | (2,346) | 17,721 | ||||||||||||
| MFS Inflation-Adjusted Bond Fund | 10,432 | 19,766 | (4,216) | 25,982 | ||||||||||||
| MFS Institutional Money Market Portfolio | 12,078 | 5,699,340 | (5,581,378) | 130,040 | ||||||||||||
| MFS International Growth Fund | 10,819 | 19,238 | (3,009) | 27,048 | ||||||||||||
| MFS International New Discovery Fund | 5,939 | 10,268 | (1,619) | 14,588 | ||||||||||||
| MFS International Value Fund | 8,924 | 14,813 | (2,665) | 21,072 | ||||||||||||
| MFS Mid Cap Growth Fund | 31,510 | 50,483 | (9,909) | 72,084 | ||||||||||||
| MFS Mid Cap Value Fund | 21,548 | 35,556 | (5,327) | 51,777 | ||||||||||||
| MFS New Discovery Fund | 4,133 | 8,260 | (1,943) | 10,450 | ||||||||||||
| MFS New Discovery Value Fund | 8,363 | 15,333 | (3,101) | 20,595 | ||||||||||||
| MFS Research Fund | 9,512 | 15,135 | (2,378) | 22,269 | ||||||||||||
| MFS Research International Fund | 19,695 | 35,144 | (5,686) | 49,153 | ||||||||||||
| MFS Total Return Bond Fund | 10,077 | 18,652 | (3,702) | 25,027 | ||||||||||||
| MFS Value Fund | 15,756 | 25,067 | (3,611) | 37,212 | ||||||||||||
Underlying Affiliated Funds | Realized Gain (Loss) | Capital Gain Distributions | Dividend Income | Ending Value | ||||||||||||
| MFS Commodity Strategy Fund | $(8,872) | $— | $864 | $559,598 | ||||||||||||
| MFS Emerging Markets Equity Fund | (1,681) | 3,362 | 1,578 | 217,393 | ||||||||||||
| MFS Global Real Estate Fund | (1,715) | 5,677 | 10,128 | 544,519 | ||||||||||||
| MFS Growth Fund | (1,970) | 33,163 | — | 1,304,099 | ||||||||||||
| MFS Inflation-Adjusted Bond Fund | (1,508) | — | 2,221 | 274,114 | ||||||||||||
| MFS Institutional Money Market Portfolio | — | — | 93 | 130,040 | ||||||||||||
| MFS International Growth Fund | (5,298) | 4,832 | 8,420 | 765,999 | ||||||||||||
| MFS International New Discovery Fund | (2,517) | — | 4,297 | 436,339 | ||||||||||||
| MFS International Value Fund | (3,053) | 5,915 | 11,961 | 762,613 | ||||||||||||
| MFS Mid Cap Growth Fund | (3,361) | 47,985 | — | 1,088,467 | ||||||||||||
| MFS Mid Cap Value Fund | (3,011) | 42,307 | 5,404 | 1,089,385 | ||||||||||||
| MFS New Discovery Fund | (4,524) | 12,737 | — | 271,185 | ||||||||||||
| MFS New Discovery Value Fund | (1,863) | 9,710 | 801 | 271,851 | ||||||||||||
| MFS Research Fund | (1,459) | 28,132 | 5,664 | 870,482 | ||||||||||||
| MFS Research International Fund | (6,099) | — | 15,163 | 872,471 | ||||||||||||
| MFS Total Return Bond Fund | (251) | 717 | 5,294 | 274,301 | ||||||||||||
MFS Value Fund | (1,965) | 22,688 | 19,836 | 1,307,271 | ||||||||||||
| $(49,147) | $217,225 | $91,724 | $11,040,127 | |||||||||||||
| (8) | Acquisitions |
At close of business on June 20, 2014, the MFS Lifetime Income Fund (formerly the MFS Lifetime Retirement Income Fund) with net assets of approximately $394,420,562, acquired all of the assets and liabilities of MFS Lifetime 2010 Fund. The purpose of the transaction was to provide shareholders of MFS Lifetime 2010 Fund the opportunity to participate in a larger combined portfolio with a similar investment objective and similar investment policies and strategies. The acquisition was accomplished by a tax-free exchange of approximately 5,653,483 shares of the MFS Lifetime Income Fund (valued at approximately $69,704,946) for all of the assets and liabilities of MFS Lifetime 2010 Fund. MFS Lifetime 2010 Fund then distributed the shares of the MFS Lifetime Income
139
Table of Contents
Notes to Financial Statements – continued
Fund that MFS Lifetime 2010 Fund received from the MFS Lifetime Income Fund to its shareholders. MFS Lifetime 2010 Fund’s investments on that date were valued at approximately $69,675,874 with a cost basis of approximately $56,833,182. For financial reporting purposes, assets received and shares issued by the MFS Lifetime Income Fund were recorded at fair value; however, the cost basis of the investments received from MFS Lifetime 2010 Fund were carried forward to align ongoing reporting of the MFS Lifetime Income Fund’s realized and unrealized gains and losses with amounts distributable to shareholders for tax purposes. Because the combined investment portfolios have been managed as a single integrated portfolio since the acquisition was completed, it is not practicable to separate the amounts of revenue and earnings of MFS Lifetime 2010 Fund that have been included in the MFS Lifetime Income Fund’s Statement of Operations since June 20, 2014.
Assuming the acquisition had been completed on May 1, 2014, the MFS Lifetime Income Fund’s pro forma results of operations for the year ended April 30, 2015 are as follows:
| Net investment income | $6,776,724 | |||
| Net realized and unrealized gain (loss) on investments | $9,985,623 | |||
| Change in net assets from operations | $16,762,347 |
140
Table of Contents
REPORT OF INDEPENDENT REGISTERED PUBLIC ACCOUNTING FIRM
To the Board of Trustees of MFS Series Trust XII and Shareholders of MFS Lifetime Funds:
We have audited the accompanying statements of assets and liabilities, including the portfolios of investments, of MFS Lifetime Income Fund (formerly MFS Lifetime Retirement Income Fund), MFS Lifetime 2015 Fund, MFS Lifetime 2020 Fund, MFS Lifetime 2025 Fund, MFS Lifetime 2030 Fund, MFS Lifetime 2035 Fund, MFS Lifetime 2040 Fund, MFS Lifetime 2045 Fund, MFS Lifetime 2050 Fund and MFS Lifetime 2055 Fund (the MFS Lifetime Funds) (ten of the series constituting MFS Series Trust XII) as of April 30, 2015, and the related statements of operations for the year then ended, the statements of changes in net assets for each of the two years in the period then ended and the financial highlights for each of the periods indicated therein. These financial statements and financial highlights are the responsibility of the MFS Lifetime Funds’ management. Our responsibility is to express an opinion on these financial statements and financial highlights based on our audits.
We conducted our audits in accordance with the standards of the Public Company Accounting Oversight Board (United States). Those standards require that we plan and perform the audits to obtain reasonable assurance about whether the financial statements and financial highlights are free of material misstatement. We were not engaged to perform an audit of the MFS Lifetime Funds’ internal control over financial reporting. Our audits included consideration of internal control over financial reporting as a basis for designing audit procedures that are appropriate in the circumstances, but not for the purpose of expressing an opinion on the effectiveness of the MFS Lifetime Funds’ internal control over financial reporting. Accordingly, we express no such opinion. An audit also includes examining, on a test basis, evidence supporting the amounts and disclosures in the financial statements and financial highlights, assessing the accounting principles used and significant estimates made by management, and evaluating the overall financial statement presentation. Our procedures included confirmation of securities owned as of April 30, 2015, by correspondence with the transfer agent. We believe that our audits provide a reasonable basis for our opinion.
In our opinion, the financial statements and financial highlights referred to above present fairly, in all material respects, the financial position of MFS Lifetime Funds (ten of the series constituting the MFS Series Trust XII) at April 30, 2015, and the results of their operations for the year then ended, the changes in their net assets for each of the two years in the period then ended and the financial highlights for each of the periods indicated therein, in conformity with U.S. generally accepted accounting principles.

Boston, Massachusetts
June 16, 2015
141
Table of Contents
TRUSTEES AND OFFICERS — IDENTIFICATION AND BACKGROUND
The Trustees and Officers of the Trust, as of June 1, 2015, are listed below, together with their principal occupations during the past five years. (Their titles may have varied during that period.) The address of each Trustee and Officer is 111 Huntington Avenue, Boston, Massachusetts 02199-7618.
Name, Age | Position(s) Held with Fund | Trustee/Officer Since (h) | Principal Occupations During the Past Five Years | Other Directorships (j) | ||||
| INTERESTED TRUSTEES | ||||||||
Robert J. Manning (k) (age 51) | Trustee | February 2004 | Massachusetts Financial Services Company, Chairman, Co-Chief Executive Officer and Director; Chief Investment Officer (until 2010) | N/A | ||||
Robin A. Stelmach (k) (age 53) | Trustee and President | January 2014 | Massachusetts Financial Services Company, Executive Vice President and Chief Operating Officer | N/A | ||||
| INDEPENDENT TRUSTEES | ||||||||
David H. Gunning (age 73) | Trustee and Chair of Trustees | January 2004 | Private investor | Lincoln Electric Holdings, Inc. (welding equipment manufacturer), Director; Development Alternatives, Inc. (consulting), Director/Non-Executive Chairman | ||||
Steven E. Buller (age 63) | Trustee | February 2014 | Chairman, Financial Accounting Standards Advisory Council; Standing Advisory Group, Public Company Accounting Oversight Board, Member (until 2014); BlackRock, Inc. (investment management), Managing Director (until 2014), BlackRock Finco UK (investment management), Director (until 2014) | N/A | ||||
Robert E. Butler (age 73) | Trustee | January 2006 | Consultant – investment company industry regulatory and compliance matters | N/A | ||||
Maureen R. Goldfarb (age 60) | Trustee | January 2009 | Private investor | N/A | ||||
William R. Gutow (age 73) | Trustee | December 1993 | Private investor and real estate consultant; Capitol Entertainment Management Company (video franchise), Vice Chairman | Texas Donuts (donut franchise), Vice Chairman (until 2010) | ||||
Michael Hegarty (age 70) | Trustee | December 2004 | Private investor | Rouse Properties Inc. (real estate), Director; Capmark Financial Group Inc. (real estate), Director | ||||
John P. Kavanaugh (age 60) | Trustee | January 2009 | Private investor | N/A | ||||
Maryanne L. Roepke (age 59) | Trustee | May 2014 | American Century Investments (investment management), Senior Vice President and Chief Compliance Officer (until 2014) | N/A | ||||
Laurie J. Thomsen (age 57) | Trustee | March 2005 | Private investor; New Profit, Inc. (venture philanthropy), Executive Partner (until 2010) | The Travelers Companies (insurance), Director | ||||
Robert W. Uek (age 74) | Trustee | January 2006 | Consultant to investment company industry | N/A | ||||
142
Table of Contents
Trustees and Officers – continued
Name, Age | Position(s) Held with Fund | Trustee/Officer Since (h) | Principal Occupations During the Past Five Years | Other Directorships (j) | ||||
| OFFICERS | ||||||||
Christopher R. Bohane (k) (age 41) | Assistant Secretary and Assistant Clerk | July 2005 | Massachusetts Financial Services Company, Vice President and Assistant General Counsel | N/A | ||||
Kino Clark (k) (age 46) | Assistant Treasurer | January 2012 | Massachusetts Financial Services Company, Vice President | N/A | ||||
Thomas H. Connors (k) (age 55) | Assistant Secretary and Assistant Clerk | September 2012 | Massachusetts Financial Services Company, Vice President and Senior Counsel; Deutsche Investment Management Americas Inc. (financial service provider), Director and Senior Counsel (until 2012) | N/A | ||||
Ethan D. Corey (k) (age 51) | Assistant Secretary and Assistant Clerk | July 2005 | Massachusetts Financial Services Company, Senior Vice President and Associate General Counsel | N/A | ||||
David L. DiLorenzo (k) (age 46) | Treasurer | July 2005 | Massachusetts Financial Services Company, Senior Vice President | N/A | ||||
Brent H. Farmer (k) (age 47) | Interim Chief Compliance Officer | June 2015 | Massachusetts Financial Services Company, Vice President and Director of Corporate Compliance | N/A | ||||
Brian E. Langenfeld (k) (age 42) | Assistant Secretary and Assistant Clerk | June 2006 | Massachusetts Financial Services Company, Vice President and Senior Counsel | N/A | ||||
Susan S. Newton (k) (age 65) | Assistant Secretary and Assistant Clerk | May 2005 | Massachusetts Financial Services Company, Senior Vice President and Associate General Counsel | N/A | ||||
Kenneth Paek (k) (age 40) | Assistant Treasurer | February 2015 | Massachusetts Financial Services Company, Vice President; Cohen & Steers, Vice President/Head of Fund Administration (until 2014) | N/A | ||||
Susan A. Pereira (k) (age 44) | Assistant Secretary and Assistant Clerk | July 2005 | Massachusetts Financial Services Company, Vice President and Senior Counsel | N/A | ||||
Kasey L. Phillips (k) (age 44) | Assistant Treasurer | September 2012 | Massachusetts Financial Services Company, Vice President; Wells Fargo Funds Management, LLC, Senior Vice President, Fund Treasurer (until 2012) | N/A | ||||
Mark N. Polebaum (k) (age 63) | Secretary and Clerk | January 2006 | Massachusetts Financial Services Company, Executive Vice President, General Counsel and Secretary | N/A | ||||
Matthew A. Stowe (k) (age 40) | Assistant Secretary and Assistant Clerk | October 2014 | Massachusetts Financial Services Company, Vice President and Assistant General Counsel | N/A | ||||
Frank L. Tarantino (age 71) | Independent Senior Officer | June 2004 | Tarantino LLC (provider of compliance services), Principal | N/A | ||||
Richard S. Weitzel (k) (age 44) | Assistant Secretary and Assistant Clerk | October 2007 | Massachusetts Financial Services Company, Senior Vice President and Associate General Counsel | N/A | ||||
James O. Yost (k) (age 54) | Deputy Treasurer | September 1990 | Massachusetts Financial Services Company, Senior Vice President | N/A | ||||
| (h) | Date first appointed to serve as Trustee/officer of an MFS Fund. Each Trustee has served continuously since appointment unless indicated otherwise. For the period from December 15, 2004 until February 22, 2005, Mr. Manning served as Advisory Trustee. Prior to January 2012, Messrs. DiLorenzo and Yost served as Assistant Treasurers of the Funds. Ms. Stelmach was appointed as President of the Funds as of October 1, 2014. |
143
Table of Contents
Trustees and Officers – continued
| (j) | Directorships or trusteeships of companies required to report to the Securities and Exchange Commission (i.e., “public companies”). |
| (k) | “Interested person” of the Trust within the meaning of the Investment Company Act of 1940 (referred to as the 1940 Act), which is the principal federal law governing investment companies like the fund, as a result of a position with MFS. The address of MFS is 111 Huntington Avenue, Boston, Massachusetts 02199-7618. |
Each Trustee (except Ms. Stelmach, Mr. Buller and Ms. Roepke) has been elected by shareholders and each Trustee and officer holds office until his or her successor is chosen and qualified or until his or her earlier death, resignation, retirement or removal. The Trust does not hold annual meetings for the purpose of electing Trustees, and Trustees are not elected for fixed terms. Messrs. Butler, Kavanaugh, Uek and Mses. Thomsen and Roepke are members of the Trust’s Audit Committee.
Each of the Fund’s Trustees and officers holds comparable positions with certain other funds of which MFS or a subsidiary is the investment adviser or distributor, and, in the case of the officers, with certain affiliates of MFS. As of June 1, 2015, the Trustees served as board members of 132 funds within the MFS Family of Funds.
The Statement of Additional Information for a Fund includes further information about the Trustees and is available without charge upon request by calling 1-800-225-2606.
| Investment Adviser | Custodian | |
| Massachusetts Financial Services Company | State Street Bank and Trust Company | |
| 111 Huntington Avenue | 1 Lincoln Street | |
| Boston, MA 02199-7618 | Boston, MA 02111-2900 | |
| Distributor | Independent Registered Public Accounting Firm | |
| MFS Fund Distributors, Inc. | Ernst & Young LLP | |
| 111 Huntington Avenue | 200 Clarendon Street | |
| Boston, MA 02199-7618 | Boston, MA 02116 | |
| Portfolio Manager | ||
| Joseph Flaherty |
144
Table of Contents
PROXY VOTING POLICIES AND INFORMATION
MFS votes proxies on behalf of the funds pursuant to proxy voting policies and procedures that are available without charge, upon request, by calling 1-800-225-2606, by visiting the Proxy Voting section of mfs.com or by visiting the SEC’s Web site at http://www.sec.gov.
Information regarding how each fund voted proxies relating to portfolio securities during the twelve-month period ended June 30, 2014 is available without charge by visiting the Proxy Voting section of mfs.com or by visiting the SEC’s Web site at http://www.sec.gov.
QUARTERLY PORTFOLIO DISCLOSURE
Each fund will file a complete schedule of portfolio holdings with the Securities and Exchange Commission (the Commission) for the first and third quarters of each fiscal year on Form N-Q. A shareholder can obtain the quarterly portfolio holdings report at mfs.com. Each fund’s Form N-Q is also available on the EDGAR database on the Commission’s Internet Web site at http://www.sec.gov, and may be reviewed and copied at the:
Public Reference Room
Securities and Exchange Commission
100 F Street, NE, Room 1580
Washington, D.C. 20549
Information on the operation of the Public Reference Room may be obtained by calling the Commission at 1-800-SEC-0330. Copies of each fund’s Form N-Q also may be obtained, upon payment of a duplicating fee, by electronic request at the following e-mail address: publicinfo@sec.gov or by writing the Public Reference Section at the above address.
From time to time, MFS may post important information about each fund or the MFS funds on the MFS web site (mfs.com). This information is available by visiting the “Market Commentary” and “Announcements” sub sections in the “Market Outlooks” section of mfs.com or by clicking on the fund’s name under “Mutual Funds” in the “Products” section of mfs.com.
FEDERAL TAX INFORMATION (unaudited)
The funds will notify shareholders of amounts for use in preparing 2015 income tax forms in January 2016. The following information is provided pursuant to provisions of the Internal Revenue Code.
The funds designate the maximum amount allowable as qualified dividend income eligible to be taxed at the same rate as long-term capital gain.
The funds below designated the following amounts as capital gain dividends paid during the fiscal year:
Capital Gains | ||||
| MFS Lifetime Income Fund | $2,759,000 | |||
| MFS Lifetime 2015 Fund | 240,000 | |||
| MFS Lifetime 2020 Fund | 1,235,797 | |||
| MFS Lifetime 2025 Fund | 856,000 | |||
| MFS Lifetime 2030 Fund | 538,908 | |||
| MFS Lifetime 2035 Fund | 807,000 | |||
| MFS Lifetime 2040 Fund | 1,257,000 | |||
| MFS Lifetime 2045 Fund | 421,000 | |||
| MFS Lifetime 2050 Fund | 787,000 | |||
| MFS Lifetime 2055 Fund | 49,000 | |||
For corporate shareholders, the percentages of the ordinary income dividends paid during the fiscal year that qualify for the corporate dividends received deduction are as follows:
| Dividends Received Deductions | ||||
| MFS Lifetime Income Fund | 12.52% | |||
| MFS Lifetime 2015 Fund | 10.22% | |||
| MFS Lifetime 2020 Fund | 17.13% | |||
| MFS Lifetime 2025 Fund | 22.97% | |||
| MFS Lifetime 2030 Fund | 34.56% | |||
| MFS Lifetime 2035 Fund | 33.87% | |||
| MFS Lifetime 2040 Fund | 37.58% | |||
| MFS Lifetime 2045 Fund | 36.97% | |||
| MFS Lifetime 2050 Fund | 37.04% | |||
| MFS Lifetime 2055 Fund | 39.82% | |||
145
Table of Contents
rev. 3/11
| WHAT DOES MFS DO WITH YOUR
|  |
| Why? | Financial companies choose how they share your personal information. Federal law gives consumers the right to limit some but not all sharing. Federal law also requires us to tell you how we collect, share, and protect your personal information. Please read this notice carefully to understand what we do. |
| What? | The types of personal information we collect and share depend on the product or service you have with us. This information can include:
• Social Security number and account balances • Account transactions and transaction history • Checking account information and wire transfer instructions
When you are no longer our customer, we continue to share your information as described in this notice. |
| How? | All financial companies need to share customers’ personal information to run their everyday business. In the section below, we list the reasons financial companies can share their customers’ personal information; the reasons MFS chooses to share; and whether you can limit this sharing. |
| Reasons we can share your personal information | Does MFS share? | Can you limit this sharing? | ||
For our everyday business purposes – such as to process your transactions, maintain your account(s), respond to court orders and legal investigations, or report to credit bureaus | Yes | No | ||
For our marketing purposes – to offer our products and services to you | No | We don’t share | ||
| For joint marketing with other financial companies | No | We don’t share | ||
For our affiliates’ everyday business purposes – information about your transactions and experiences | No | We don’t share | ||
For our affiliates’ everyday business purposes – information about your creditworthiness | No | We don’t share | ||
| For nonaffiliates to market to you | No | We don’t share |
| Questions? | Call 800-225-2606 or go to mfs.com. |
146
Table of Contents
| Page 2 |
| Who we are | ||
| Who is providing this notice? | MFS Funds, MFS Investment Management, MFS Institutional Advisors, Inc., MFS Fund Distributors, Inc., MFS Heritage Trust Company, and MFS Service Center, Inc. | |
| What we do | ||
| How does MFS protect my personal information? | To protect your personal information from unauthorized access and use, we use security measures that comply with federal law. These measures include procedural, electronic, and physical safeguards for the protection of the personal information we collect about you. | |
| How does MFS collect my personal information? | We collect your personal information, for example, when you
• open an account or provide account information • direct us to buy securities or direct us to sell your securities • make a wire transfer
We also collect your personal information from others, such as credit bureaus, affiliates and other companies. | |
| Why can’t I limit all sharing? | Federal law gives you the right to limit only
• sharing for affiliates’ everyday business purposes – information about your creditworthiness • affiliates from using your information to market to you • sharing for nonaffiliates to market to you
State laws and individual companies may give you additional rights to limit sharing. | |
| Definitions | ||
| Affiliates | Companies related by common ownership or control. They can be financial and nonfinancial companies.
• MFS does not share personal information with affiliates, except for everyday business purposes as described on page one of this notice. | |
| Nonaffiliates | Companies not related by common ownership or control. They can be financial and nonfinancial companies.
• MFS does not share with nonaffiliates so they can market to you. | |
| Joint Marketing | A formal agreement between nonaffiliated financial companies that together market financial products or services to you.
• MFS doesn’t jointly market. | |
| Other important information | ||
| If you own an MFS product or receive an MFS service in the name of a third party such as a bank or broker-dealer, their privacy policy may apply to you instead of ours. | ||
147
Table of Contents
| MFS® will send you prospectuses, |

reports, and proxies directly via e-mail so you will get information faster with less mailbox clutter.
To sign up:
1. Go to mfs.com.
2. Log in via MFS® Access.
3. Select eDelivery.
If you own your MFS fund shares through a financial institution or a retirement plan, MFS® TALK, MFS® Access, or eDelivery may not be available to you.
CONTACT US
WEB SITE
mfs.com
MFS TALK
1-800-637-8255
24 hours a day
ACCOUNT SERVICE AND LITERATURE
Shareholders
1-800-225-2606
Financial advisors
1-800-343-2829
Retirement plan services
1-800-637-1255
MAILING ADDRESS
MFS Service Center, Inc.
P.O. Box 55824
Boston, MA 02205-5824
OVERNIGHT MAIL
MFS Service Center, Inc.
c/o Boston Financial Data Services
30 Dan Road
Canton, MA 02021-2809
Table of Contents
| ITEM 2. | CODE OF ETHICS. |
The Registrant has adopted a Code of Ethics pursuant to Section 406 of the Sarbanes-Oxley Act and as defined in Form N-CSR that applies to the Registrant’s principal executive officer and principal financial and accounting officer. During the period covered by this report, the Registrant has not amended any provision in its Code of Ethics (the “Code”) that relates to an element of the Code’s definitions enumerated in paragraph (b) of Item 2 of this Form N-CSR. During the period covered by this report, the Registrant did not grant a waiver, including an implicit waiver, from any provision of the Code.
A copy of the Code of Ethics is filed as an exhibit to this Form N-CSR.
| ITEM 3. | AUDIT COMMITTEE FINANCIAL EXPERT. |
Messrs. Robert E. Butler, John P. Kavanaugh and Robert W. Uek and Mses. Maryanne L. Roepke and Laurie J. Thomsen, members of the Audit Committee, have been determined by the Board of Trustees in their reasonable business judgment to meet the definition of “audit committee financial expert” as such term is defined in Form N-CSR. In addition, Messrs. Butler, Kavanaugh and Uek and Mses. Roepke and Thomsen are “independent” members of the Audit Committee (as such term has been defined by the Securities and Exchange Commission in regulations implementing Section 407 of the Sarbanes-Oxley Act of 2002). The Securities and Exchange Commission has stated that the designation of a person as an audit committee financial expert pursuant to this Item 3 on the Form N-CSR does not impose on such a person any duties, obligations or liability that are greater than the duties, obligations or liability imposed on such person as a member of the Audit Committee and the Board of Trustees in the absence of such designation or identification.
| ITEM 4. | PRINCIPAL ACCOUNTANT FEES AND SERVICES. |
Items 4(a) through 4(d) and 4(g):
The Board of Trustees has appointed Ernst & Young LLP (“E&Y”) to serve as independent accountant to each series of the Registrant (each a “Fund” and collectively the “Funds”). The tables below set forth the audit fees billed to each Fund as well as fees for non-audit services provided to each Fund and/or to the Fund’s investment adviser, Massachusetts Financial Services Company (“MFS”) and to various entities either controlling, controlled by, or under common control with MFS that provide ongoing services to the Fund (“MFS Related Entities”).
Table of Contents
For the fiscal years ended April 30, 2015 and 2014, audit fees billed to each Fund by E&Y were as follows:
| Audit Fees | ||||||||
| 2015 | 2014 | |||||||
Fees billed by E&Y: | ||||||||
MFS Lifetime Income Fund | 27,799 | 27,348 | ||||||
MFS Lifetime 2010 Fund+ | 0 | 27,348 | ||||||
MFS Lifetime 2015 Fund | 27,172 | 20,306 | ||||||
MFS Lifetime 2020 Fund | 27,799 | 27,348 | ||||||
MFS Lifetime 2025 Fund | 27,172 | 20,306 | ||||||
MFS Lifetime 2030 Fund | 27,799 | 27,348 | ||||||
MFS Lifetime 2035 Fund | 27,172 | 20,306 | ||||||
MFS Lifetime 2040 Fund | 27,799 | 27,348 | ||||||
MFS Lifetime 2045 Fund | 27,172 | 20,306 | ||||||
MFS Lifetime 2050 Fund | 27,272 | 26,830 | ||||||
MFS Lifetime 2055 Fund | 27,172 | 20,306 | ||||||
|
|
|
| |||||
Total | 274,328 | 265,100 | ||||||
For the fiscal years ended April 30, 2015 and 2014, fees billed by E&Y for audit-related, tax and other services provided to each Fund and for audit-related, tax and other services provided to MFS and MFS Related Entities were as follows:
| Audit-Related Fees1 | Tax Fees2 | All Other Fees3 | ||||||||||||||||||||||
| 2015 | 2014 | 2015 | 2014 | 2015 | 2014 | |||||||||||||||||||
Fees billed by E&Y: | ||||||||||||||||||||||||
To MFS Lifetime Income Fund | 0 | 0 | 5,095 | 5,010 | 0 | 0 | ||||||||||||||||||
To MFS Lifetime 2010 Fund+ | 0 | 0 | 5,095 | 5,010 | 0 | 0 | ||||||||||||||||||
To MFS Lifetime 2015 Fund | 0 | 0 | 4,992 | 4,908 | 0 | 0 | ||||||||||||||||||
To MFS Lifetime 2020 Fund | 0 | 0 | 5,095 | 5,010 | 0 | 0 | ||||||||||||||||||
To MFS Lifetime 2025 Fund | 0 | 0 | 4,992 | 4,908 | 0 | 0 | ||||||||||||||||||
To MFS Lifetime 2030 Fund | 0 | 0 | 5,095 | 5,010 | 0 | 0 | ||||||||||||||||||
To MFS Lifetime 2035 Fund | 0 | 0 | 4,992 | 4,908 | 0 | 0 | ||||||||||||||||||
To MFS Lifetime 2040 Fund | 0 | 0 | 5,095 | 5,010 | 0 | 0 | ||||||||||||||||||
To MFS Lifetime 2045 Fund | 0 | 0 | 4,992 | 4,908 | 0 | 0 | ||||||||||||||||||
To MFS Lifetime 2050 Fund | 0 | 0 | 5,072 | 4,987 | 0 | 0 | ||||||||||||||||||
To MFS Lifetime 2055 Fund | 0 | 0 | 4,992 | 4,908 | 0 | 0 | ||||||||||||||||||
Total fees billed by E&Y To above Funds: | 0 | 0 | 55,507 | 54,577 | 0 | 0 | ||||||||||||||||||
Table of Contents
| Audit-Related Fees1 | Tax Fees2 | All Other Fees3 | ||||||||||||||||||||||
| 2015 | 2014 | 2015 | 2014 | 2015 | 2014 | |||||||||||||||||||
Fees billed by E&Y: | ||||||||||||||||||||||||
To MFS and MFS Related Entities of MFS Lifetime Income Fund* | 0 | 0 | 0 | 0 | 0 | 0 | ||||||||||||||||||
To MFS and MFS Related Entities of MFS Lifetime 2010 Fund*+ | 0 | 0 | 0 | 0 | 0 | 0 | ||||||||||||||||||
To MFS and MFS Related Entities of MFS Lifetime 2015 Fund* | 0 | 0 | 0 | 0 | 0 | 0 | ||||||||||||||||||
To MFS and MFS Related Entities of MFS Lifetime 2020 Fund* | 0 | 0 | 0 | 0 | 0 | 0 | ||||||||||||||||||
To MFS and MFS Related Entities of MFS Lifetime 2025 Fund* | 0 | 0 | 0 | 0 | 0 | 0 | ||||||||||||||||||
To MFS and MFS Related Entities of MFS Lifetime 2030 Fund* | 0 | 0 | 0 | 0 | 0 | 0 | ||||||||||||||||||
To MFS and MFS Related Entities of MFS Lifetime 2035 Fund* | 0 | 0 | 0 | 0 | 0 | 0 | ||||||||||||||||||
To MFS and MFS Related Entities of MFS Lifetime 2040 Fund* | 0 | 0 | 0 | 0 | 0 | 0 | ||||||||||||||||||
To MFS and MFS Related Entities of MFS Lifetime 2045 Fund* | 0 | 0 | 0 | 0 | 0 | 0 | ||||||||||||||||||
To MFS and MFS Related Entities of MFS Lifetime 2050 Fund* | 0 | 0 | 0 | 0 | 0 | 0 | ||||||||||||||||||
To MFS and MFS Related Entities of MFS Lifetime 2055 Fund* | 0 | 0 | 0 | 0 | 0 | 0 | ||||||||||||||||||
Aggregate Fees for Non-audit Services | ||||||||
| 2015 | 2014 | |||||||
Fees billed by E&Y: | ||||||||
To MFS Lifetime Income Fund, MFS and MFS Related Entities# | 95,095 | 50,010 | ||||||
To MFS Lifetime 2010 Fund, MFS and MFS Related Entities#+ | 95,095 | 50,010 | ||||||
To MFS Lifetime 2015 Fund, MFS and MFS Related Entities# | 94,992 | 49,908 | ||||||
To MFS Lifetime 2020 Fund, MFS and MFS Related Entities# | 95,095 | 50,010 | ||||||
To MFS Lifetime 2025 Fund, MFS and MFS Related Entities# | 94,992 | 49,908 | ||||||
To MFS Lifetime 2030 Fund, MFS and MFS Related Entities# | 95,095 | 50,010 | ||||||
To MFS Lifetime 2035 Fund, MFS and MFS Related Entities# | 94,992 | 49,908 | ||||||
To MFS Lifetime 2040 Fund, MFS and MFS Related Entities# | 95,095 | 50,010 | ||||||
To MFS Lifetime 2045 Fund, MFS and MFS Related Entities# | 94,992 | 49,908 | ||||||
To MFS Lifetime 2050 Fund, MFS and MFS Related Entities# | 95,072 | 49,987 | ||||||
To MFS Lifetime 2055 Fund, MFS and MFS Related Entities# | 94,992 | 49,908 | ||||||
| + | MFS Lifetime 2010 Fund was reorganized into the MFS Lifetime Income Fund, as of June 20, 2014. |
Table of Contents
| * | This amount reflects the fees billed to MFS and MFS Related Entities for non-audit services relating directly to the operations and financial reporting of the Funds (portions of which services also related to the operations and financial reporting of other funds within the MFS Funds complex). |
| # | This amount reflects the aggregate fees billed by E&Y for non-audit services rendered to the Funds and for non-audit services rendered to MFS and the MFS Related Entities. |
| 1 | The fees included under “Audit-Related Fees” are fees related to assurance and related services that are reasonably related to the performance of the audit or review of financial statements, but not reported under ‘‘Audit Fees,’’ including accounting consultations, agreed-upon procedure reports, attestation reports, comfort letters and internal control reviews. |
| 2 | The fees included under “Tax Fees” are fees associated with tax compliance, tax advice and tax planning, including services relating to the filing or amendment of federal, state or local income tax returns, regulated investment company qualification reviews and tax distribution and analysis. |
| 3 | The fees under “All Other Fees” are fees for products and services provided by E&Y other than those reported under “Audit Fees,” “Audit-Related Fees” and “Tax Fees”. |
Item 4(e)(1):
Set forth below are the policies and procedures established by the Audit Committee of the Board of Trustees relating to the pre-approval of audit and non-audit related services:
To the extent required by applicable law, pre-approval by the Audit Committee of the Board is needed for all audit and permissible non-audit services rendered to the Funds and all permissible non-audit services rendered to MFS or MFS Related Entities if the services relate directly to the operations and financial reporting of the Registrant. Pre-approval is currently on an engagement-by-engagement basis. In the event pre-approval of such services is necessary between regular meetings of the Audit Committee and it is not practical to wait to seek pre-approval at the next regular meeting of the Audit Committee, pre-approval of such services may be referred to the Chair of the Audit Committee for approval; provided that the Chair may not pre-approve any individual engagement for such services exceeding $50,000 or multiple engagements for such services in the aggregate exceeding $100,000 in each period between regular meetings of the Audit Committee. Any engagement pre-approved by the Chair between regular meetings of the Audit Committee shall be presented for ratification by the entire Audit Committee at its next regularly scheduled meeting.
Item 4(e)(2):
None, or 0%, of the services relating to the Audit-Related Fees, Tax Fees and All Other Fees paid by the Fund and MFS and MFS Related Entities relating directly to the operations and financial reporting of the Registrant disclosed above were approved by the audit committee pursuant to paragraphs (c)(7)(i)(C) of Rule 2-01 of Regulation S-X (which permits audit committee approval after the start of the engagement with respect to services other than audit, review or attest services, if certain conditions are satisfied).
Table of Contents
Item 4(f): Not applicable.
Item 4(h): The Registrant’s Audit Committee has considered whether the provision by a Registrant’s independent registered public accounting firm of non-audit services to MFS and MFS Related Entities that were not pre-approved by the Committee (because such services did not relate directly to the operations and financial reporting of the Registrant) was compatible with maintaining the independence of the independent registered public accounting firm as the Registrant’s principal auditors.
| ITEM 5. | AUDIT COMMITTEE OF LISTED REGISTRANTS. |
Not applicable to the Registrant.
| ITEM 6. | INVESTMENTS |
A schedule of investments of the Registrant is included as part of the report to shareholders of such series under Item 1 of this Form N-CSR.
| ITEM 7. | DISCLOSURE OF PROXY VOTING POLICIES AND PROCEDURES FOR CLOSED-END MANAGEMENT INVESTMENT COMPANIES. |
Not applicable to the Registrant.
| ITEM 8. | PORTFOLIO MANAGERS OF CLOSED-END MANAGEMENT INVESTMENT COMPANIES. |
Not applicable to the Registrant.
| ITEM 9. | PURCHASES OF EQUITY SECURITIES BY CLOSED-END MANAGEMENT INVESTMENT COMPANY AND AFFILIATED PURCHASERS. |
Not applicable to the Registrant.
| ITEM 10. | SUBMISSION OF MATTERS TO A VOTE OF SECURITY HOLDERS. |
There were no material changes to the procedures by which shareholders may send recommendations to the Board for nominees to the Registrant’s Board since the Registrant last provided disclosure as to such procedures in response to the requirements of Item 407 (c)(2)(iv) of Regulation S-K or this Item.
Table of Contents
| ITEM 11. | CONTROLS AND PROCEDURES. |
| (a) | Based upon their evaluation of the effectiveness of the registrant’s disclosure controls and procedures (as defined in Rule 30a-3(c) under the Investment Company Act of 1940 (the “Act”)) as conducted within 90 days of the filing date of this report on Form N-CSR, the registrant’s principal financial officer and principal executive officer have concluded that those disclosure controls and procedures provide reasonable assurance that the material information required to be disclosed by the registrant on this report is recorded, processed, summarized and reported within the time periods specified in the Securities and Exchange Commission’s rules and forms. |
| (b) | There were no changes in the registrant’s internal controls over financial reporting (as defined in Rule 30a-3(d) under the Act) that occurred during the second fiscal quarter of the period covered by the report that have materially affected, or are reasonably likely to materially affect, the registrant’s internal control over financial reporting. |
| ITEM 12. | EXHIBITS. |
| (a) | File the exhibits listed below as part of this form. Letter or number the exhibits in the sequence indicated. |
| (1) | Any code of ethics, or amendment thereto, that is the subject of the disclosure required by Item 2, to the extent that the registrant intends to satisfy the Item 2 requirements through filing of an exhibit: Code of Ethics attached hereto. |
| (2) | A separate certification for each principal executive officer and principal financial officer of the registrant as required by Rule 30a-2(a) under the Act (17 CFR 270.30a-2): Attached hereto. |
| (b) | If the report is filed under Section 13(a) or 15(d) of the Exchange Act, provide the certifications required by Rule 30a-2(b) under the Act (17 CFR 270.30a-2(b)), Rule 13a-14(b) or Rule 15d-14(b) under the Exchange Act (17 CFR 240.13a-14(b) or 240.15d-14(b)) and Section 1350 of Chapter 63 of Title 18 of the United States Code (18 U.S.C. 1350) as an exhibit. A certification furnished pursuant to this paragraph will not be deemed “filed” for the purposes of Section 18 of the Exchange Act (15 U.S.C. 78r), or otherwise subject to the liability of that section. Such certification will not be deemed to be incorporated by reference into any filing under the Securities Act of 1933 or the Exchange Act, except to the extent that the registrant specifically incorporates it by reference: Attached hereto. |
Table of Contents
Notice
A copy of the Declaration of Trust, as amended, of the Registrant is on file with the Secretary of State of The Commonwealth of Massachusetts and notice is hereby given that this instrument is executed on behalf of the Registrant by an officer of the Registrant as an officer and not individually and the obligations of or arising out of this instrument are not binding upon any of the Trustees or shareholders individually, but are binding only upon the assets and property of the respective constituent series of the Registrant.
Table of Contents
SIGNATURES
Pursuant to the requirements of the Securities Exchange Act of 1934 and the Investment Company Act of 1940, the registrant has duly caused this report to be signed on its behalf by the undersigned, thereunto duly authorized.
(Registrant) MFS SERIES TRUST XII
| By (Signature and Title)* | ROBIN A. STELMACH | |
| Robin A. Stelmach, President |
Date: June 16, 2015
Pursuant to the requirements of the Securities Exchange Act of 1934 and the Investment Company Act of 1940, this report has been signed below by the following persons on behalf of the registrant and in the capacities and on the dates indicated.
| By (Signature and Title)* | ROBIN A. STELMACH | |
| Robin A. Stelmach, President (Principal Executive Officer) |
Date: June 16, 2015
| By (Signature and Title)* | DAVID L. DILORENZO | |
| David L. DiLorenzo, Treasurer (Principal Financial Officer and Accounting Officer) |
Date: June 16, 2015
| * | Print name and title of each signing officer under his or her signature. |